Embed Size (px)
Citation preview
Lab NotebookA. Stolp, 1/8/00, rev 1/7/14
This is what I expect in your notebook, and some suggestions of how to organize it.
General:! Title.! Date. Get into the habit of dating every piece of paper you write on. It will save you troublesomeday.! Objective(s) and/or introduction. Read the entire lab before lab time and write your own objective(s)and/or introduction to the lab. If you copy my objectives verbatim, you may not get full credit.
Procedures:! Describe what you do in lab in such a way that you could repeat the lab again later without referringto a handout. Do not cut-and-paste from the lab handout. You are supposed to be learning how tokeep a notebook of your own! Draw circuit diagrams of everything that you build. A diagram is the fastest and easiest way todescribe a circuit. Include parts values. Include equipment and instrument information in at least thefirst diagram where each instrument is used. (Example: write “Agilent E3631A” next to the voltagesupply in your diagram.)! Describe how you use the lab equipment, especially any new procedures as you learn them. A majorobjective of your work in the lab is that you learn how to use this equipment. ! Describe the problems that you encounter and how you solve those problems.! Answer the lab handout questions. You will find many questions sprinkled throughout the labhandouts. Answer in the form of a complete sentence. Same when you are asked to “comment” onsomething– comment in a complete sentence.
Data:! Take all your raw data and measurements directly into your notebook. If you process the data,include your calculations. ! List data in tables and plot graphs whenever possible. Tables are especially good when comparingdata, such as calculated values v.s. measured values, or measured values obtained from two orthree different methods. Sometimes you can compare data as separate graph curves on the sameset of axes. When tables and graphs are not appropriate, insure that data elements (measurements)stand out clearly. No one should have to hunt through your write-up for data.! Draw graphs to scale, using a ruler. Make the horizontal axis the independent variable (the one youchange or control) and the vertical axis the dependent variable (the result which you measure). Ploteach data point as a dot, an X or a cross. Draw a smooth, averaged line through the points. Generally, the line will not connect all the points, and may touch very few of them. Title each graphand label the axes. You may make graphs on a computer and tape them in your notebook.
Conclusion:The conclusion is an important part of the lab write-up, because it tells what you’ve learned from theexperiment. Say what you got out of the experiment. Specifically, look back at your objectives, andtell how you met them.
Discuss your results/measurements/data relative to their quality, i.e., how close were they toexpected results or to calculated values? How close were measurements obtained by differentmethods to each other? How accurate were your results? Try to account for differences. How welldid circuits work?
A lab notebook may be any notebook that you cannot insert pages into, IE spiral or bound.
Lab Notebook handout
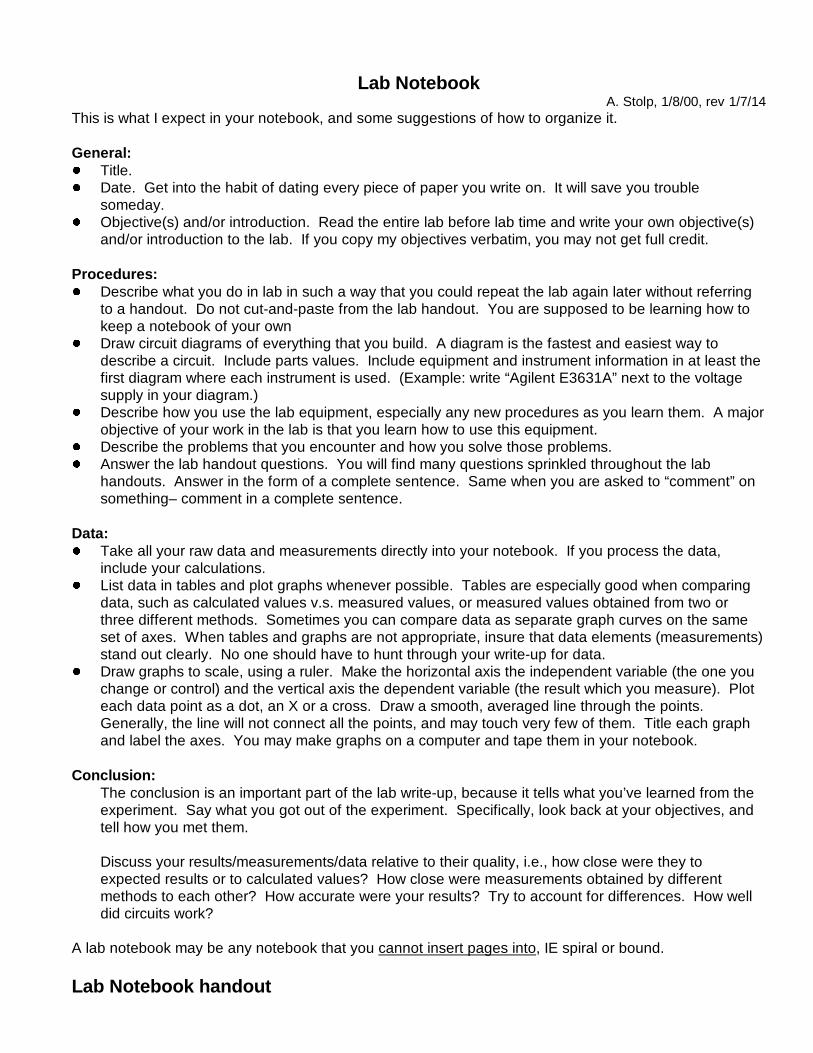
Standard 5% resistor values
Color433333333Bands
blugrnyelorgredbrnblkgold21gold101.0100101.010010blkbrngold111.1110111.111011brnbrngold121.2120121.212012redbrngold131.3130131.313013orgbrngold151.5150151.515015grnbrngold161.6160161.616016blubrngold181.8180181.818018grybrngold202.0200202.020020blkredgold222.2220222.222022redredgold242.4240242.424024yelredgold272.7270272.7270272.7vioredgold303.0300303.0300303.0blkorggold333.3330333.3330333.3orgorggold363.6360363.6360363.6bluorggold393.9390393.9390393.9whtorggold434.3430434.3430434.3orgyelgold474.7470474.7470474.7vioyelgold515.1510515.1510515.1brngrngold565.6560565.6560565.6blugrngold626.2620626.2620626.2redblugold686.8680686.8680686.8gryblugold757.5750757.5750757.5grnviogold828.2820828.2820828.2redgrygold919.1910919.1910919.1brnwht
5%ΩΩΩΩMΩΩΩΩkΩΩΩΩ
p1 ECE2210/00 Intro Lab
University of UtahElectrical & Computer Engineering Department
ECE 2210/2200 Lab 1Introduction
A. Stolp, 1/8/00Rev. A.S., 1/7/14, 1/6/20
Objectives1 Teach the student to keep an
engineering notebook.2 Talk about lab practices, check-off,
and grading.3 Introduce the lab bench equipment.4 Teach wiring techniques.5 Show how voltmeters, ammeters,
and ohmmeters are used.6 Teach good data reporting and
graphing.
Parts to be supplied by thestudent:! Lab notebook for all ECE labs! ECE 2210 parts kit, OR individual parts below! 100 Ω, 270 Ω, 560 Ω, two 1 kΩ, two 2.0 kΩ, and 2.2
kΩ resistors (see table on p.5 for band colors)! Breadboard and wires The electrical parts may be bought from stockroom. Buy parts using your “U-Card”. They can’t accept cash.
Check out from stockroom:! Servo! DMM (Digital Multi-meter)
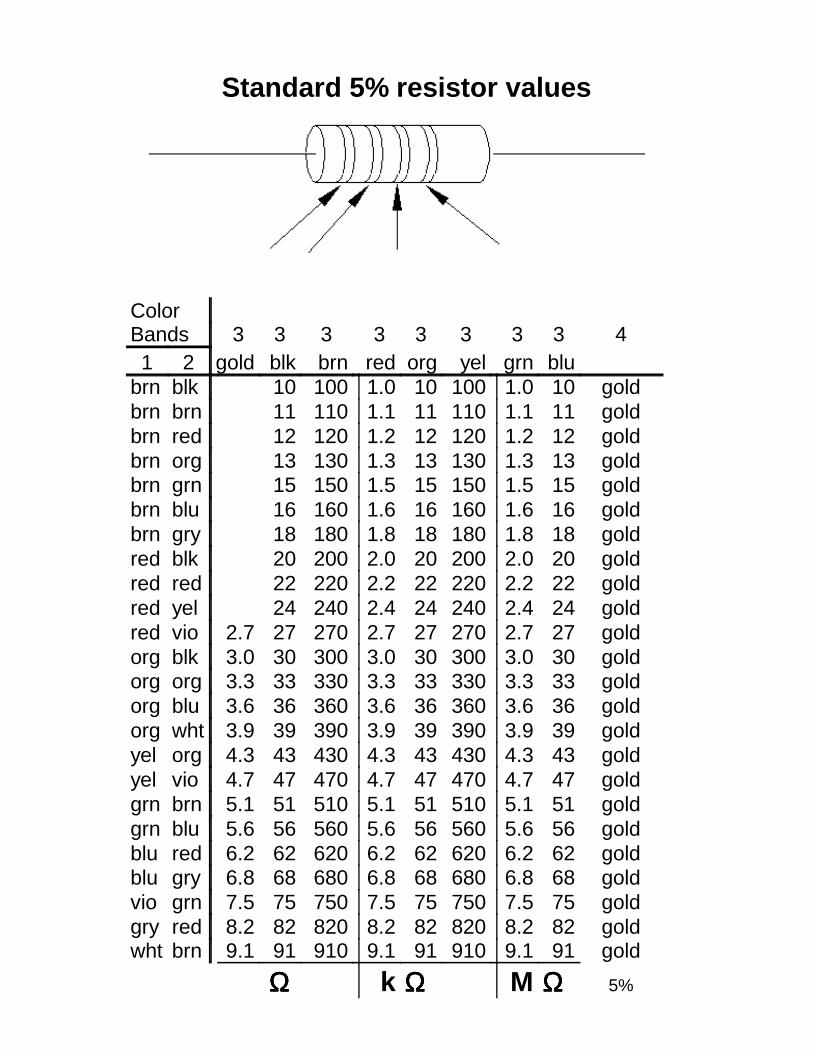
GeneralChoose a workbench space with an Agilent or HP34401A multimeter and an Agilent or HP E3631A DCpower supply, perhaps grouped in a cluster like the oneshown at right. (You may use different equipment butthen you’ll have to modify the specific instructionsfound in this lab. You may also need another multi-meter and additional help from your lab TA.)
Lab NotebookAs engineers many of you will be paid to do research, development, and invention. Thecompanies that employ you may be interested in obtaining patents on these developments. In patents, timing is important—you’ve got to be first, and you’ve got be able to prove it. Awell-kept engineering notebook can be used in court as part of your proof. The number-one purpose of a true engineering notebook is to keep an accurate, chronological record
p2 ECE2210/00 Intro Lab
of your work, and you may need to keep one someday for your high-paying job. Manynon-R&D jobs also require a similar notebook for record keeping or billing purposes. Inthis class you’ll need to keep one to get a grade. We’re going to pretend that it’s jobtraining. If your future boss asks you to keep an engineering notebook and all you can dois ask, “huh, what’s that?” Both you and the “U” will look bad.
Keeping a true engineering lab notebook, acceptable in court, is fairly involved. You needto write everything in ink, all pages must be numbered, dated, and signed by others, etc.etc.. By these standards we’ll be quite lax in this class. But we will pay particular attentionto the following things:! Work in your lab notebook at lab time—no scribble sheets for data so that you can
“write it down neatly later.” Before you leave the lab you will need to get yourinstructor to (check-off) initial your book. Some or all of your notebook may be gradedat this time. ! Write clearly and make sure your work stands on its own, without reference to thehandout.! Follow the guidelines on the “Lab Notebook” handout for procedures, data, andconclusions. ! Use lots of drawings, tables, and graphs, and label them well. Often these are botheasier to create and better than written text.
My main objectives are that you to work in your notebook, and that you make that workuseful for later reference.
Check-off: When you are finished with your lab, you should call your lab TA over to check you off. Atthis time, you should be able to demonstrate a working circuit, answer questions aboutwhat you did, and show your finished notebook. You’ll get part or all of your lab graderight on the spot. Check-off becomes a problem if you ever miss your normal lab time, sotry not to. If you have to miss a lab, make arrangements with your TA to make it up. MostTAs will accept the check-off from another TA or from me.
ExperimentTA Demonstration (If your TA doesn’t give you a lecture or not do this part of the lab foryou (takes about an hour), please report to Arn)Your lab instructor will do this part of today’s lab as demonstration and write examplenotebook entries on the whiteboard. If you follow along with your TA and write the samethings in your notebook that your TA writes on the board, you won’t have to re-do this partlater. The following paragraphs are written as though they are instructions to you, but yourTA will show you how to do them.
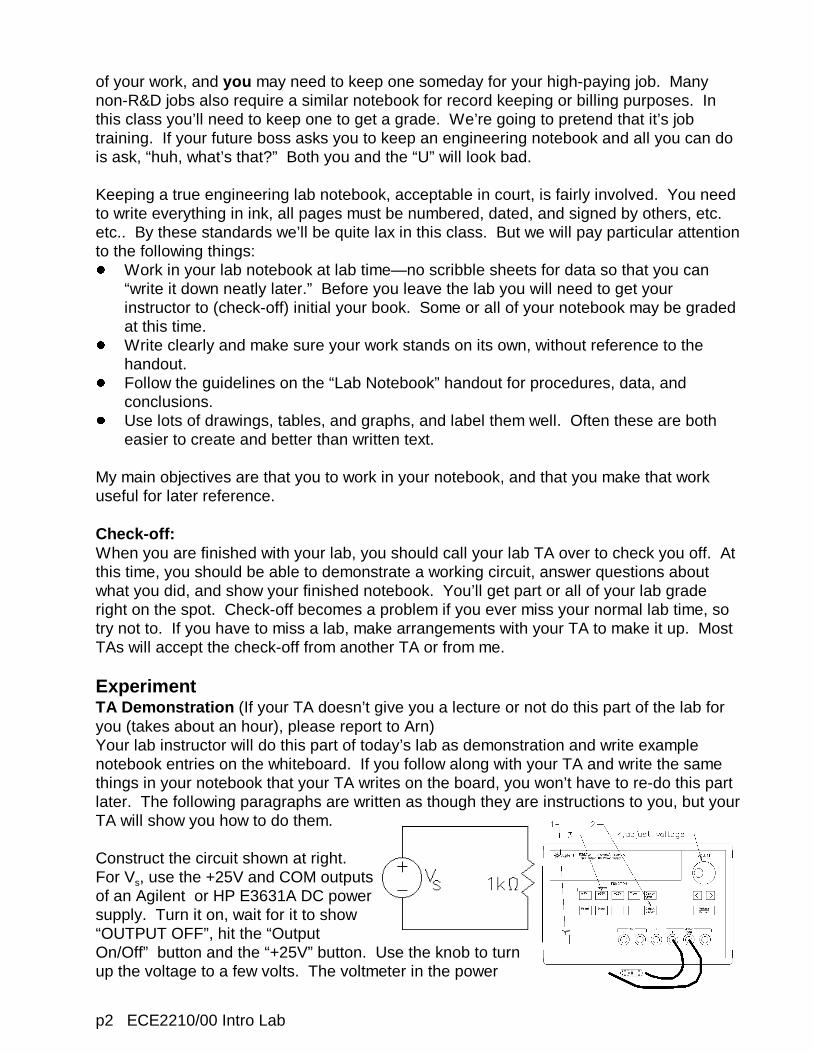
Construct the circuit shown at right. For Vs, use the +25V and COM outputsof an Agilent or HP E3631A DC powersupply. Turn it on, wait for it to show“OUTPUT OFF”, hit the “Output On/Off” button and the “+25V” button. Use the knob to turnup the voltage to a few volts. The voltmeter in the power
p3 ECE2210/00 Intro Lab
supply will show the output voltage but the notice that the ammeter isn’t sensitive enoughto accurately show the current. Comment in your lab notebook.
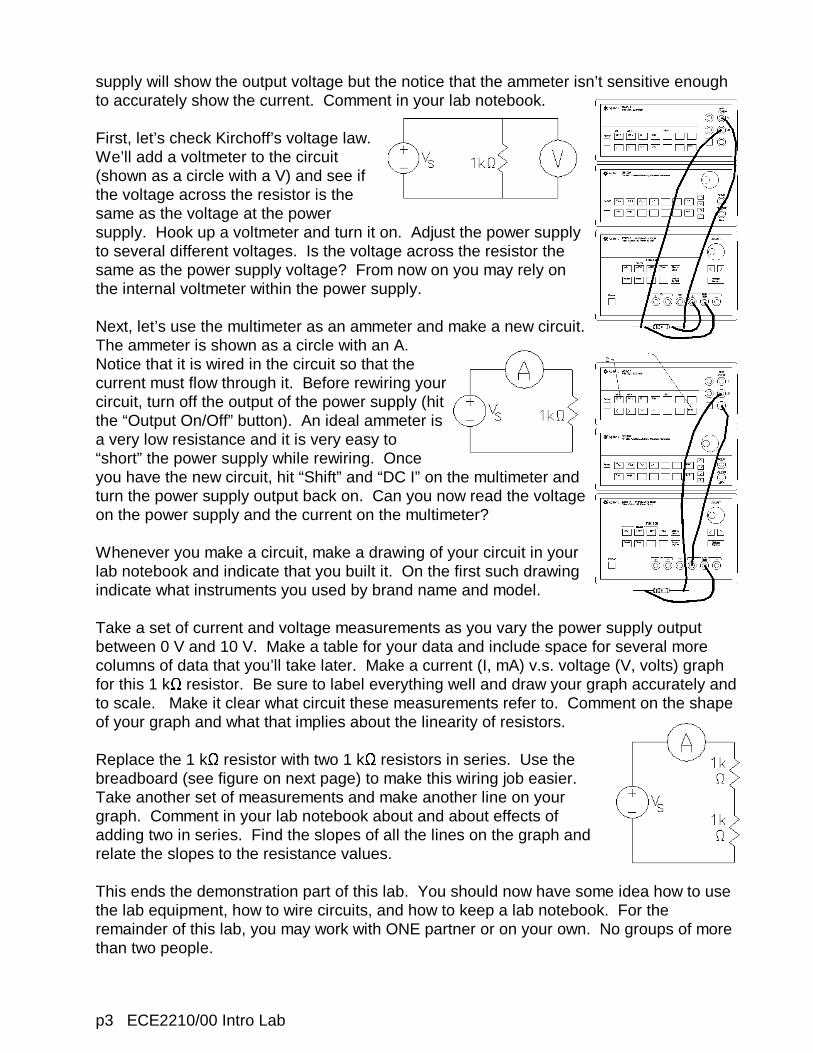
First, let’s check Kirchoff’s voltage law. We’ll add a voltmeter to the circuit (shown as a circle with a V) and see ifthe voltage across the resistor is thesame as the voltage at the powersupply. Hook up a voltmeter and turn it on. Adjust the power supplyto several different voltages. Is the voltage across the resistor thesame as the power supply voltage? From now on you may rely onthe internal voltmeter within the power supply.
Next, let’s use the multimeter as an ammeter and make a new circuit. The ammeter is shown as a circle with an A. Notice that it is wired in the circuit so that thecurrent must flow through it. Before rewiring yourcircuit, turn off the output of the power supply (hitthe “Output On/Off” button). An ideal ammeter isa very low resistance and it is very easy to“short” the power supply while rewiring. Onceyou have the new circuit, hit “Shift” and “DC I” on the multimeter andturn the power supply output back on. Can you now read the voltageon the power supply and the current on the multimeter?
Whenever you make a circuit, make a drawing of your circuit in yourlab notebook and indicate that you built it. On the first such drawingindicate what instruments you used by brand name and model.
Take a set of current and voltage measurements as you vary the power supply outputbetween 0 V and 10 V. Make a table for your data and include space for several morecolumns of data that you’ll take later. Make a current (I, mA) v.s. voltage (V, volts) graphfor this 1 kΩ resistor. Be sure to label everything well and draw your graph accurately andto scale. Make it clear what circuit these measurements refer to. Comment on the shapeof your graph and what that implies about the linearity of resistors.
Replace the 1 kΩ resistor with two 1 kΩ resistors in series. Use thebreadboard (see figure on next page) to make this wiring job easier. Take another set of measurements and make another line on yourgraph. Comment in your lab notebook about and about effects ofadding two in series. Find the slopes of all the lines on the graph andrelate the slopes to the resistance values.
This ends the demonstration part of this lab. You should now have some idea how to usethe lab equipment, how to wire circuits, and how to keep a lab notebook. For theremainder of this lab, you may work with ONE partner or on your own. No groups of morethan two people.
p4 ECE2210/00 Intro Lab
Student Lab If you haven’t already done so, begin yourlab notebook entries with the title, date,and objective(s).
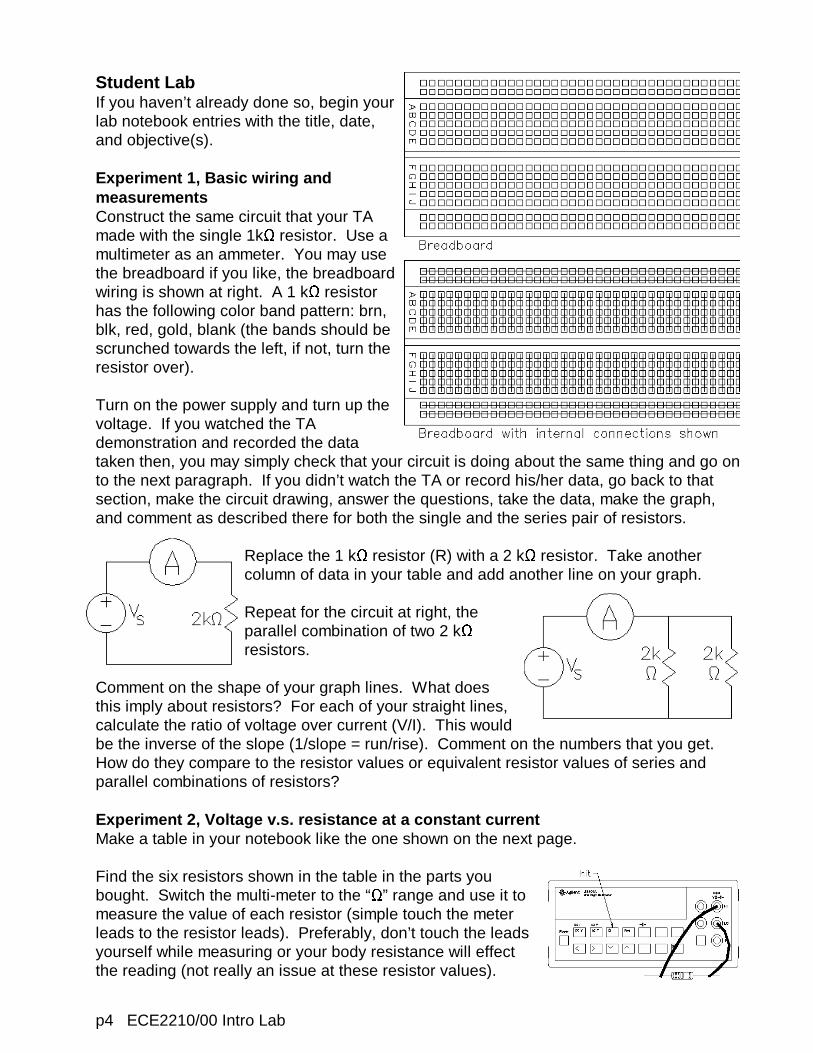
Experiment 1, Basic wiring andmeasurementsConstruct the same circuit that your TAmade with the single 1kΩ resistor. Use amultimeter as an ammeter. You may usethe breadboard if you like, the breadboardwiring is shown at right. A 1 kΩ resistorhas the following color band pattern: brn,blk, red, gold, blank (the bands should bescrunched towards the left, if not, turn theresistor over).
Turn on the power supply and turn up thevoltage. If you watched the TAdemonstration and recorded the datataken then, you may simply check that your circuit is doing about the same thing and go onto the next paragraph. If you didn’t watch the TA or record his/her data, go back to thatsection, make the circuit drawing, answer the questions, take the data, make the graph,and comment as described there for both the single and the series pair of resistors.
Replace the 1 kΩ resistor (R) with a 2 kΩ resistor. Take anothercolumn of data in your table and add another line on your graph.
Repeat for the circuit at right, theparallel combination of two 2 kΩresistors.
Comment on the shape of your graph lines. What doesthis imply about resistors? For each of your straight lines,calculate the ratio of voltage over current (V/I). This wouldbe the inverse of the slope (1/slope = run/rise). Comment on the numbers that you get. How do they compare to the resistor values or equivalent resistor values of series andparallel combinations of resistors?
Experiment 2, Voltage v.s. resistance at a constant currentMake a table in your notebook like the one shown on the next page.
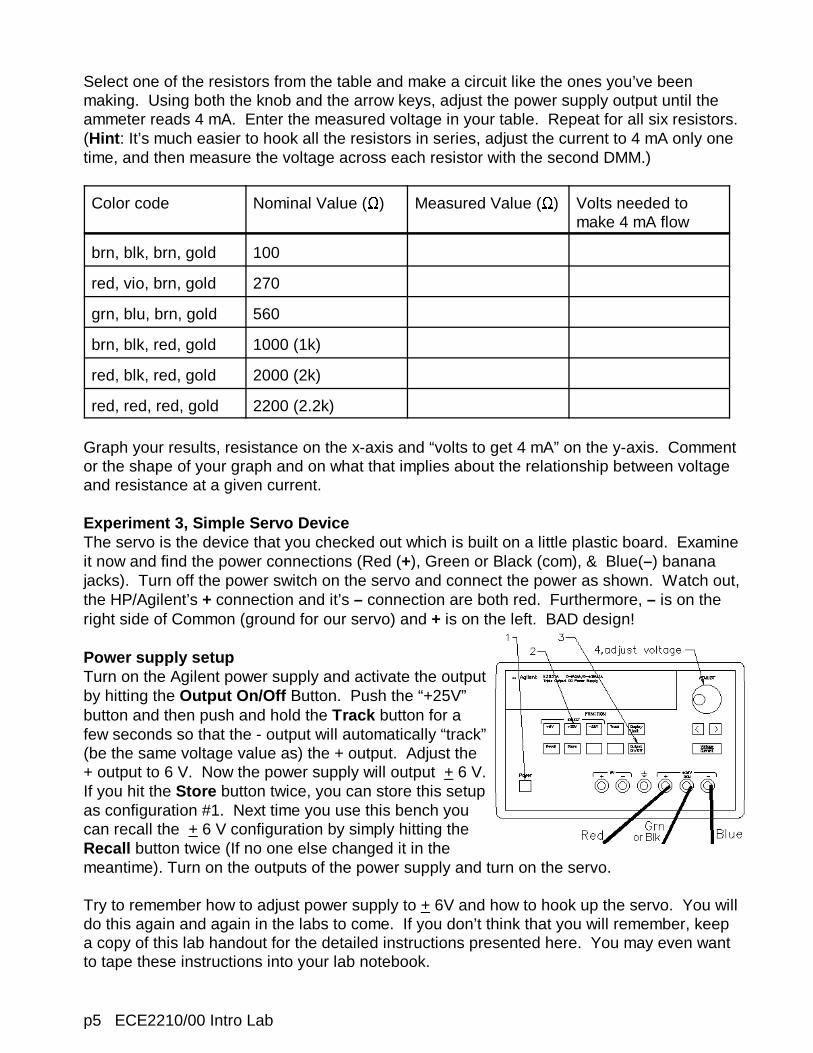
Find the six resistors shown in the table in the parts youbought. Switch the multi-meter to the “Ω” range and use it tomeasure the value of each resistor (simple touch the meterleads to the resistor leads). Preferably, don’t touch the leadsyourself while measuring or your body resistance will effectthe reading (not really an issue at these resistor values).
p5 ECE2210/00 Intro Lab
Select one of the resistors from the table and make a circuit like the ones you’ve beenmaking. Using both the knob and the arrow keys, adjust the power supply output until theammeter reads 4 mA. Enter the measured voltage in your table. Repeat for all six resistors. (Hint : It’s much easier to hook all the resistors in series, adjust the current to 4 mA only onetime, and then measure the voltage across each resistor with the second DMM.)
Color code Nominal Value (Ω) Measured Value (Ω) Volts needed tomake 4 mA flow
brn, blk, brn, gold 100
red, vio, brn, gold 270
grn, blu, brn, gold 560
brn, blk, red, gold 1000 (1k)
red, blk, red, gold 2000 (2k)
red, red, red, gold 2200 (2.2k)
Graph your results, resistance on the x-axis and “volts to get 4 mA” on the y-axis. Commentor the shape of your graph and on what that implies about the relationship between voltageand resistance at a given current.
Experiment 3, Simple Servo DeviceThe servo is the device that you checked out which is built on a little plastic board. Examineit now and find the power connections (Red (+), Green or Black (com), & Blue(–) bananajacks). Turn off the power switch on the servo and connect the power as shown. Watch out,the HP/Agilent’s + connection and it’s – connection are both red. Furthermore, – is on theright side of Common (ground for our servo) and + is on the left. BAD design!
Power supply setup Turn on the Agilent power supply and activate the outputby hitting the Output On/Off Button. Push the “+25V”button and then push and hold the Track button for afew seconds so that the - output will automatically “track”(be the same voltage value as) the + output. Adjust the+ output to 6 V. Now the power supply will output + 6 V. If you hit the Store button twice, you can store this setupas configuration #1. Next time you use this bench youcan recall the + 6 V configuration by simply hitting theRecall button twice (If no one else changed it in themeantime). Turn on the outputs of the power supply and turn on the servo.
Try to remember how to adjust power supply to + 6V and how to hook up the servo. You willdo this again and again in the labs to come. If you don’t think that you will remember, keepa copy of this lab handout for the detailed instructions presented here. You may even wantto tape these instructions into your lab notebook.
p6 ECE2210/00 Intro Lab
Play around with the input position shaft and watch the motor turn the output shaft to follow. (If the servo oscillates, turn down the gain.) In your lab notebook, write a short descriptionof what the servo does. This is a very crude, slow, and weak servo, but it does illustrate howthey work. Imagine what this, or a more powerful, servo could do if the output shaft washooked to other mechanical devices, maybe a cutting device, or digging tool, or steeringdevice, or... Write down at least 3 uses for servos. Do you think that you might work withservos in subsequent classes and later as an engineer? Mechanical engineering studentsshould definitely answer “yes” here. Chemical Engineers, Material Scientists, andEnvironmental Engineers (a branch of Civil) are more likely to see process and temperaturecontrol systems, but they turn out to be quite similar. The servo is just a control system thatcontrols a mechanical motion. For you Mining and Civil Engineers (Other thanEnvironmental) that don’t plan to go to grad school are less likely to deal directly with controlsystems. Although, I might point out that the Citicorp building has a large servo controlledmass at the top of the building that reduces its sway on windy days.
In the first two experiments of this lab you learned a little about resistors. At first thought aresistor may seem like a pretty worthless part, but resistors are used a lot in electroniccircuits. About how many resistors are used in the servo circuit? Determine the value of atleast one of the resistors from it’s color code (try the most common value).
You will see this servo again many times in the lab. I will try use it to show you how thethings you learn in class and in lab relate to something mechanical–something useful.
ConcludeCall your lab instructor over to check you off. Usually you do this before you tear down yourfinal circuit. Be prepared to discuss your measurements, calculations, and conclusions andto show off your notebook.
Write a conclusion in your notebook. Make sure that you touch on each of the subjects inyour objectives. Mention any problems that you encountered in this lab and how youovercame them.
This sort of check-off and conclusion will be required at the end of each lab, even if it’s not specifically asked for in the lab handout. Before leaving, make sure everything is turned offand return everything that you checked out.
p1 ECE 2210 DC Lab
University of UtahElectrical & Computer Engineering Department
ECE 2210/2200Experiment No. 2
DC CircuitsA. Stolp, 9/27/99
rev, A.S, 1/6/13, 9/6/18(wire colors)
Objectives1.) Verify Ohm’s and Kirchoff’s laws.2.) Verify series and parallel equivalence, and the divider rules.3.) Feel the power dissipation of a resistor as heat.4.) See that the position sensors in the servo are simply voltage dividers.
Parts to be supplied by the student: (Parts in bold are new to this lab)! Two 390 Ω, 560 Ω, and 1 kΩ resistors, (The little resistors you buy are rated for ¼watt power dissipation) (390 is orange-white-brown-gold)! Breadboard and wires
Check out from stockroom:! Portable digital multimeter ! Servo
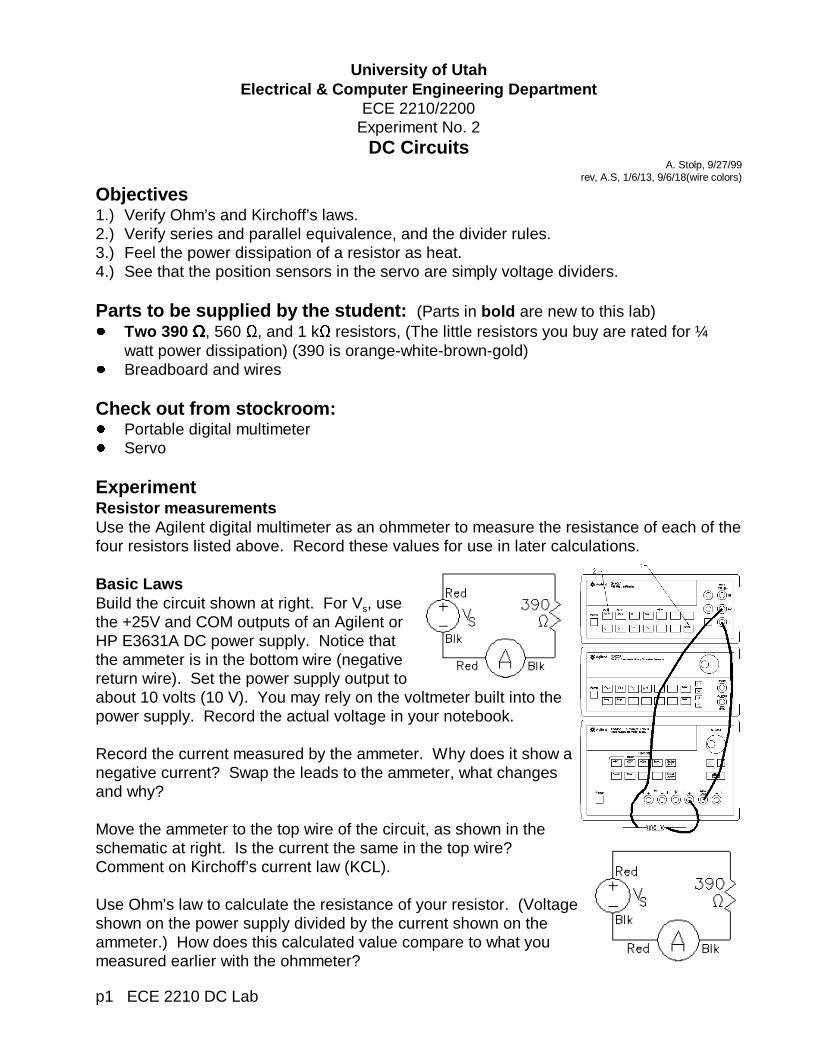
ExperimentResistor measurementsUse the Agilent digital multimeter as an ohmmeter to measure the resistance of each of thefour resistors listed above. Record these values for use in later calculations.
Basic LawsBuild the circuit shown at right. For Vs, usethe +25V and COM outputs of an Agilent orHP E3631A DC power supply. Notice thatthe ammeter is in the bottom wire (negativereturn wire). Set the power supply output toabout 10 volts (10 V). You may rely on the voltmeter built into thepower supply. Record the actual voltage in your notebook.
Record the current measured by the ammeter. Why does it show anegative current? Swap the leads to the ammeter, what changesand why?
Move the ammeter to the top wire of the circuit, as shown in theschematic at right. Is the current the same in the top wire? Comment on Kirchoff’s current law (KCL).
Use Ohm’s law to calculate the resistance of your resistor. (Voltage shown on the power supply divided by the current shown on theammeter.) How does this calculated value compare to what youmeasured earlier with the ohmmeter?
p2 ECE 2210 DC Lab
MetersA voltmeter measures thevoltage differenceACROSS it. An idealvoltmeter acts like an opencircuit (no connection) andcan be connected betweenany two points in the circuitto show the voltage(potential) differencebetween those two points. They are fairly hard tomisuse unless you’re dealing with highvoltages—and we’ll try to avoid that inhere. The registrar doesn’t like it whenwe kill tuition sources.
An ammeter, however, is very easy tomisuse. An ammeter measures thecurrent that passes THROUGH it. Anideal ammeter acts like wire. A wire inthe wrong place is known as a shortcircuit (a direct, low resistanceconnection, usually unwanted). Anammeter makes a connection, and ifyou’re not careful, you’ll make aconnection that you don’t want. To usean ammeter; make your complete circuitfirst, then open part of the circuit andreplace a wire or connection with theammeter. The key phrase here is openup. If you aren’t breaking open someconnection in order to insert theammeter, then you’re doing somethingwrong.
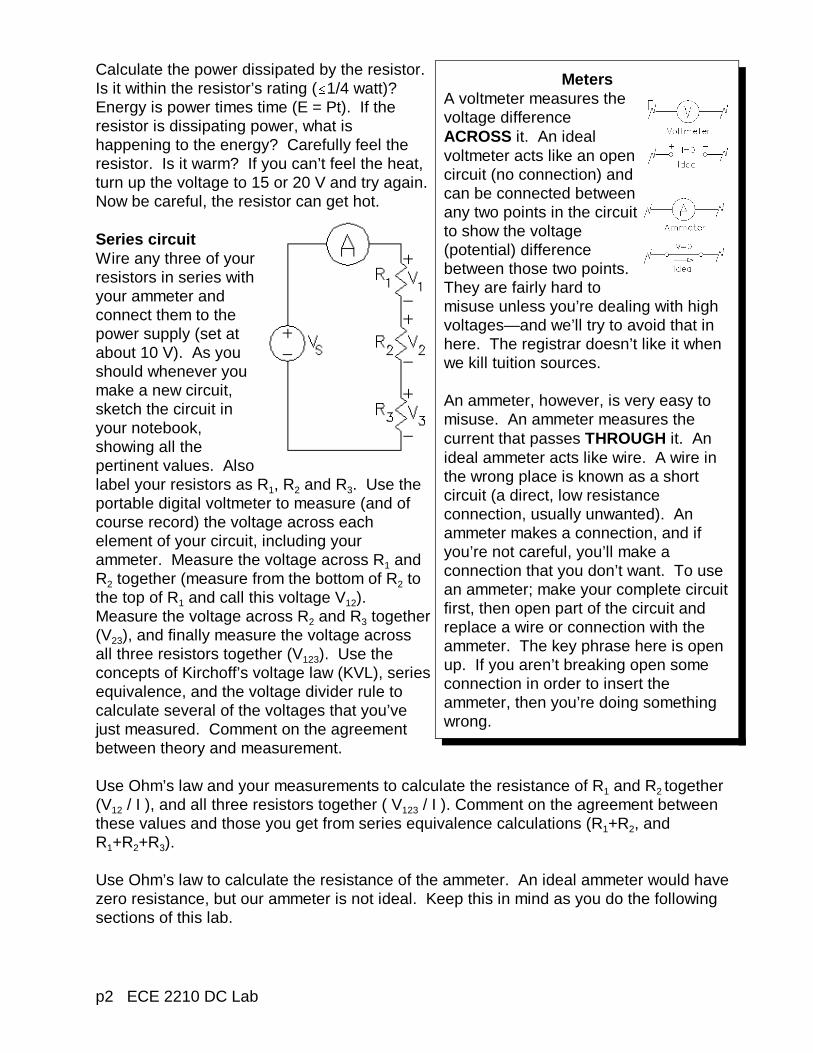
Calculate the power dissipated by the resistor. Is it within the resistor’s rating (#1/4 watt)? Energy is power times time (E = Pt). If theresistor is dissipating power, what ishappening to the energy? Carefully feel theresistor. Is it warm? If you can’t feel the heat,turn up the voltage to 15 or 20 V and try again. Now be careful, the resistor can get hot.
Series circuitWire any three of yourresistors in series withyour ammeter andconnect them to thepower supply (set atabout 10 V). As youshould whenever youmake a new circuit,sketch the circuit inyour notebook,showing all thepertinent values. Alsolabel your resistors as R1, R2 and R3. Use theportable digital voltmeter to measure (and ofcourse record) the voltage across eachelement of your circuit, including yourammeter. Measure the voltage across R1 andR2 together (measure from the bottom of R2 tothe top of R1 and call this voltage V12). Measure the voltage across R2 and R3 together(V23), and finally measure the voltage acrossall three resistors together (V123). Use theconcepts of Kirchoff’s voltage law (KVL), seriesequivalence, and the voltage divider rule tocalculate several of the voltages that you’vejust measured. Comment on the agreementbetween theory and measurement.
Use Ohm’s law and your measurements to calculate the resistance of R1 and R2 together(V12 / I ), and all three resistors together ( V123 / I ). Comment on the agreement betweenthese values and those you get from series equivalence calculations (R1+R2, andR1+R2+R3).
Use Ohm’s law to calculate the resistance of the ammeter. An ideal ammeter would havezero resistance, but our ammeter is not ideal. Keep this in mind as you do the followingsections of this lab.
p3 ECE 2210 DC Lab
Parallel circuitBuild the circuit shown, using any two of your resistors inparallel. Ignore the “dotted” ammeters for now. Labelyour resistors as R1 and R2. Record the voltage acrossthe parallel resistors (shown on the power supply).
Record the ammeter reading (I12). Move the ammeterinto the two other positions shown by the dotted outlinesin the drawing above and record all the currents I1 and I2. Since current must flow through the ammeter for it to work, you will need to do somerewiring each time you move the ammeter (See box on previous page). Admittedly, this isa pain in the neck but it is good practice. Be very careful with your wiring.
Now calculate I1 and I2 from the power supply voltage and the resistance values. Addthese to calculate the current I12. Comment on the agreement between these calculationsand your ammeter measurements.
What is the equivalent resistance of R1 and R2 together calculated from the formula forparallel resistors? Now use Ohm’s law and your measurements to calculate the equivalentresistance ( V / I12 ). Comment on the agreement between these values.
Series-parallel circuitThe resistors in the circuits you have made so far have been either all in series or all inparallel. In a series-parallel circuit some resistors are in series and some are in parallel atthe same time. Design a series-parallel circuit using all four of your resistors. Make yourcircuit and connect it to the power supply through the ammeter. Record the power supplyvoltage (which is the voltage across the entire resistor network) and the ammeter reading(which should be the total current though the entire network). Use Ohm’s law andmeasurements to calculate the resistance of all the resistor network. Use series andparallel formulas to calculate the resistance of the network from the individual resistorvalues. Comment on the agreement between these values.
Make at least one more voltage measurement across and one more current measurementelsewhere in the circuit. Assume that the power supply voltage is correct and use theoryto find the same voltage and current you just measured. Comment on the agreementbetween theory and measurement.
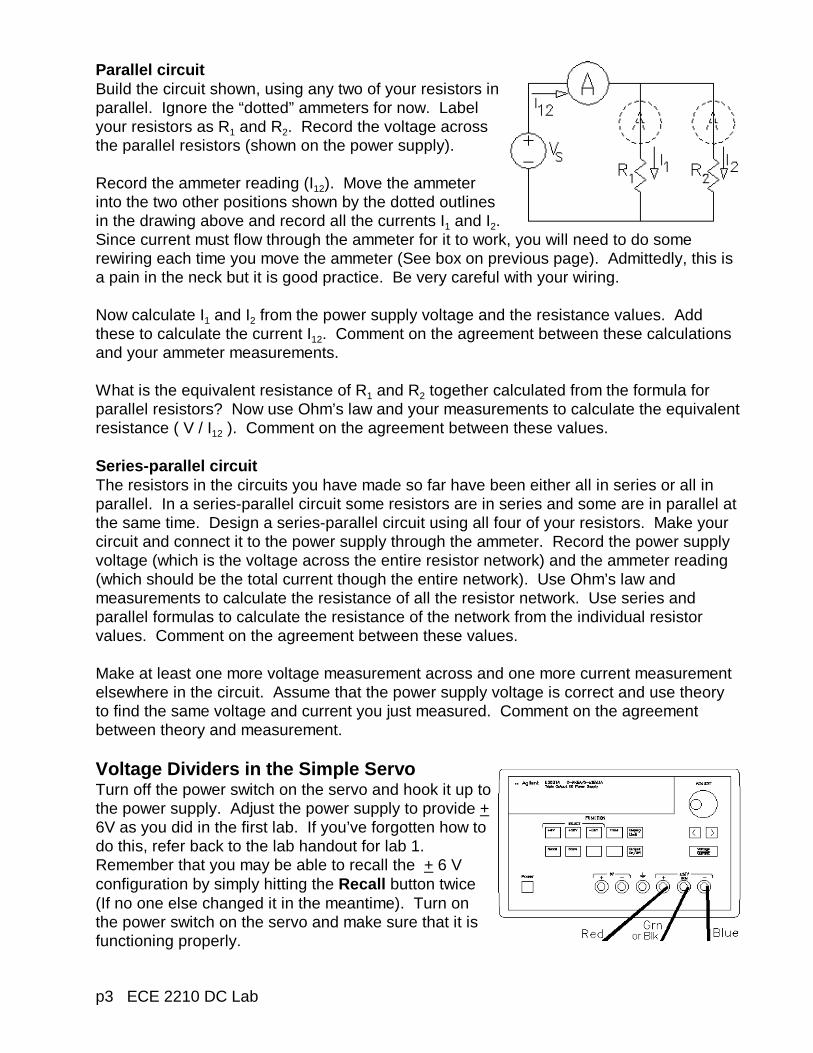
Voltage Dividers in the Simple ServoTurn off the power switch on the servo and hook it up tothe power supply. Adjust the power supply to provide +6V as you did in the first lab. If you’ve forgotten how todo this, refer back to the lab handout for lab 1. Remember that you may be able to recall the + 6 Vconfiguration by simply hitting the Recall button twice(If no one else changed it in the meantime). Turn onthe power switch on the servo and make sure that it isfunctioning properly.
p4 ECE 2210 DC Lab
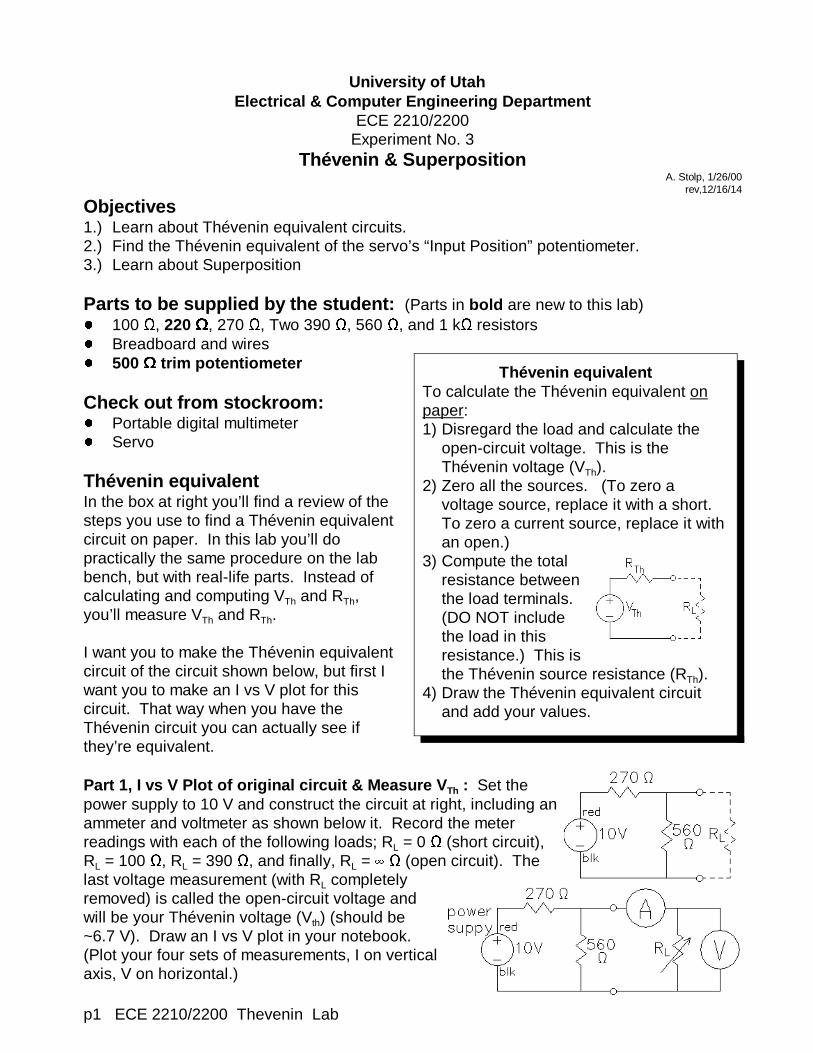
Potentiometers used as position sensorsIf you look at the servo, you’ll see three potentiometers (pots). Oneis used to adjust the gain of the circuit, you will learn about thatnear the end of the semester. The other two are used as positionsensors. They translate shaft position into voltage. When theshaft is turned, the voltage on the center lead changes.
One of the pots is labeled “Input Position” and is the one you turnby hand. Another is coupled to the output shaft of the motor andgeartrain and is turned by the servo. The circuit compares thepositions of these two pots and amplifies the difference to run themotor in the correct direction to eliminate that difference. Each ofthese pots is simply a voltage divider.
Measure the voltage between the two outside leads of the “Input Position” pot. Turn thepot through its range. Does this voltage change significantly? Now measure from the blue(or black) to the yellow lead and try it again. What range of voltages do you measure?
Look at the schematic that shows how this part of the servo circuit is wired. Calculate thevoltage that you expect to see across the 10 kΩ pot. Compare to the measured voltage. Explain why blue-to-yellow lead measurements make sense.
Measure the voltage from the black to the brown leads of the other position sensor as youmake the motor turn through its range of motion. Compare to the similar measurement atthe first pot. ConcludeBefore you put everything away, call your lab instructor over to check you off. Write aconclusion in your notebook. Discuss the agreement of measurements and calculations. If you are concerned about disagreements, make some % error calculations. Usually yourerrors are smaller than they at first appear. Also remember that no measuring instrumentis perfect and neither are parts. Mention any problems that you encountered in this laband how you overcame them.
p1 ECE 2210/2200 Thevenin Lab
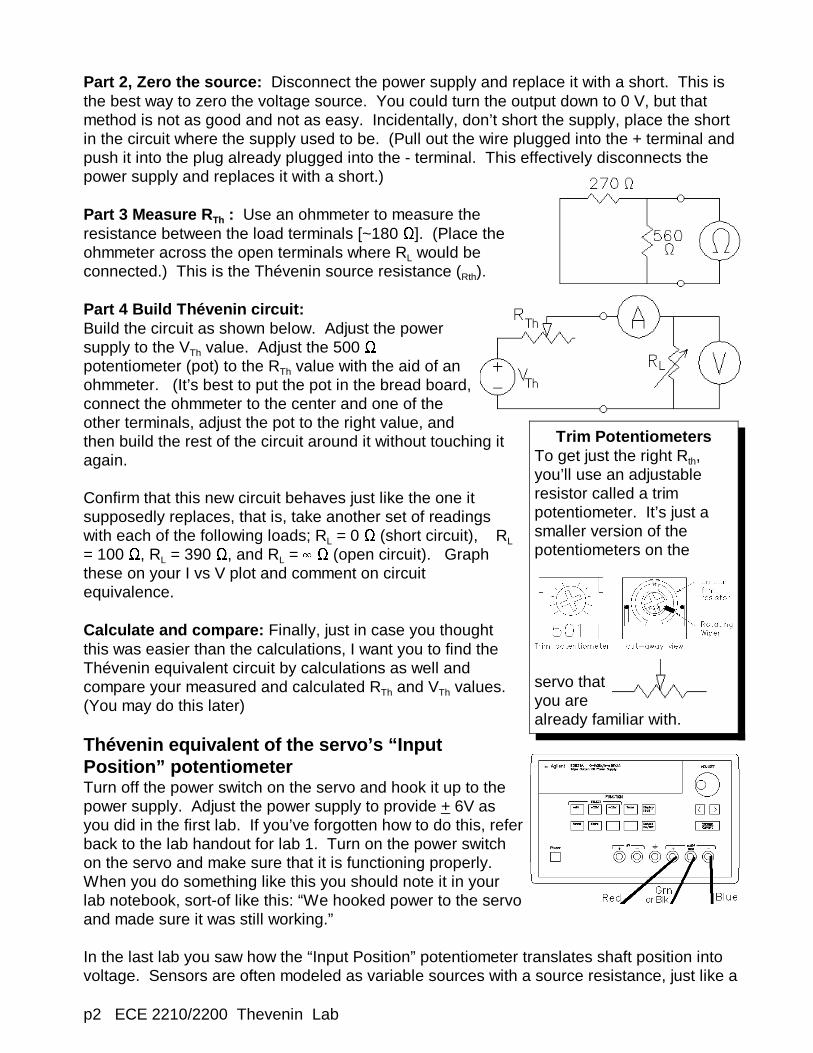
Thévenin equivalentTo calculate the Thévenin equivalent onpaper:1) Disregard the load and calculate the
open-circuit voltage. This is theThévenin voltage (VTh).
2) Zero all the sources. (To zero avoltage source, replace it with a short. To zero a current source, replace it withan open.)
3) Compute the totalresistance betweenthe load terminals. (DO NOT includethe load in thisresistance.) This isthe Thévenin source resistance (RTh).
4) Draw the Thévenin equivalent circuitand add your values.
University of UtahElectrical & Computer Engineering Department
ECE 2210/2200Experiment No. 3
Thévenin & SuperpositionA. Stolp, 1/26/00
rev,12/16/14
Objectives1.) Learn about Thévenin equivalent circuits.2.) Find the Thévenin equivalent of the servo’s “Input Position” potentiometer.3.) Learn about Superposition
Parts to be supplied by the student: (Parts in bold are new to this lab)! 100 Ω, 220 Ω, 270 Ω, Two 390 Ω, 560 Ω, and 1 kΩ resistors! Breadboard and wires! 500 Ω trim potentiometer
Check out from stockroom:! Portable digital multimeter! Servo
Thévenin equivalentIn the box at right you’ll find a review of thesteps you use to find a Thévenin equivalentcircuit on paper. In this lab you’ll dopractically the same procedure on the labbench, but with real-life parts. Instead ofcalculating and computing VTh and RTh,you’ll measure VTh and RTh.
I want you to make the Thévenin equivalentcircuit of the circuit shown below, but first Iwant you to make an I vs V plot for thiscircuit. That way when you have theThévenin circuit you can actually see ifthey’re equivalent.
Part 1, I vs V Plot of original circuit & Measure V Th : Set thepower supply to 10 V and construct the circuit at right, including anammeter and voltmeter as shown below it. Record the meterreadings with each of the following loads; RL = 0 Ω (short circuit),RL = 100 Ω, RL = 390 Ω, and finally, RL = 4 Ω (open circuit). Thelast voltage measurement (with RL completelyremoved) is called the open-circuit voltage andwill be your Thévenin voltage (Vth) (should be~6.7 V). Draw an I vs V plot in your notebook. (Plot your four sets of measurements, I on verticalaxis, V on horizontal.)
p2 ECE 2210/2200 Thevenin Lab
Trim PotentiometersTo get just the right Rth,you’ll use an adjustableresistor called a trimpotentiometer. It’s just asmaller version of thepotentiometers on the
servo thatyou arealready familiar with.
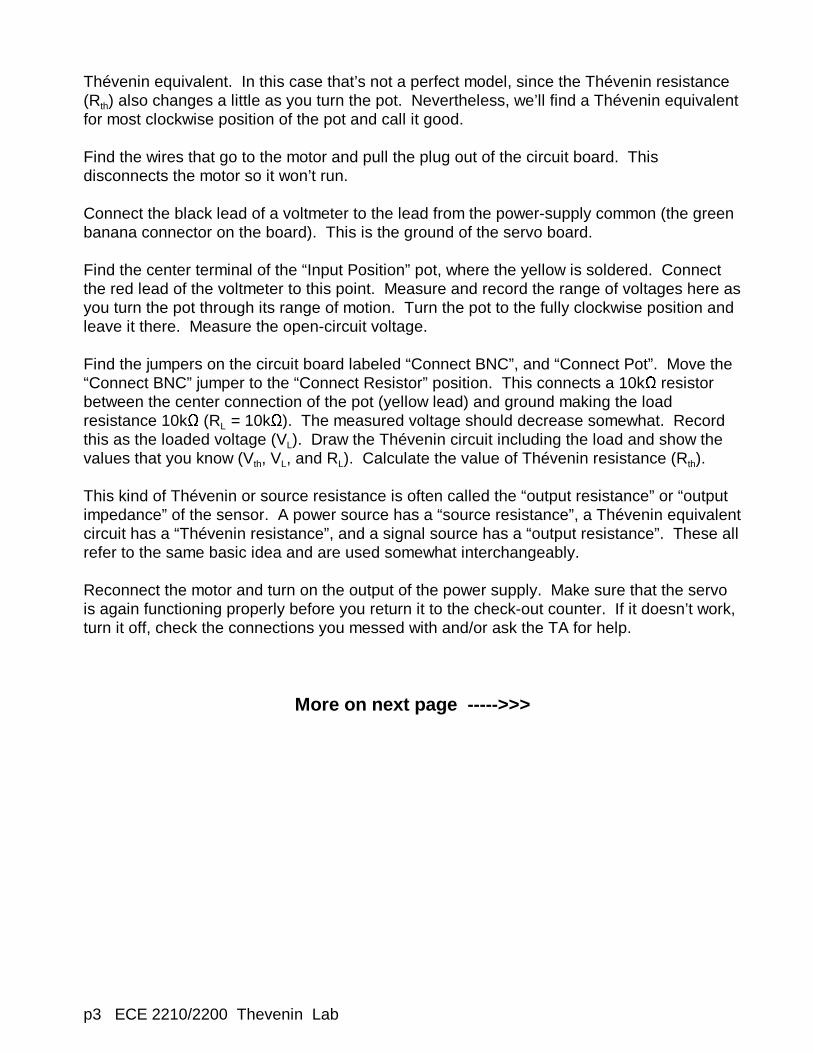
Part 2, Zero the source: Disconnect the power supply and replace it with a short. This isthe best way to zero the voltage source. You could turn the output down to 0 V, but thatmethod is not as good and not as easy. Incidentally, don’t short the supply, place the shortin the circuit where the supply used to be. (Pull out the wire plugged into the + terminal andpush it into the plug already plugged into the - terminal. This effectively disconnects thepower supply and replaces it with a short.)
Part 3 Measure R Th : Use an ohmmeter to measure theresistance between the load terminals [~180 Ω]. (Place theohmmeter across the open terminals where RL would beconnected.) This is the Thévenin source resistance (Rth).
Part 4 Build Thévenin circuit:Build the circuit as shown below. Adjust the powersupply to the VTh value. Adjust the 500 Ωpotentiometer (pot) to the RTh value with the aid of anohmmeter. (It’s best to put the pot in the bread board,connect the ohmmeter to the center and one of theother terminals, adjust the pot to the right value, andthen build the rest of the circuit around it without touching itagain.
Confirm that this new circuit behaves just like the one itsupposedly replaces, that is, take another set of readingswith each of the following loads; RL = 0 Ω (short circuit), RL
= 100 Ω, RL = 390 Ω, and RL = 4 Ω (open circuit). Graphthese on your I vs V plot and comment on circuitequivalence.
Calculate and compare: Finally, just in case you thoughtthis was easier than the calculations, I want you to find theThévenin equivalent circuit by calculations as well andcompare your measured and calculated RTh and VTh values. (You may do this later)
Thévenin equivalent of the servo’s “InputPosition” potentiometerTurn off the power switch on the servo and hook it up to thepower supply. Adjust the power supply to provide + 6V asyou did in the first lab. If you’ve forgotten how to do this, referback to the lab handout for lab 1. Turn on the power switchon the servo and make sure that it is functioning properly. When you do something like this you should note it in yourlab notebook, sort-of like this: “We hooked power to the servoand made sure it was still working.”
In the last lab you saw how the “Input Position” potentiometer translates shaft position intovoltage. Sensors are often modeled as variable sources with a source resistance, just like a
p3 ECE 2210/2200 Thevenin Lab
Thévenin equivalent. In this case that’s not a perfect model, since the Thévenin resistance(Rth) also changes a little as you turn the pot. Nevertheless, we’ll find a Thévenin equivalentfor most clockwise position of the pot and call it good.
Find the wires that go to the motor and pull the plug out of the circuit board. Thisdisconnects the motor so it won’t run.
Connect the black lead of a voltmeter to the lead from the power-supply common (the greenbanana connector on the board). This is the ground of the servo board.
Find the center terminal of the “Input Position” pot, where the yellow is soldered. Connectthe red lead of the voltmeter to this point. Measure and record the range of voltages here asyou turn the pot through its range of motion. Turn the pot to the fully clockwise position andleave it there. Measure the open-circuit voltage.
Find the jumpers on the circuit board labeled “Connect BNC”, and “Connect Pot”. Move the“Connect BNC” jumper to the “Connect Resistor” position. This connects a 10kΩ resistorbetween the center connection of the pot (yellow lead) and ground making the loadresistance 10kΩ (RL = 10kΩ). The measured voltage should decrease somewhat. Recordthis as the loaded voltage (VL). Draw the Thévenin circuit including the load and show thevalues that you know (Vth, VL, and RL). Calculate the value of Thévenin resistance (Rth).
This kind of Thévenin or source resistance is often called the “output resistance” or “outputimpedance” of the sensor. A power source has a “source resistance”, a Thévenin equivalentcircuit has a “Thévenin resistance”, and a signal source has a “output resistance”. These allrefer to the same basic idea and are used somewhat interchangeably.
Reconnect the motor and turn on the output of the power supply. Make sure that the servois again functioning properly before you return it to the check-out counter. If it doesn’t work,turn it off, check the connections you messed with and/or ask the TA for help.
More on next page ----->>>
p4 ECE 2210/2200 Thevenin Lab
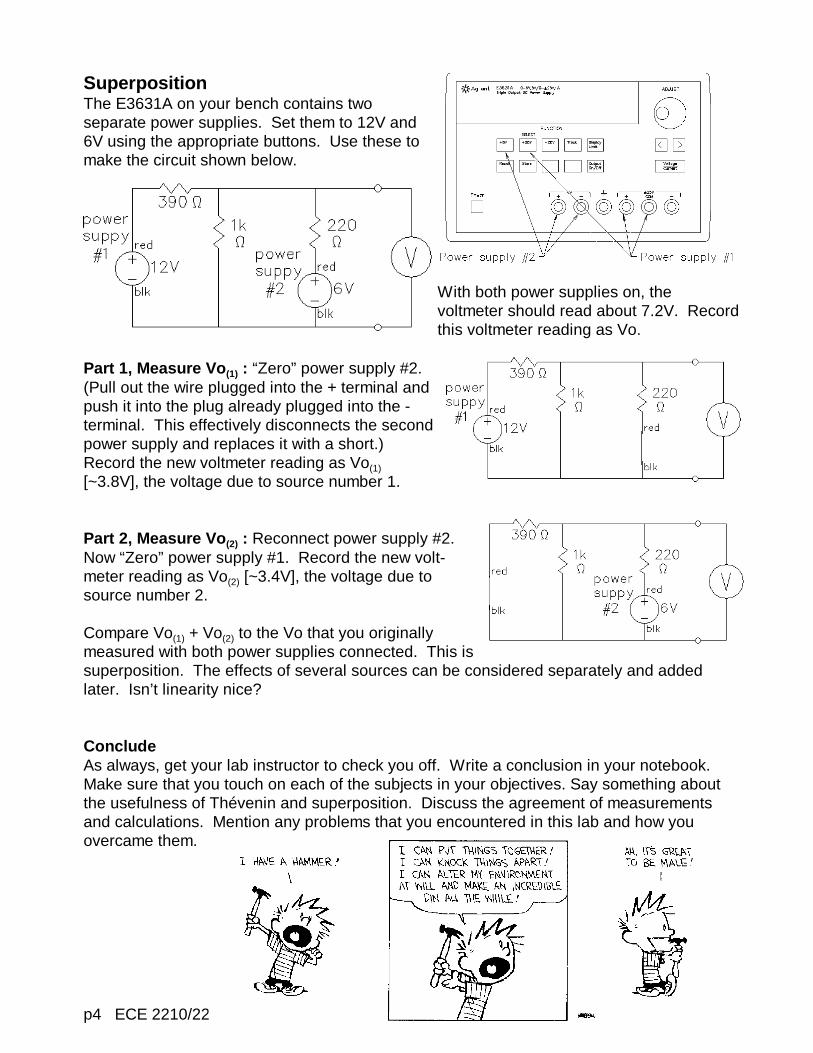
SuperpositionThe E3631A on your bench contains twoseparate power supplies. Set them to 12V and6V using the appropriate buttons. Use these tomake the circuit shown below.
With both power supplies on, thevoltmeter should read about 7.2V. Recordthis voltmeter reading as Vo.
Part 1, Measure Vo (1) : “Zero” power supply #2. (Pull out the wire plugged into the + terminal andpush it into the plug already plugged into the -terminal. This effectively disconnects the secondpower supply and replaces it with a short.) Record the new voltmeter reading as Vo(1)
[~3.8V], the voltage due to source number 1.
Part 2, Measure Vo (2) : Reconnect power supply #2. Now “Zero” power supply #1. Record the new volt-meter reading as Vo(2) [~3.4V], the voltage due tosource number 2.
Compare Vo(1) + Vo(2) to the Vo that you originallymeasured with both power supplies connected. This issuperposition. The effects of several sources can be considered separately and addedlater. Isn’t linearity nice?
ConcludeAs always, get your lab instructor to check you off. Write a conclusion in your notebook. Make sure that you touch on each of the subjects in your objectives. Say something aboutthe usefulness of Thévenin and superposition. Discuss the agreement of measurementsand calculations. Mention any problems that you encountered in this lab and how youovercame them.
p1 ECE 2210/2200 Scope Lab
University of UtahElectrical & Computer Engineering Department
ECE 2210/2200 Lab 4Oscilloscope
A. Stolp, 9/12/12Rev 9/22/15, 9/15/16
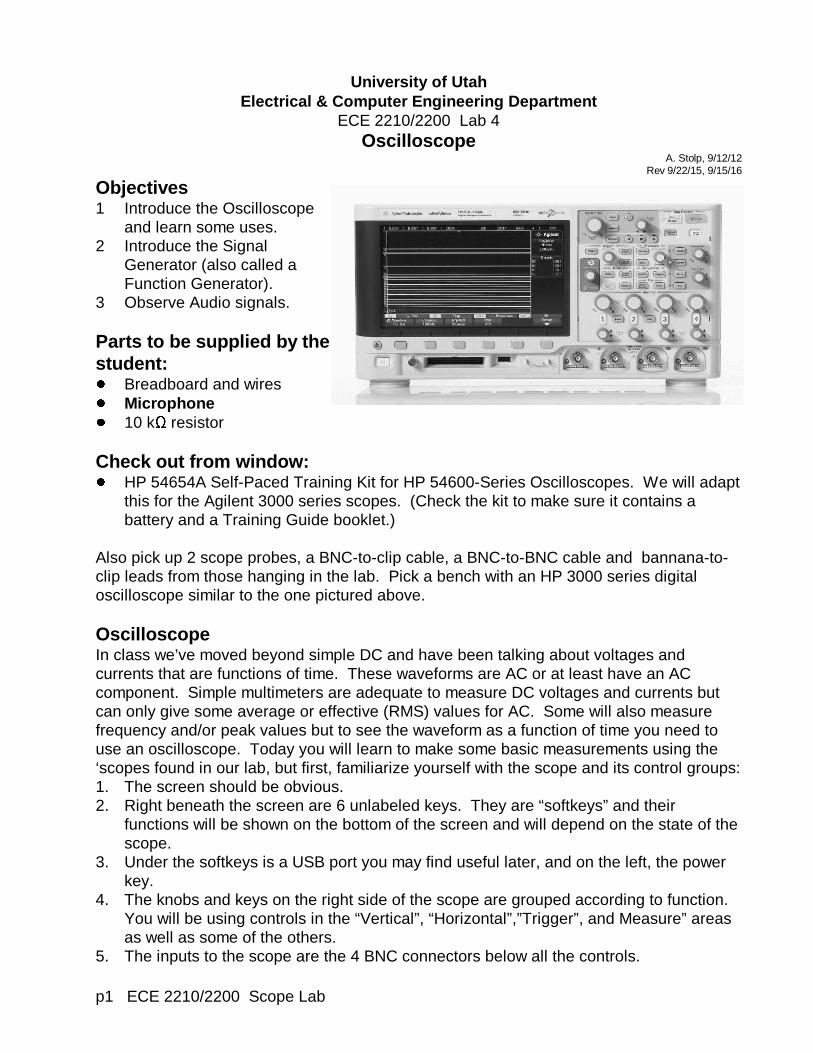
Objectives1 Introduce the Oscilloscope
and learn some uses.2 Introduce the Signal
Generator (also called aFunction Generator).
3 Observe Audio signals.
Parts to be supplied by thestudent:! Breadboard and wires! Microphone! 10 kΩ resistor
Check out from window:! HP 54654A Self-Paced Training Kit for HP 54600-Series Oscilloscopes. We will adaptthis for the Agilent 3000 series scopes. (Check the kit to make sure it contains abattery and a Training Guide booklet.)
Also pick up 2 scope probes, a BNC-to-clip cable, a BNC-to-BNC cable and bannana-to-clip leads from those hanging in the lab. Pick a bench with an HP 3000 series digitaloscilloscope similar to the one pictured above.
OscilloscopeIn class we’ve moved beyond simple DC and have been talking about voltages andcurrents that are functions of time. These waveforms are AC or at least have an ACcomponent. Simple multimeters are adequate to measure DC voltages and currents butcan only give some average or effective (RMS) values for AC. Some will also measurefrequency and/or peak values but to see the waveform as a function of time you need touse an oscilloscope. Today you will learn to make some basic measurements using the‘scopes found in our lab, but first, familiarize yourself with the scope and its control groups:1. The screen should be obvious.2. Right beneath the screen are 6 unlabeled keys. They are “softkeys” and their
functions will be shown on the bottom of the screen and will depend on the state of thescope.
3. Under the softkeys is a USB port you may find useful later, and on the left, the powerkey.
4. The knobs and keys on the right side of the scope are grouped according to function. You will be using controls in the “Vertical”, “Horizontal”,”Trigger”, and Measure” areasas well as some of the others.
5. The inputs to the scope are the 4 BNC connectors below all the controls.
p2 ECE 2210/2200 Scope Lab
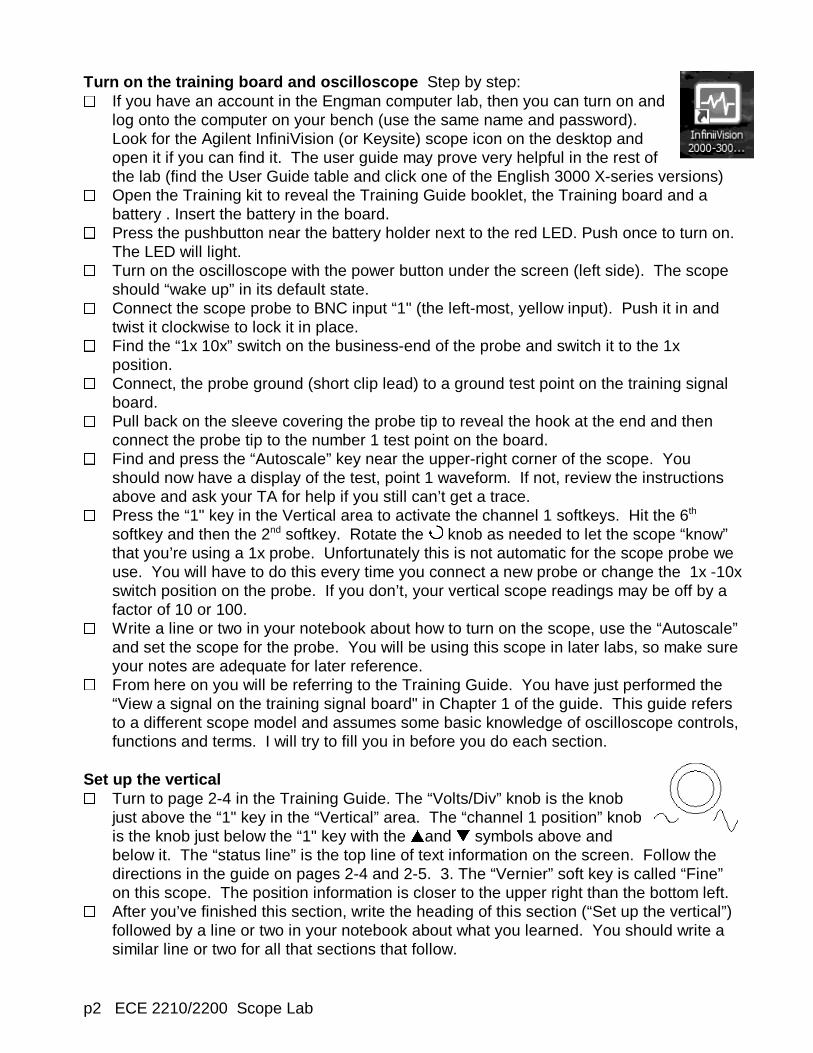
Turn on the training board and oscilloscope Step by step:G If you have an account in the Engman computer lab, then you can turn on andlog onto the computer on your bench (use the same name and password). Look for the Agilent InfiniVision (or Keysite) scope icon on the desktop andopen it if you can find it. The user guide may prove very helpful in the rest ofthe lab (find the User Guide table and click one of the English 3000 X-series versions)G Open the Training kit to reveal the Training Guide booklet, the Training board and abattery . Insert the battery in the board.G Press the pushbutton near the battery holder next to the red LED. Push once to turn on. The LED will light. G Turn on the oscilloscope with the power button under the screen (left side). The scopeshould “wake up” in its default state.G Connect the scope probe to BNC input “1" (the left-most, yellow input). Push it in andtwist it clockwise to lock it in place.G Find the “1x 10x” switch on the business-end of the probe and switch it to the 1xposition.G Connect, the probe ground (short clip lead) to a ground test point on the training signalboard.G Pull back on the sleeve covering the probe tip to reveal the hook at the end and thenconnect the probe tip to the number 1 test point on the board. G Find and press the “Autoscale” key near the upper-right corner of the scope. Youshould now have a display of the test, point 1 waveform. If not, review the instructionsabove and ask your TA for help if you still can’t get a trace.G Press the “1" key in the Vertical area to activate the channel 1 softkeys. Hit the 6th
softkey and then the 2nd softkey. Rotate the knob as needed to let the scope “know”that you’re using a 1x probe. Unfortunately this is not automatic for the scope probe weuse. You will have to do this every time you connect a new probe or change the 1x -10xswitch position on the probe. If you don’t, your vertical scope readings may be off by afactor of 10 or 100.G Write a line or two in your notebook about how to turn on the scope, use the “Autoscale”and set the scope for the probe. You will be using this scope in later labs, so make sureyour notes are adequate for later reference. G From here on you will be referring to the Training Guide. You have just performed the“View a signal on the training signal board" in Chapter 1 of the guide. This guide refersto a different scope model and assumes some basic knowledge of oscilloscope controls,functions and terms. I will try to fill you in before you do each section.
Set up the verticalG Turn to page 2-4 in the Training Guide. The “Volts/Div” knob is the knobjust above the “1" key in the “Vertical” area. The “channel 1 position” knobis the knob just below the “1" key with the •and – symbols above andbelow it. The “status line” is the top line of text information on the screen. Follow thedirections in the guide on pages 2-4 and 2-5. 3. The “Vernier” soft key is called “Fine”on this scope. The position information is closer to the upper right than the bottom left.G After you’ve finished this section, write the heading of this section (“Set up the vertical”)followed by a line or two in your notebook about what you learned. You should write asimilar line or two for all that sections that follow.
p3 ECE 2210/2200 Scope Lab
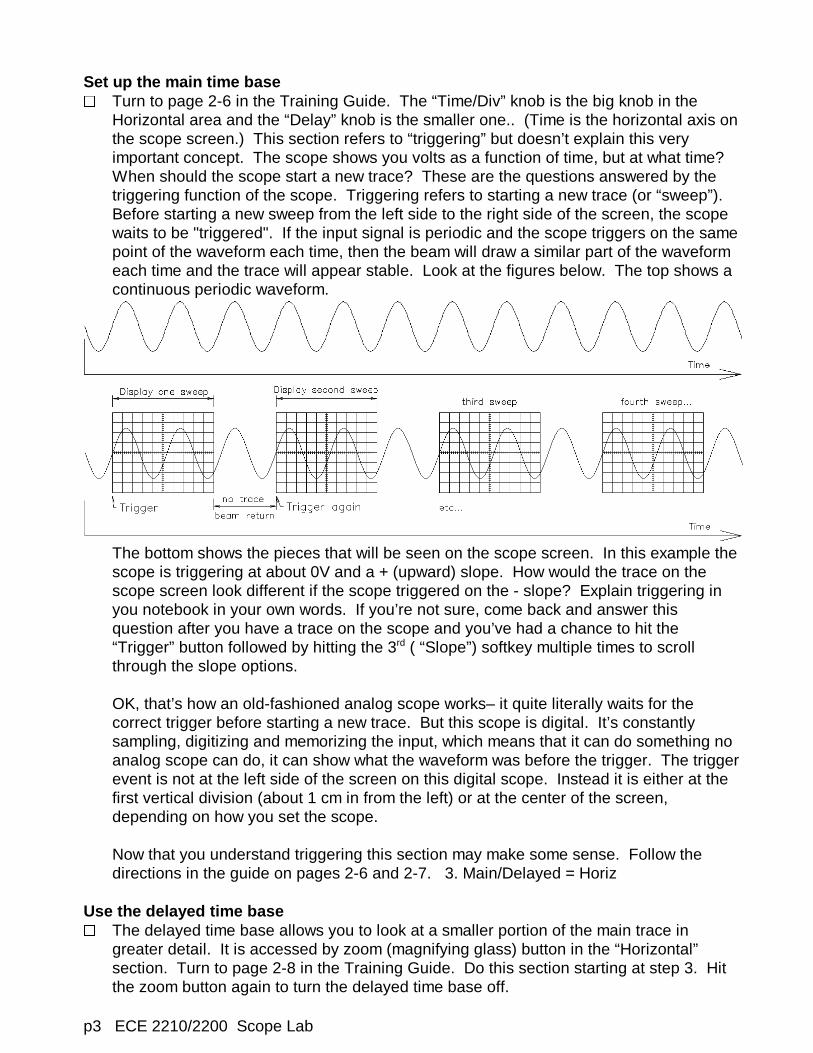
Set up the main time baseG Turn to page 2-6 in the Training Guide. The “Time/Div” knob is the big knob in theHorizontal area and the “Delay” knob is the smaller one.. (Time is the horizontal axis onthe scope screen.) This section refers to “triggering” but doesn’t explain this veryimportant concept. The scope shows you volts as a function of time, but at what time? When should the scope start a new trace? These are the questions answered by thetriggering function of the scope. Triggering refers to starting a new trace (or “sweep”). Before starting a new sweep from the left side to the right side of the screen, the scopewaits to be "triggered". If the input signal is periodic and the scope triggers on the samepoint of the waveform each time, then the beam will draw a similar part of the waveformeach time and the trace will appear stable. Look at the figures below. The top shows acontinuous periodic waveform.
The bottom shows the pieces that will be seen on the scope screen. In this example thescope is triggering at about 0V and a + (upward) slope. How would the trace on thescope screen look different if the scope triggered on the - slope? Explain triggering inyou notebook in your own words. If you’re not sure, come back and answer thisquestion after you have a trace on the scope and you’ve had a chance to hit the“Trigger” button followed by hitting the 3rd ( “Slope”) softkey multiple times to scrollthrough the slope options.
OK, that’s how an old-fashioned analog scope works– it quite literally waits for thecorrect trigger before starting a new trace. But this scope is digital. It’s constantlysampling, digitizing and memorizing the input, which means that it can do something noanalog scope can do, it can show what the waveform was before the trigger. The triggerevent is not at the left side of the screen on this digital scope. Instead it is either at thefirst vertical division (about 1 cm in from the left) or at the center of the screen,depending on how you set the scope.
Now that you understand triggering this section may make some sense. Follow thedirections in the guide on pages 2-6 and 2-7. 3. Main/Delayed = Horiz
Use the delayed time baseG The delayed time base allows you to look at a smaller portion of the main trace ingreater detail. It is accessed by zoom (magnifying glass) button in the “Horizontal”section. Turn to page 2-8 in the Training Guide. Do this section starting at step 3. Hitthe zoom button again to turn the delayed time base off.
p4 ECE 2210/2200 Scope Lab
Set up the normal triggerG Turn to page 2-9 in the Training Guide. In step 4, use the “Trigger” key and try thedifferent softkey options to see what they do.
Use time and voltage cursorsG Do the next two sections. Note that the “Cursors” key gives you a “Cursors” softkey toselect X1 an X2 instead of t1 and t2 and Y1 and Y2 instead of V1 an V2. Once you’vehit the “Cursors” softkey once, use the knob and the “Cursors” knob together tochange the cursors quickly and make measurements fast.
Make voltage and time measurementsG Notice the status line at the top of the screen. It shows the volts per division setting forboth channels. Use these values and the division lines on the scope screen todetermine the peak-to-peak voltage of each waveform. The status line also shows thetime per division setting. Use that to determine the period of either waveform and fromthat the frequency.G Now turn to page 2-13 in the Training Guide. Follow the directions there to see how youcan let the scope make these measurements for you. Note: your scope has just one“Meas” key instead of individual “Voltage” and “Time “ keys.
Using Trigger HoldoffG Trigger holdoff is a softkey under the “Mode/Coupling” key. When asked in step 5, usethe knob as needed to get the desired trigger holdoff.G Turning to page 2-15 and doing the next two sections will give you a much better idea ofwhat triggering is all about and why it is needed to get stable trace. Record the holdoffneeded to achieve a stable trace.
Observe the phase differences between signalsG Turn to page 2-33 and do that section. Note: use the “Trigger” key and the softkeys tochange the trigger source to Ch1.G Turn both knobs on the trainer fully clockwise. Use a combination of the cursors and the“Meas” key to find the phase lag of the lower waveformG Make sure that you’ve made some comments in your notebook for each section.
Ok, that’s enough for the training board, let’s measure something else with the scope. Butfirst, turn off the training board and disconnect the scope probes from the board. Return thetraining board now, it may be in demand by other students.
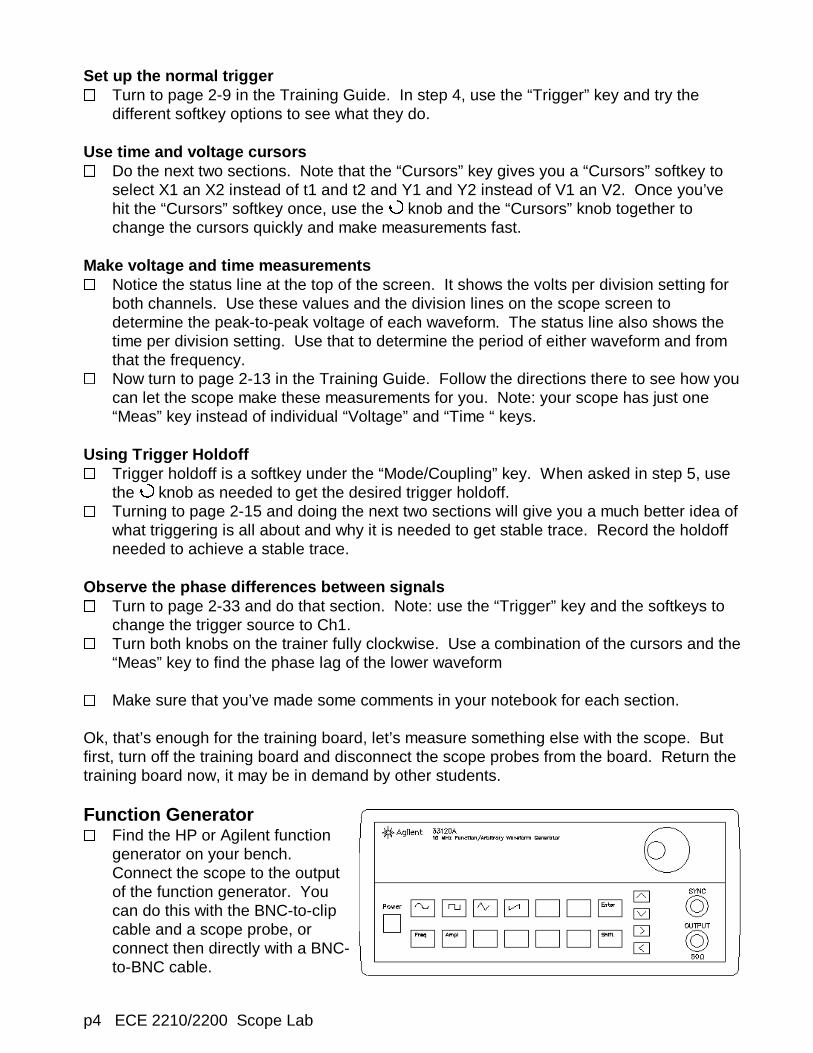
Function GeneratorG Find the HP or Agilent functiongenerator on your bench. Connect the scope to the outputof the function generator. Youcan do this with the BNC-to-clipcable and a scope probe, orconnect then directly with a BNC-to-BNC cable.
p5 ECE 2210/2200 Scope Lab
G Turn on the function generator and let it begin operating. Adjust the scope to look at thetrace. Determine the frequency and amplitude (or peak-to-peak) of the signal. Find thefrequency and amplitude (or peak-to-peak) values shown by the function generator (youmay have to push the “Freq” and/or the “Ampl” buttons to change the display on thefunction generator). Compare your two sets of values. You should find somethingstrange about the amplitude (or peak-to-peak) values. For reasons I can only describeas “ding-a-ling design”, the function generator actually outputs twice the amplitude itshows, hence, 100 mVpp is actually 200 mVpp. (The ding-a-ling designers made theidiotic assumption that you would always hook their function generator to a 50 Ω load. Since the output resistance (RS) is also 50 Ω that would result halving the output. Giventhat you almost never actually hook the function generator to a 50 Ω load, that was anincredibly stupid assumption on their part.) Please, when you become an engineer anddesigner, please try to imagine how all the end users will actually use your device andtry to anticipate their expectations. If you can’t do this, then please become an “enduser” yourself for as long as you can before you finalize your design. Maybe that wayyou can catch the “ding-a-ling” mistakes before you inflict them on your customers. Forexample, examine and compare how Apple products operate vs. Microsoft products...you’ll get the idea. Design for the convenience and expectations of the end user– notfor the producer. Keysite function generators do not have this problem.G Hit the button and observe the effect on the scope. Try the other two waveformshapes as well. Go back to the sinusoid.G Hit the “Freq” button and change the frequency to 25 Hz. You will need to use acombination of the knob and the and buttons. Readjust the scope, measure andcompare the frequency.G Repeat for 12.345 MHz.G Hit the “Ampl” button and change the displayed Vpp to 240 mVpp. Again, you will needto use a combination of the knob and the and buttons. Readjust the scope,measure and compare the Vpp.G Repeat for 9.5 Vpp.G Play some more with this combination of instruments and finally turn off the functiongenerator.
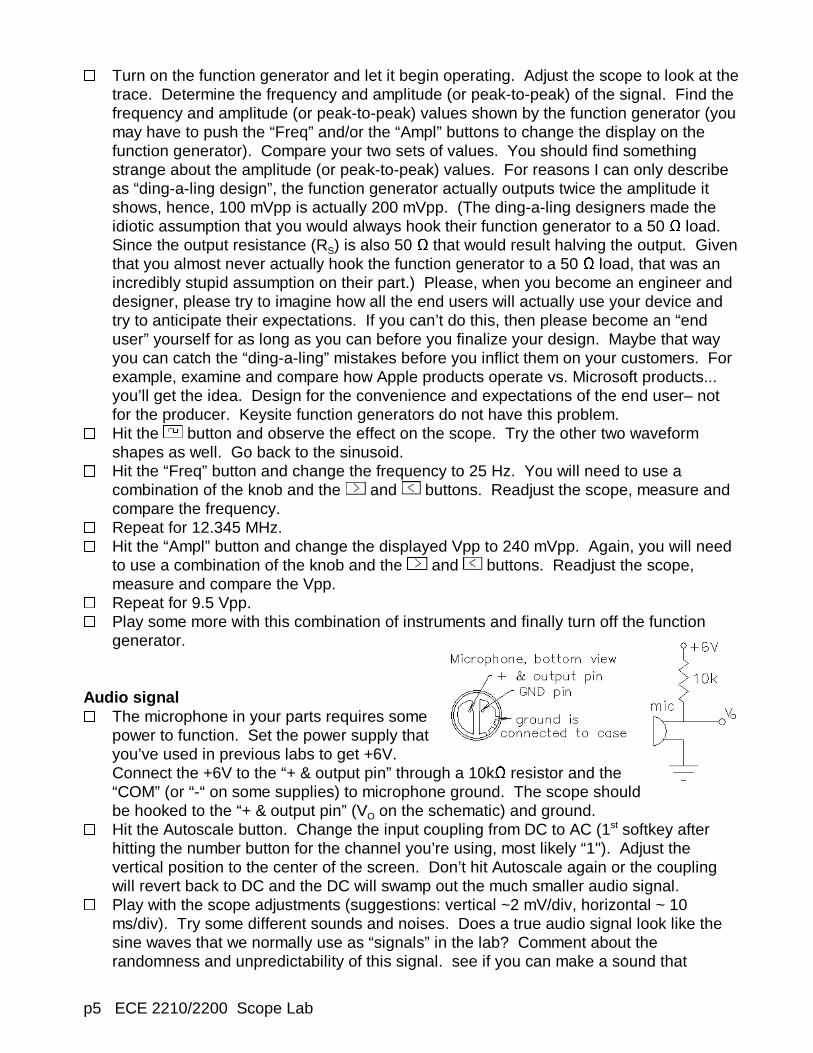
Audio signal G The microphone in your parts requires somepower to function. Set the power supply thatyou’ve used in previous labs to get +6V. Connect the +6V to the “+ & output pin” through a 10kΩ resistor and the“COM” (or “-“ on some supplies) to microphone ground. The scope shouldbe hooked to the “+ & output pin” (VO on the schematic) and ground.G Hit the Autoscale button. Change the input coupling from DC to AC (1st softkey afterhitting the number button for the channel you’re using, most likely “1"). Adjust thevertical position to the center of the screen. Don’t hit Autoscale again or the couplingwill revert back to DC and the DC will swamp out the much smaller audio signal.G Play with the scope adjustments (suggestions: vertical ~2 mV/div, horizontal ~ 10ms/div). Try some different sounds and noises. Does a true audio signal look like thesine waves that we normally use as “signals” in the lab? Comment about therandomness and unpredictability of this signal. see if you can make a sound that
p6 ECE 2210/2200 Scope Lab
produces something like a sine wave. Note: the triggering will work better if you rejectthe high frequencies and noise. You can do this with softkeys after you hit the“Mode/Coupling” button in the “Trigger” area. G Speak into the microphone. Notice that each sweep triggers at the same level andslope, even though the waveform isn’t periodic (each trace is different from the last one). The scope is triggering normally, it can’t help it that the traces don’t overlap nicely afterthe trigger.
Frequencies of different soundsG Make vowel sounds; ahhh, aye, eeee, oooo, eww, etc.. Notice the different frequenciesof the different sounds. Try some consonant sounds, like ssssss, shhhh, fffff, or zzzzz. What kinds of sounds are generally higher in frequency?G Now try to capture some more transient sounds, like t, k, ch, or g. These will be difficultto see, especially with all the noise in the lab. Try “Run/Stop” and “Single” to freeze asingle trace that you can look at. Try to freeze and look at the t, k, ch, or g soundsagain. G You should find that the vowel sounds are generally louder and lower in frequency thanthe consonant sounds. Comment in your notebook. Unfortunately, the consonantsounds are the most important when it comes to understanding speech, so a commoncomplaint of someone who’s lost some of their hearing at higher frequency is, “I canhear, but I can’t understand.”
ConclusionThis should give you a quick overview of the most important features of the oscilloscope andthe function generator as well as give you some practical experience with the microphone. The trainer will help you explore further if you want. Throughout the rest of this semesteryou will use the scope for many of your measurements and will become much handier with it. Write aconclusion inyour notebooklike you’vedone before. Call your labinstructor overto check youoff. Beprepared todiscuss yourmeasurements,andconclusionsand to show offyour notebook.
p1 ECE 2210 Capacitors Lab
University of UtahElectrical & Computer Engineering Department
ECE 2210/2200 Lab 5Capacitors
A. Stolp, 10/4/99rev 9/18/12 2/5/13 9/22/13
Objectives1.) Observe charging and discharging of a capacitor.2.) Measure the time constant of an RC circuit.3.) Observe and measure the frequency dependence of capacitor impedance.4.) Observe the phase relationship of AC voltages and confirm KVL for these voltages.
Parts to be supplied by the student: (Parts in bold are new to this lab)! 1 kΩ (brn,blk,red), and 100 kΩ (brn,blk,yel) resistors! 0.1 µF (usually marked 104) and two 47 µF capacitors
Equipment and materials to be checked out from stoc kroom:! Analog BK precision multimeter or similar.
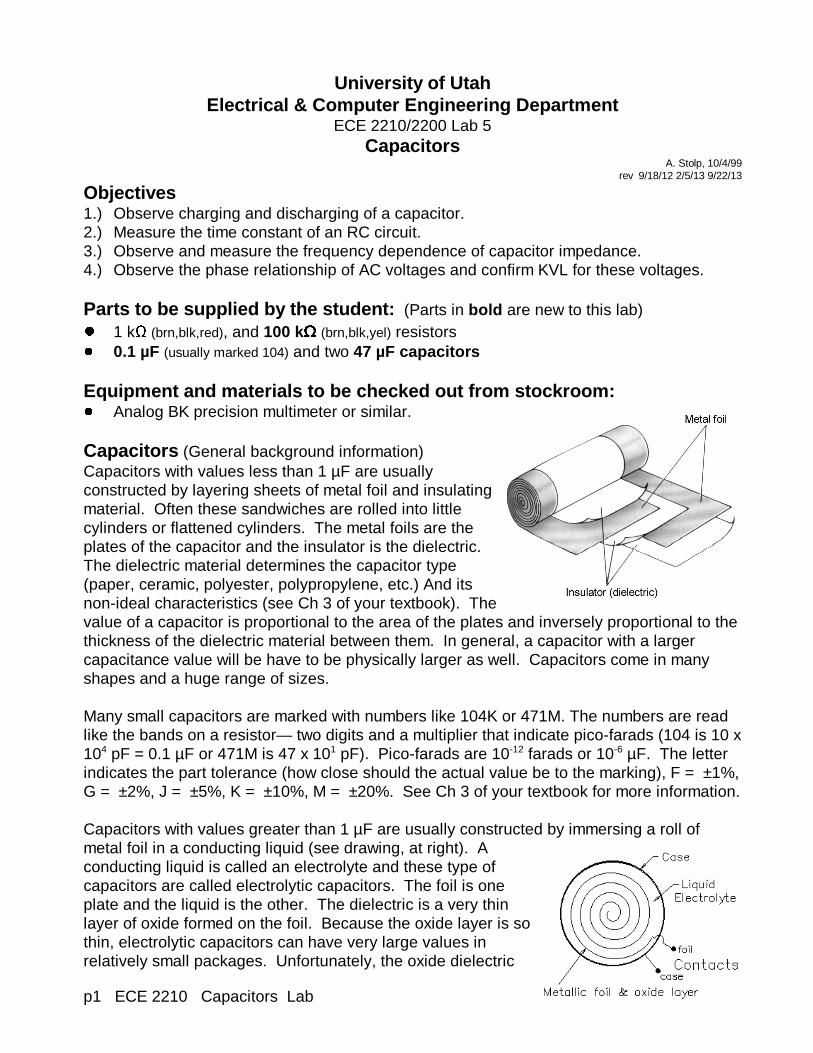
Capacitors (General background information)Capacitors with values less than 1 µF are usuallyconstructed by layering sheets of metal foil and insulatingmaterial. Often these sandwiches are rolled into littlecylinders or flattened cylinders. The metal foils are theplates of the capacitor and the insulator is the dielectric. The dielectric material determines the capacitor type(paper, ceramic, polyester, polypropylene, etc.) And itsnon-ideal characteristics (see Ch 3 of your textbook). Thevalue of a capacitor is proportional to the area of the plates and inversely proportional to thethickness of the dielectric material between them. In general, a capacitor with a largercapacitance value will be have to be physically larger as well. Capacitors come in manyshapes and a huge range of sizes.
Many small capacitors are marked with numbers like 104K or 471M. The numbers are readlike the bands on a resistor— two digits and a multiplier that indicate pico-farads (104 is 10 x104 pF = 0.1 µF or 471M is 47 x 101 pF). Pico-farads are 10-12 farads or 10-6 µF. The letterindicates the part tolerance (how close should the actual value be to the marking), F = ±1%,G = ±2%, J = ±5%, K = ±10%, M = ±20%. See Ch 3 of your textbook for more information.
Capacitors with values greater than 1 µF are usually constructed by immersing a roll ofmetal foil in a conducting liquid (see drawing, at right). Aconducting liquid is called an electrolyte and these type ofcapacitors are called electrolytic capacitors. The foil is oneplate and the liquid is the other. The dielectric is a very thinlayer of oxide formed on the foil. Because the oxide layer is sothin, electrolytic capacitors can have very large values inrelatively small packages. Unfortunately, the oxide dielectric
p2 ECE 2210 Capacitors Lab
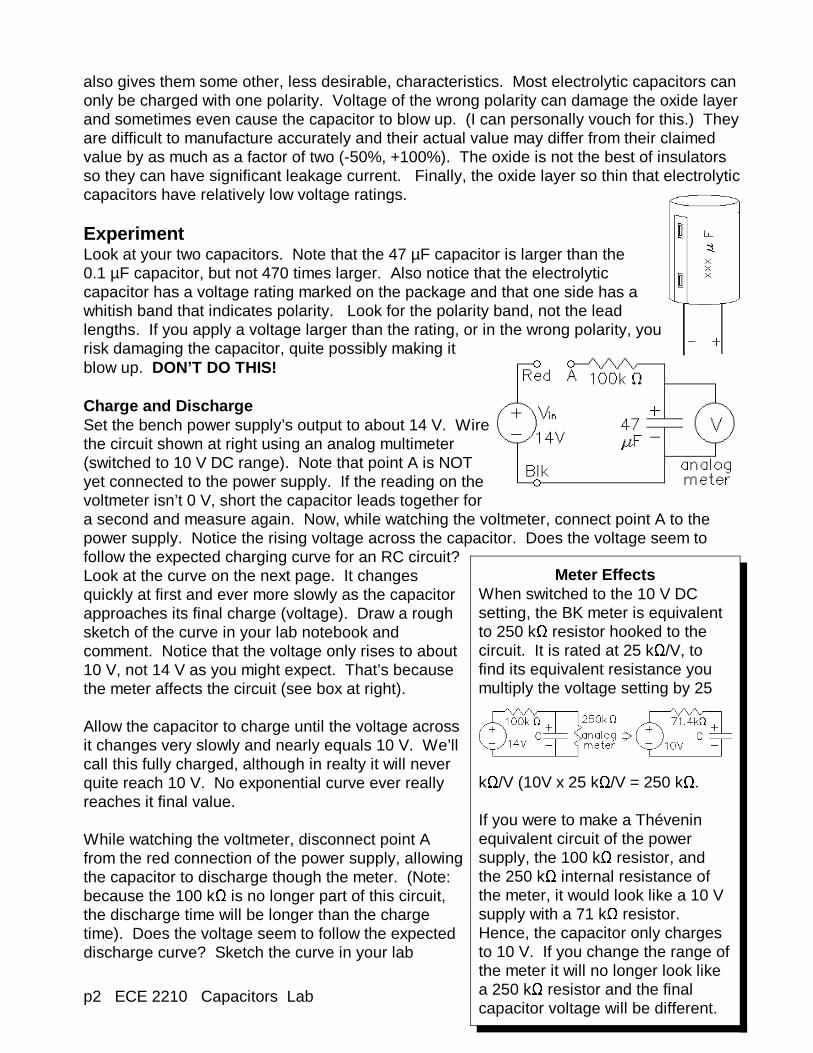
Meter EffectsWhen switched to the 10 V DCsetting, the BK meter is equivalentto 250 kΩ resistor hooked to thecircuit. It is rated at 25 kΩ/V, tofind its equivalent resistance youmultiply the voltage setting by 25
kΩ/V (10V x 25 kΩ/V = 250 kΩ.
If you were to make a Théveninequivalent circuit of the powersupply, the 100 kΩ resistor, andthe 250 kΩ internal resistance ofthe meter, it would look like a 10 Vsupply with a 71 kΩ resistor. Hence, the capacitor only chargesto 10 V. If you change the range ofthe meter it will no longer look likea 250 kΩ resistor and the finalcapacitor voltage will be different.
also gives them some other, less desirable, characteristics. Most electrolytic capacitors canonly be charged with one polarity. Voltage of the wrong polarity can damage the oxide layerand sometimes even cause the capacitor to blow up. (I can personally vouch for this.) Theyare difficult to manufacture accurately and their actual value may differ from their claimedvalue by as much as a factor of two (-50%, +100%). The oxide is not the best of insulatorsso they can have significant leakage current. Finally, the oxide layer so thin that electrolyticcapacitors have relatively low voltage ratings.
ExperimentLook at your two capacitors. Note that the 47 µF capacitor is larger than the0.1 µF capacitor, but not 470 times larger. Also notice that the electrolyticcapacitor has a voltage rating marked on the package and that one side has awhitish band that indicates polarity. Look for the polarity band, not the leadlengths. If you apply a voltage larger than the rating, or in the wrong polarity, yourisk damaging the capacitor, quite possibly making itblow up. DON’T DO THIS!
Charge and DischargeSet the bench power supply’s output to about 14 V. Wirethe circuit shown at right using an analog multimeter(switched to 10 V DC range). Note that point A is NOTyet connected to the power supply. If the reading on thevoltmeter isn’t 0 V, short the capacitor leads together fora second and measure again. Now, while watching the voltmeter, connect point A to thepower supply. Notice the rising voltage across the capacitor. Does the voltage seem tofollow the expected charging curve for an RC circuit? Look at the curve on the next page. It changesquickly at first and ever more slowly as the capacitorapproaches its final charge (voltage). Draw a roughsketch of the curve in your lab notebook andcomment. Notice that the voltage only rises to about10 V, not 14 V as you might expect. That’s becausethe meter affects the circuit (see box at right).
Allow the capacitor to charge until the voltage acrossit changes very slowly and nearly equals 10 V. We’llcall this fully charged, although in realty it will neverquite reach 10 V. No exponential curve ever reallyreaches it final value.
While watching the voltmeter, disconnect point Afrom the red connection of the power supply, allowingthe capacitor to discharge though the meter. (Note:because the 100 kΩ is no longer part of this circuit,the discharge time will be longer than the chargetime). Does the voltage seem to follow the expecteddischarge curve? Sketch the curve in your lab
p3 ECE 2210 Capacitors Lab
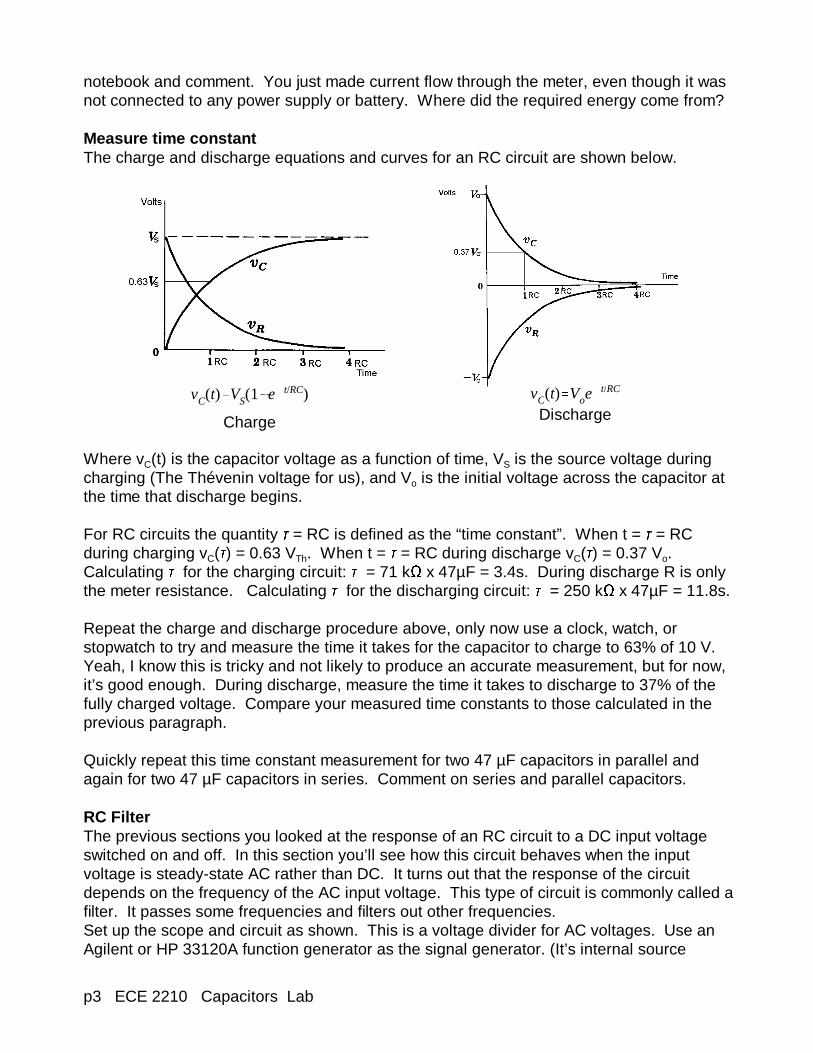
vC(t)'VS(1&e &t/RC)
Charge
vC(t)'Voe&t/RC
Discharge
notebook and comment. You just made current flow through the meter, even though it wasnot connected to any power supply or battery. Where did the required energy come from?
Measure time constantThe charge and discharge equations and curves for an RC circuit are shown below.
Where vC(t) is the capacitor voltage as a function of time, VS is the source voltage duringcharging (The Thévenin voltage for us), and Vo is the initial voltage across the capacitor atthe time that discharge begins.
For RC circuits the quantity τ = RC is defined as the “time constant”. When t = τ = RCduring charging vC(τ) = 0.63 VTh. When t = τ = RC during discharge vC(τ) = 0.37 Vo.Calculating τ for the charging circuit: τ = 71 kΩ x 47µF = 3.4s. During discharge R is onlythe meter resistance. Calculating τ for the discharging circuit: τ = 250 kΩ x 47µF = 11.8s.
Repeat the charge and discharge procedure above, only now use a clock, watch, orstopwatch to try and measure the time it takes for the capacitor to charge to 63% of 10 V. Yeah, I know this is tricky and not likely to produce an accurate measurement, but for now,it’s good enough. During discharge, measure the time it takes to discharge to 37% of thefully charged voltage. Compare your measured time constants to those calculated in theprevious paragraph.
Quickly repeat this time constant measurement for two 47 µF capacitors in parallel andagain for two 47 µF capacitors in series. Comment on series and parallel capacitors.
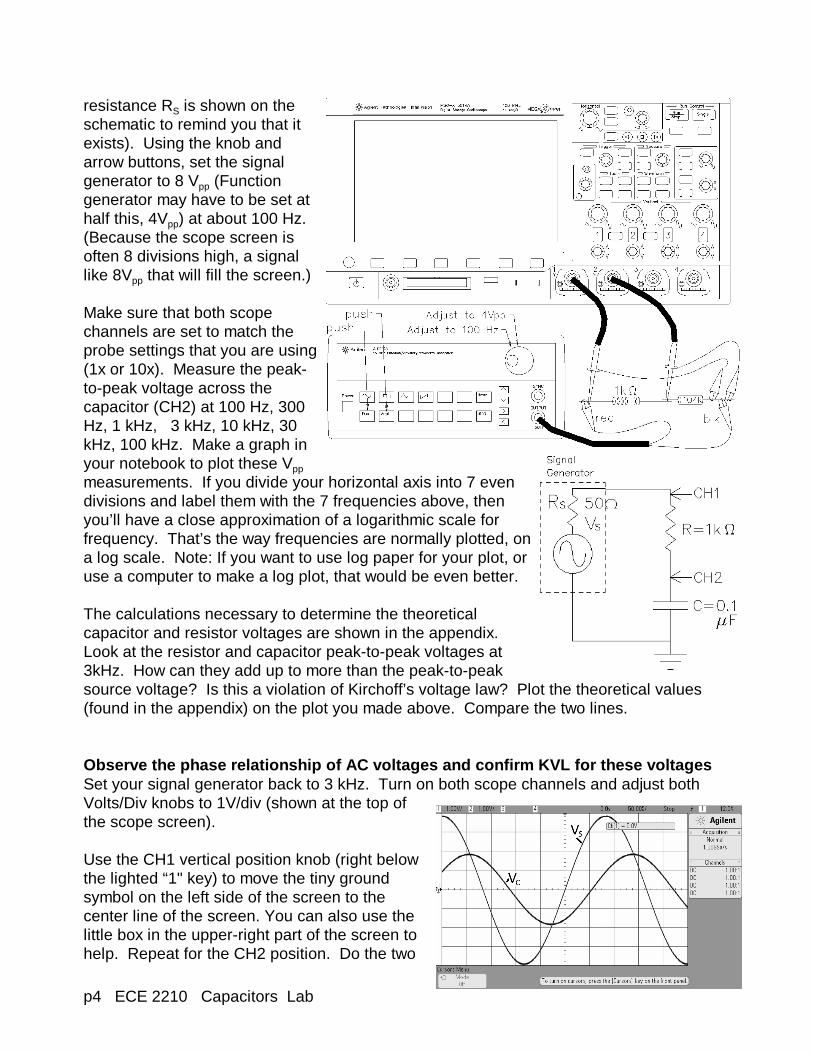
RC FilterThe previous sections you looked at the response of an RC circuit to a DC input voltageswitched on and off. In this section you’ll see how this circuit behaves when the inputvoltage is steady-state AC rather than DC. It turns out that the response of the circuitdepends on the frequency of the AC input voltage. This type of circuit is commonly called afilter. It passes some frequencies and filters out other frequencies. Set up the scope and circuit as shown. This is a voltage divider for AC voltages. Use anAgilent or HP 33120A function generator as the signal generator. (It’s internal source
p4 ECE 2210 Capacitors Lab
resistance RS is shown on theschematic to remind you that itexists). Using the knob andarrow buttons, set the signalgenerator to 8 Vpp (Functiongenerator may have to be set athalf this, 4Vpp) at about 100 Hz. (Because the scope screen isoften 8 divisions high, a signallike 8Vpp that will fill the screen.)
Make sure that both scopechannels are set to match theprobe settings that you are using(1x or 10x). Measure the peak-to-peak voltage across thecapacitor (CH2) at 100 Hz, 300Hz, 1 kHz, 3 kHz, 10 kHz, 30kHz, 100 kHz. Make a graph inyour notebook to plot these Vpp
measurements. If you divide your horizontal axis into 7 evendivisions and label them with the 7 frequencies above, thenyou’ll have a close approximation of a logarithmic scale forfrequency. That’s the way frequencies are normally plotted, ona log scale. Note: If you want to use log paper for your plot, oruse a computer to make a log plot, that would be even better.
The calculations necessary to determine the theoreticalcapacitor and resistor voltages are shown in the appendix. Look at the resistor and capacitor peak-to-peak voltages at3kHz. How can they add up to more than the peak-to-peaksource voltage? Is this a violation of Kirchoff’s voltage law? Plot the theoretical values(found in the appendix) on the plot you made above. Compare the two lines.
Observe the phase relationship of AC voltages and c onfirm KVL for these voltagesSet your signal generator back to 3 kHz. Turn on both scope channels and adjust bothVolts/Div knobs to 1V/div (shown at the top ofthe scope screen).
Use the CH1 vertical position knob (right belowthe lighted “1" key) to move the tiny groundsymbol on the left side of the screen to thecenter line of the screen. You can also use thelittle box in the upper-right part of the screen tohelp. Repeat for the CH2 position. Do the two
p5 ECE 2210 Capacitors Lab
waveforms (VS and VC) peak at the same instant in time? If not, then you really can’t add thepeak-to-peak voltages. You cannot add the peaks if they don’t happen at the same time! You can, however, add the instantaneous voltage levels and we will do that next.
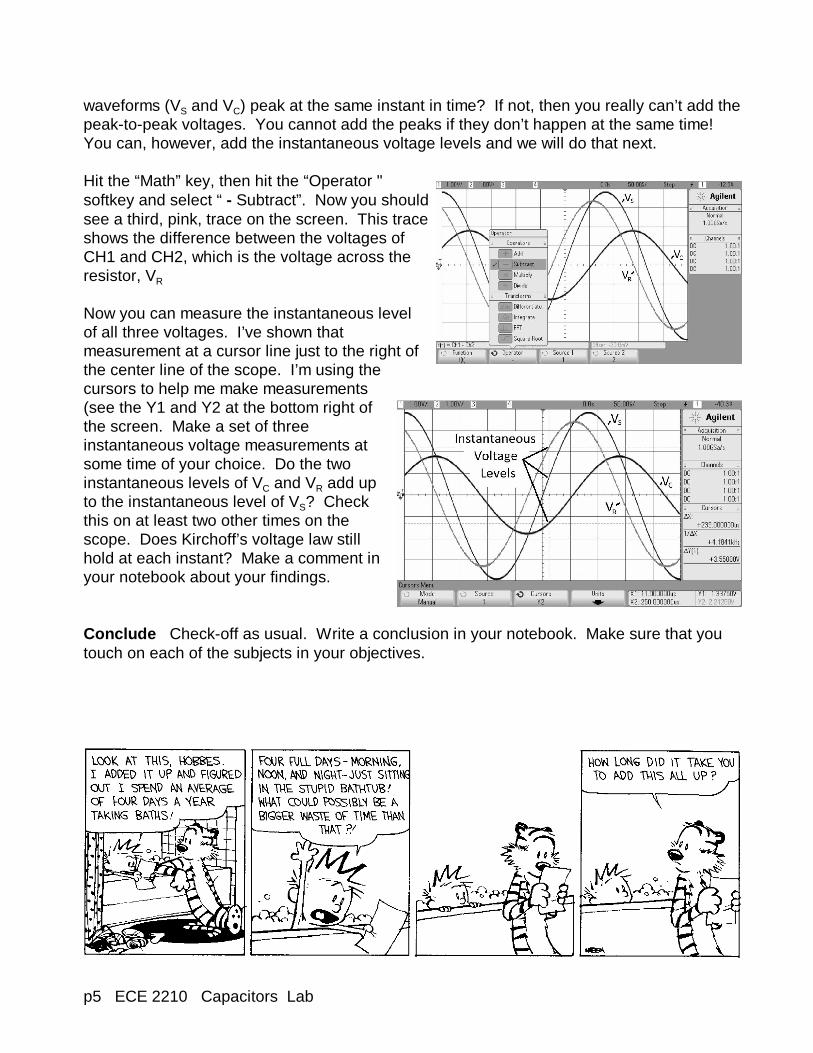
Hit the “Math” key, then hit the “Operator "softkey and select “ - Subtract”. Now you shouldsee a third, pink, trace on the screen. This traceshows the difference between the voltages ofCH1 and CH2, which is the voltage across theresistor, VR
Now you can measure the instantaneous levelof all three voltages. I’ve shown thatmeasurement at a cursor line just to the right ofthe center line of the scope. I’m using thecursors to help me make measurements(see the Y1 and Y2 at the bottom right ofthe screen. Make a set of threeinstantaneous voltage measurements atsome time of your choice. Do the twoinstantaneous levels of VC and VR add upto the instantaneous level of VS? Checkthis on at least two other times on thescope. Does Kirchoff’s voltage law stillhold at each instant? Make a comment inyour notebook about your findings.
Conclude Check-off as usual. Write a conclusion in your notebook. Make sure that youtouch on each of the subjects in your objectives.
p1 ECE 2210/2200 Resonance Lab
University of UtahElectrical & Computer Engineering Department
ECE 2210/2200 Lab 6Resonance
A. Stolp, 10/11/99, rev. 1/6/13
Objectives1.) Observe, measure and plot the resonance of a series RLC circuit.2.) Observe the effect of R on the “Q”.Observe the resonance of a parallel RLC circuit.3.) Observe oscillation and resonance in the servo system.
Parts: (Parts in bold are new to this lab)! 100 (brn,blk,brn), 390 (org,wht,brn) and 2 kΩ (red,blk,red) resistors! 0.001 µF capacitor (typ. marked 102)! Inductor , 2 to 4 mH (ask for a 3.3 mH blue plastic cylinder marked “!332" or 2.8mHmarked “LH233")
Equipment and materials from stockroom:! Servo! From the post in the lab: 2 10X Oscilloscope probes (If they have switches, make surethey’re set to 10X)
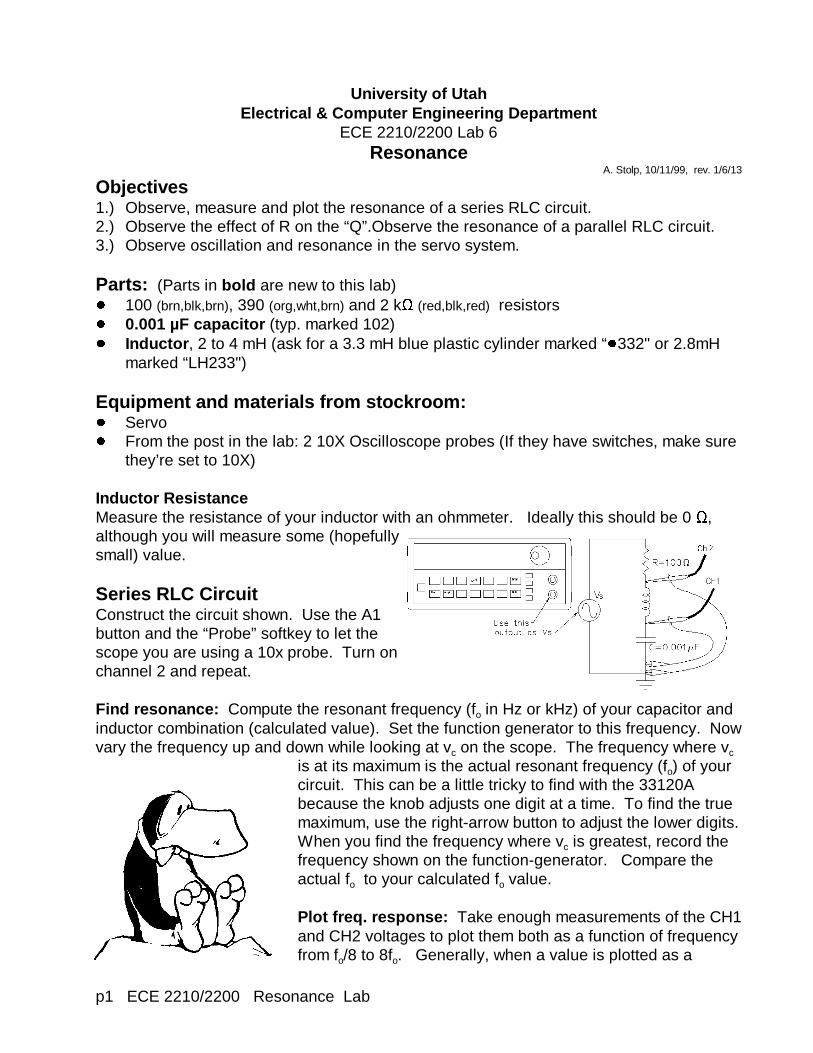
Inductor ResistanceMeasure the resistance of your inductor with an ohmmeter. Ideally this should be 0 Ω,although you will measure some (hopefullysmall) value.
Series RLC CircuitConstruct the circuit shown. Use the A1button and the “Probe” softkey to let thescope you are using a 10x probe. Turn onchannel 2 and repeat.
Find resonance: Compute the resonant frequency (fo in Hz or kHz) of your capacitor andinductor combination (calculated value). Set the function generator to this frequency. Nowvary the frequency up and down while looking at vc on the scope. The frequency where vc
is at its maximum is the actual resonant frequency (fo) of yourcircuit. This can be a little tricky to find with the 33120Abecause the knob adjusts one digit at a time. To find the truemaximum, use the right-arrow button to adjust the lower digits. When you find the frequency where vc is greatest, record thefrequency shown on the function-generator. Compare theactual fo to your calculated fo value.
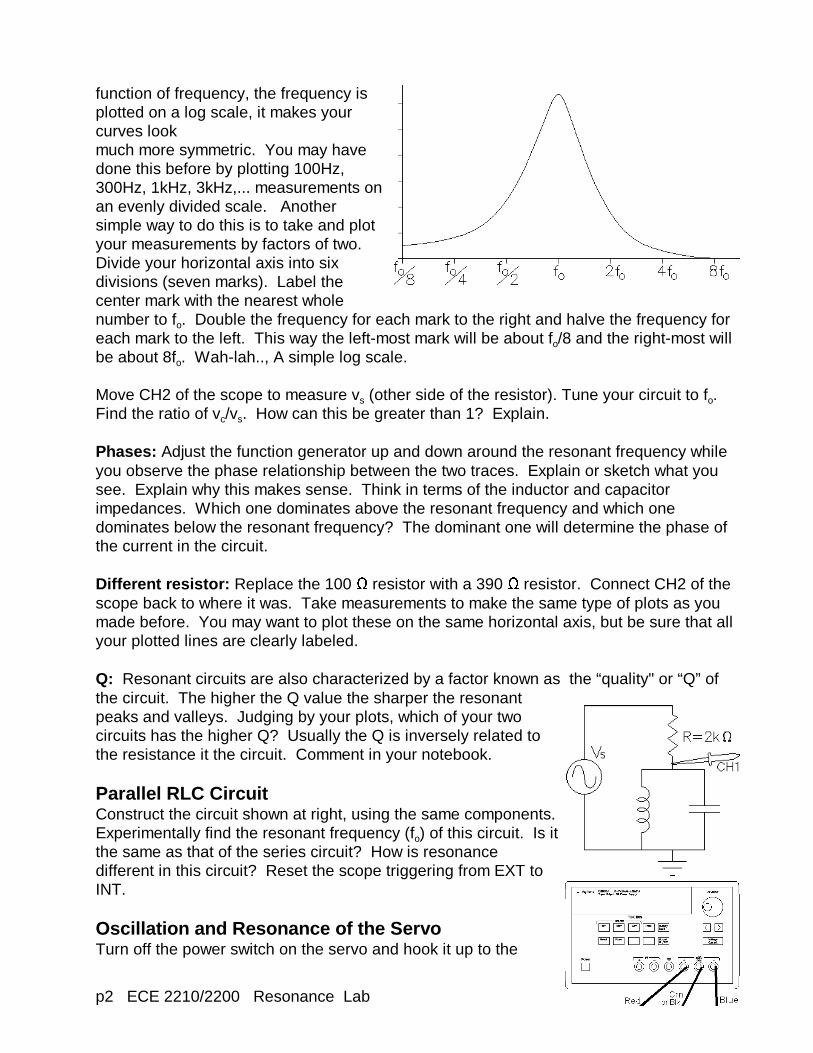
Plot freq. response: Take enough measurements of the CH1and CH2 voltages to plot them both as a function of frequencyfrom fo/8 to 8fo. Generally, when a value is plotted as a
p2 ECE 2210/2200 Resonance Lab
function of frequency, the frequency isplotted on a log scale, it makes yourcurves lookmuch more symmetric. You may havedone this before by plotting 100Hz,300Hz, 1kHz, 3kHz,... measurements onan evenly divided scale. Anothersimple way to do this is to take and plotyour measurements by factors of two. Divide your horizontal axis into sixdivisions (seven marks). Label thecenter mark with the nearest wholenumber to fo. Double the frequency for each mark to the right and halve the frequency foreach mark to the left. This way the left-most mark will be about fo/8 and the right-most willbe about 8fo. Wah-lah.., A simple log scale.
Move CH2 of the scope to measure vs (other side of the resistor). Tune your circuit to fo. Find the ratio of vc/vs. How can this be greater than 1? Explain.
Phases: Adjust the function generator up and down around the resonant frequency whileyou observe the phase relationship between the two traces. Explain or sketch what yousee. Explain why this makes sense. Think in terms of the inductor and capacitorimpedances. Which one dominates above the resonant frequency and which onedominates below the resonant frequency? The dominant one will determine the phase ofthe current in the circuit. Different resistor: Replace the 100 Ω resistor with a 390 Ω resistor. Connect CH2 of thescope back to where it was. Take measurements to make the same type of plots as youmade before. You may want to plot these on the same horizontal axis, but be sure that allyour plotted lines are clearly labeled.
Q: Resonant circuits are also characterized by a factor known as the “quality" or “Q” ofthe circuit. The higher the Q value the sharper the resonantpeaks and valleys. Judging by your plots, which of your twocircuits has the higher Q? Usually the Q is inversely related tothe resistance it the circuit. Comment in your notebook.
Parallel RLC CircuitConstruct the circuit shown at right, using the same components. Experimentally find the resonant frequency (fo) of this circuit. Is itthe same as that of the series circuit? How is resonancedifferent in this circuit? Reset the scope triggering from EXT toINT.
Oscillation and Resonance of the ServoTurn off the power switch on the servo and hook it up to the
p3 ECE 2210/2200 Resonance Lab
power supply. Adjust the power supply to provide + 6V as you did in the first lab. If you’veforgotten how to do this, refer back to the lab handout for lab 1. Turn on the power switchon the servo and make sure that it is functioning properly. Remember, to comment in yourlab notebook that you hooked power to the servo and made sure it was still working.
Hook the scope probe ground clip to the servo ground (the green banana jack where thepower supply is connected). Hook the scope probe up to the center wire of the “MotorPosition Sensor” potentiometer (yello wire). Remark in your notebook that you hooked thescope up to the “Motor Position” signal.
Set the “Input Position” potentiometer to about center position. Turn up the “Gain” (CW)as far as it will go. If the servo doesn’t begin to oscillate on its own, make a slightadjustment to the “Input Position” potentiometer and it should start. If it still doesn’toscillate, turn off the power and adjust the rubber link between the mechanics and the“Motor Position Sensor” to get less friction in the gears. Once you get your servo tooscillate, describe what is happening in your notebook. Adjust the scope to get arepeating trace if you can. Otherwise, hit the “Run/Stop” key to freeze the trace. Find theperiod and frequency of oscillation.
Now slowly turn down the gain until the oscillations stop. Leave the gain at this “barelystable” position. Hook a BNC-to-BNC cable from the function generator to the servo“SIGNAL” input. Turn on the function generator and adjust the amplitude to 1Vpp(probably have to set to 500mVpp). Listen to the servo motor. Is it trying to move backand forth 1000 times per second? It’s not moving very far, is it? Why can’t the mechanicalsystem keep up?
Hit the “Run/Stop” key on the scope again if necessary to unfreeze the trace. Turn downthe frequency until you get significant movement. Adjust the function generator mVpp to alower value, say 200mVpp. Lower the frequency farther and try to find a resonance. (Youmay have to lower the mVpp again to keep the scope trace looking decent. Find theresonant frequency of the servo (where the output is the greatest). Be careful , there maybe more than one peak. This seems to be caused by strange dynamics of the rubber linkbetween the mechanics and the “Motor Position Sensor”. Make sure that you are on theare biggest peak for true resonance. How does this frequency compare to the naturaloscillation frequency that you found earlier? It should be pretty close (but I have to admit,the servos are not very accurate and few people get this resonance to match theoscillation frequency).
ConcludeAs always,check offand write aconclusion.