Embed Size (px)
Citation preview
(Lab 6) Extraction of Caffeine: ranking various teas and coffees by drug content
IntroductionCaffeine is one of three legal, mind-altering drugs available in the U.S without a prescription. Two common sources of this drug are tea and coffee, both of which are prepared via extraction of the solid
foodstuff with liquid water. In this lab you will extract caffeine from food samples with liquid solvents and quantify the amount obtained.
LaboratoryHypothesis:
We can rank various tea and coffee samples by caffeine content by performing a solid-liquid extraction from the foodstuff, followed by analysis via thin-layer chromatography.
Experiment:
In a 50 mL Erlenmeyer flask were placed 2.0 g of black tea. Dichloromethane (15 mL) and 0.2 M
NaOH (5 mL) were added successively, and the stoppered flask was swirled gently by hand for 10 minutes (note: avoid vigorous shaking, as it will cause an emulsion to form). The dicloromethane layerwas separated from the leaves and the aqueous layer by vacuum filtration through 7 g Celite 545, and the leaves were washed with a further 15 mL dichloromethane. The combined dichloromethane
solution was placed in a 50 mL round bottom flask and concentrated to a minimal volume (ca. 1 mL) via simple distillation. The remaining dichloromethane solutions was transferred to a watch glass via
pipet, and the solvent was evaporated in a fume hood. The sample was evaluated by TLC (a mixture ofmethanol and ethyl acetate as the mobile phase, co-spotted with authentic caffeine).
Data: What was your crude yield of caffeine? What was the mass percentage of caffeine in your food source?
Given that the materials we are interested in are UV active, compared to the TLC standard how would you characterize the purity of your caffeine extracts?
Conclusions: Can you comment on the purity of your caffeine sample? For all samples your class worked with,
where does your foodstuff rank in terms of caffeine content? How much caffeine is reported for they typical serving of coffee or tea? How did your extraction and isolation compare?
Source:
J. Chem. Ed. 1996, 73, 556–557.
Lab 7 – Spectroscopy & Chemical Dyes
Goal Calculate the concentration of a dye in real time using sample’s extinction coefficient (ε) and λmax value, the Beer-Lambert Law, and a calibration curve.
Introduction The field of spectroscopy involves the study of light and how it interacts with matter. You will take measurements of visible light (intensity and wavelength) and make conclusions about samples of chemical dyes.
When dealing with visible light, there are two parameters we will be curious about: “what color is it?” and “how intense is it?” The color is correlated to wavelength (λ) of the light and the intensity is usually called I. We will use an instrument called a spectrophotometer to measure these properties of light.
The spectrophotometer will allow us to select the wavelength and intensity of light shone upon our dye samples, and will also be able to measure the intensity of light emitted by the sample. Comparing the intensity of the light before and after interacting with the sample is called measuring transmittance:
! = !!!
This is simply saying that transmittance is the intensity of the light passing through the sample (I) divided by the initial intensity of the light (I0). T will be a value between 0 and 1, with the lowest values coming from samples that let little light pass, and the highest values from samples that let a lot of light through.
Chemists are more likely to talk about the absorbance than transmittance of a particular sample. The absorbance (A) is related to transmittance by the relationship:
! = −log !!!
Large values of A mean that the sample absorbed a lot of light, while small values of A means that your sample did not absorb much light at all. Absorbance is the measurement we will be chiefly concerned about from our spectrophotometer.
One reason we care about absorbance so much is that it can give us an idea of the concentration of a solution. The relevant equation is the ubiquitous Beer-Lambert Law:
! = ε!" In this presentation of Beer's Law, A is absorbance, ε is a physical constant for your particular sample called the “extinction coefficient,” l is the length of the sample (usually a cuvette of length 1 cm), and c is the concentration of the sample. This means that once you measure the absorbance of a sample whose concentration you know, you can calculate the extinction coefficient for your dye sample. Once we have an ε value for the dye, we can calculate unknown concentrations of samples based on their absorbance.
When we observe a large absorbance the concentration is high and if we observe a small absorbance the concentration is low.
One other aspect of chemical reactions which you will study in this experiment is time. The duration of a reaction is often important when you're trying to make something new. For your chemical dye, you will study how fast it reacts with bleach. You will monitor absorbance in real time and be able to observe how fast or slowly the colorful dye is consumed.
Laboratory Work Experiments Dilutions: Your GSI will assign you two of four dye samples: erioglaucine, sunset yellow, fast green, and/or allura red. The dyes will be supplied in solution at a concentration of 0.01 M. You will need to perform dilutions of the stock solutions with deionized water to obtain concentrations of:
0.001 M 0.0001M 0.00001 M 0.00008 M 0.00005 M 0.00003 M
For our purposes it is fine to use your 10 mL graduated cylinder to perform these dilutions (rinse with deionized water). You may find the disposable glass vials handy for storing your solutions, but remember to make it easy on yourself and label them clearly.
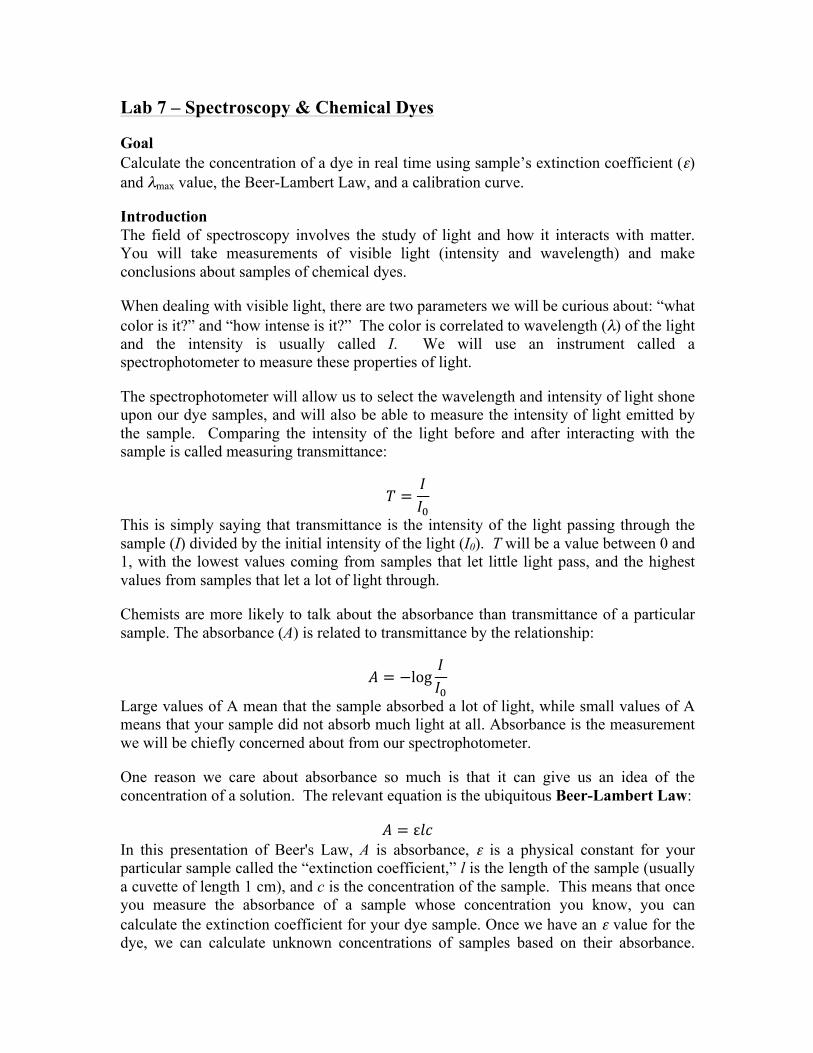
Lambda Max: You will need to find the wavelength of light that your particular dyes absorb most strongly, the λmax. To do this, using the Ocean Optics spectrophotometers, connect the instrument to the computer and power source. The light source takes 15 min to warm up.
Not for experimental use
Open the OceanView UV software. Wait a couple of seconds until the software connects with the instrument. In the Welcome Screen, select “Quick View”.
Light Pathway Direction
Power Plug Port
USB Port

Click on Create New Spectroscopic Application (upper left hand corner) .
Select Absorbance (concentration)
Select Absorbance only, then click Next
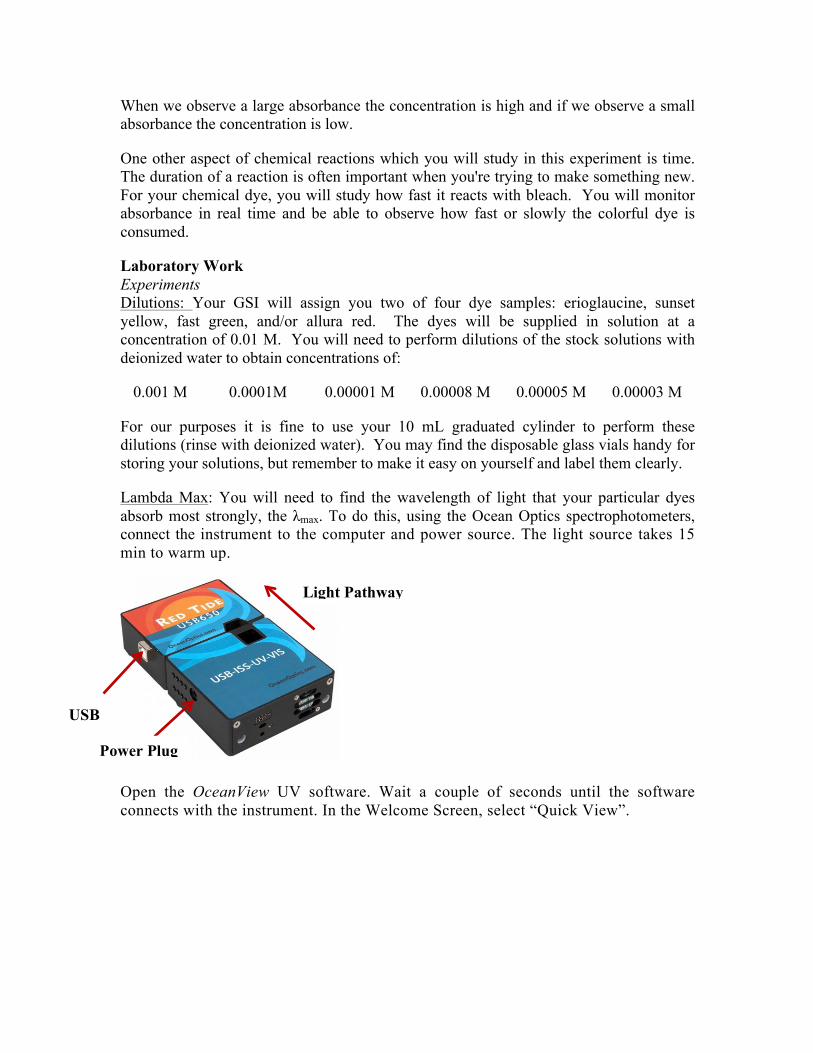
In the set up window, click “automatic” for integration time, check “strobe/lamp enable”. Under the light source panel, check “enabled” as well. It should look like the diagram on the following page. To move on, click “Next”.
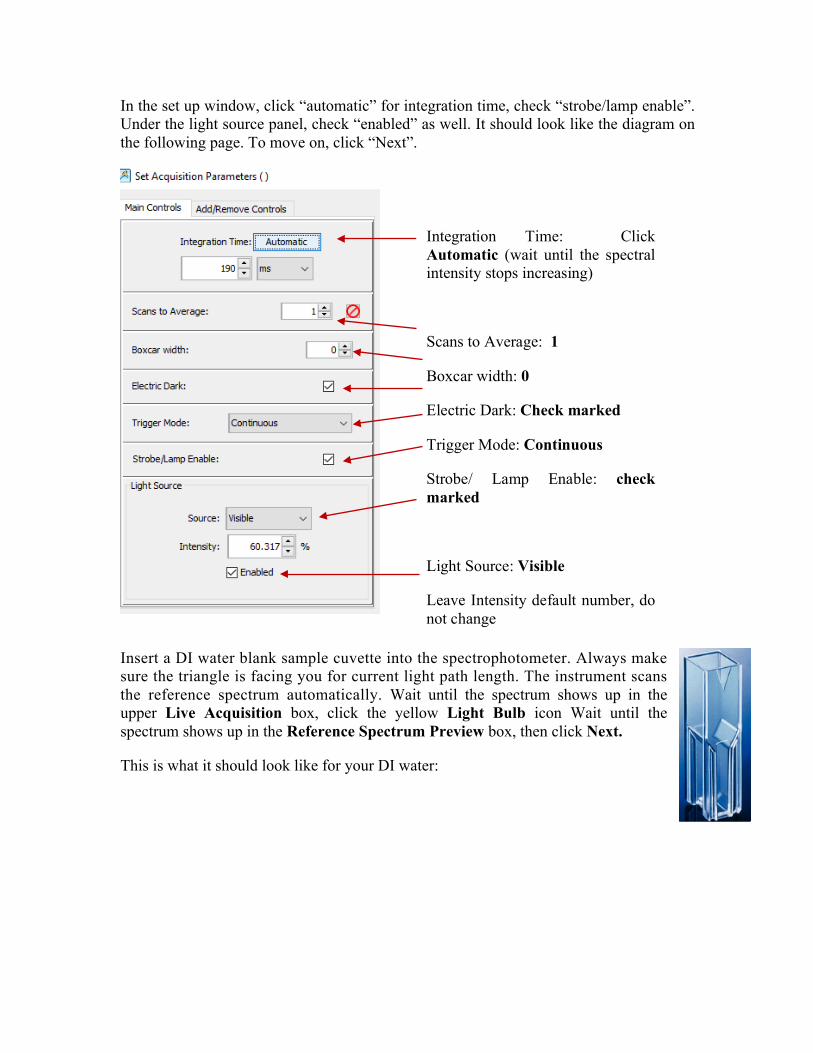
Insert a DI water blank sample cuvette into the spectrophotometer. Always make sure the triangle is facing you for current light path length. The instrument scans the reference spectrum automatically. Wait until the spectrum shows up in the upper Live Acquisition box, click the yellow Light Bulb icon Wait until the spectrum shows up in the Reference Spectrum Preview box, then click Next.
This is what it should look like for your DI water:
Integration Time: Click Automatic (wait until the spectral intensity stops increasing)
Scans to Average: 1
Boxcar width: 0
Electric Dark: Check marked
Trigger Mode: Continuous
Strobe/ Lamp Enable: check marked
Light Source: Visible
Leave Intensity default number, do not change
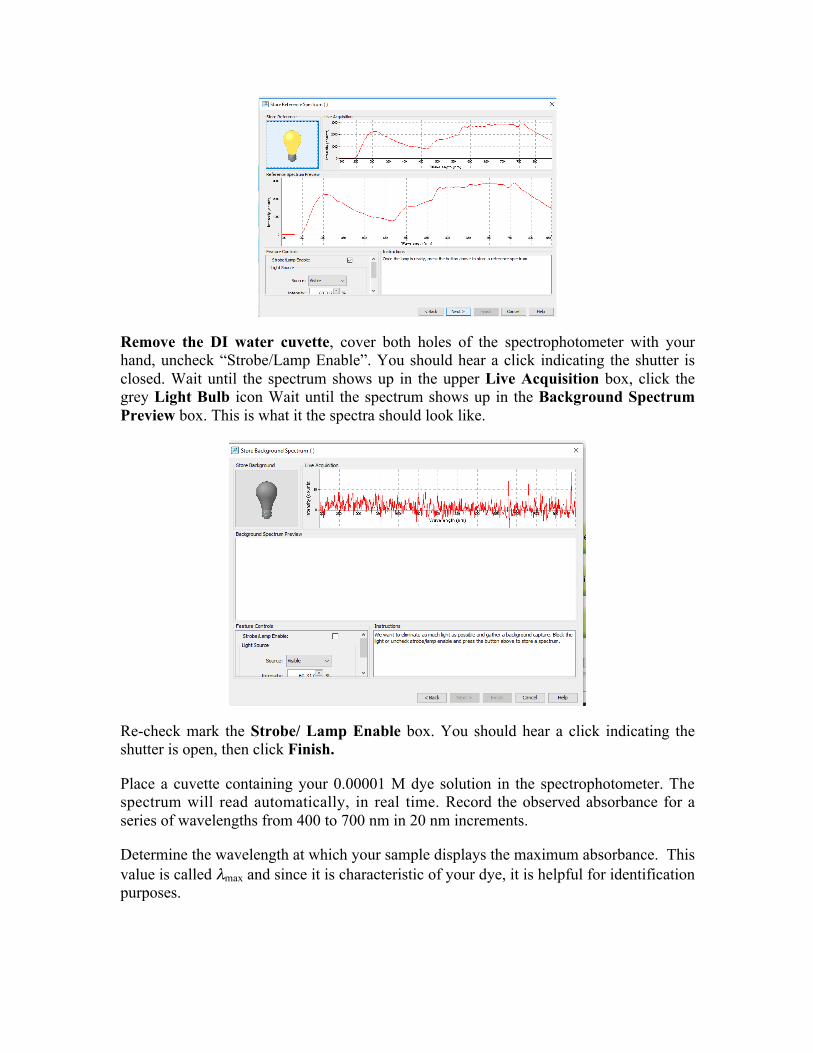
Remove the DI water cuvette, cover both holes of the spectrophotometer with your hand, uncheck “Strobe/Lamp Enable”. You should hear a click indicating the shutter is closed. Wait until the spectrum shows up in the upper Live Acquisition box, click the grey Light Bulb icon Wait until the spectrum shows up in the Background Spectrum Preview box. This is what it the spectra should look like.
Re-check mark the Strobe/ Lamp Enable box. You should hear a click indicating the shutter is open, then click Finish.
Place a cuvette containing your 0.00001 M dye solution in the spectrophotometer. The spectrum will read automatically, in real time. Record the observed absorbance for a series of wavelengths from 400 to 700 nm in 20 nm increments.
Determine the wavelength at which your sample displays the maximum absorbance. This value is called λmax and since it is characteristic of your dye, it is helpful for identification purposes.
Repeat the above process, and find a λmax value for your second dye sample. Change the wavelength parameter on your instrument to the respective λmax value for each dye for the remainder of your experiments with those materials.
Extinction Coefficient: For at least one of your particular dye samples, record absorbance values for your dye samples for the series of concentrations 0.0001M, 0.00008 M, 0.00005 M, 0.00003 M, and 0.00001 M at that dye’s λmax.
Calculate ε for each of these measurements, and find an average value for ε.
Calibration Curve: A plot of these absorbance vs. concentration data is called a calibration curve. It allows you to convert a measured absorbance into a calculated concentration using a linear best fit.
Bleaching Dyes: For at least one of your particular dye samples, prepare a cuvette containing 1 mL at the concentration listed below. Add the noted amount and concentration of bleach to the cuvette. Bleach is a 6% solution of sodium hypochlorite (NaOCl), so dilution may be necessary.
Dye Name Concentration of Dye Solution
Volume and Concentration of Bleach Solution
Erioglaucine (blue 1) 0.00001 M 1 drops of 6% NaOCl Sunset yellow (yellow 6) 0.0001 M 2 drops of 0.6% NaOCl
Fast green (green 3) 0.0001 M 1 mL of 6% NaOCl Allura red (red 40) 0.001 M 1 drop of 6% NaOCl
Place the cuvette in the spectrophotometer and start a timer. Record the absorbance value every 10 seconds for the first 5 minutes and every 30 seconds after that for the next 15 minutes (20 minutes total reaction time). Use your calibration curve to convert absorbance to dye concentration at each time point.
Data The important data for this experiment are:
- the absorbances observed at varying wavelengths for each dye - the absorbances observed at varying concentration for at least one dye - the absorbances observed at varying time as at least one dye is consumed by
bleach
Conclusions The following plots should be included in your post-lab write-up:
- your λmax plot - your calibration curve - your [dye] vs t plot
What is the half-life for the bleaching reaction for your dye?
What is ε and how did you determine it in your experiment? Why is the extinction coefficient the same for each concentration of the same dye? What does the λmax you calculated tell you about your dyes?
What do you propose is the relationship between concentration and λmax for a given dye?
What concentration of your dye (or dyes) remains at the end of each 20-minute bleach reaction?
Post-lab Assignment You will write a short communication style manuscript for your post-lab assignment for this experiment. This is a max of 3 formatted pages, and should summarize your objective, methods, data, and conclusions. Make sure to clearly answer each question in the conclusions section above.
For more words on how to write a communication style manuscript, see the Assignment Information at the beginning of this document.
(Lab 8) The equilibrium constant: calculating Kc for a reaction Introduction All chemical reactions are theoretically reversible. Furthermore, reactions do not necessarily go to completion. When a chemist asks the question “did this reaction proceed to completion?” perhaps a better way to phrase this question would be “exactly how far towards completion did this reaction proceed?” If the amount of remaining starting material is too minuscule to detect, we say that a reaction proceeded to completion. But if we are able to detect an amount of remaining starting material once a reaction has “finished” by reaching equilibrium, we can characterize a reaction in terms of just how far it has progressed.
We will study a reaction between iron(III) ion and thiocyanate ion as they form a metal-anion complex:
Fe3+
(aq) + SCN–(aq) ⇄ FeSCN2+
(aq)
This reaction will not proceed to completion, though we can monitor how much product has formed via spectroscopic measurement. In such cases we can calculate an amount of starting material remaining after a reaction has reached equilibrium, and we can write a mathematical expression to express just how much starting material and product exist in a steady state balance. We call that expression the equilibrium constant expression:
Generally, larger values of Kc indicate that the reaction has progressed significantly to the right, and smaller values of Kc indicate that the reaction has not progressed substantially and that mostly starting material remains. The value of Kc is constant at a given temperature. If we were to run this reaction multiple times with the starting materials Fe3+ and SCN–, the reactants will continue to combine to produce FeSCN2+ until the same value of Kc is reached every time. Your job is to calculate the value of Kc for this reaction at room temperature.
Laboratory Hypothesis: We will combine solutions containing known concentrations of iron(III) nitrate, Fe(NO3)3, and potassium thiocyanate, KSCN. If we can measure the amount of FeSCN2+ product present at equilibrium, then we can calculate the amounts of both Fe3+ and SCN– consumed, the amounts of Fe3+
and SCN– remaining, and ultimately the value for the equilibrium constant Kc. Experiments: Remember to allow ~30 minutes for your spectrophotometer to warm up on your bench while preparing solutions. Prepare a stock solution of 0.002 M Fe(NO3)3 in 1 M HNO3 and one of 0.002 M KSCN in water. Some things to keep in mind as you prepare these solutions: are these salts anhydrous, or provided as a hydrate? What are their molar masses? Try to use only as much reactant as you will need: keep in mind you will only need ca. 25.0 mL of the Fe(NO3)3 solution and only ca. 15.0 mL of the KSCN solution. How much total mass of each salt will you need to dispense? Is this a practical amount to measure with a balance?
2
3
[FeSCN ][Fe ][SCN ] cK
+
+ −=
Prepare five solutions by according to the following proportions: Solution #1: 5.0 mL 0.002 M Fe(NO3)3 in 1 M HNO3, 1.0 mL 0.002 M KSCN, 4.0 mL water Solution #2: 5.0 mL 0.002 M Fe(NO3)3 in 1 M HNO3, 2.0 mL 0.002 M KSCN, 3.0 mL water Solution #3: 5.0 mL 0.002 M Fe(NO3)3 in 1 M HNO3, 3.0 mL 0.002 M KSCN, 2.0 mL water Solution #4: 5.0 mL 0.002 M Fe(NO3)3 in 1 M HNO3, 4.0 mL 0.002 M KSCN, 1.0 mL water Solution #5: 5.0 mL 0.002 M Fe(NO3)3 in 1 M HNO3, 5.0 mL 0.002 M KSCN
You may prepare these solutions in a 10 mL graduated cylinder, but be sure to rinse your cylinder thoroughly between each use. Set your spectrophotometer to measure absorbance at 450 nm, remembering to use a blank water sample to ‘zero’ your instrument when changing the wavelength. For each of your solutions #1 through #5, measure the absorbance.
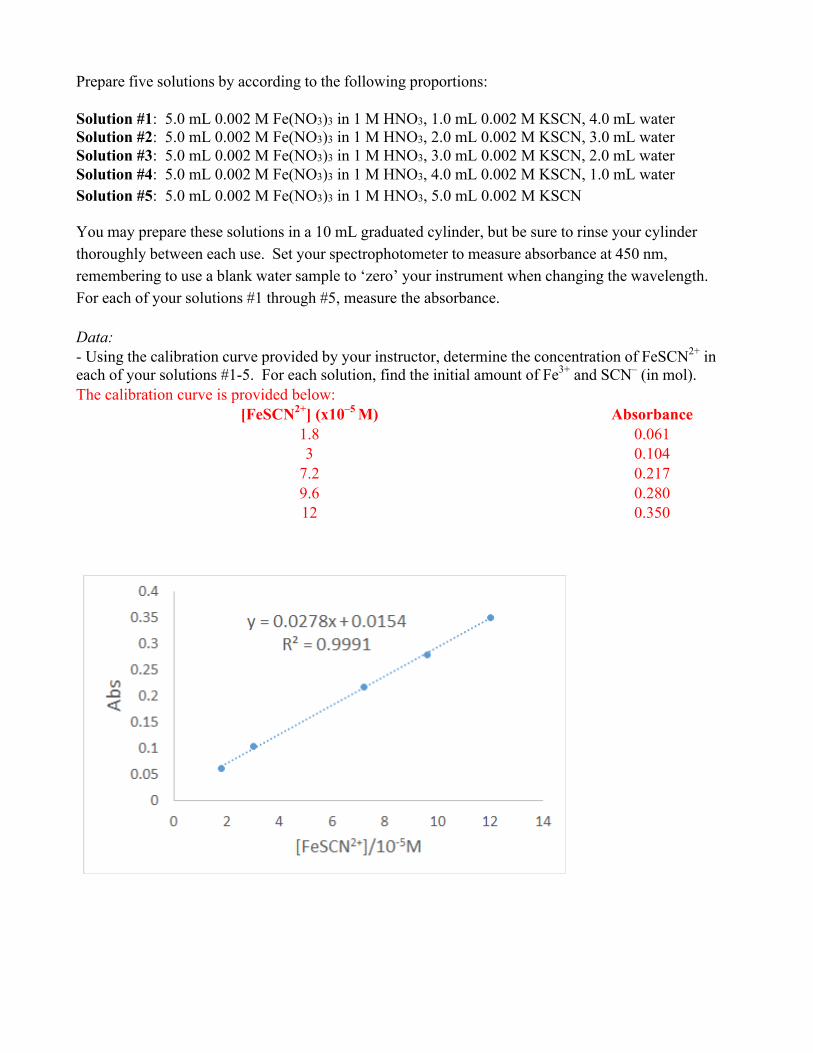
Data: - Using the calibration curve provided by your instructor, determine the concentration of FeSCN2+ in each of your solutions #1-5. For each solution, find the initial amount of Fe3+ and SCN– (in mol). The calibration curve is provided below:
[FeSCN2+] (x10–5 M) Absorbance 1.8 0.061 3 0.104
7.2 0.217 9.6 0.280 12 0.350
- From the values of [FeSCN2+] at equilibrium in each of the solutions #1-5, find the number of moles of FeSCN2+ in each of the solutions. Also calculate the number of moles Fe3+ and SCN– used up while the reaction proceeded to equilibrium. - Calculate the number of moles Fe3+ and SCN– that remain at equilibrium. Find the concentrations of all species at equilibrium, and calculate Kc for each of the solutions #1-5.
Conclusions: What are the five Kc calculations for your reaction trials? What is the average Kc value? What is the standard deviation? Report the range of values that are within plus-or-minus two standard deviations of your mean value.
(Lab 9) Determining a Relative Rate Law: a 'clock' reaction
IntroductionAn important parameter involved with the study of chemical processes is time. How long does a reaction take? Some reactions occur more or less instantaneously, in less than the blink of an eye (or atleast as fast as the reactants can physically mix). Other reactions might stir for days or weeks, or even millennia before they show appreciable progress. In cases where the product of a chemical reaction is valuable, knowing the time it takes to make that product is an important characteristic to understand.
The process we will study is the oxidation-reduction reaction between iodide and bromate ions under acidic conditions:
6 I–(aq) + BrO3
–(aq) + 6 H+
(aq) → 3 I2(aq) + Br–(aq) + 3 H2O(l) (reaction 1)
This reaction proceeds at a reasonable pace at room temperature, depending on the concentrations of iodide, bromate, and H+. The rate law describing this process is:
rate = k[I–]m[BrO3–]n[H+]p
(equation 2)
Note that k is the rate constant, which is specific to the reaction in question at a given temperature. We will be recording relative rates in this lab, and hence our k' values will be relative rate constants:
rel. rate = k'[I–]m[BrO3–]n[H+]p
(equation 3)
The primary goal of our experiments are to determine reasonable values for a relative rate constant k',
and the orders m, n, and p for the reaction.
The method we will employ for our investigation is commonly called a “clock reaction.” By this we mean a follow-up process to reaction 1 that is relatively fast, and thiosulfate ion will consume the I2 produced at an essentially instantaneous rate:
I2(aq) + 2 S2O32–
(aq) → 2 I–(aq) + S4O6
2–(aq) (reaction 4)
Reactions 1 and 4 will be allowed to occur in the same flask, in the presence of a starch indicator. Starch reacts with I2 to give a deep blue color. As reaction 1 steadily produces I2, if there is S2O3
2–
remaining, the I2 will be quickly converted to I– rather than reacting with the starch, and no blue color will be observed.
After all S2O32– has been consumed, any new I2 that is formed will linger and now react with the starch
and a blue color will be observed. In effect, the presence of a persistent blue hue is our indicator that all S2O3
2– (and by extension BrO3–) has been consumed and our reaction is complete. The time that it
takes for the reaction to finish is the key measurement to describing the reaction kinetics.
LaboratoryHypothesis: If we can carefully control the concentration of each reactant in our clock reactions, then we can calculate all of the parameters of a relative rate law governing the chemical process.
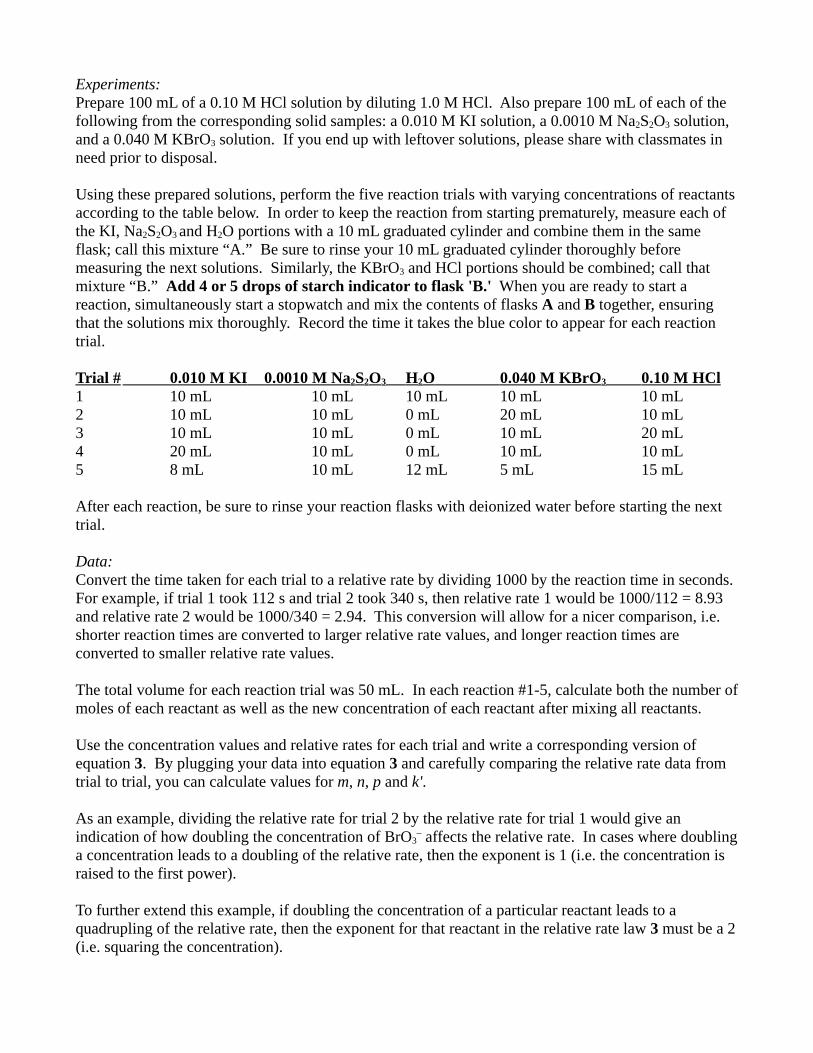
Experiments:
Prepare 100 mL of a 0.10 M HCl solution by diluting 1.0 M HCl. Also prepare 100 mL of each of the following from the corresponding solid samples: a 0.010 M KI solution, a 0.0010 M Na2S2O3 solution, and a 0.040 M KBrO3 solution. If you end up with leftover solutions, please share with classmates in need prior to disposal.
Using these prepared solutions, perform the five reaction trials with varying concentrations of reactantsaccording to the table below. In order to keep the reaction from starting prematurely, measure each of the KI, Na2S2O3 and H2O portions with a 10 mL graduated cylinder and combine them in the same flask; call this mixture “A.” Be sure to rinse your 10 mL graduated cylinder thoroughly before measuring the next solutions. Similarly, the KBrO3 and HCl portions should be combined; call that mixture “B.” Add 4 or 5 drops of starch indicator to flask 'B.' When you are ready to start a reaction, simultaneously start a stopwatch and mix the contents of flasks A and B together, ensuring that the solutions mix thoroughly. Record the time it takes the blue color to appear for each reaction trial.
Trial # 0.010 M KI 0.0010 M Na2S2O3 H2O 0.040 M KBrO3 0.10 M HCl1 10 mL 10 mL 10 mL 10 mL 10 mL2 10 mL 10 mL 0 mL 20 mL 10 mL3 10 mL 10 mL 0 mL 10 mL 20 mL4 20 mL 10 mL 0 mL 10 mL 10 mL5 8 mL 10 mL 12 mL 5 mL 15 mL
After each reaction, be sure to rinse your reaction flasks with deionized water before starting the next trial.
Data: Convert the time taken for each trial to a relative rate by dividing 1000 by the reaction time in seconds. For example, if trial 1 took 112 s and trial 2 took 340 s, then relative rate 1 would be 1000/112 = 8.93 and relative rate 2 would be 1000/340 = 2.94. This conversion will allow for a nicer comparison, i.e. shorter reaction times are converted to larger relative rate values, and longer reaction times are converted to smaller relative rate values.
The total volume for each reaction trial was 50 mL. In each reaction #1-5, calculate both the number ofmoles of each reactant as well as the new concentration of each reactant after mixing all reactants.
Use the concentration values and relative rates for each trial and write a corresponding version of equation 3. By plugging your data into equation 3 and carefully comparing the relative rate data from trial to trial, you can calculate values for m, n, p and k'.
As an example, dividing the relative rate for trial 2 by the relative rate for trial 1 would give an indication of how doubling the concentration of BrO3
– affects the relative rate. In cases where doublinga concentration leads to a doubling of the relative rate, then the exponent is 1 (i.e. the concentration is raised to the first power).
To further extend this example, if doubling the concentration of a particular reactant leads to a quadrupling of the relative rate, then the exponent for that reactant in the relative rate law 3 must be a 2(i.e. squaring the concentration).

Conclusions: -Compare the relative rate law for trial 1 to trial 2 to solve for n-Compare the relative rate law for trial 1 to trial 3 to solve for p-Compare the relative rate law for trial 1 to trial 4 to solve for m-Use the values you found for m, n, and p, and the data from trial 5 to solve for k'