Embed Size (px)
Citation preview
Lab 3
The Blood Vessels
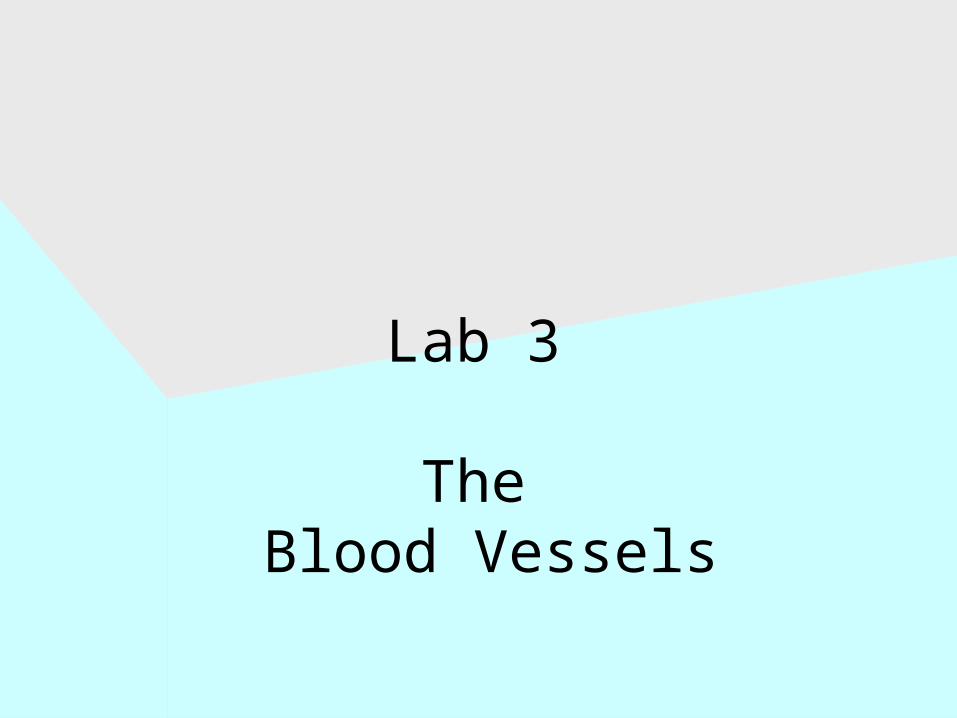
Lab 3: Objectives• Examine:
– Slide #44 of artery, vein, and capillaries; #45 of atherosclerosis
– Circulatory tree and torso models– Arm blood vessels model – Vessels on heart, torso, thorax, and pelvis models
• Palpate superficial pulse points/take apical pulse
• Biopac L07-ECG-Pulse: ECG and pulse (including effect of cold temperature and raising arm (gravity) on pulse amplitude)
• Biopac L017-HS-1 (Heart Sounds): ECG and heart (valve) sounds
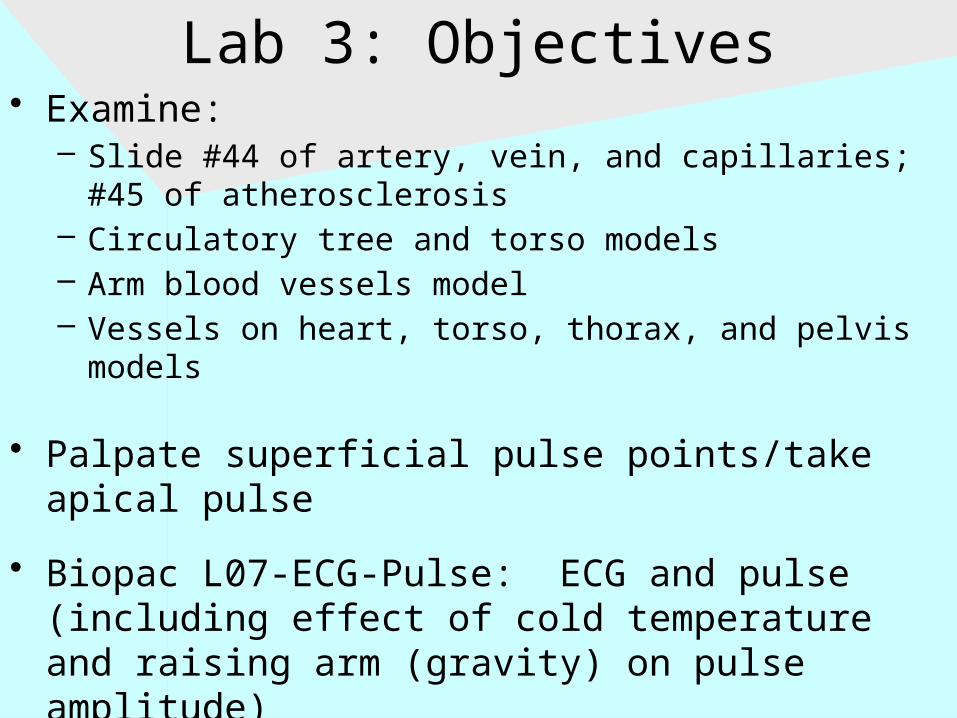
Vessel Structure• All vessels have the
same basic structure• 3 layers in the wall
– Tunica adventitia (externa) - elastic and laminar fibers
– Tunica media • thickest layer• smooth muscle fibers
and elastic fibers– Tunica interna (intima)
• endothelium – non-stick layer
• basement membrane• internal elastic lamina
• lumen = opening
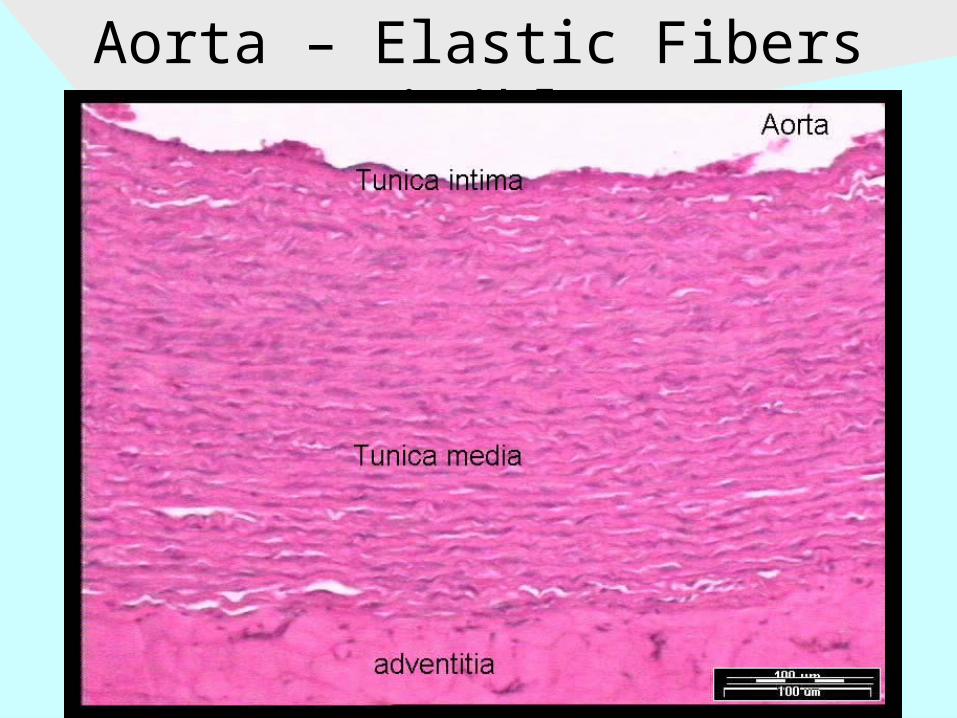
Aorta – Elastic Fibers Visible
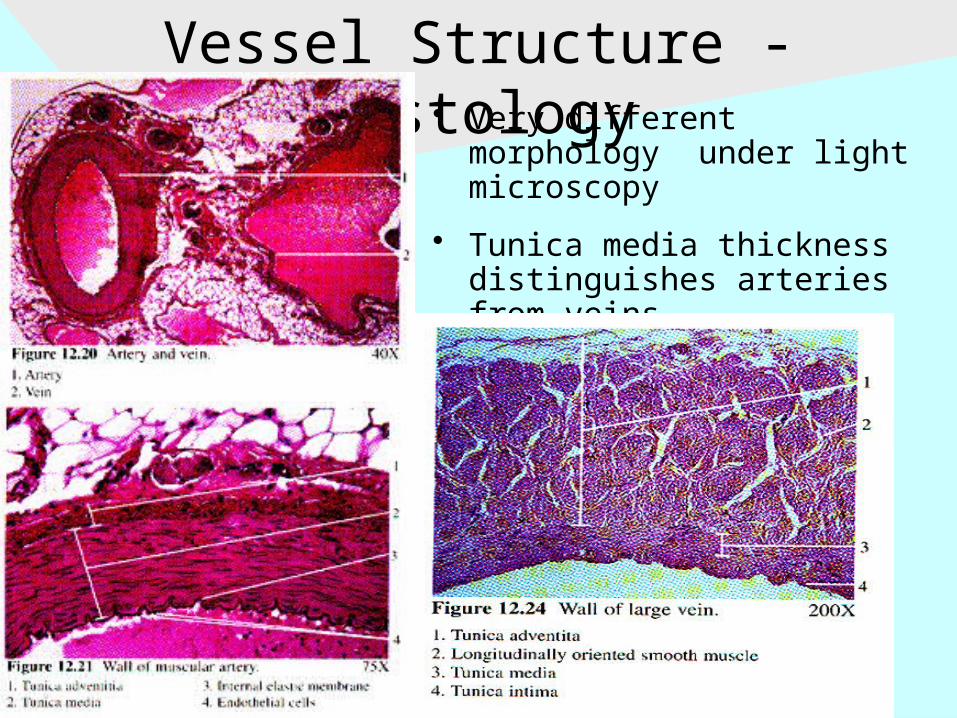
Vessel Structure - Histology• Very different morphology
under light microscopy
• Tunica media thickness distinguishes arteries from veins
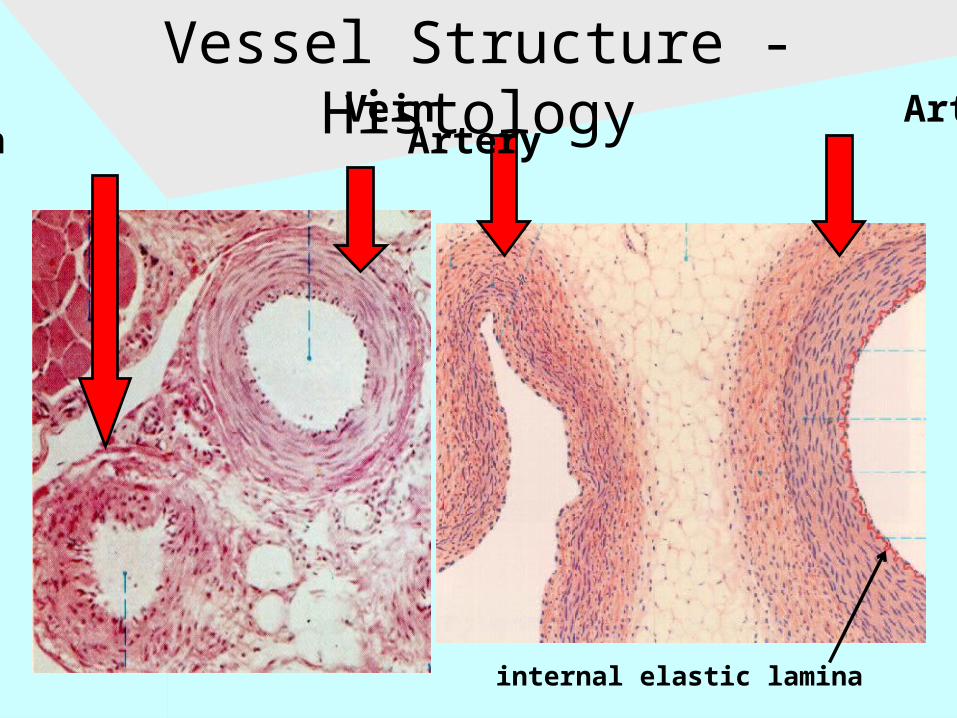
Vessel Structure - HistologyVein Artery
Vein Artery
internal elastic lamina
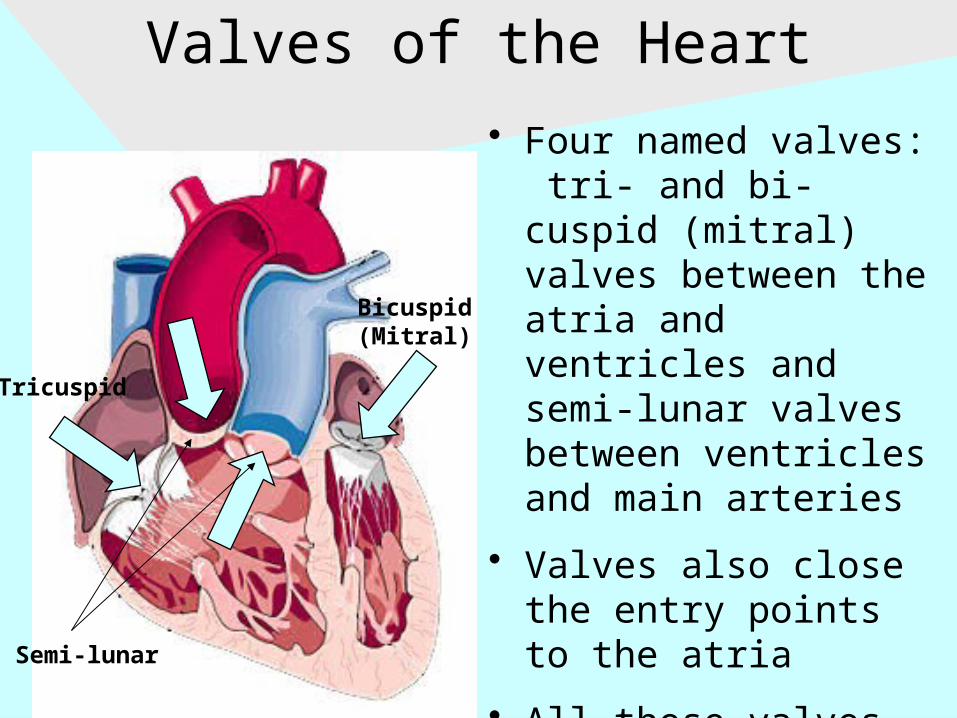
Valves of the Heart• Four named valves:
tri- and bi-cuspid (mitral) valves between the atria and ventricles and semi-lunar valves between ventricles and main arteries
• Valves also close the entry points to the atria
• All these valves prevent back flow of the blood
Tricuspid
Bicuspid(Mitral)
Semi-lunar
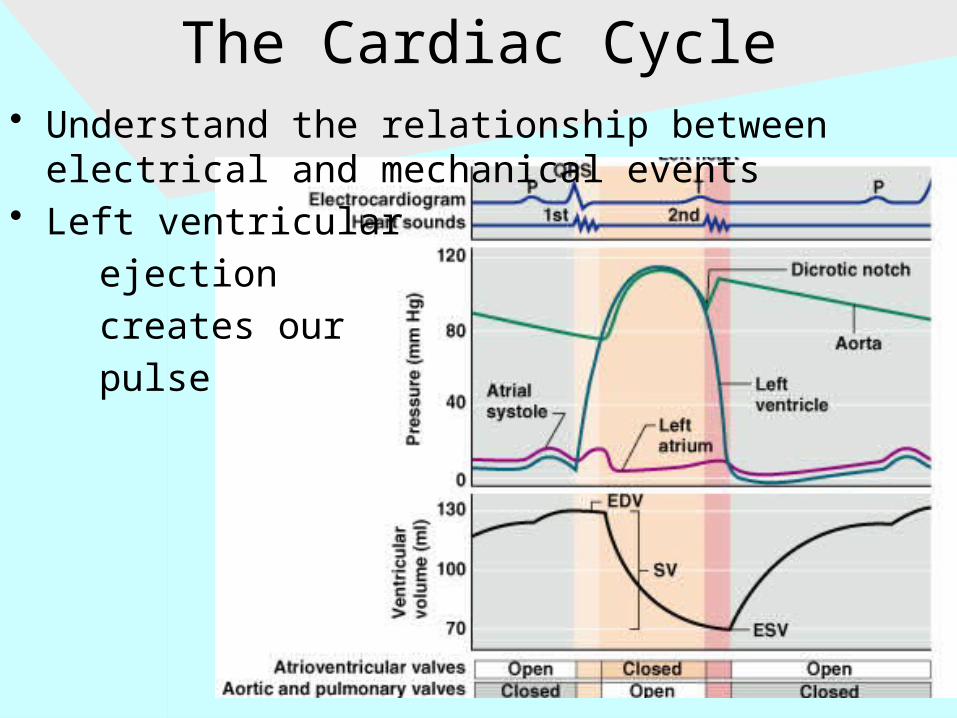
The Cardiac Cycle• Understand the relationship between electrical
and mechanical events• Left ventricular ejection creates our pulse
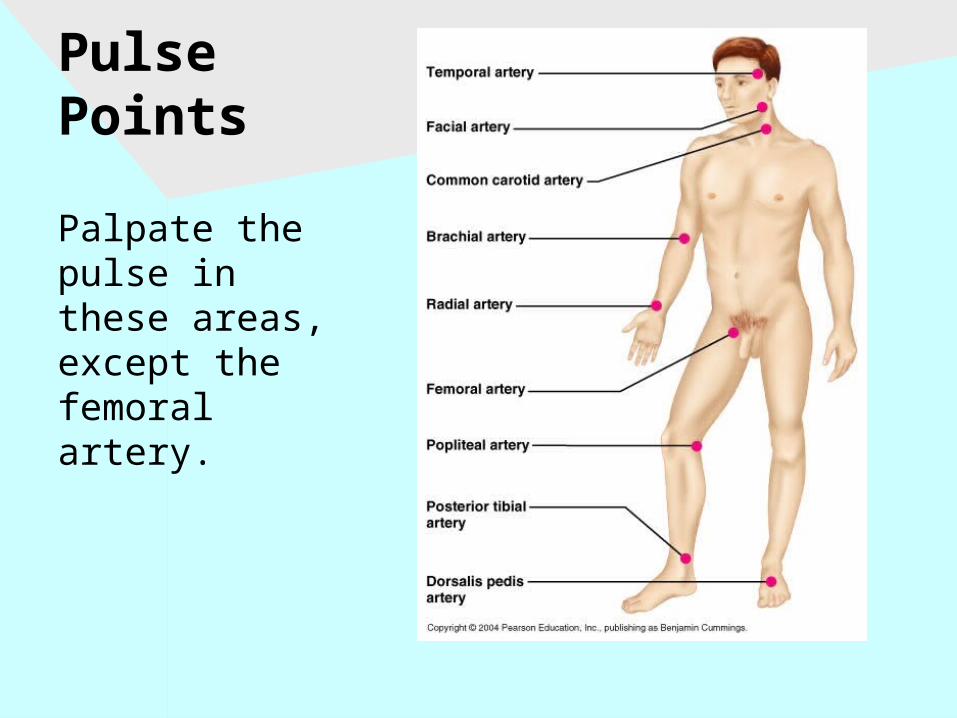
Pulse Points
Palpate the pulse in these areas, except the femoral artery.
pulse
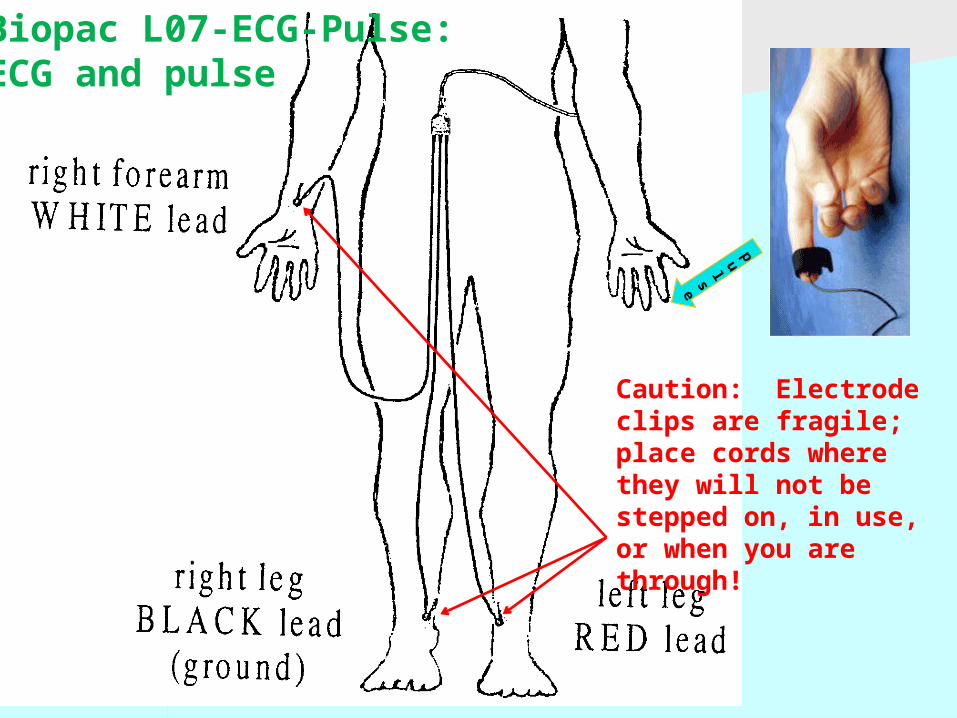
Biopac L07-ECG-Pulse:ECG and pulse
Caution: Electrode clips are fragile; place cords where they will not be stepped on, in use, or when you are through!
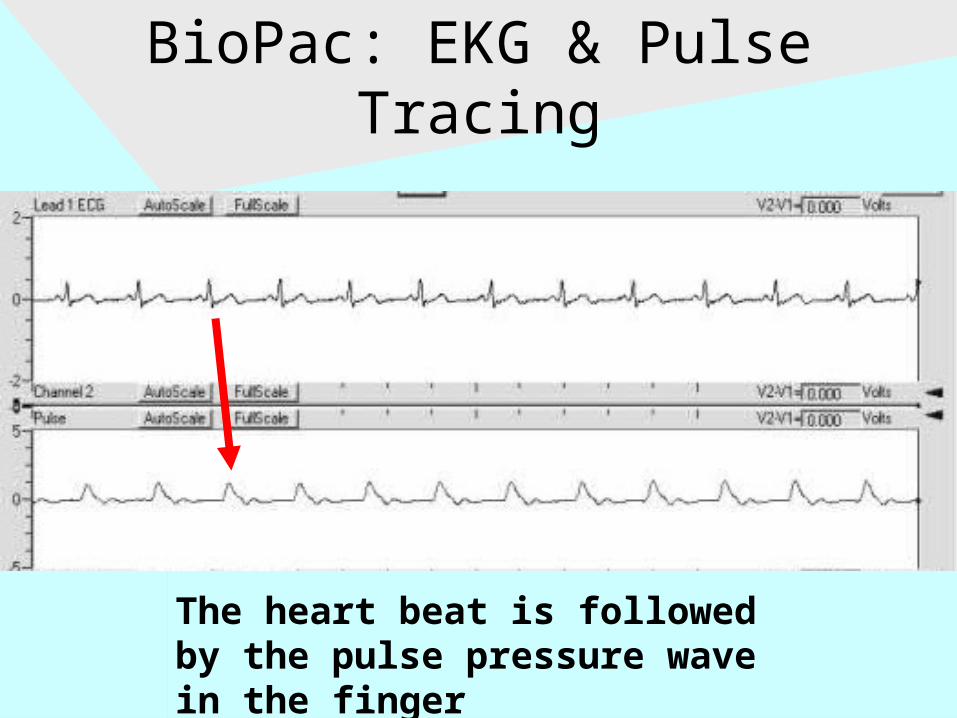
BioPac: EKG & Pulse Tracing
The heart beat is followed by the pulse pressure wave in the finger
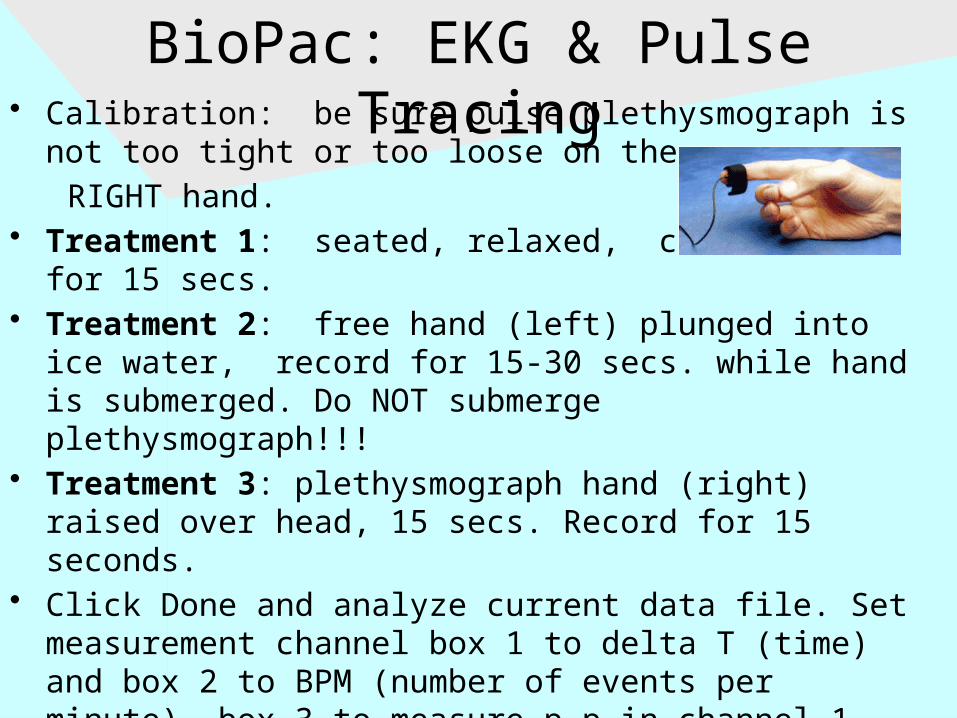
BioPac: EKG & Pulse Tracing• Calibration: be sure pulse plethysmograph is not too
tight or too loose on the RIGHT hand.• Treatment 1: seated, relaxed, click record for 15
secs.• Treatment 2: free hand (left) plunged into ice water,
record for 15-30 secs. while hand is submerged. Do NOT submerge plethysmograph!!!
• Treatment 3: plethysmograph hand (right) raised over head, 15 secs. Record for 15 seconds.
• Click Done and analyze current data file. Set measurement channel box 1 to delta T (time) and box 2 to BPM (number of events per minute), box 3 to measure p-p in channel 1 ( height of waves in ecg) and box 4 to measure p-p on channel 40 (height of highlighted pulse waves)
• Use I-beam to select regions for Table 1 on page 3-21
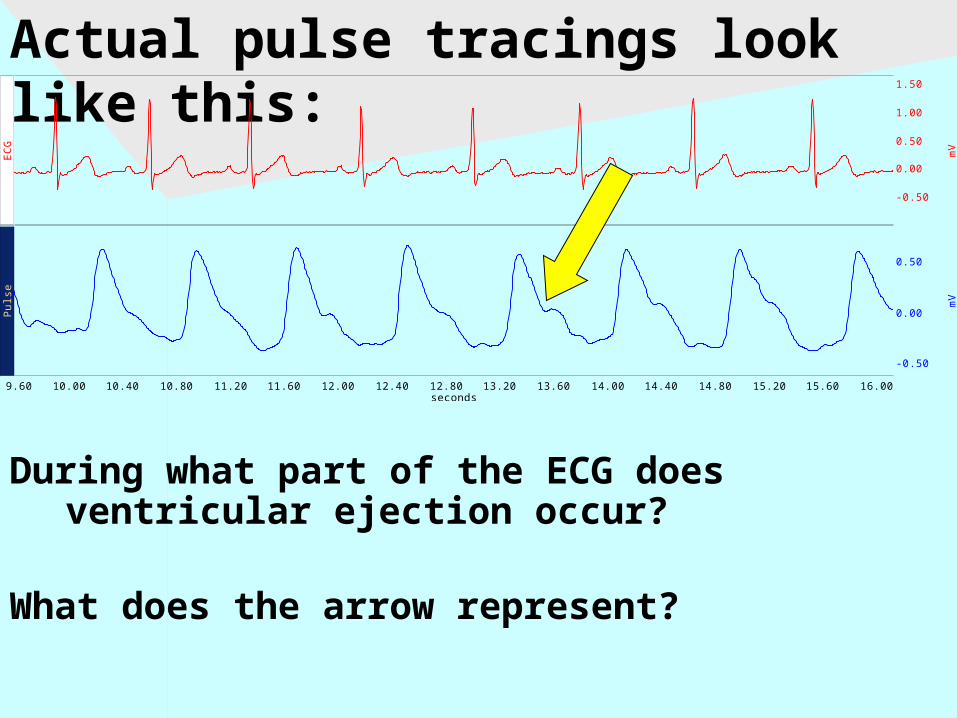
Actual pulse tracings look like this:
During what part of the ECG does ventricular ejection occur?
What does the arrow represent?
9.60 10.00 10.40 10.80 11.20 11.60 12.00 12.40 12.80 13.20 13.60 14.00 14.40 14.80 15.20 15.60 16.00seconds
-0.50
0.00
0.50
1.00
1.50
mV
ECG
-0.50
0.00
0.50
mV
Pulse
BioPac: EKG & Pulse Tracing
3.20 3.60 4.00 4.40 4.80 5.20 5.60 6.00 6.40 6.80 7.20 7.60 8.00 8.40 8.80 9.20 9.60 10.00 10.40 10.80seconds
-0.50
0.00
0.50
1.00
1.50
mV
0.00
0.25
mV
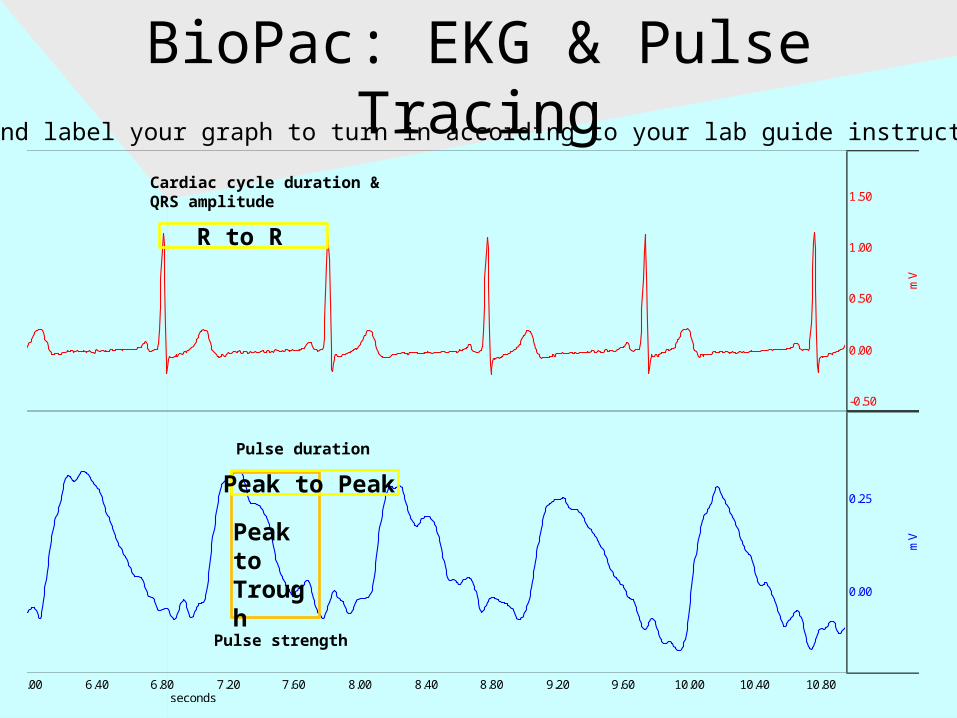
R to R
Peak to Peak
Peak to Trough
Print and label your graph to turn in according to your lab guide instructions.
Cardiac cycle duration &QRS amplitude
Pulse duration
Pulse strength

Biopac L017-HS-1 (Heart Sounds)You must change the Biopac cable
connections to the box for the heart sounds Biopac lab!1. The stethoscope should be plugged in to
channel 12. The ECG leads need to be plugged into
channel 2
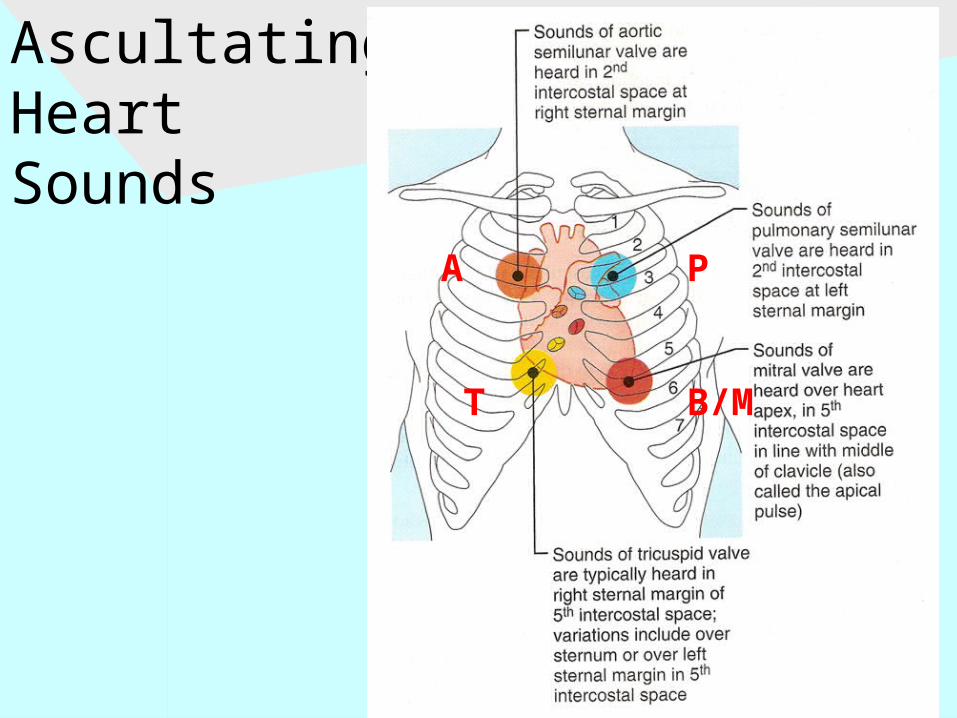
Ascultating Heart Sounds
A P
T B/M
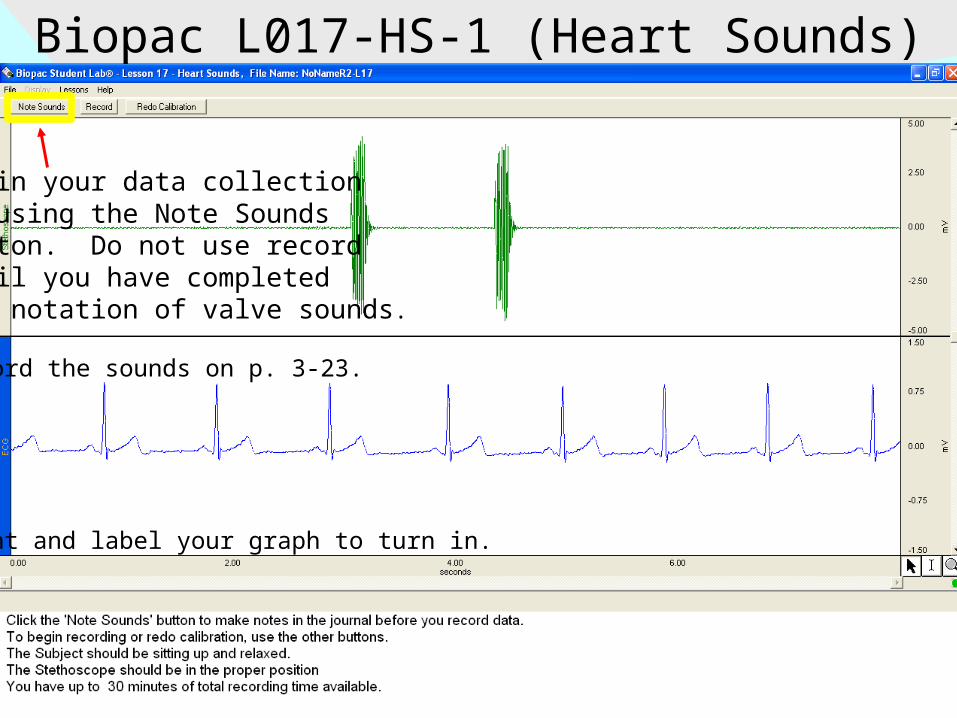
Biopac L017-HS-1 (Heart Sounds)
Begin your data collectionby using the Note Sounds button. Do not use record until you have completed the notation of valve sounds.
Record the sounds on p. 3-23.
Print and label your graph to turn in.
Biopac L017-HS-1 (Heart Sounds)
2.60 2.80 3.00 3.20 3.40 3.60 3.80 4.00 4.20 4.40 4.60seconds
0.00 mV
Stethoscope
0.00
0.50
mVECG
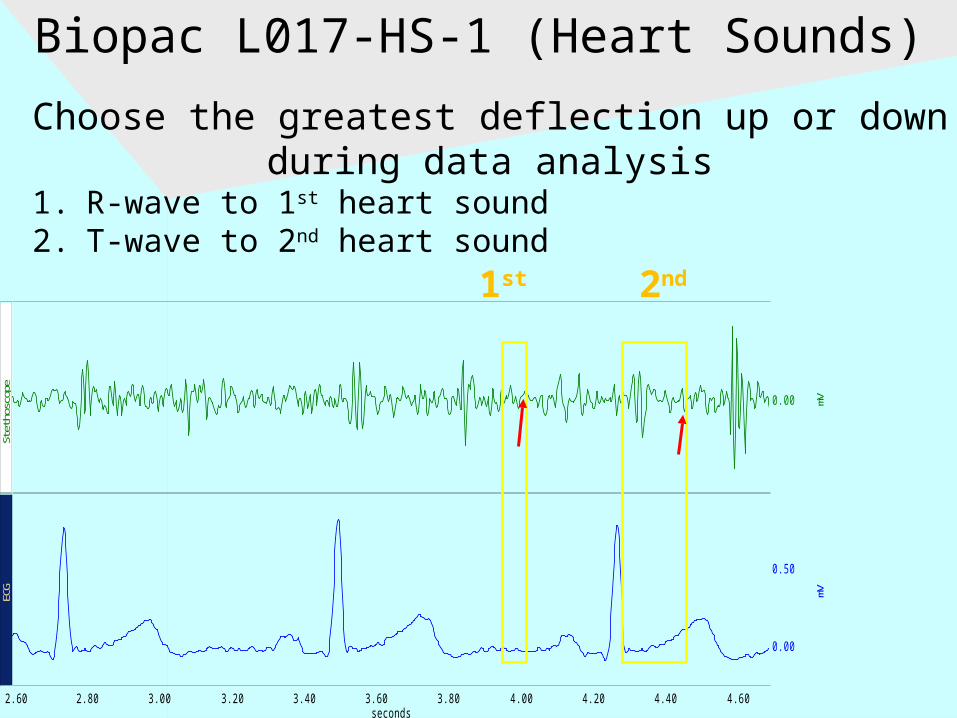
1st 2nd
Choose the greatest deflection up or downduring data analysis
1. R-wave to 1st heart sound2. T-wave to 2nd heart sound
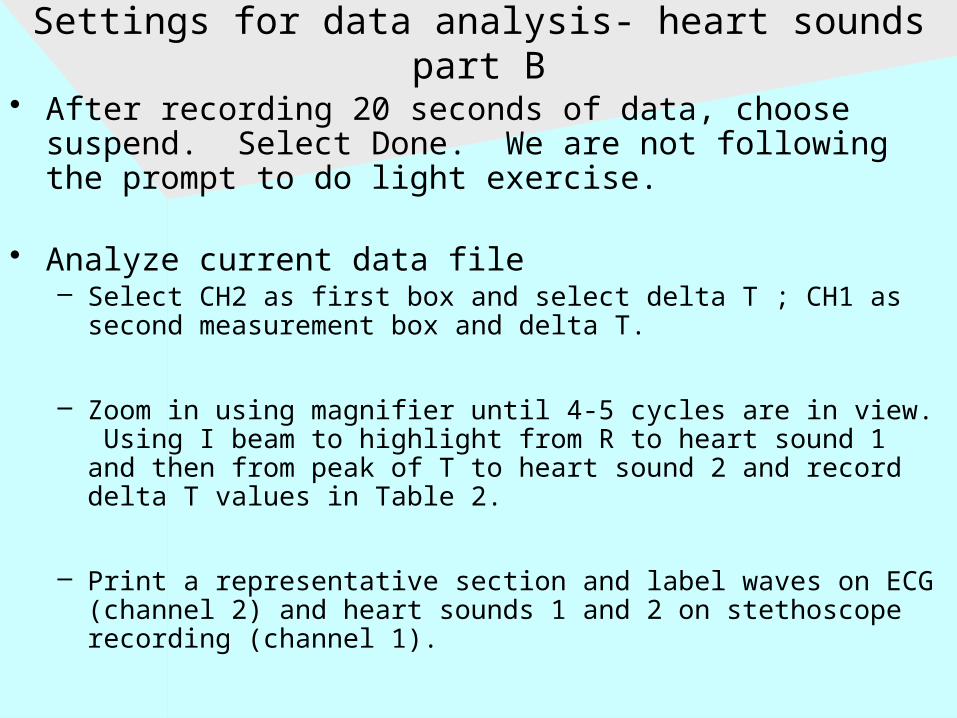
Settings for data analysis- heart sounds part B
• After recording 20 seconds of data, choose suspend. Select Done. We are not following the prompt to do light exercise.
• Analyze current data file– Select CH2 as first box and select delta T ; CH1 as second
measurement box and delta T.
– Zoom in using magnifier until 4-5 cycles are in view. Using I beam to highlight from R to heart sound 1 and then from peak of T to heart sound 2 and record delta T values in Table 2.
– Print a representative section and label waves on ECG (channel 2) and heart sounds 1 and 2 on stethoscope recording (channel 1).
What will be due next week:1. Pages 3-21 through 3-24
2. Two labeled printouts, one from each biopac lab
3. Mastering A and P activity 3 is due by Friday at 11:59 p.m.