Embed Size (px)
Citation preview

Blood Pressure SupplementLab Manual Exercises: Exercise 29 p. 475
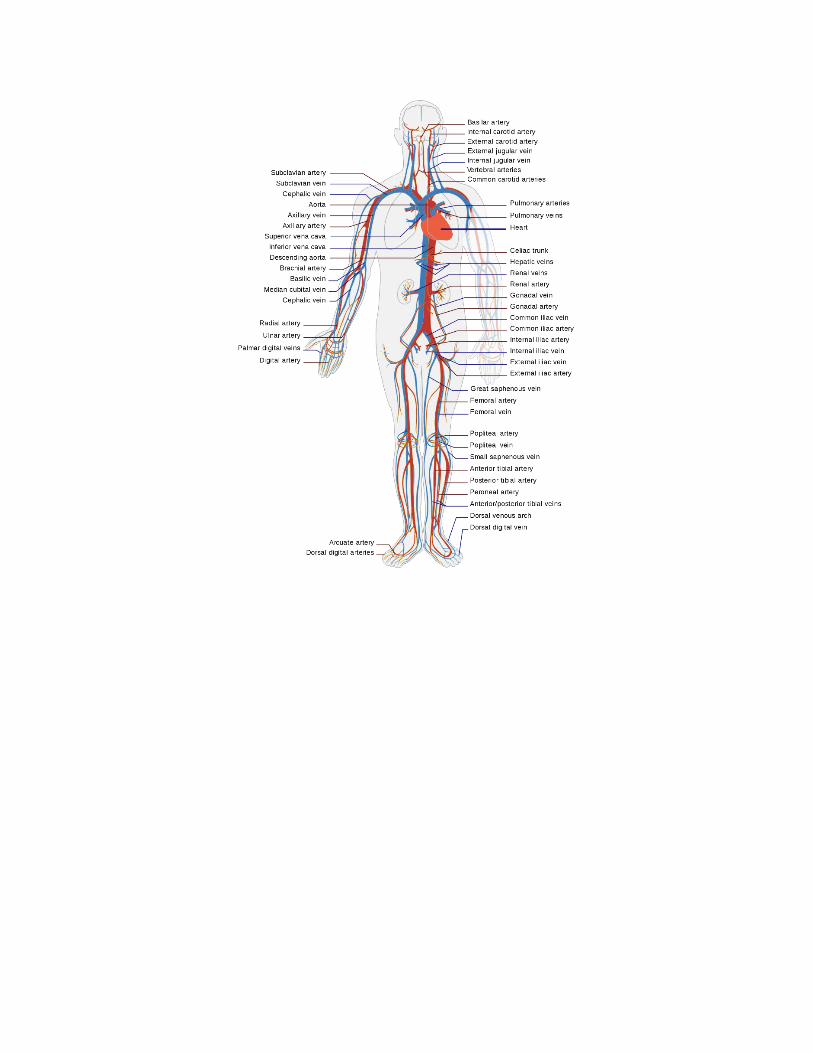
A. Identify blood vessels
Identify blood vessels on lab models (hearts, torso, blood vessel board)
This is listed in your “Anatomy to Know.xls” file.
Be sure to distinguish between arteries, veins and capillaries in lab manual images Look at microscope slides on blood vessels; note the difference between arteries and
veins
B. Auscultating Heart Sounds (Activity 1 p. 478)
You will auscultate (listen) to your partners hearts sounds using a stethoscope. Listen for S1 (AV valve closure) and S2 (semilunar valve closure) in each of the following locations (see Figure 2 on p 478). Remember to clean the ear pieces with an alcohol swab.
1) 2nd intercostal space right of sternal margin
2) 2nd intercostal space left of sternal margin
3) 5th intercostal space left of sternum
4) 5th intercostal space right of sternum
Areas of the thorax where heart sounds can best be detected
Questions:
1) What do the two heart sounds represent (i.e. what makes the lub-dup sound you hear in the stethoscope?)
2) Estimate your heart rate.
3) How long is the interval (pause) between the two sounds? What is going on during this pause?
4) Why do we bother listening to heart sounds in the 4 locations described above?

C. Palpating Superficial Pulse Points (Activity 2, p 479)
A person’s pulse is a measure of their heart rate. Pulse rates vary greatly from person to person. Heart rates rise when people take part in certain activities or take certain medications. The following are factors that influence heart rate: emotions, fitness level, body size, activity level, medication use, body position, and air temperature. It can be used to assess critical life-threatening conditions. For instance, an extremely slow pulse combined with dizziness can indicate shock and help identify internal bleeding. A pulse that is too quick, on the other hand, points to high blood pressure and cardiovascular problems.
Measuring Pulse
Pulse is measured by placing two fingers, with a little pressure, over superficial arteries. Count the beats you feel under your fingers for 15 seconds and multiply by 4 to get beats/minute. Do not use your thumb to take a measurement; it has its own pulse.
Palpate each of the following pulse points and estimate the pulse from each.
1) Common Carotid Artery _____________________b/min
2) Brachial Artery _____________________b/min
3) Radial Artery _____________________b/min
4) Posterior Tibial Artery _____________________b/min
Question:
1) Which pulse point had the greatest amplitude (which pulse was most easily detected)?
2) Try to palpate the common carotid and posterior tibial arteries simultaneously. Do you notice any difference in pulse between these two points?
3) Now listen to your apical pulse with a stethoscope and palpate your radial artery. Try to measure the lag time between these two events. Your apical pulse is measure by listening to the apex of your heart.

D. Using a manual sphygmomanometer to measure blood pressure (Activity 5, p. 482)
1) Follow the directions in your laboratory manual for obtaining blood pressure readings using a stethoscope and manual sphygmomanometer. Practice measuring BP and pulse with a partner.
Take 2 readings. Calculate or estimate Pulse Pressure (PP), Mean Arterial Pressure (MAP), and Cardiac Output (CO). Assume a stroke volume (SV) of 70 ml/contraction. Place the results of your calculations in Table 1.
PP = systole mmHg – diastole mm Hg
MAP = diastolic pressure + (pulse pressure/3); normal MAP is between 70-110 mm HG
CO = SV x HR (heart rate); Assume a stroke volume (SV) of 70 ml/contraction.
Table 1. Blood Pressure Readings
Trial 1 Trial 2SystolicDiastolicPPMAPCO
E. Observing the effects of various factors on blood pressure and heart rate
(Activity 7, p 484).
1) Question: What are the effects of body position on pulse and blood pressure? (lying, standing or sitting)
2) Hypothesis:
3) Obtain readings for each subject for the three scenarios described below. Enter data in Table 2.

Conditions for Activity E
Scenario 1: Sitting: Obtain baseline HR & BP data while the subject is seated.
Scenario 2: Lying Down: Have subject lie quietly for 2 minutes before recording blood pressure.
Estimate heart rate by palpating radial pulse for 15 s.
Scenario 3: Standing: Measure blood pressure and heart rate of subject
a) Immediately upon standing.
b) 3 min after standing
Table 2. Effect of Body position on HR and BP
Body position HR BPSittingLyingStanding (immediately)Standing (after 3 minute)
F: Effects of Age on Cardiovascular Fitness (Harvard Step Test): In this activity, we will evaluate the effects of age on cardiovascular recovery times (the time it takes the heart to recover resting HR and BP after exercise). In general, people who are more physically fit will have faster recovery times.
Q: How does cardiovascular fitness change with age?
H:
1. Obtain baseline HR & BP data while the subject is seated.
2. Have subject stand quietly for 2 minutes.
3. Have the subject step up and down on the step box for 5 minutes (30 steps/minute). The subject’s back should remain straight during the exercise. The exercise should be terminated once the subject fails to keep pace for 15 s or feels uncomfortable.
4. Have the subject sit down. Record recovery HR & BP at 1 minute intervals for 3 minutes following exercise.
5. Use this data to calculate subjects’ index of physical fitness (see pp. 501). Record in
Table 3.
6. Graph fitness level vs. age using a scatter graph. Add a trend line if a relationship is evident.
7. Discussion: Write a paragraph discussing your results. Was your hypothesis supported or refuted? What other factors might play a role in cardiovascular fitness?

Table 3. Effects of Age on Cardiovascular Fitness
Baseline Immediately 1 minute 2 minute 3 minute Total minutes each exercise
Fitness Level
ID Gender Age BP (sys)
HR BP (sys)
HR BP (sys)
HR BP (sys)
HR BP (sys)
HR