Embed Size (px)
Citation preview
Lab 12 Atomic spectra and atomic
structure

amplitude
Wavelength -
The Hydrogen SpectrumThe Hydrogen Spectrum
Experiment 6

IntroductionIntroduction
• Purpose: To observe the spectra of elements and relate the wavelengths to energy and energy levels of electrons.
• Spectroscope: Contains a prism, which separates emitted light into its constituent wavelengths. (red, green…etc.)
Anatomy of a Light WaveAnatomy of a Light Wave
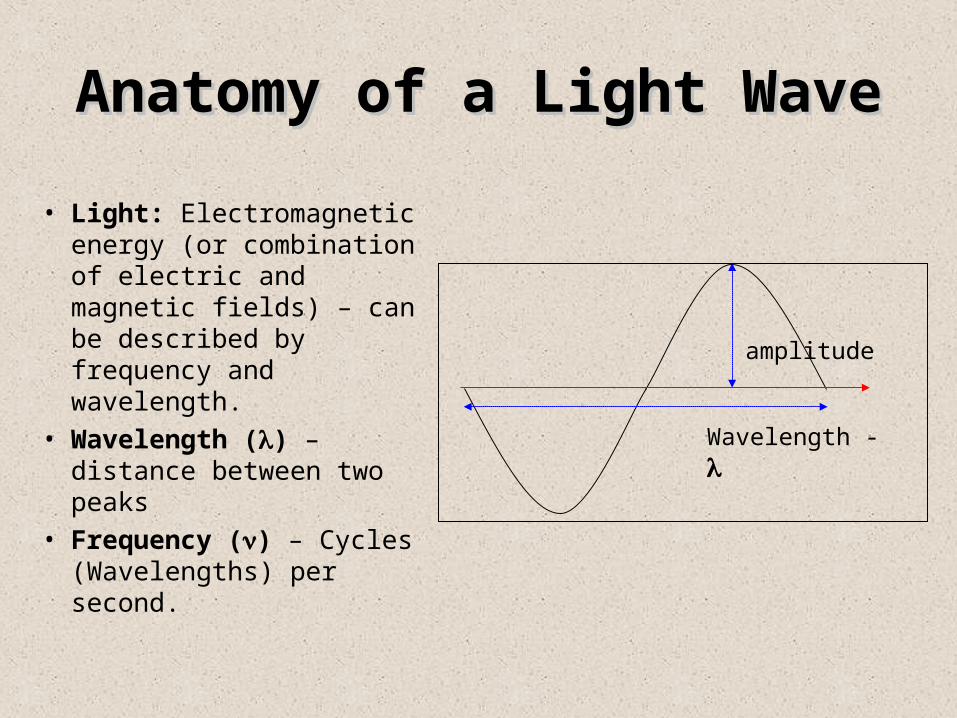
• Light: Electromagnetic energy (or combination of electric and magnetic fields) – can be described by frequency and wavelength.
• Wavelength () – distance between two peaks
• Frequency () – Cycles (Wavelengths) per second.
amplitude
Wavelength -
The Equation for LightThe Equation for Lightcc= =
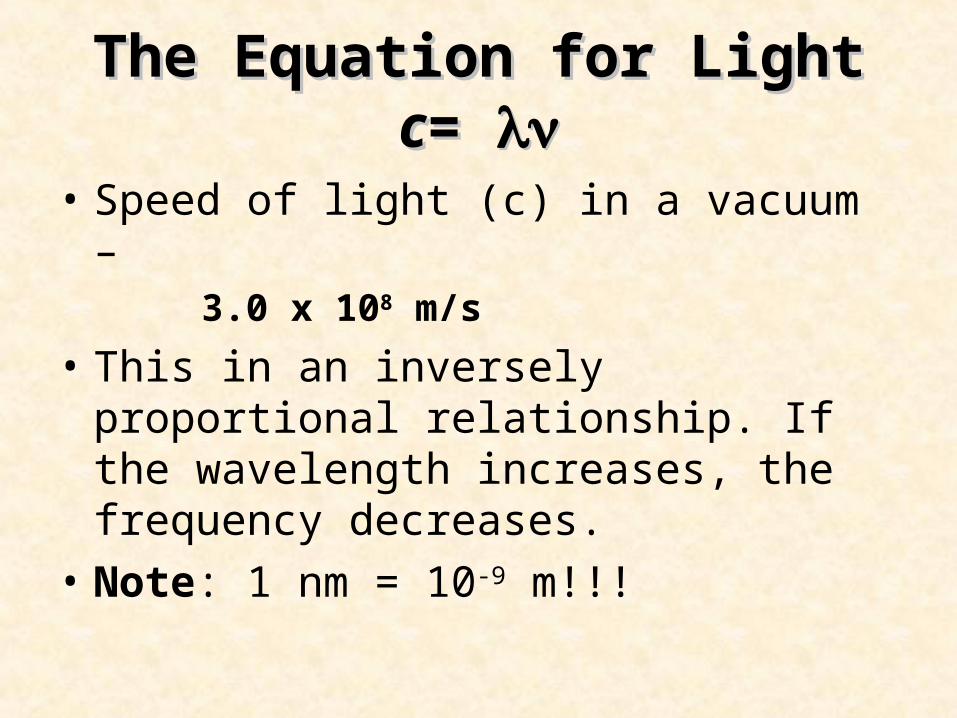
• Speed of light (c) in a vacuum – 3.0 x 10⁸ m/s
• This in an inversely proportional relationship. If the wavelength increases, the frequency decreases.
• Note: 1 nm = 10-9 m!!!

Bohr’s TheoryBohr’s Theory
• An element, when heated to its gaseous state, produces an emission line spectrum which we can observe by using a spectroscope. (Finger print)
• What is atomic structure and how is light emitted? Electrons in an atom exist in specific regions at various distances from the nucleus. (eg. Planets circling the sun.)

Bohr’s Theory (2)Bohr’s Theory (2)diagram of a Cl atom
• Electrons revolve around the nucleus in specific energy levels called orbits.
• Principle energy level (n): 1, 2, 3, ……n
• The greater the value of n the further away from the nucleus the electron is.
Nucleus
ClCl
x
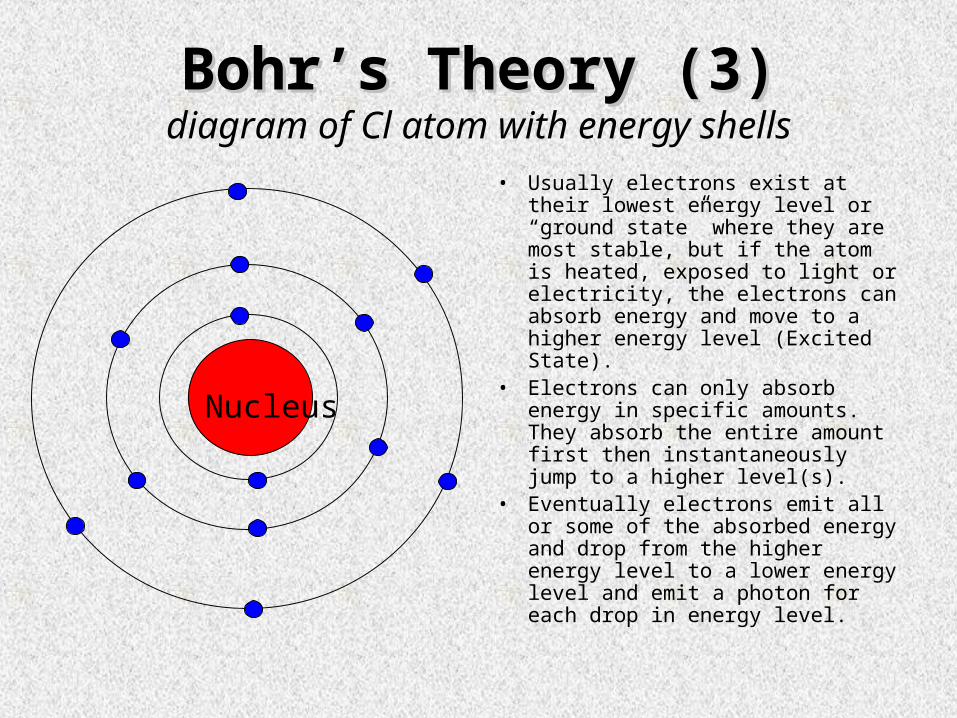
Bohr’s Theory (3)Bohr’s Theory (3)diagram of Cl atom with energy shells
• Usually electrons exist at their lowest energy level or “ground state” where they are most stable, but if the atom is heated, exposed to light or electricity, the electrons can absorb energy and move to a higher energy level (Excited State).
• Electrons can only absorb energy in specific amounts. They absorb the entire amount first then instantaneously jump to a higher level(s).
• Eventually electrons emit all or some of the absorbed energy and drop from the higher energy level to a lower energy level and emit a photon for each drop in energy level.
Nucleus

The ExperimentThe Experiment
• Light emitted from hydrogen atom. We will observe energy being emitted as electrons drop from higher energy levels to lower ones.
UV
visible
IR
2
3
1
4
5
6
n=

The Experiment (2)The Experiment (2)
• Since energy emitted depends on the size of the energy level drop, atoms may emit visible or non-visible light.
• Note: For hydrogen, each electron drop to n = 2 will result in the emission of visible light.
• nf will be 2 for our experiment.

The Experiment (3)The Experiment (3)
• The energy evolved (absorbed or emitted) from an electrons transition is called a photon (discrete packet of energy).
E = h– Where h = 6.63 x 10⁻³⁴ J•s (Planck’s constant), and
= frequency (sec-1or s-1)
• NOTE: E Negative value during emission E Positive value during absorption

The Experiment (4)The Experiment (4)a sample calculation
• A Hydrogen spectral line is observed at 486 nm. Find , E, and Ni:
= c/• You must first convert nanometers to
meters 486nm = 4.86 x 10⁻⁷ m• c = 3.0 x 10⁸ m/s
J10 x 4.09
)s10 x s)(6.17J10 x 6.63
10 x 6.17m10 x 4.86
m/s 10 x 3.0v
19
11434
1147
8
hvE
s
Calibration of Mercury
• Look through spectroscope to determine emission lines of mercury
• Compare the observed with the theoretical of these colored lines
• Prepare a calibration curve by plotting your experimental wavelengths to the theoretical ones given on page 126– Graph needs to be computer generated with a
trend line and a equation of the line
Part A. Emission spectrum of Hydrogen
• Look at hydrogen through a spectroscope and determine the colors that the emission spectrum produces
• Use Rydberg’s Equation found on page 5 and 6 on pg 127 to calculate wavelength in nanometers for the electron transitions listed on pg 129.
• Look at the chart in the classroom, and determine which colors correlate to which assignment

Rydberg’s Equation
• Relates energy emitted to an electron shift in a hydrogen atom.
E Energy emitted, Joules
• Rh 2.18 x 10⁻¹⁸ Joules
• Ni Initial energy level
• Nf Final energy level
nf will be 2 for our experiment!
22 n
1
n
1RE
fi
h

Rydberg’s Equation (2)Rydberg’s Equation (2)
• Example: (green) nf = 2; ni = 4
22 n
1
n
1RE
fi
h
emittedJ/photon 10 x 4.09
0.25)(0.0625 J 10 x 2.18
4
1
16
1 J 10 x 2.18ΔE
2
1
4
1 J 10 x 2.18ΔE
19
18
18
2218

Part BEmission Spectra of Group 1 A
and 2A elements
• When solutions of metals are heated in a Bunsen burner flame, they give off characteristic colours. For example, sodium makes the flame turn bright orange –

Part B
• Using a nichrome wire place a small sample of the known metal into the flame and record the gross color.
• Use HCL to clean the wire and repeat with the next metal
• Determine the unknowns based on your standards
Due next week
• Pgs 25-27
• Questions 1-10 pg 27
• Study for next weeks quiz