Embed Size (px)
Citation preview
Lab 1: A Thing on a Spring
(Fundamental Implications of Hooke’s Law) Physics 204
Martens Yaverbaum, WaltersJohn Jay College of Criminal Justice, the CUNY
*** PLEASE NOTE: For all experiments in both Physics 203 and Physics 204, each lab group will submit two separate reports; the detailed requirements and instructions for each are explained at the end of this Lab 1 Manual.
The first of the two reports is a Physics Post-Lab. Methodical completion of each Post-Lab exercise helps us maintain a clear idea of what we should expect to know (therefore deploy) and what we should not expect to know (therefore figure out) from one laboratory investigation to the next. It is a document designed to sharpen thought and communication among physics students—within, for example, a university classroom. Among other intended educational purposes, each Post-Lab should help us build a Formal Laboratory Report, briefly introduced below; the Post-Lab is therefore always the first of two reports to be written.
The second of the two reports is the Formal Report. This document is a complete scholarly accounting of everything you did for a particular laboratory investigation and why. All sections of this Formal Report are ultimately directed toward the answering of a Research Question (or, in some cases, up to three related Research Questions): The Formal Report explains to any and all uninitiated readers precisely how and why a set of data was collected, by what means these data were analyzed, and in what way this analysis—within a specified range of measurement uncertainty—led to a finding that, finally, answered the Research Question.
This Formal Report is composed and presented in the manner of a research physicist submitting her experimental findings to a (“peer-reviewed”) journal. The Formal Report, that is, is formal in the following fundamental sense: Imagine that an intelligent and interested reader is randomly selected from far outside the context of all John Jay syllabi, discussions and experiences; this reader, although familiar with general scientific research, might not even know any physics. Such a reader, with no specific background nor supplementary explanations, should be able to use a properly written Report in order to reproduce our methods and pursue his own answer to the self-evidently meaningful Research Question found within. A strong Formal Report is, in principle, ready for publication.
As you read any of the Lab Manuals for Physics 203 or Physics 204, notice directions that are preceded by three asterisks (***). These refer to steps of measurement or thought that you will be expected to emphasize, and therefore carefully consider, in your Formal Report. Three asterisks essentially mean “Make certain to recall this step even after you have left all your measuring equipment behind”.

2
A) The Research Questions for today’s lab.
All your lab thoughts, designs, actions, measurements, mathematics and writingsmust begin and end with focused attention toward the Research Question(s). Always. Whenever you are not sure what to do or write next, ask yourself, “How can I somehow connect/relate what I just did to the Research Question?” Suggestions for Today’s Research Questions are presented below.
1) In Newtons per meter, what is an experimentalvalue for K, the ‘stiffness’ constant, for someparticular spring?
(This comparatively small and specific question is necessary in order to studythe larger and more generalized question below. The question below is reallywhat drives this week’s work. Like a customary physics research question, itseeks a mathematical function for the answer. This week’s central questionseeks a relationship between one independent variable and one dependentvariable. In addition to variables, however, functions frequently contain at leastone constant. One of the constants in the function pursued in this investigationwill b e generated by the answer to (1), above. The answer to this question (1)should be a number. Like most numbers that represent experimental values,this number will express something meaningful about the world only after it isassociated with units and uncertainty.)
2) If a spring of known stiffness is hung verticallyfrom a ring stand and differing masses are hungfrom it so as to produce differing oscillations,how does the time period for oscillation vary asa function of mass?
3
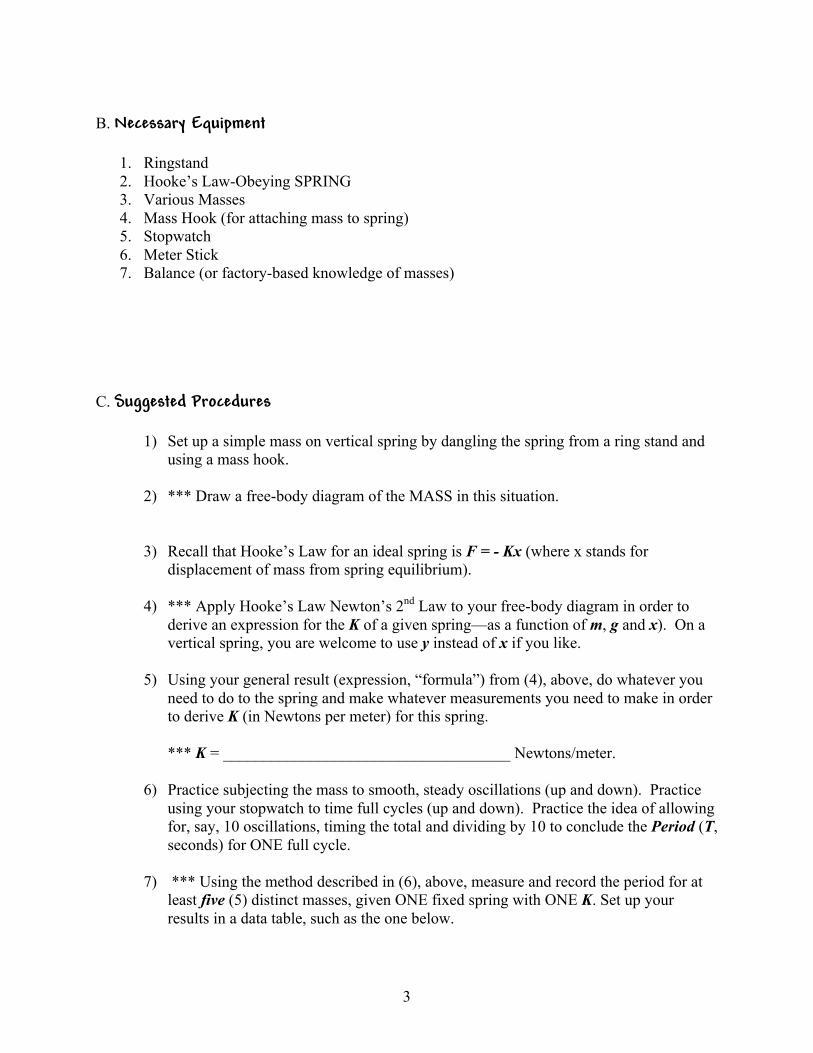
B. Necessary Equipment
1. Ringstand2. Hooke’s Law-Obeying SPRING3. Various Masses4. Mass Hook (for attaching mass to spring)5. Stopwatch6. Meter Stick7. Balance (or factory-based knowledge of masses)
C. Suggested Procedures
1) Set up a simple mass on vertical spring by dangling the spring from a ring stand andusing a mass hook.
2) *** Draw a free-body diagram of the MASS in this situation.
3) Recall that Hooke’s Law for an ideal spring is F = - Kx (where x stands fordisplacement of mass from spring equilibrium).
4) *** Apply Hooke’s Law Newton’s 2nd Law to your free-body diagram in order toderive an expression for the K of a given spring—as a function of m, g and x). On avertical spring, you are welcome to use y instead of x if you like.
5) Using your general result (expression, “formula”) from (4), above, do whatever youneed to do to the spring and make whatever measurements you need to make in orderto derive K (in Newtons per meter) for this spring.
*** K = ____________________________________ Newtons/meter.
6) Practice subjecting the mass to smooth, steady oscillations (up and down). Practiceusing your stopwatch to time full cycles (up and down). Practice the idea of allowingfor, say, 10 oscillations, timing the total and dividing by 10 to conclude the Period (T,seconds) for ONE full cycle.
7) *** Using the method described in (6), above, measure and record the period for atleast five (5) distinct masses, given ONE fixed spring with ONE K. Set up yourresults in a data table, such as the one below.

4
FOR EACH DISTINCT MASS VALUE, YOU SHOULD DO AT LEAST THREE SEPARATE TRIALS AND AVERAGE THE RESULTS!
K = _________________ Newtons/meter
Mass (kg) Period (seconds)
8) *** With Period on the Y-axis , create one neat, careful and large Scatter Plot for thistable. A Scatter Plot is simply a graph of points—no trend lines nor connections ofany kind. You are encouraged to use software of your choice for these plots. Fullyand clearly label (with units) both axes and the graph. When creating a graph, alwaysask yourself: Is (0,0) a point?
9) Now draw the simplest, smoothest possible “best-fit” or “trend” “line” through thepoints. This “line” might well be curved. But the idea is that it should be thesimplest possible shape that best captures the pattern of all the dots. It willnecessarily NOT touch all the points – except (0,0) if you are analytically confidentof that one. All the other points are experimental and therefore imperfect. The lineshould represent an average pattern: It should fall below many of the points byapproximately the same amount that it falls above the rest of the points.
10) *** Applying any kind of logic, unit/dimensional analysis, mathematical techniqueand/or software to this graph, DERIVE:
11) Period (T) as a function of Mass (m) for a given spring (of known, constant K).
12) HINT a: The function is NOT linear, but it is a well-known and comparativelysimple function.
13) *** HINT b: Given that the function is not linear, look at your scatter plot and try tothink of a comparatively simple, well-known function (shape) that describes it. Writedown this function.
14) *** Create a new plot from this function. This graph will be the linearized version ofthe first graph.
FOR EXAMPLE: If you recognize the shape of your first graph and think that T =some function of m3, then cube all your m values and use these cubed m’s as the newx-axis coordinates. Do not change the T values. That is, plot the cube of m, rather
5
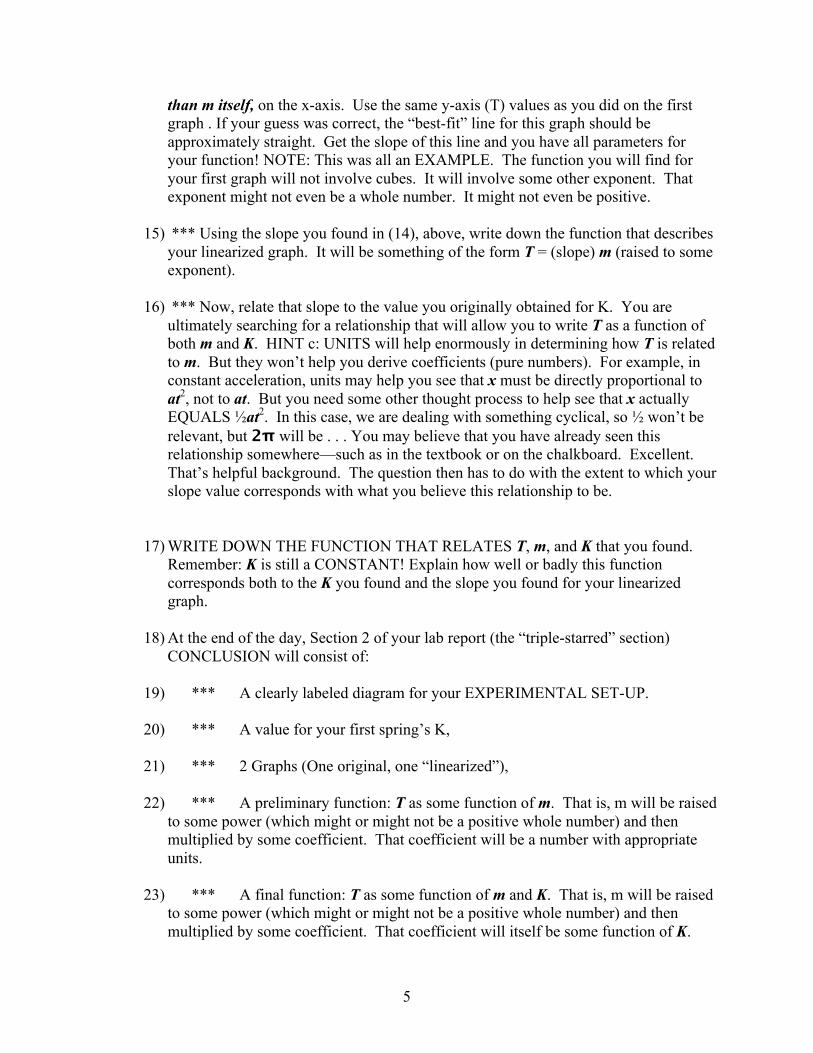
than m itself, on the x-axis. Use the same y-axis (T) values as you did on the first graph . If your guess was correct, the “best-fit” line for this graph should be approximately straight. Get the slope of this line and you have all parameters for your function! NOTE: This was all an EXAMPLE. The function you will find for your first graph will not involve cubes. It will involve some other exponent. That exponent might not even be a whole number. It might not even be positive.
15) *** Using the slope you found in (14), above, write down the function that describesyour linearized graph. It will be something of the form T = (slope) m (raised to someexponent).
16) *** Now, relate that slope to the value you originally obtained for K. You areultimately searching for a relationship that will allow you to write T as a function ofboth m and K. HINT c: UNITS will help enormously in determining how T is relatedto m. But they won’t help you derive coefficients (pure numbers). For example, inconstant acceleration, units may help you see that x must be directly proportional toat2, not to at. But you need some other thought process to help see that x actuallyEQUALS ½at2. In this case, we are dealing with something cyclical, so ½ won’t berelevant, but 2π will be . . . You may believe that you have already seen thisrelationship somewhere—such as in the textbook or on the chalkboard. Excellent.That’s helpful background. The question then has to do with the extent to which yourslope value corresponds with what you believe this relationship to be.
17) WRITE DOWN THE FUNCTION THAT RELATES T, m, and K that you found.Remember: K is still a CONSTANT! Explain how well or badly this functioncorresponds both to the K you found and the slope you found for your linearizedgraph.
18) At the end of the day, Section 2 of your lab report (the “triple-starred” section)CONCLUSION will consist of:
19) *** A clearly labeled diagram for your EXPERIMENTAL SET-UP.
20) *** A value for your first spring’s K,
21) *** 2 Graphs (One original, one “linearized”),
22) *** A preliminary function: T as some function of m. That is, m will be raisedto some power (which might or might not be a positive whole number) and thenmultiplied by some coefficient. That coefficient will be a number with appropriateunits.
23) *** A final function: T as some function of m and K. That is, m will be raisedto some power (which might or might not be a positive whole number) and thenmultiplied by some coefficient. That coefficient will itself be some function of K.
Post-Labs & Formal Reports:
A GENERAL EXPLANATION which contains within THE SPECIFIC QUESTIONS FOR Physics 204, LAB 1
Physics 204: LAB Martens Yaverbaum, Walters
John Jay College of Criminal Justice, the CUNY
Part 1: The Post-Lab
All responses to all four parts of every Post-Lab must be submitted on clean, separate sheets of paper. The Post-Lab must be headed with the names of all Lab Group members and each response must somehow make clear precisely what question it is intended to address. No other document or reading should be necessary in order for a reader to follow the meaning and sense of a properly completed Post-Lab.
Post-Labs in Physics 203 have a very specific four-part format. Each part is graded out of 2.5, for a total possible score of 10.0.
The Post-Lab is designed to help you write your Formal Report. Therefore, you should always complete the post-lab first, AS A GROUP, then work on the Formal Report. If you don’t have time to work as a group on the post lab, then we STRONGLY RECOMMEND that each group member attempt all questions SEPARATELY on his/her own; that way, the group can compare answers remotely. If the group is not in agreement on the Post-Lab, it will be unable to write a good Formal Report, and any group member who has not worked on the Post-Lab is not prepared to work on the Formal Report.
For this first Physics Post-Lab, we will now walk through each of the four different parts and explain how it works. At the end of each explanation, the specific Post-Lab question for THIS LAB (Lab #1) is presented in a different typeface and introduced by the phrase WHAT TO DO FOR THIS PARTICULAR (Lab #1) POST-LAB.
ON SEPARATE SHEETS OF PAPER, PLEASE ANSWER THE FOUR QUESTIONS FOUND IN THE FOLLOWING PAGES. THIS IS YOUR POST-LAB for LAB 1.
In future labs, you will simply be given the four particular questions and expected to know how to approach them. They will be of the same four types for every lab.
2
I. Epistemological Table
BACKGROUND EXPLANATION
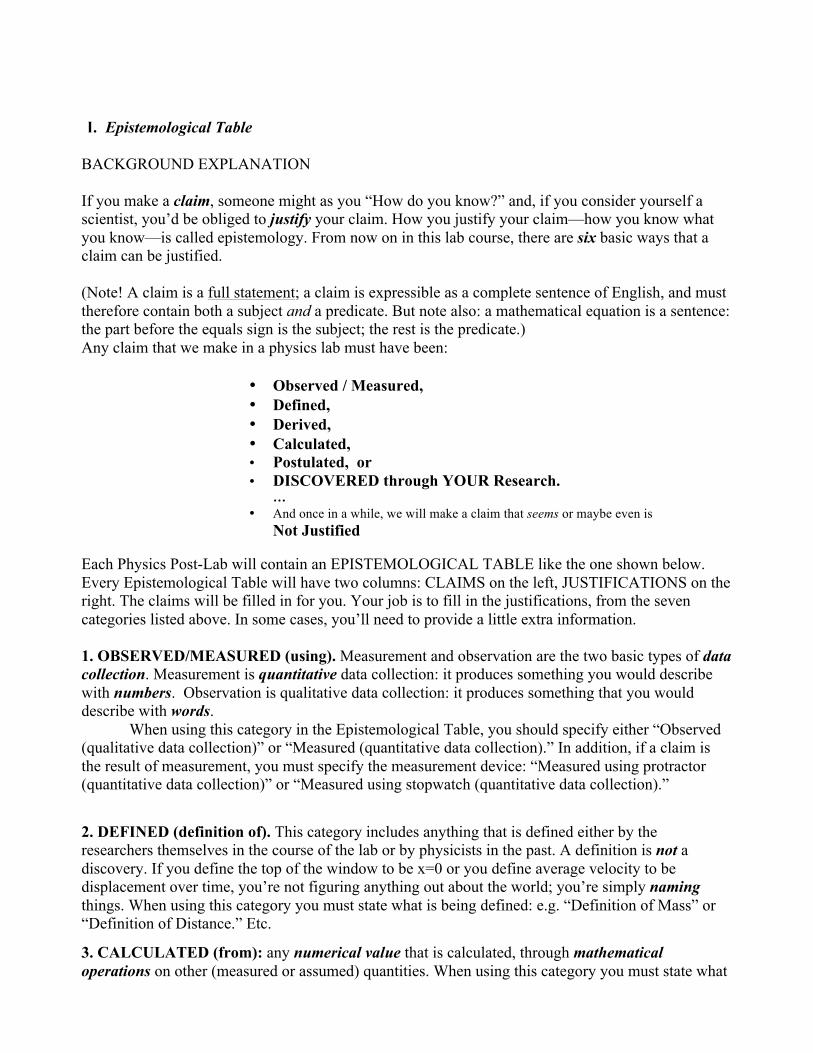
If you make a claim, someone might as you “How do you know?” and, if you consider yourself a scientist, you’d be obliged to justify your claim. How you justify your claim—how you know what you know—is called epistemology. From now on in this lab course, there are six basic ways that a claim can be justified.
(Note! A claim is a full statement; a claim is expressible as a complete sentence of English, and must therefore contain both a subject and a predicate. But note also: a mathematical equation is a sentence: the part before the equals sign is the subject; the rest is the predicate.) Any claim that we make in a physics lab must have been:
• Observed / Measured,• Defined,• Derived,• Calculated,• Postulated, or• DISCOVERED through YOUR Research.
…• And once in a while, we will make a claim that seems or maybe even isNot Justified
Each Physics Post-Lab will contain an EPISTEMOLOGICAL TABLE like the one shown below. Every Epistemological Table will have two columns: CLAIMS on the left, JUSTIFICATIONS on the right. The claims will be filled in for you. Your job is to fill in the justifications, from the seven categories listed above. In some cases, you’ll need to provide a little extra information.
1. OBSERVED/MEASURED (using). Measurement and observation are the two basic types of datacollection. Measurement is quantitative data collection: it produces something you would describewith numbers. Observation is qualitative data collection: it produces something that you woulddescribe with words.
When using this category in the Epistemological Table, you should specify either “Observed (qualitative data collection)” or “Measured (quantitative data collection).” In addition, if a claim is the result of measurement, you must specify the measurement device: “Measured using protractor (quantitative data collection)” or “Measured using stopwatch (quantitative data collection).”
2. DEFINED (definition of). This category includes anything that is defined either by theresearchers themselves in the course of the lab or by physicists in the past. A definition is not adiscovery. If you define the top of the window to be x=0 or you define average velocity to bedisplacement over time, you’re not figuring anything out about the world; you’re simply namingthings. When using this category you must state what is being defined: e.g. “Definition of Mass” or“Definition of Distance.” Etc.
3. CALCULATED (from): any numerical value that is calculated, through mathematicaloperations on other (measured or assumed) quantities. When using this category you must state what
3
equation(s) were used to calculate the value: e.g. “Calculated from the definition of average velocity” or “Calculated from Netwon’s Second Law.”
4. DERIVED (from). Derived knowledge is anything (equation or verbal statement) that is derived(i.e. figured out) through logic and/or mathematical proof. When using this category, you mustspecify which laws, definitions, observations, etc. you used to derived this statement: “Derived fromthe definition of acceleration and the midpoint velocity formula” or “derived from Newton’s firstlaw.”
5. POSTULATED. Postulates are statements that form the basic assumptions of an area of study(in this case, physics). A postulate is not directly provable, but it is accepted because it makes all therest of physics possible. Only a VERY small number of claims fall into this category. When usingthis category, state the name of the postulate: e.g. “Postulated: Galileo’s Principle of Relativity” or“Postulated: Newton’s Second Law.”
6. DISCOVERED THROUGH OUR RESEARCH. This category is reserved for things that youlearned not by pure observation, measurement, derivation, calculation, or postulation, but through thestrategic combination of these various forms of knowledge, which we call scientific research. Thiscould be something that you discovered in a previous lab in this course or something that youdiscovered in this lab, after doing a bunch of data collection AND analysis. If a claim was proved in aprevious lab, you should specify which lab: e.g. “Discovered through our research, in the ‘Free Fall’experiment.”
7.NOT JUSTIFIED. You should use this category VERY rarely. It is reserved for statements thatyou are taking as true basically just because someone told you they were true and you believedthem—i.e. statements that you have no way to verify.

4
WHAT TO DO FOR THIS PARTICULAR (Lab #1) POST-LAB:
Reproduce this table in a SEPARATE document or sheet of paper and choose among the seven categories listed above in order to complete it.
NOTE: the Justification MUST INCLUDE some sort of prepositional phrase that narrows the type
(and makes it easier for instructors to award credit for valid justifications they did not anticipate), e.g.: “derived from…,” “measured with (using)…” “definition of…,” etc.
(This is requirement is a slight modification from Physics 203 and is intended to result in better results for all.)
Claim Type of Justification
a) The cylinder hanging from ourspring had a mass of approx. .45 kg.
b) The cylinder hung at a locationthat was approx. .03 m below our
spring’s original equilibrium position.
c) 𝐾 = !"!
c) Our spring had a spring‘stiffness’ constant, K, of approx..
105 Newtons/meter.
d) When a mass of .45 kg was hungfrom our spring, the period for onevertical oscillation was approx. 4.3
seconds.
e) As the amount of mass hungfrom our spring is increased, theperiod of spring oscillation will
increase.
f) The period of oscillation for onespring (of fixed stiffness) varies indirect proportion with the square
root of the mass attached to it.
g) The period of oscillation forvarious springs attached to one
fixed mass varies in inverse proportion with the square root of
the stiffness of such springs.
h) A spring of stiffness K = 150N/m attached to a mass of 150 kg
will take approximately 2𝜋 secondsto complete one full oscillation.

5
II. Research Design Chart.
BACKGROUND EXPLANATION.
The chart begins with your Research Question and shows how you proceeded from data collection FOR at least ONE MEASUREMENT all the way toward an answer for that Research Question (RQ).
Note: For this and all future Post-Labs, you need only select ONE particular RQ and one particular data thread for depiction in a Chart.
Always write your RQ right above your Research Design Chart
The chart has 3 sections:
Example
RQ: how does changing the volume of a chamber affect the temperature of a the gas inside the chamber?
WHAT TO DO FOR THIS PARTICULAR (Lab #1) POST-LAB:
Using the model provided by two figures above, make a Research Design Chart that applies specifically to at least ONE MEASUREMENT you made in Lab #1.
ANALYSIS: Some mathematical or
logical analysis you did on those measured quantities
or observations.
CONCLUSION: How that analysis helped you answer
your Research Question
DATA COLLECTION:
Measurement(s) you took or observation(s) you made in the lab.
We measured the initial length, width & height of the chamber and got 7 cm, 5 cm, and 8cm, respectively.
We substituted these values into the equation for the volume of a rectangular prism: V=W× L× H. We concluded that the initial volume of the chamber was 5cm × 7cm × 8cm = 280 cm3
Knowing the initial volume of the chamber allowed us to compare that to the volume after the chamber was compressed, which allowed us to see the change in volume, which helped us determine the relationship between change in volume to change in pressure.

6
III. The Counter-Factual.
BACKGROUND EXPLANATION.
At this point in the semester, we let this portion of the Post-Lab speak for itself. It is simply aquestion or small set of questions that asks you to consider the implications of something thatmost probably did NOT happen in your laboratory experience. Though it might seem asthough we are asking you to waste thought or time on a non-sequitur (to something entirelyunrelated to the issues at hand), we are not.
In fact, we are asking you to identify, scrutinize, test or possibly challenge some kind ofreasoning that is central to the lab—and therefore to the Formal Lab Report.
WHAT TO DO FOR THIS PARTICULAR (Lab #1) POST-LAB:
In complete sentences of English, answer the following two questions (two parts each, secondquestion is on the next page):
a. Imagine that in the hypothetical counter-factual world, you did and thoughtabout everything in this experiment precisely as you did in your actual John Jayexperience, EXCEPT one thing: you utterly forgot to get a K value for yourspring. It is too late to go back to the lab and you have all the numbers and yourlogic at your disposal, so you go ahead and draft a full and beautiful formalreport anyway. (Each of your partners does the same thing and then you’re allplanning to get together, share your drafts, debate your differences and distillone spectacular final version. Just like you normally do, right?)
i. in what specific ways (if any) would this omission of K value changeyour final answer to the Research Question?
ii. in what specific ways (if any) would this omission of K value NOTchange your final answer to the Research Question?

7
b. Imagine that you are no longer imagining the above hypothetical counter-factual world. Imagine, that is, that you have collected all your data and madeall calculations (etc) thoroughly – including K. You are comparing report draftswith one of your partners and the partner raises the following concern:
Most of this experiment is about how period and mass are related when a spring oscillates. But our spring oscillates vertically. From the moment we started measuring, plotting and analyzing actual oscillations*, we never once made any reference to gravity. Nothing about 9.81 m/s2 or mg is anywhere in our data tables or our graphs or our final conclusion! There must be a reason that somebody decided to put this spring on its side – and gravity must be doing something, yet our final function for period does not depend on g in any apparent way – not even in a constant way. We must be missing something!
* That is, once we knew how strong our spring was and actually started using it toderive a relationship.
Well, one thing is true of both the hypothetical and the John Jay physics world: In both, you are not – in fact – missing something: If you analyze according to the laws of physics, and if your spring elects to obey such laws, then the force of gravity should not play any direct role in your final conclusion.
i. Why/How not? Be specific and thorough. And thoughtful. There aredifferent possible ways to explain this, but none of them is some quickformula that you once memorized.
ii. If gravity does not affect your final answer to the Research Question,then why did we choose to investigate springs in a vertical orientation?Assuming that physicists prefer to keep things as simple as possible,how might this seemingly distracting choice have helped theinvestigation?

8
IV. The Wild Card.
BACKGROUND EXPLANATION.
There is no ‘Background Explanation’ for something called a Wild Card. We claim that youknow that. Our justification is “by definition of Wild Card”. In other words, each week theWild Card is one final piece of written reflection for which you are responsible – but whichcan appear in any form — whether familiar or unfamiliar.
The Wild Card might require another simple diagram or another ‘counter-factual’ paragraph ofwriting (things already done) or it might ask you to communicate your understanding in amanner you have not previously considered – such as “knit a sock puppet who can perform aone-act pantomime play about the particle’s acceleration”. The reason for a Wild Card is thateach particular experiment raises its own particular issues and concerns. Often, particularissues are best expressed by means of their own particular modes of expression. (Usually,there are more effective and precise ways to convey physics findings than by means of a sockpuppet.)
WHAT TO DO FOR THIS PARTICULAR (Lab #1) POST-LAB:
Even though this is no longer technically the counter-factual, imagine the following: Youhave a dim recollection of some web-site about some book you dreamed about reading once.Somewhere in that resource, someone of authority seemed to be discussing springs andoscillations and functions and you could have sworn you saw the following:
𝑇 = 2𝜋 !!
.
(Of course, just because you read something somewhere doesn’t mean that it’s true. And even if you read something in an extremely trustworthy place, it’s still quite plausible that the reading is about one context and came to the reading thinking about some other context. Nonetheless, the claim above does seem to have something to do with something relevant to some of our thoughts here…)
a) If you remember and use the above claim while you write up your formal report, are youcheating? Why or why not? Even if the “dim recollection” scenario mentioned above doesnot apply to you – even if you swear that you have never seen this equation before in yourentire life – you have now read this paragraph which includes the equation. You are nowthinking about all this with reference to the lab. So, are you cheating? Why or why not?
9
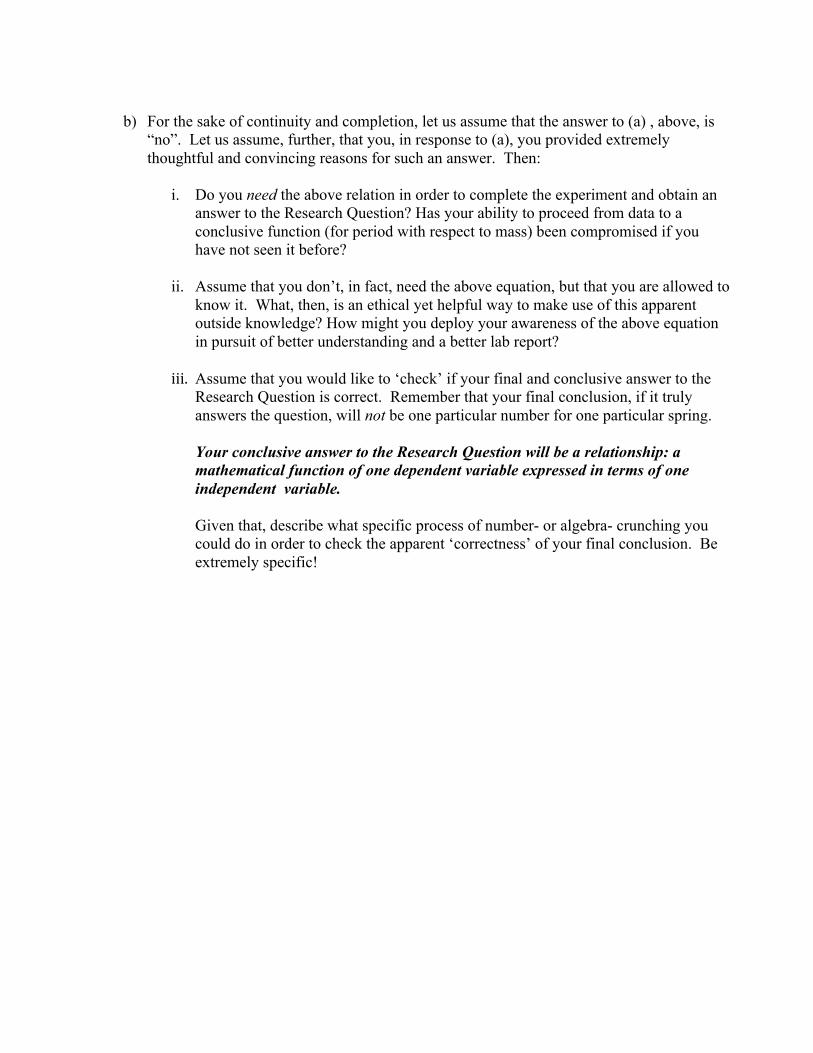
b) For the sake of continuity and completion, let us assume that the answer to (a) , above, is
“no”. Let us assume, further, that you, in response to (a), you provided extremely thoughtful and convincing reasons for such an answer. Then:
i. Do you need the above relation in order to complete the experiment and obtain an answer to the Research Question? Has your ability to proceed from data to a conclusive function (for period with respect to mass) been compromised if you have not seen it before?
ii. Assume that you don’t, in fact, need the above equation, but that you are allowed to know it. What, then, is an ethical yet helpful way to make use of this apparent outside knowledge? How might you deploy your awareness of the above equation in pursuit of better understanding and a better lab report?
iii. Assume that you would like to ‘check’ if your final and conclusive answer to the Research Question is correct. Remember that your final conclusion, if it truly answers the question, will not be one particular number for one particular spring. Your conclusive answer to the Research Question will be a relationship: a mathematical function of one dependent variable expressed in terms of one independent variable. Given that, describe what specific process of number- or algebra- crunching you could do in order to check the apparent ‘correctness’ of your final conclusion. Be extremely specific!

10
Part 2: The Formal Report. Overview The Formal Report is a complete scholarly accounting of everything you did for a particular laboratory investigation and why. All sections of this Formal Report are ultimately directed toward the answering of a Research Question (or, in some cases, up to three related Research Questions): The Formal Report explains to any and all uninitiated readers precisely how and why a set of data was collected, by what means these data were analyzed, and in what way this analysis—within a specified range of measurement uncertainty—led to a finding that, finally, answered the Research Question. This Formal Report is composed and presented in the manner of a research physicist submitting her experimental findings to a (“peer-reviewed”) journal. The Formal Report, that is, is formal in the following fundamental sense: Imagine that an intelligent and interested reader is randomly selected from far outside the context of all John Jay syllabi, discussions and experiences; this reader, although familiar with general scientific research, might not even know any physics. Such a reader, with no specific background nor supplementary explanations, should be able to use a properly written Report in order to reproduce our methods and pursue his own answer to the self-evidently meaningful Research Question found within. A strong Formal Report is, in principle, ready for publication. Specific Format and Sequence of Sections: In BRIEF
i. Title Page: title, date, section number, authors. ii. Abstract: a summary that includes your research question and your conclusion
(with uncertainty interval), as well as a VERY brief (1-3 sentences) overview of your methods.
iii. Introduction: some background on the topic; underlying knowledge; why this research is interesting/important.
iv. Research Question: The QUESTION AT THE HEART OF THE EXPERIMENT. It was to answer this question that you did EVERYTHING you did in the experiment!
v. Data Collection: what you measured and how you measured it: similar to that which is sometimes known as Materials & Methods.
vi. Diagram: not a photograph, not something off the internet—an original rendering of your experimental design, fully labeled with all variables & constants.
vii. Analysis: everything you did to your data after you collected it (math, logic, graphing, etc.). In other words, a thorough step-by-step narrative that both quantitatively and qualitatively explains how a trend, relationship and/or generalized finding was ultimately inferred from the data.
viii. Uncertainty: a precise explanation of the uncertainty associated with each individual (type of) measurement as well as a meaningful application of the combined uncertainty for all measurements taken together.
ix. Conclusion: a clear, concise and final answer to your Research Question(s), explicitly including uncertainty.
x. Appendices.

11
Sections explained in greater detail 1) Title Page. Title of Lab Date Lab Section Number All members of Lab Group: Listed in alphabetical order by last name. 2) Abstract. One paragraph. A clear, concise yet quantitative summary of what you did and found in your experiment. It is a distillation of (headline for) the whole document to come. Put another way, the abstract is an expansion of the conclusion. It is the reason anybody would want to turn the page and read the entire report. It can stand on its own as the “Sneek Preview” or “Readers Digest” version of your whole report: If you were to present your report at a conference, then the abstract would be advance printed in the conference literature. The abstract must explicitly contain the R.Q., the answer to the R.Q. and 2 – 3 sentences which summarize the methods deployed in order to get from the former to the latter. 3) Introduction. Also one paragraph. This one provides a brief bit of physics background: which particular physics thoughts are treated as known but somehow provoking by the research team before they walk through the laboratory door? How do these assumptions lead to a curiosity that finds shape as a Research Question. The introduction section offers a bit of freedom to place the entire report into some kind of helpful context. The specific context might vary from lab group to lab group, but, no matter what, the introduction must and will always culminate in an explicit statement of the Research Question. 4) The Research Question. Pose a clear and direct question that best captures the curiosity your investigation seeks to address: the question toward which all your planning, tinkering and thinking were ultimately pointing. Your question should be as concise as it can possibly be, but it does have to make sense on its own. The report starts and ends with the question. Colleagues read your report in order to understand what you found to be the answer and how: Nobody should have to read the report in order to understand the question in the first place. The question itself, therefore, must mention any conditions/context in which it operates. The question, moreover, must somehow be of generalized interest or at least generalizable application. We can all grow curious about some one-shot-deal particular instance of something that suddenly demands our attention, like a well-timed 3-point shot in the local high school basketball championship, but we would find it quite challenging to raise a question of global interest and reproducibility about that one specific event.
A constructive Research Question generally asks about a relationship between two quantities—one that we alter deliberately and continually (the independent variable) and one that we observe in order to find out how nature tends to respond to such changes (the dependent variable). In order to confine the scope and significance of these two variables, an implicit “if… then” usually underlies the question—whether or not the words “if… then” are actually used. “How fast does it go?” might be a question, for example, but it is NOT a Research Question. Even, “How fast does a marble roll?” is not quite a Research Question.
This is an example of a strong and realistic Research Question for Physics 203: “Given a long and approximately smooth slide, how does the average speed of a rolling marble depend on the slide’s angle of elevation?”
12
5) Data Collection. Provide a thorough and specific narrative that explains in plain, fluid English what you actually did with your set-up: what measurements you took and how you related them to one another. Here, you will refer to specific numbers only insofar as they provide clear examples for your flowing explanation. You are focusing more on types of numbers (variables, constants, etc.). This explanation should be one that any reasonable person could read and follow. All the details of specific trials will be covered in your tables, graphs and other prior steps. Place all tables and graphs in 'Appendices' and refer to these appendices in your findings section. 6) Diagram. Begin with a clearly labeled diagram of your experimental set-up. Any variable or constant to which you refer in your findings section must first be established as a label in the diagram. This is NOT a photograph of your apparatus. While you may certainly also provide captured images, you must first provide a hand-drawn or computer-created schematic that reveals just the essential elements of the set-up. It is your job to decide and convey what is important and therefore worthy of a label: such as an algebraic variable or constant.
This is also NOT an image that you grabbed off the internet.. If it is a hand-drawn image, you must hand in the original sheet of paper on which you did the drawing, and it should be signed by the artist. If it is a computer-generated image, you must hand in an editable document in the program you used to create the image: if you used Photoshop, hand in a .psd; if you used Word, hand in a .doc; if you used Pages, hand in a zipped Pages folder. 7) Analysis
The Analysis section explains everything you did to the data after you collected it: mathematical calculations, graphing, logic, etc.. But it is more than just that: it is a written explanation of the thinking that brought your research team from a bunch of seemingly disconnected raw measurements (dots on a page) all the way to some general discovery about the world. As you go further into this course and 204, and labs become more mathematically and logically complex, the Analysis will become an increasingly important part of the lab report.
Of everything you do in the laboratory, this type of dot-connecting most closely resembles that which you will have to do in order to prepare for and take physics exams. Your narrative began with a description of measuring procedures and measurement results. Here, it will proceed to a discussion of how/why all these numbers mean anything with regard to one another. Such apparent meaning and connection is that which allowed the R.Q. to be experimentally tested in the first place. So, the analysis (body of the report) is where you show everything that you did with, for and from the measurements you made. This is the part where raw numbers evolve into thoughts, relationships and results. Here, you will establish and use mathematical equations. Center every equation on its own line of text. Never use an equation unless every term has been explained (by means of the diagram) and unless the relationship is also developed in CLEAR ENGLISH. 8) Uncertainty. Fully discuss the minimum systematic uncertainty associated with each measurement. Then show how these uncertainties combined to create one final uncertainty in your finding. Use this final uncertainty to relate your ultimate finding to your Research Question. This section often provides the most challenge to students, but it is crucial. All measurements are associated with some amount of quantifiable uncertainty—even measurements made by computers. Uncertainty in measurement distinguishes experimental science from pure mathematics, pure philosophy and, indeed, pure drivel. Compute and combine all uncertainties by the method explained in the introductory lab documents from Physics 203.
13
9) Conclusion (Finding). Conclude with what you ultimately, finally found out (or learned, discovered, confirmed or emphasized) at the end of the laboratory investigation. This ultimate finding will generally (although not always) be a relationship between one variable and another. It will often be expressed as an equation. No matter what it is, the ultimate finding must be clearly explained -- both quantitatively (as a mathematical equation) and qualitatively (in words). THE CONCLUSION MUST EXPLICITLY ANSWER THE RESEARCH QUESTION(S). It must, moreover, include and make meaningful use of your uncertainty range. Your conclusion must ultimately communicate a finding, that is, that relied in some important way on physical experimentation, observation and measurement—on, that is, science. If there is no acknowledgment of uncertainty, then you have not answered a scientific research question. Quite possibly, rather, you have dissected some definitions. You might even have thrust into some theology. Most vexingly, though, you might have just flirted with some falsehoods. In physics, we can be comfortable not knowing what we think. But we would prefer not to think that we know what we do not. So don’t be wrong. Just be uncertain.
Within a range of uncertainty, conclude by answering your Research Question.
10) Appendices Here, you will include all graphs, data tables, supplementary diagrams, etc. You refer to them throughout your Methods & Findings section (for example, “see Appendix I: Graph of Spring Period vs. Spring Mass). By isolating all data and figures, your narrative becomes a far smoother reading experience than otherwise. Even graphs (etc.) that are vital to your analysis should be placed in appendices and then referred to at the appropriate time.