Embed Size (px)
Citation preview
LA-13539-MS
Approved tor public release; " 'ribution is unlimited.
""·
111111111111111111111111111///llll/ 11563
Fracture Characteristics in a
Disposal Pit on Mesita del Buey,
Los Alamos National Laboratory
Los Alamos JUN 1 5 1999 '-~AY\~
NATIONAL LABORATORY
Los Alamos National Laboratory is operated by the University of California for the United States Department of Energy under contract W-7405-ENG-36.

•
•
•
Prepared by L.nnny Piotrowski, Group EES-1
An Affirmative Action/Equal Opportunity Employer
This repOrt was prepared as an account of work sponsored by an.agency of ihe Unile!i States.: '···-: ·. ·. Government . . Neither The Regents of the University pf California, t!ze United StatiS .. , .. >' · · Government nor any agency thereof, 1ior any of their enwloyees, ~ an.Ji UJaTTilnh.f, expi~~,· ; or implied, or assumes any legal liability or responsibility for t!ze 'tli;etitllC}f, cpmpletet~eSS;:'i1r> > , .· usefulness of any information, apparatus, product, or pro'*$ d~, PT represe,~ t1uitJf$\~: .· • ': ~:/Y:~f:?< · '• ·
. ';aU:::~'::ess~n=va,;;~;:::m~~~~~!:,;TJ)r~~ S:~4"~ :\~:... ·>~''.ji·',<:1~~!'?f;~~~~.· _, necessarily constitute or imply its endorsement, recommetitJa#o/i, arfJtuor#ng l?!J The Regiijzfs. :• ,· \ '· ·-·· · · ·· · • · · · · of the University of California, the United States ~frrairff a~ ~hereof,.· T/tj,{£!·7"·· _ •:::·ht;~;;y;' ;; ?J,~ :' ·; Views and opinions of autlwrs eXpressed herein do not necessarily state« rifiecf tiWSe of<\ . . ' '"r: ' ~: ,, ' -.. ; The Regents of the University of California, the United StatesGi:1Verpment, oranyagem;y ,, · ·;: , ;, · <:"•. thereof Los Alamos National Laboratory strongly supports academicfreedOm aiiil.'lli"- ':: }\'•· ·. ·. · " "c>: > < • ;;.,<· > . researcher's right to publish; as an institutian, howeVer, tlie LaiJoratory does not endorSe the ' · viezvpoint of a publication or guarantee its technical corr:eC:tneSs· · · · ·
Fracture Characteristics in a
Disposal Pit on Mesita del Buey,
Los Alamos National Laboratory
Steven L. Reneau
David T. Vaniman
Los Alamos NATIONAL LABORATORY
Los Alamos, New Mexico 87545
LA-13539-MS
Issued: December 1998
FRACTURE CHARACTERISTICS IN A DISPOSAL PIT ON MESITA DEL BUEY,
LOS ALAMOS NATIONAL LABORATORY
by
Steven L. Reneau and David T. Vaniman
ABSTRACT
)
The characteristics of fractures in unit 2 of the Tshirege Member of the Bandelier Tuff were
documented in Pit 39, a newly excavated 13.7 m deep disposal pit at Material Disposal Area G
on Mesita del Buey. The average spacing between fractures is about 1.0 to 1.3 m, the average
fracture aperture is about 3 to 5 mm, and the average fracture dip is about 76° to 77°. Fracture
spacing and dip in Pit 39 are generally consistent with that reported from other fracture studies
on the Pajarito Plateau. although the fracture apertures in Pit 39 are less than reported elsewhere.
Measured fracture orientations are strongly affected by biases imparted by the orientations of
the pit wal1s, which, combined with a sma11 data set, make identification of potential preferred
orientations difficult. The most prominent fracture orientations observed in Pit 39, about E-W
and N20E, are often not well represented elsewhere on the Pajarito Plateau. Fracture fills contain
smectite to about 3m depth, and calcite and opal may occur at all depths, principally associated
with roots or root fossils (rhizoliths). Roots of pinon pine extend in fractures to the bottom of
the pit along the north side, perhaps indicating a zone of preferred infiltration of water. Finely
powdered tuff with clay-sized particles occurs within a number of fractures and may record )
abrasive disaggregation associated with small amounts of displacement on minor local faults.
INTRODUCTION
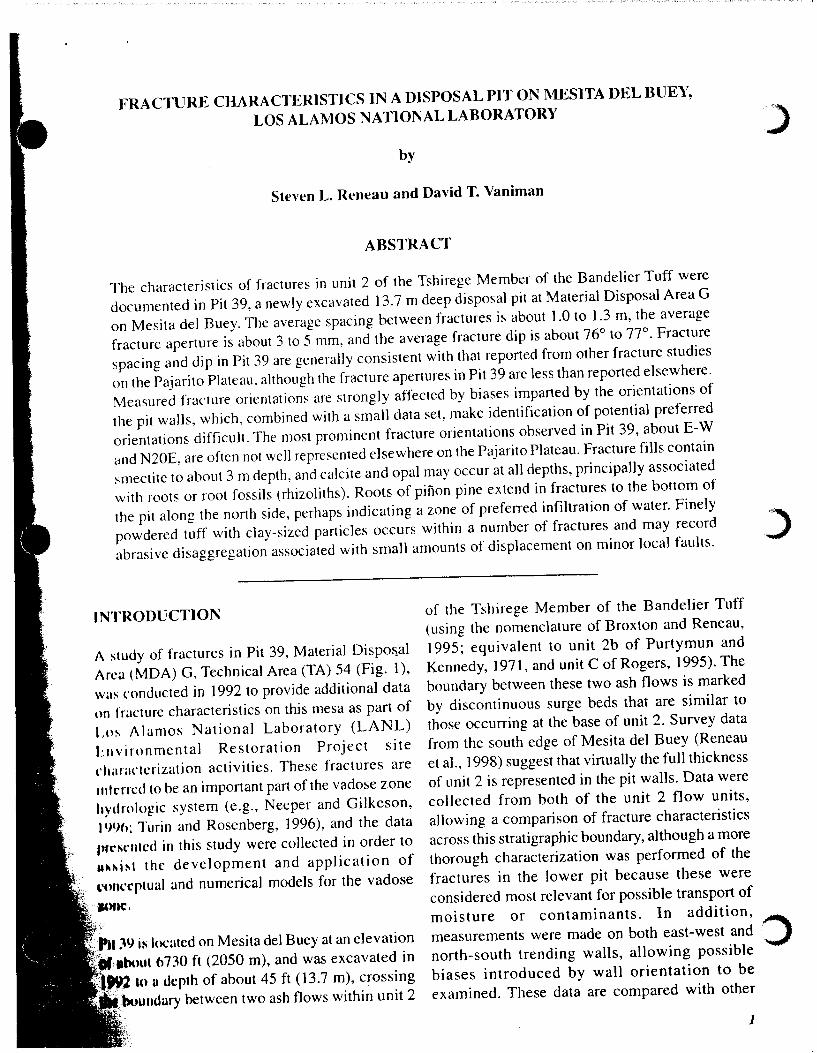
A study of fractures in Pit 39, Material Dispo~al
Area (MDA) G, Technical Area (TA) 54 (Fig. 1 ),
wm; conducted in 1992 to provide additional data
on fracture characteristics on this mesa as part of
Los A I amos National Laboratory (LANL)
l·.nvironmental Restoration Project site
dlillactcrization activities. These fractures are
111lcrrcd to be an important part of the vadose zone
hydrologic system (e.g., Neeper and Gilkeson,
I ')96: Turin and Rosenberg, 1996), and the data
prc~cntcd in this study were collected in order to
"""ist the development and application of
''tmcrptual and numerical models for the vadose
Pn 39 is located on Mesita del Buey at an elevation
•--·•'''"'" 6730 ft (2050 m), and was excavated in
lou depth of about 45ft (13.7 m), crossing
boundary between two ash flows within unit 2
of the Tshirege Member of the Bandelier Tuff
(using the nomenclature of Broxton and Reneau,
1995; equivalent to unit 2b of Purtymun and
Kennedy, 1971, and unit C of Rogers, 1995). The
boundary between these two ash flows is marked
by discontinuous surge beds that are similar to
those occurring at the base of unit 2. Survey data
from the south edge of Mesita del Buey (Reneau
et al., 1998) suggest that virtually the full thickness
of unit 2 is represented in the pit walls. Data were
collected from both of the unit 2 flow units,
allowing a comparison of fracture characteristics
across this stratigraphic boundary, although a more
thorough characterization was performed of the
fractures in the lower pit because these were
considered most relevant for possible transport of
moisture or contaminants. In addition,
measurements were made on both east-west and
north-south trending walls, allowing possible
biases introduced by wall orientation to be
examined. These data are compared with other
I
c
I - -
E I,,
+
O.E
O.t- 1 km
[ '
-I ::.·,
3!'
37
36
' \ :;; ...-;,,
'1\\
' ,,
0 100 200 300 400 500 h j,,,,,,,,,j,,,,,,,,,j,,,,,,,,,j,,,,,,,u[,,,,l!l!!l
106°15
Pit 39
........... ~ ... --··--.
CEDROc,q~:--..,. rolit·'-··.
SAN ILDEFONso
I N DIAN
RESERVATiON
w· J. (A) Map showing location of MDA Gat TA-54. (B) Location of Pit 39 within MDA G.
fracture data collected on the Pajarito Plateau to
examine to what degree the Pit 39 data may be
repre~entative of other ~ites.
METHODS
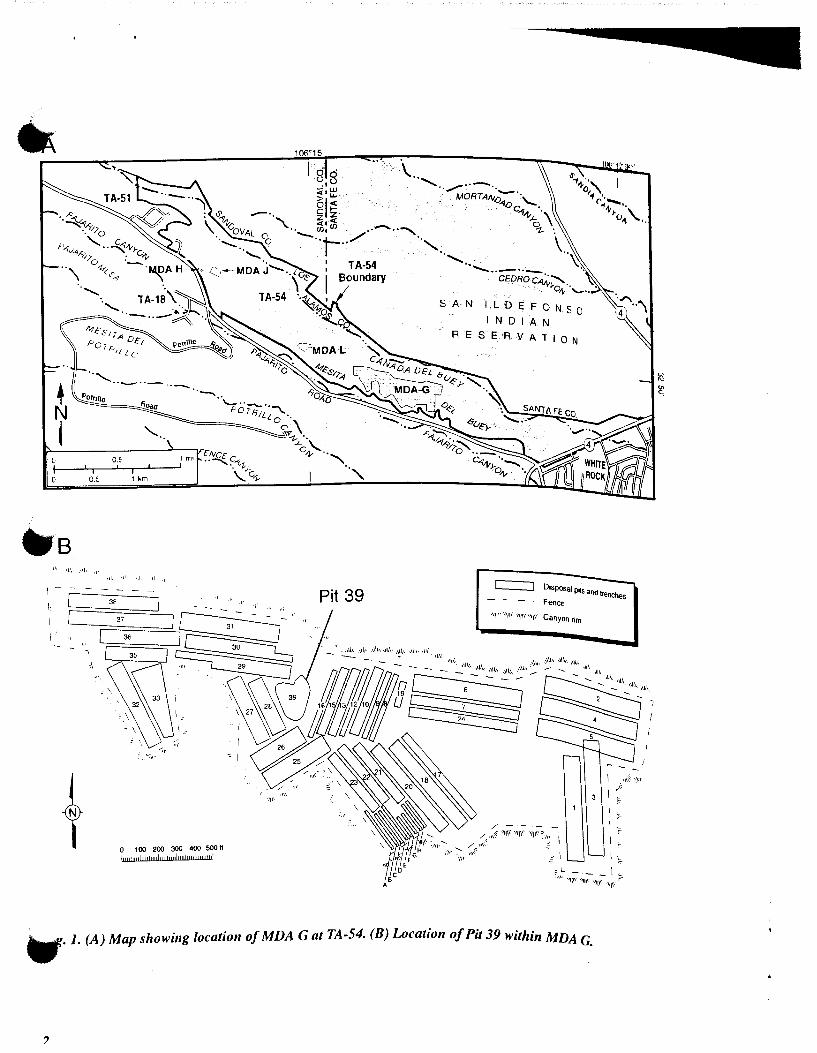
Fracture~ were mapped onto a 1-ft contour map of
Pit 39 provided by LANL group EM-7, plotted at
a ~cale of 1:132.5 (Fig. 2). All of the lower walls
A
B
0 15 30 tt I I I
and about half of the upper walls of Pit 39 were
mapped. As discussed in this report, the upper wall
is equiv:Jient to the upper flow unit exposed in
Pit 39, and the lower wall is equivalent to the lower
flow unit. For accessible and well-exposed
fractures, measurements were made of fracture
orientation. dip, and aperture, and notes were made
on fracture filling materials and roots.
Measurements were not made on some fractures
that were inaccessible on the pit walls. ln addition,
Fig. 2. (A) Topographic map of Pit 39, showing mapped fractures and locations of samples discussed in text.
The contour interval is 2ft, and the topographic base map was provided by EM-7. (B) Map of Pit 39, indicat-
ing mapped fractures in which living roots or root fossils occur (heavier lines). Note the concentration of
these occurrences in the northern portion of the pit and at depths extending at least to the bottom of the pit. ....,.,
This concentration may indicate a zone of preferred migration for surface water penetrating into the mesa,
prior to pit excavation.
3
' I
·---------·>rts of the pit walls consisted of highly broken ' .k that was at least partially caused by pit tJ;"cavation, and measurements were not made if such secondary fractures were suspected. Consequently. some zones of highly fractured tuff were probably not recognized. and the measurements of fracture density may be somewhat underestimated. Jn addition to the field measurements of fracture characteristics. representative samples of fracture filling materials and roots were collected for X-ray diffraction (XRD) and scanning electron microscope (SEM) analyses to examine their mineralogy and
distribution on the upper walls, with both a larger percentage of fracture spacings under 2 ft (0.6 m) and a larger maximum fracture spacing.
chemistry.
FRACTURE CHARACTERJSTJCSAT PJT39 AND COMl,ARJSON 'VJTH OTHER SJTES
Fra<'1 ure Density
Pit 39. Fracture density was measured along 17 • ,-izontaltransects along the east, north, and west .,,Ills of Pit 39, on both the upper and Jow~r walls, and along 70 sloping transects down the pit walls. The horizontal transects provide data comparable to horizontal core holes and the sloping transects provide data comparable to inclined core holes.
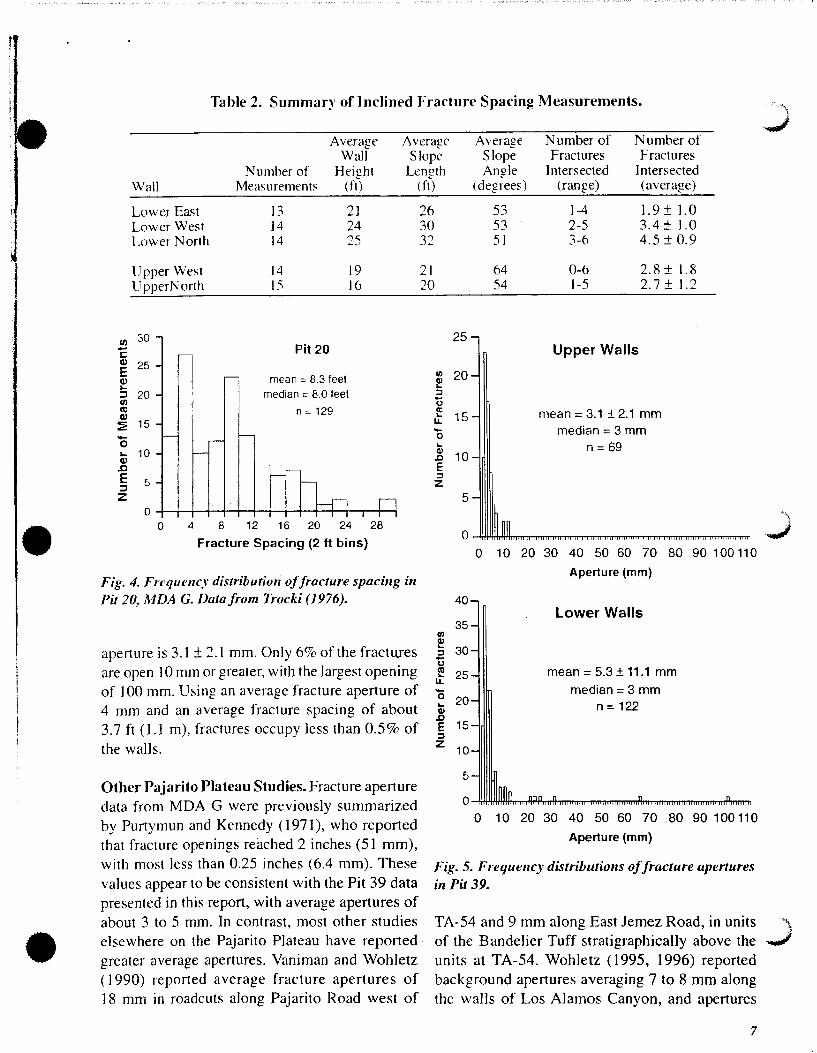
For the sloping transects, fractures were intersected less frequently than for the horizontal transects. reflecting the steeply dipping nature of most of the fractures. For the upper wall. including the upper 15 ft (4.6 m) of the pit, 0 to 6 fractures were encountered along transects that averaged 20 to 21 ft (6.1 to 6.4 m) in length (Table 2). The average number of fractures encountered was similar on both the west and north walls, at 2.7 to 2.8 per transect. For the lower wall. including the lower 21 to 25ft (6.4 to 7.6 m) of the pit, 1 to 6 fractures were measured along transects that averaged 26 to 32ft (7 .9 to 9.8 m) in length (Table 2). The average number of fractures encountered ranged from 1.9 on the lower east wall to 4.5 on the lower north wall. A possible relationship between the orientation of the transect and the number of fractures encountered is consistent with data on fracture dip. discussed later, that suggests a preferential dip to the west or northwest in the lower walls.
Other Pajarito Plateau Studies. Purtymun et al.
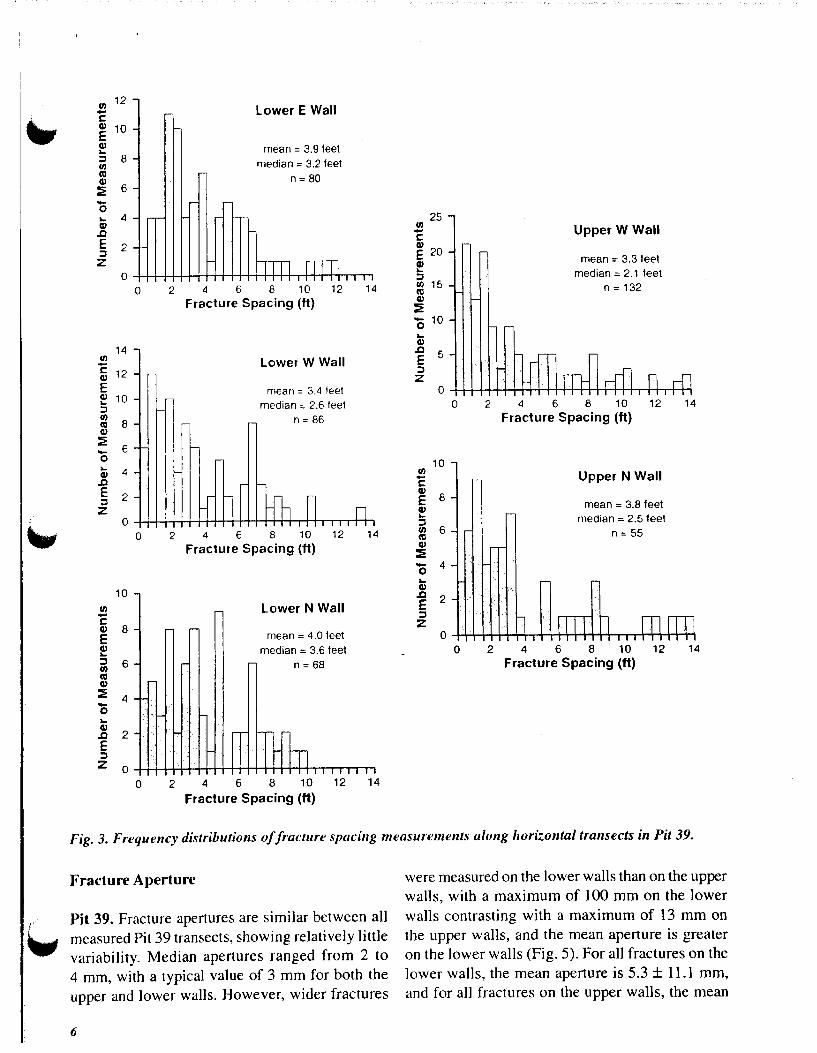
For the horizontal transects, the average fracture spacing ranged from 3.2 to 4.2 ft ( 1.0 to 1.3 m) along these transects, and the median fracture spacing ranged from 1.9. to 4.0 f~ (0.6 to 1.2 m) (Table 1 ). Maximum honzontal distance between fractures was 14ft (4.3 m). Frequency distributions of horizontal fracture spacing measurements from each wall are shown in Figure 3.
( 1978) reported fracture data obtained from horizontal core holes beneath Pit 3, east of Pit 39 in MDA G (Fig. lb). Most of the data were obtained from the lower part of their unit 2b (unit 2 of Broxton and Reneau, 1995), with some of the data from the upper part of their unit 2a (the uppermost part of unit 1 v of Broxton and Reneau, 1995). The average fracture spacing of 3.0 to 5.6 ft (0.9 to 1.7 m) that they reported is consistent with the 3.2 to 4.2 ft ( 1.0 to 1.3 m) average spacing measured in Pit 39. In contrast, other data from TA-54 indicate more widely spaced fractures. Purtymun et al. ( 1978) reported that the average fracture spacing me~sured within Pit 3 was 7.2 ft (2.2 m), and they attnbute this difference from the core data as probably due to incomplete mapping of minor fractures on the pit walls. Similarly, Purtymun and Kennedy ( 1971) reported average fracture spacing at MDA G to be about 7 ft (2.1 m), and data from individual MDA G pits, summarized by Rogers (1977), indicate a range of average spacings of
Slight differences are noted between the h.orizontal fracture spacing on different wal1s of Pit 39. On both the }ower and upper walls, both average and median fracture spacing is slightly higher on the E-W wa11 than on the N-S walls (Table 1, Fig. 3). is may be due to the apparent dominance of an lllw fracture set. In addition, although average ~acture spacing is similar between the upper and lower walls, median spacing is greater on the lower wa11s. This reflects a more highly skewed
4
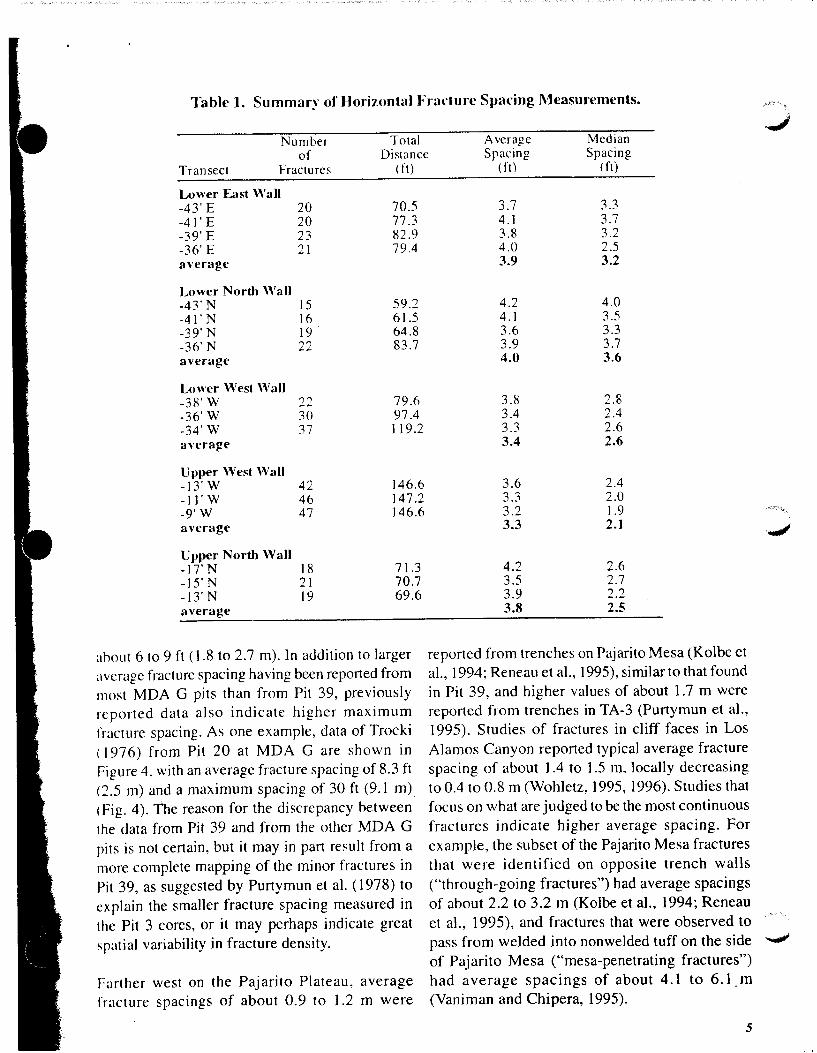
Table 1. Summar~' of Horizontal Frarture Spacing Measurements.
Number Total Average Median of Distance Spacing Spacing
Transect Fractures (ft)
Lower East Wall -43' E 20 70.5 -41' E 20 77.3 -39' E 23 82.9 -36' E 21 79.4 average
Lower North Wall -43' N 15 59.2 -41' N 16 61.5 -39' N 19 64.8 -36' N 22 83.7 average
Lower West Wall -38' w 22 79.6 -36' w 30 97.4 -34'W 37 119.2 average
Upper West Wall -13' w 42 146.6 -11'W 46 147.2 -9'W 47 146.6 average
Upper North Wall -17' N 18 71.3 -15' N 21 70.7 -13' N 19 69.6 average
ahout 6 to 9 ft ( 1.8 to 2.7 m). ln addition to larger
average fracture spacing having been reported from
most MDA G pits than from Pit 39, previously
reported data also indicate higher maximum
fracture spacing. As one example, data of Trocki
( 1976) from Pit 20 at MDA G are shown in
Figure 4, with an average fracture spacing of 8.3 ft
(2.5 m) and a maximum spacing of 30ft (9.1 m)
(Fig. 4). The reason for the discrepancy between
the data from Pit 39 and from the other MDA G
pits is not certain, but it may in part result from a
more complete mapping of the minor fractures in
Pit 39, as suggested by Purtymun et al. (1978) to
explain the smaller fracture spacing measured in
the Pit 3 cores, or it may perhaps indicate great
spatial variability in fracture density.
Farther west on the Pajarito Plateau, average
fracture spacings of about 0.9 to 1.2 m were
( ft) ( ft)
3.7 3.3 4.1 3.7 3.8 3.2 4.0 2.5 3.9 3.2
4.2 4.0 4.1 3.5 3.6 3.3 3.9 3.7 4.0 3.6
3.8 2.8 3.4 2.4 3.3 2.6 3.4 2.6
3.6 2.4 3.3 2.0 3.2 1.9 3.3 2.1
4.2 2.6 3.5 2.7 3.9 2.2 3.8 2.5
reported from trenches on Pajarito Mesa (Kolbe et
al., 1994; Reneau et al., 1995), similar to that found
in Pit 39, and higher values of about 1.7 m were
reported from trenches in TA-3 (Purtymun et al.,
1995). Studies of fractures in cliff faces in Los
Alamos Canyon reported typical average fracture
spacing of about 1.4 to 1.5 m, locally decreasing
to 0.4 to 0.8 m (Wohletz, 1995, 1996). Studies that
focus on what are judged to be the most continuous
fractures indicate higher average spacing. For
example, the subset of the Pajarito Mesa fractures
that were identified on opposite trench walls
("through-going fractures") had average spacings
of about 2.2 to 3.2 m (Kolbe et al., 1994; Reneau
et al., 1995), and fractures that were observed to
pass from welded into nonwelded tuff on the side
of Pajarito Mesa ("mesa-penetrating fractures")
had average spacings of about 4.1 to 6.1. m
(Vaniman and Chipera, 1995).
5
.,!
-..,
Cl) 12 -c
Q) 10 E Q) ... :::l 8 Cl)
C'C Q)
6 :E -0 ... 4 -Q) .rJ E 2 :::l -z
0 0
14 ~ c 12 Q)
E Q) 10 ... :::l Cl)
8 C'C Q)
:E 6 -0 ... 4 Q)
.rJ E 2 :::l z
0 0
10 Cl) -c Q) 8 E Q) ... :::l 6 Cl)
C'C Q)
:E 4 -0 ... Q)
.rJ 2 E :::l z 0
0
Lower E Wall
mean = 3.9 feet
median = 3.2 feet
n = 80
.-
hTn nm I I I -,,,,
2 4 6 8 10 12
Fracture Spacing (ft)
Lower W Wall
mean = 3.4 feet median= 2.6 feet
n = 86
2 4 6 8 10 12
Fracture Spacing (ft)
Lower N Wall
mean= 4.0 feet
median= 3.6 feet
n = 68
14
14
ITITl r1
2 4 6 8 10 12 14
Fracture Spacing (ft)
25 Cl) -c E 20 Q) ... :::l Cl) 15 C'C Q)
:E -10 0 ... Q)
.rJ 5 E :::l z
0
10 Cl) -c Q)
8 E Q) ... :::l Cl) 6 C'C Q)
:E - 4 0 ... Q) .rJ 2 E :::l z
0
0
0
Upper W Wall
mean = 3.3 feet median= 2.1 feet
n = 132
2 4 6 8 10 12
Fracture Spacing (ft)
Upper N Wall
mean = 3.8 feet median = 2.5 feet
n =55
2 4 6 8 10 12
Fracture Spacing (ft)
14
14
Fig. 3. Frequency distributions of fracture spacing measurements along horizontal transects in Pit 39.
Fracture Aperture
Pit 39. Fracture apertures are similar between all measured Pit 39 transects, showing relatively little variability. Median apertures ranged from 2 to 4 mm, with a typical value of 3 mm for both the upper and lower walls. However, wider fractures
6
were measured on the lower walls than on the upper walls, with a maximum of 100 mm on the lower walls contrasting with a maximum of 13 mm on the upper walls, and the mean aperture is greater on the lower walls (Fig. 5). For all fractures on the lower walls, the mean aperture is 5.3 ± 11.1 mm, and for all fractures on the upper walls, the mean
•
•
Table 2. Summar~' of ]nclined Fracture Spacing Measurements.
Average Average Average Number of Number of Wall Slope Slope Fractures Fractures
Number of Hei£ht Length Angle Intersected Intersected (fi) Wall Mea.;;urements
Lower Ea<>t 13 21 Lower West 14 24 Lower North 14 25
Upper West 14 19 UpperNorth 15 16
Pit 20 C/1 30 -s::
mean = 8.3 feet
Q) 25 E Q) ... ::J 20 median = 8.0 feet C/1
n = 129 It) Q)
~ 15 -0 ... 10 Q)
.D E 5 ::J z
0 0 4 8 12 16 20 24 28
Fracture Spacing (2ft bins)
Fig. 4. Frequency distribution of fracture spacing in Pit 20, MDA G. Data from Trocki (1976).
aperture is 3.1 ± 2.1 mm. Only 6% of the fractures are open I 0 mm or greater, with the largest opening of I 00 mm. Using an average fracture aperture of 4 mm and an average fracture spacing of about 3.7 ft (1.1 m), fractures occupy Jess than 0.5% of the walls.
Other Pajarito Plateau Studies. Fracture aperture data from MDA G were previously summarized by Purtymun and Kennedy ( 1971 ), who reported that fracture openings reached 2 inches (51 mm), with most Jess than 0.25 inches (6.4 mm). These values appear to be consistent with the Pit 39 data presented in this report, with average apertures of about 3 to 5 mm. In contrast, most other studies elsewhere on the Pajarito Plateau have reported greater average apertures. Yaniman and Wohletz ( 1 990) reported average fracture apertures of 18 mm in roadcuts along Pajarito Road west of
(ft) (degrees) (range) (average)
26 53 1-4 1.9±1.0 30 53 2-5 3.4 ± 1.0 32 51 3-6 4.5±0.9
21 64 0-6 2.8±1.8 20 54 1-5 2.7± 1.2
Ill Q) ... :::J
t> ltl ...
LL -0 ... Q)
..0 E :::J z
Ill
25
20
15
10
5
40
35
:E :::J 30 -u E 25 u. -~ 20 Q) ..0 E 15 :::J
z 10
5
0
Upper Walls
mean= 3.1 ± 2.1 mm median= 3 mm
n = 69
0 10 20 30 40 50 60 70 80 90 100110
Aperture (mm)
Lower Walls
mean= 5.3 ± 11.1 mm
median= 3 mm n = 122
0 10 20 30 40 50 60 70 80 90 100110
Aperture (mm)
Fig. 5. Frequency distributions of fracture apertures in Pit 39.
TA-54 and 9 mm along East Jemez Road, in units of the Bandelier Tuff stratigraphically above the units at TA-54. Wohletz (1995, 1996) reported background apertures averaging 7 to 8 mm along the walls of Los Alamos Canyon, and apertures
7

1eragmg 1 0 to 13 mm within broad zones of
gl,.. racture density. The average width of
r.,-going fractures in trenches on Pajarito
esa is ahout 2 em (Kolbe et al., 1994: Reneau et
.. 1995). and is similar to average fracture widths
·about I to 2 em in trenches at TA-63 (Kolbe et
.• 1995) and TA-3 (Purtymun et al.. 1995).
he reasons for the apparently lower fracture
)ertures in Pit 39 as compared to sites farther west
1 the Pajarito Plateau are not certain. Possible
tuses for wider fractures to the west include
) greater cooling contraction in more welded
1its to the west, and (2) more tectonic extension
'the west. closer to the Pajarito fault zone. It is
so possible that fractures tend to become more
Jen near cliff faces and mesa edges. as suggested
)'some workers (Conover, 1956, cited in Rogers.
n7, p. G-1; Kolbe et al., 1995). although this
10uld not apply to trenches excavated near the
~nters of mesas.
r~· ~e Orientation
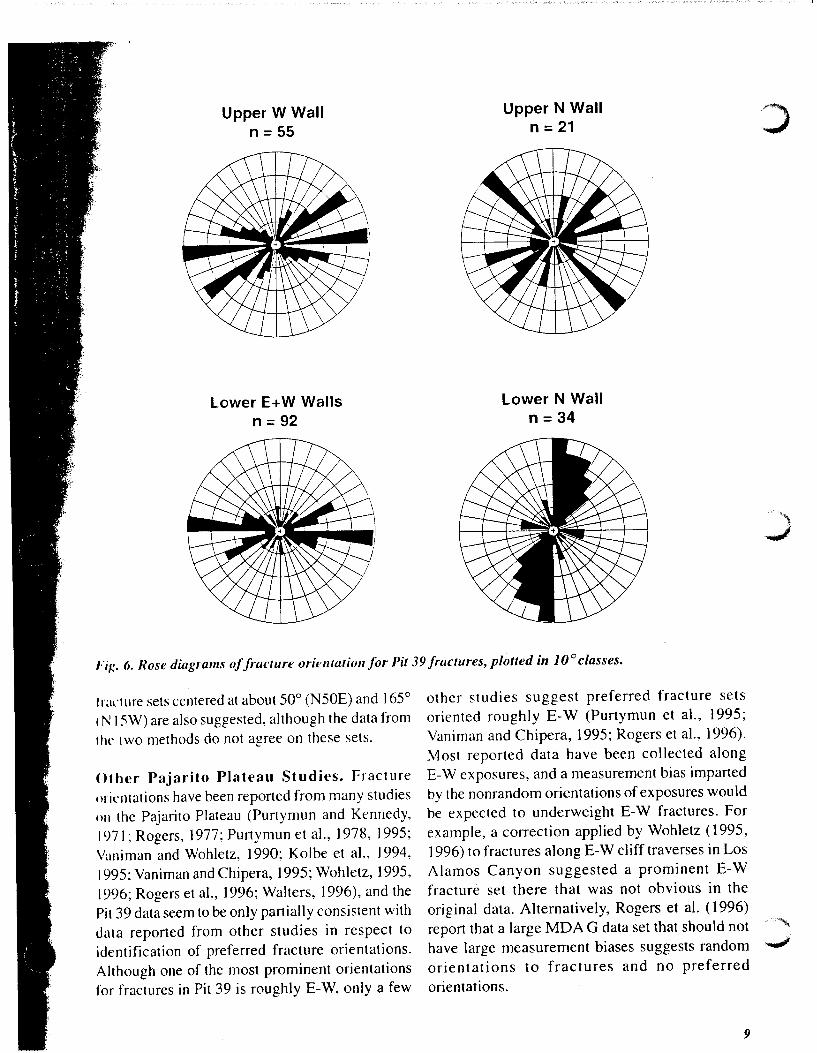
it~ A significant bias is apparent in the data on
acture orientation at Pit 39, reflecting the different
rientations of the measured walls. Specifically,
-W fracture sets are most apparent in the east and
est walls, which have general N-S orientations,
1d N-S fracture sets are most apparent in the north
·all. These biases can be seen in rose diagrams of
·acture azimuths plotted separately for each wall
::ig. 6). The existence of such an inherent bias
nparted by the nonrandom orientation of
1easured exposures has long been recognized (e.g.,
erzaghi, 1965), and corrections for this bias are
~eded to derive accurate data on preferred fracture
~ts. In this study, two methods were attempted to
::)ffect for this bias, as presented below.
he first method for correcting the fracture
rientation data assumed that combining
Jeasurements from both theE-Wand N-S trending
~~~· into one data set would approximate a
1~ distribution. Upper and lower walls were
·e~ separately, and the data from E-W walls
nd N-S walls were weighted equally so that the
larger number of fractures measured on N-S
trending walls would not dominate the results. The
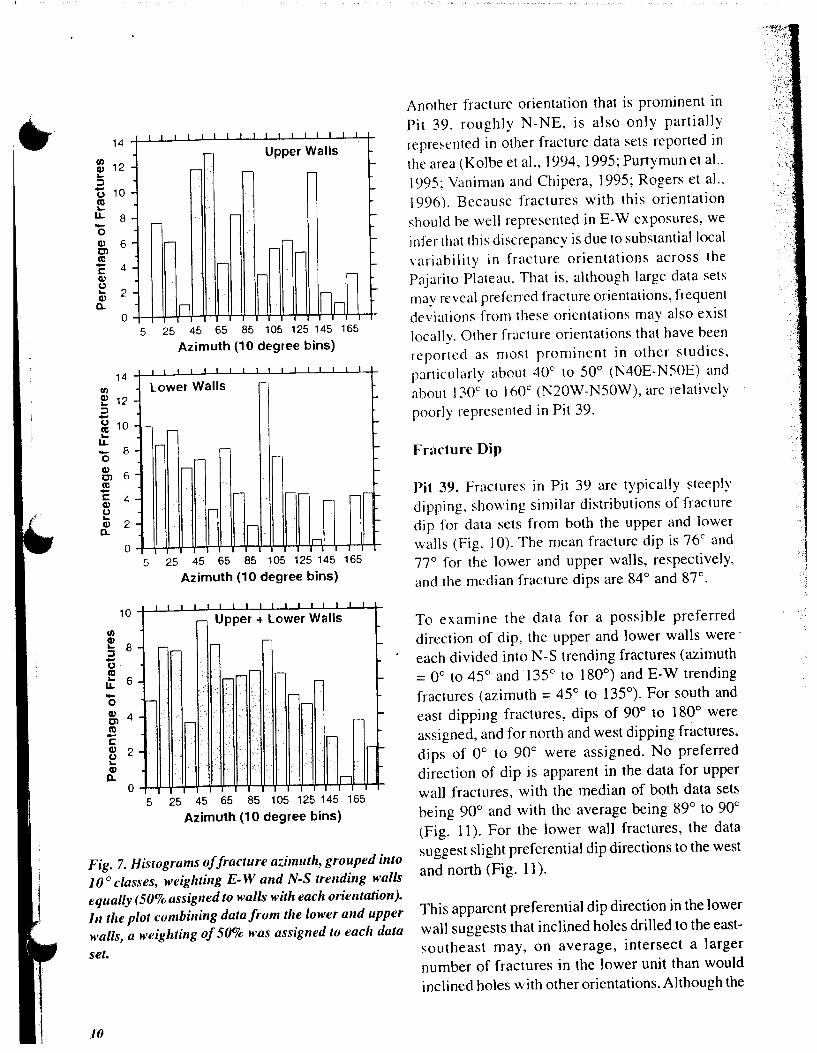
most common fracture orientations on the lower
wall are roughly E-W (9S0 azimuth, or N85W),
N-S (15°, Nl5E), and NE-SW (65°, N65E)
(Fig. 7). The most common orientations on the
upper wall are roughly NE-SW (50°, N50E), E-W
(85°, N85E), and NW-SE ( 135°, N45W) (Fig. 7).
Combining the data sets for the upper and lower
walls, again weighting each equally, suggests
fracture sets at about 20° (N20E), 50° (N50E). and
95o (N85W) (Fig. 7). although the small number
of fractures measured on some walls limits the
confidence in these values.
The second method for correcting for wall
orientation uses an equation provided by Terzaghi
( 1 965): N90 = Na I sin a,
where N90 is the number of fractures that would
have been intersected in an exposure oriented 90°
to the fracture set, and Na is the number of fractures
intersected in an exposure oriented at an angle a
to the fracture set. This equation was applied to
the data sets from each wall separately to check
for the reliability of this correction. Theoretically,
if the data sets are large enough to provide an
accurate sample of fractures in each data set, the
corrected fracture distributions from walls with
different orientations should be similar. As
presented in Figure 8, it is apparent that the
corrected data sets do not completely agree,
probably reflecting the relatively small number of
measured fractures on some walls. For example,
the apparent dominance of an E-W fracture set in
the lower N wall is produced by four fractures that
intersect this wall at a very low angle.
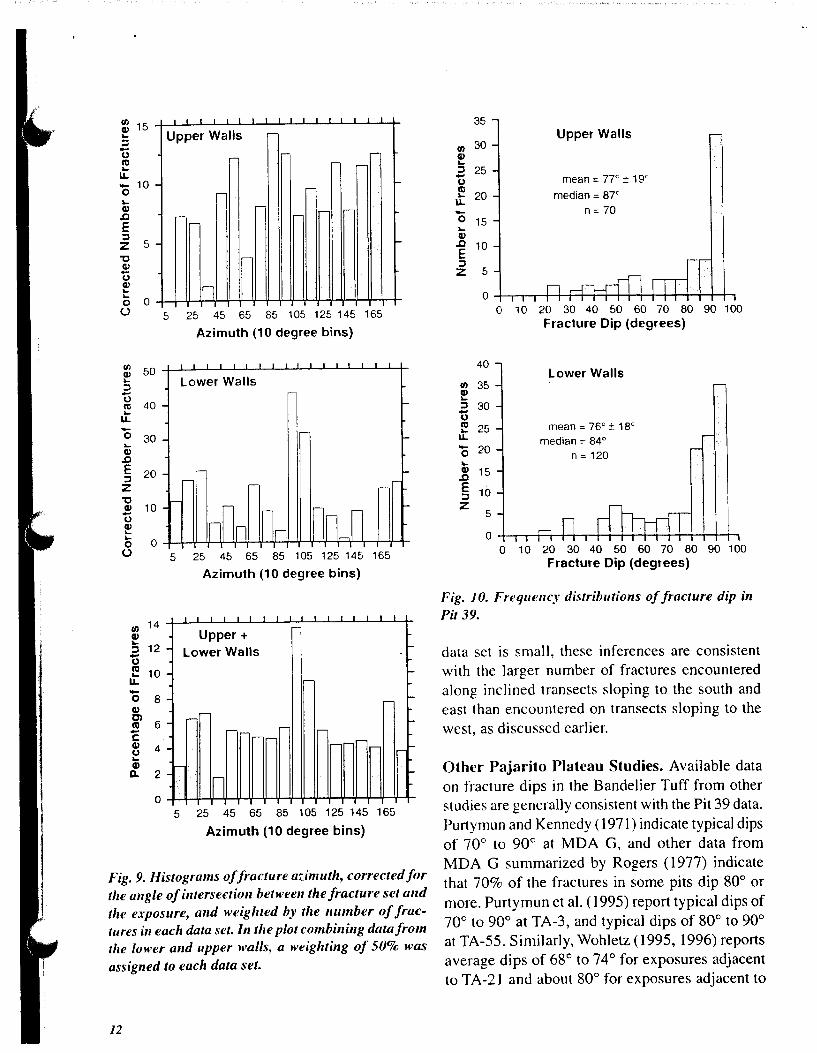
The fracture orientation data for each wall,
corrected for wall orientation, are summarized in
Figure 9. Comparing these data with the data
summarized in Figure 7 indicates that both methods
of adjusting the fracture data for biases show
fracture sets centered at about 95° (N85W) and 20°
(N20E), supporting the existence of significant
fracture sets with these orientations. Possible
•·
Upper W Wall n =55
Lower E+W Walls n = 92
Upper N Wall n = 21
Lower N Wall n = 34
ri~. 6. Rose diagrams of fracture orientation for Pit 39 fractures, plotted in 10 ° classes.
fracture sets centered at about 50° (N50E) and 165°
( N 15W) are also suggested, although the data from
the two methods do not agree on these sets.
Other Pajarito Plateau Studies. Fracture
orientations have been reported from many studies
on the Pajarito Plateau (Purtymun and Kennedy,
1971; Rogers, 1977; Purtymun et al., 1978, 1995;
Vaniman and Wohletz, 1 990; Kolbe et al., 1994,
1995; Vaniman and Chipera, 1995; Wohletz, 1995,
1996; Rogers et al., 1996; Walters, 1996), and the
Pit 39 data seem to be only partially consistent with
data reported from other studies in respect to
identification of preferred fracture orientations.
Although one of the most prominent orientations
for fractures in Pit 39 is roughly E-W, only a few
other studies suggest preferred fracture sets
oriented roughly E-W (Purtymun et al., 1995;
Vaniman and Chipera, 1995; Rogers et al., 1996).
Most reported data have been collected along
E-W exposures, and a measurement bias imparted
by the nonrandom orientations of exposures would
be expected to underweight E-W fractures. For
example, a correction applied by Wohletz (1995,
1 996) to fractures along E-W cliff traverses in Los
Alamos Canyon suggested a prominent E-W
fracture set there that was not obvious in the
original data. Alternatively, Rogers et al. ( 1996)
report that a large MDA G data set that should not
have large measurement biases suggests random
orientations to fractures and no preferred
orientations.
9
' I
14
1/) 12 Q) ...
:::l - 10 0 m ... u.. 8 -0 Q) Cl
6 m - 4 s::: Q) 0 ... 2 Q) a..
0
14 1/)
f: 12 :::l -~ 10 ... u.. - 8 0
~ 6 m "E 4 Q) 0 ... Q) 2 a..
1/) Q)
0
10
!:i 8 -0
E 6 u.. -0
~ 4 J!l s::: ~ 2 ... Q)
a.. 0
-
I I I I I I I I
Upper Walls
r- r-
~
,--
r- ,.--~ -
--
~ nn I
5 25 45 65 85 105 125 145 165
Azimuth (10 degree bins)
I
r
r
r
r
r
r
i_i
Lower Walls
.- r-
,.--
r- r-
~
- r-- -,-.....,
. .-. n
5 ~ ~ ~ ~ 1~1~1~1~
Azimuth (10 degree bins)
I I
r- Upper + Lower Walls
.--.-- .-- .-
,.-r-r- .-
,-,.-- ,.--.
.- ,.--
r-
In
5 25 45 65 85 105 125 145 165
Azimuth (10 degree bins)
r
-
-r
r
r-r
Fig. 7. Histograms of fracture azimuth, grouped into
10 ° classes, weighting E- W and N-S trending walls
equally (50% assigned to walls with each orientation).
In the plot combining data from the lower and upper
walls, a weighting of 50% was assigned to each data
set.
10
Another fracture orientation that is prominent in
Pit 39, roughly N-NE, is also only partially
represented in other fracture data sets reported in
the area (Kolbe et al., 1994, 1995; Purtymun et al..
I 995: Vaniman and Chipera, 1995; Rogers et al..
1996). Because fractures with this orientation
should be well represented in E-W exposures, we
infer that this discrepancy is due to substantial local
variability in fracture orientations across the
Pajarito Plateau. That is, although large data sets
may reveal preferred fracture orientations, frequent
deviations from these orientations may also exist
locally. Other fracture orientations that have been
reported as most prominent in other studies,
particularly about 40° to 50° (N40E-N50E) and
about I 30° to I 60° (N20W-N50W), are relatively
poorly represented in Pit 39.
Fracture Dip
Pit 39. Fractures in Pit 39 are typically steeply
dipping, showing similar distributions of fracture
dip for data sets from both the upper and lower
walls (Fig. I 0). The mean fracture dip is 76° and
77° for the lower and upper walls, respectively,
and the median fracture dips are 84° and 87°.
To examine the data for a possible preferred
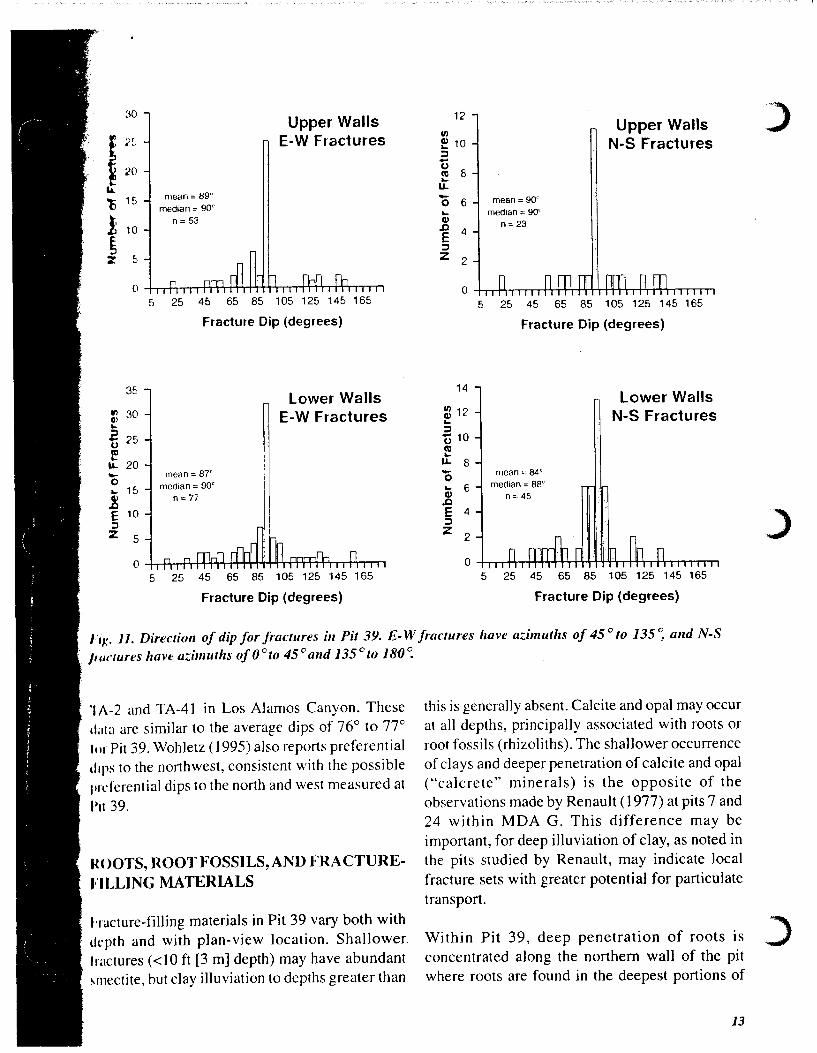
direction of dip, the upper and lower walls were·
each divided into N-S trending fractures (azimuth
= oo to 45° and 135° to 180°) and E-W trending
fractures (azimuth = 45° to 135°). For south and
east dipping fractures, dips of 90° to 1 80° were
assigned, and for north and west dipping fractures,
dips of 0° to 90° were assigned. No preferred
direction of dip is apparent in the data for upper
wall fractures, with the median of both data sets
being 90° and with the average being 89° to 90°
(Fig. 11 ). For the lower wall fractures, the data
suggest slight preferential dip directions to the west
and north (Fig. 11 ).
This apparent preferential dip direction in the lower
wall suggests that inclined holes drilled to the east
southeast may, on average, intersect a larger
number of fractures in the lower unit than would
inclined holes with other orientations. Although the
'· ~
,, f,
.. . ()
12
10
8
6
4
2
0
- I I
,.- Lower E Wall . r-
.
- r-
r-
-,- ..-, r-
r-
.ro J, D 5 25 45 65 85 105 125 145 165
Azimuth (10 degree bins)
I I I I I I I
Lower W Wall r-
r-,..- ,....
,..- ..-r
r
rn ir-1 In
r
r
r
r
r-
r
f-
f-
f-
r
._
~ 12 -f--L-L--'~-_l..L....J_l _ _l-L-_l..___j_.__.._t _ _j_..___lL-J...l-J..-L..J1~-+-
:; Upper W Wall '.-
'0 10 ca ... LL
- 8 0 ... ~ 6 E ~ 4 "C
r-' r 'r-
~ 2
lD lr11ro o o ++-rH:.....l!-+-ll,:.....l!--++-Y-rH-¥-++-+o 5
5
25 45 65 85 105 125 145 165
Azimuth (10 degree bins)
25 45 65 85 105 125 145 165
Azimuth (10 degree bins)
Fig. 8. Histograms of fracture azimuths for each wall, corrected for the angle of intersection between the
Jmcture set and the exposure. Wall az.imutlzs are 20°(N20E)for the east wall, 160°(N20W)for the west wall, "'\
tmd 100 ° ( N80W) for the north walL ,.J
11
II) 15 Q)
~
:l -0 m ~
u.. -0 10
~ Q)
.c E :l
5 z "C ~ 0 Q) .... .... 0 0 (.)
II) 14 Q) ~
12 :l -0 m 10 .... u.. -0 8 Q)
Cl 6 m -c
Q) 4 0 ~ Q)
c. 2
0
I I I
Upper Walls r-
r- ' r- r-
r-r-
r-r- .--
r-r-
r-
In 5 25 45 65 85 105 125 145 165
5
Azimuth (10 degree bins)
Lower Walls
25 45 65 85 105 125 145 165
Azimuth (10 degree bins)
1 I I I
Upper+ Lower Walls
-
-r-'
r-,-r-r-r- .--
,..-r-,
~
101
5 ~ ~ ~ ~ 1~1~1~1~
Azimuth (1 0 degree bins)
r
~
~ -~
~
r
.-~
Fig. 9. Histograms of fracture azimuth, corrected for the angle of intersection between the fracture set and the exposure, and weighted by the number of fractures in each data set. In tlze plot combining data from tlze lower and upper walls, a weighting of 50% was
assigned to each data set.
12
35
II) 30 Q) ~
:l 25 -0 m
20 ~
u.. -0 15 ~ Q) .c 10 E :l z 5
0
40
II) 35 Q) ~
:l 30 -0 m 25 ~
u.. - 20 0 ... Q) 15 .c E 10 :l z
5
0
0 10
Upper Walls
mean= 77' ± 19'
median= 87' n = 70
20 30 40 50 60 70 80 Fracture Dip (degrees)
Lower Walls
mean= 76' ± 18' median= 84°
n = 120
90 100
0 1 0 20 30 40 50 60 70 80 90 1 00 Fracture Dip (degrees)
Fig. 10. Frequency distributions of fracture dip in Pit 39.
data set is small, these inferences are consistent with the larger number of fractures encountered along inclined transects sloping to the south and east than encountered on transects sloping to the west, as discussed earlier.
Other Pajarito Plateau Studies. Available data on fracture dips in the Bandelier Tuff from other studies are generally consistent with the Pit 39 data.
Purtymun and Kennedy ( 1971) indicate typical dips of 70c to 90c at MDA G, and other data from
MDA G summarized by Rogers ( 1977) indicate that 70% of the fractures in some pits dip soc or
more. Purtymun et al. ( 1995) report typical dips of 70c to 90c at TA-3, and typical dips of soc to 90c at TA-55. Similarly, Wohletz (1995, 1996) reports average dips of 6Sc to 74c for exposures adjacent to TA-21 and about soc for exposures adjacent to
35
It) 30 I> ... .;! 0 25 ~ .....
I.L 20 -0 ... 15 .8 E 10 :::l z 5
0
mean= 89" median= 90'
n =53
Upper Walls E-W Fractures
5 25 45 65 85 105 125 145 165
Fracture Dip (degrees)
lower Walls E-W Fractures
mean= 87' median= 90'
n = 77
5 25 45 65 85 105 125 145 165
Fracture Dip (degrees)
12
1/)
~ 10 :::l
~ 8 ... LL
0 6 ... I> .c 4 E :::l z 2
14
l{l12 ... :::l 0 10 ~ ... I.L 8 -0 ... 6 I> .c E 4 :::l z
2
0
mean= 90' median= 90'
n = 23
Upper Walls N-S Fractures
5 25 45 65 85 105 125 145 165
Fracture Dip (degrees)
5
mean= 84' median= 88'
n = 45
lower Walls N-S Fractures
25 45 65 85 105 125 145 165
Fracture Dip (degrees)
IIJ:. JJ. Direction of dip for fractures in Pit 39. E- W fractures have azimuths of 45 ° to 135 ~ and N-S
Jwctures have azimuths of0°to 45°and 135°to 180~
·1 A-2 and TA-41 in Los Alamos Canyon. These
data are similar to the average dips of 76° to 77°
lm Pit 39. Wohletz ( 1995) also reports preferential
d1ps to the northwest, consistent with the possible
preferential dips to the north and west measured at
Pit 39.
IH >OTS, ROOT FOSSILS, AND FRACTURE
a:ILLJNG MATERIALS
hacture-filling materials in Pit 39 vary both with
depth and with plan-view location. Shallower.
fractures (<10ft [3 m] depth) may have abundant
"mectite, but clay illuviation to depths greater than
this is generally absent. Calcite and opal may occur
at all depths, principally associated with roots or
root fossils (rhizoliths). The shallower occurrence
of clays and deeper penetration of calcite and opal
("calcrete" minerals) is the opposite of the
observations made by Renault ( 1977) at pits 7 and
24 within MDA G. This difference may be
important, for deep illuviation of clay, as noted in
the pits studied by Renault, may indicate local
fracture sets with greater potential for particulate
transport.
Within Pit 39, deep penetration of roots is
concentrated along the northern wall of the pit
where roots are found in the deepest portions of
13
I I
the pit. Those roots that could be identified at this
depth are pinon roots (Martens, 1993). The
concentration of deep roots in this part of the pit
may indicate a fracture set along which deep water
transport has been concentrated.
Finely powdered tuff occurs in a number of
fractures at all depths and is admixed with a small
amount of calcite at shallower depths. This
powdered tuff consists of clay-sized particles but
appears to be the product of abrasive
disaggregation of the vapor-phase minerals and
perhaps of phenocrysts that line the fracture walls.
Fractures filled with such powdered material may
have experienced small amounts of displacement.
leading to desegregation of the friable tuff. Such
displacements are indicated by common minor
faults identified along the south side of Mesita del
Buev (Reneau et al., 1998).
Root-Feature Distributions
Occurrences of roots and root fossils were noted
during fracture mapping. These occurrences were
considered to be of some importance because of
the nonuniform distribution of root features and
the potential use of these features as indications of
water-bearing fracture systems. Because roots are
unlikely to penetrate deeply into fracture sets where
water is not available, the distributions of living
roots may provide one indication of water
transmissive fracture sets.
ln the northern part of Pit 39, living roots were
found in fractures as deep as the bottom of the pit
(45ft). This contrasts with the eastern and western
walls of the pit, where roots were not found at this
depth and root abundances at shallower levels were
minor. Figure 2B shows the distribution of those
fractures that contain roots. Although it is possible
that water might be transported uniformly through
all fractures transecting the pit, with a chance
increase in root abundance to the north, we feel
that the nonuniformity in root distributions is not
fortuitous.
14
Although root distributions are inferred to indicate
those fractures in which deep infiltration was most
prominent prior to the excavation of Pit 39, it is
possible that excavation has disturbed the fracture
systems intersecting the pit walL and fracture
transport in the future will not be the same as in
the past. The Seamist monitoring system emplaced
in the pit may provide useful information on
whether such disturbance has occurred. The results
of this monitoring may be useful for evaluation
not only of Pit 39, but also of future pit excavations.
l\1ineralog~' of Fracture Fillings
Several fracture fillings were analyzed by XRD to
determine their mineralogy. The fracture fillings
chosen for analysis are those that are typical of the
fractures mapped. and their locations are shown
on Figure 2A. These analyses are summarized
below.
I) Samples F138 (fracture filling at 1ft depth. west
wall of pit) and F1 I (fracture fi1lin2 at 41 ft depth.
east wall of pit)
These are fine-grained, gray powders that occur in
both shallow and deep fractures but are most typical
of the deeper (>20 ft, 6 m) fracture fillings. The
extremely fine-grained nature of these fracture
filling powders was suggestive of clay mineralogy
in the field. However, XRD analysis shows that
there is essentially no clay in these powders, and
they consist mostly of very fine-grained material
derived from the surrounding devitrified tuff.
Nevertheless, the feldspar and silica-mineral
particles that make up these powders are very fine
grained (1 to 10 J.lm) and most of the fragments
are clay-sized ( <4 J.lm).
The shallow gray-powder fracture sample (F138)
consists of powdered feldspars, tridymite, quartz,
cristobalite, and calcite with minor amounts of
gypsum and hematite. Clay separation methods
(grinding and centrifugation) yielded a very small
proportion of smectite and kaolinite, both poorly
rv-;t;llline. The principal authigenic mineral at this
•IJ;dlow depth (1ft 0.3 m) is therefore .calcite, with
tnurh smaller amounts of smectite. Gypsum may
· 11rtroduced as an eolian component.
'l'hl' deeper gray-powder fracture sample (Fll)
( "nsists almost entirely of powdered feldspars,
ltHiymite, quartz, and cristobalite with minor
illllounts of hematite. The only authigenic mineral
pll·srnt at this greater depth (41 ft 12.5 m) is
rakite. which occurs in minor amounts.
:'1 ,5;rmple Fl42 (clav-rich fracture filling at 1 ft
Llt11th, west wall of pit)
This sample is from a thick (5 em) surface
t·rllargement of a fracture that closes down to
t\ rnm within a few ft from the surface. The upper
day filling of the wider fracture is predominantly
'lllcctite, with minor amounts of detrital feldspars,
tridymite, quartz, cristobalite. and hematite with
-.ome authigenic calcite. There are traces of gypsum
,,~ well, perhaps introduced as an eolian
t·omponent. The dominance of smectite and the
11ature of the secondary mineralogic components
111 this sample are consistent with results of other
qudies on the Pajarito Plateau (Renault, 1977;
Davenport, 1993; Davenport et al., 1995; Vaniman
und Chipera, 1995).
~)Sample F61 (thin fracture-wall coating at 42ft
depth, north wall of pit)
Thin coatings ( 1 to 3 mm) such as this occur on
several fracture walls at depth and are typically
associated with root and root fossil occurrences.
This coating predominantly consists of calcite with
some opal-A.
4) Sample F44 (root fossil at 17ft depth, NE comer
Q[pill
This sample of a wel1-fossilized root consists
entirely of opal-A.
ChemistQ' of Root Features
Both living roots and root fossils were examined
using a SEM. Root-fossil formation incJudes calcite
and opal precipitation within root cavities, around
root walls, and replacing root cell structures.
Calcite predominates, either as micrite grains or
as needle-fiber crystals (1 to 5 J.lm wide and up to
100 J.lm long). The needle-fiber form is
characteristic of fungal activity during root decay.
Advanced stages of root fossilization (e.g., sample
F44, described above) can result in complete
replacement of the root structure by opal-A.
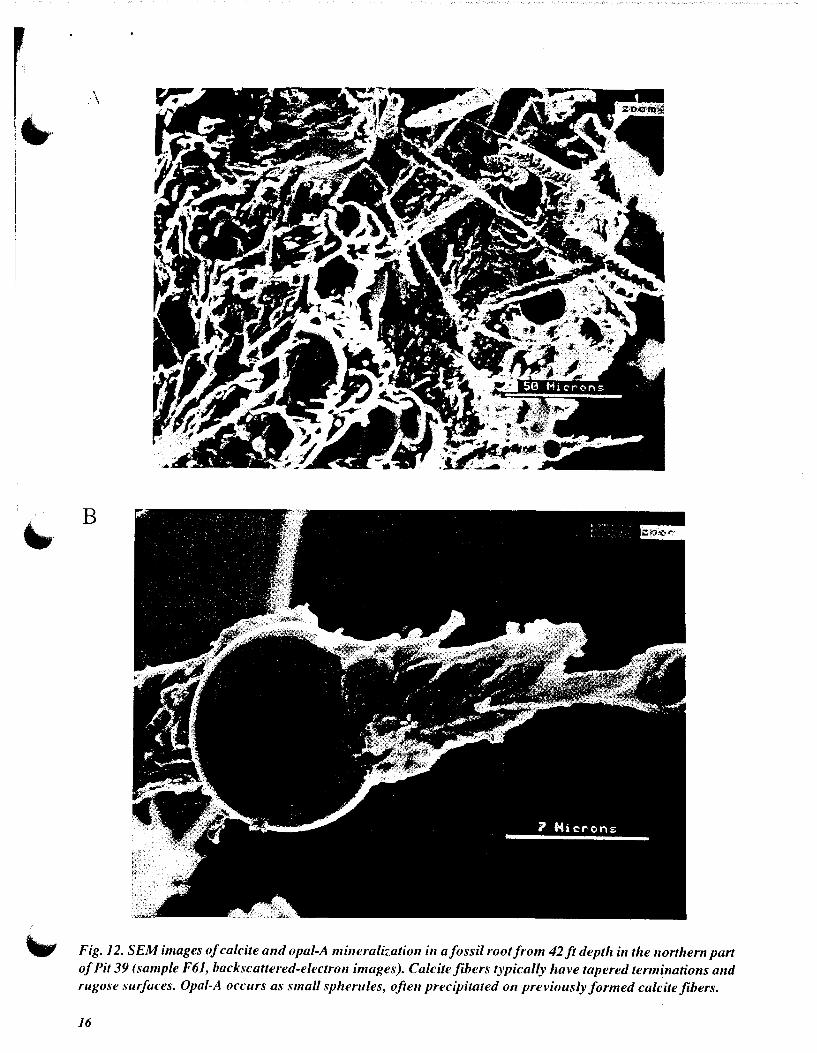
Figure 12 illustrates the morphology of calcite
needles and of opal-A spherules in a root fossil
from fracture F61, at 42 ft (12.8 m) depth on the
north wall of Pit 39. Literature data on needle-fiber
cakites typically show fibers with smooth or
serrated outer surfaces (Verrecchia and Verrecchia,
1994), in contrast to the rugose fiber surfaces seen
in Figure 12. The rugose surfaces and large
diameters (up to 7!lm) of needle-fiber cakites from
Pit 39 indicate that the original fungal forms have
been coated by later calcite precipitation.
Clay i11uviation is common at depths up to 10 ft
(3.0 m) but is rare or absent in the lower portions
of the pit. Extensive cakite and opal-A deposition
occurs around living roots and as root fossils in
this upper (10ft, 3 m) zone. Mineralization is less
abundant at greater depths (with the exception of
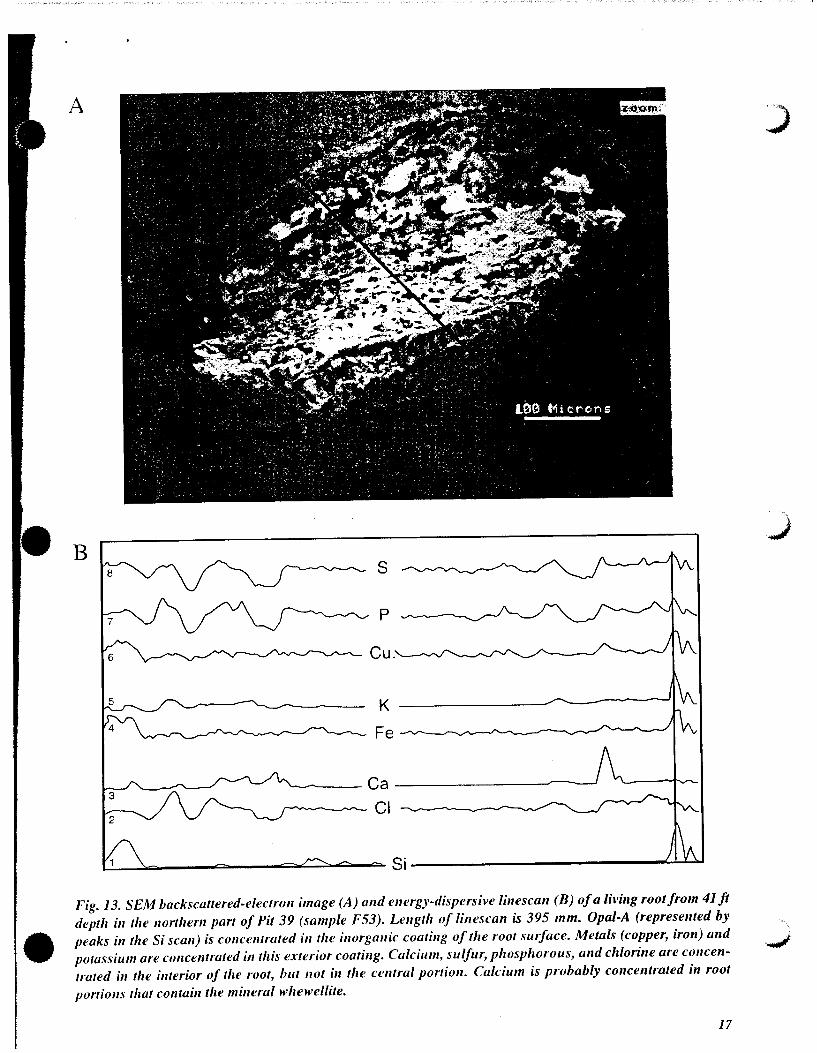
a few fractures in the north wall). Energy
dispersive linescans across living root segments
from the deeper portions of the north wall
(Fig. 13) show that the cores of living roots from
the pit bottom are dominantly Ca-rich; from other
studies of pifion and juniper roots, it is likely that
all of theCa observed is present within the mineral
whewellite (CaC20 4·H20) or in amorphous forms
associated with P, Cl, and S (Vaniman et al., 1995).
Opal-A (amorphous Si02) is concentrated on the
exterior surfaces of the roots. At Pit 39 there is
little cakite associated with the living roots prior
to fossilization. Calcium and silicon, the two
15
)
-.,.
.\
B
Fig. 12. SEM images of calcite and opal-A m ineralhation in a fossil root from 42ft depth in the northern part of Pit 39 (sample F61, backscattered-electron images). Calcite fibers typically have tapered terminations and rugose surfaces. Opal-A occurs as small spherules, often precipitated 011 previously formed calcite fibers.
16
•
A
B
K
Fe~--~~-J~--~~~~~~~~
'------Ca------------------' Cl
Fig. 13. SEM backscattered-electron image (A) and energy-dispersive linescan (B) of a living root from 41ft
depth in the northern part of Pit 39 (sample F53). Length of linescan is 395 mm. Opal-A (represented by
peaks in the Si scan) is concenrrated in the inorganic coating of the root surface. Metals (copper, iron) and
potassium are concentrated in this exterior coating. Calcium, sulfur, phosphorous, and chlorine are concen
trated in the interior of the root, but not in the antral portion. Calcium is probably concentrated in root
portions thai contain the mineral whewellite.
17
clements associated with whewellite and opaL are
A..... predominant. but some trace elements appear to
W" he correlated with certain root portions:
1) CL P. and S are concentrated \:vithin portions of
the root interiors.
2) Heavier metals (Fe. Zn. Cu) and K are
concentrated in the inorganic opaline coatings on
the root surfaces.
Root chemistry. especially metal retention effects
and possible metal complexation around roots, may
he an important factor in long-term contaminant
transport interactions.
Jmplin1tions of Mint>ralogic and Root Studies
Mineralogic qudies of fracture fillings suggest that
deep (>:20ft. 6 m) fracture fillings consist only of
powdered tuff unless root penetration and the
products of root decay introduce calcite and. to a
' Jesser extent. opal-A as biologic:.JIIy mediated
-.,,precipitates. Such deep mineral deposits in
fractures are limited to the northern pm1 of Pit 39,
where penetration by living roots is common. This
northern part of the pit may mark a zone of
infiltration of water from the surface.
Clay minerals-predominantly smectite, with rare
kaolinite-are abundant only in the near-surface:
downward transport of clay-size particles by
illuviation is largely ineffective over distances
greater than 10ft (3m) at Pit 39.
The origins of the fine gray tuff powder that occurs
in several other fractures in various parts of the pit
are somewhat enigmatic. The absence of clay
illuviation to depths where these powders are
common indicates that they are not formed by
winnowing and downward filtration of tuff fines.
Local abrasion and size reduction of the friable host
tuff along preferred fractures is a more likely
explanation. This explanation, however, requires
-..,some differential movement along the fractures that
contain the powders. These fractures may therefore
be those that have moved to accommodate
dispersed fault offsets, as seen in offset surge beds
18
in the cliff margin ;tlont' the south side of Mesita
del Buey (Renc;lll ct al.. 1 t)t)X ). The amount of
fracture movement required to create these
powders need not he great. for the particle size
range (I to 10 11m) is not si)2nifieantly smaller than
that of the fine-grained devitrification crystals that
form the matrix of the host tuff.
SUMMARY
Pit 39 at MDA G. TA-54. exposes two ash flows
within unit 2 of the Tshirege Member of the
Bandelier Tuff: fractures were mapped and
described within each flow unit. The fractures are
generally qeeply dipping, with mean dips of 76°
and 77c and median dips of 84° and 87° for the
lower and upper flow units, respectively.
Preferential dips to the north and east in the lower
unit are suggeqed by the data, in turn suggesting
that inclined drill holes oriented to the southeast
may optimize intersections with fractures. Fracture
apertures are typically small, with median value~
of about 3 mm for both units and average aperture~
of 3 to 5 mm. Average fracture spacing ranges from
3.2 to 4.2 ft ( 1.0 to 1.3 m), and median fracture
spacing ranges from 1.9 to 4.0 ft (0.6 to 1.2 m).
Slight differences are suggested between fracture
spacing between the upper and lower units, with a
higher percentage of fracture spacings under 2 ft
(0.6 m) and a higher maximum fracture spacing
(14ft, 4.3 m) in the upper unit, although average
spacing is similar between the units.
The measurements of fracture dip and aperture at
Pit 39 appear to be consistent with previous
measurements from other pits at MDA G. The
measurements of fracture spacing at Pit 39,
however, indicate more closely spaced fractures
than recorded at other pits, although the Pit 39 data
are similar to data from horizontal core holes
obtained beneath Pit 3 at MDA G (Purtymun et
al., 1978). This discrepancy may be due to an
incomplete logging of minor fractures in the pit
walls in previous studies.
Data on fracture orientation from Pit 39 suggest
fracture sets centered at about 95° (N85W) and 20°
•
(N20E) azimuth, with possible additional fracture
sets centered at about 50° (N50E) and 165°
(N 15W). However, these data may not be reliable
due to the small sample size and the need to correct
for biases imparted by the nonrandom orientation
of pit walls. Similar biases have probably affected
other data sets on fracture orientation from the
Bandelier Tuff. For example, the most prominent
fracture set at Pit 39, with extensive north-south
walls, is oriented roughly east-west, whereas other
fracture data obtained from east-west transects do
not show prominent east-west fracture sets, a bias
also shown by Rogers et al. ( 1996).
The minerals and roots that fill or line fractures
provide information on the depths and nature of
potential transport, as well as on possible offset
along fractures. Root penetration to the bottom of
the pit can be used to infer fracture zones that held
intermittent water prior to pit excavation: roots are
unlikely to have penetrated to this depth if the
fractures were permanently dry. However, the
general absence of clay illuviation in any fractures
to depths > 10 to 20 ft (3 to 6 m) suggests that
particulate transport has not been effective in any
of the fractures or fracture sets at Pit 39. Fractures
that generally Jack authigenic minerals but are filled
with powdered tuff may have suffered small-scale
displacements sufficient to disaggregate the wall
rock tuff.
ACKNOWLEDGMENTS
The authors thank Dave Broxton for assistance with
the field work; Anthony Garcia and John Carney
for figure preparation; Steve Chipera for XRD
analyses; Steve Francis for arranging access to Pit
39; Jamie Gardner, Bob Gilkeson, Diana Ho11is,
Don Krier, Don Neeper, and Cheryl Rofer for
providing encouragement and support for this
study; Scott Martens for root identification; Mable
Amador for editing; Lanny Piotrowski for
compositing of the final report; and Giday
WoldeGabriel for review comments. This work was
supported by the Los Alamos National Laboratory
Environmental Restoration Project, as part of site
characterization activities for TA-54 (Operable
Unit 1 1 48) and the Framework Studies program
within the Earth Science Technical Team.
REFERENCES
Broxton. D. E., and Reneau, S. L., 1995,
Stratigraphic Nomenclature of the Bandelier Tuff
for the Environmental Restoration Project at Los
Alamos National Laboratory: Los Alamos National
Laboratory report LA-13010-MS, Los Alamos,
New Mexico, 21 pp.
Davenport, D. W., 1993, Micromorphology,
Mineralogy, and Genesis of Soils and Fracture Fills
on the Pajarito Plateau, New Mexico: Ph.D. thesis,
Texas Tech University, Lubbock, 109 pp.
Davenport, D. W., Wilcox, B. P., and Allen. B. L, I 995, Micromorphology of Pedogenically Derived
Fracture Fills in Bandelier Tuff, New Mexico: Soil
Science Society of America Journal, v. 59,
pp. 1672-1683.
Kolbe, T., Sawyer, J., Gorton, A, Olig, S., Simpson,
D., Fenton, C., Reneau, S., Carney, J., Bott, J., and
Wong, I., 1994, Evaluation of the Potential for
Surface Faulting at the Proposed Mixed Waste
Disposal Facility, TA-67: Woodward-Clyde
Federal Services, Oakland, California, 3 volumes.
Kolbe, T., Sawyer, J., Springer, J., Olig, S., Reneau,
S., Hemphill-Haley, M., and Wong, 1., 1995,
Evaluation of the Potential for Surface Faulting at
TA-63: Woodward-Clyde Federal Services,
Oakland, California.
Martens, S., 1993, personnel communication, Los
Alamos National Laboratory.
Neeper, D. A., and Gilkeson, R. H., 1996, The
Influence of Topography, Stratigraphy, and
Barometric Venting on the Hydrology of
Unsaturated Bandelier Tuff, in Goff, F., Kues, B .
S., Rogers, M.A., McFadden, L. D., and Gardner,
J. N ., Eds., The Jemez Mountains Region: New
Mexico Geological Society Forty-Seventh Annual
Field Conference Guidebook, pp. 427--432.
19
l'urt~·rnun. W. D .. and Kennedy. W. R., 1971, (leo logy and llydrology of Mesita del Buey: Los Alamos Scrcntific Lahoratory report LA-4660, Los Alamos. New Mexico. 12 pp.
Purtymun. W. D .. Wheeler. M. L.. and Rogers, M. !\ .. 197R. Geologic Description of Cores from Holes P-3 MH-1 through P-3 MH-5. Area G, Technical Area 54: Los Alamos Scientific Lahoratory informal report LA-7308-MS. Los Alamos. New Mexico, 13 pp.
Purtymun. W. D., Koenig, E., Morgan. T.. and Sagon, E., 1995, Joint Orientations and Characteristics as Observed in a Trench Excavated near TA-3 and a Basement Excavated at TA-55: Los Alamos National Laboratory report LA-13036-MS, Los Alamos, New Mexico. 42 pp.
Renault, J., 1977, Report on the Examination of Fracture Fillings in Disposal Pits No. 7 and No. 24, Los Alamos Scientific Laboratory. in Rogers, M.A., Ed., History and Environmental Setting of LASL Near-Surface Land Disposal Facilities for Radioactive Wastes (Areas A, B, C, D, E, F, G, and T): A Source Document: Los Alamos Scientific Laboratory informal report LA-6848-MS, Los Alamos, New Mexico, v. I, pp. G-73-G-80.
Reneau, S. L., Kolbe, T., Simpson, D., Carney. J. S., Gardner, J. N., Olig, S. S., and Vaniman, D. T., 1995, Surficial Materials and Structure at Pajarito Mesa, in Reneau, S. L., and Raymond, R., Jr., Eds., Geological Site Characterization for the Proposed Mixed Waste Disposal Facility, Los Alamos National Laboratory: Los Alamos National Laboratory report LA-13089-MS, Los Alamos, New Mexico, pp. 31-69.
Reneau, S. L., Broxton, D. E., Carney, J. S., and LaDelfe, C., 1998, Structure of the Tshirege Member of the Bandelier Tuff at Mesita del Buey, Technical Area 54, Los Alamos National Laboratory: Los Alamos National Laboratory report LA-13538-MS, Los Alamos, New Mexico.
20
Rogers, M.A., 1977, History and Environmental Setting of LASL Near-Surface Land Disposal Facilities for Radioactive Wastes (Areas A, B, C, D, E, F, G, and T): A Source Document: Los Alamos Scientific Laboratory informal report LA-6848-MS, v. I, Los Alamos, New Mexico.
Rogers, M. A., 1995, Geologic Map of the Los Alamos National Laboratory Reservation: New Mexico Environment Department, Santa Fe.
Rogers, M.A., Budding, K. E., and Christie, C. V. L., 1996, Distinguishing Tectonic Joints from Cooling Joints in the Bandelier Tuff (Pleistocene), Pajarito Plateau, Los Alamos County, New Mexico, in Goff, F., Kues, B.S., Rogers, M.A., McFadden, L. D., and Gardner, J. N ., Eds., The Jemez Mountains Region: New Mexico Geological Society Forty-Seventh Annual Field Conference Guidebook, pp. 293-301.
Terzaghi, R. D., 1965, Sources of Error in Joint Surveys: Geotechnique, v. 5, pp. 287-304.
Trocki, L., 1976, Los Alamos Scientific Laboratory internal memo to Margaret Anne Rogers, January 8, 1976, Subject: Photographs of Pit 20, TA-54, with Geologic Explanations. Symbol: HS-7-76.
Turin, H. J., and Rosenberg, N. D., 1996, A Conceptual Model for Flow in the Vadose Zone beneath the Finger Mesas of the Pajarito Plateau, in Goff, F., Kues, B.S., Rogers, M.A., McFadden, L. D., and Gardner, J. N., Eds., The Jemez Mountains Region: New Mexico Geological Society Forty-Seventh Annual Field Conference Guidebook, pp. 74-76.
Vaniman, D., and Chipera, S., 1995, MesaPenetrating Fractures, Fracture Mineralogy, and Projected Fault Traces at Pajarito Mesa, in Reneau, S. L., and Raymond, R., Jr., Eds., Geological Site Characterization for the Proposed Mixed Waste Disposal Facility: Los Alamos National Laboratory report LA-13089-MS, Los Alamos, New Mexico, pp. 71-85.
V;111irnan, D., and Wohletz, K., 1990, Results from
< icologic Mapping and Fracture Measurements
:11ound the TA-55 Area: Los Alamos National
l.ahoratory memo EES 1-SH90-17, Los Alamos,
New Mexico, 23 pp.
Vaniman, D., Chipera, S .. and Bish, D. L., 1995.
l'ct rography, Mineralogy, and Chemistry of
C.dcite-Silica Deposits at Exile Hill, Nevada.
<'om pared with Local Spring Deposits: Los
/\l;m1os National Laboratory report LA- I 3096-
MS. Los Alamos, New Mexico, 70 pp.
Vnrecchia, E. P., and Verrecchia, K. E., 1994,
Needle-Fiber Calcite: A Critical Review and
Proposed Classification: Journal of Sedimentary
Research, v. A64, pp. 650-664.
Walters, M. C., 1996, Fracture Analysis of the
Bandelier Tuff, Pajarito Plateau, North-Central Rio
Grande Rift, New Mexico: M.S. thesis, Texas
Christian University, Forth Worth, 91 pp.
Wohletz, K., 1995, Measurement and Analysis of
Rock Fractures in the Tshirege Member of the
Bandelier Tuff along Los Alamos Canyon Adjacent
to TA-21, in Broxton, D. E., and Eller, P. G., Eds.,
Earth Science Investigations For Environmental
Restoration-Los Alamos National Laboratory
Technical Area 21: Los Alamos National
Laboratory report LA-12934-MS, Los Alamos,
New Mexico, pp. 10-31.
Wohletz, K., 1996, Fracture Characterization of the
Bandelier Tuff in OU-1098 (TA-2 and TA-41 ): Los
Alamos National Laboratory Report LA-13194-
MS, Los Alamos, New Mexico, 19 pp.
I I
)
21
This report has been reproduced directly from the best available copy.
lt is available to DOE and DOE contractors from the Office of Scientific and Technical Information, P.O. Box 62, Oak Ridge, TN 37831. Prices are available from (423) 576-8401. http://www .doe.govlbridge
lt is available to the public from the National Technical Information Service, US Department of Commerce, 5285 Port Royal Rd., Springfield, VA 22616, (800) 553-6847.