Embed Size (px)
Citation preview
Session 13 L, Big Data, Behavioral Data and Predicting Health Outcomes
Moderator/Presenter:
James C. Guszcza, Ph.D., FCAS
Presenter: Ian G. Duncan, FSA, FIA, FCIA, MAAA
BIG DATA IN HEALTHCARE
Ian Duncan FSA FIA FCIA FCA MAAA
Agenda
1. Data has transformed business
2. ….but not Healthcare
3. A new approach to predictive modeling.
4. Case Study: End-of-Life
2
IntroductionsIan Duncan, FSA, FIA, FCIA, MAAA
• Professor, Actuarial Statistics, University of California at Santa Barbara.
• Founder and former president, Solucia Consulting (now SCIO Health Analytics).
• Author of several books and a number of peer-reviewed studies on healthcare management and predictive modeling
• Board member, Society of Actuaries.
2nd Edition 2014
3
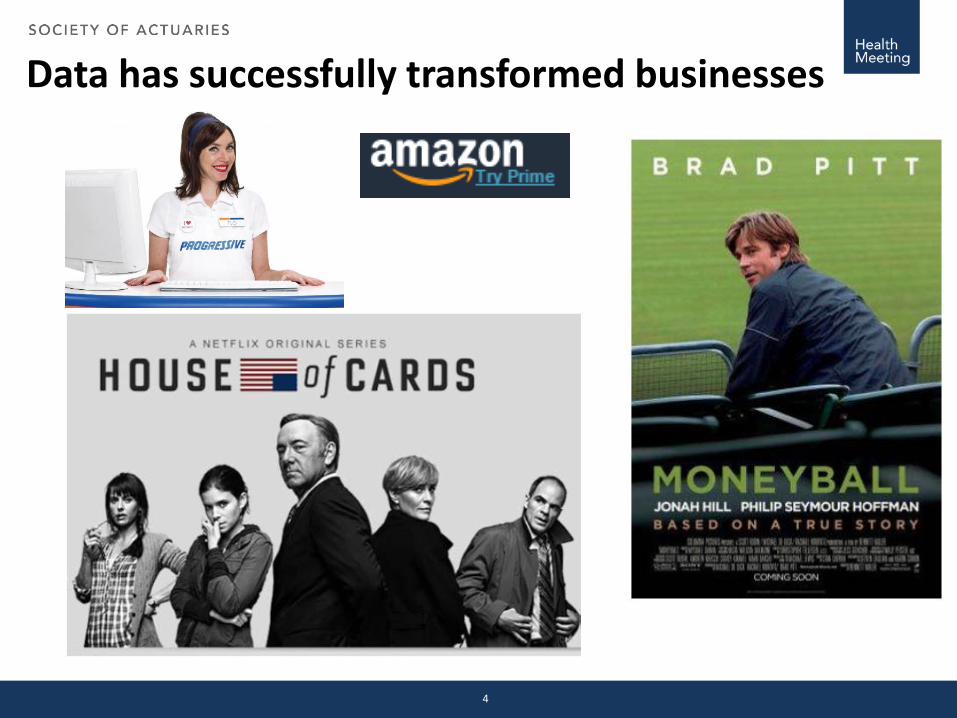
Data has successfully transformed businesses
4
Many reasons why data hasn’t transformed healthcare
• Medicine is complicated; so are medical data; we generally don’t have integrated datasets.
• The best models aren’t very good yet.
• People would rather trust their own judgment.
• We often focus on things that will not produce immediate returns.
• The “Last Mile” Problem: we don’t have very good behavioral models and behavior change programs. We can find risky patients (sometimes); we just don’t always know what to do with them.
• While we have many outcomes studies, its hard to know what works.
• It is very difficult to implement and manage an outcome-effective, cost-effective program of sufficient scale.
5
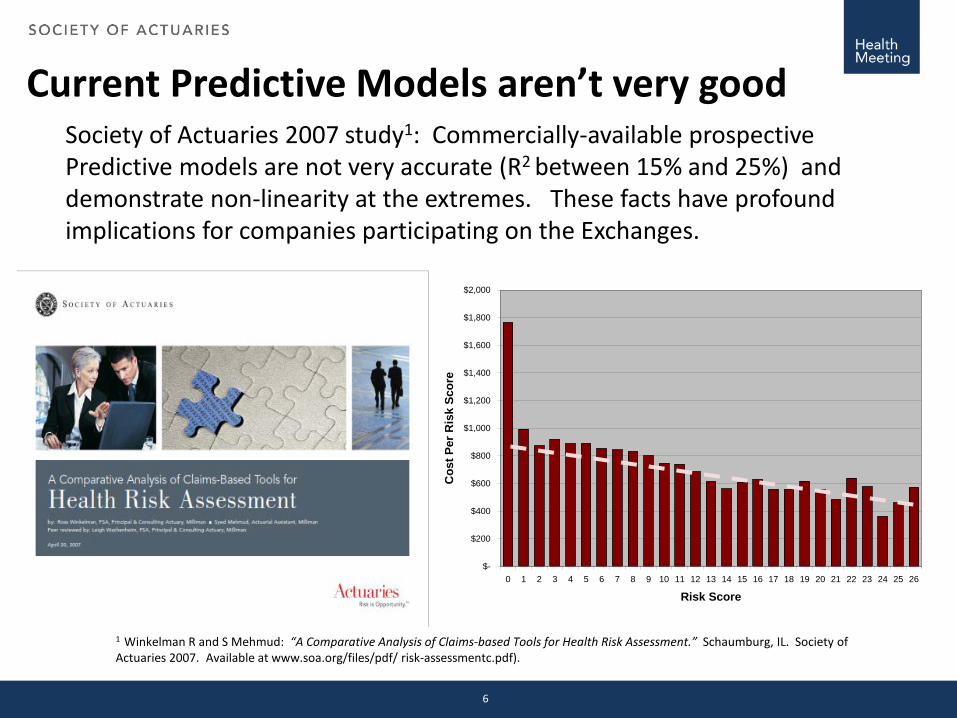
Current Predictive Models aren’t very goodSociety of Actuaries 2007 study1: Commercially-available prospective Predictive models are not very accurate (R2 between 15% and 25%) and demonstrate non-linearity at the extremes. These facts have profound implications for companies participating on the Exchanges.
1 Winkelman R and S Mehmud: “A Comparative Analysis of Claims-based Tools for Health Risk Assessment.” Schaumburg, IL. Society of Actuaries 2007. Available at www.soa.org/files/pdf/ risk-assessmentc.pdf).
$-
$200
$400
$600
$800
$1,000
$1,200
$1,400
$1,600
$1,800
$2,000
0 1 2 3 4 5 6 7 8 9 10 11 12 13 14 15 16 17 18 19 20 21 22 23 24 25 26
Risk Score
Cos
t Per
Ris
k Sc
ore
6
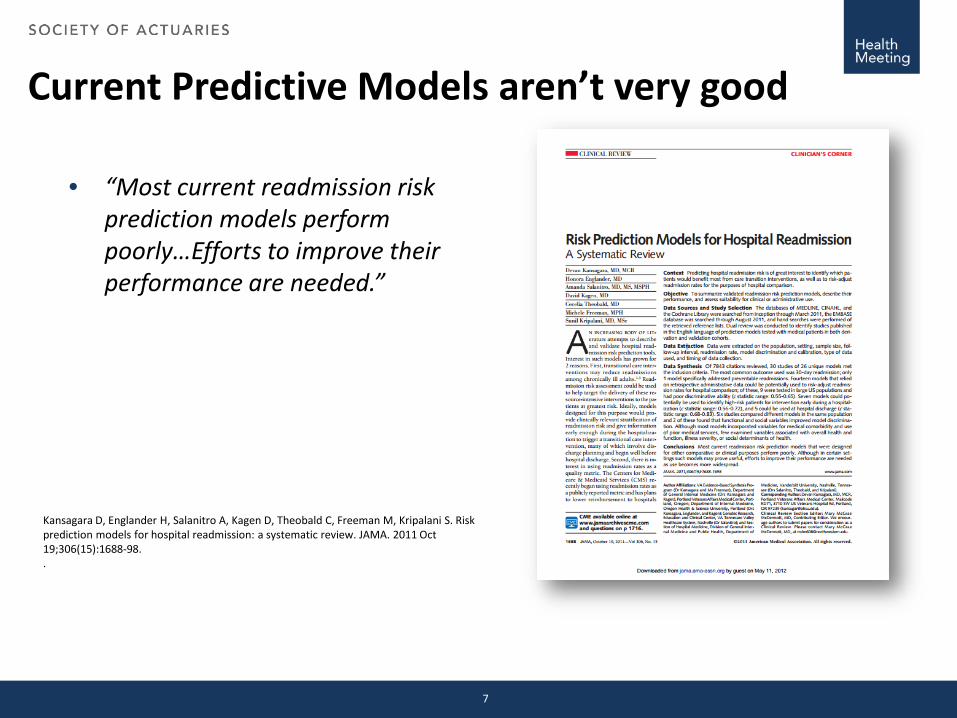
Current Predictive Models aren’t very good
• “Most current readmission risk prediction models perform poorly…Efforts to improve their performance are needed.”
Kansagara D, Englander H, Salanitro A, Kagen D, Theobald C, Freeman M, Kripalani S. Risk prediction models for hospital readmission: a systematic review. JAMA. 2011 Oct 19;306(15):1688-98..
7
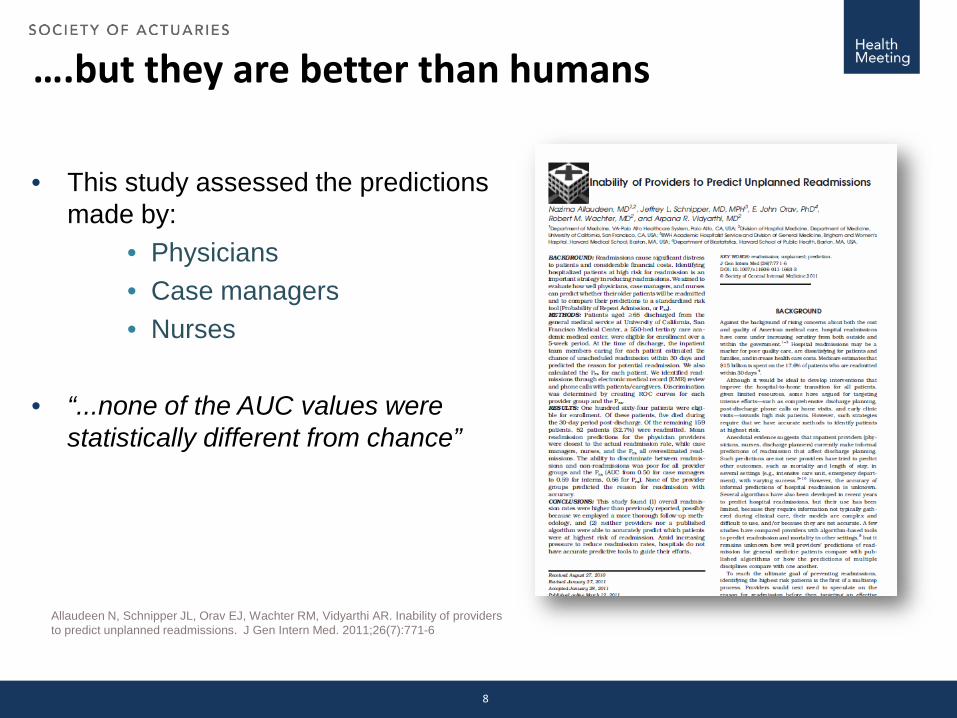
….but they are better than humans
• This study assessed the predictions made by:
• Physicians• Case managers• Nurses
• “...none of the AUC values were statistically different from chance”
Allaudeen N, Schnipper JL, Orav EJ, Wachter RM, Vidyarthi AR. Inability of providers to predict unplanned readmissions. J Gen Intern Med. 2011;26(7):771-6
8
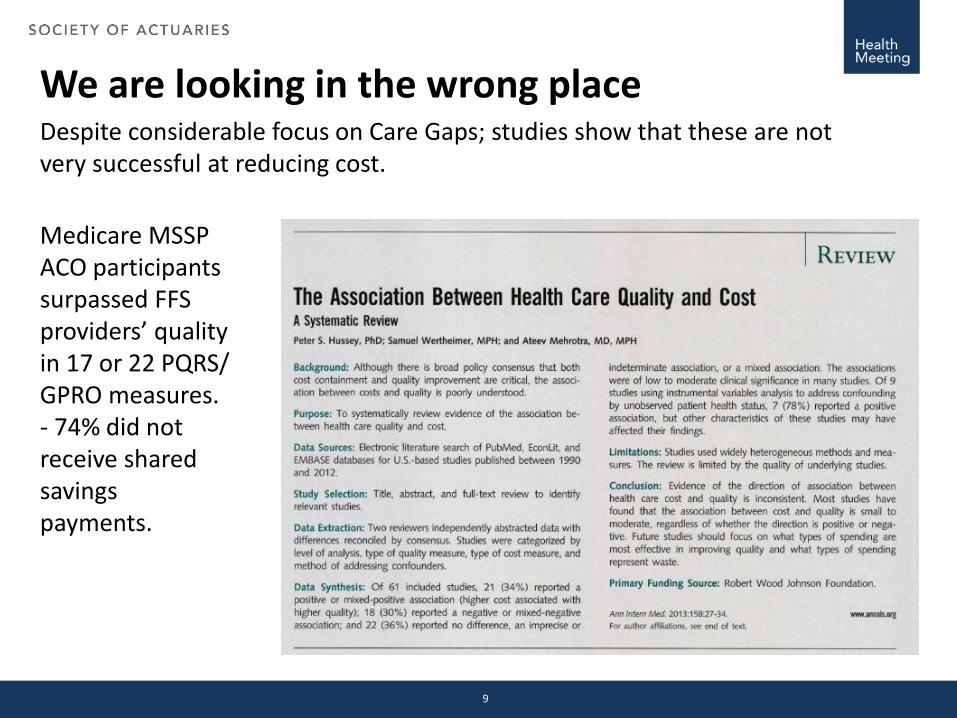
We are looking in the wrong placeDespite considerable focus on Care Gaps; studies show that these are not very successful at reducing cost.
Medicare MSSP ACO participants surpassed FFS providers’ quality in 17 or 22 PQRS/ GPRO measures.- 74% did not receive shared savings payments.
9
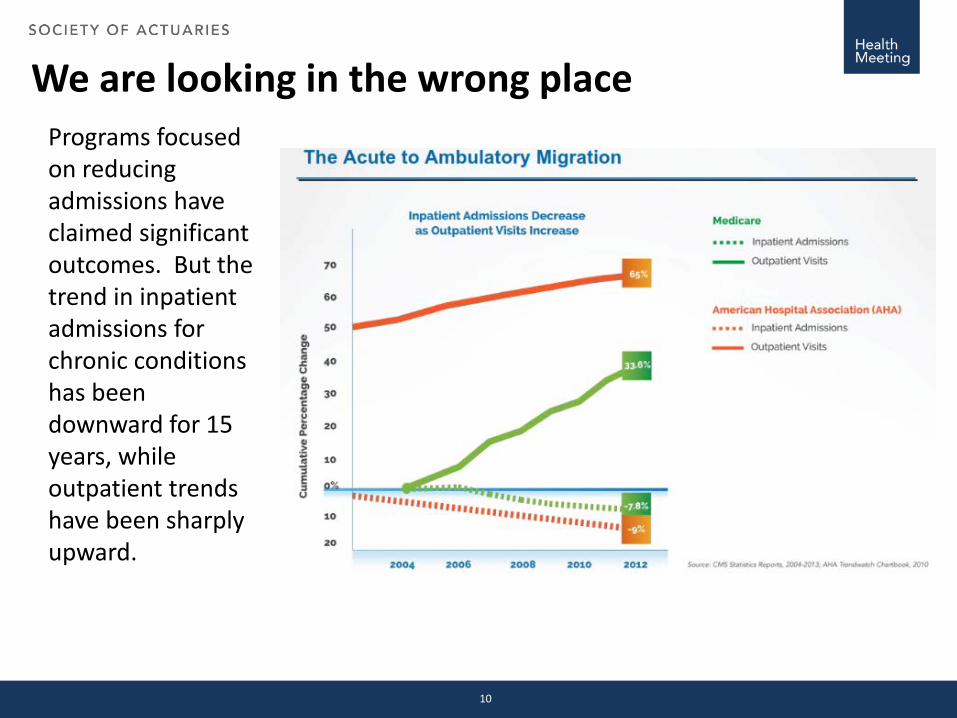
We are looking in the wrong placePrograms focused on reducing admissions have claimed significant outcomes. But the trend in inpatient admissions for chronic conditions has been downward for 15 years, while outpatient trends have been sharply upward.
10
Predictive Modeling in Business
Predictive Modeling in Business helps consumers make better choices, consistent with their long-term goals (cheaper, better products; tailored choices; faster access). The Progressive (and other auto insurers) experience is instructive:
• Progressive (through the use of predictive modeling) identified customers who were classified as high-risk (and assigned to a high-risk pool) but who were predicted to be low-cost.
• Their marketing focused intensely on these customers.
• The company successfully penetrated a profitable market.
BUT: They also focused on changing risky behavior in their existing customers.
11
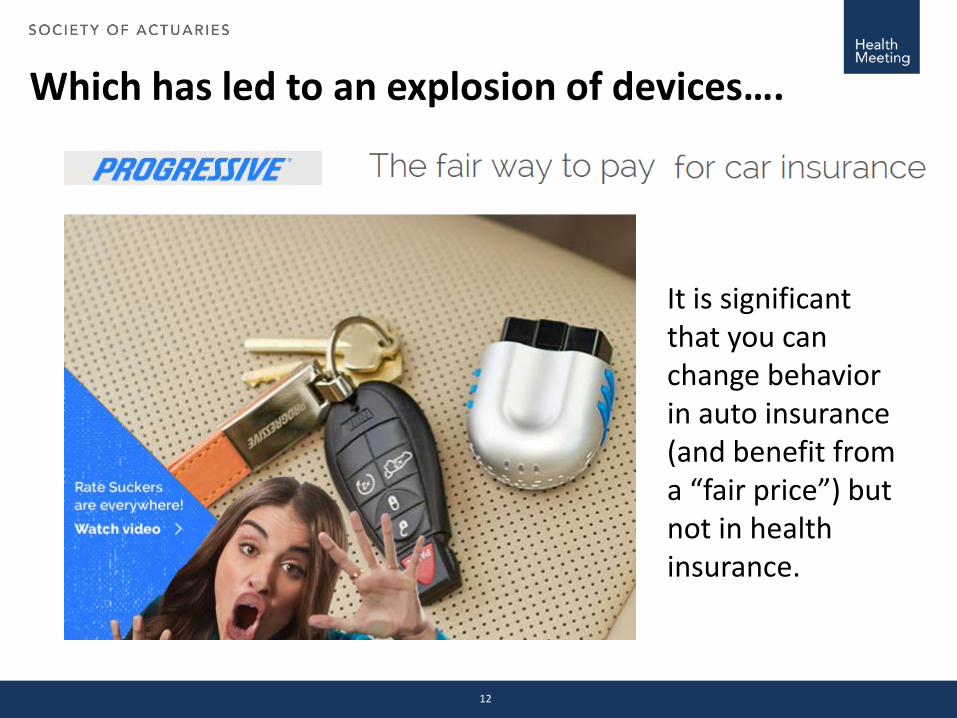
Which has led to an explosion of devices….
It is significant that you can change behavior in auto insurance (and benefit from a “fair price”) but not in health insurance.
12
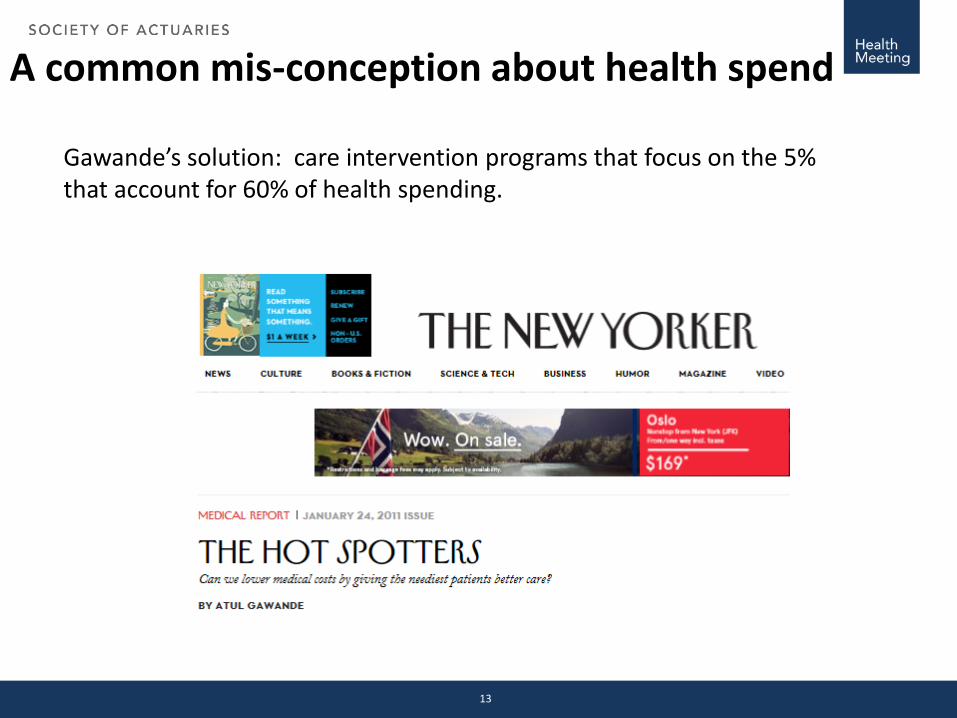
A common mis-conception about health spend
Gawande’s solution: care intervention programs that focus on the 5% that account for 60% of health spending.
13
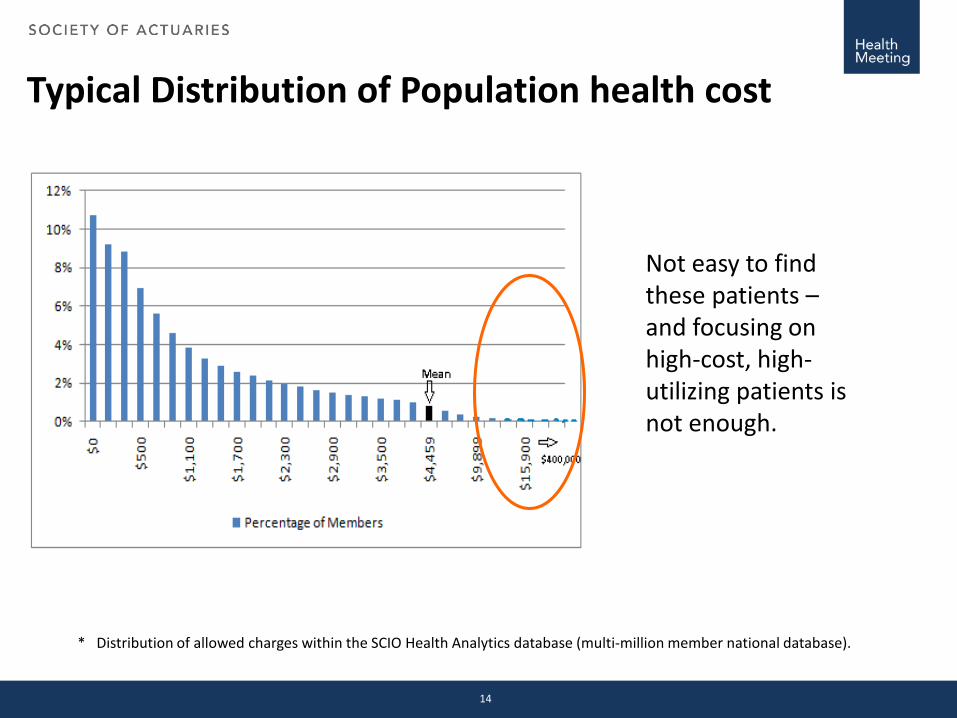
Typical Distribution of Population health cost
* Distribution of allowed charges within the SCIO Health Analytics database (multi-million member national database).
Not easy to find these patients –and focusing on high-cost, high-utilizing patients is not enough.
14
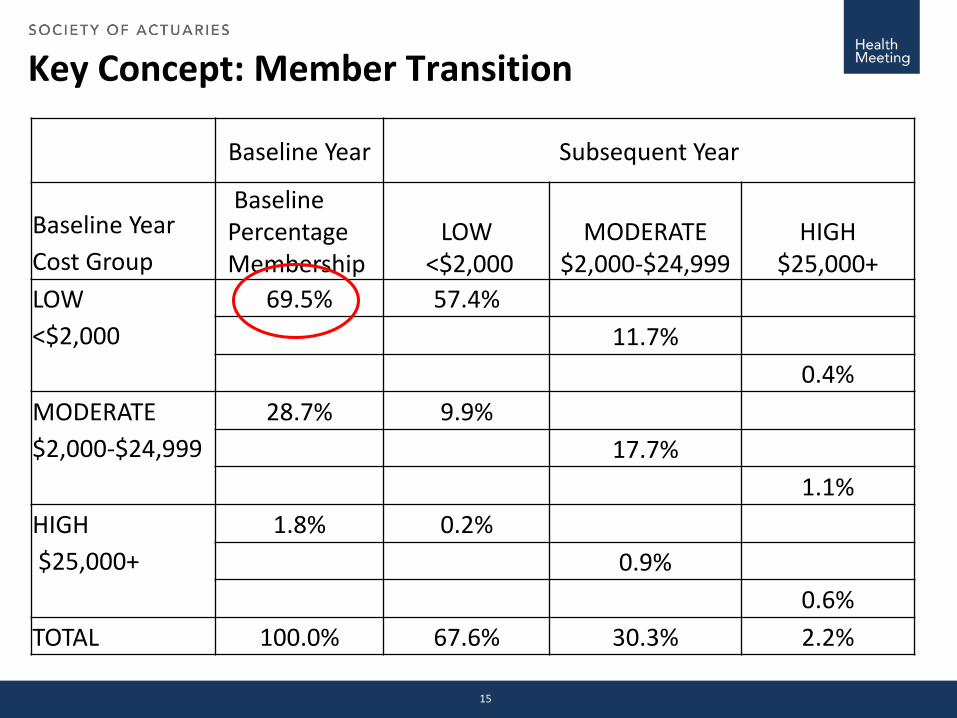
Key Concept: Member Transition
Baseline Year Subsequent Year
Baseline Year Cost Group
Baseline Percentage Membership
LOW <$2,000
MODERATE $2,000-$24,999
HIGH $25,000+
LOW <$2,000
69.5% 57.4%11.7%
0.4%MODERATE $2,000-$24,999
28.7% 9.9%17.7%
1.1%HIGH $25,000+
1.8% 0.2%0.9%
0.6%TOTAL 100.0% 67.6% 30.3% 2.2%
15
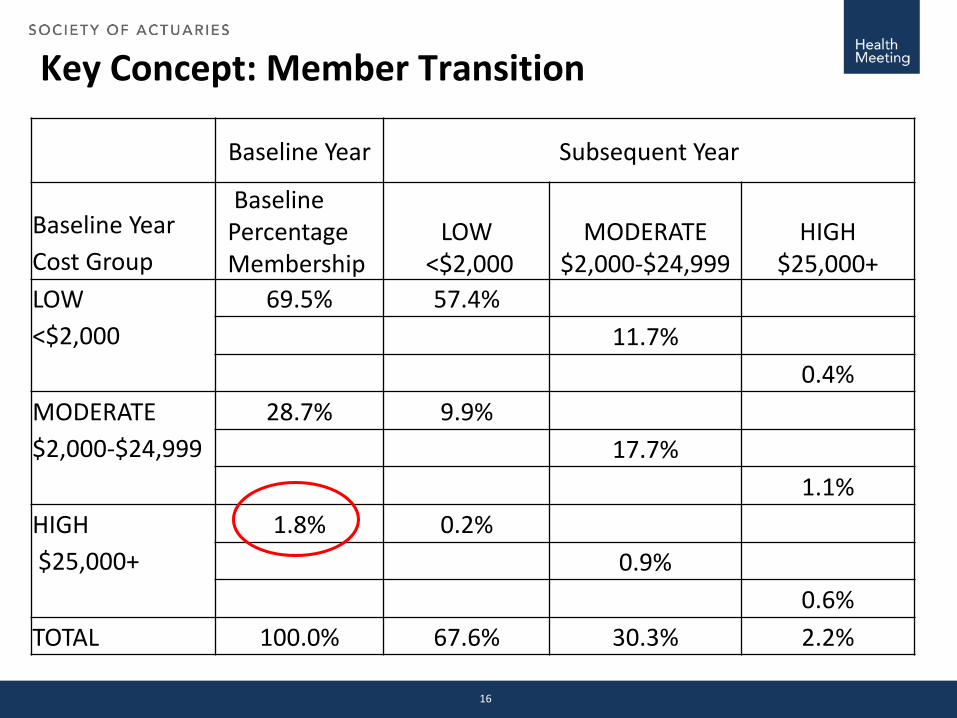
Key Concept: Member Transition
Baseline Year Subsequent Year
Baseline Year Cost Group
Baseline Percentage Membership
LOW <$2,000
MODERATE $2,000-$24,999
HIGH $25,000+
LOW <$2,000
69.5% 57.4%11.7%
0.4%MODERATE $2,000-$24,999
28.7% 9.9%17.7%
1.1%HIGH $25,000+
1.8% 0.2%0.9%
0.6%TOTAL 100.0% 67.6% 30.3% 2.2%
16
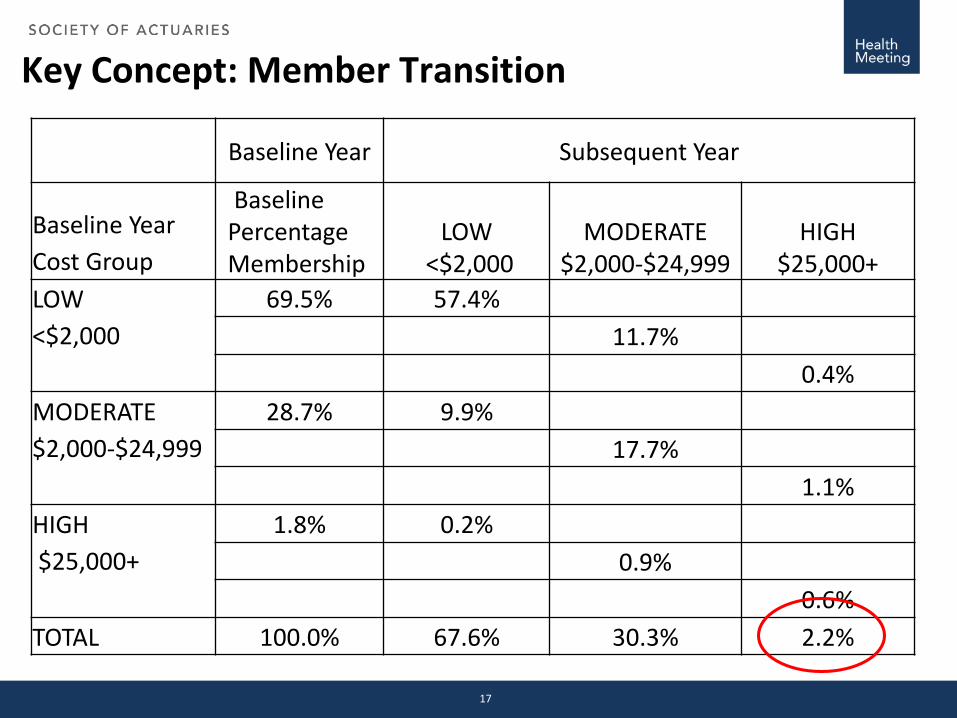
Key Concept: Member Transition
Baseline Year Subsequent Year
Baseline Year Cost Group
Baseline Percentage Membership
LOW <$2,000
MODERATE $2,000-$24,999
HIGH $25,000+
LOW <$2,000
69.5% 57.4%11.7%
0.4%MODERATE $2,000-$24,999
28.7% 9.9%17.7%
1.1%HIGH $25,000+
1.8% 0.2%0.9%
0.6%TOTAL 100.0% 67.6% 30.3% 2.2%
17
Modeling Risk Transitions• As studies show, traditional approaches to predicting future high utilizers are
not too accurate.
• My current research is focused on the application of actuarial models to risk transition in chronic populations, using an NHS (UK) dataset (800,000 lives; 25 years longitudinally, including clinical and behavioral data).
• Research will also inform current UK developments: increasing use of financial risk sharing (ACO model).
• Actuaries have traditionally built models to predict mortality (Life Tables). These allow us to price products rationally, knowing how deaths will occur in a large population.
• The idea is to build similar morbidity models. Knowing how diseases progress (statistically) we can better target interventions and evaluate whether our interventions worked.
• An example of a (simple) transition model for diabetes follows.
18
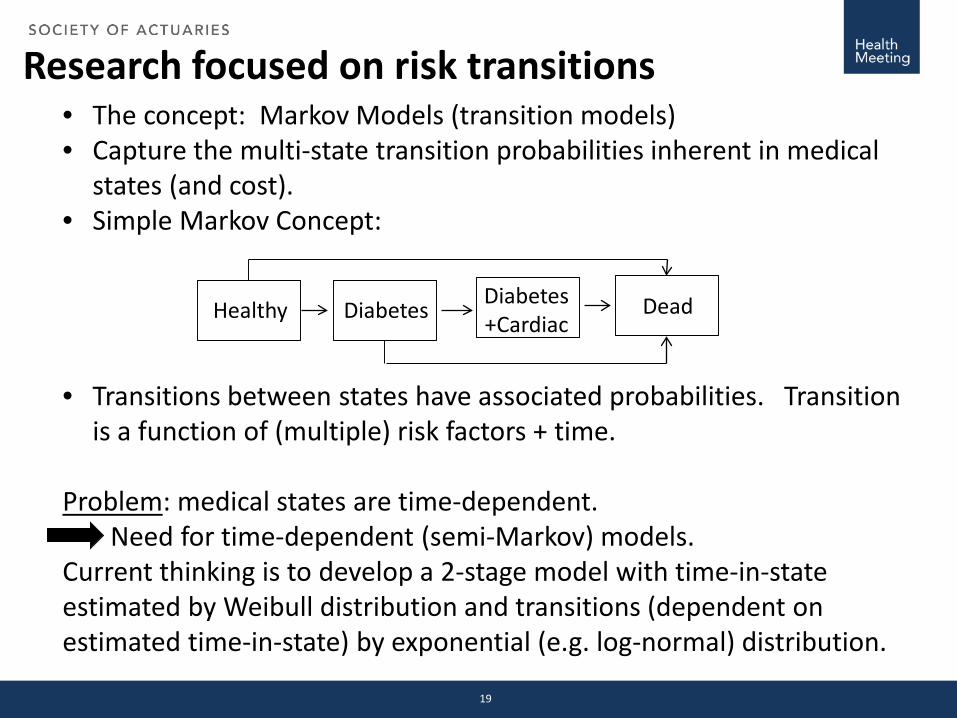
Research focused on risk transitions• The concept: Markov Models (transition models)• Capture the multi-state transition probabilities inherent in medical
states (and cost).• Simple Markov Concept:
• Transitions between states have associated probabilities. Transition is a function of (multiple) risk factors + time.
Problem: medical states are time-dependent. Need for time-dependent (semi-Markov) models.
Current thinking is to develop a 2-stage model with time-in-state estimated by Weibull distribution and transitions (dependent on estimated time-in-state) by exponential (e.g. log-normal) distribution.
Healthy Diabetes Diabetes +Cardiac
Dead
19
The “Last Mile” ProblemData/Analytics can identify issues and find opportunities. On their own, they cannot solve the “Last Mile1” problem.
The “Last Mile” problem helps to explain why Progressive Insurance, Netflix, Amazon, The Oakland As and others have successfully implemented data analytics and healthcare has not. Consumers either enjoy lower rates (Progressive), better and cheaper players (A’s), a better consumer experience (Amazon), etc.
The example that follows shows the importance of addressing both risk and the Last Mile.
1 Guszcza, J. “The Last Mile Problem: How Data Science and Behavioral Science Can Work Together” Deloitte Review, (16) 2015.
20
Case study: Value-based purchasing in Medicare
CMS’s Medicare Shared-savings ACO model aims to address the Triple Aim. It forces providers to work together; it does not address the patient last-mile problem.
Results are not encouraging (2013 results)
• Only 26% of MSSP ACOs earned shared savings.
• Another 27% lowered cost but did not qualify to share in savings.
• Almost half (47%) did not lower the cost of care.
• Very significant leakage to non-ACO providers.
21
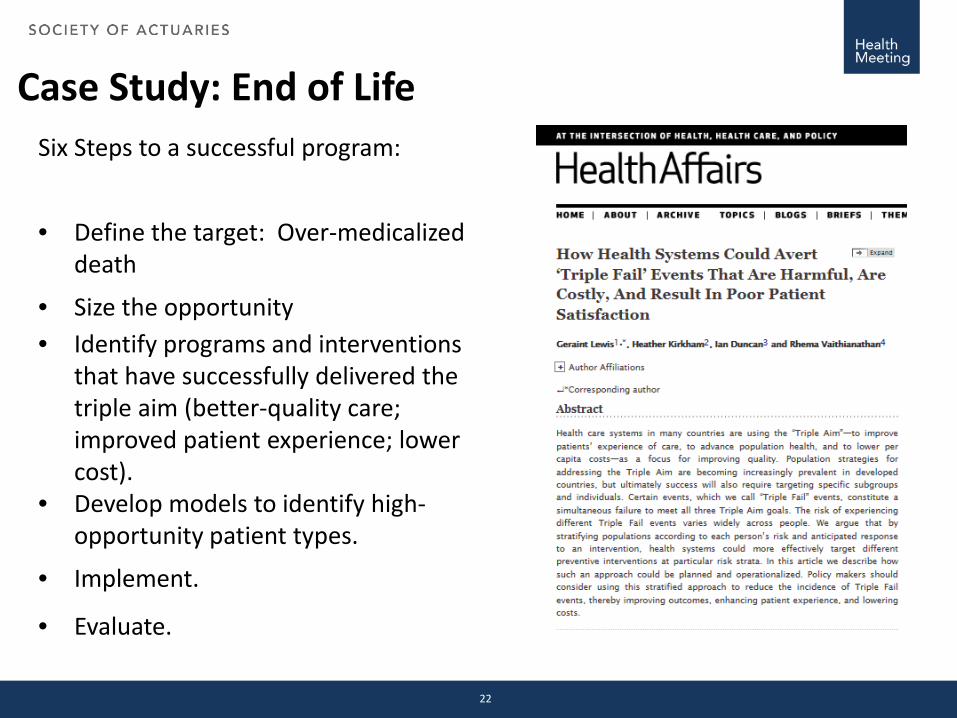
Case Study: End of LifeSix Steps to a successful program:
• Define the target: Over-medicalized death
• Size the opportunity• Identify programs and interventions
that have successfully delivered the triple aim (better-quality care; improved patient experience; lower cost).
• Develop models to identify high-opportunity patient types.
• Implement.
• Evaluate.
22
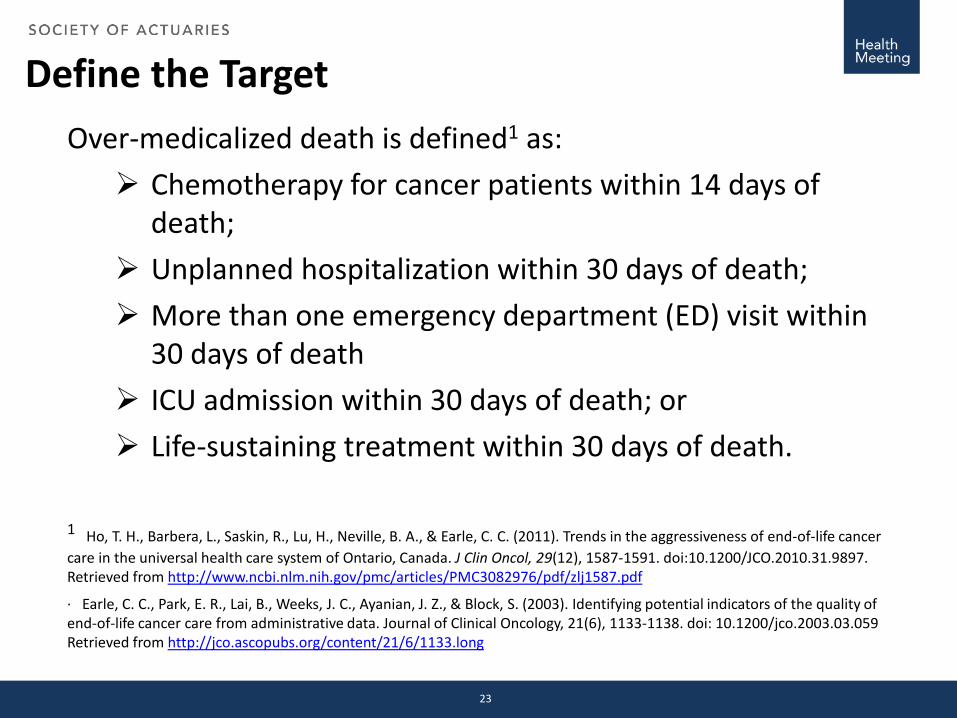
Define the TargetOver-medicalized death is defined1 as: Chemotherapy for cancer patients within 14 days of
death; Unplanned hospitalization within 30 days of death; More than one emergency department (ED) visit within
30 days of death ICU admission within 30 days of death; or Life-sustaining treatment within 30 days of death.
1 Ho, T. H., Barbera, L., Saskin, R., Lu, H., Neville, B. A., & Earle, C. C. (2011). Trends in the aggressiveness of end-of-life cancer care in the universal health care system of Ontario, Canada. J Clin Oncol, 29(12), 1587-1591. doi:10.1200/JCO.2010.31.9897. Retrieved from http://www.ncbi.nlm.nih.gov/pmc/articles/PMC3082976/pdf/zlj1587.pdf
· Earle, C. C., Park, E. R., Lai, B., Weeks, J. C., Ayanian, J. Z., & Block, S. (2003). Identifying potential indicators of the quality of end-of-life cancer care from administrative data. Journal of Clinical Oncology, 21(6), 1133-1138. doi: 10.1200/jco.2003.03.059 Retrieved from http://jco.ascopubs.org/content/21/6/1133.long
23
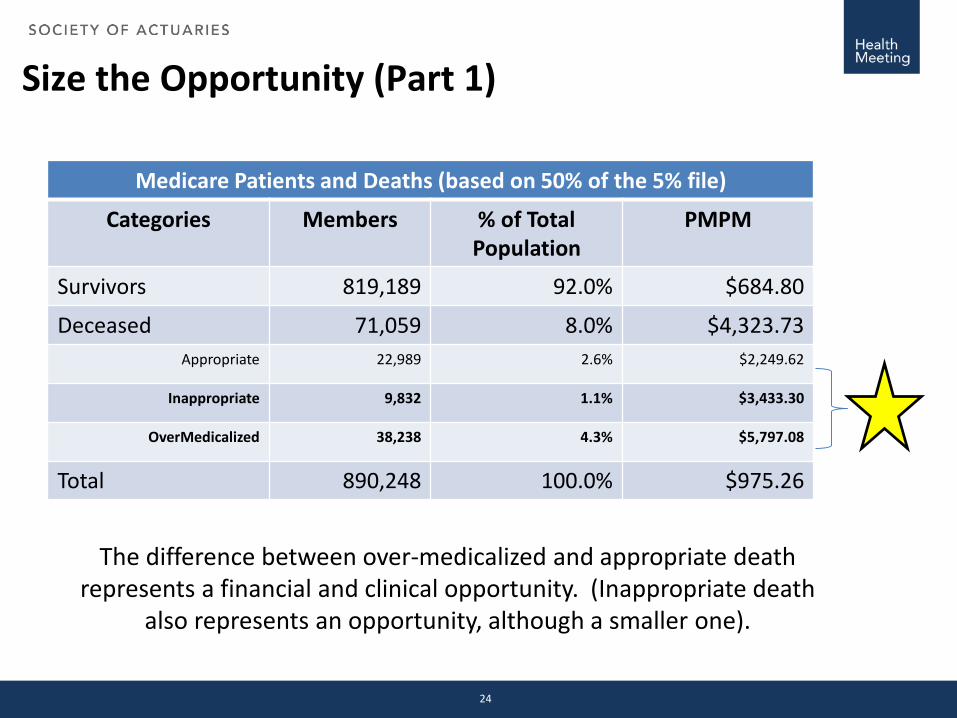
Size the Opportunity (Part 1)
Medicare Patients and Deaths (based on 50% of the 5% file)
Categories Members % of Total Population
PMPM
Survivors 819,189 92.0% $684.80
Deceased 71,059 8.0% $4,323.73Appropriate 22,989 2.6% $2,249.62
Inappropriate 9,832 1.1% $3,433.30
OverMedicalized 38,238 4.3% $5,797.08
Total 890,248 100.0% $975.26
The difference between over-medicalized and appropriate death represents a financial and clinical opportunity. (Inappropriate death
also represents an opportunity, although a smaller one).
24
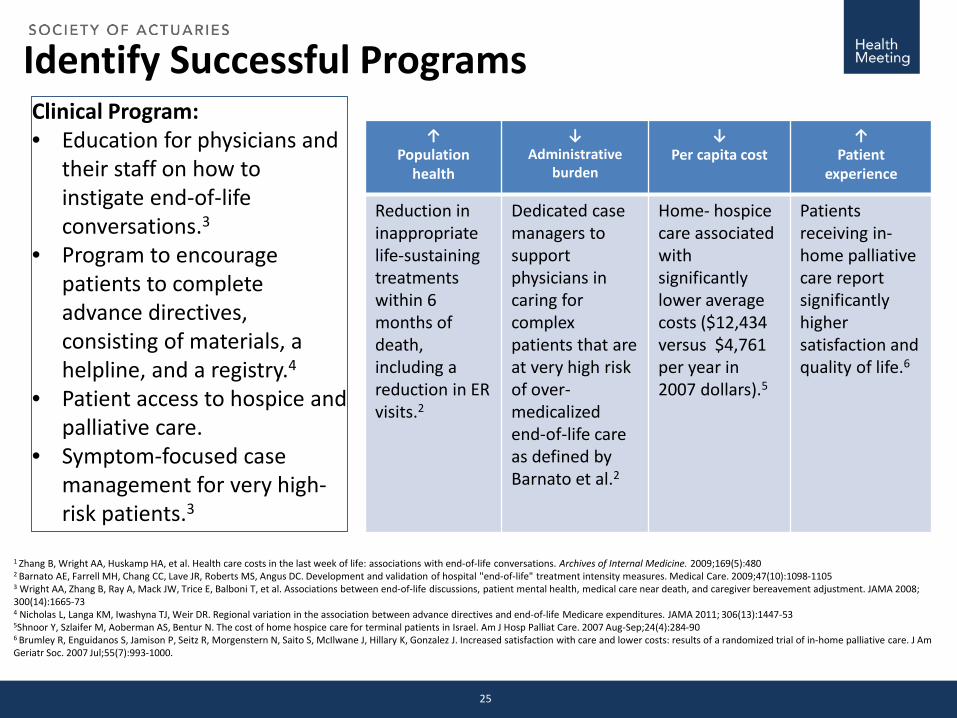
Identify Successful Programs
↑ Population
health
↓Administrative
burden
↓Per capita cost
↑Patient
experience
Reduction in inappropriate life-sustaining treatments within 6 months of death, including a reduction in ER visits.2
Dedicated case managers to support physicians in caring for complex patients that are at very high risk of over-medicalizedend-of-life care as defined by Barnato et al.2
Home- hospice care associated with significantly lower average costs ($12,434 versus $4,761 per year in 2007 dollars).5
Patients receiving in-home palliative care report significantly higher satisfaction and quality of life.6
Clinical Program:• Education for physicians and
their staff on how to instigate end-of-life conversations.3
• Program to encourage patients to complete advance directives, consisting of materials, a helpline, and a registry.4
• Patient access to hospice and palliative care.
• Symptom-focused case management for very high-risk patients.3
1 Zhang B, Wright AA, Huskamp HA, et al. Health care costs in the last week of life: associations with end-of-life conversations. Archives of Internal Medicine. 2009;169(5):4802 Barnato AE, Farrell MH, Chang CC, Lave JR, Roberts MS, Angus DC. Development and validation of hospital "end-of-life" treatment intensity measures. Medical Care. 2009;47(10):1098-11053 Wright AA, Zhang B, Ray A, Mack JW, Trice E, Balboni T, et al. Associations between end-of-life discussions, patient mental health, medical care near death, and caregiver bereavement adjustment. JAMA 2008; 300(14):1665-734 Nicholas L, Langa KM, Iwashyna TJ, Weir DR. Regional variation in the association between advance directives and end-of-life Medicare expenditures. JAMA 2011; 306(13):1447-535Shnoor Y, Szlaifer M, Aoberman AS, Bentur N. The cost of home hospice care for terminal patients in Israel. Am J Hosp Palliat Care. 2007 Aug-Sep;24(4):284-906 Brumley R, Enguidanos S, Jamison P, Seitz R, Morgenstern N, Saito S, McIlwane J, Hillary K, Gonzalez J. Increased satisfaction with care and lower costs: results of a randomized trial of in-home palliative care. J Am Geriatr Soc. 2007 Jul;55(7):993-1000.
25
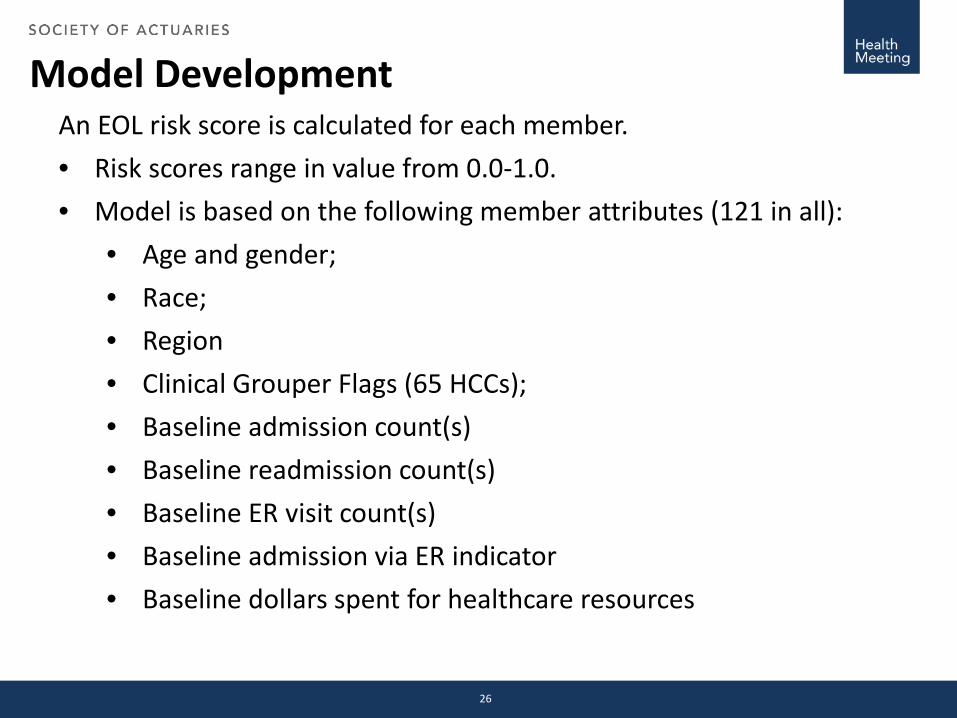
Model DevelopmentAn EOL risk score is calculated for each member.• Risk scores range in value from 0.0-1.0.• Model is based on the following member attributes (121 in all):
• Age and gender;• Race;• Region• Clinical Grouper Flags (65 HCCs);• Baseline admission count(s)• Baseline readmission count(s)• Baseline ER visit count(s)• Baseline admission via ER indicator• Baseline dollars spent for healthcare resources
26
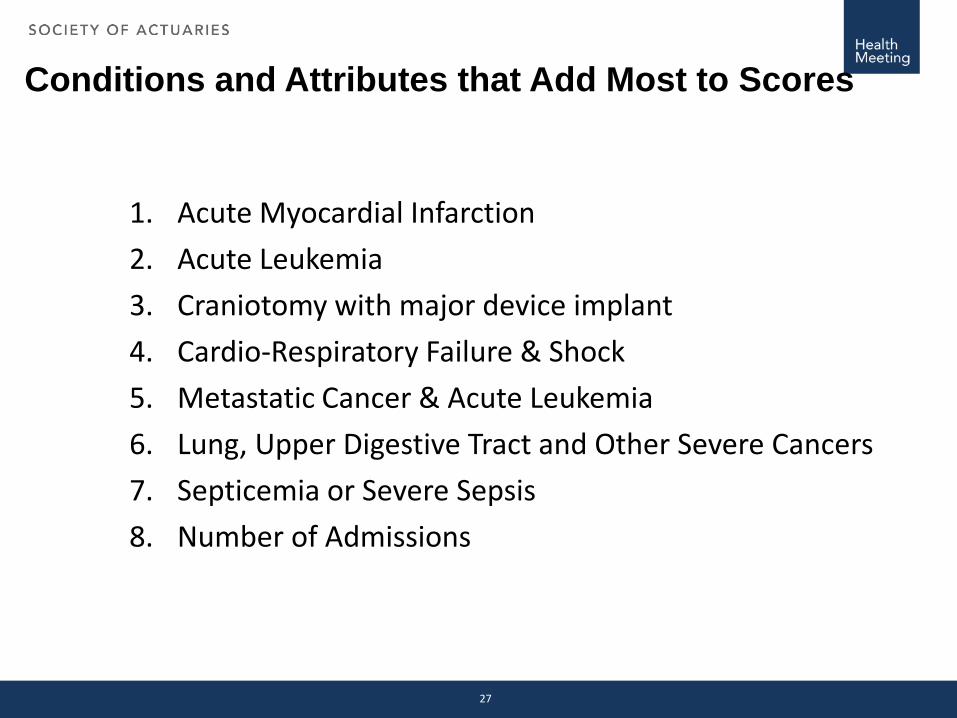
Conditions and Attributes that Add Most to Scores
1. Acute Myocardial Infarction2. Acute Leukemia3. Craniotomy with major device implant4. Cardio-Respiratory Failure & Shock5. Metastatic Cancer & Acute Leukemia6. Lung, Upper Digestive Tract and Other Severe Cancers7. Septicemia or Severe Sepsis8. Number of Admissions
27
Model Testing
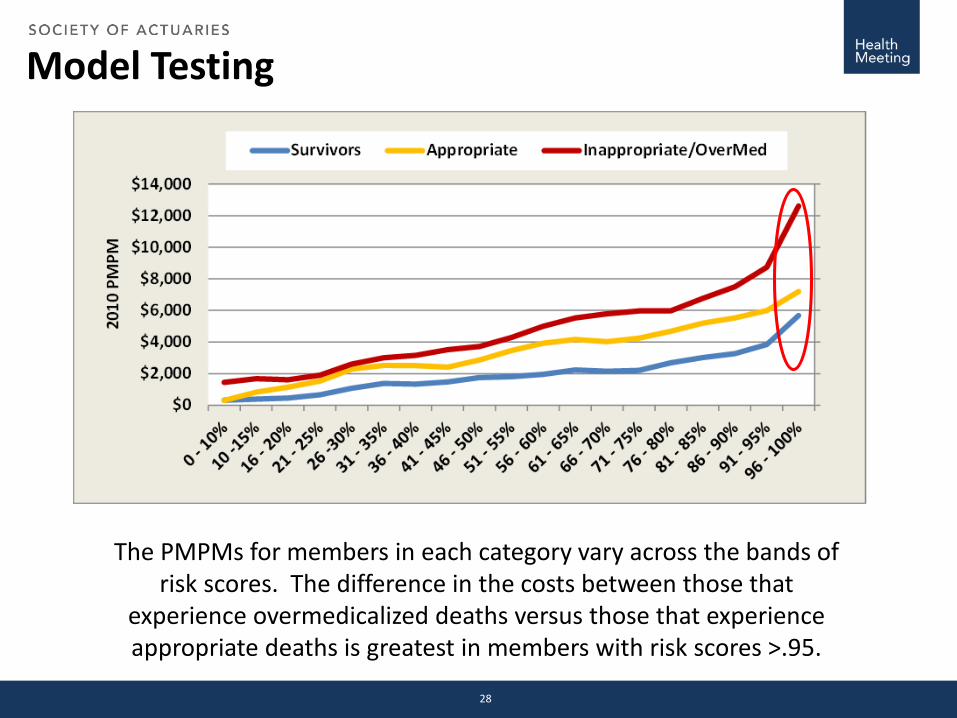
The PMPMs for members in each category vary across the bands of risk scores. The difference in the costs between those that
experience overmedicalized deaths versus those that experience appropriate deaths is greatest in members with risk scores >.95.
28
Model Performance
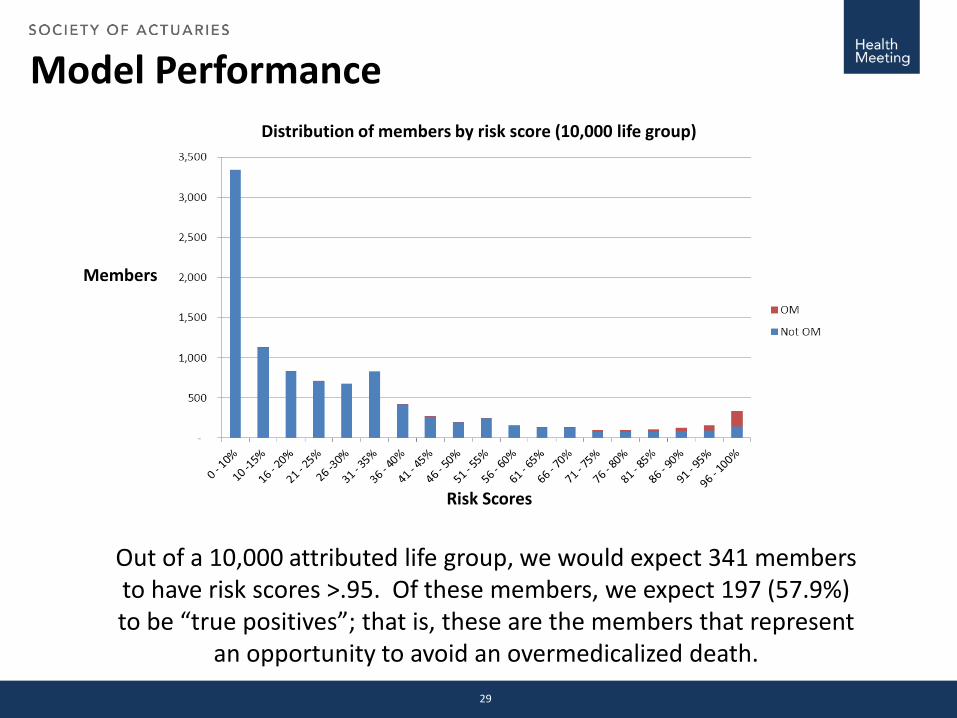
Out of a 10,000 attributed life group, we would expect 341 members to have risk scores >.95. Of these members, we expect 197 (57.9%) to be “true positives”; that is, these are the members that represent
an opportunity to avoid an overmedicalized death.
Risk Scores
Distribution of members by risk score (10,000 life group)
Members
29
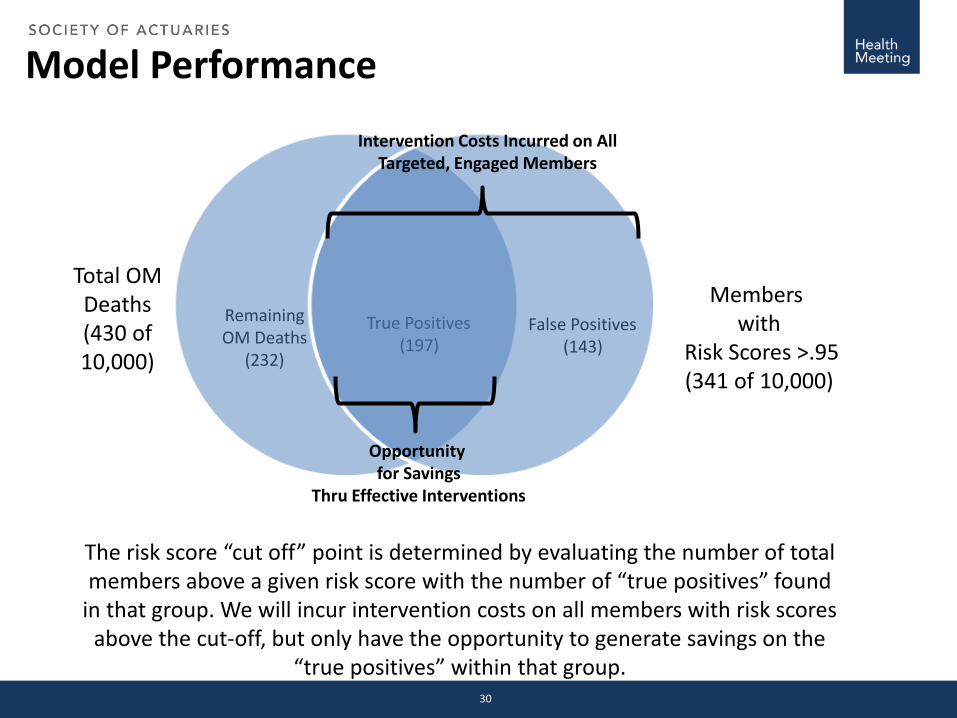
Model Performance
Total OM Deaths(430 of 10,000)
Members with
Risk Scores >.95(341 of 10,000)
True Positives(197)
False Positives(143)
RemainingOM Deaths
(232)
The risk score “cut off” point is determined by evaluating the number of total members above a given risk score with the number of “true positives” found
in that group. We will incur intervention costs on all members with risk scoresabove the cut-off, but only have the opportunity to generate savings on the
“true positives” within that group.
Opportunity for Savings
Thru Effective Interventions
Intervention Costs Incurred on All Targeted, Engaged Members
30
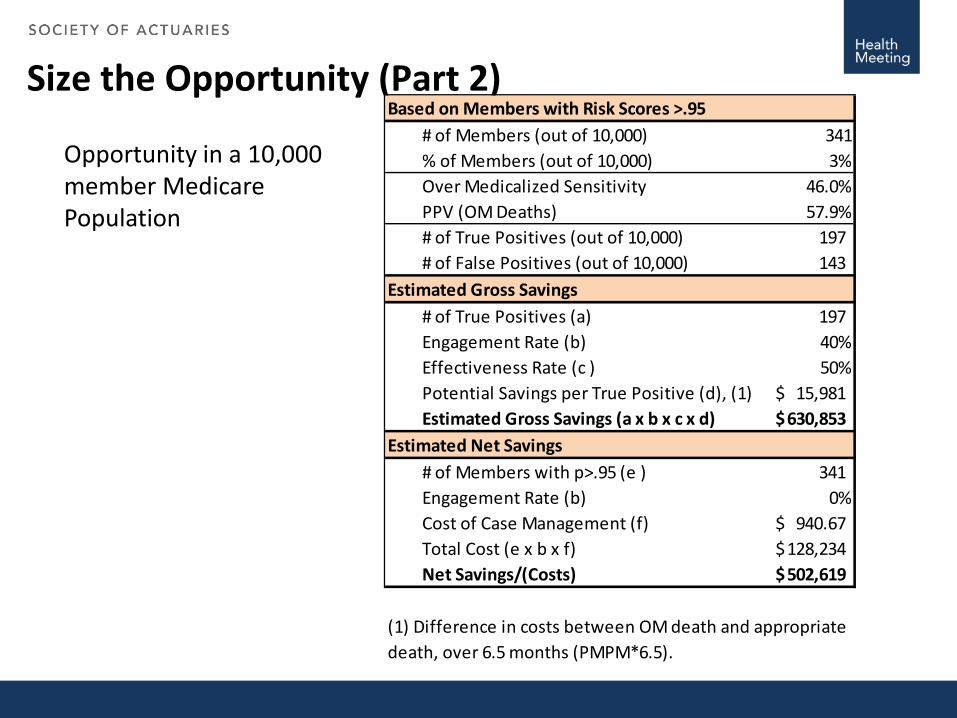
Size the Opportunity (Part 2)# of Members (out of 10,000) 341% of Members (out of 10,000) 3%Over Medicalized Sensitivity 46.0%PPV (OM Deaths) 57.9%# of True Positives (out of 10,000) 197 # of False Positives (out of 10,000) 143
Estimated Gross Savings# of True Positives (a) 197 Engagement Rate (b) 40%Effectiveness Rate (c ) 50%Potential Savings per True Positive (d), (1) 15,981$ Estimated Gross Savings (a x b x c x d) 630,853$
Estimated Net Savings# of Members with p>.95 (e ) 341 Engagement Rate (b) 0%Cost of Case Management (f) 940.67$ Total Cost (e x b x f) 128,234$ Net Savings/(Costs) 502,619$
(1) Difference in costs between OM death and appropriatedeath, over 6.5 months (PMPM*6.5).
Based on Members with Risk Scores >.95
Opportunity in a 10,000 member Medicare Population

So: What happened?
Ian Duncan FSA FIA FCIA MAAAAdj. Assoc. Professor Dept. of Statistics & Applied ProbabilityUniversity of California, Santa Barbara
(805) 893-6023(860) [email protected]
Contact Information
Big DataWhat is it – and what does it mean for the insurance industry?
SOA Health MeetingAtlantaJune 15, 2015
James Guszcza, PhD, FCAS, FSADeloitte Consulting | [email protected]
2 Deloitte Analytics Institute © 2011 Deloitte LLP
James Guszcza – US Chief Data Scientist, Deloitte Consulting
James Guszcza is the Chief Data Scientist of Deloitte Consulting in the United States, as well as a member of Deloitte’s Advanced Analytics and Modeling practice. Jim has applied statistical and machine learning methods to such diverse business problems as healthcare utilization, customer and employee retention, talent management, insurance agent recruiting, customer segmentation, insurance pricing and underwriting, credit scoring, child support enforcement, medical malpractice and patient safety, claims management, and fraud detection. He has also explored the use of behavioral nudge tactics to more effectively act on model indications. A frequent author and conference speaker, Jim designed and teaches hands-on business analytics training seminars for both the Casualty Actuarial Society and the Society of Actuaries. Jim is a former professor at the University of Wisconsin-Madison business school, and he holds a PhD in the Philosophy of Science from The University of Chicago. Jim is a Fellow of both the Casualty Actuarial Society and Society of Actuaries.
Deloitte Consulting LLP350 South Grand AvenueLos Angeles, CA 90071
James Guszcza, PhD, FCAS, FSAChief Data ScientistDeloitte Consulting | US Tel: +1 310 883 4042
Member ofDeloitte Touche Tohmatsu
3 Deloitte Analytics Institute © 2011 Deloitte LLP
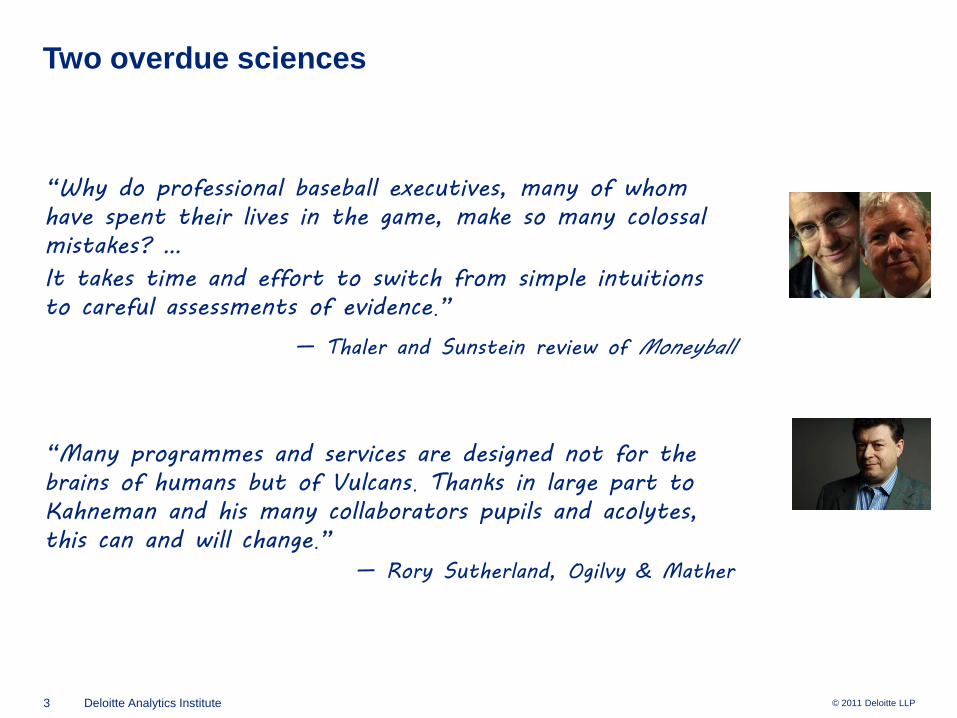
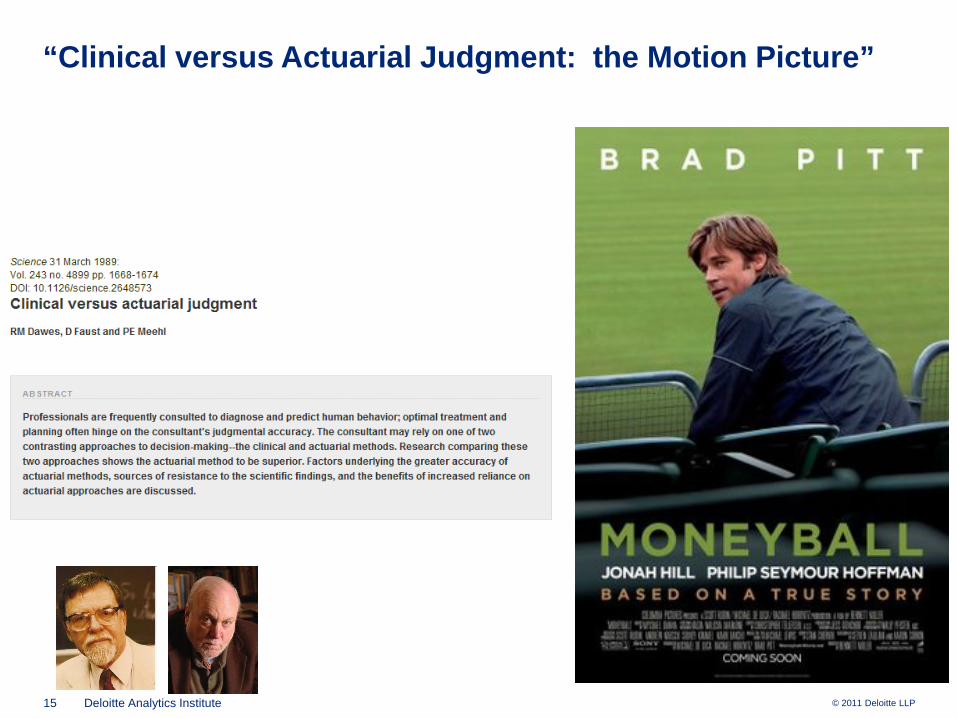
Two overdue sciences
“Why do professional baseball executives, many of whom have spent their lives in the game, make so many colossal mistakes? … It takes time and effort to switch from simple intuitions to careful assessments of evidence.”
— Thaler and Sunstein review of Moneyball
“Many programmes and services are designed not for the brains of humans but of Vulcans. Thanks in large part to Kahneman and his many collaborators pupils and acolytes, this can and will change.”
— Rory Sutherland, Ogilvy & Mather
4 Deloitte Analytics Institute © 2011 Deloitte LLP
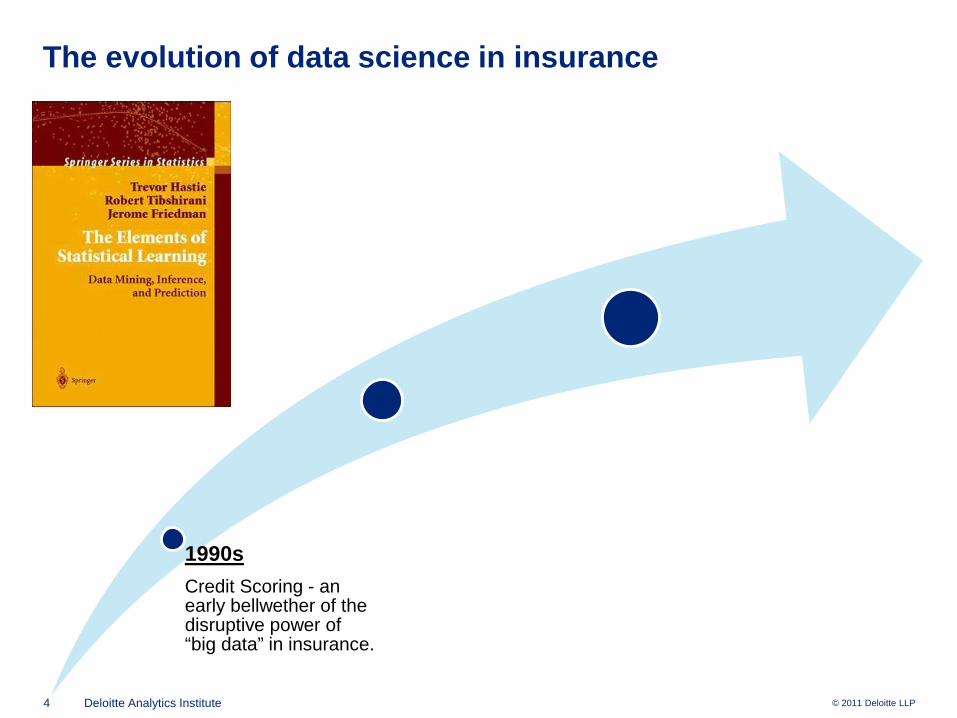
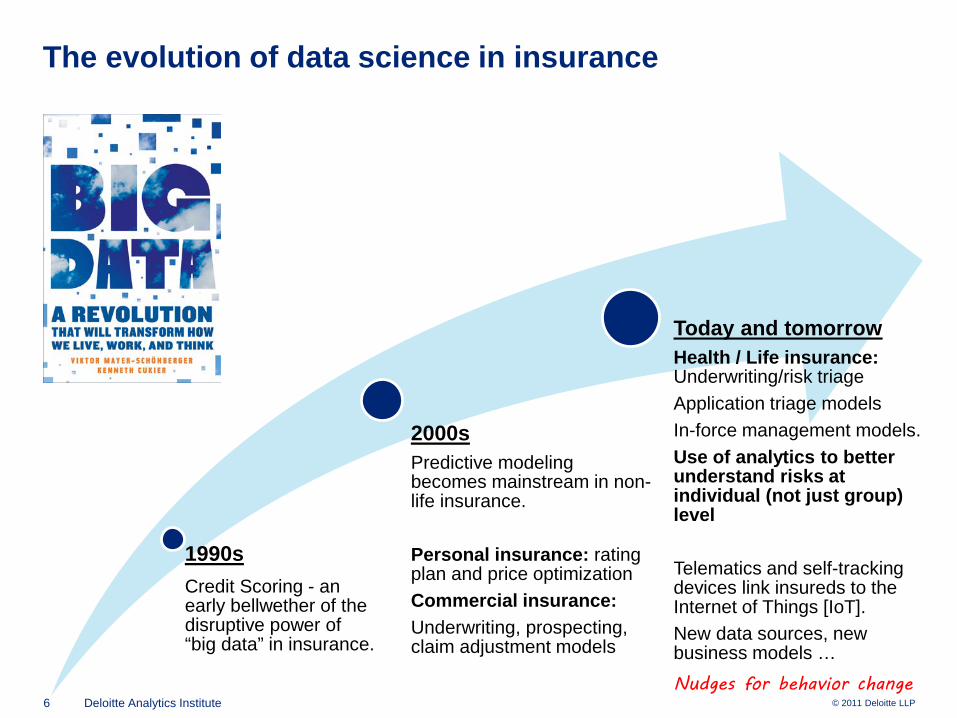
The evolution of data science in insurance
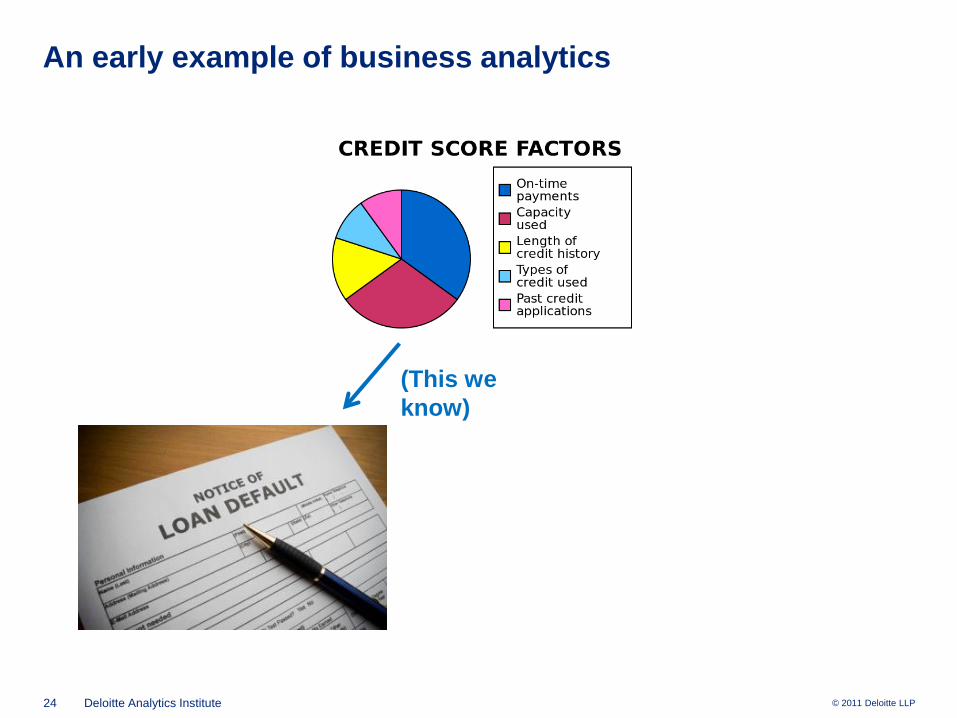
1990sCredit Scoring - an early bellwether of the disruptive power of “big data” in insurance.
5 Deloitte Analytics Institute © 2011 Deloitte LLP
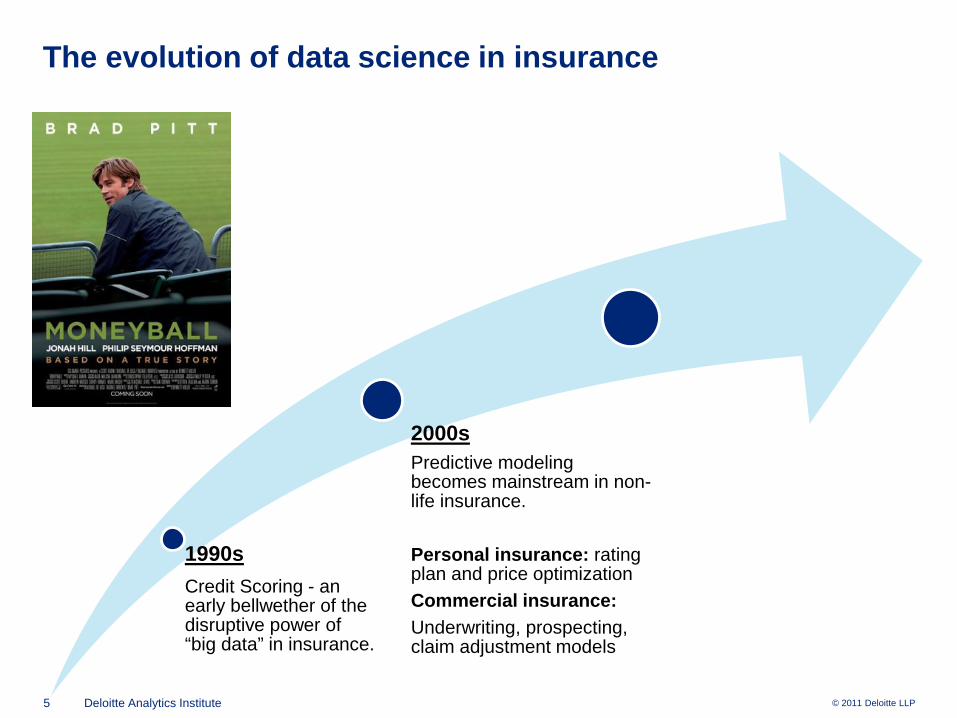
The evolution of data science in insurance
1990sCredit Scoring - an early bellwether of the disruptive power of “big data” in insurance.
2000sPredictive modeling becomes mainstream in non-life insurance.
Personal insurance: rating plan and price optimizationCommercial insurance:Underwriting, prospecting, claim adjustment models
6 Deloitte Analytics Institute © 2011 Deloitte LLP
The evolution of data science in insurance
1990sCredit Scoring - an early bellwether of the disruptive power of “big data” in insurance.
2000sPredictive modeling becomes mainstream in non-life insurance.
Personal insurance: rating plan and price optimizationCommercial insurance:Underwriting, prospecting, claim adjustment models
Today and tomorrowHealth / Life insurance: Underwriting/risk triageApplication triage modelsIn-force management models.Use of analytics to better understand risks at individual (not just group) level
Telematics and self-tracking devices link insureds to the Internet of Things [IoT].New data sources, new business models …Nudges for behavior change
Big data:So what’s the big deal?
8 Deloitte Analytics Institute © 2011 Deloitte LLP
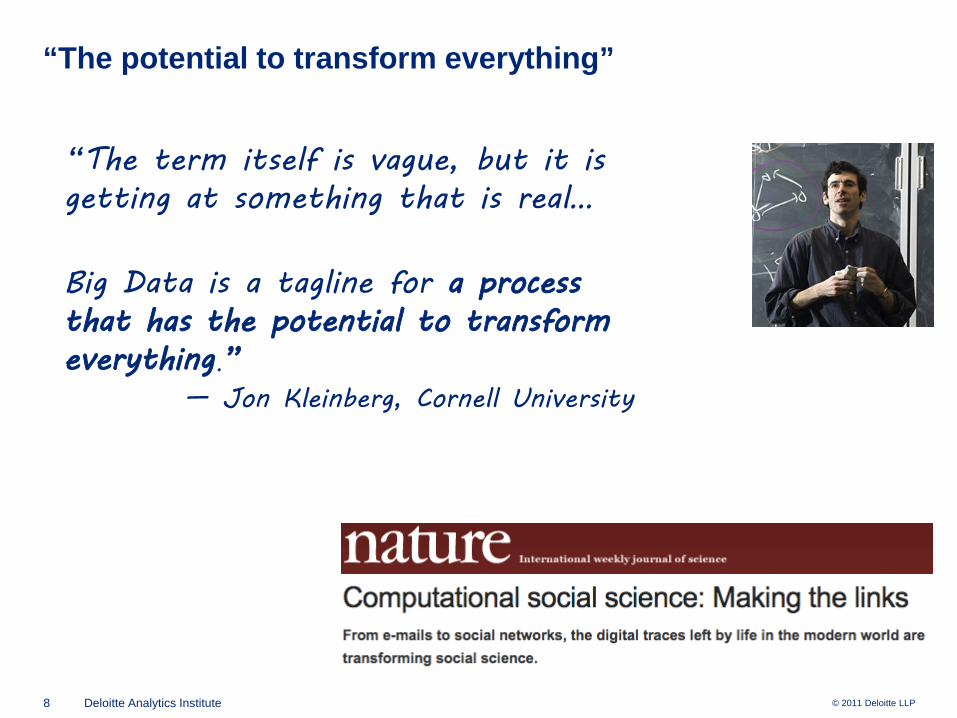
“The potential to transform everything”
“The term itself is vague, but it is getting at something that is real…
Big Data is a tagline for a process that has the potential to transform everything.”
— Jon Kleinberg, Cornell University
9 Deloitte Analytics Institute © 2011 Deloitte LLP
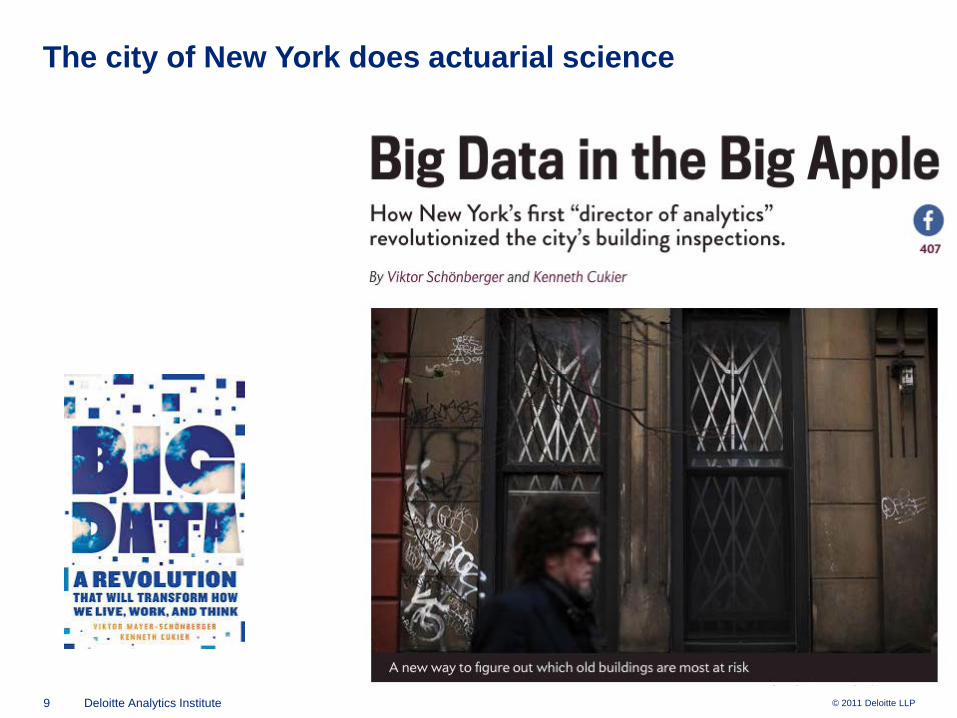
The city of New York does actuarial science
10 Deloitte Analytics Institute © 2011 Deloitte LLP
Three definitions of big data
1. Data sets with sizes beyond the capability of standard IT tools to capture, process, and analyze in reasonable time frames.
11 Deloitte Analytics Institute © 2011 Deloitte LLP
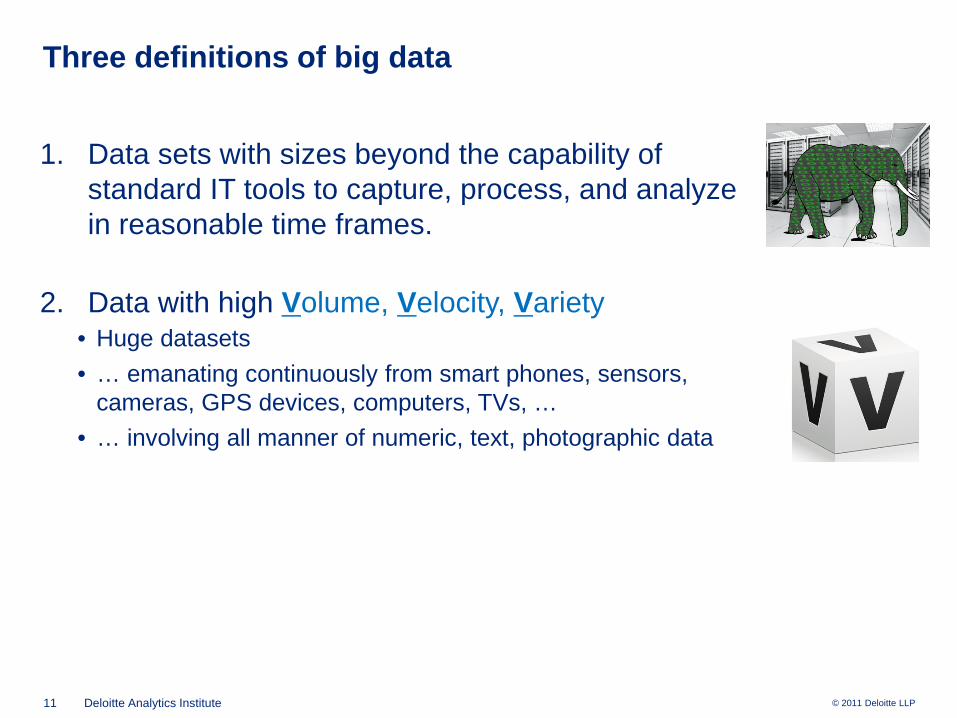
Three definitions of big data
1. Data sets with sizes beyond the capability of standard IT tools to capture, process, and analyze in reasonable time frames.
2. Data with high Volume, Velocity, Variety• Huge datasets• … emanating continuously from smart phones, sensors,
cameras, GPS devices, computers, TVs, …• … involving all manner of numeric, text, photographic data
12 Deloitte Analytics Institute © 2011 Deloitte LLP
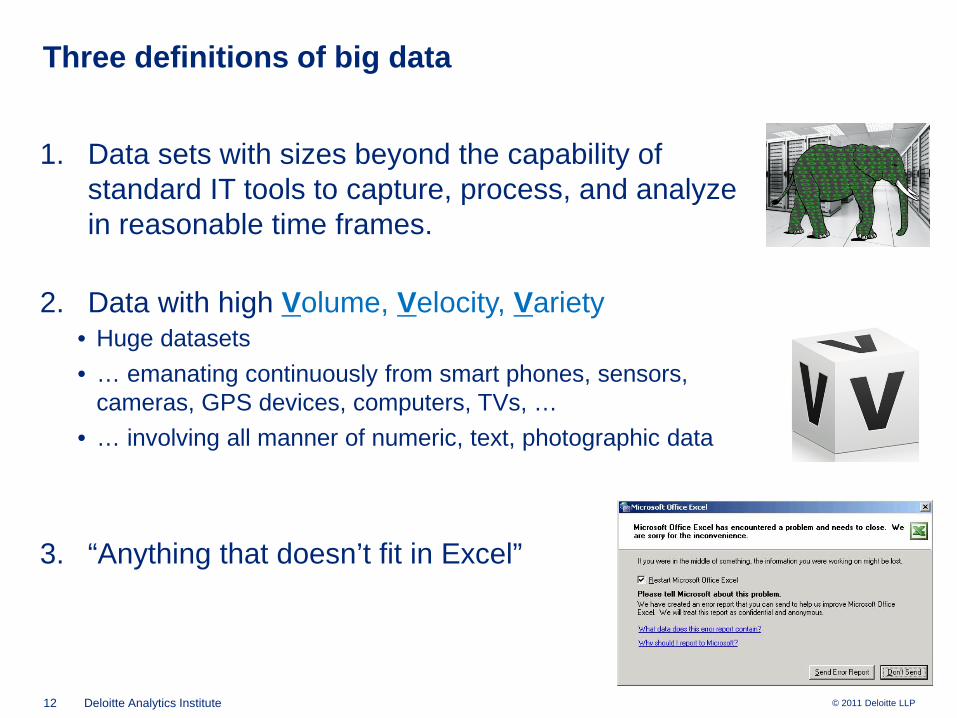
Three definitions of big data
1. Data sets with sizes beyond the capability of standard IT tools to capture, process, and analyze in reasonable time frames.
2. Data with high Volume, Velocity, Variety• Huge datasets• … emanating continuously from smart phones, sensors,
cameras, GPS devices, computers, TVs, …• … involving all manner of numeric, text, photographic data
3. “Anything that doesn’t fit in Excel”

13 Deloitte Analytics Institute © 2011 Deloitte LLP
In Hollywood, “Nobody Knows Anything”
14 Deloitte Analytics Institute © 2011 Deloitte LLP
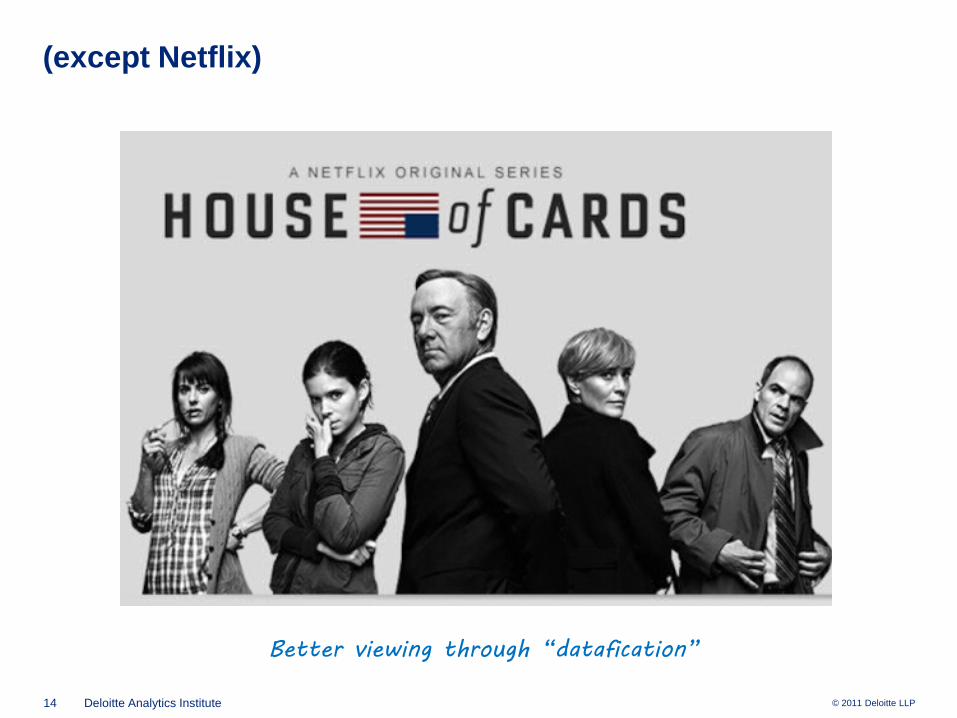
(except Netflix)
Better viewing through “datafication”
15 Deloitte Analytics Institute © 2011 Deloitte LLP
“Clinical versus Actuarial Judgment: the Motion Picture”
16 Deloitte Analytics Institute © 2011 Deloitte LLP
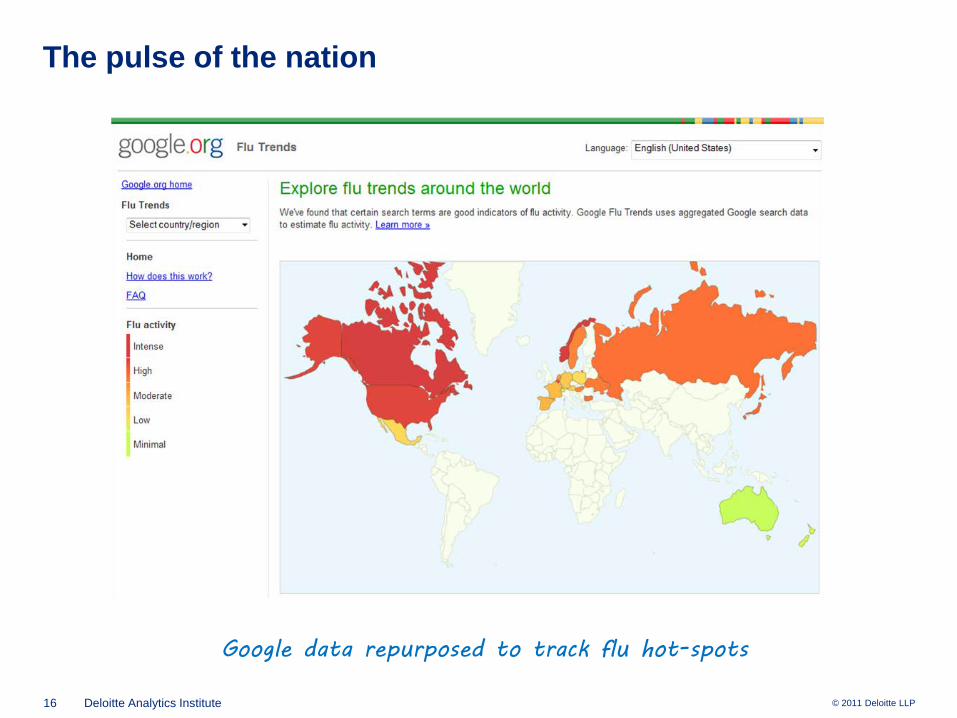
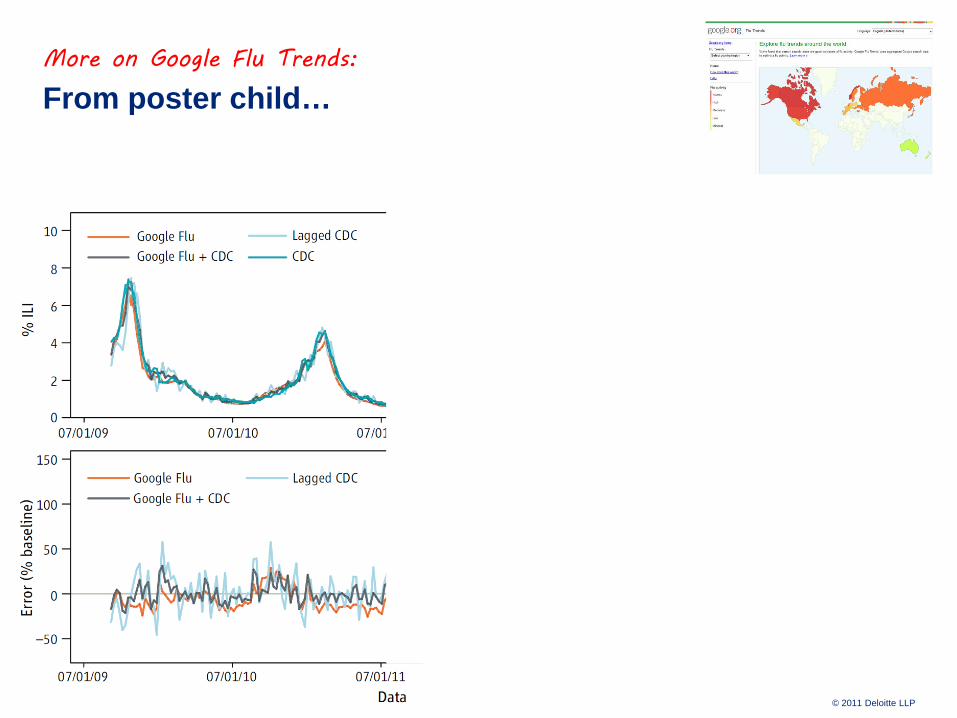
The pulse of the nation
Google data repurposed to track flu hot-spots
Is big data different?
18 Deloitte Analytics Institute © 2010 Deloitte LLP
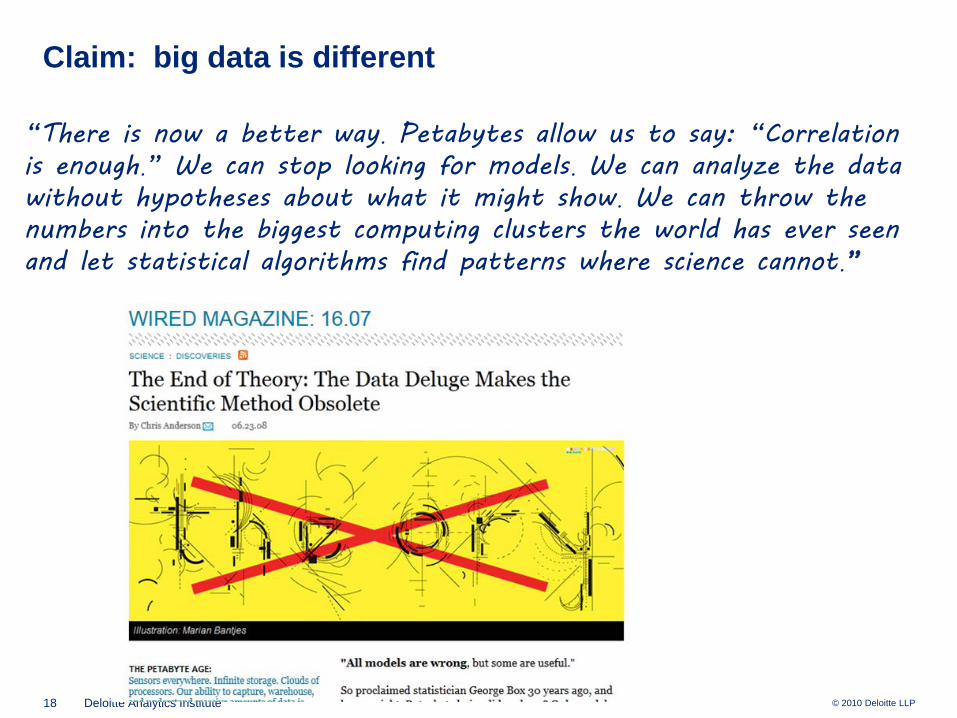
Claim: big data is different
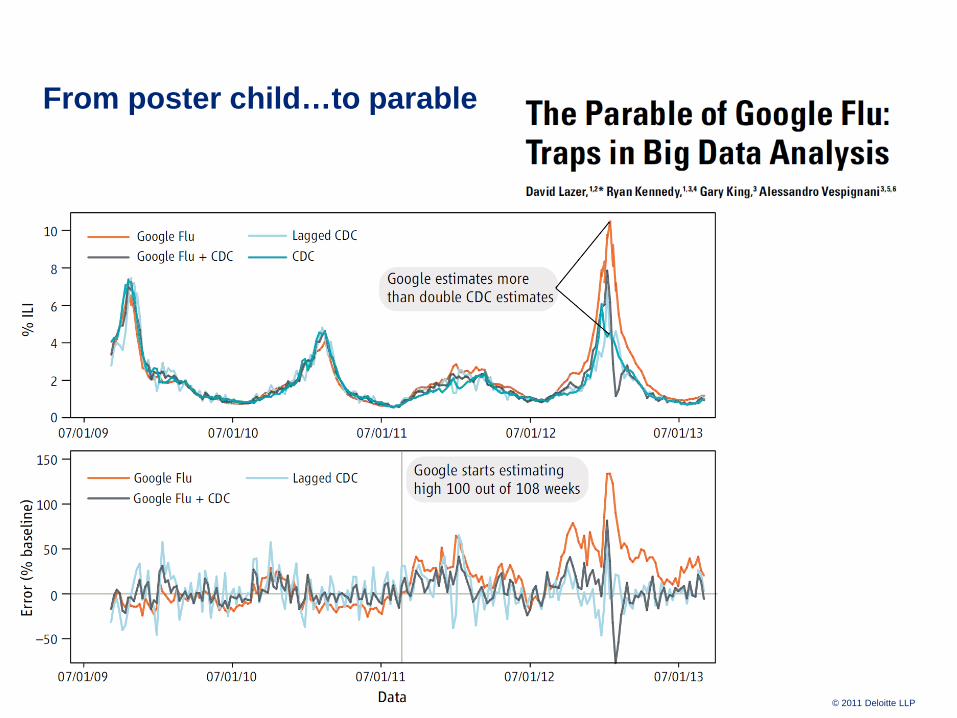
“There is now a better way. Petabytes allow us to say: “Correlation is enough.” We can stop looking for models. We can analyze the data without hypotheses about what it might show. We can throw the numbers into the biggest computing clusters the world has ever seen and let statistical algorithms find patterns where science cannot.”
19 Deloitte Analytics Institute © 2011 Deloitte LLP
More on Google Flu Trends:
From poster child…
20 Deloitte Analytics Institute © 2011 Deloitte LLP
From poster child…to parable
21 Deloitte Analytics Institute © 2011 Deloitte LLP
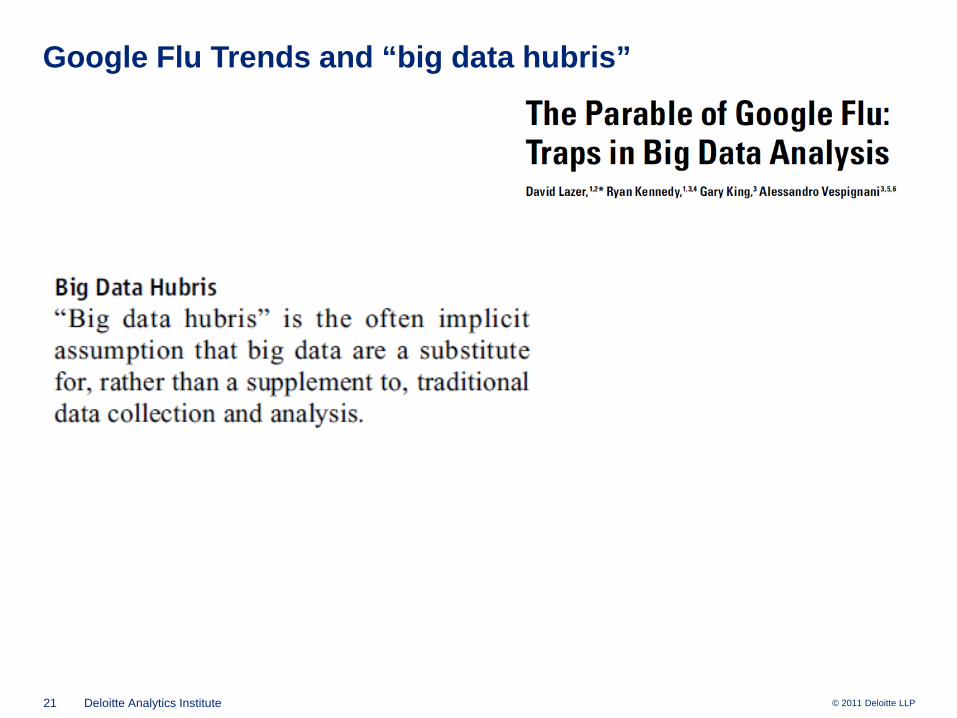
Google Flu Trends and “big data hubris”
22 Deloitte Analytics Institute © 2010 Deloitte LLP
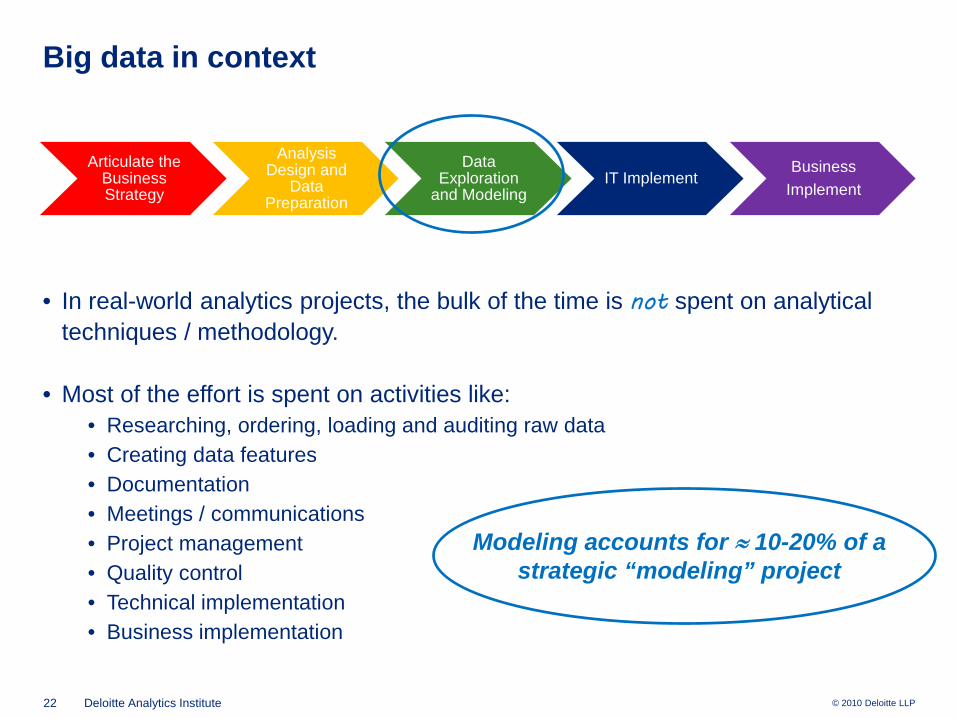
Big data in context
Articulate the Business Strategy
Analysis Design and
Data Preparation
Data Exploration
and ModelingIT Implement
BusinessImplement
• In real-world analytics projects, the bulk of the time is not spent on analytical techniques / methodology.
• Most of the effort is spent on activities like:• Researching, ordering, loading and auditing raw data• Creating data features• Documentation• Meetings / communications• Project management• Quality control• Technical implementation• Business implementation
Modeling accounts for ≈ 10-20% of a strategic “modeling” project
B is for behavioral
24 Deloitte Analytics Institute © 2011 Deloitte LLP
An early example of business analytics
(This we know)
25 Deloitte Analytics Institute © 2011 Deloitte LLP
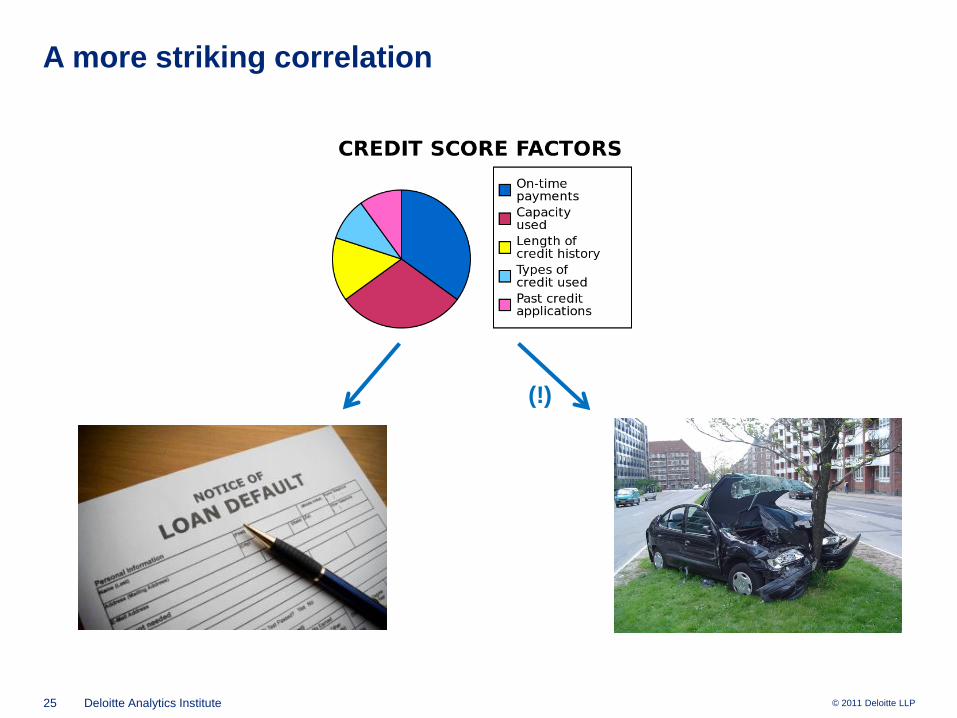
A more striking correlation
(!)
26 Deloitte Analytics Institute © 2011 Deloitte LLP
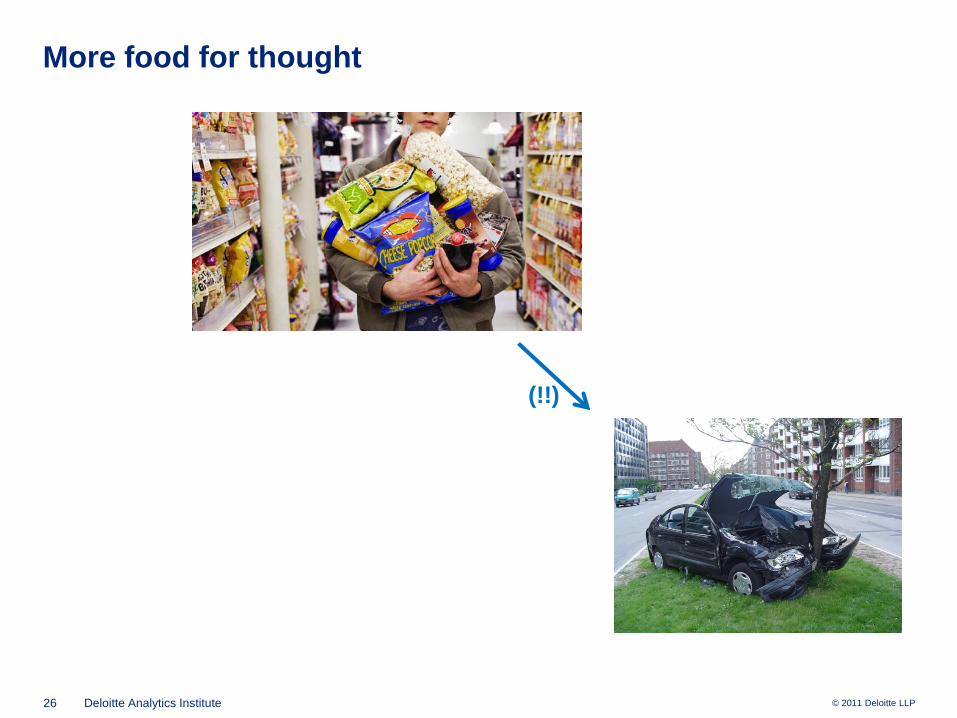
More food for thought
(!!)
27 Deloitte Analytics Institute © 2011 Deloitte LLP
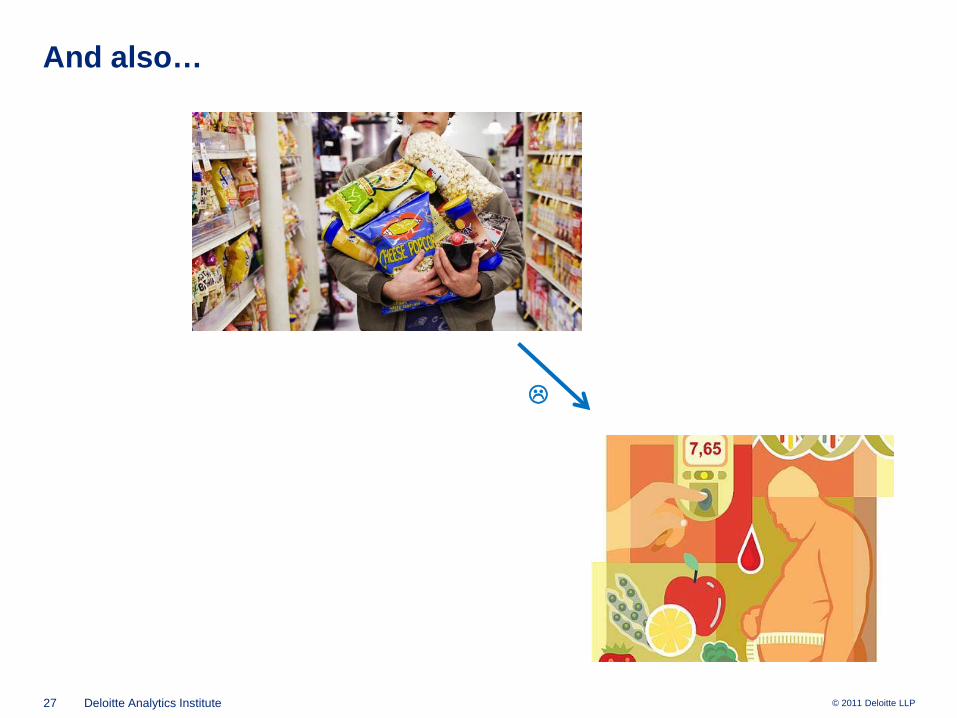
And also…
28 Deloitte Analytics Institute © 2011 Deloitte LLP
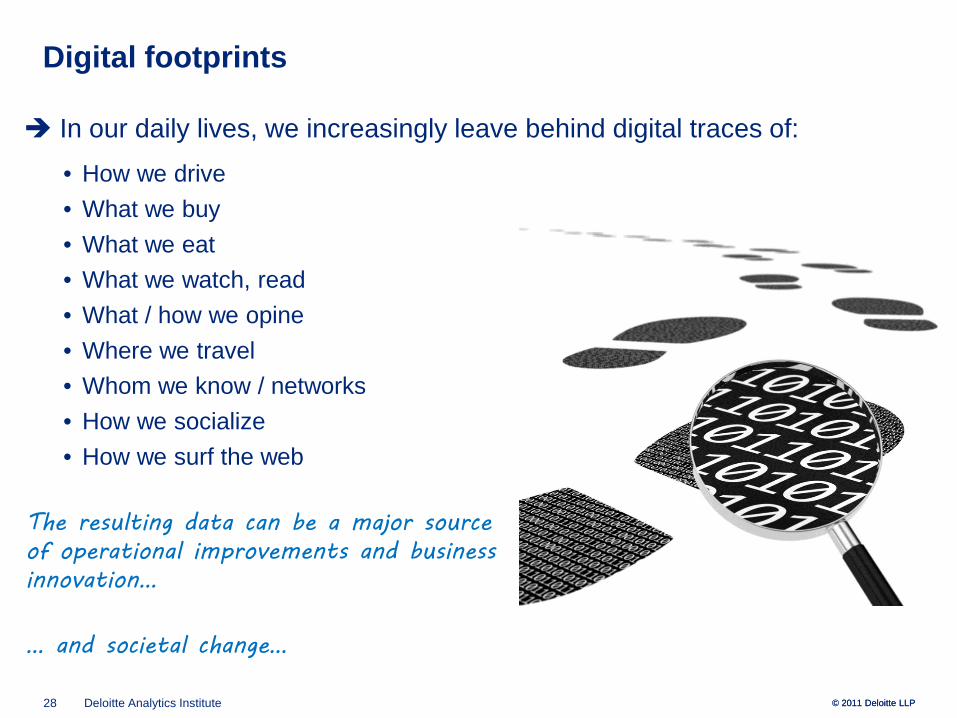
• How we drive• What we buy• What we eat• What we watch, read• What / how we opine• Where we travel• Whom we know / networks• How we socialize• How we surf the web
The resulting data can be a major source of operational improvements and business innovation…
… and societal change…
Digital footprints
© 2011 Deloitte LLP
In our daily lives, we increasingly leave behind digital traces of:
29 Deloitte Analytics Institute © 2011 Deloitte LLP
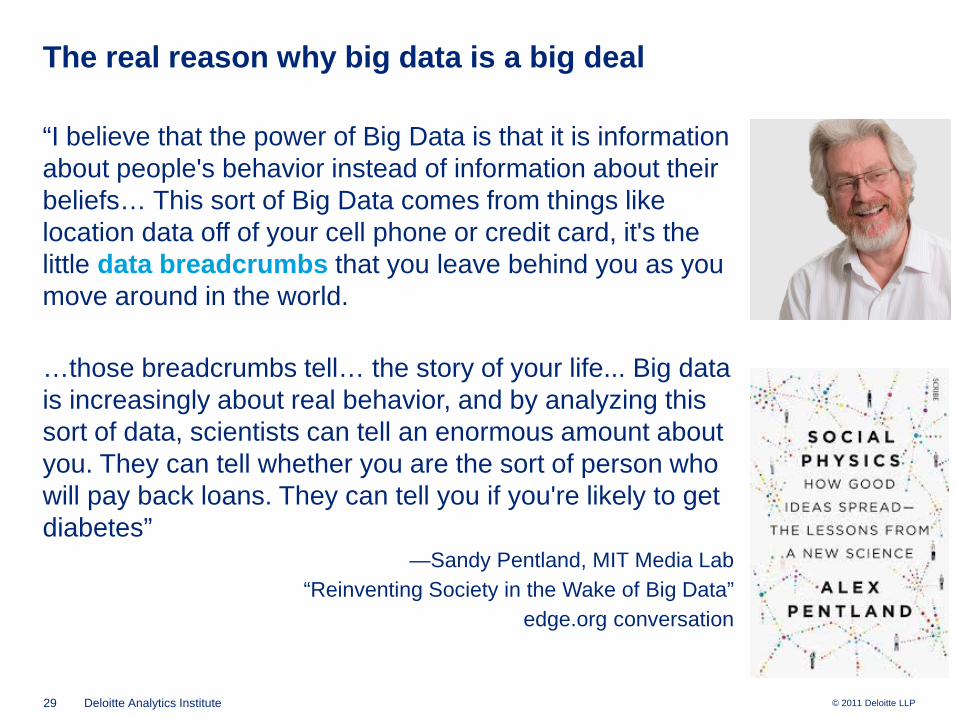
The real reason why big data is a big deal
“I believe that the power of Big Data is that it is information about people's behavior instead of information about their beliefs… This sort of Big Data comes from things like location data off of your cell phone or credit card, it's the little data breadcrumbs that you leave behind you as you move around in the world.
…those breadcrumbs tell… the story of your life... Big data is increasingly about real behavior, and by analyzing this sort of data, scientists can tell an enormous amount about you. They can tell whether you are the sort of person who will pay back loans. They can tell you if you're likely to get diabetes”
—Sandy Pentland, MIT Media Lab “Reinventing Society in the Wake of Big Data”
edge.org conversation
30 Deloitte Analytics Institute © 2011 Deloitte LLP
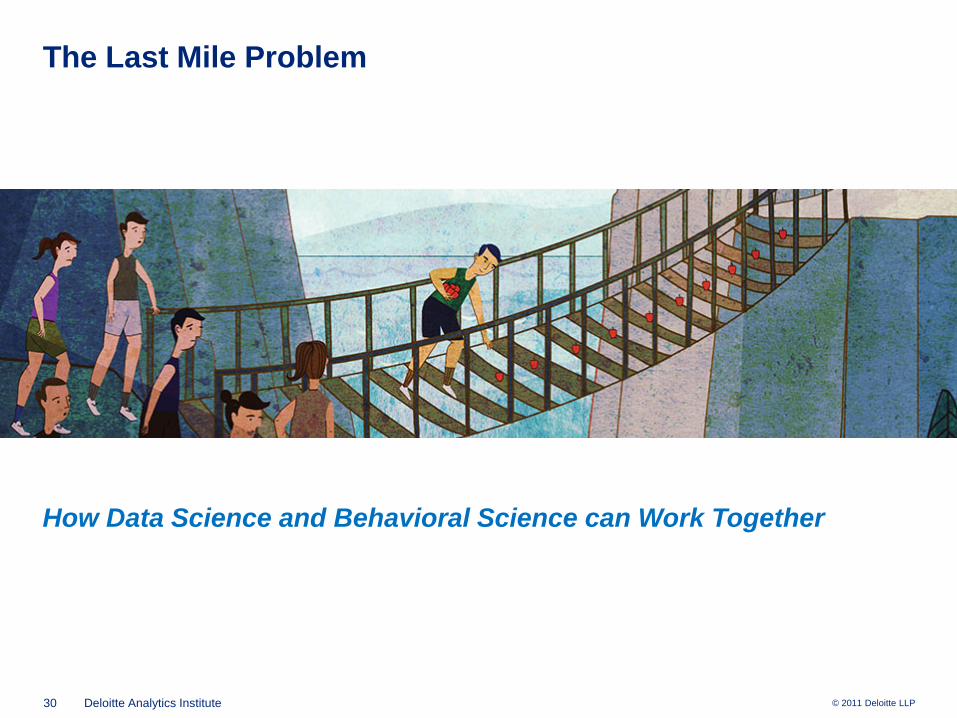
The Last Mile Problem
How Data Science and Behavioral Science can Work Together
31 Deloitte Analytics Institute © 2011 Deloitte LLP
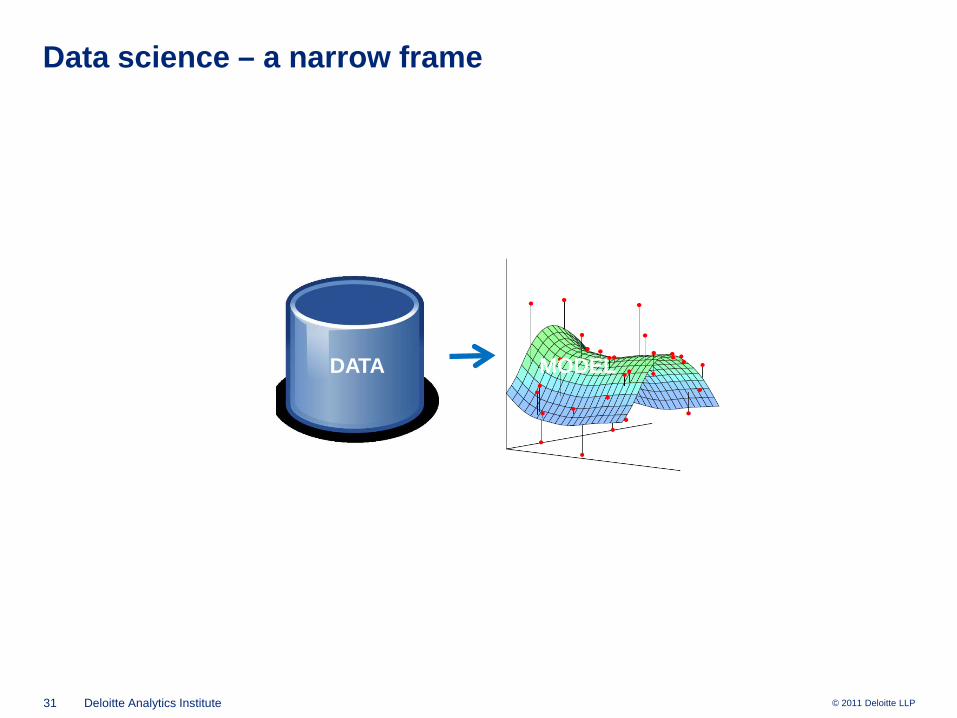
Data science – a narrow frame
DATA MODEL
32 Deloitte Analytics Institute © 2011 Deloitte LLP
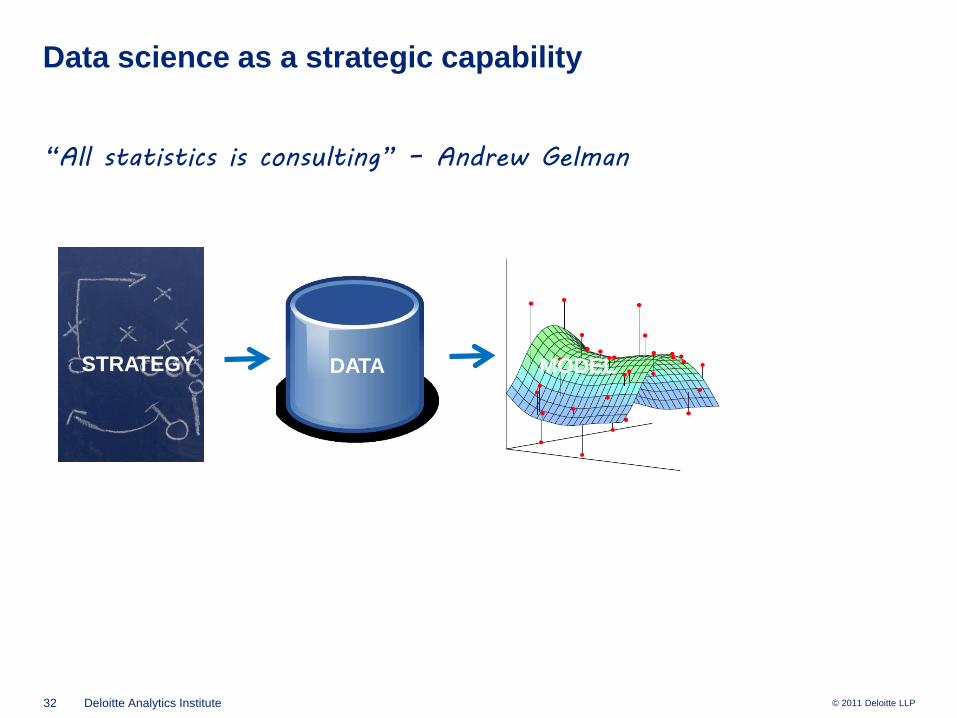
Data science as a strategic capability
“All statistics is consulting” – Andrew Gelman
DATA MODELSTRATEGY
33 Deloitte Analytics Institute © 2011 Deloitte LLP
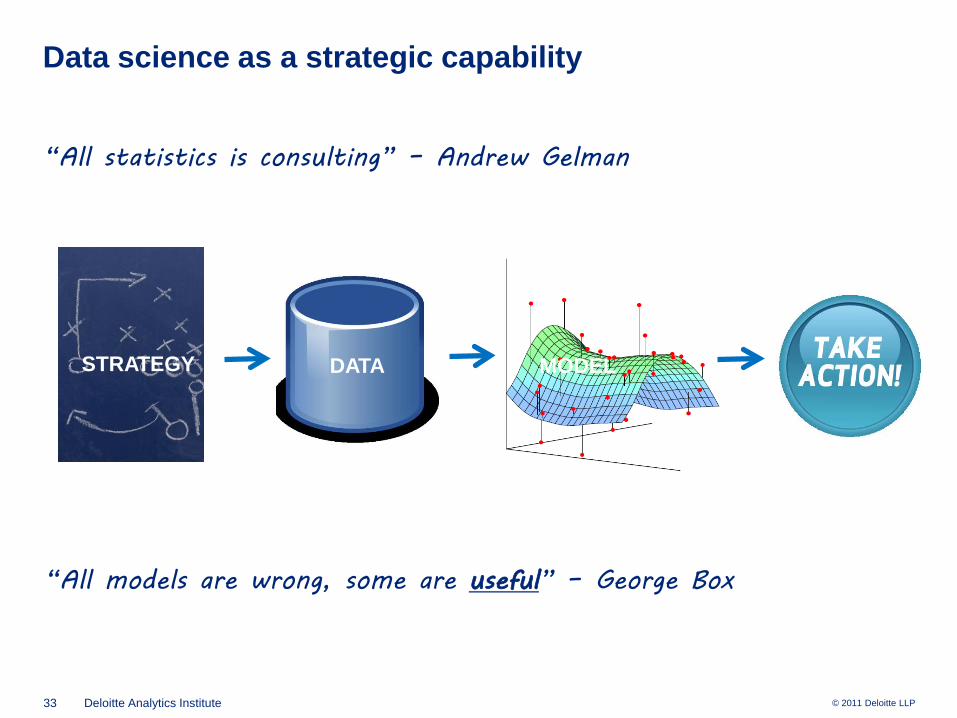
Data science as a strategic capability
“All statistics is consulting” – Andrew Gelman
DATA MODELSTRATEGY
“All models are wrong, some are useful” – George Box
34 Deloitte Analytics Institute © 2011 Deloitte LLP
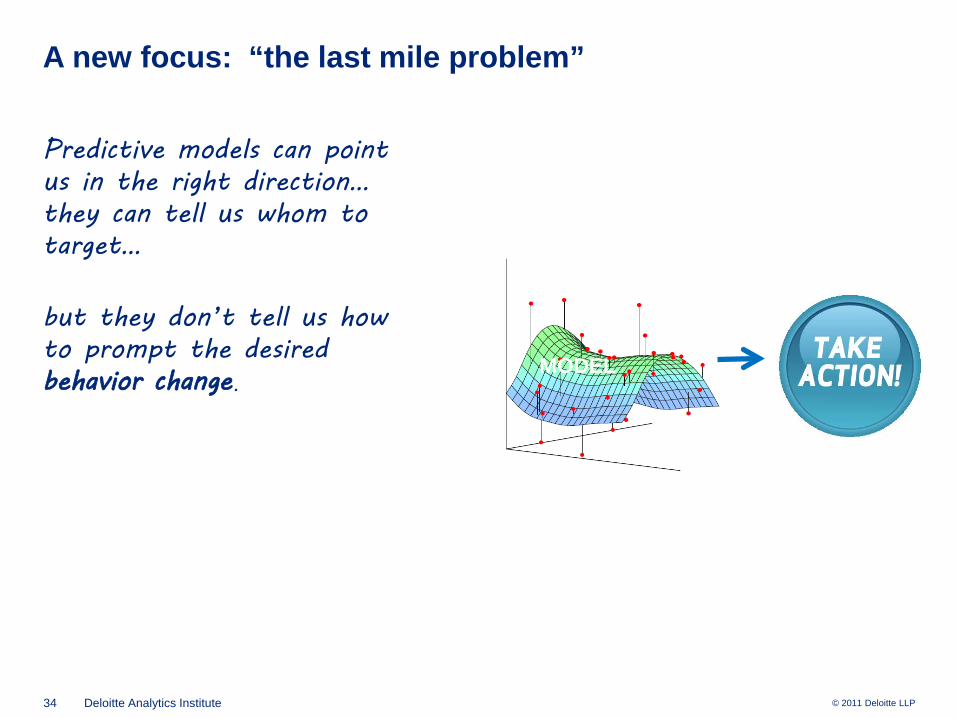
A new focus: “the last mile problem”
Predictive models can point us in the right direction… they can tell us whom to target…
but they don’t tell us how to prompt the desired behavior change.
MODEL
35 Deloitte Analytics Institute © 2011 Deloitte LLP
Yes they did
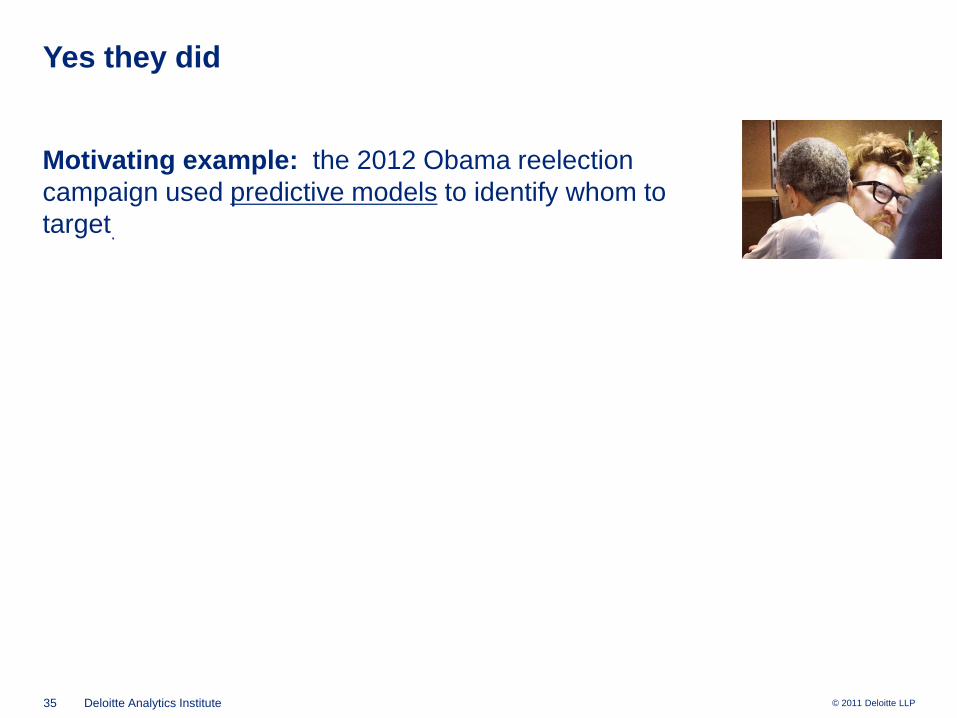
Motivating example: the 2012 Obama reelection campaign used predictive models to identify whom to target.
36 Deloitte Analytics Institute © 2011 Deloitte LLP
Yes they did
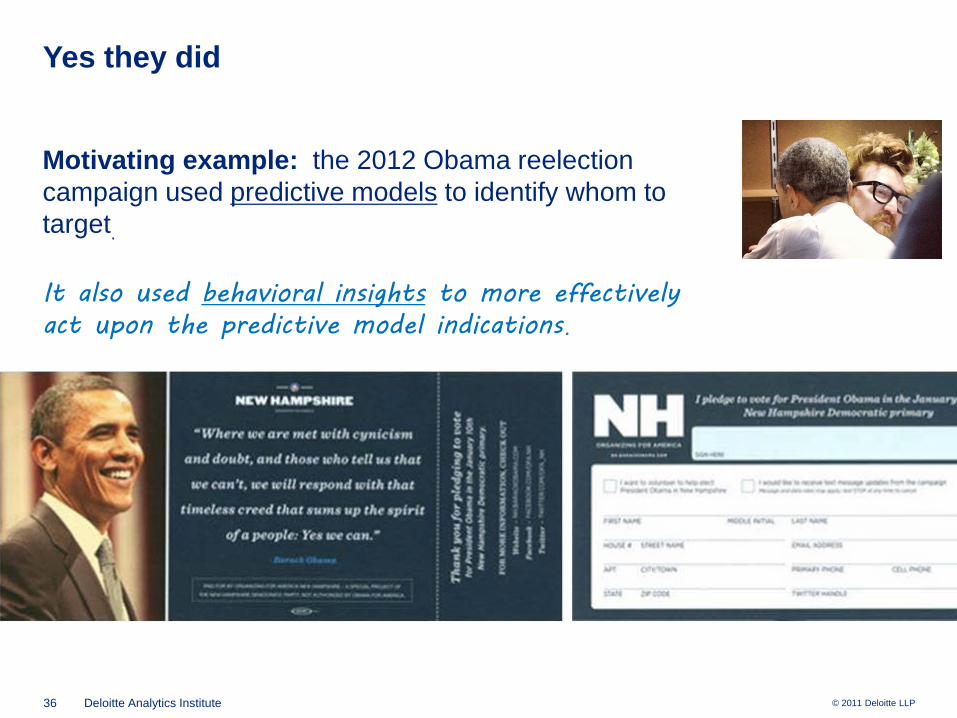
Motivating example: the 2012 Obama reelection campaign used predictive models to identify whom to target.
It also used behavioral insights to more effectively act upon the predictive model indications.
37 Deloitte Analytics Institute © 2011 Deloitte LLP
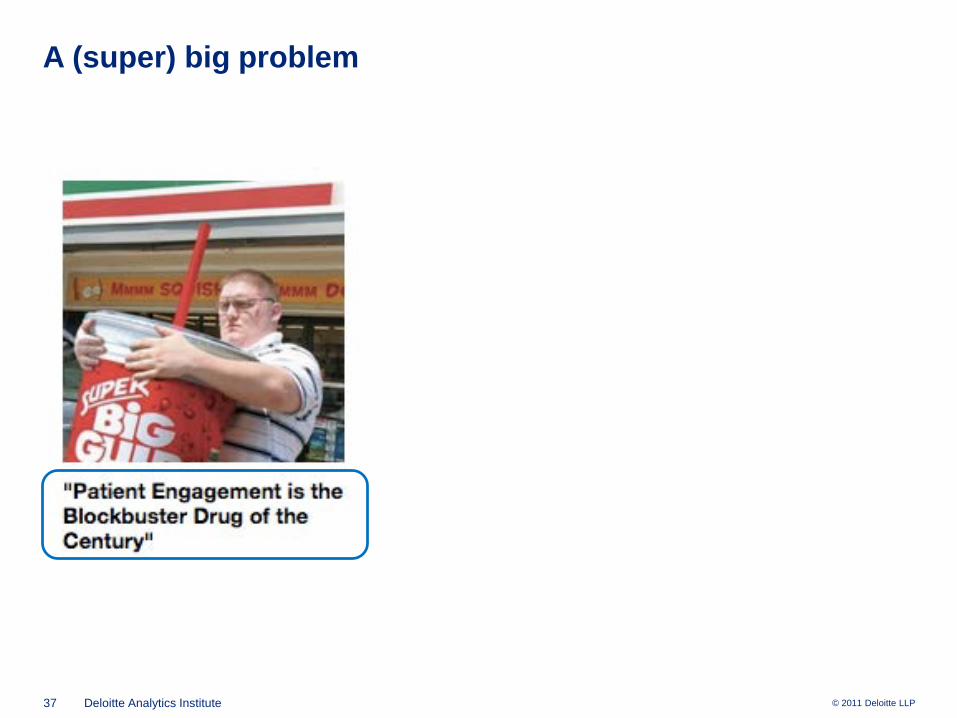
A (super) big problem
38 Deloitte Analytics Institute © 2011 Deloitte LLP
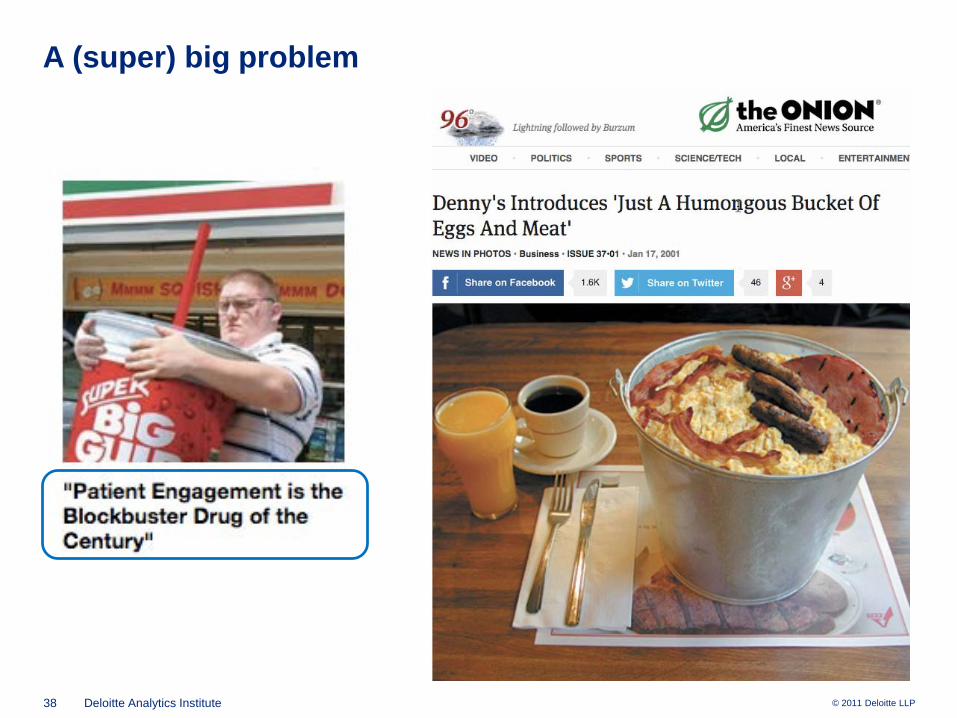
A (super) big problem
39 Deloitte Analytics Institute © 2011 Deloitte LLP
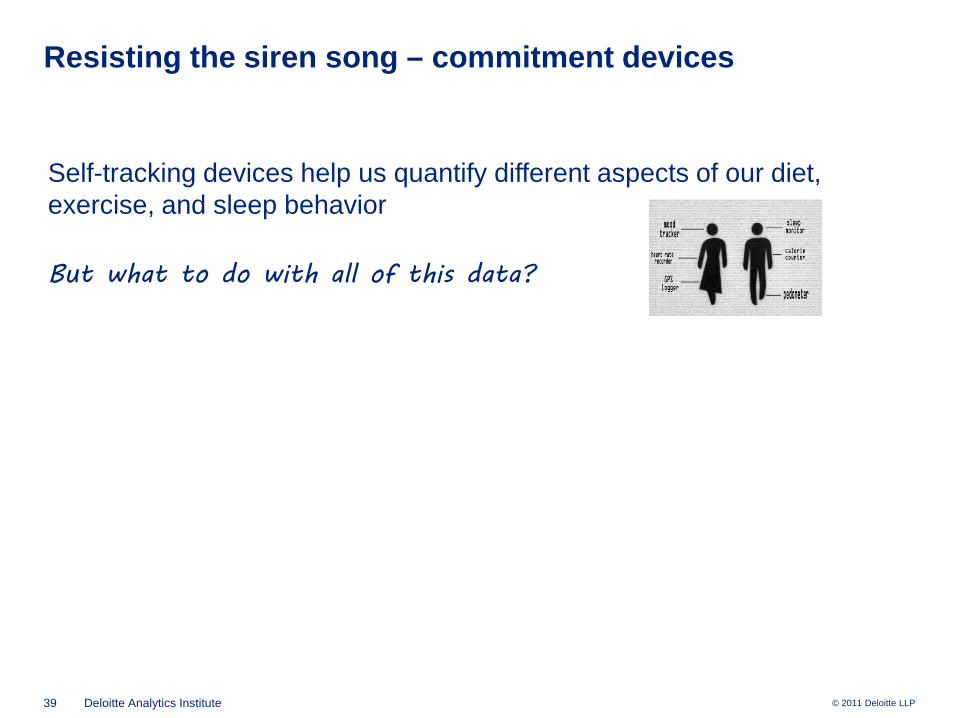
Resisting the siren song – commitment devices
Self-tracking devices help us quantify different aspects of our diet, exercise, and sleep behavior
But what to do with all of this data?
40 Deloitte Analytics Institute © 2011 Deloitte LLP
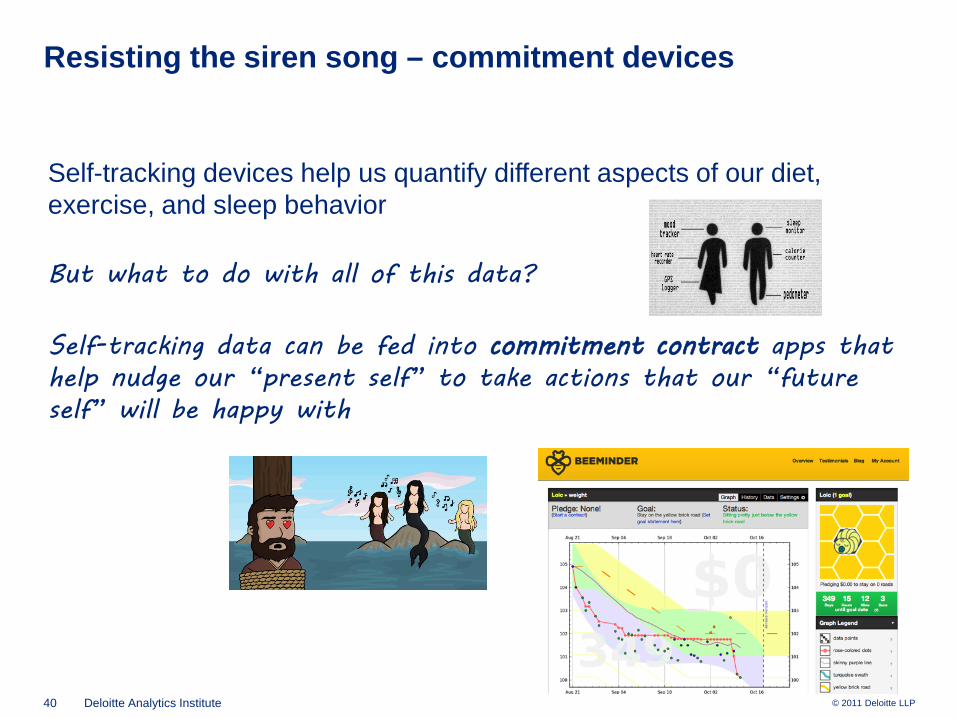
Resisting the siren song – commitment devices
Self-tracking devices help us quantify different aspects of our diet, exercise, and sleep behavior
But what to do with all of this data?
Self-tracking data can be fed into commitment contract apps that help nudge our “present self” to take actions that our “future self” will be happy with
41 Deloitte Analytics Institute © 2011 Deloitte LLP
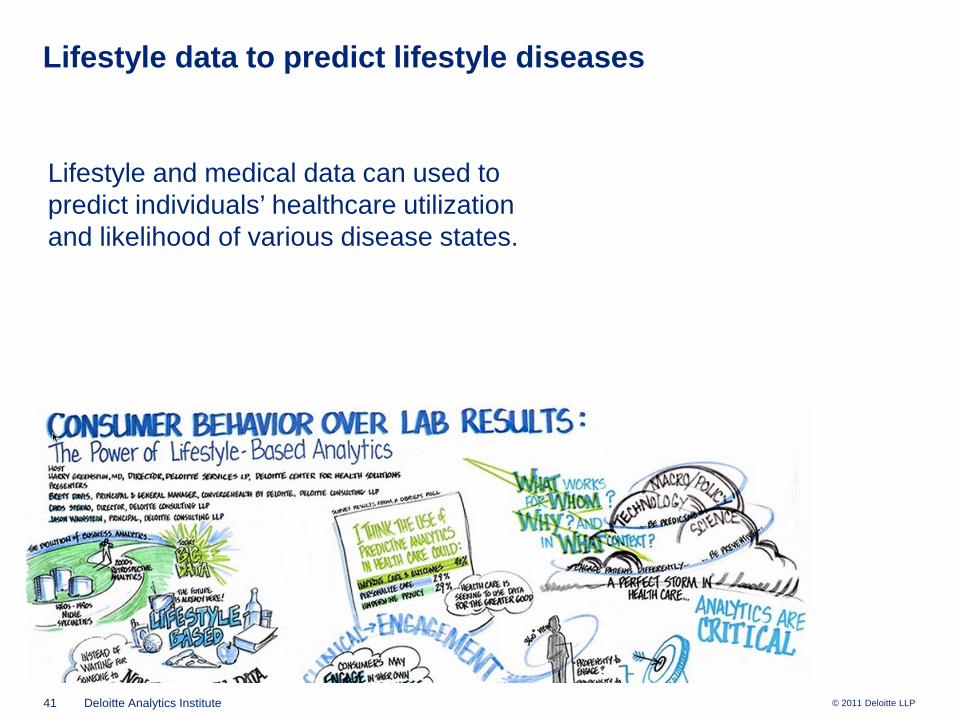
Lifestyle data to predict lifestyle diseases
Lifestyle and medical data can used to predict individuals’ healthcare utilization and likelihood of various disease states.
42 Deloitte Analytics Institute © 2011 Deloitte LLP
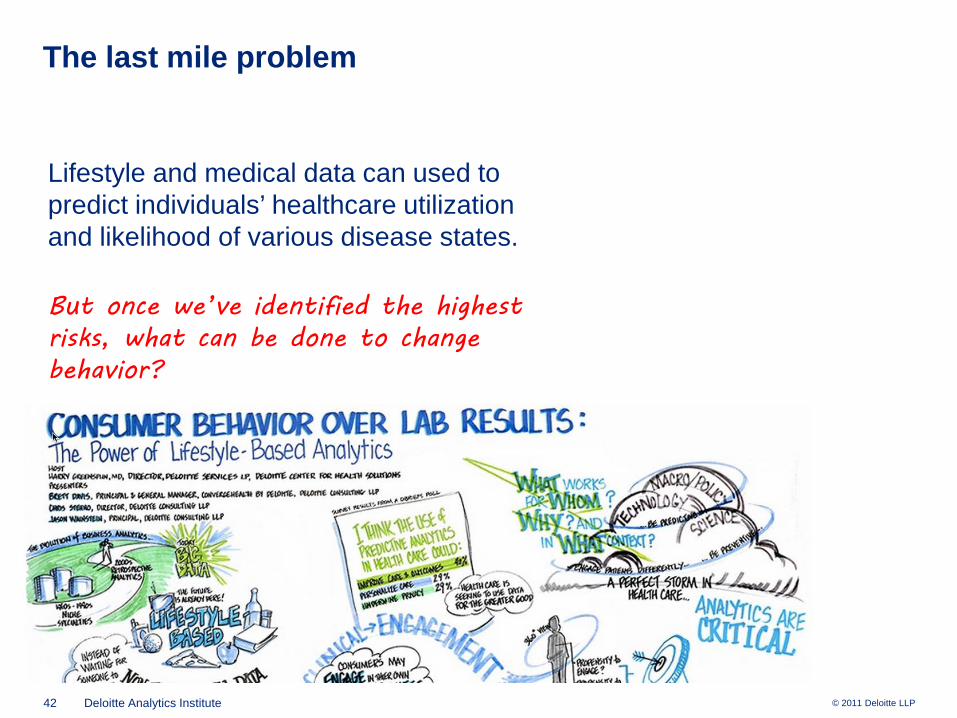
The last mile problem
Lifestyle and medical data can used to predict individuals’ healthcare utilization and likelihood of various disease states.
But once we’ve identified the highest risks, what can be done to change behavior?
43 Deloitte Analytics Institute © 2011 Deloitte LLP
House calls and health coaching
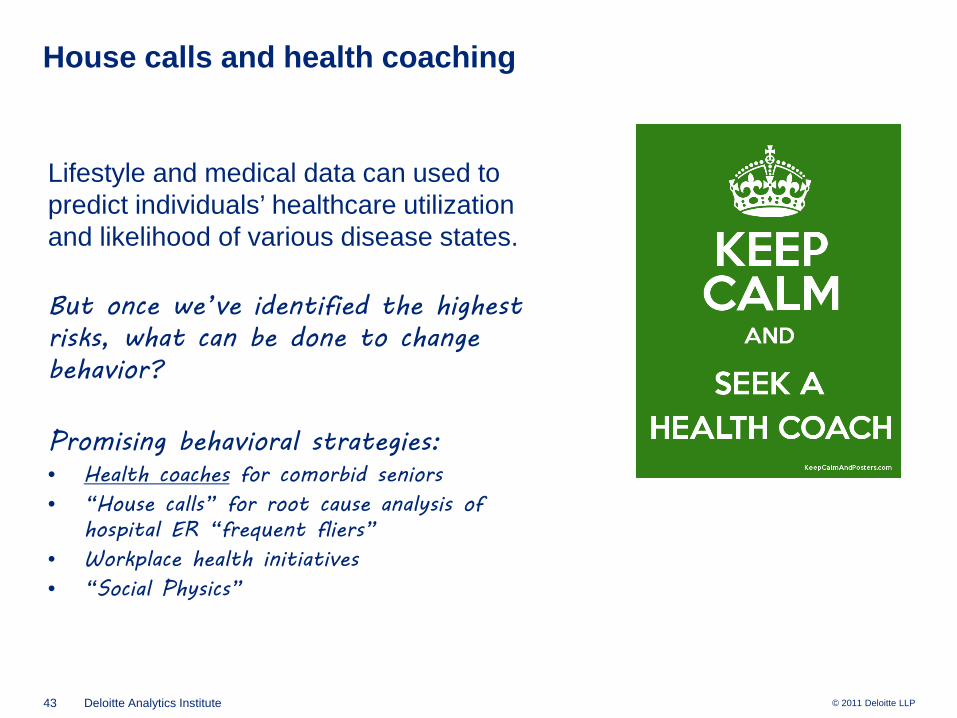
Lifestyle and medical data can used to predict individuals’ healthcare utilization and likelihood of various disease states.
But once we’ve identified the highest risks, what can be done to change behavior?
Promising behavioral strategies:• Health coaches for comorbid seniors• “House calls” for root cause analysis of
hospital ER “frequent fliers”• Workplace health initiatives• “Social Physics”
44 Deloitte Analytics Institute © 2011 Deloitte LLP
House calls and health coaching
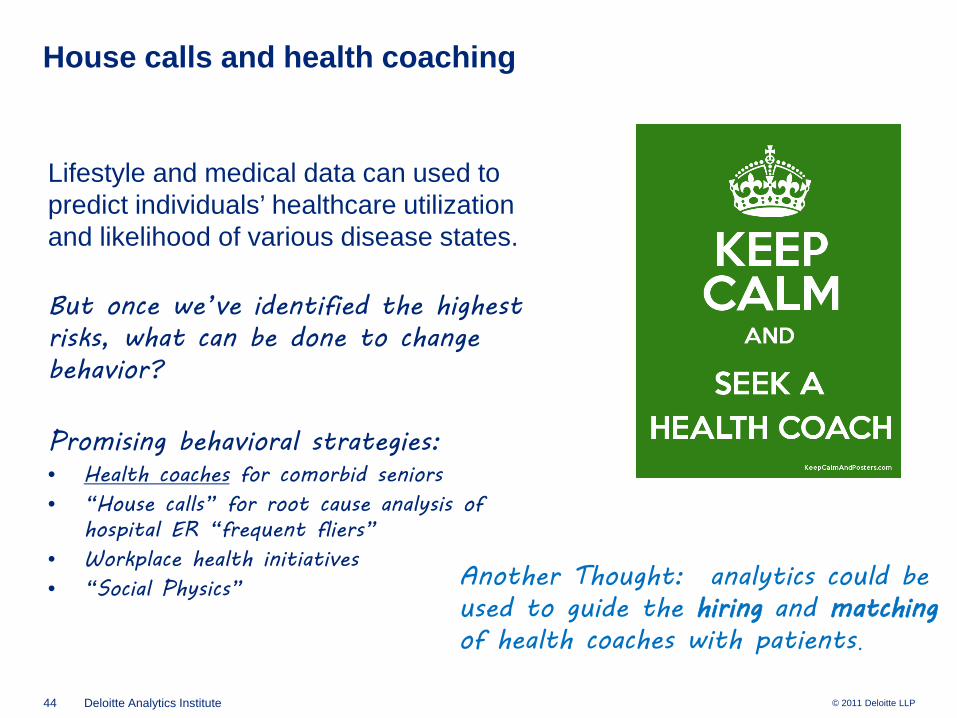
Lifestyle and medical data can used to predict individuals’ healthcare utilization and likelihood of various disease states.
But once we’ve identified the highest risks, what can be done to change behavior?
Promising behavioral strategies:• Health coaches for comorbid seniors• “House calls” for root cause analysis of
hospital ER “frequent fliers”• Workplace health initiatives• “Social Physics” Another Thought: analytics could be
used to guide the hiring and matchingof health coaches with patients.
45 Deloitte Analytics Institute © 2011 Deloitte LLP
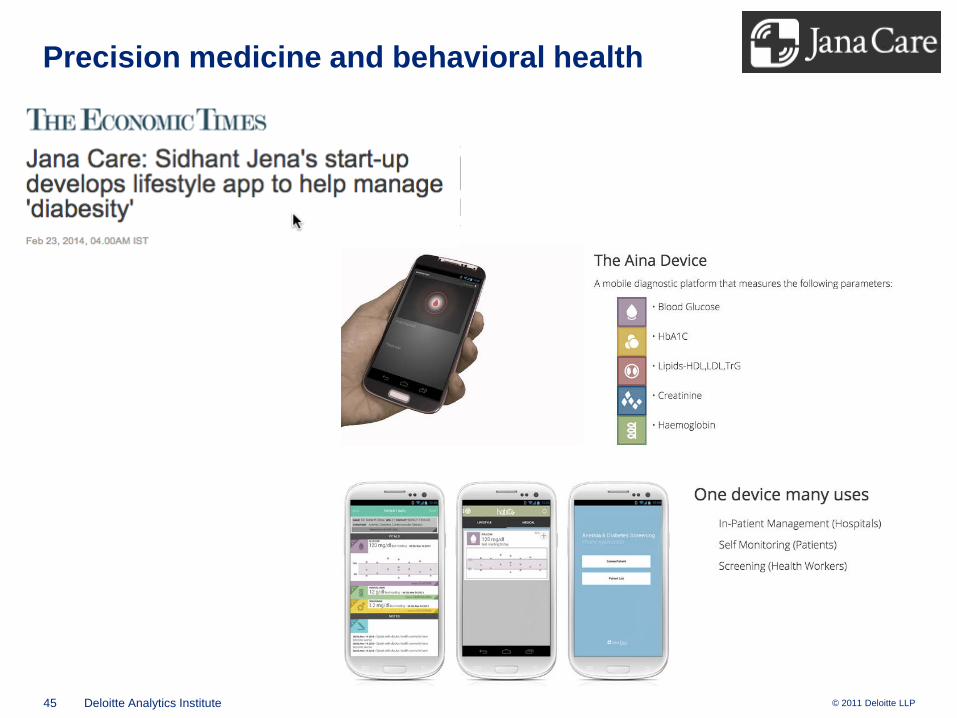
Precision medicine and behavioral health
46 Deloitte Analytics Institute © 2011 Deloitte LLP
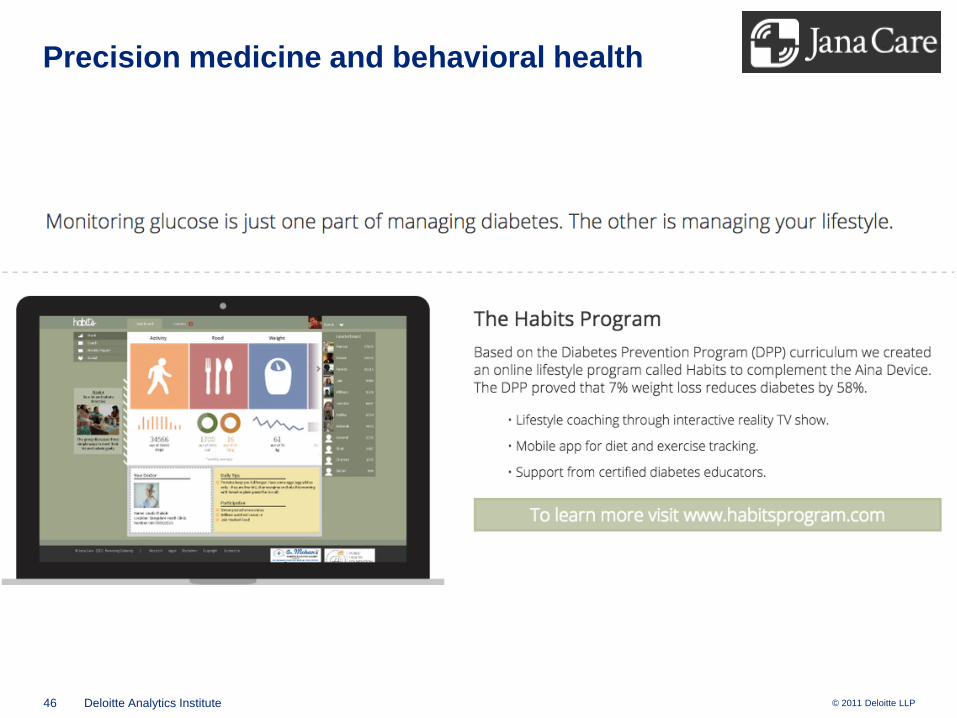
Precision medicine and behavioral health
47 Deloitte Analytics Institute © 2011 Deloitte LLP
Copies available in the lobby
More details can be found in:
Articles by James Guszcza on business analytics and behavioral science:
• “Analyzing Analytics” – Contingencies, July-Aug 2008• “Rethinking Rationality” – Contingencies July-Aug 2009• “Knowing Me, Knowing You” – Contingencies May 2012• “The Personalized and the Personal: Socially Responsible Innovation through Big Data” –
Deloitte Review January 2014• “The Last Mile Problem: How Data Science and Behavioral Science can Work Together” –
Deloitte Review January 2015