Embed Size (px)
Citation preview
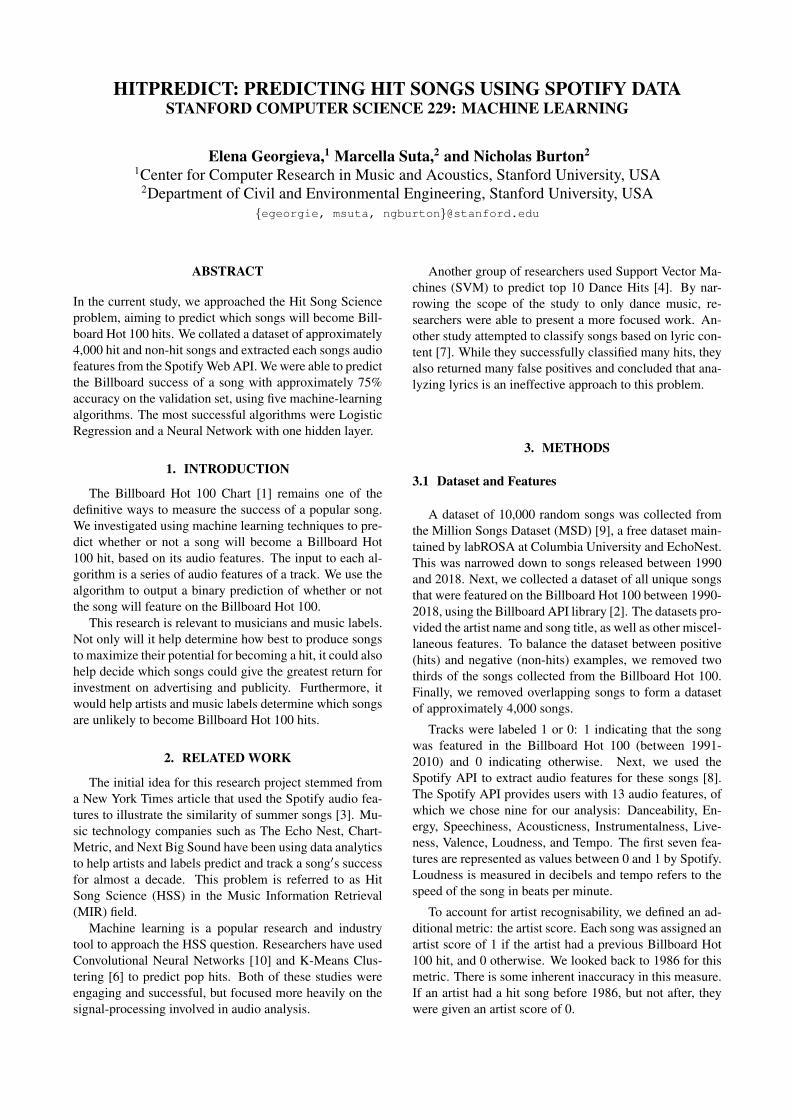
HITPREDICT: PREDICTING HIT SONGS USING SPOTIFY DATASTANFORD COMPUTER SCIENCE 229: MACHINE LEARNING
Elena Georgieva,1 Marcella Suta,2 and Nicholas Burton2
1Center for Computer Research in Music and Acoustics, Stanford University, USA2Department of Civil and Environmental Engineering, Stanford University, USA
{egeorgie, msuta, ngburton}@stanford.edu
ABSTRACT
In the current study, we approached the Hit Song Scienceproblem, aiming to predict which songs will become Bill-board Hot 100 hits. We collated a dataset of approximately4,000 hit and non-hit songs and extracted each songs audiofeatures from the Spotify Web API. We were able to predictthe Billboard success of a song with approximately 75%accuracy on the validation set, using five machine-learningalgorithms. The most successful algorithms were LogisticRegression and a Neural Network with one hidden layer.
1. INTRODUCTION
The Billboard Hot 100 Chart [1] remains one of thedefinitive ways to measure the success of a popular song.We investigated using machine learning techniques to pre-dict whether or not a song will become a Billboard Hot100 hit, based on its audio features. The input to each al-gorithm is a series of audio features of a track. We use thealgorithm to output a binary prediction of whether or notthe song will feature on the Billboard Hot 100.
This research is relevant to musicians and music labels.Not only will it help determine how best to produce songsto maximize their potential for becoming a hit, it could alsohelp decide which songs could give the greatest return forinvestment on advertising and publicity. Furthermore, itwould help artists and music labels determine which songsare unlikely to become Billboard Hot 100 hits.
2. RELATED WORK
The initial idea for this research project stemmed froma New York Times article that used the Spotify audio fea-tures to illustrate the similarity of summer songs [3]. Mu-sic technology companies such as The Echo Nest, Chart-Metric, and Next Big Sound have been using data analyticsto help artists and labels predict and track a song′s successfor almost a decade. This problem is referred to as HitSong Science (HSS) in the Music Information Retrieval(MIR) field.
Machine learning is a popular research and industrytool to approach the HSS question. Researchers have usedConvolutional Neural Networks [10] and K-Means Clus-tering [6] to predict pop hits. Both of these studies wereengaging and successful, but focused more heavily on thesignal-processing involved in audio analysis.
Another group of researchers used Support Vector Ma-chines (SVM) to predict top 10 Dance Hits [4]. By nar-rowing the scope of the study to only dance music, re-searchers were able to present a more focused work. An-other study attempted to classify songs based on lyric con-tent [7]. While they successfully classified many hits, theyalso returned many false positives and concluded that ana-lyzing lyrics is an ineffective approach to this problem.
3. METHODS
3.1 Dataset and Features
A dataset of 10,000 random songs was collected fromthe Million Songs Dataset (MSD) [9], a free dataset main-tained by labROSA at Columbia University and EchoNest.This was narrowed down to songs released between 1990and 2018. Next, we collected a dataset of all unique songsthat were featured on the Billboard Hot 100 between 1990-2018, using the Billboard API library [2]. The datasets pro-vided the artist name and song title, as well as other miscel-laneous features. To balance the dataset between positive(hits) and negative (non-hits) examples, we removed twothirds of the songs collected from the Billboard Hot 100.Finally, we removed overlapping songs to form a datasetof approximately 4,000 songs.
Tracks were labeled 1 or 0: 1 indicating that the songwas featured in the Billboard Hot 100 (between 1991-2010) and 0 indicating otherwise. Next, we used theSpotify API to extract audio features for these songs [8].The Spotify API provides users with 13 audio features, ofwhich we chose nine for our analysis: Danceability, En-ergy, Speechiness, Acousticness, Instrumentalness, Live-ness, Valence, Loudness, and Tempo. The first seven fea-tures are represented as values between 0 and 1 by Spotify.Loudness is measured in decibels and tempo refers to thespeed of the song in beats per minute.
To account for artist recognisability, we defined an ad-ditional metric: the artist score. Each song was assigned anartist score of 1 if the artist had a previous Billboard Hot100 hit, and 0 otherwise. We looked back to 1986 for thismetric. There is some inherent inaccuracy in this measure.If an artist had a hit song before 1986, but not after, theywere given an artist score of 0.
3.2 Algorithms
To predict a song′s success, we used six differentmachine-learning algorithms: Expectation Maximization(EM), Logistic Regression (LR), Gaussian DiscriminantAnalysis (GDA), Support Vector Machines (SVM), Deci-sion Trees (DT), and Neural Networks (NN). We focusedmainly on the accuracy of results, but we report the preci-sion and recall as well. False positive predictions may becostly if a music label invests in a song that is unlikely tobecome a hit.
For an initial identification of clusters in the data, weused the EM algorithm assuming no labelled data, thencompared the clusters to the actual labels. This algorithmcreates clusters of the data, according to a specified prob-ability distribution. In each iteration, the parameters ofeach cluster are calculated, and the probability of each datapoint being in each cluster is calculated. We used a Gaus-sian distribution with the following update rule.
w(i)j =
P (zi = j)P (zi = j)∑Kk=1 Pz
i = kP (zi = k)(1)
θ := argmaxθ
m∑i=1
K∑j=1
w(i)j log
P (xi, zi; θ)
w(i)j
(2)
We then used the semi-supervised EM algorithm withthe labels of a randomly selected 20 percent of the exam-ples. This algorithm incorporates the known labels into thecalculation of parameters as above.
For each supervised learning algorithm, we split thedata into training and validation examples using a 75/25split. An additional test set was not needed. We testedthe accuracy against both the training and validation labels.LR and GDA both fit a decision boundary to the data. LRuses Newtons Method to maximise the logarithmic likeli-hood on the training set, with the following algorithm.
Ha,b = 1/m
m∑i=1
x(i)a x(i)b σ(θTx(i))(1− σ(θTx(i))) (3)
∇al(θ) = 1/m
m∑i=1
x(i)a y(i) − x(i)a σ(θTx(i)) (4)
θ := θ −H−1∇l(θ) (5)
GDA fits a probability distribution to positive and neg-ative examples, and calculates the decision boundary thatmaximizes the logarithmic likelihood on the training set,using the following equations.
P (x(i); θ) =1
1 + exp(−θTx(i))(6)
θ := argmaxθlog
m∏i=1
P (x(i), y(i); θ) =
argmaxθlog∏mi=1 P (x(i)|y(i);µj ,Σ)P (y(i);ψ)
(7)We then used SVM, which creates a decision boundary
based on the data points closest to the decision boundaries,creating support vectors. We maximize the Lagrangian onthe training set with respect to values of alpha as follows.
m∑i=1
αi − 1/2
m∑i,j=1
y(i)y(j)αiαj < x(i), x(j) > (8)
αi >= 0, i = 1, ...,m (9)
m∑i=1
αiy(i) = 0 (10)
We used three different kernels (linear, radial basisfunction (RBF) and polynomial), with notably different re-sults.
DT creates a series of decision boundaries on the train-ing set. Each boundary splits the data into two clusters(within the current cluster) at a value of a feature that min-imizes the Gini loss.
|R1|L(R1) + |R2|L(R2)
|R1|+ |R2|(11)
L(Rm) =
K∑k=1
Pmk(1− pmk) (12)
Our final approach in this hit predicting problem was touse a Neural Network. We used a neural network regular-ization, with one hidden layer of six units and the sigmoidactivation function. The L2 regularization function was ap-plied to the cost function to avoid over-fitting.
J(W ) =
N∑i=1
(y − y) + ||α1W1 + α2W2||2 (13)
Where W1 is the weight matrix mapping the features tothe hidden layer and W2 is the weight matrix mapping theoutput of the hidden layer to the final output.
4. RESULTS
We used accuracy, precision and recall on the trainingand validation sets to evaluate the performance of each al-gorithm (Figure 2). Note that plots in this section showonly two features: Danceability and Acousticness.
The EM algorithm gave a poor accuracy of 50.1%, withpredictions on data points matching poorly to their actuallabels (Figure 1). The semi-supervised EM algorithm alsogave a poor accuracy of 46.9%. We concluded that un-supervised learning algorithms are inappropriate for thissupervised learning problem.
LR and GDA yielded a reasonable accuracy of 75.9%and 73.7% against the validation data, with similar accu-racy against the training data indicating no overfitting. The
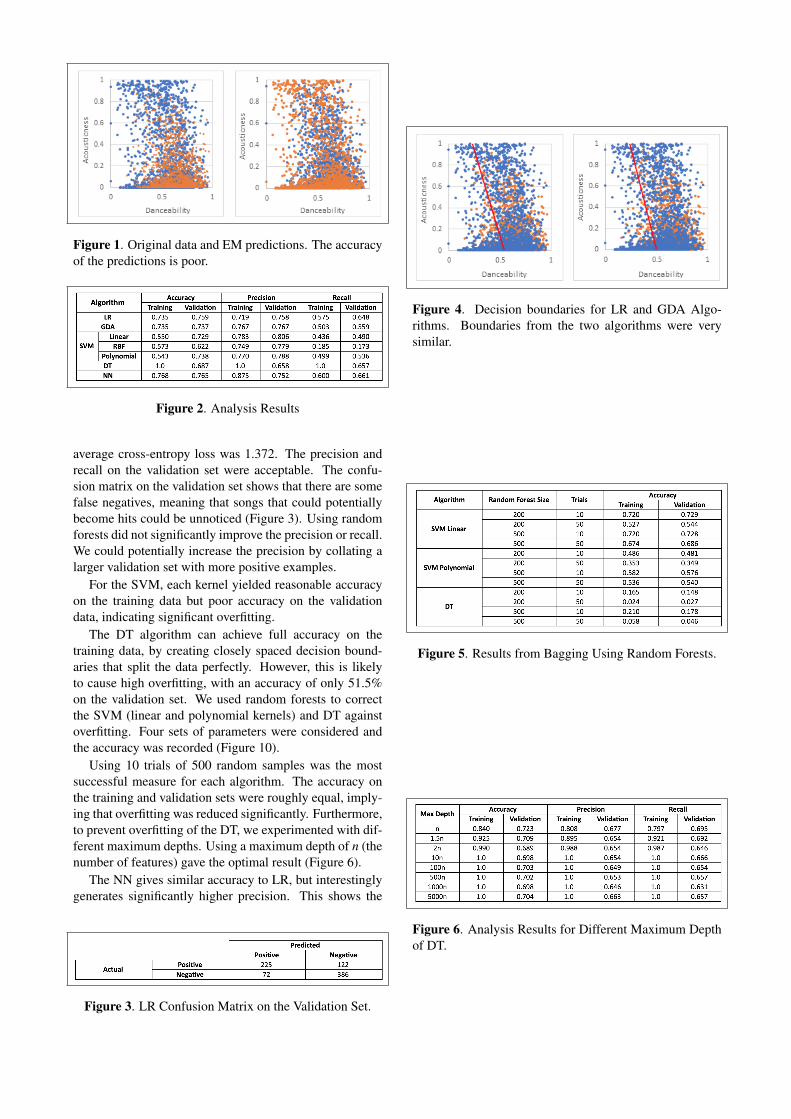
Figure 1. Original data and EM predictions. The accuracyof the predictions is poor.
Figure 2. Analysis Results
average cross-entropy loss was 1.372. The precision andrecall on the validation set were acceptable. The confu-sion matrix on the validation set shows that there are somefalse negatives, meaning that songs that could potentiallybecome hits could be unnoticed (Figure 3). Using randomforests did not significantly improve the precision or recall.We could potentially increase the precision by collating alarger validation set with more positive examples.
For the SVM, each kernel yielded reasonable accuracyon the training data but poor accuracy on the validationdata, indicating significant overfitting.
The DT algorithm can achieve full accuracy on thetraining data, by creating closely spaced decision bound-aries that split the data perfectly. However, this is likelyto cause high overfitting, with an accuracy of only 51.5%on the validation set. We used random forests to correctthe SVM (linear and polynomial kernels) and DT againstoverfitting. Four sets of parameters were considered andthe accuracy was recorded (Figure 10).
Using 10 trials of 500 random samples was the mostsuccessful measure for each algorithm. The accuracy onthe training and validation sets were roughly equal, imply-ing that overfitting was reduced significantly. Furthermore,to prevent overfitting of the DT, we experimented with dif-ferent maximum depths. Using a maximum depth of n (thenumber of features) gave the optimal result (Figure 6).
The NN gives similar accuracy to LR, but interestinglygenerates significantly higher precision. This shows the
Figure 3. LR Confusion Matrix on the Validation Set.
Figure 4. Decision boundaries for LR and GDA Algo-rithms. Boundaries from the two algorithms were verysimilar.
Figure 5. Results from Bagging Using Random Forests.
Figure 6. Analysis Results for Different Maximum Depthof DT.
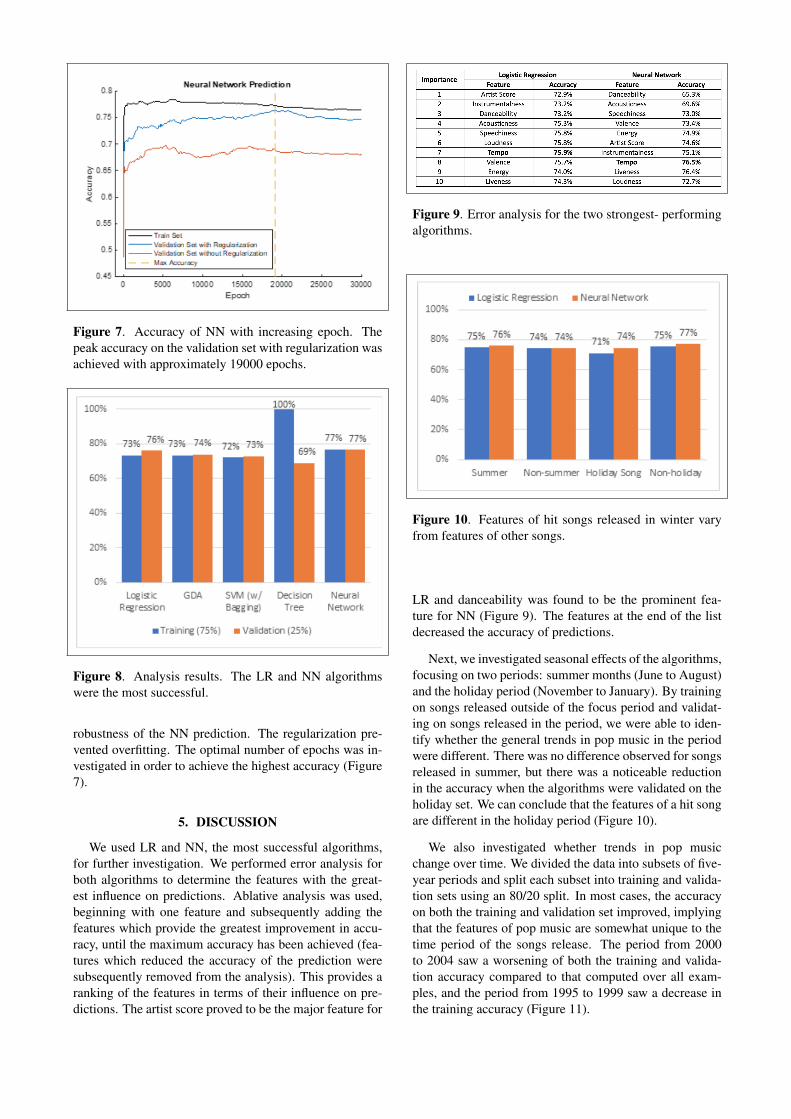
Figure 7. Accuracy of NN with increasing epoch. Thepeak accuracy on the validation set with regularization wasachieved with approximately 19000 epochs.
Figure 8. Analysis results. The LR and NN algorithmswere the most successful.
robustness of the NN prediction. The regularization pre-vented overfitting. The optimal number of epochs was in-vestigated in order to achieve the highest accuracy (Figure7).
5. DISCUSSION
We used LR and NN, the most successful algorithms,for further investigation. We performed error analysis forboth algorithms to determine the features with the great-est influence on predictions. Ablative analysis was used,beginning with one feature and subsequently adding thefeatures which provide the greatest improvement in accu-racy, until the maximum accuracy has been achieved (fea-tures which reduced the accuracy of the prediction weresubsequently removed from the analysis). This provides aranking of the features in terms of their influence on pre-dictions. The artist score proved to be the major feature for
Figure 9. Error analysis for the two strongest- performingalgorithms.
Figure 10. Features of hit songs released in winter varyfrom features of other songs.
LR and danceability was found to be the prominent fea-ture for NN (Figure 9). The features at the end of the listdecreased the accuracy of predictions.
Next, we investigated seasonal effects of the algorithms,focusing on two periods: summer months (June to August)and the holiday period (November to January). By trainingon songs released outside of the focus period and validat-ing on songs released in the period, we were able to iden-tify whether the general trends in pop music in the periodwere different. There was no difference observed for songsreleased in summer, but there was a noticeable reductionin the accuracy when the algorithms were validated on theholiday set. We can conclude that the features of a hit songare different in the holiday period (Figure 10).
We also investigated whether trends in pop musicchange over time. We divided the data into subsets of five-year periods and split each subset into training and valida-tion sets using an 80/20 split. In most cases, the accuracyon both the training and validation set improved, implyingthat the features of pop music are somewhat unique to thetime period of the songs release. The period from 2000to 2004 saw a worsening of both the training and valida-tion accuracy compared to that computed over all exam-ples, and the period from 1995 to 1999 saw a decrease inthe training accuracy (Figure 11).
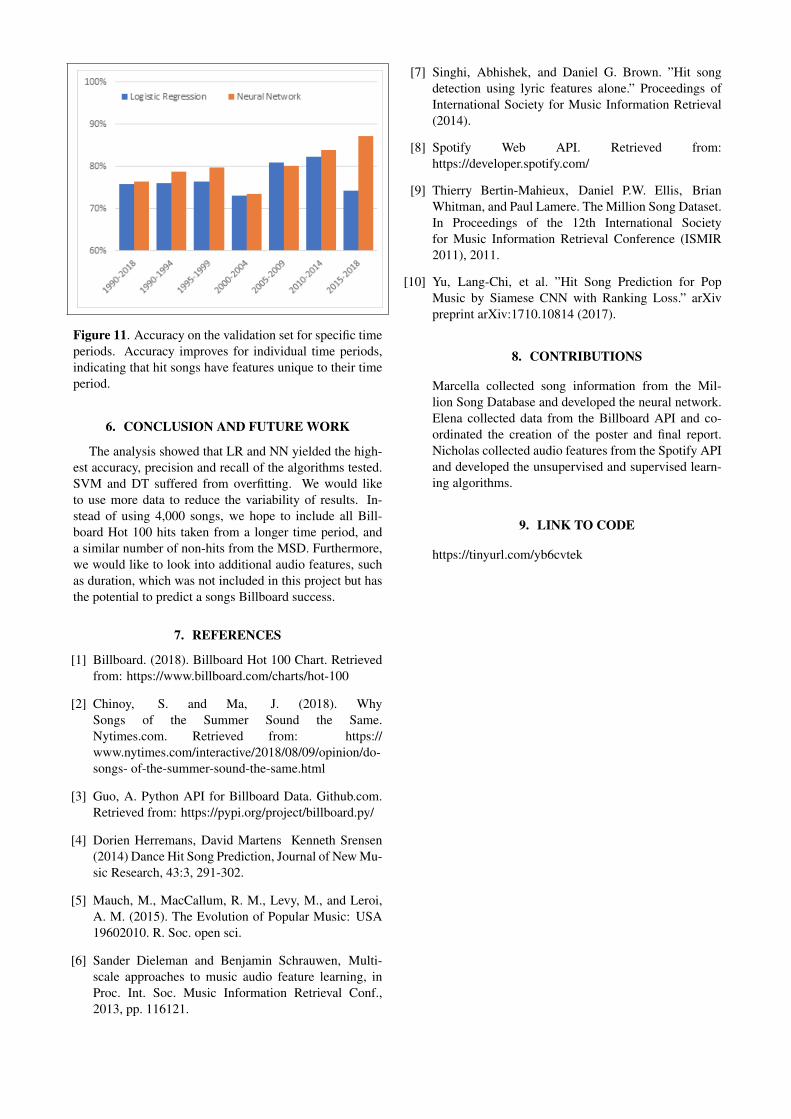
Figure 11. Accuracy on the validation set for specific timeperiods. Accuracy improves for individual time periods,indicating that hit songs have features unique to their timeperiod.
6. CONCLUSION AND FUTURE WORK
The analysis showed that LR and NN yielded the high-est accuracy, precision and recall of the algorithms tested.SVM and DT suffered from overfitting. We would liketo use more data to reduce the variability of results. In-stead of using 4,000 songs, we hope to include all Bill-board Hot 100 hits taken from a longer time period, anda similar number of non-hits from the MSD. Furthermore,we would like to look into additional audio features, suchas duration, which was not included in this project but hasthe potential to predict a songs Billboard success.
7. REFERENCES
[1] Billboard. (2018). Billboard Hot 100 Chart. Retrievedfrom: https://www.billboard.com/charts/hot-100
[2] Chinoy, S. and Ma, J. (2018). WhySongs of the Summer Sound the Same.Nytimes.com. Retrieved from: https://www.nytimes.com/interactive/2018/08/09/opinion/do-songs- of-the-summer-sound-the-same.html
[3] Guo, A. Python API for Billboard Data. Github.com.Retrieved from: https://pypi.org/project/billboard.py/
[4] Dorien Herremans, David Martens Kenneth Srensen(2014) Dance Hit Song Prediction, Journal of New Mu-sic Research, 43:3, 291-302.
[5] Mauch, M., MacCallum, R. M., Levy, M., and Leroi,A. M. (2015). The Evolution of Popular Music: USA19602010. R. Soc. open sci.
[6] Sander Dieleman and Benjamin Schrauwen, Multi-scale approaches to music audio feature learning, inProc. Int. Soc. Music Information Retrieval Conf.,2013, pp. 116121.
[7] Singhi, Abhishek, and Daniel G. Brown. ”Hit songdetection using lyric features alone.” Proceedings ofInternational Society for Music Information Retrieval(2014).
[8] Spotify Web API. Retrieved from:https://developer.spotify.com/
[9] Thierry Bertin-Mahieux, Daniel P.W. Ellis, BrianWhitman, and Paul Lamere. The Million Song Dataset.In Proceedings of the 12th International Societyfor Music Information Retrieval Conference (ISMIR2011), 2011.
[10] Yu, Lang-Chi, et al. ”Hit Song Prediction for PopMusic by Siamese CNN with Ranking Loss.” arXivpreprint arXiv:1710.10814 (2017).
8. CONTRIBUTIONS
Marcella collected song information from the Mil-lion Song Database and developed the neural network.Elena collected data from the Billboard API and co-ordinated the creation of the poster and final report.Nicholas collected audio features from the Spotify APIand developed the unsupervised and supervised learn-ing algorithms.
9. LINK TO CODE
https://tinyurl.com/yb6cvtek