Embed Size (px)
Citation preview
Envisioning the future
3rd
EUROCONTROL Innovative ResearchWorkshop
December 9th & 10th, 2004
EUROCONTROL Experimental
Centre
EUROCONTROL Experimental
Centre
Envisioning the future
l AGENDA
l EXHIBITION
l CARE-II Quantum Cryptography
l CARE-II SCOPE
l CARE-II ANIMS
l CARE-II Visu Airport
l CARE-II Airport of the future
l CARE-II Neural Network
l Interactive & immersive 3D visualisation for ATC
l Wheelie
l VITAL
l Augmented reality for tower control
l Augmented reality for tower control - performance assessment
l Advanced speech watermarking for secure aircraft identification
l Open source
l Future airport concept
l Analyse the impact of small aircraft on ATM in Europe
l Paradigm Shift
l Complexity Of Speed Resolutions
l Air Rail Intermodlity from passenger perspective
l Model based conflict detection and resolution
l Stochastic uncertainties in air path planning
l En Route slot allocation under uncertainty
l ATFM pre tactical planning
l Implicit structures and real-time slot allocation for ATC
l Optimal flight level Assignment introducing uncertainty
l Column generation for dynamic ATFM
l Evaluation of a first approach in generating the trunk route network
l Speed uncertainty & regulation for conflict detection & resolution
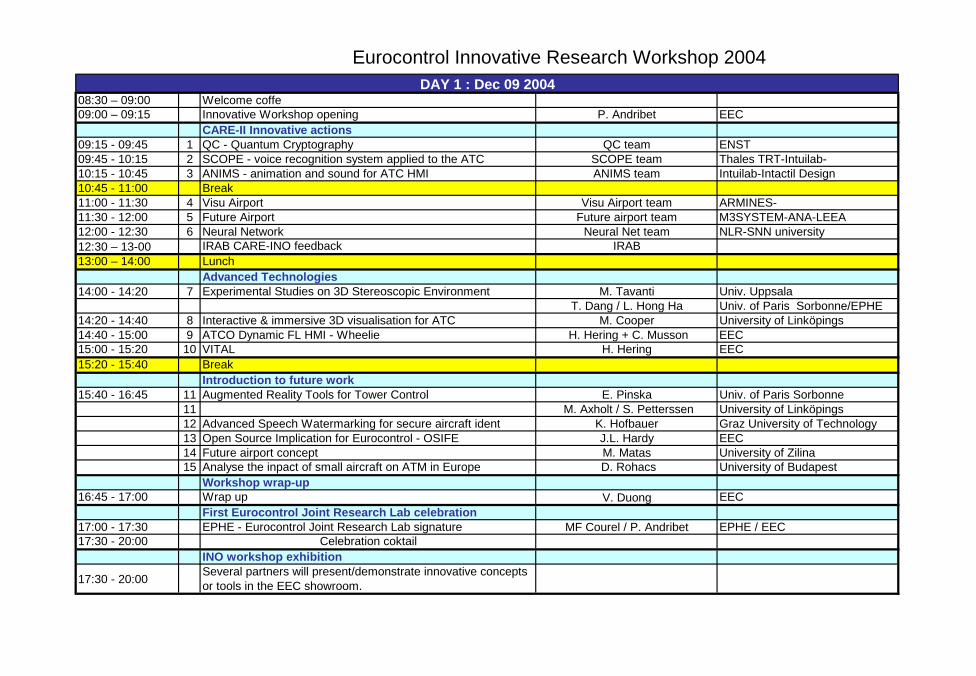
Eurocontrol Innovative Research Workshop 2004
08:30 – 09:00 Welcome coffe09:00 – 09:15 Innovative Workshop opening P. Andribet EEC
CARE-II Innovative actions09:15 - 09:45 1 QC - Quantum Cryptography QC team ENST09:45 - 10:15 2 SCOPE - voice recognition system applied to the ATC SCOPE team Thales TRT-Intuilab-10:15 - 10:45 3 ANIMS - animation and sound for ATC HMI ANIMS team Intuilab-Intactil Design10:45 - 11:00 Break11:00 - 11:30 4 Visu Airport Visu Airport team ARMINES-11:30 - 12:00 5 Future Airport Future airport team M3SYSTEM-ANA-LEEA12:00 - 12:30 6 Neural Network Neural Net team NLR-SNN university12:30 – 13-00 IRAB CARE-INO feedback IRAB13:00 – 14:00 Lunch
Advanced Technologies14:00 - 14:20 7 Experimental Studies on 3D Stereoscopic Environment M. Tavanti Univ. Uppsala
T. Dang / L. Hong Ha Univ. of Paris Sorbonne/EPHE14:20 - 14:40 8 Interactive & immersive 3D visualisation for ATC M. Cooper University of Linköpings14:40 - 15:00 9 ATCO Dynamic FL HMI - Wheelie H. Hering + C. Musson EEC15:00 - 15:20 10 VITAL H. Hering EEC15:20 - 15:40 Break
Introduction to future work15:40 - 16:45 11 Augmented Reality Tools for Tower Control E. Pinska Univ. of Paris Sorbonne
11 M. Axholt / S. Petterssen University of Linköpings12 Advanced Speech Watermarking for secure aircraft ident K. Hofbauer Graz University of Technology13 Open Source Implication for Eurocontrol - OSIFE J.L. Hardy EEC14 Future airport concept M. Matas University of Zilina15 Analyse the inpact of small aircraft on ATM in Europe D. Rohacs University of Budapest
Workshop wrap-up16:45 - 17:00 Wrap up V. Duong EEC
First Eurocontrol Joint Research Lab celebration17:00 - 17:30 EPHE - Eurocontrol Joint Research Lab signature MF Courel / P. Andribet EPHE / EEC17:30 - 20:00 Celebration coktail
INO workshop exhibition
17:30 - 20:00 Several partners will present/demonstrate innovative concepts or tools in the EEC showroom.
DAY 1 : Dec 09 2004

Eurocontrol Innovative Research Workshop 2004
08:30 – 09:00 Welcome coffe09:00 – 09:15 Innovative Workshop welcoming V. Duong EEC
Advanced ATM Concept09:15 - 10:00 16 PARADIGM SHIFT L. Guichard ; S. Guibert EEC
Shift team - J. Laborde University of Aix (IFURTA)10:00 - 10:20 17 Complexity of speed resolutions - conflict density R. Ehrmanntraut EEC10:20 - 10:35 18 TUBES concepts - to be confirmed M. Brochard EEC10:35 - 10:55 19 Air-Rail multimodal PAX A. Cokasova University of Zilina10:55 - 11:15 Break
Uncertainty Modelling - I11:15 - 11:35 20 Model Based Conflict Detection and resolution J. Lygeros Univ. Patras11:35 - 11:55 21 Stochastic uncertainties in air path planning D. Sohier LDCI EPHE Paris11:55 - 12:15 22 En-route slot allocation under uncertainty F. Ferchaud Labri - Univ. Bordeaux12:15 - 12:35 23 ATFM pre tactical planning N. Belouardy ENST Paris 12:35 – 13:00 24 Implicit Structures and time-slot allocation for ATC C. Gwignner Ecole Polytechnique13:00 – 14:00 Lunch
Uncertainty Modelling - II14:00 – 14:20 25 Optimal flight level assignment : introducing uncertainty S. Constans - N.E el Faouzi INRETS14:20 - 14:40 26 Column generation for dynamic ATFM Olivier Richard INRETS
14:40 - 15:00 27 Evaluation of a first approach in generating the trunk route network T. Riviere CENA - INPT
15:00 - 15:20 28 Speed uncertainty & regulation for conflict detection & resolution N. Archambault CENA - INPT
15:20 - 15:40 BreakINO Business Plan
15:40 - 16:10 INO strategy for 2005 - 2009 V. Duong EEC16:10 - 16:30 Comments from the Advisory Board / Discussions IRAB16:30 - 16:45 Innovative Workshop closure V. Duong EEC
DAY 2 : Dec 10 2004
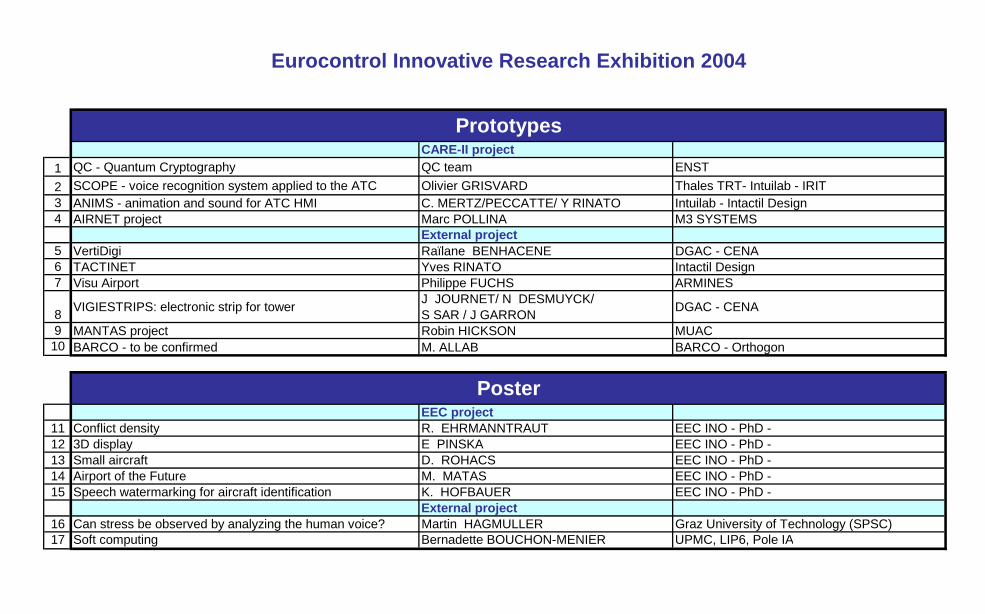
CARE-II project1 QC - Quantum Cryptography QC team ENST2 SCOPE - voice recognition system applied to the ATC Olivier GRISVARD Thales TRT- Intuilab - IRIT3 ANIMS - animation and sound for ATC HMI C. MERTZ/PECCATTE/ Y RINATO Intuilab - Intactil Design4 AIRNET project Marc POLLINA M3 SYSTEMS
External project5 VertiDigi Raïlane BENHACENE DGAC - CENA6 TACTINET Yves RINATO Intactil Design7 Visu Airport Philippe FUCHS ARMINES
8 VIGIESTRIPS: electronic strip for tower J JOURNET/ N DESMUYCK/ S SAR / J GARRON DGAC - CENA
9 MANTAS project Robin HICKSON MUAC10 BARCO - to be confirmed M. ALLAB BARCO - Orthogon
EEC project11 Conflict density R. EHRMANNTRAUT EEC INO - PhD -12 3D display E PINSKA EEC INO - PhD -13 Small aircraft D. ROHACS EEC INO - PhD -14 Airport of the Future M. MATAS EEC INO - PhD -15 Speech watermarking for aircraft identification K. HOFBAUER EEC INO - PhD -
External project16 Can stress be observed by analyzing the human voice? Martin HAGMULLER Graz University of Technology (SPSC)17 Soft computing Bernadette BOUCHON-MENIER UPMC, LIP6, Pole IA
Eurocontrol Innovative Research Exhibition 2004
Prototypes
Poster
1
Enhancement of AGT using Quantum Cryptography
Ecole nationale supérieure des télécommunicationsNetwork and Computer Science Department
46 rue Barrault, 75013 Paris, [email protected]
+33 1 45 81 78 70
The objective of the study is related to the security of Air-Ground Telecommunications (AGT) inthe dangerous after 9/11 world where one may expect serious threats to aircraft safety. We maybe concerned by attack on confidentiality, integrity and availability of telecommunications. Awrong message or the absence of message may have strong consequences for aircraft safety.Eavesdropping attempts may inform ill-intentioned actors. These hard facts plead for a permanentsearch of a maximal AGT security.
Communications are handled by the Aeronautical Telecommunication Network�(ATN) that wediscovered during this project. The ATN is incrementally built using existing networks. Thesecurity of ATN is a crucial matter. Aircraft Communications And Reporting System�(ACARS)Data Link must be secured. Inter Domain Routing Protocol�(IRDP) must be secured too. Airlinescompanies require secrecy too. ATN may be secured using classical cryptography providing so-called cryptographic security. That means that the security relies on the assumed but unprovenintractability of some mathematical problems related to prime numbers or elliptic curves.
Quantum Cryptography�(QC) provides unconditional security relying on the quantum physicslaw. Such a security is called information theoretic security because it is proved using the theoryof information of Shannon.
The ATN is an Internet network and may switch to IPv6 in the future in order to provide IPaddresses to all equipments. Security and confidentiality in the ATN will be handled usingclassical public key cryptography. But public key cryptography is not proven to beunconditionally secure. No one can claim that heuristics do not exist to break Public KeyCryptography with high probability. The birth of Quantum Computers would be the death ofpublic key cryptography. If Quantum Computers are built in a few years, then public keycryptography would be dead. Quantum Computers support efficient algorithms, Shor’s algorithmfor instance, to solve the mathematical problems on which public key cryptography relies.
Public key cryptography necessitates aPublic Key Infrastructure (PKI). PKI areheavy hierarchical administrative tools.Any security failure in one elementcompromises the security of the system.Thus, PKI is likely to be managed in well-trusted operators areas. PKI will increasethe overhead on the band-limited channels.For example, a classical X.509 certificate isabout 20Kb. Another typical element ofPKI is the Certificates Revocation Lists(CRL), which are very large and must bedispatched to all parties.
Example of ATN Session. When an Airborne End System(AES) wants to communicate with an A/G (Air/Ground)Application at Ground Station (GS), e.g. the Controller-PilotData Link Communication (CPDLC) Application, AES andGS will cooperate to execute a basic scenario:Step 0: Initialization of ATN’s PKI services for ATN entitieswho take part in secure communications such as AES, ContextManagement Application (CMA), CPDLC Application.Step 1: AES creates a CM Logon CPDLC Request and sendsit to CMA.Step 2: CMA sends a CM Logon CPDLC Response back toAES.Step 3: AES and CPDLC Application compute a commonsecret Session Key.Step 4: AES and CPDLC Application protect messages byusing this Session Key.
2
Any solution for improving security must be done inside the framework of the ATN. It mustconsider costs and existing infrastructure into account. Existing infrastructure must be re-used.Moreover, any proposed solution for using QC to secure the ATN must be incremental.
QC is an emerging technology that could, in a few years, provide a totally secure Internetarchitecture. Enst is currently involved in the European IST project SECOQC which aim is todesign specialized Internet optic fiber architecture and protocols based on QC. QuantumCryptography proposes an alternative and a complement to classical Public Key Cryptography.
The point is Quantum Key Distribution (QKD)that allows a totally secure transmission of anencryption key. Another possible applicationfield is (air) free space telecommunicationswhich uses faint pulses laser beams. Works havebeen conducted in Europe and USA withsignificant results. QKD allows two endpoints toshare a secret key. This encryption key is usedwith an unbreakable encryption algorithm, such
as Vernam (one-time pad) cipher, to encode the communication. The main QKD protocol namedBB84 is fully described in the report and a visual implementation is given as a demonstrator.QKD uses a classical open channel and a quantum channel which may be an optic fiber or a freespace faint pulses laser beam or any physical device able to transmit unaltered quantum states.The security is guaranteed by Quantum Physics laws instead of unproven mathematicalassumptions: the Heisenberg’s uncertainty principle and the Non-cloning theorem. With QKD,any eavesdropper (spy) can be detected because its measures perturb the quantum states.
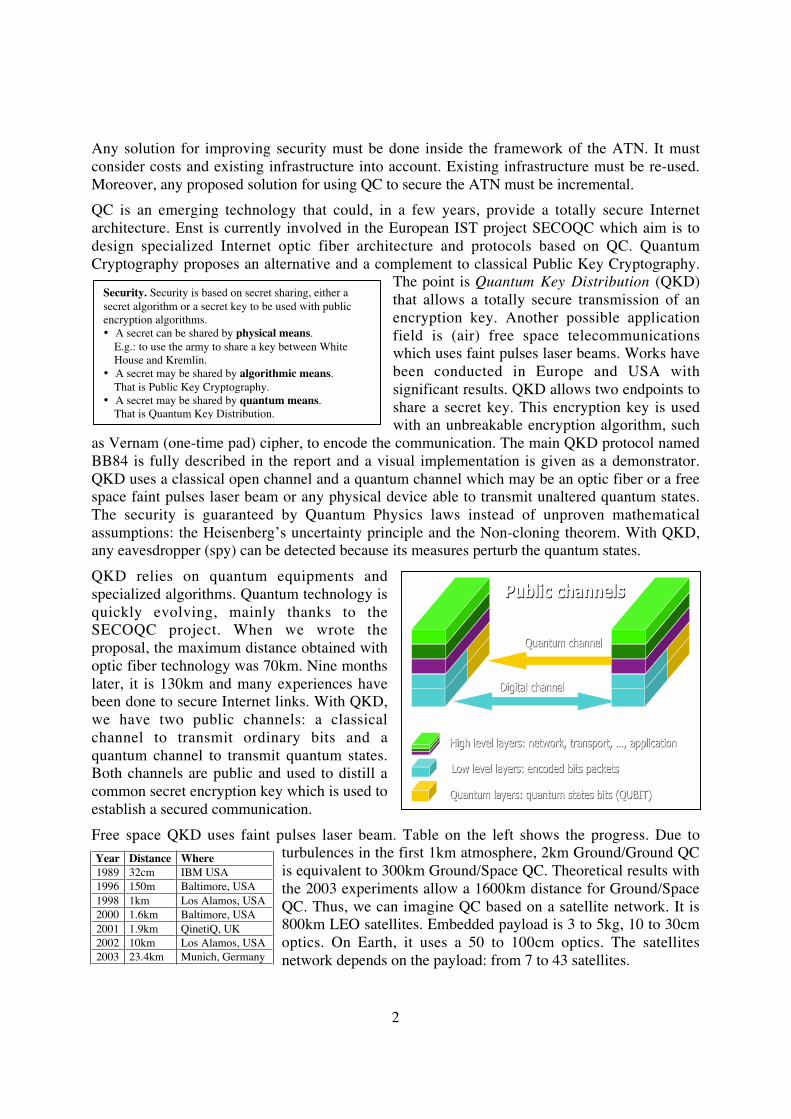
QKD relies on quantum equipments andspecialized algorithms. Quantum technology isquickly evolving, mainly thanks to theSECOQC project. When we wrote theproposal, the maximum distance obtained withoptic fiber technology was 70km. Nine monthslater, it is 130km and many experiences havebeen done to secure Internet links. With QKD,we have two public channels: a classicalchannel to transmit ordinary bits and aquantum channel to transmit quantum states.Both channels are public and used to distill acommon secret encryption key which is used toestablish a secured communication.
Free space QKD uses faint pulses laser beam. Table on the left shows the progress. Due toturbulences in the first 1km atmosphere, 2km Ground/Ground QCis equivalent to 300km Ground/Space QC. Theoretical results withthe 2003 experiments allow a 1600km distance for Ground/SpaceQC. Thus, we can imagine QC based on a satellite network. It is800km LEO satellites. Embedded payload is 3 to 5kg, 10 to 30cmoptics. On Earth, it uses a 50 to 100cm optics. The satellitesnetwork depends on the payload: from 7 to 43 satellites.
Security. Security is based on secret sharing, either asecret algorithm or a secret key to be used with publicencryption algorithms.• A secret can be shared by physical means.
E.g.: to use the army to share a key between WhiteHouse and Kremlin.
• A secret may be shared by algorithmic means.That is Public Key Cryptography.
• A secret may be shared by quantum means.That is Quantum Key Distribution.
Quantum channelQuantum channel
Digital channelDigital channel
Low level layers: encoded bits packetsLow level layers: encoded bits packets
Quantum layers: quantum states bits (QUBIT)Quantum layers: quantum states bits (QUBIT)
High level layers: network, transport, High level layers: network, transport, ……, application, application
Public channelsPublic channels
Year Distance Where1989 32cm IBM USA1996 150m Baltimore, USA1998 1km Los Alamos, USA2000 1.6km Baltimore, USA2001 1.9km QinetiQ, UK2002 10km Los Alamos, USA2003 23.4km Munich, Germany
3
Thus, QC can achieve unconditionally secured communications links over restricted distancesdepending on the used technology. Big progresses are made and other alternatives to BB84 arestudied: quantum continuous variables (QCV) and entangled photons (EPR pairs). We mayassume that the distances will be enlarged. In the report, we assumed that all foreseeable QKDtechnologies have been developed. For instance, we assume Free Space Satellite QKD that hadnot been experimented. We looked at the incremental insertion of QKD in the ATN. That is tosay that we looked where PKI can be locally replaced by a Quantum Confidentiality KeyInfrastructure (QCKI) which would be responsible of providing confidential sharing ofencryption keys between two endpoints.
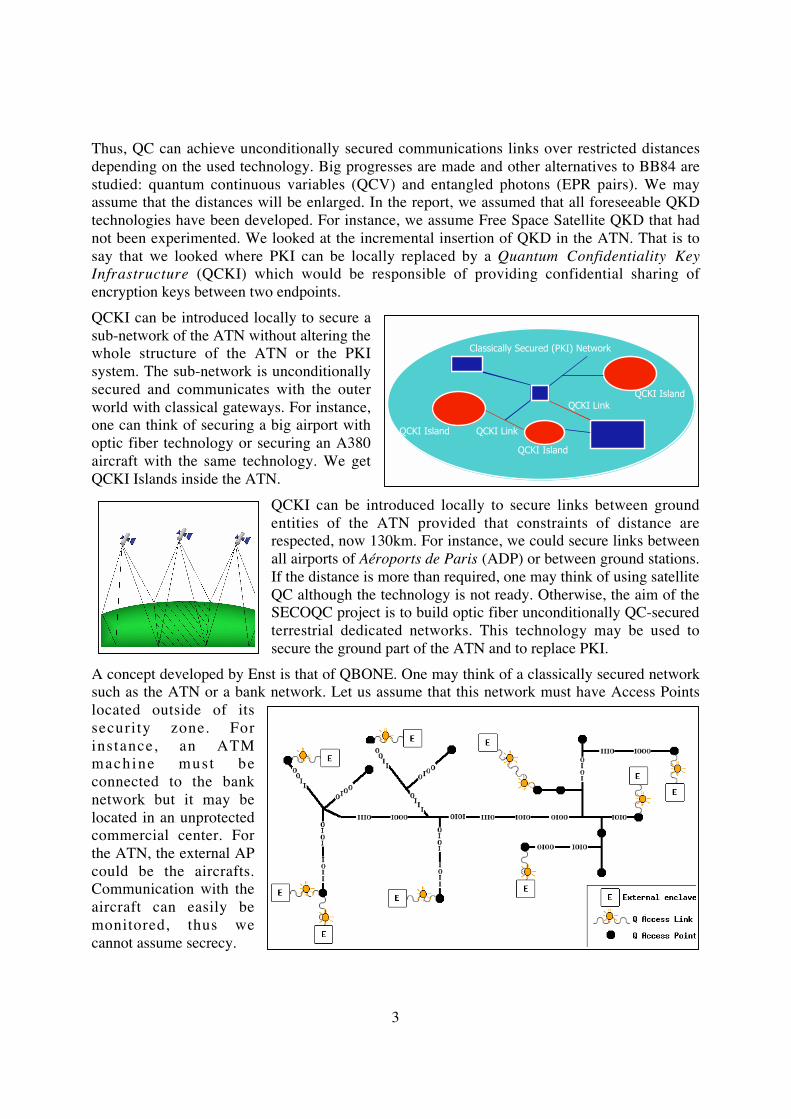
QCKI can be introduced locally to secure asub-network of the ATN without altering thewhole structure of the ATN or the PKIsystem. The sub-network is unconditionallysecured and communicates with the outerworld with classical gateways. For instance,one can think of securing a big airport withoptic fiber technology or securing an A380aircraft with the same technology. We getQCKI Islands inside the ATN.
QCKI can be introduced locally to secure links between groundentities of the ATN provided that constraints of distance arerespected, now 130km. For instance, we could secure links betweenall airports of Aéroports de Paris (ADP) or between ground stations.If the distance is more than required, one may think of using satelliteQC although the technology is not ready. Otherwise, the aim of theSECOQC project is to build optic fiber unconditionally QC-securedterrestrial dedicated networks. This technology may be used tosecure the ground part of the ATN and to replace PKI.
A concept developed by Enst is that of QBONE. One may think of a classically secured networksuch as the ATN or a bank network. Let us assume that this network must have Access Pointslocated outside of itssecurity zone. Forinstance, an ATMmachine must beconnected to the banknetwork but it may belocated in an unprotectedcommercial center. Forthe ATN, the external APcould be the aircrafts.Communication with theaircraft can easily bemonitored, thus wecannot assume secrecy.
Classically Secured (PKI) Network
QCKI Island
QCKI Island
QCKI Island
QCKI Link
QCKI Link

4
Let us consider aircraft as external AP to the classically secured ATN. AGT Data Link (DLK)provides numerical communications between ground stations and aircraft. They are used forGraphical Position Reports, Contact Reports, etc. One may classify different threats:
• Monitoring. A third party may listen to the DLK communications and gain information on thetraffic. Current DLK communications do not guarantee privacy.
• Spoofing. A third party may listen to the DLK communications and gain authenticationinformation in order to impersonate one of the parties.
• Modifying. A third party may impersonate the second party with respect to the first partymeanwhile he may also impersonate the first party with respect to the second party (man-in-the-middle attack). Integrity of the data is not preserved. Data may be corrupted.
It is very easy to monitor Aircraft Communications Addressing And Reporting System (ACARS)Data Link Messages. One needs a personal computer, a sound card, a Radio Frequency (RF)scanner and few software freely available on the WEB.
Thus, the need to secure aircraft communication with ground stations appears clearly. Weconsider them as AP to the ATN. Free space QCKI can be used to distribute encryption keys:
• To aircraft entering the European sky:
o From the ground if controllers oblige the aircraft to cruise at the vertical of one ofsome chosen points at the frontier of Europe.
o From satellites otherwise.
• To aircraft standing at the airport, maybe not wired to the airport terminal. The control towercould securely distribute a key to any aircraft standing on the tarmac.
Then the encryption keys are distributed to the ground stations using the classically secured ATN.
The object of our follow-up proposal is to couple Air Identification Tag (AIT) developed by theuniversity of Graz and Eurocontrol with QKD. AIT is the watermarking insertion of flightidentification in VHF pilot-controller communication. Any party duly equipped can see the otherparty identification on a special visual device or, in the case of controller, it can be used tohighlight the speaking aircraft on the radar screen. AIT did not intend to guarantee authenticationof the parties. AIT has been designed to reduce the controller workload and stress. Authenticationand integrity can be obtained by cryptographic signature technology provided that the two partiesshare a key. Free space QKD is used from the control tower to distribute a key to aircraft standingat the airport. The AIT message could include the flight identification, the current GMT Time anda signature of both provided by one of the hash functions of the classical cryptography cookbook.We propose to design and build the equipment: quantum optics, dedicated computers, algorithms,etc. We introduce two new partners: Munich and Bordeaux quantum physics laboratories.
The report of our work also describes more ambitious scenarios based on different QKDtechniques to secure the whole ATN while respecting the criteria of incrementality of theinsertion of QKD inside a PKI-based system and the criteria of complementarity of the twotechniques. The most ambitious plan would be to use satellites-based key distribution. Therequired number of satellites varies from 7 to 43 depending on technology evolution. It is a costlysolution that may be used only if PKI is broken one day by Quantum Computers or mathematicalprogress.

-1 -
SCOPE: Safety of Controller-Pilot Dialogue
CARE II Innovative Project
The reliability of communications between pilots and air traffic controllers is of paramount importance to air traffic safety. As such, the detection of communication errors between pilots and controllers has always been a major safety issue. Many of those errors arise from undetected misunderstandings between the pilot and the controller during radio conversations. An automated tracking of the pilot-controller dialogue, in order to check the matching between clearances (controller) and acknowledgments (pilot), coupled with a verification of the effectiveness of the modification of flight parameters would dramatically improve flight safety.
The purpose of the SCOPE project was to increase the reliability of pilot-controller communications using automatic speech recognition, in order to track the dialogue between the controller and the pilot, and multimodal information presentation, in order to present the results of the tracking to the controller through an enhanced interface. Air Traffic Control (ATC) systems require a high level of reliability and are subject to real-time constraints. With such a challenge in mind, the SCOPE study consisted in selecting and modelling a relevant subset of ATC phraseology and exploring the potential of the use of voice recognition for pilots and controllers as well as the conditions of its successful implementation.
The SCOPE team was composed of experts in robust voice and language recognition from the Human Interaction Laboratory at THALES Research & Technology, researchers in multimodal interaction application from the DIAMANT team at the Institut de Recherche en Informatique de Toulouse (IRIT), and experienced user interface designers and innovators in ATC from IntuiLab. THALES R&T is the corporate research centre of the THALES group, IRIT is a French academic research institute in computer science and IntuiLab is a French SME specialized in the development of user interfaces.
The first task of SCOPE consisted in identifying and analysing the most appropriate tool for automatic speech recognition (ASR) in ATC, with a special focus on availability, robustness and ability to be incorporated into ATC systems. Given the nature of the targeted application, that is ATC communications with limited vocabulary and constrained language, and the associated strong constraints (noisy environment, low quality transmission channels, overlapping utterances and stressed speech), Nuance 8.0 from Nuance Communications appeared to be the appropriate choice. Nuance is perfectly designed for limited vocabulary, and its grammar construction, edition and integration facilities make it readily usable for a constrained language such as the one used by controllers and pilots. The results obtained with Nuance 8.0 on such a language are much better than those obtained with other ASR software, and Nuance is able to perform recognition for this kind of application in real-time.
The next task concerned the modelling of the pilot-controller communication language in order to build the grammar for the selected recogniser. One of the most difficult aspects of implementing ASR is the creation of the grammar file. The terminology of all possible phrases must be rigidly defined. As such, callsign recognition is the main step to achieve in the ATC domain. Without this information, the recognition process cannot fulfil the requirements of ATC systems. Therefore, a formal model of English callsigns was proposed. All possible pronunciations were formally described, in order to limit the size of the generated grammar and optimise speech recognition. The methodology used in the SCOPE project for grammar constraining made it possible to use only a small grammar for callsign recognition. In particular, the grammar was adapted to a limited list of flight plans for the controller’s current sector. This solution ensured that Nuance 8.0 together with the SCOPE grammar for callsign recognition could perform clearance/acknowledgement recognition in real time and yielded excellent results under some conditions (average English accent, good experience of the OACI alphabet and of company names, average voice volume and speed).
The third task focused on the design of a multimodal interface for the presentation of the speech tracking results to the controller, and the specification of the underlying architecture. Several scenarios were proposed in order to demonstrate the usefulness of ASR in ATC communications. The retained scenario coupled:
• Verification of aircraft identity using matching of the callsign obtained from ASR of the controller’s clearance and the callsign obtained from watermarking on the pilot’s acknowledgement;
• Alerting of clearance/acknowledgement conflicts using comparison of recognition results for both the controller’s clearance and the pilot’s acknowledgement.
-2 -
As a consequence, the multimodal interface was designed as to present alerts to the controller in case of mismatches or conflicts. The resulting software architecture includes two ASR tools, one for the controller and one for the pilot, plus a radar image supporting presentation of multimodal information (twinkle and plug-in) together with an air traffic simulator in order to better illustrate the scenario (see figure).
Air traffic
simulator
Twinkle
+
Plug-in
Controller
A.S.R.
Nuance vocal
recognition
engine
Air traffic
control
specialized
Grammar
Ivy Bus
Pilot A.S.R.
Nuance vocal
recognition
engine
Air traffic
control
specialized
Grammar
The last task consisted in implementing a demonstrator of the tracking system with a multimodal interface according to the specifications. The resulting demonstrator consists of two workstations with ASR capabilities, one for the controller’s working position, which includes also a laptop running the multimodal radar interface, and one for the pilot. The demonstrator permits to illustrate several cases of controller-pilot communications leading to conflicts, which are detected by the SCOPE ASR system and presented to the controller on the radar image, and thus demonstrate the usefulness of ASR for the tracking of ATC communications. The SCOPE demonstrator will be presented live during the 3
rd Eurocontrol Innovative Workshop & Exhibition.
As a possible follow-up to the SCOPE project, the SCOPE consortium propose to study the scaling of the SCOPE approach in order to tackle issues that were out of the scope of the initial project, such as stressed speech or limited bandwidth. The study would rely on a corpus of live conversations between controllers and pilots and would be dedicated to fine acoustic and language modelling together with contextual and semantic based repairing of recognition errors. The efficiency of the resulting ASR and dialogue technology could be illustrated through one of the following applications, among others:
• Reduction of controller’s cognitive load;
• Redundancy of information for the pilot;
• Real-time analysis of controller’s workload.

ANIMS
Improving the efficiency and safety of ATM user interfaces with
visual animation and sound
CARE II Innovative Project
In the past years, the development of tools for air traffic control was considered by all as a
task for ATC experts, software engineers, and human factors specialists. Meanwhile, the
times have changed for the computer industry. Nowadays, thousands of designers work on
interactive software for cars, aircraft cockpits, office systems or games, because they help to
make better and more usable systems. The role of software engineers fades back to making
systems that work, not designing their interface. At the same time, as user interface
technology grows more mature, it offers possibilities that can improve the efficiency,
naturalness and even safety of operation of interactive software. This comes at a time when
new air traffic management concepts and tools are flourishing and thus are raising the need of
a carefully designed information environment for air traffic management operators.
The ANIMS project studies the benefits and conditions of use of two related design-intensive
interface technologies: animation and sound. Research and experience in the last decade has
shown how what appeared as futile details, namely interaction styles and visual design, could
determine the success or failure of an ATC system. In the same way, recent research shows
that the quality of feedback and alerts, however subtle they are, has a notable influence on
situation awareness, mutual awareness and safety. Animation and sound are two interaction
modalities that share many characteristics: they are intrinsically dynamic modalities (as
opposed to graphics, which are mainly static), they are time intensive in terms of computer
CPU, they introduce potentially complex notions of synchronisation into software
architectures, and they solicit specific perceptual and cognitive capabilities of users.
ANIMS is carried out in collaboration between Eurocontrol ATC experts, researchers in user
interfaces from IntuiLab, and visual and sound designers from Intactile Design. The first
phase of ANIMS aimed at demonstrating the potential of well designed sound and
animation in HMI for air traffic management. The project also aims at providing the
Eurocontrol agency with means for popularizing that technology among ATC providers and
helping the industry to do actual work with designers: design guidelines, methods for
designing and specifying animated and sound notifications or feedback, guidelines for adding
them to existing HMI software architecture. During this first year 2004, the project produced
both a state of the art and demonstrators.
The state of the art report on animation and sound in Human Machine Interfaces examines
their uses in HMI, whatever the application domain. It reviews the field both from a

theoretical point of view (based on scientific literature review) and from a practical point of
view based on current HMI practices in laboratories and industries. The report first focuses on
animations. It proposes a practical definition of what animations are and defines three
different types: story-telling animation, system or user triggered animation, and user driven
animation. It then describes how they can be modelled, and what techniques can be used to
create them. The main possible uses are then listed before considering human factors, with
both advantages and possible drawbacks of animation. The report then focuses on sound from
a more theoretical point of view, as current experience and research in sound are more limited
in the field of HMI. It defines the sound both as a physical phenomenon, and as a perceptual
phenomenon. It identifies the possible use of sound in HMI following three different possible
applications: feedback, alarms and information. It then describes the current use of both sound
and animations in ATC HMI, both in operational systems and in the field of research. The
state of the art also contains an extensive bibliography on sound and animations. During this
state of the art work, a workshop was organized at EEC, with HMI and Human Factors
experts from both the field of ATM and other domain such as the car and office software
industries. The workshop both provided insight as to the nature and uses of animation and
sound, and fostered ideas about possible cross-domain collaborations on user interface design.
After the domain review, operational scenarios for assessing and demonstrating the potential
of animation and sound were selected in coordination with HMI and Human Factor experts
from EEC and CENA. The scenarios were chosen for a medium term implementation,
because it provides a realistic schedule for implementation of new HMI features, and because
we wanted the intended public (air traffic controllers, ATC system designers) to focus on the
use of animation and sound rather than on hypothetical long term scenarios. Five different
scenarios were selected. Four of them are based on the radar view display: enhancing STCA
and down-linked ACAS-RA alert, presenting more information on line 0 of a flight label, and
notifying which flight is calling (with the help of flight identification watermarked in the
voice radio channel). The fifth scenario is for a flight sequencer, based on a timeline HMI
where either the user or the system can re-sequence flights in the timeline.
Demonstrators were then designed and developed through an iterative process. A
methodology has been defined so that involved participants will be able to describe and share
their idea on animation and sound design. Due to the intrinsically dynamic characteristics of
both animation and sound, describing them either in draft documents, working documents and
of course in design and specification documents is not an easy task. For the animations, we
extensively used storyboards, in a similar way to the movie, cartoon or game industry. For
sound, the problem is even more difficult as it not even possible to draw or write a snapshot of
a sound (as it is possible for an animation). Despite their limitations for that purpose, we have
also used storyboarding techniques for describing combinations of sound and animation. Most
of the animations were prototyped with the Flash Macromedia tool to validate some temporal
aspects beyond the use of storyboards. Some of those prototypes also included the use of
sound. Finally scenarios were prototyped and developed, using the IntuiKit environment (an
IntuiLab product), in a more realistic context, involving some flight traffic as well as pilots
and controller voices. Both traffic and voices were re-used from the RADE1 experiment. The
demonstrators both show the several benefits of designing animation and sound in ATM user
interfaces, and suggest possible designs for medium term implementation.

The scenarios will be demonstrated during the CARE-INO workshop at EEC in Brétigny on
December 9-10, 2004. Some videos will also be made available on ANIMS web site at
www.eurocontrol.int/care/innovative/care2/Intuilab/anims.htm
IntuiLab (www.intuilab.com) is a French SME based in Toulouse, specialised in the
development of user interfaces, involving advanced technologies combining sophisticated
graphics, gesture and speech recognition, natural language interaction, etc. Half of the activity
of IntuiLab is research, with current involvement in the CARE-INO SCOPE project, two
European Commission projects (Airnet: mobility for airport stakeholders, useme.gov:
providing new mobility services for the citizens), as well as self-funded research on
multimodality and software engineering for user interfaces. IntuiLab also helps car
manufacturers designing their cockpit HMI, ATC tool providers or operators designing new
tools, or telecom companies designing new services or handsets.
Intactile Design (www.intactile.com) is a French SME based in Montpellier, specialized in
Graphic design and Sound design for user interfaces. They design and realise multi-modal
interfaces.
VisuAirport
CARE II Innovative Project
1. Objectives and innovative ideas of the study
The objective is to propose to several airport professional branches the 3D vision of their working environment, adapted to their needs: the sight of the airport, the landing strips, the areas of circulation and parking, the airport infrastructure, planes evolving in the airport, other vehicles evolving in the airport, etc. The main interested professions are the ground agents, especially those in charge with the plane operations and the persons in charge with the airports. The tool proposes a 3D vision, which makes possible to any agent an instantaneous synthetic view of the zone of its choice. The airport environment not being fixed, all the vehicles and planes must be localised in real-time, thanks to localization sensors (GPS or others). It is the principal assumption of this project. Thus, it will be possible to provide synthesized images, rebuilt in real-time, very similar to the real sight. The disturbing influences, such as the bad conditions of visibility, the weather phenomena, etc, supposed to obstruct the observations, are thus eliminated.
The principal innovation is to exploit a new type of adaptable and multi-functional visual interface, using desktop computers as fixed stations or tablet-PC as mobile working stations. By associating this mobile station with a real-time modelling framework of the environment, relatively well structured and known, we are proposing to the airport professionals a new observation concept of their environment. The exploitation of the new inertial sensors, borrowed from the virtual reality techniques, able to provide us three degrees of freedom in real-time, could be used to easily choose the desired point of view, by manipulating the tablet-PC, localised by an inertial sensor: the observer, while turning relatively the tablet, changes the view point’s orientation in a pseudo-natural way. The user can easily choose, without a keyboard, only by using the pen and the interactive screen, the observed zone, the display functionalities, the memorized configurations of several points of view, to communicate with other people, etc.
2. Creation of software with all functionalities
The system gives the user the possibility of changing his observation point and of configuring a set of viewpoints. The work consisted in the design of the software functions allowing the viewpoint modification, by using a simple mouse, the tablet-PC’s pen or using an inertial sensor connected to tablet PC. The demonstrator will allow the simulation and the validation of several innovative ideas starting from two scenarios:
- Airplanes - ground vehicles accident prevention in airport area; - Inter-professional dialogue improprement
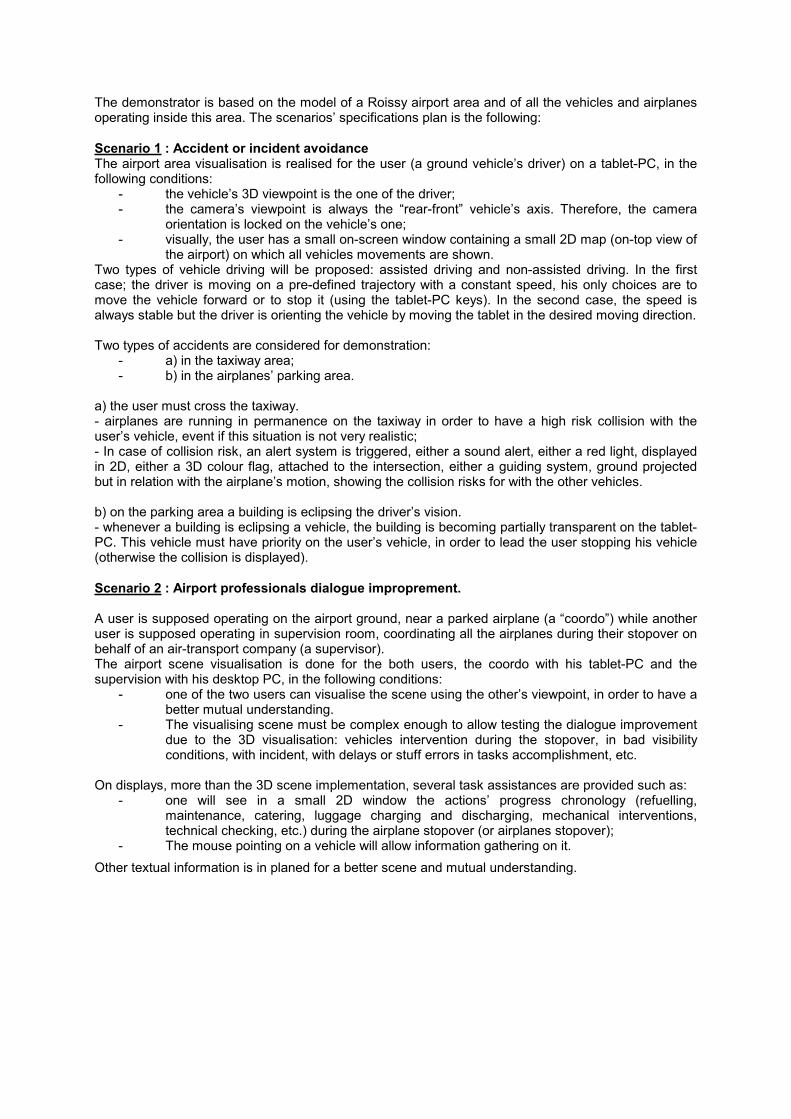
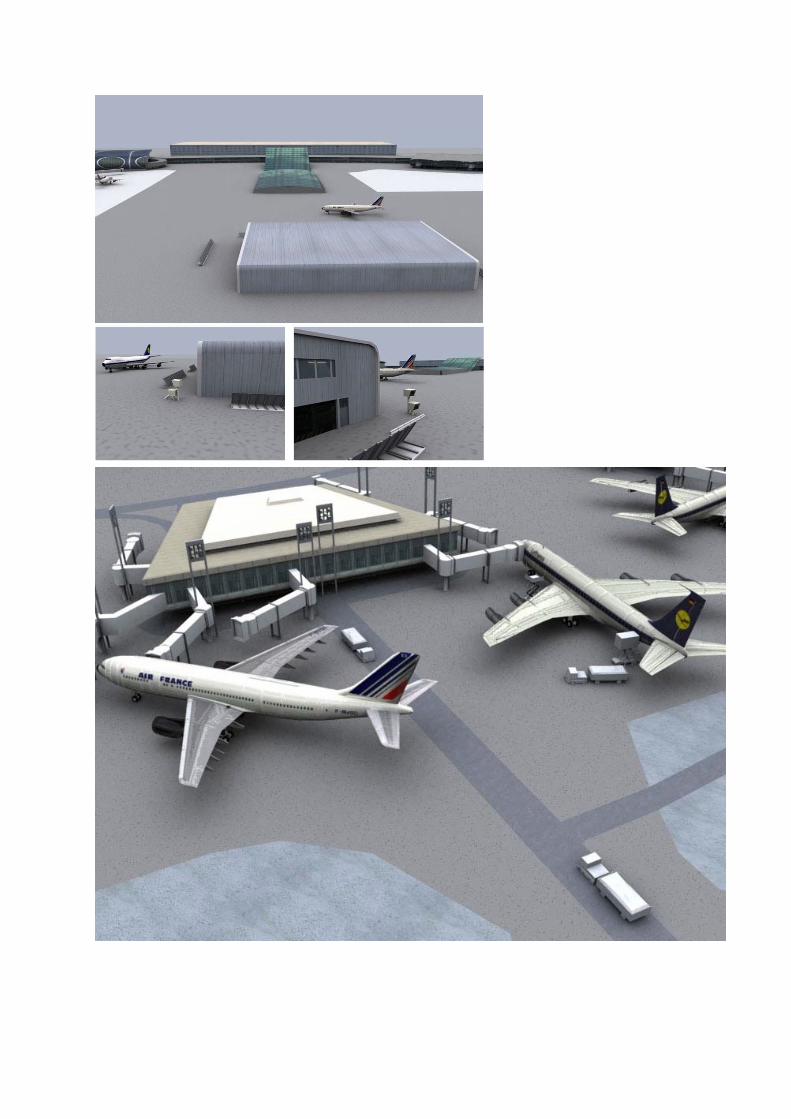
The demonstrator is based on the model of a Roissy airport area and of all the vehicles and airplanes operating inside this area. The scenarios’ specifications plan is the following:
Scenario 1 : Accident or incident avoidance The airport area visualisation is realised for the user (a ground vehicle’s driver) on a tablet-PC, in the following conditions:
- the vehicle’s 3D viewpoint is the one of the driver; - the camera’s viewpoint is always the “rear-front” vehicle’s axis. Therefore, the camera
orientation is locked on the vehicle’s one; - visually, the user has a small on-screen window containing a small 2D map (on-top view of
the airport) on which all vehicles movements are shown. Two types of vehicle driving will be proposed: assisted driving and non-assisted driving. In the first case; the driver is moving on a pre-defined trajectory with a constant speed, his only choices are to move the vehicle forward or to stop it (using the tablet-PC keys). In the second case, the speed is always stable but the driver is orienting the vehicle by moving the tablet in the desired moving direction.
Two types of accidents are considered for demonstration: - a) in the taxiway area; - b) in the airplanes’ parking area.
a) the user must cross the taxiway. - airplanes are running in permanence on the taxiway in order to have a high risk collision with the user’s vehicle, event if this situation is not very realistic; - In case of collision risk, an alert system is triggered, either a sound alert, either a red light, displayed in 2D, either a 3D colour flag, attached to the intersection, either a guiding system, ground projected but in relation with the airplane’s motion, showing the collision risks for with the other vehicles.
b) on the parking area a building is eclipsing the driver’s vision. - whenever a building is eclipsing a vehicle, the building is becoming partially transparent on the tablet-PC. This vehicle must have priority on the user’s vehicle, in order to lead the user stopping his vehicle (otherwise the collision is displayed).
Scenario 2 : Airport professionals dialogue improprement.
A user is supposed operating on the airport ground, near a parked airplane (a “coordo”) while another user is supposed operating in supervision room, coordinating all the airplanes during their stopover on behalf of an air-transport company (a supervisor). The airport scene visualisation is done for the both users, the coordo with his tablet-PC and the supervision with his desktop PC, in the following conditions:
- one of the two users can visualise the scene using the other’s viewpoint, in order to have a better mutual understanding.
- The visualising scene must be complex enough to allow testing the dialogue improvement due to the 3D visualisation: vehicles intervention during the stopover, in bad visibility conditions, with incident, with delays or stuff errors in tasks accomplishment, etc.
On displays, more than the 3D scene implementation, several task assistances are provided such as: - one will see in a small 2D window the actions’ progress chronology (refuelling,
maintenance, catering, luggage charging and discharging, mechanical interventions, technical checking, etc.) during the airplane stopover (or airplanes stopover);
- The mouse pointing on a vehicle will allow information gathering on it.
Other textual information is in planed for a better scene and mutual understanding.

3. Results of the study
The one-year project consisted in making a demonstrator to study the interest of this concept. The outcome is a demonstrator composed of two visual interfaces (one as a fixed station and another as a mobile one), the operating software for the two interfaces, and the (wireless) communication between them. This software makes possible to visualise in 3D the airport with its planes, its ground vehicles and other staff vehicles in motion. The synthesis images are created in real-time (25 images a second) starting from an established pre-scenario of the motion of the mobile entities. It also allows the information exchange between the two visual interfaces. A certain number of complementary useful information is displayed and integrated within the demonstrator as a 2D interface. The results of a first set of tests for concept validation will be provided. A paper will be presented, drawing the conclusions of the experiments carried out with the demonstrator.

In a context of a fast evolution of the air transport market, the future of the Air traffic Management
will not only be linked to the improvements in technologies, but also to the evolution of traffic flows.
Despite the current difficulties in air transport, forecasts still mention strong traffic increases for years
to come. One of the main solutions chosen by the European Commission for coping with airport
congestion problem and transports’ pollution is to develop intermodal transports to air. This
development is an important objective of the European Commission since Intermodality and
multimodality are at the heart of the 2001 European Commission white papers on transport. One of the
main priority objectives to be attained by 2010 is to link-up transport modes for successful
intermodality.
The first question what comes to mind is to know what is exactly intermodality? What is its
development today? More important what are the perspectives of intermodality tomorrow in terms of
airport development and what would be its influence on air traffic levels and distribution?
The study “The airport of the future: central link of intermodal transport?” aims at providing answers
to some of these questions when considering the global transport network. This constitutes an
innovative aspect since the evolution of each transport mode was so far envisaged without taking
necessarily into account the evolution of the other modes, and ignoring the possibility that the modes
could be cooperative instead of being competitive only. An other innovative aspect of this study lies in
the analysis of intermodal transport as a way to tackle what could be the airport of the future; it also
considers the intermodality between all the possible transport modes.
Intermodality is the characteristic of a transport network which allows the use of at least two different
coordinated transport modes for at least one single trip from origin destination. In literature, the term
“intermodal” transport applied to passengers using successively air and other transport modes is used
equally for the airport access to the city centre or for the integration of the airport in the regional or
national network of other transport modes. As the implications of both types of airport intermodality
are different in terms of investment, passenger needs, operators coordination, transport policies, etc.,
we have chosen in this study to differentiate between them. In the case of airport access, the relevant
modes to study are all public modes. In the case of integration of the airport in the regional or national
network, only rail is relevant (and particularly high speed train), since bus services on long distances
are quite rare in Europe, and do not seem to become more prominent in the future. Conversely, air rail
intermodality seems to offer promising opportunities for the future.
The objective of the study is therefore to elaborate European scenarios of transport network evolution
by putting more focus on French and Portuguese ones, and identifying the impacts of these scenarios
in terms of development of intermodality.
CARE INO II: The airport of the future: Central link
of intermodal transport?
Summary
INO WORKSHOP, 9 December 2004
CARE INO II: The airport of the future: Central link of intermodal transport?
__________________________________________________________________________________________
M3 Systems – ANA - ENAC-AEEL Page II
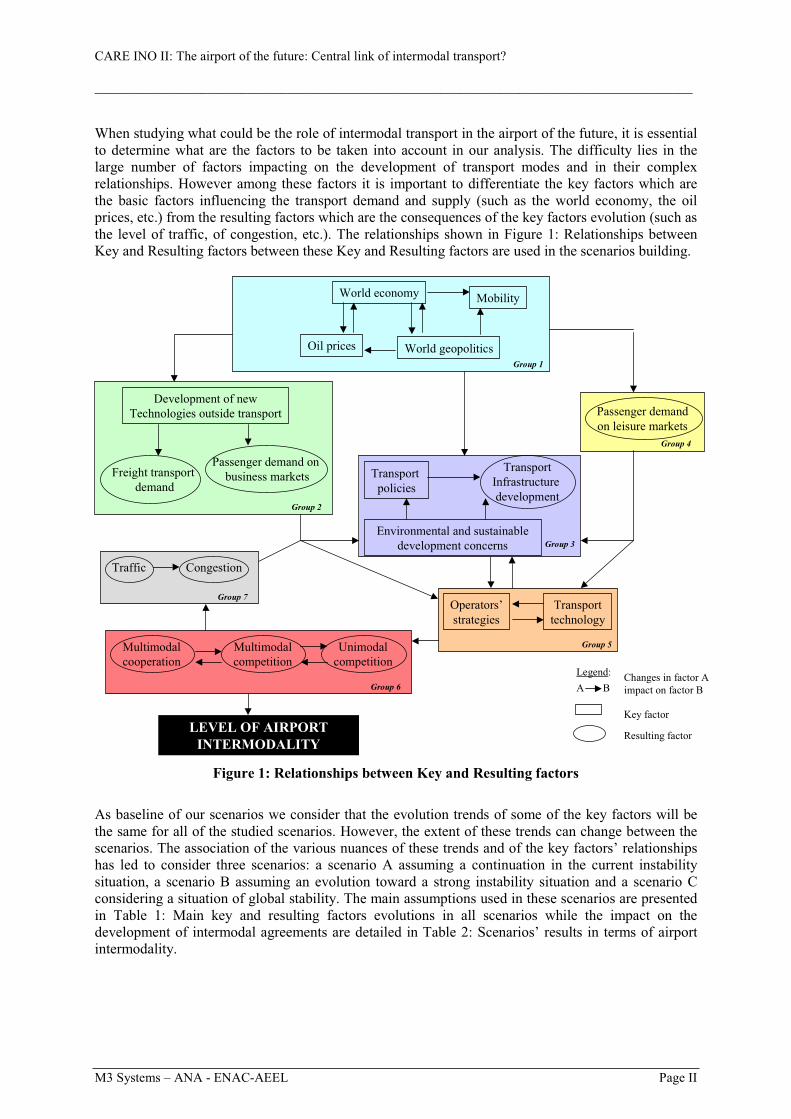
When studying what could be the role of intermodal transport in the airport of the future, it is essential
to determine what are the factors to be taken into account in our analysis. The difficulty lies in the
large number of factors impacting on the development of transport modes and in their complex
relationships. However among these factors it is important to differentiate the key factors which are
the basic factors influencing the transport demand and supply (such as the world economy, the oil
prices, etc.) from the resulting factors which are the consequences of the key factors evolution (such as
the level of traffic, of congestion, etc.). The relationships shown in Figure 1: Relationships between
Key and Resulting factors between these Key and Resulting factors are used in the scenarios building.
Oil prices World geopolitics
World economy
Passenger demand
on leisure markets
Transport
policies
Environmental and sustainable
development concerns
Transport
Infrastructure
development
Operators’
strategies
Multimodal
cooperation
Multimodal
competition
Group 1
Group 6
Group 4
Group 5
Group 3
Development of new
Technologies outside transport
Freight transport
demand
Passenger demand on
business markets
Group 2
Legend:
Transport
technology
Key factor
Resulting factor
BChanges in factor A
impact on factor B
Mobility
Unimodal
competition
Traffic Congestion
Group 7
A
LEVEL OF AIRPORT
INTERMODALITY
Figure 1: Relationships between Key and Resulting factors
As baseline of our scenarios we consider that the evolution trends of some of the key factors will be
the same for all of the studied scenarios. However, the extent of these trends can change between the
scenarios. The association of the various nuances of these trends and of the key factors’ relationships
has led to consider three scenarios: a scenario A assuming a continuation in the current instability
situation, a scenario B assuming an evolution toward a strong instability situation and a scenario C
considering a situation of global stability. The main assumptions used in these scenarios are presented
in Table 1: Main key and resulting factors evolutions in all scenarios while the impact on the
development of intermodal agreements are detailed in Table 2: Scenarios’ results in terms of airport
intermodality.

CARE INO II: The airport of the future: Central link of intermodal transport?
__________________________________________________________________________________________
M3 Systems – ANA - ENAC-AEEL Page III
Passenger demand Scenario
Economic growth level
Environmental concerns
International tensions
Oil prices
Business Leisure
Freightdemand
A1 Strong Moderate Moderate increase
High increase Moderate increase
High increase
A
A2
High
Moderate Moderate Moderate increase
High increase Moderate increase
High increase
B Low Weak High High increase Weak
increase Weak
increase Moderate increase
C Moderate Strong Weak Weak increase High increase High increase Moderate increase
Table 1: Main key and resulting factors evolutions in all scenarios
Scenario
Level of use of
air/HST
intermodal
agreements on
passengers’
markets
Level of use of
air/rail
intermodal
agreements for
airport access
Level of use of
air/bus
intermodal
agreements for
airport access
Level of use of
air/rail intermodal
agreements on
freight markets
Level of use of
air/road intermodal
agreements on
freight markets
A A1 Moderate Moderate Moderate High Moderate
A2 Weak Weak Moderate Moderate Moderate
B Weak Weak Weak Weak Weak
C High High Moderate High Moderate
Table 2: Scenarios’ results in terms of airport intermodality
Analysis of these scenarios tends to show that a good economic growth is not sufficient for strongly
developing airport intermodality, especially air/rail one for passengers and air/road one for freight.. In
particular, the levels of environmental constraints play an important role in this development. In
addition, the globalization process stimulates economic growth but may result in unequal wealth
distribution. This process leads to positive effects on freight transport growth and multimodal
cooperation. Its effect on multimodal cooperation for passenger transport depends also on other factors
and varies according to the scenarios.
Concrete applications of these scenarios have been made on the case of France and Portugal, which by
their difference in the current intermodality development can be considered as representing the
situation in “Core” European countries and less developed or new European countries respectively.
Indeed Portugal does not have yet intermodal infrastructure but plans to integrate Porto airport in the
future high-speed rail network. France which already has intermodal infrastructure also plans to
improve the integration of airports in the high-speed rail network and the airport access by dedicated
rail links.
Nevertheless, the applications of scenarios lead to the conclusion that despite the difference of current
state of intermodality in both countries, building new infrastructure could not be sufficient for
developing airport intermodality. If as a base for intermodal development, intermodal infrastructure
has to be built, the future of airport intermodality should also be largely impacted by the market
CARE INO II: The airport of the future: Central link of intermodal transport?
__________________________________________________________________________________________
M3 Systems – ANA - ENAC-AEEL Page IV
conditions (economic environment but also competition levels on the transport market), as well as the
air capacity constraints and transport policies. The association of some conditions could promote the
development of intermodal agreements between transport operators while other conditions could
impede it.
The Air Traffic Management evolution for the next 15-20 years could be very sensitive to the
development of such agreements. If there are so far few examples where airport intermodality
impacted air traffic, the number of these examples could increase with the level of airport
intermodality, and the air traffic level and distribution would then be affected more and more. We can
indeed assume that a strong development of intermodal agreements could noticeably decrease air
traffic on short and medium-haul. Change in traffic flows compared to the current situation, could be
sizeable and involve deep changes in their traffic flow management. This could help to alleviate air
congestion problems. We can then wonder on what conditions airport intermodality can be a solution
to air traffic congestion.
We propose to answer this essential question in performing a new study. By showing identifying
factors directly or indirectly influencing the development of airport intermodality and showing their
complex relationships, the study “The airport of the future: Central link of intermodal transport?” can
indeed be considered as the first step of a deeper analysis. The next step would consist in analysing
these factors deeper and determine what could be the conditions bringing about the development of
airport intermodality and under which conditions airport intermodality could lead to redistribution of
air traffic. This economic study would provide an economic analysis of the market conditions
impacting on the intermodality development, in particular operators’ strategies, unimodal and
multimodal competitions. Economic instruments (such as for instance the introduction of a Kerosene
tax) and political or administrative measures (such as for instance new distribution of slots) favouring
airport intermodality would also be identified and analysed. Finally, all the conditions influencing
airport intermodality and their impacts on air traffic would be analysed. As a result of these analyses,
strategic guidelines for intermodal development would be provided.
In parallel to this economic study we propose to develop the AIRMOD tool aiming at measuring the
level of intermodality at airports and simulating how these changes impact airport catchments area.
Airport intermodality indicators would be elaborated so as to provide a concrete measurement of the
intermodality level and computed for each considered airport. For a given airport, current levels of
indicators as well as airport catchments area would be shown using a specific geographic map as web
interface. The AIRMOD tool would also allow to modify assumptions and indicators’ levels so as to
observe impacts on airport catchments area evolution.

Eurocontrol CARE Innovative Research 2004
Neural network-based recognition and diagnosis of safety-critical events
S.H. Stroeve*, A. Ypma
+, J. Spanjers
+, P.W. Hoogers
*
*National Aerospace Laboratory NLR, The Netherlands
+Foundation for Neural Networks SNN, University of Nijmegen, The Netherlands
Successful safety management in air traffic management (ATM) needs an up-to-date picture
of the safety of the operations. Currently, the most important source of feedback on trends in
ATM safety levels is obtained from safety occurrence reporting by human operators, such as
air traffic controllers and pilots. In an effort to support further development of ATM safety
management, research has been done in the CARE INO 2004 project on the feasibility of a
neural network-based system for automatic recognition and diagnosis of non-nominal
(potentially safety-critical) events in ATM.
Neural networks and related machine learning techniques provide the possibility to learn
associations between sets of signals. In the context of ATM safety monitoring they may learn
mappings between safety-relevant and observable operational data, on the one hand, and the
occurrence of a particular type of safety event, on the other hand. The operational data that
may be used depends on the operational context and may include, e.g., radar track data,
down-linked aircraft data, in-flight recorded data, air-ground messages and ATC system
input.
Development of a neural network-based detection system requires data for learning of
the associations. In this study, the suitability of several potential data sources for neural
network-based safety monitoring were evaluated. These data sources included Airborne
Collision Avoidance System Resolution Advisories (ACAS-RA’s) data gathered by
Eurocontrol’s Automatic Safety Monitoring Tool (ASMT), data of the human error database
HERA-JANUS, ATM incident and operational data, and Monte Carlo simulation data for air
traffic operations. This evaluation considers aspects such as observability of the data types in
an operational context, quantity of the data and types of related safety occurrences.
For an initial ASMT-based data set of ACAS-RA events, the feasibility of neural
network-based safety monitoring was evaluated by application of machine learning
techniques for automatic classification of two important and non-trivial issues in the
evaluation of the ACAS-RA events: Level off above/below and Followed. The data set
contained flight-related data, such as track data and RA data, on the on hand, and an expert-
based classification of the ACAS-RA issues considered, on the other hand. The application
included extraction of input features for the neural networks and other machine learning
techniques, training of the classification systems, and evaluation of the classification
performance. The results obtained for this particular application indicate that a limited
improvement in classification performance over a naive classifier may be obtained by
machine learning techniques. The best performance was usually obtained by a rule-based
classifier with data-optimised parameter values.
Finally, a general ATM safety monitoring strategy is sketched, which includes detection
of safety occurrences, filtering of event-specific data, filtering of general safety relevant data
and risk analysis. In such a framework, detection and filtering may be effectively based on
combinations of rule-based and neural network-based methods, while risk analysis is
expected to be supported most effectively by a model-based assessment approach.

Interactive and Immersive 3D Visualization for ATC
Matt Cooper & Marcus Lange
Norrköping Visualization and Interaction Studio
EUROCONTROL Experimental Centre & University of Linköping, Sweden
1 Abstract NVIS has been working with
Eurocontrol's INO group for the last
three years to explore the usability of 3D
display and 'Virtual Reality' technologies
in the sphere of Air Traffic Management
and Control. NVIS' task has been to
explore the potential from the viewpoint
of information visualization and
interaction and has produced four
successive versions of an interactive,
semi-immersive 3D visualization system
for evaluation by INO.
Apart from the many internal changes
made to the software to extend and
improve its function, common to any
large software development which is
under constant redesign and extension,
this year the work has focused on
improvements to many features of the
system, such as weather and flight
information display, but with a major
effort to improve the interaction schemes
provided with enhanced voice
recognition and speech feedback and
hand-based (dataglove) control systems
being redesigned and reimplemented for
improved interaction and control. In
terms of enhanced functionality, the
single largest addition is a new scheme
for the detection of future conflicts
present in defined flight plans with real-
time updates to permit the controller to
interactively update the flight plans to
remove conflicts.
2 Major updates
2.1 Flags
A range of information can be attached
to the aircraft models representing each
flight in the controller’s sphere of
influence. These data are represented by
flag objects which include both textual
and graphical information connected to
the airplanes by vertical lines, hence the
term ‘flags’. The flags are sorted and
ordered in different ways so that they are
visible at all times avoiding the visual
‘clutter’ which is common in 3D
displays of complex data. A flag that is
covered by another flag will be
repositioned so that it is visible. Flags
that are farther away are higher up.
Stereo display resolves these flag objects
easily.
Flights can have different types
including the name of the airplane, a
graphical or textual indication of the
speed and the altitude. Individual flag
objects can be added or removed from
the display, under user control, during
runtime.
There are currently four different flag
types:
1. Speed – indicating the speed as a
horizontal bar.
2. Altitude – indicating the altitude as a
horizontal bar.
3. Name of the airplane – displaying

the name of the airplane as text
4. Destination airport – displaying the
name of the destination airport.
2.2 More flight routes and
airports
Up until now we have been focused on
one particular airport, Stockholm
Arlanda. Trajectories have been color
coded differently for outgoing, incoming
or unused trajectories. When flight paths
going from and to other airports were
added to the system, the need for a
fourth type arose, a color for a trajectory
not associated with the airport in focus.
Also, when focusing on another airport,
the color of the trajectories must change,
to suit the new airport in focus. For this
purpose we have added an airports
object. Each flight is defined with a
‘from’ airport and a ‘to’ airport. The
focus can be shifted to either the ‘to’ or
‘from’ airport as appropriate, making the
camera change its centre of rotation to
the selected airport. All trajectories and
flights adapt their colors with respect to
the newly selected airport.
The flights database has also been
substantially extended to include cross
traffic which does not directly involve
our chosen airport of interest. Some of
the existing routes, which in previous
versions of the system only left Arlanda
and then disappeared from the
controller’s sphere of influence after a
time, have been extended so that they
now have both a departure and a
destination airport.
2.3 New speech client
In order to improve the speech
recognition a new speech client has been
developed. The new client is, again,
written in visual basic and uses the
recently released Microsoft SDK 5.1. It
uses continues recognition in place of
the discrete recognition protocol which
was employed in the previous version
and provides a substantially more
reliable interface which avoids many of
the sound environment problems and
issues with microphone placement which
afflicted the previous version of the
speech recognition system. In short the
recognition system has now reached a
level of accuracy and precision which
permits its use for the majority of control
functions with little recourse to pointer–
based navigation and interaction.
Commands can easily be added to a
configuration file. Speech synthesis
functionality has also been added to the
client to enable voice feedback from the
ATM application.
2.4 Sound client: positional
sound
The sound client connects to the ATC
application as any other networked client
and receives sound commands. A sound
command consists of an ID, describing
what kind of sound should be played,
and the position and orientation of that
sound in the 3D-world. The client can
either be run in text mode, doing nothing
more than playing the sounds, or in
graphical mode where you can see from
where the sound should appear to be
coming. These sounds are presented to
the controller using positional sound
features, incorporating both stereo
amplitude and phase modulation such
that a very strong sense of position can
be observed when using a surround or
headphone system. These positional cues
provide a powerful attraction to the
controller to guide their attention to the
location of specific problems such as
detected future conflicts (see later).
2.5 Vortex wakes and Vortex
trails
We have made use of data provided by
Eurocontrol’s INO group to include
visualization of vortex wakes left by
aircraft in the hope that such data can
make it possible for controllers to
compress the flight approach paths to
areas of concentration, such as are found
at airports. The approach taken in the
data provided to us is to calculate the
intensity of the disturbance at a series of
points behind each flight described by
each aircraft of appropriate data
orthogonal to the flight direction. These
data are affected by wind strength and
direction as well as the flight type. We
interpret these volumes of data and
isolate vortices where the strength is
above a user-defined intensity. We then
display the vortex as a tube following
each flight. The data are stored and
ordered with respect to time as the flight
passes a certain position.
In the current implementation we have
found that the data do not provide
significantly superior information over
the standard, time/distance-based
separation methods employed at present
since the movement of the vortex trails
is not visibly significant in our current
display system. That is the vortex trails
drawn appear as a trailed lines following
each flight along its trajectory and so do
not provide significant additional
information allowing the controller to
compress the aircraft flow towards the
point of convergence of the flights. In
future models, designed specifically for
the airport approach scenario we may be
able to display this information with
higher resolution, permitting the use of
this information in new ways which are,
at present, beyond us.
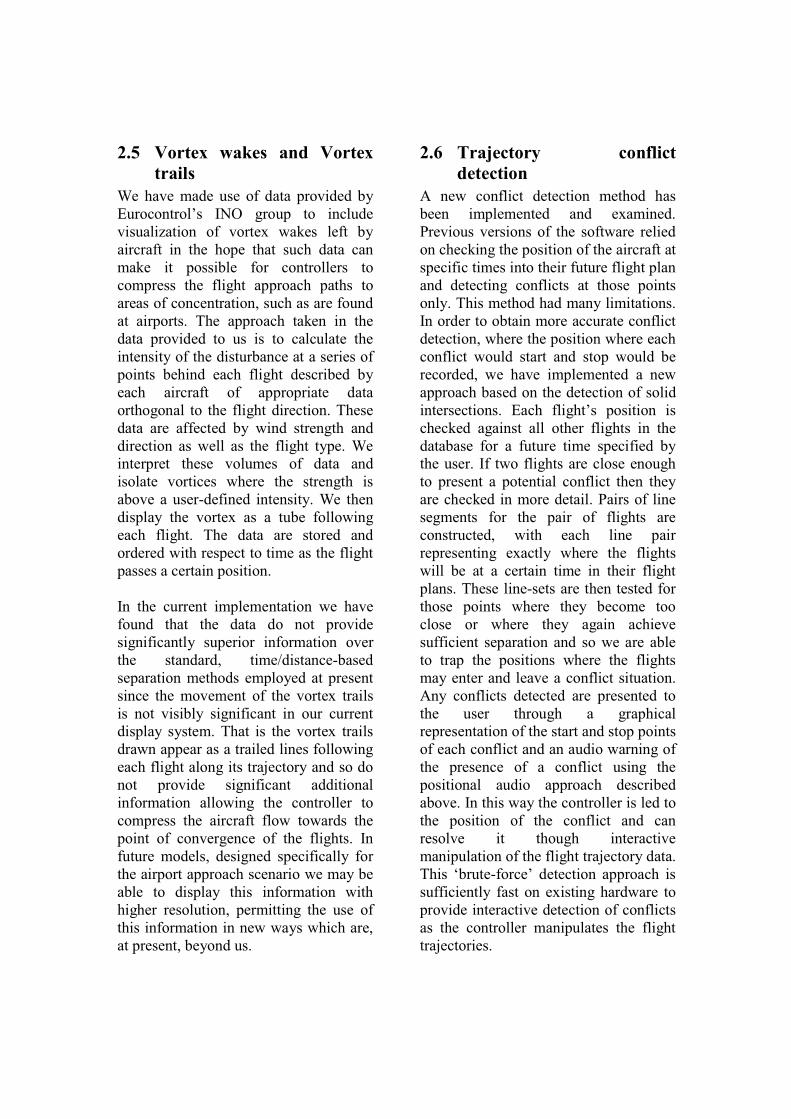
2.6 Trajectory conflict
detection
A new conflict detection method has
been implemented and examined.
Previous versions of the software relied
on checking the position of the aircraft at
specific times into their future flight plan
and detecting conflicts at those points
only. This method had many limitations.
In order to obtain more accurate conflict
detection, where the position where each
conflict would start and stop would be
recorded, we have implemented a new
approach based on the detection of solid
intersections. Each flight’s position is
checked against all other flights in the
database for a future time specified by
the user. If two flights are close enough
to present a potential conflict then they
are checked in more detail. Pairs of line
segments for the pair of flights are
constructed, with each line pair
representing exactly where the flights
will be at a certain time in their flight
plans. These line-sets are then tested for
those points where they become too
close or where they again achieve
sufficient separation and so we are able
to trap the positions where the flights
may enter and leave a conflict situation.
Any conflicts detected are presented to
the user through a graphical
representation of the start and stop points
of each conflict and an audio warning of
the presence of a conflict using the
positional audio approach described
above. In this way the controller is led to
the position of the conflict and can
resolve it though interactive
manipulation of the flight trajectory data.
This ‘brute-force’ detection approach is
sufficiently fast on existing hardware to
provide interactive detection of conflicts
as the controller manipulates the flight
trajectories.
2.7 New Glove selection
methods
In order to improve the selection
methods we have attempted a new
approach based on a natural selection
method using the data glove. Instead of
using a wand pointer from the hand to
the object of interest we now construct a
pointer by aligning the hand and the
user’s dominant eye and display a
marker or cross-hair along this line. This
would be the natural way of aiming and
pointing at objects in real life. When
aligning things the user usually uses
either the left or right eye according to
their personal eye dominance but in the
stereo display system the dominance is
usually overlooked, causing problems
with distance measures for displaying
the selection graticule. Using this
approach was often disturbing for a user
of our system so we elected to follow an
approach based on the dominant eye
where the targeting graticule is displayed
in only one of the two ‘cameras’ of the
stereo display. This removes the problem
of targeting and makes for a very natural
selection mechanism with the user’s
hand both guiding the targeting
graticule, invoking the selection of the
object using a hand ‘pinch’ and then
moving the object and releasing it
entirely using their fingers.
One disadvantage that we have observed
with this method is the fact that, with
existing tracking and glove technologies,
the weight of the equipment can become
a problem since the user’s arm gets tired
after a while if frequent selections and
manipulations are required but the
development of smaller and lighter
tracked glove devices will remove this
problem. The incorporation of improved
voice command selection would also
reduce the number of occasions where
the user’s hand selection must be
employed.
2.8 Improved geographical
orientation
In the previous version of the 3D ATM
system we made use of a ‘compass rose’,
displayed in the top-right corner of the
screen in an attempt to aid the controller
in retaining a sense of orientation within
the immersive scene. This year we have
employed a new approach where a
compass rose is, instead, projected and
blended into the map. When using the
semi-immersive workbench display the
compass is positioned with respect to the
direction of the user’s head making it
visible at all times. The compass is
scaled according to the distance between
the map and the user’s head providing
the user with both orientation and
‘zoom’ information as they work within
the system. We have also experimented
with using a smaller circle, within the
compass rose, which can be used to
select flights and waypoints when
combined with a suitable voice
command set.
3 Conclusions This application continues to be
developed according to methods which
NVIS, as visualization and interaction
experts, have new ideas to implement
and test. Each new feature raises new
problems and possibilities which we
hope to pursue in future versions of the
software. The new features which we
present here remain largely unevaluated
by professionals in the sphere of air
traffic control and management, the
evaluation being left to the Eurocontrol
INO group, and we hope to continue this
development process in the future to
provide new features and explore their
usefulness for the ATC community.

Wheelie – mobile horizontal display filter to ease controller’s separation task
Horst Hering, EUROCONTROL Experimental Center, Bretigny sur Orge, France
Abstract 1
Filter techniques for horizontal FL layers are widely used for the ODS. The aim of these conventional
techniques is to reduce the displayed information to the required level. This level of information is still complex
(3D) and requires strong mental effort for the separation task.
Wheelie introduces the concept of mobile filtering for a reference FL, accessed with the wheel of the
mouse. Aircraft associated with the reference FL are highlighted with an aureole. These aircraft may not conflict
with any others that are not on the reference FL. Aircraft on the reference FL have to be separated horizontally.
So the sub-separation task is reduced in complexity from a 3D to a 2D problem. Therewith Wheelie stimulates
the controller with a restricted ‘vision’ of his traffic and clue for a simpler ‘horizontally separated’ – yes/no
answer.
1 INO Workshop 9/10 Dec.2004, EEC, Bretigny ,France
Introduction
In the controlled airspace, safe aircraft
separations have to be guaranteed by the
responsible controller of the sector. For safe
separation the controller has to apply horizontal or
vertical separation. Conventional radar displays
called Operational Display Systems (ODS)
represent the information in 2 Dimensions (2D).
With such a display, the horizontal separation
between various aircraft are easily perceptible by
the human operator. An experienced controller is
able to observe horizontal separation at first glance.
In case the horizontal separation is no more
guaranteed, vertical separation has to be applied.
Vertical separation is based on flight level (FL) data
collected from the secondary surveillance radar.
This FL information is shown as a number in the
label associated with the aircraft symbol. The CoRe
HMI [1] specifies for these labels a minimum of
two lines going up to six lines. Such a large number
of label lines permits advanced ATC systems
moving towards a stripless environment. Currently,
most conventional ATC systems have the minimum
two line label as standard.
To observe safe vertical separation the
controller has to scan all tracks under his
responsibility permanently. He has to read the
actual FL values from the labels, memorize them
and compare them with each others to create a
mental traffic representation. This task requires
strong mental effort from the controller and
becomes more difficult in a stripless environment.
For simplification, this paper shows in its examples
minimum 2 lines labels, only.
The idea of Wheelie
In 1999, Hering [2] proposed the idea of a
horizontal filter for an ATC utility called Mosaic.
The presented idea exploits the approach of Mosaic:
‘aircraft flying on different FL can not cause horizontal separation problems’. As a consequence,
at first glance the controller can identify aircraft that
are flying on the same FL. All other cannot conflict
with the selected aircraft. Absolute FL values are
not really required to ensure vertical separation.
A horizontal filter function displays all aircraft
of a selected FL differently on the ODS than all
others. The selected FL represents the reference for
the horizontal filter function. The reference FL is
selected and changed easily with the wheel of the
computer mouse, therefore the tools is called
Wheelie.

Wheelie’s technology
The radar sensors provide the controller with
much more information than he needs for his
specific task. These sensor data are reduced by
filters, selected by the controller. Therefore an ODS
displays filtered aircraft, only. Further vertical
filtering was proposed by H. David [3][4] combined
with color coding to reduce complexity of the en-
rout traffic display. Figure 1 shows a small snapshot
of a conventional en-route traffic situation. Actual
filters work as pre-settings for the ODS. Wheelie is
designed for permanent, dynamic use. Scrolling the
mouse wheel selects the reference FL. Aircraft
flying the reference FL are highlighted in a
graphically emphasis manner. - Wheelie never
suppresses information shown on the ODS screen. –
At first glance the controller can identify potentially
conflicting (horizontally) aircraft flying the
reference FL. All other aircraft are flying on
different FLs, they are out of conflict with the
aircraft selected by Wheelie, regardless of their
horizontal position.
Wheelie displays the selected reference FL
number in a unobtrusive manner in the background
of the ODS. Aircraft flying on the reference FL get
a virtual, invisible source of light behind the aircraft
symbol ‘switched on’, which creates an aureole
around the symbol. This idea was developed and
evaluated by M. Tavanti [5].
The wheel of a mouse represents the ideal tool
for changing the reference FL. The movements up
and down with the wheel are natural to humans. In
general they need no supplementary training or
mental effort to scroll the mouse wheel. Scrolling
all reference FL will be very quick, as a dozen of
FL are used in an en-route sector, mainly.
Figure 2 shows the same traffic situation as in
Figure 1, with Wheelie set to the reference FL 330
and obviously the pending losst of separation,
between AFR1304 and BAW2330, in about 2
minutes is stressing the observer.
For limiting the influence of Wheelie on the
ODS image, Wheelie works on demand only.
Mainly Wheelie is sleeping and wakes up by a turn
of the mouse wheel. After the controller stops
scrolling (delay i.e. 10…20s), the Wheeliefunctionality falls into sleep again and disappears
from the display.
Basic HF aspects of Wheelie
Wheelie is neither another support tool to
create controller’s mental traffic representation, nor
another safety-net tool. Wheelie will stimulate the
controller to see his traffic situation under another,
a restricted ‘vision’ related to the reference FL.
These highlighted aircraft are displayed in a
common way, with an aureole to be distinguished
TAP1104 330
BAW2330 330
KLM304 340
SAS433 360
AZA1004 360
IBE1122 310
DLH1394 320
AFR1304 330
AUA145 320TAP1104
330TAP1104 330
BAW2330 330BAW2330 330
KLM304 340KLM304 340
SAS433 360SAS433 360
AZA1004 360AZA1004 360
IBE1122 310IBE1122 310
DLH1394 320DLH1394 320
AFR1304 330AFR1304 330
AUA145 320AUA145 320
Figure 1. ODS en-route snapshot
KLM304 340
SAS433 360
AZA1004
360
DLH1394
320
AUA145
320
IBE1122 310
AFR1304
330
TAP1104 330
BAW2330 330
KLM304 340KLM304 340
SAS433 360SAS433 360
AZA1004
360
AZA1004
360
DLH1394
320
DLH1394
320
AUA145
320
AUA145
320
IBE1122 310IBE1122 310
AFR1304
330
AFR1304
330
TAP1104 330TAP1104 330
BAW2330 330BAW2330 330
Figure 2. ODS with Wheelie: selected
reference FL 330
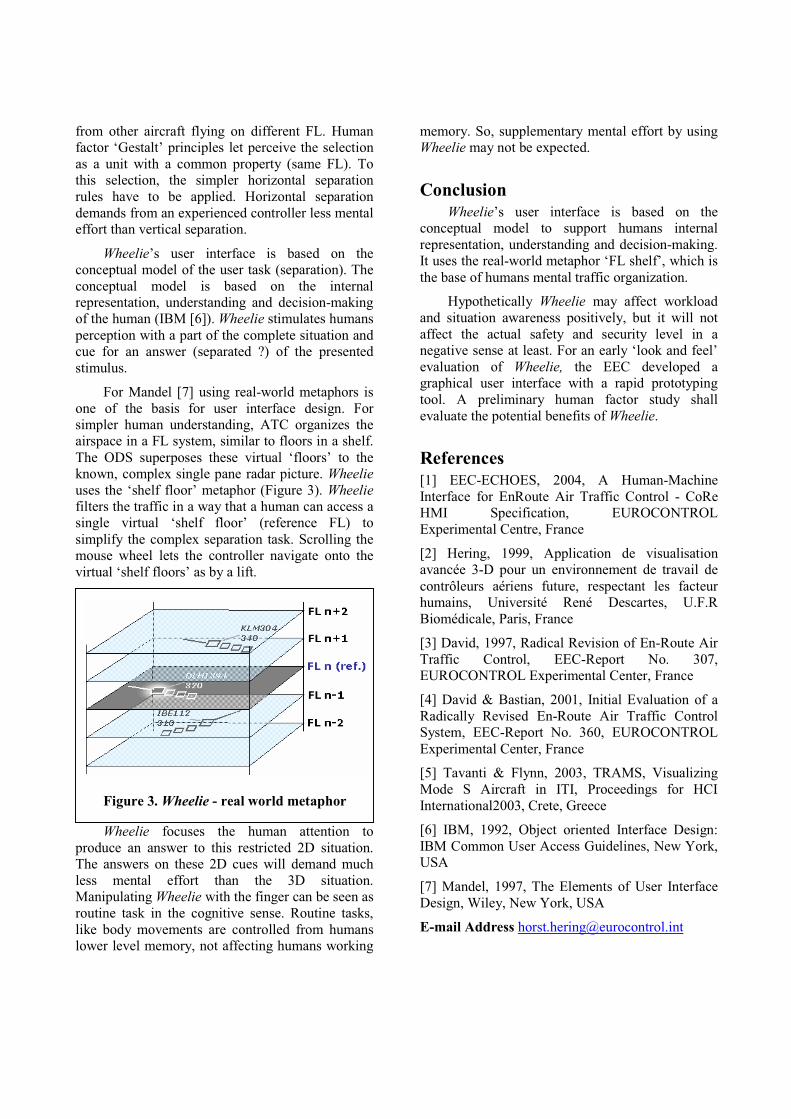
from other aircraft flying on different FL. Human
factor ‘Gestalt’ principles let perceive the selection
as a unit with a common property (same FL). To
this selection, the simpler horizontal separation
rules have to be applied. Horizontal separation
demands from an experienced controller less mental
effort than vertical separation.
Wheelie’s user interface is based on the
conceptual model of the user task (separation). The
conceptual model is based on the internal
representation, understanding and decision-making
of the human (IBM [6]). Wheelie stimulates humans
perception with a part of the complete situation and
cue for an answer (separated ?) of the presented
stimulus.
For Mandel [7] using real-world metaphors is
one of the basis for user interface design. For
simpler human understanding, ATC organizes the
airspace in a FL system, similar to floors in a shelf.
The ODS superposes these virtual ‘floors’ to the
known, complex single pane radar picture. Wheelie
uses the ‘shelf floor’ metaphor (Figure 3). Wheeliefilters the traffic in a way that a human can access a
single virtual ‘shelf floor’ (reference FL) to
simplify the complex separation task. Scrolling the
mouse wheel lets the controller navigate onto the
virtual ‘shelf floors’ as by a lift.
Wheelie focuses the human attention to
produce an answer to this restricted 2D situation.
The answers on these 2D cues will demand much
less mental effort than the 3D situation.
Manipulating Wheelie with the finger can be seen as
routine task in the cognitive sense. Routine tasks,
like body movements are controlled from humans
lower level memory, not affecting humans working
memory. So, supplementary mental effort by using
Wheelie may not be expected.
Conclusion
Wheelie’s user interface is based on the
conceptual model to support humans internal
representation, understanding and decision-making.
It uses the real-world metaphor ‘FL shelf’, which is
the base of humans mental traffic organization.
Hypothetically Wheelie may affect workload
and situation awareness positively, but it will not
affect the actual safety and security level in a
negative sense at least. For an early ‘look and feel’
evaluation of Wheelie, the EEC developed a
graphical user interface with a rapid prototyping
tool. A preliminary human factor study shall
evaluate the potential benefits of Wheelie.
References
[1] EEC-ECHOES, 2004, A Human-Machine
Interface for EnRoute Air Traffic Control - CoRe
HMI Specification, EUROCONTROL
Experimental Centre, France
[2] Hering, 1999, Application de visualisation
avancée 3-D pour un environnement de travail de
contrôleurs aériens future, respectant les facteur
humains, Université René Descartes, U.F.R
Biomédicale, Paris, France
[3] David, 1997, Radical Revision of En-Route Air
Traffic Control, EEC-Report No. 307,
EUROCONTROL Experimental Center, France
[4] David & Bastian, 2001, Initial Evaluation of a
Radically Revised En-Route Air Traffic Control
System, EEC-Report No. 360, EUROCONTROL
Experimental Center, France
[5] Tavanti & Flynn, 2003, TRAMS, Visualizing
Mode S Aircraft in ITI, Proceedings for HCI
International2003, Crete, Greece
[6] IBM, 1992, Object oriented Interface Design:
IBM Common User Access Guidelines, New York,
USA
[7] Mandel, 1997, The Elements of User Interface
Design, Wiley, New York, USA
E-mail Address [email protected]
Figure 3. Wheelie - real world metaphor

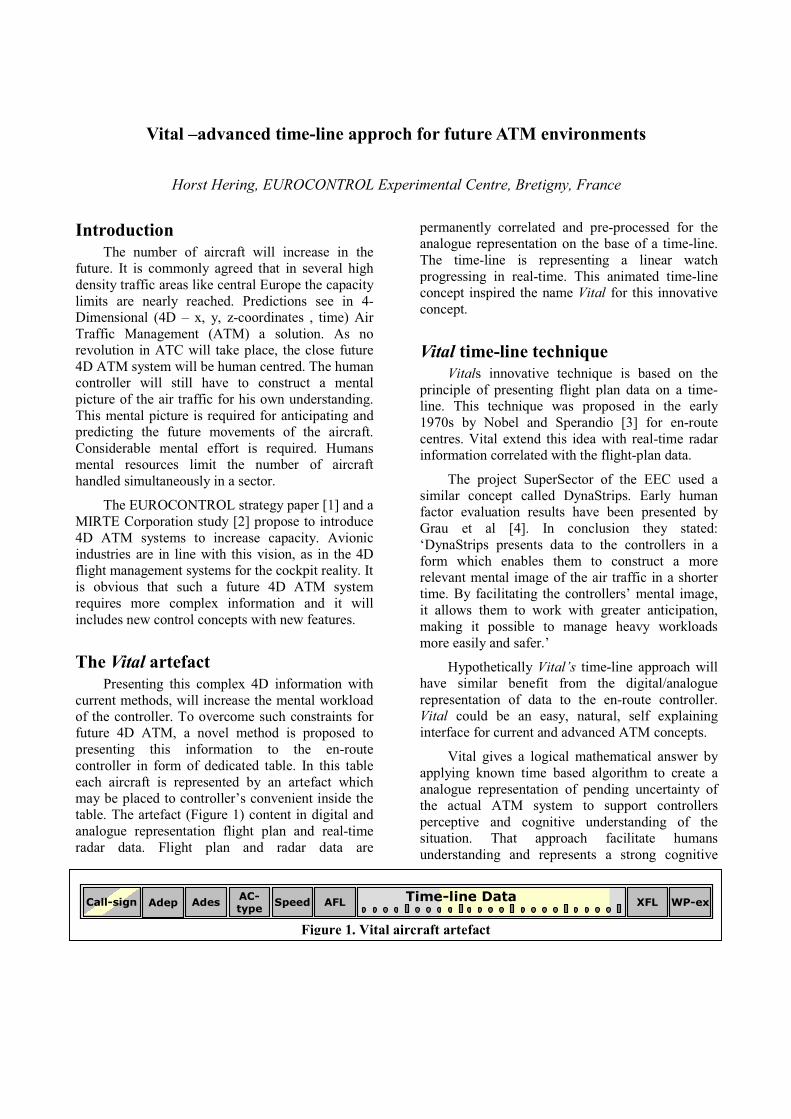
Vital –advanced time-line approch for future ATM environments
Horst Hering, EUROCONTROL Experimental Centre, Bretigny, France
Introduction
The number of aircraft will increase in the
future. It is commonly agreed that in several high
density traffic areas like central Europe the capacity
limits are nearly reached. Predictions see in 4-
Dimensional (4D – x, y, z-coordinates , time) Air
Traffic Management (ATM) a solution. As no
revolution in ATC will take place, the close future
4D ATM system will be human centred. The human
controller will still have to construct a mental
picture of the air traffic for his own understanding.
This mental picture is required for anticipating and
predicting the future movements of the aircraft.
Considerable mental effort is required. Humans
mental resources limit the number of aircraft
handled simultaneously in a sector.
The EUROCONTROL strategy paper [1] and a
MIRTE Corporation study [2] propose to introduce
4D ATM systems to increase capacity. Avionic
industries are in line with this vision, as in the 4D
flight management systems for the cockpit reality. It
is obvious that such a future 4D ATM system
requires more complex information and it will
includes new control concepts with new features.
The Vital artefact
Presenting this complex 4D information with
current methods, will increase the mental workload
of the controller. To overcome such constraints for
future 4D ATM, a novel method is proposed to
presenting this information to the en-route
controller in form of dedicated table. In this table
each aircraft is represented by an artefact which
may be placed to controller’s convenient inside the
table. The artefact (Figure 1) content in digital and
analogue representation flight plan and real-time
radar data. Flight plan and radar data are
permanently correlated and pre-processed for the
analogue representation on the base of a time-line.
The time-line is representing a linear watch
progressing in real-time. This animated time-line
concept inspired the name Vital for this innovative
concept.
Vital time-line technique
Vitals innovative technique is based on the
principle of presenting flight plan data on a time-
line. This technique was proposed in the early
1970s by Nobel and Sperandio [3] for en-route
centres. Vital extend this idea with real-time radar
information correlated with the flight-plan data.
The project SuperSector of the EEC used a
similar concept called DynaStrips. Early human
factor evaluation results have been presented by
Grau et al [4]. In conclusion they stated:
‘DynaStrips presents data to the controllers in a
form which enables them to construct a more
relevant mental image of the air traffic in a shorter
time. By facilitating the controllers’ mental image,
it allows them to work with greater anticipation,
making it possible to manage heavy workloads
more easily and safer.’
Hypothetically Vital’s time-line approach will
have similar benefit from the digital/analogue
representation of data to the en-route controller.
Vital could be an easy, natural, self explaining
interface for current and advanced ATM concepts.
Vital gives a logical mathematical answer by
applying known time based algorithm to create a
analogue representation of pending uncertainty of
the actual ATM system to support controllers
perceptive and cognitive understanding of the
situation. That approach facilitate humans
understanding and represents a strong cognitive
Adep AdesAC-type
XFLAFL WP-exSpeedCall-sign Time-line DataAdep Ades
AC-type
XFLAFL WP-exSpeedCall-sign Time-line Data
Figure 1. Vital aircraft artefact
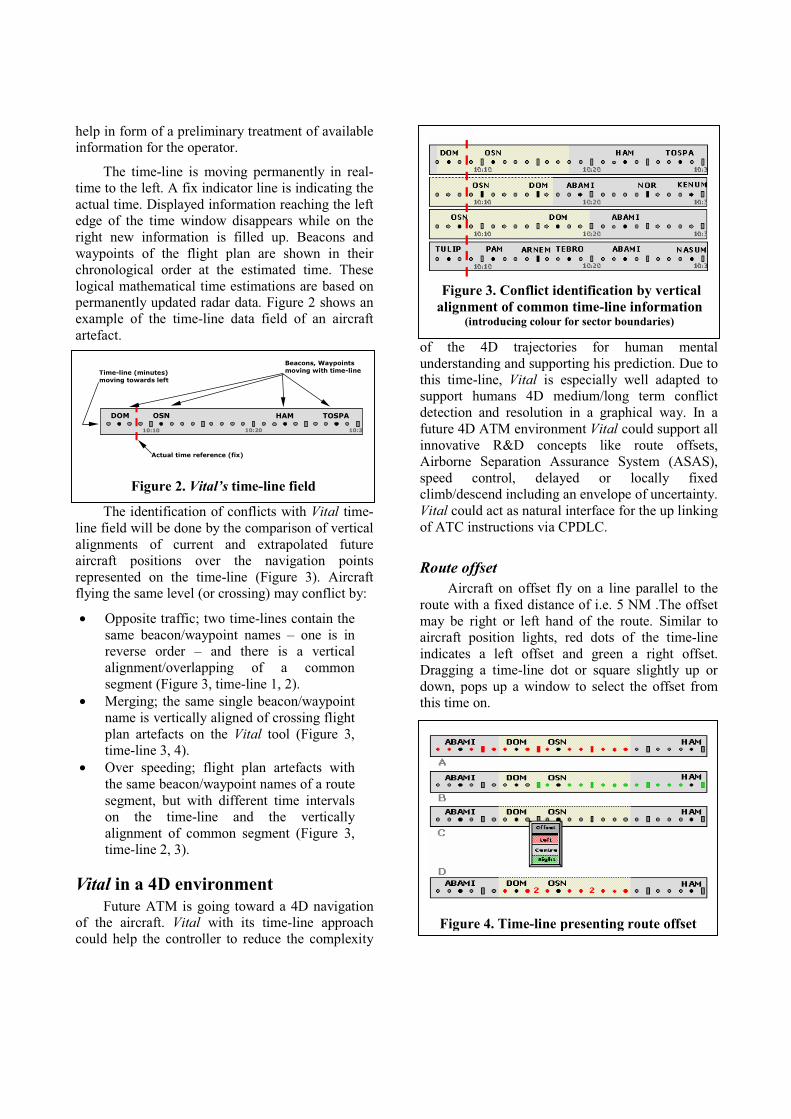
help in form of a preliminary treatment of available
information for the operator.
The time-line is moving permanently in real-
time to the left. A fix indicator line is indicating the
actual time. Displayed information reaching the left
edge of the time window disappears while on the
right new information is filled up. Beacons and
waypoints of the flight plan are shown in their
chronological order at the estimated time. These
logical mathematical time estimations are based on
permanently updated radar data. Figure 2 shows an
example of the time-line data field of an aircraft
artefact.
The identification of conflicts with Vital time-
line field will be done by the comparison of vertical
alignments of current and extrapolated future
aircraft positions over the navigation points
represented on the time-line (Figure 3). Aircraft
flying the same level (or crossing) may conflict by:
• Opposite traffic; two time-lines contain the
same beacon/waypoint names – one is in
reverse order – and there is a vertical
alignment/overlapping of a common
segment (Figure 3, time-line 1, 2).
• Merging; the same single beacon/waypoint
name is vertically aligned of crossing flight
plan artefacts on the Vital tool (Figure 3,
time-line 3, 4).
• Over speeding; flight plan artefacts with
the same beacon/waypoint names of a route
segment, but with different time intervals
on the time-line and the vertically
alignment of common segment (Figure 3,
time-line 2, 3).
Vital in a 4D environment
Future ATM is going toward a 4D navigation
of the aircraft. Vital with its time-line approach
could help the controller to reduce the complexity
of the 4D trajectories for human mental
understanding and supporting his prediction. Due to
this time-line, Vital is especially well adapted to
support humans 4D medium/long term conflict
detection and resolution in a graphical way. In a
future 4D ATM environment Vital could support all
innovative R&D concepts like route offsets,
Airborne Separation Assurance System (ASAS),
speed control, delayed or locally fixed
climb/descend including an envelope of uncertainty.
Vital could act as natural interface for the up linking
of ATC instructions via CPDLC.
Route offset
Aircraft on offset fly on a line parallel to the
route with a fixed distance of i.e. 5 NM .The offset
may be right or left hand of the route. Similar to
aircraft position lights, red dots of the time-line
indicates a left offset and green a right offset.
Dragging a time-line dot or square slightly up or
down, pops up a window to select the offset from
this time on.
Figure 3. Conflict identification by vertical
alignment of common time-line information (introducing colour for sector boundaries)
DOM HAM OSN TOSPA
10:10 10:20 10:3
Actual time reference (fix)
Time-line (minutes)
moving towards left
Beacons, Waypoints
moving with time-line
Figure 2. Vital’s time-line field
Figure 4. Time-line presenting route offset
Climb/descend
Known flight level change of the aircraft are
indicated by the Vital tool. A diagonal blue strip
indicates the estimated level change area. The
different time length of the strips are related to
uncertainty of the manoeuvred execution. The angle
of the strip is depending from the rate of
climb/descend and the number of FL to move. The
final CFL (Cleared Flight Level) is indicated at the
right end of the strips.
Station keeping
Vital is able to indicate a station keeping
‘train’ of aircraft in a natural way on the time-line
(Figure 6). The red bar represents the time segment
on the time-line which is attributed to the ‘train’ of
aircraft. In the example the 3 aircraft occupy about
8 minutes of time space. The controller handles this
‘train’ as one unit which is represented for him by
the first aircraft in line.
Speed envelope
Vital gives the possibility to indicate possible
time envelopes over the next waypoints of the time-
line. These earlier or later arrival of the aircraft over
future waypoints are based on estimated safe speed
variations (related to aircraft type, flight level).
Figure 7 shows an example with ‘speed’ clicked.
Conclusion
Vital proposes to improve the controllers’
mental image of the en-route traffic by the
innovative combination of representing digital and
analogue aircraft data in a same artefact. The
analogue data are extracted from radar sensors,
correlated with flight plan information and
represented pre-processed on a time-line.
An early evaluation of a time-line concept for
strips showed benefit for the time needed to create
the mental traffic picture. Hypothetically similar
benefit could be expected by the concept of Vital.
Several new ATM concepts for a future
complex 4D ATM can be supported by Vital with a
simple, intuitive and natural representation of the
information. The Vital time-line approach may be
adapted to current concepts too.
The EEC will realise the proposed ideas of this
paper as a demonstrator user interface of Vital with
a graphical rapid prototyping tool. This paper
describes its functionality for an early look and feel
evaluation. A hypothetical En-route MONitor
(EMON) presenting Vital’s concept is shown in
Apendix I.
References
[1] EUROCONTROL, 2004, Air Traffic
Management Strategy for the Years 2000+,
EUROCONTROL, Brussels, Belgium,
http://www.eurocontrol.be/dgs/publications/brochur
es/v2_year2000_en/p7.html
[2] Mohleji, Ostwald, Sept. 2003, Future Vision of
Globally Harmonized National Airspace System
with Concepts of Operations Beyond Year
2020,The MIRTE corporation, McLean, USA,
Figure 7. Time-line presenting speed envelope
Figure 6. Time-line presenting station
keeping aircraft
Figure 5. Time-line presenting climb/descend
http://www.mitre.org/work/tech_papers/tech_papers
_03/mohleji_airspace/index.html
[3] Nobel & Sperandio, 1973, Etude experimentale
du strip ‘base temp’ a l’usage des centres des
contrôl régionaux, Centre d’Etude de la Navigation,
France
[4] Grau, Nobel, Guichard, Gawinowski, 2003,
‘DynaStrips’: A time-line approach for improving
the air traffic picture of ATCOs, Proceedings of
22nd
DASC Conference Indianapolis, USA
Email Address
Appendix I
How a EMON - Vital could looks like; an example constructed for the Munster-sector (MN) of the
EUROCONTROL UAC Maastricht with mail- and recycling-box.
09:55
09:55
10:00
10:00
10:05
10:05
10:10
10:10
10:15
10:15
EMON - Vital
D
ABAMI DOM WSR
240
OSN BASUMLFPG EDDH 330430B737AFR452 WSR240
STADE OSNLBE300
BASUMEDDH LFPG 140↑430B737AFR453 ABAMI240
EDEGA RKNSUVOXBIGGE FLEVOTENLILOWW EGCC 320440A320AUA724 FLEVO240
RENNE HMMMOHNE TENLI FLEVO SPY290 320
RKNARPEDDF KLAX 250↑480B747DLH4563 FLEVO240
HMMBIGGE ROSONSAAMSANEDEGAMASEK
240LHBP EHAM 300430B737KLM123 ROBIS240
STADBASUMMEVEL250 330
ARTERVALSUEDDL EKCH 217↑440A320DLH234A STADE240
DLE PIROT EXOBA NEBAR ABAMI RMAREKEDDT LFPO 320430B737EZY123 NEBAR240
DLE PIROT
240 100
MAREK NEBAR ABAMIEXOBAEDDB EDDK 300440A320HLF876 NEBAR240
ABAMI NEBAR MAREK EXOBA PIROT DLENUMCCP253A
EBBR EDDB 310450B757DHL56A PIROT240
SUPAM ARNEM OSN ROBEG310
SONEB SUVOXEHAM EPWA 255↑430B737KLM2357 ROBEG240
EVEL OSN ROBEG DLE HLZ290
EVELEDDL EPWA 289↑440A320DLH122 ROBEG240
STADE DOMOSN
300 240
BASUM.BE BOTESSA EDDL 320440MD80SAS344 DOM240
TADE BASUM DOMOSNESSA EHEH 300380C550PHLNX BOT240
ABAMI DOM
240
OSN VISKI
100
TIMENLFPB EDDV 310410FA42FGLXX VISKI240
250 330VALKIOSNDOMNEBARWYPEDDK EFHK 160↑440A320FIN890 VALKI240
NOW
NOW
09:55
09:55
09:55
09:55
10:00
10:00
10:00
10:00
10:05
10:05
10:05
10:05
10:10
10:10
10:10
10:10
10:15
10:15
10:15
10:15
EMON - Vital
DD
ABAMI DOM WSR
240
OSN BASUMLFPG EDDH 330430B737AFR452 WSR240ABAMI DOM WSR
240
OSN BASUMABAMI DOM WSR
240
OSN BASUMLFPG EDDH 330430B737AFR452 LFPG EDDH 330430B737AFR452 WSR240 WSR240
STADE OSNLBE300
BASUMEDDH LFPG 140↑430B737AFR453 ABAMI240STADE OSNLBE300
BASUMSTADE OSNLBE300
BASUMEDDH LFPG 140↑430B737AFR453 EDDH LFPG 140↑430B737AFR453 ABAMI240 ABAMI240
EDEGA RKNSUVOXBIGGE FLEVOTENLILOWW EGCC 320440A320AUA724 FLEVO240
EDEGA RKNSUVOXBIGGE FLEVOTENLIEDEGA RKNSUVOXBIGGE FLEVOTENLILOWW EGCC 320440A320AUA724 LOWW EGCC 320440A320AUA724 FLEVO240 FLEVO240
RENNE HMMMOHNE TENLI FLEVO SPY290 320
RKNARPEDDF KLAX 250↑480B747DLH4563 FLEVO240RENNE HMMMOHNE TENLI FLEVO SPY290 320
RKNARP RENNE HMMMOHNE TENLI FLEVO SPY290 320
RKNARPEDDF KLAX 250↑480B747DLH4563 EDDF KLAX 250↑480B747DLH4563 FLEVO240 FLEVO240
HMMBIGGE ROSONSAAMSANEDEGAMASEK
240LHBP EHAM 300430B737KLM123 ROBIS240
HMMBIGGE ROSONSAAMSANEDEGAMASEK
240
HMMBIGGE ROSONSAAMSANEDEGAMASEK
240LHBP EHAM 300430B737KLM123 LHBP EHAM 300430B737KLM123 ROBIS240 ROBIS240
STADBASUMMEVEL250 330
ARTERVALSUEDDL EKCH 217↑440A320DLH234A STADE240STADBASUMMEVEL
250 330ARTERVALSU STADBASUMMEVEL
250 330ARTERVALSU
EDDL EKCH 217↑440A320DLH234A EDDL EKCH 217↑440A320DLH234A STADE240 STADE240
DLE PIROT EXOBA NEBAR ABAMI RMAREKEDDT LFPO 320430B737EZY123 NEBAR240
DLE PIROT EXOBA NEBAR ABAMI RMAREKDLE PIROT EXOBA NEBAR ABAMI RMAREKEDDT LFPO 320430B737EZY123 EDDT LFPO 320430B737EZY123 NEBAR240 NEBAR240
DLE PIROT
240 100
MAREK NEBAR ABAMIEXOBAEDDB EDDK 300440A320HLF876 NEBAR240
ABAMI NEBAR MAREK EXOBA PIROT DLENUMCCP253A
EBBR EDDB 310450B757DHL56A PIROT240
DLE PIROT
240 100
MAREK NEBAR ABAMIEXOBADLE PIROT
240 100
MAREK NEBAR ABAMIEXOBAEDDB EDDK 300440A320HLF876 EDDB EDDK 300440A320HLF876 NEBAR240 NEBAR240
ABAMI NEBAR MAREK EXOBA PIROT DLENUMCCP253A
EBBR EDDB 310450B757DHL56A PIROT240ABAMI NEBAR MAREK EXOBA PIROT DLENUM
CCP253A
ABAMI NEBAR MAREK EXOBA PIROT DLENUMCCP253A
EBBR EDDB 310450B757DHL56A EBBR EDDB 310450B757DHL56A PIROT240 PIROT240
SUPAM ARNEM OSN ROBEG310
SONEB SUVOXEHAM EPWA 255↑430B737KLM2357 ROBEG240SUPAM ARNEM OSN ROBEG310
SONEB SUVOXSUPAM ARNEM OSN ROBEG310
SONEB SUVOXEHAM EPWA 255↑430B737KLM2357 EHAM EPWA 255↑430B737KLM2357 ROBEG240 ROBEG240
EVEL OSN ROBEG DLE HLZ290
EVELEDDL EPWA 289↑440A320DLH122 ROBEG240EVEL OSN ROBEG DLE HLZ290
EVELEVEL OSN ROBEG DLE HLZ290
EVELEDDL EPWA 289↑440A320DLH122 EDDL EPWA 289↑440A320DLH122 ROBEG240 ROBEG240
STADE DOMOSN
300 240
BASUM.BE BOTESSA EDDL 320440MD80SAS344 DOM240STADE DOMOSN
300 240
BASUM.BE BOTSTADE DOMOSN
300 240
BASUM.BE STADE DOMOSN
300 240
BASUM.BE BOTESSA EDDL 320440MD80SAS344 ESSA EDDL 320440MD80SAS344 DOM240 DOM240
TADE BASUM DOMOSNESSA EHEH 300380C550PHLNX BOT240TADE BASUM DOMOSNTADE BASUM DOMOSNESSA EHEH 300380C550PHLNX ESSA EHEH 300380C550PHLNX BOT240 BOT240
ABAMI DOM
240
OSN VISKI
100
TIMENLFPB EDDV 310410FA42FGLXX VISKI240
ABAMI DOM
240
OSN VISKI
100
TIMENABAMI DOM
240
OSN VISKI
100
TIMENLFPB EDDV 310410FA42FGLXX LFPB EDDV 310410FA42FGLXX VISKI240 VISKI240
250 330VALKIOSNDOMNEBARWYPEDDK EFHK 160↑440A320FIN890 VALKI240
250 330VALKIOSNDOMNEBARWYP
250 330VALKIOSNDOMNEBARWYPEDDK EFHK 160↑440A320FIN890 EDDK EFHK 160↑440A320FIN890 VALKI240 VALKI240
NOW
NOW
NOW
NOW
Augmented Reality Tools for Tower Control
Magnus AXHOLT, PhD Student
Stephen PETERSON, PhD Student
EUROCONTROL Experimental Centre & Linkoping University
Introduction
The aim of the project is to apply
visualization techniques to all possible
data sets in the air traffic control tower
in order to help the controller perform
his task in a more effective manner. The
project will concentrate on principles
within Augmented Reality (AR) by
constructing a common test bed to be
used for both technical implementations
and human factor evaluations.
Initial work will involve assessment of
the state of the art and inventory of
suitable technology. Literature study and
hardware setup will be followed by
software development to create a test
environment. Tests will yield results for
further development into to main
branches: abstract phenomena and
concrete objects.
Background
A modern control tower is equipped with
many separate systems and subsequently
has many separate sources of data. Flight
plans, radar data, runway and taxiway
layout, weather information, wind
direction and speed, atmospheric
pressure, runway visual range, cloud
ceiling are just a few. The controller is
continuously updating his mental picture
by interpreting all this data in order to
have all information available to perform
his tasks systematically, and foremost,
correctly. As a consequence of this, the
controller tends to spend much time
head-down “inside the tower” rather
than head-up, outside, losing the picture
of the traffic situation.[1]
Visualization is the process of exploring,
transforming, and viewing data as
images (or other sensory forms) to gain
insight into the data[2].
There have been previous studies on
how computer visualization can help a
controller perform his tasks more
efficiently. Human factors experts have
found that a specific system design can
have both beneficial and adverse effects
on the controllers’ performance. Aiding
in one task might make others harder[3].
As there have been a number of studies
that reach contradictory conclusions
regarding the applicability of 3D
graphics in the ATM domain it gives us
reason to believe that system benefits are
task dependent [4].
Applicability
Intuitively the AR approach has a lot of
potential. One obvious application is
enhancing visibility conditions to
alleviate the constraints of bad weather
conditions. Aircraft position, movement
and state in reference to airport layout is
such an example. More abstract
examples are meteorological phenomena
such as wind direction. Furthermore
there is the possibility to display the
results of calculations or pre-calculated
simulation results, such as the effects of
a wake vortex.
AR can also be used for collaborative
decision making whether it be
illustrating the progress of processes or
using symbolic data. AR may also
investigate historical data and statistics,
according to traditional data
visualization methods involving stream
ribbons and density plots.
In its similarity to Virtual Reality (VR),
as a step towards VR, AR will provide
useful insights when evaluating
procedures for a future towerless control,
the Virtual Tower.
Project Scheme
(1) The initial state of the art
investigation and technology inventory
will provide a framework and taxonomy.
(2) Thereafter a test environment will be
developed. (3) Fundamental problems
such as hardware calibration must be
solved, possibly with interaction
schemes, intelligent software layers,
compensating coarse calibration
standards. (4) Results of ATCO task
analysis will identify basic practices for
which to construct interaction models.
(5) These will be tested and models
proven to be successful will be built
upon, following the guidelines of the
previously set framework so as to avoid
inconclusive results or areas where
studies are already in progress. (6) The
common test environment will be split
into two research areas investigating (6a)
concrete object and (6b) abstract
phenomena. (7) Findings will
continuously be summarized and
recommendations will be presented in
reports. The reports will be the
foundation of the thesis.
Expected Results
- A framework and taxonomy to
be able to compile test results
that are comparable, and
facilitate future research.
- An AR test environment that is
developed through user feedback
where each step is validated.
- Prioritize tasks that benefit from
3D visualization, and
consequently some that do not.
- Conclusions applicable both for
AR and VR useful in a future
Virtual Tower project.
References [1] Franzl, T. (2001). Wearable Computing
Augmented Vision Information Systems for Air
Traffic Control Towers. International Conference
and Workshop: Telecommunications and Mobile
Computing, October 15-16, 2001, Graz,
Germany.
[2] Schroeder, W., Martin, K., Lorensen, B.
(1998). The Visualization Toolkit, 2nd Edition
(p. 5). New Jersey: Prentice Hall PTR
[4] Stuart, G.W., McAnally, K.I., & Meehan,
J.W. (2001). Head-up displays and visual
attention: integrating data and theory. Human
Factors and Erospace Safety, 1, 103-124.
[5] Tavanti, M., Le, H., Nguyen-Thong, D.,
Three-Dimensional Stereoscopic Visualization
for Air Traffic Control Interfaces: A Preliminary
Study. AIAA/IEEE Digital Avionics Systems
Conference, October 2003, Indianapolis.
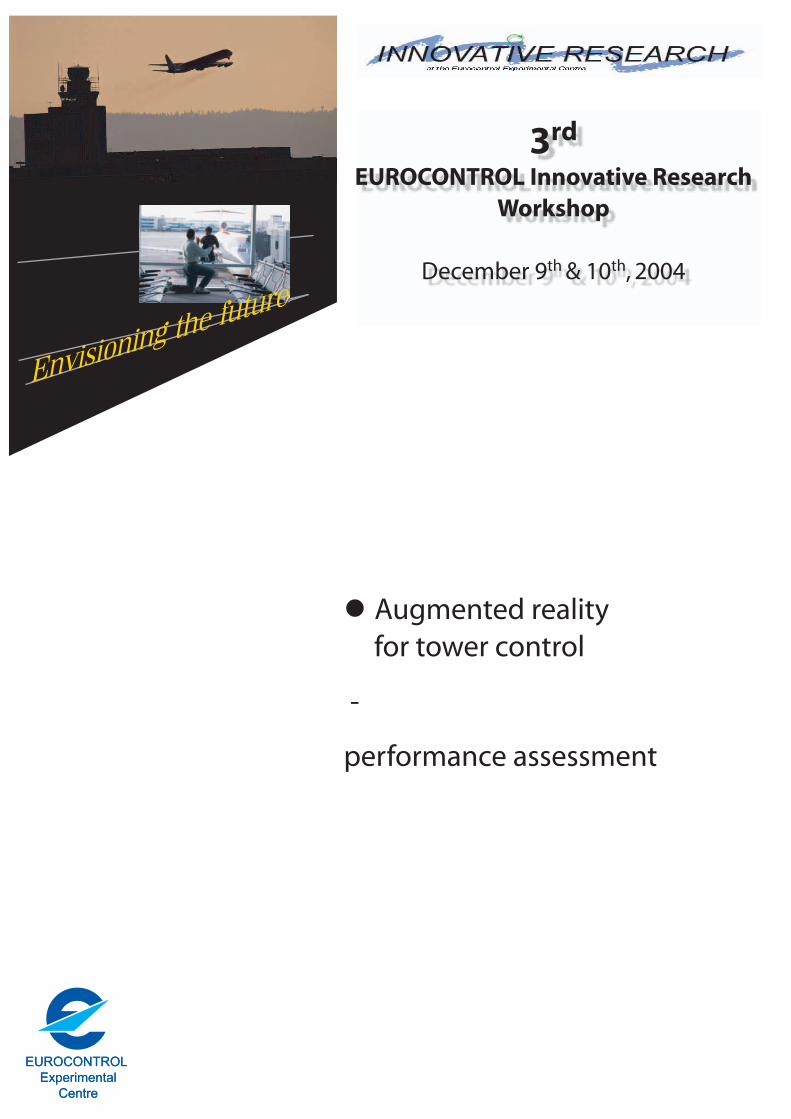
3D Visualization and Interaction Tower Control Traffic
Performance assessment
Study design
Elzbieta Pinska, PhD Student
EUROCONTROL Experimental Centre & Sorbonne University Paris
1. Introduction The proposed studies are continuation of
multidisciplinary framework for empirical analysis of the applicability of 3D stereoscopic visualization and interaction for ATC environment carried out at EUROCONTROL Experimental Centre. The framework composes of three components: Human Factors, Visualization and Interaction.
The previous studies were focused on the empirical investigation of memory task performance for 2D and 3D displays for ATC. The results show that 3D display enhanced performance of some tasks (1), (2).
Current studies concern evaluation of visualization and interaction for tower control traffic. The main attention will be given to performance parameters assessment for tower control activity.
2. Background Tower control activity is based on spatial
orientation and integration of the airspace among the three dimensions. Controllers relay on the window view visibility that depends on day/night time and existing weather conditions or radar, that presents only two dimensions and where only mouse interactions are allowed. The controllers maintain three dimensional mental picture of traffic situation, supported by these recourses.
Its is expected that augmented reality technology, used for Virtual Tower takes an advantages of containing depth cues and can represent data in easily accessible way for controller. The anticipated advantages of augmented reality are a very realistic representation of picture regardless to outdoor conditions. The representation include the realistic visual image of the objects (aircraft type), additionally provides
flight related information attached to the object like aircraft tracks, vertical speed, flight plans and all addition tools that support controller in his task. Presented scenarios offer high level visibility apart from day/night time and also the weather events like fog or clouds might be presented without screen saturation and occlusion.
Furthermore applying augmented reality displays acquires spatial manipulation and navigation among the representation. Also interactive Human Machine Interface allows controller to act in more flexible and suitable to his preferences. Rapid and dynamic interaction, zooming certain spot of traffic or rotation that changing point of view might bring benefits for controllers, however more further research are require to examine the most profitable use of this functions.
3. Topics for Study The previous research results for 3D
applicability are not consistent (3). The performance assessment in words of timing and accuracy for identifying flights levels was superior for 3D displays (2). Other authors found no difference in performance among 3D and 2D (4). The results suggest that it might be due to the task dependency for the performance of 3D displays (3).
For this reason planned research will evaluate of the impact of 3D displays on performance for particular tasks. For the air traffic control activity the precise judgment of spatial localization of object is a key element therefore spatial attention will be given to following topics:
o Depth judgment o Accuracy of distance judgment o Measurement of execution time and other
performance characteristic
o Error analysis o Analysis of spatial orientation issues
The proposed topic will be extended during the exploration of area. Any comments for developing area are welcome and will be considered by the author of the study.
4. Study scheme This is an initial proposal for PhD study,
planned to run out at EUROCONTROL Research Centre at Bretigny s/Orge between October 2004 to September 2007.
The first six months of study will be addressed to the extensive exploration of the state of art for the topics:
o 3 D and ATC (EEC 3D team results and others)
o Human visual perception o Controller’s interviewing and tower control
incident’s analysis
After sufficient investigation another six month studies is foreseen to design and conduct a preliminary research within internal resources that allows capturing the holistic problem set up for the main experiment design. The preliminary study will lead to the main experiment design that will be conducted at second trimester 2006. The next step will be to analysis the data and publish preface results. The final results will be presented at the end of 2006. Last half a year will be addressed to work on the PhD thesis and preparing to defense.
5. Expected results The proposed studies are expected to evaluate
the applicability and usability of employing advanced 3D technologies for ATC domain. The results will explore the possibility of supporting tower control activity by elements of augmented reality. All the potential problems are expected to be reveled and solution will be proposed.
6. References (1) Dang Nguyen, H. Le-Hong, M. Tavanti.
“Empirical Analysis of the Applicability of 3D Stereoscopic in Air Traffic Control”. In
Proceedings of “IEEE 6th ITSC2003, International Conference on Intelligent Transportation Systems”, Shanghai, China, October, 2003.
(2) Tavanti, H. Le-Hong, T. Dang-Nguyen, "Three-dimensional Stereoscopic visualization for Air Traffic Control Interfaces: a preliminary study". In Proceedings of the IEEE "22nd Digital Avionics Systems Conference", Indianapolis, Indiana, October 2003.
(3) Wickens, C. D., 2000. The when and how of using 2-D and 3-D displays for operational tasks, In Proc. of the 44th Annual Meeting of the Human Factors and Ergonomics Society, pp. 403-406. Santa Monica, CA: Human Factors Society.
(4) Tham, M., & Wickens, C.D., 1993, Evaluation of perspective and stereoscopic displays as alternatives to plan view displays in air traffic control,Technical Report (ARL-93-4/FAA-93-1). University of Illinois Institute of Aviation, USA.

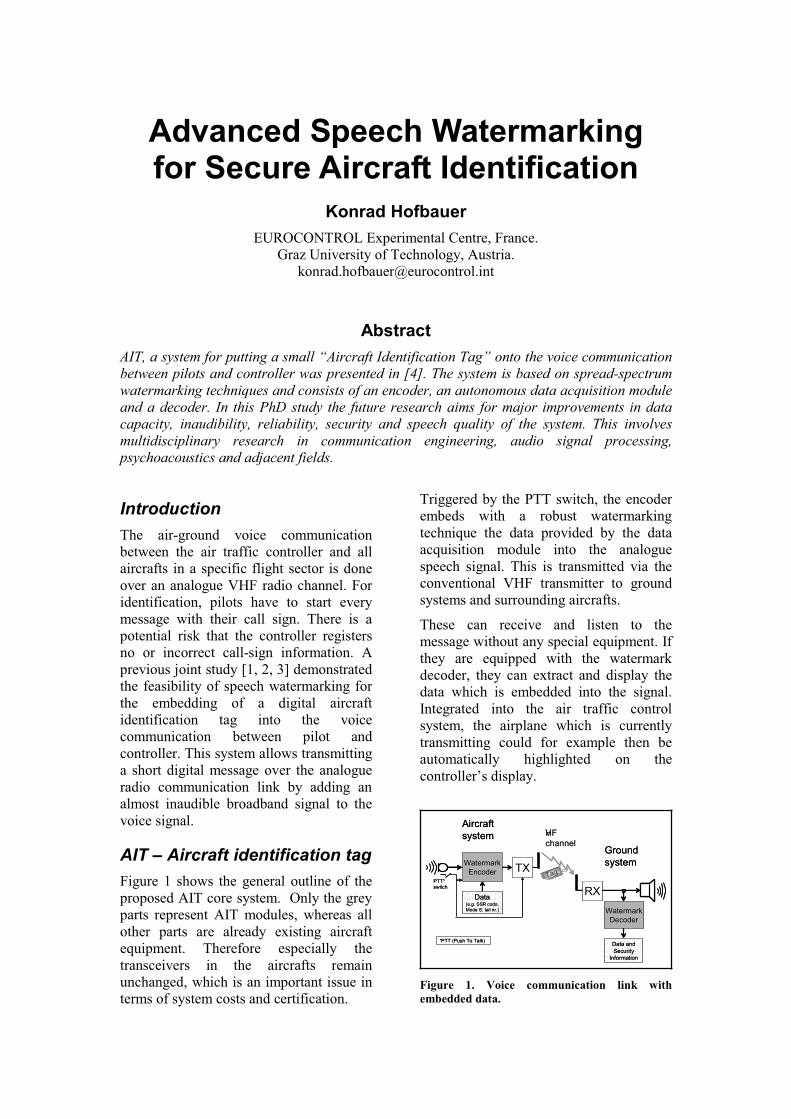
Advanced Speech Watermarking for Secure Aircraft Identification
Konrad Hofbauer
EUROCONTROL Experimental Centre, France.
Graz University of Technology, Austria.
Abstract
AIT, a system for putting a small “Aircraft Identification Tag” onto the voice communication between pilots and controller was presented in [4]. The system is based on spread-spectrum
watermarking techniques and consists of an encoder, an autonomous data acquisition module and a decoder. In this PhD study the future research aims for major improvements in data capacity, inaudibility, reliability, security and speech quality of the system. This involves
multidisciplinary research in communication engineering, audio signal processing, psychoacoustics and adjacent fields.
Introduction
The air-ground voice communication
between the air traffic controller and all
aircrafts in a specific flight sector is done
over an analogue VHF radio channel. For
identification, pilots have to start every
message with their call sign. There is a
potential risk that the controller registers
no or incorrect call-sign information. A
previous joint study [1, 2, 3] demonstrated
the feasibility of speech watermarking for
the embedding of a digital aircraft
identification tag into the voice
communication between pilot and
controller. This system allows transmitting
a short digital message over the analogue
radio communication link by adding an
almost inaudible broadband signal to the
voice signal.
AIT – Aircraft identification tag
Figure 1 shows the general outline of the
proposed AIT core system. Only the grey
parts represent AIT modules, whereas all
other parts are already existing aircraft
equipment. Therefore especially the
transceivers in the aircrafts remain
unchanged, which is an important issue in
terms of system costs and certification.
Triggered by the PTT switch, the encoder
embeds with a robust watermarking
technique the data provided by the data
acquisition module into the analogue
speech signal. This is transmitted via the
conventional VHF transmitter to ground
systems and surrounding aircrafts.
These can receive and listen to the
message without any special equipment. If
they are equipped with the watermark
decoder, they can extract and display the
data which is embedded into the signal.
Integrated into the air traffic control
system, the airplane which is currently
transmitting could for example then be
automatically highlighted on the
controller’s display.
TX
RX
Aircraft
system
Ground
system
PTT* switch
* PTT (Push To Talk)
Data(e.g. SSR code,
Mode S, tail nr.)
Watermark
Encoder Tag
Watermark
Decoder
Data and
Security
Information
VHF
channel
TX
RX
Aircraft
system
Ground
system
PTT* switch
* PTT (Push To Talk)
Data(e.g. SSR code,
Mode S, tail nr.)
Watermark
Encoder TagTag
Watermark
Decoder
Data and
Security
Information
VHF
channel
Figure 1. Voice communication link with
embedded data.

Encoder
The watermark encoder is working in the
digital domain and currently bases on
direct-sequence spread spectrum
technology and frequency masking.
The first step in the encoder adds
redundancy to the digital data by an error
control coding scheme. This highly
increases the reliability of the system and
is necessary because of the distortions
occurring in the VHF transmission.
In the next step, this coded data is spread
over the available frequency bandwidth by
a well-defined pseudo-noise sequence.
This watermarked signal is then spectrally
shaped with a LPC filter and embedded
into the digitized speech signal, exploiting
the frequency masking property of the
human perception. As a last step, the
digital signal is converted back to
analogue domain.
Decoder
After transmission and conversion to
digital domain again, the decoder applies a
whitening filter on the incoming signal to
compensate for the spectral shaping in the
encoder. After the decoder’s
synchronization to the data stream, the
signal is de-spread and the watermark data
extracted. With the redundancy included
in the encoding stage, the decoder can
correct errors which occurred during the
radio transmission.
Data Module
The purpose of the data extension module
is to provide the payload data (e.g. SSR
code) and PTT switch status to the AIT
system. For simplified cockpit integration
and certification, the data should be
acquired autonomously without
connection to the aircraft’s internal data
busses and without any user interaction
required.
Current research evaluates the feasibility
of integrating two simple radio receivers
into the data module. One of them detects
active VHF transmissions, which implies
that the PTT switch is currently pressed.
The second receiver continuously
monitors the SSR identifier which is
broadcasted by the aircraft’s transponder.
Therefore it seems possible to integrate the
AIT system into the connector of the
pilot’s headset, without any further
modification to the aircraft equipment.
Figure 2 shows some possible
configurations for the aircraft system.
Target objectives and future research topics
The present research aims at substantial
improvements of the speech watermarking
system regarding its design and its range
of applications.
Whereas the author’s research focuses on
the following issues on an algorithmic
level, the development on system level,
implementation and cockpit integration are
carried out in cooperation with external
partners.
Capacity
We have strong believe, that the payload
data rate of the system can be increased to
100bit/s. In this case for example the
position of the aircraft can be transmitted
as well. To achieve this, we will conduct
in-depth research in state-of-the-art
watermarking and data hiding algorithms
and adapt them to the specific needs of the
AIT application.
A D
DA
DSP
Powermanagement
AC bus
Rx (VHF)/PS noise
Fix data
Payload
Data-Bus
PTT
Switch-Bus
AC bus
Rx (SSR)
Data Integrity
Tx
AIT base system
AIT data extension
A D
A D
DA
DA
DSP
Powermanagement
AC bus
Rx (VHF)/PS noise
Fix data
Payload
Data-Bus
PTT
Switch-Bus
AC bus
Rx (SSR)
Data Integrity
Tx
AIT base system
AIT data extension
Figure 2. AIT aircraft system architecture.
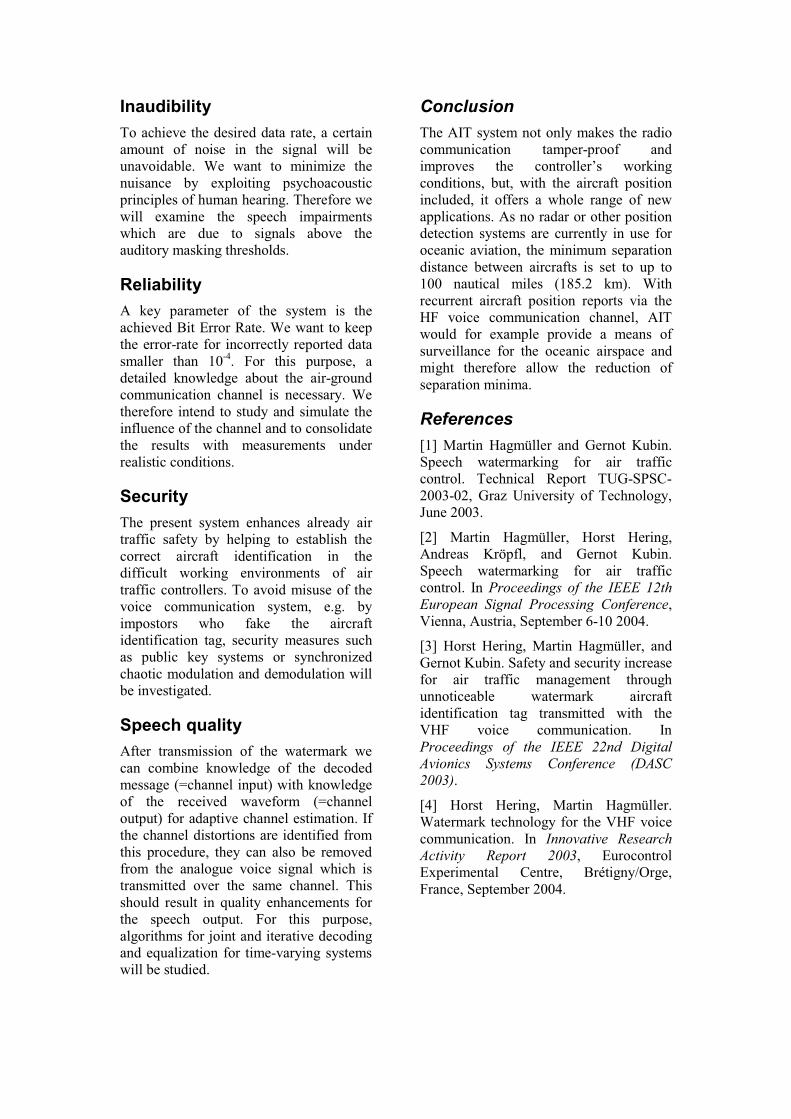
Inaudibility
To achieve the desired data rate, a certain
amount of noise in the signal will be
unavoidable. We want to minimize the
nuisance by exploiting psychoacoustic
principles of human hearing. Therefore we
will examine the speech impairments
which are due to signals above the
auditory masking thresholds.
Reliability
A key parameter of the system is the
achieved Bit Error Rate. We want to keep
the error-rate for incorrectly reported data
smaller than 10-4
. For this purpose, a
detailed knowledge about the air-ground
communication channel is necessary. We
therefore intend to study and simulate the
influence of the channel and to consolidate
the results with measurements under
realistic conditions.
Security
The present system enhances already air
traffic safety by helping to establish the
correct aircraft identification in the
difficult working environments of air
traffic controllers. To avoid misuse of the
voice communication system, e.g. by
impostors who fake the aircraft
identification tag, security measures such
as public key systems or synchronized
chaotic modulation and demodulation will
be investigated.
Speech quality
After transmission of the watermark we
can combine knowledge of the decoded
message (=channel input) with knowledge
of the received waveform (=channel
output) for adaptive channel estimation. If
the channel distortions are identified from
this procedure, they can also be removed
from the analogue voice signal which is
transmitted over the same channel. This
should result in quality enhancements for
the speech output. For this purpose,
algorithms for joint and iterative decoding
and equalization for time-varying systems
will be studied.
Conclusion
The AIT system not only makes the radio
communication tamper-proof and
improves the controller’s working
conditions, but, with the aircraft position
included, it offers a whole range of new
applications. As no radar or other position
detection systems are currently in use for
oceanic aviation, the minimum separation
distance between aircrafts is set to up to
100 nautical miles (185.2 km). With
recurrent aircraft position reports via the
HF voice communication channel, AIT
would for example provide a means of
surveillance for the oceanic airspace and
might therefore allow the reduction of
separation minima.
References
[1] Martin Hagmüller and Gernot Kubin.
Speech watermarking for air traffic
control. Technical Report TUG-SPSC-
2003-02, Graz University of Technology,
June 2003.
[2] Martin Hagmüller, Horst Hering,
Andreas Kröpfl, and Gernot Kubin.
Speech watermarking for air traffic
control. In Proceedings of the IEEE 12th European Signal Processing Conference,
Vienna, Austria, September 6-10 2004.
[3] Horst Hering, Martin Hagmüller, and
Gernot Kubin. Safety and security increase
for air traffic management through
unnoticeable watermark aircraft
identification tag transmitted with the
VHF voice communication. In
Proceedings of the IEEE 22nd Digital Avionics Systems Conference (DASC 2003).
[4] Horst Hering, Martin Hagmüller.
Watermark technology for the VHF voice
communication. In Innovative Research Activity Report 2003, Eurocontrol
Experimental Centre, Brétigny/Orge,
France, September 2004.

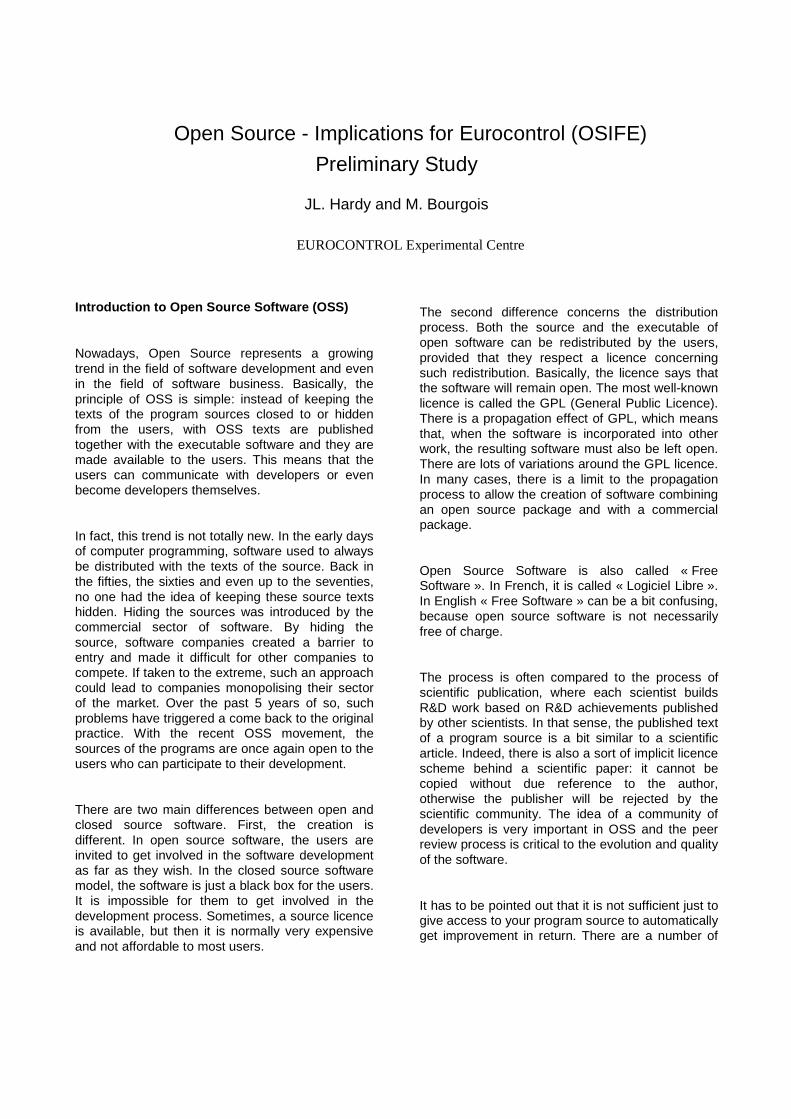
Open Source - Implications for Eurocontrol (OSIFE) Preliminary Study
JL. Hardy and M. Bourgois
EUROCONTROL Experimental Centre
Introduction to Open Source Software (OSS)
Nowadays, Open Source represents a growing trend in the field of software development and even in the field of software business. Basically, the principle of OSS is simple: instead of keeping the texts of the program sources closed to or hidden from the users, with OSS texts are published together with the executable software and they are made available to the users. This means that the users can communicate with developers or even become developers themselves.
In fact, this trend is not totally new. In the early days of computer programming, software used to always be distributed with the texts of the source. Back in the fifties, the sixties and even up to the seventies, no one had the idea of keeping these source texts hidden. Hiding the sources was introduced by the commercial sector of software. By hiding the source, software companies created a barrier to entry and made it difficult for other companies to compete. If taken to the extreme, such an approach could lead to companies monopolising their sector of the market. Over the past 5 years of so, such problems have triggered a come back to the original practice. With the recent OSS movement, the sources of the programs are once again open to the users who can participate to their development.
There are two main differences between open and closed source software. First, the creation is different. In open source software, the users are invited to get involved in the software development as far as they wish. In the closed source software model, the software is just a black box for the users. It is impossible for them to get involved in the development process. Sometimes, a source licence is available, but then it is normally very expensive and not affordable to most users.
The second difference concerns the distribution process. Both the source and the executable of open software can be redistributed by the users, provided that they respect a licence concerning such redistribution. Basically, the licence says that the software will remain open. The most well-known licence is called the GPL (General Public Licence). There is a propagation effect of GPL, which means that, when the software is incorporated into other work, the resulting software must also be left open. There are lots of variations around the GPL licence. In many cases, there is a limit to the propagation process to allow the creation of software combining an open source package and with a commercial package.
Open Source Software is also called « Free Software ». In French, it is called « Logiciel Libre ». In English « Free Software » can be a bit confusing, because open source software is not necessarily free of charge.
The process is often compared to the process of scientific publication, where each scientist builds R&D work based on R&D achievements published by other scientists. In that sense, the published text of a program source is a bit similar to a scientific article. Indeed, there is also a sort of implicit licence scheme behind a scientific paper: it cannot be copied without due reference to the author, otherwise the publisher will be rejected by the scientific community. The idea of a community of developers is very important in OSS and the peer review process is critical to the evolution and quality of the software.
It has to be pointed out that it is not sufficient just to give access to your program source to automatically get improvement in return. There are a number of
additional conditions that must be fulfilled to get open software dynamics that will generate the development of the software. The methodology of open software is not yet clearly established, despite some anthropological observations about the culture of developers, also called « hackers ».
The field of OSS has several well-known gurus. Richard M. Stallman is the founder of the « Free Software » movement. He is probably the most respected person in the Open Software community, because he invented the GPL licence almost 20 years ago. Originally the GPL was used for a free UNIX project called GNU. The GPL licence is the one used by Linux Torvalds, a younger guru who is probably the most famous, because he gave his name to Linux. The third guru is Eric S. Raymond who is famous for having written the article and the subsequent book called « The Cathedral and the Bazaar » in which he points out some fundamental differences between the planned development of closed software (with clear objectives and a list of precise specifications defined from the beginning), and the more anarchical open source development where the process is much more incremental.
OSS has already well-known success stories with some widely used applications in different fields:
• Operating systems: Linux, FreeBSD. • High-level languages: Perl, PHP, Python. • Data Bases: MySQL, PostGreSQL. • Office automation: OpenOffice. • Internet-client: Mozilla suite, including Firefox. • Internet-server: Apache.
Introduction of the OSIFE project
Given that the OSS is regarded either as an accidental revolution or as a paradigm shift, the objective of the OSIFE project is to understand what this revolution/paradigm is about in order to determine if, when and how it could impact the business in ATM.
The method applied to the project is classical: review of the literature, definition and ordering of hypotheses, test and validation of these hypotheses (with possible iterations for the definitions of new
hypotheses), and finally conclusions and recommendations. The validation process will involve contact with other industrial domains to discover if the OSS paradigm has already been applied especially where software is critical for safety. Another validation activity will be to revisit some main Eurocontrol software projects with the following question: what if an open source scheme would have been applied to these projects? In the short term, we intend to collect feedback from a questionnaire addressed to the companies involved in the next ATC-Maastricht exhibition in February 2005.
Up to now, we have determined 4 main hypotheses for this project.
The first hypothesis concerns the harmonization of ATM. There have already in the past been several approaches to harmonize systems in the ATM domain. The first approach was to develop standards. The ASTERIX format used for the interchange of radar data is one of the best achievements of this approach, but not many have followed. The second approach was to launch common developments. A typical example is ARTAS, the radar data tracker and server. However, because the development was outsourced to one company, a monopoly was created and contested. The third approach is multiple developments. eFDP is a typical example of that approach, but the verdict is still out. Based on the fact that most closed software approaches to harmonization of ATM seem to fail or have limited impact, it can be assumed that the OSS approach could be a means to inject common kernel applications in the ATM that will facilitate harmonization and inter-operability.
The second hypothesis concerns software quality. Based on the fact that a lot of OSS complex software demonstrate high quality achievements, it can be assumed that the quality of complex ATM software could be improved through OSS development methods.
The third hypothesis concerns the business model in ATM software. Based on the fact that the OSS development is financed by some companies looking for revenues in hardware (Sun) or services
(IBM, Redhat, …), it can be assumed that OSS development would definitively change the business model in the ATM industry, but companies would continue (or start?) to generate profit from ATM.
The fourth hypothesis concerns the role of Eurocontrol as a public service. The first premise for this hypothesis is that it may be useful to open the text of software sources to any potential user, if and only if these users have the competence to understand these sources and the underlying assumptions. The second premise is the fact that there are many tools developed in the scope of Eurocontrol projects that simply disappear once the project over or people are gone. Based on these two premises, it can be assumed that many of the tools developed at Eurocontrol could be mutually beneficial to the research community at large in ways we cannot anticipate and involving researchers that we may not even interact with today.
To summarize and simplify these four hypotheses, it could be said that, through an Open Source Software approach by Eurocontrol, the harmonization of the ATM would be improved, the quality of ATM software would remain the same, the ATM industry would change but continue, and the public service obligation would be met in a better manner.

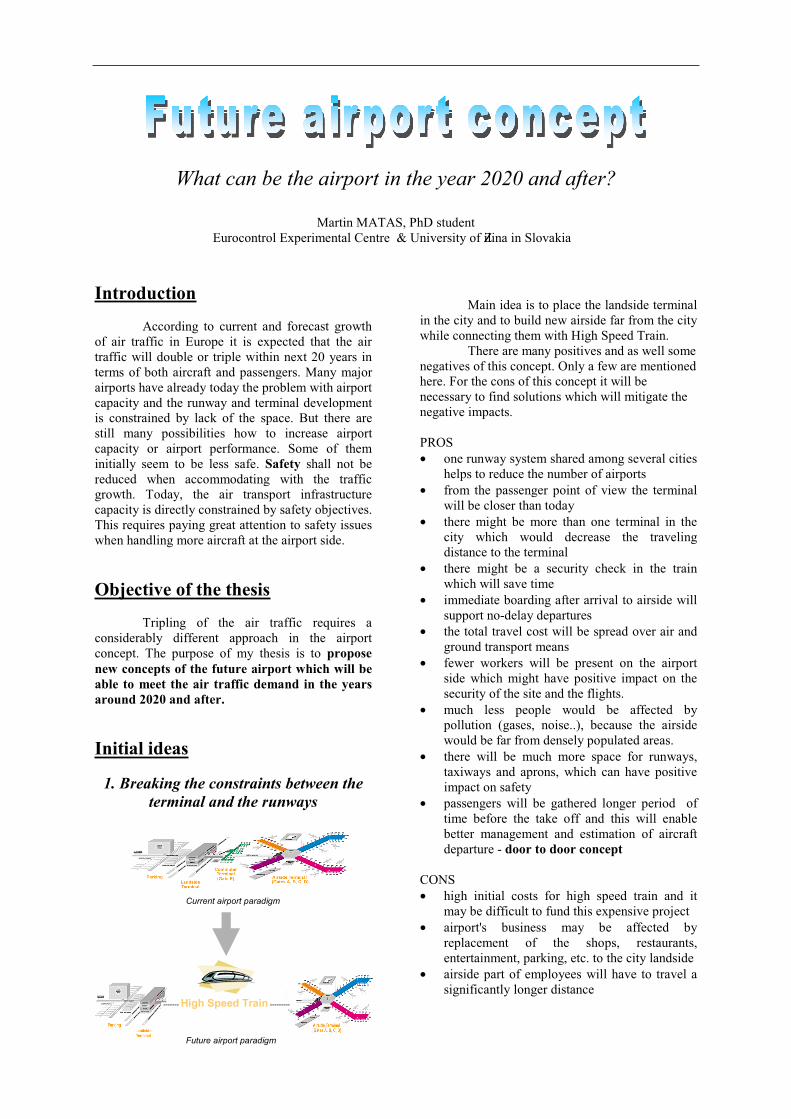
What can be the airport in the year 2020 and after?
Martin MATAS, PhD student
Eurocontrol Experimental Centre & University of Zilina in Slovakia
Introduction
According to current and forecast growth
of air traffic in Europe it is expected that the air
traffic will double or triple within next 20 years in
terms of both aircraft and passengers. Many major
airports have already today the problem with airport
capacity and the runway and terminal development
is constrained by lack of the space. But there are
still many possibilities how to increase airport
capacity or airport performance. Some of them
initially seem to be less safe. Safety shall not be
reduced when accommodating with the traffic
growth. Today, the air transport infrastructure
capacity is directly constrained by safety objectives.
This requires paying great attention to safety issues
when handling more aircraft at the airport side.
Objective of the thesis
Tripling of the air traffic requires a
considerably different approach in the airport
concept. The purpose of my thesis is to propose
new concepts of the future airport which will be
able to meet the air traffic demand in the years
around 2020 and after.
Initial ideas
1. Breaking the constraints between the
terminal and the runways
Main idea is to place the landside terminal
in the city and to build new airside far from the city
while connecting them with High Speed Train.
There are many positives and as well some
negatives of this concept. Only a few are mentioned
here. For the cons of this concept it will be
necessary to find solutions which will mitigate the
negative impacts.
PROS
• one runway system shared among several cities
helps to reduce the number of airports
• from the passenger point of view the terminal
will be closer than today
• there might be more than one terminal in the
city which would decrease the traveling
distance to the terminal
• there might be a security check in the train
which will save time
• immediate boarding after arrival to airside will
support no-delay departures
• the total travel cost will be spread over air and
ground transport means
• fewer workers will be present on the airport
side which might have positive impact on the
security of the site and the flights.
• much less people would be affected by
pollution (gases, noise..), because the airside
would be far from densely populated areas.
• there will be much more space for runways,
taxiways and aprons, which can have positive
impact on safety
• passengers will be gathered longer period of
time before the take off and this will enable
better management and estimation of aircraft
departure - door to door concept
CONS
• high initial costs for high speed train and it
may be difficult to fund this expensive project
• airport's business may be affected by
replacement of the shops, restaurants,
entertainment, parking, etc. to the city landside
• airside part of employees will have to travel a
significantly longer distance
Current airport paradigm
------- High Speed Train ---------
Future airport paradigm
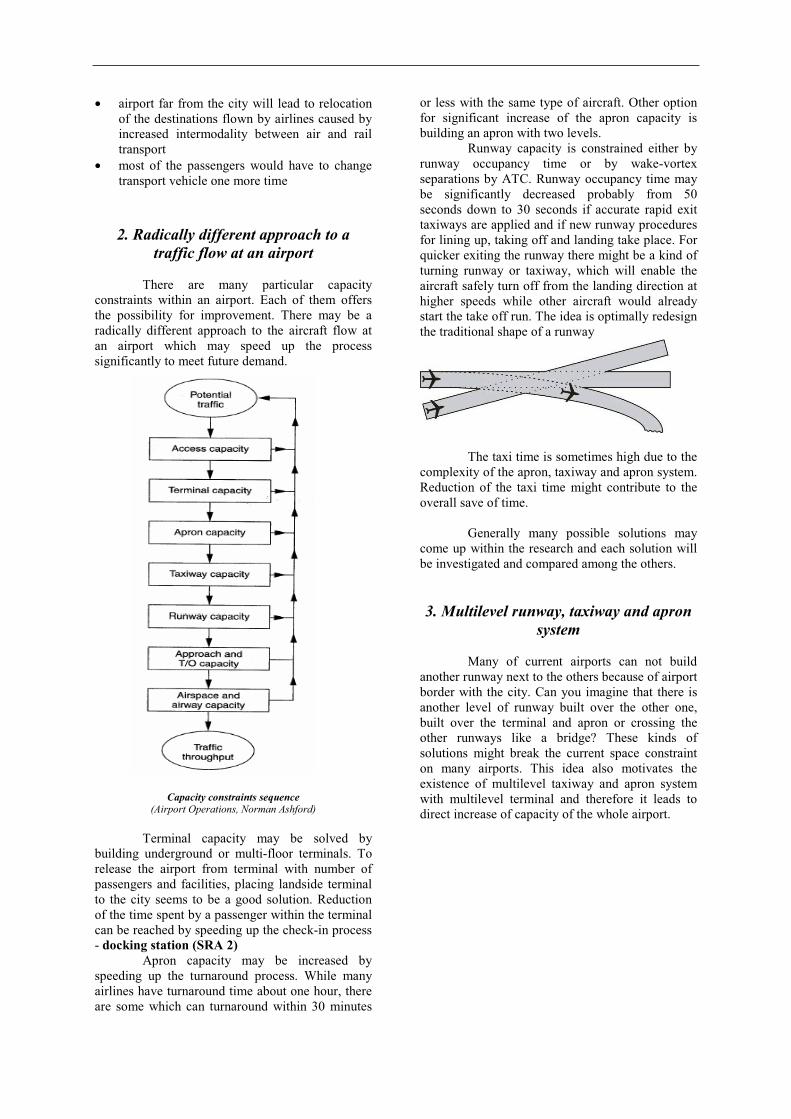
• airport far from the city will lead to relocation
of the destinations flown by airlines caused by
increased intermodality between air and rail
transport
• most of the passengers would have to change
transport vehicle one more time
2. Radically different approach to a
traffic flow at an airport
There are many particular capacity
constraints within an airport. Each of them offers
the possibility for improvement. There may be a
radically different approach to the aircraft flow at
an airport which may speed up the process
significantly to meet future demand.
Capacity constraints sequence (Airport Operations, Norman Ashford)
Terminal capacity may be solved by
building underground or multi-floor terminals. To
release the airport from terminal with number of
passengers and facilities, placing landside terminal
to the city seems to be a good solution. Reduction
of the time spent by a passenger within the terminal
can be reached by speeding up the check-in process
- docking station (SRA 2)
Apron capacity may be increased by
speeding up the turnaround process. While many
airlines have turnaround time about one hour, there
are some which can turnaround within 30 minutes
or less with the same type of aircraft. Other option
for significant increase of the apron capacity is
building an apron with two levels.
Runway capacity is constrained either by
runway occupancy time or by wake-vortex
separations by ATC. Runway occupancy time may
be significantly decreased probably from 50
seconds down to 30 seconds if accurate rapid exit
taxiways are applied and if new runway procedures
for lining up, taking off and landing take place. For
quicker exiting the runway there might be a kind of
turning runway or taxiway, which will enable the
aircraft safely turn off from the landing direction at
higher speeds while other aircraft would already
start the take off run. The idea is optimally redesign
the traditional shape of a runway
The taxi time is sometimes high due to the
complexity of the apron, taxiway and apron system.
Reduction of the taxi time might contribute to the
overall save of time.
Generally many possible solutions may
come up within the research and each solution will
be investigated and compared among the others.
3. Multilevel runway, taxiway and apron
system
Many of current airports can not build
another runway next to the others because of airport
border with the city. Can you imagine that there is
another level of runway built over the other one,
built over the terminal and apron or crossing the
other runways like a bridge? These kinds of
solutions might break the current space constraint
on many airports. This idea also motivates the
existence of multilevel taxiway and apron system
with multilevel terminal and therefore it leads to
direct increase of capacity of the whole airport.

LHR airport with two level runway and apron system
Two level configuration with parallel runway over a taxiway
There are many configurations available.
The upper runway doesn’t need to be right over the
other one. It may stand in parallel to other runway
enabling aircraft taxiing under it to the lower
runway, it can cross the lower runway in the middle
or it can stand completely apart from any runway
for example on the lower apron and lower terminal.
Conclusion
There are many other different future
airport concepts to be invented or which have
already been thought out. The purpose of my thesis
is to find out what has been done in this area,
collect, imagine and compare the possible new and
innovative concepts, to select optimal ones and to
conduct further research on.
References:
1. http://www.airliners.net
2. Airport Operations / Norman Ashford,
H.P.Martin Stanton, Clifton A.Moore. - 2nd ed.
3. ACARE "vision for 2020"
http://www.acare4europe.org/
4. Airport of the Future, Marc Brochard,
Eurocontrol Exp. Centre (Word document,
2004)

Analyze the impact of small aircraft on ATM in Europe
Daniel Rohacs PhD student
Eurocontrol Experimental Cenre &
Budapest University of Technology and Economics
Abstract
Air traffic of regional airports (which do
not offer a conventional radio-location
approach) and general aviation need a
new, cheap, and secure control system.
This kind of system demands totally
new, innovative ideas must integrated
into One Sky Europe philosophy. The
net centric system uses the satellite
(GPS) positioning, on board data
collection, remote sensing, automatic
data link, ground broadcasting, ground,
centralized situation awareness, real time
simulations for decision support,
advisory system and 3D visualization
transferring to aircraft back, integrated
meteorological and flight information
systems, etc. Such system philosophy
comes from ADS-B practice applied and
modified to general aviation needs.
1. Introduction
Why do we need a new system? The
answer seems to be simple. [1] Today’s
air traffic volume is projected to be
double by 2020 [2]. As the existing
system is already reaching his limits, for
tomorrow’s capacity it will not be able
to meet future needs in several areas:
airport, airplane, environmental
consideration, security, and safety, etc
[2].
The regional flight in new democratic
countries, in new members of EU must
develop rapidly with increasing the
economy [3]. However the regional
airports in those regions are not
equipped with modern radio-location
systems for controlling the air traffic.
On the other hand, today, there are
300 000 private and small aircraft pilots
in Europe. They fly more then 60 000
small aircraft. Annual market of general
aviation is 5,5 Milliard EURs only in
Europe. With accordance to our
investigation [4] this market will
increase even with greater ratio then
conventional air traffic.
2. Some market information
All that means, we will be obliged to use
a much more efficient system in the aim
to save the world from the large
economic costs of flight delays and
cancellations.
It is said, that today is the perfect time
for the industry to develop the air system
of the future, because just in a few years
ahead air traffic will be reaching record
levels, so till then we have a little
breathing time to prepare ourselves [1].
And that time isn't too far off. When
looking at a 30-year worldwide trend, by
the Gulf War and the Asian financial
crisis the growth of air traffic slowed
down only temporary, exactly like after
the September 11th
terrorist attacks (see
also figure 2.1.). So this drop in air
traffic expected to be short lived and
traffic growth is already seems to be
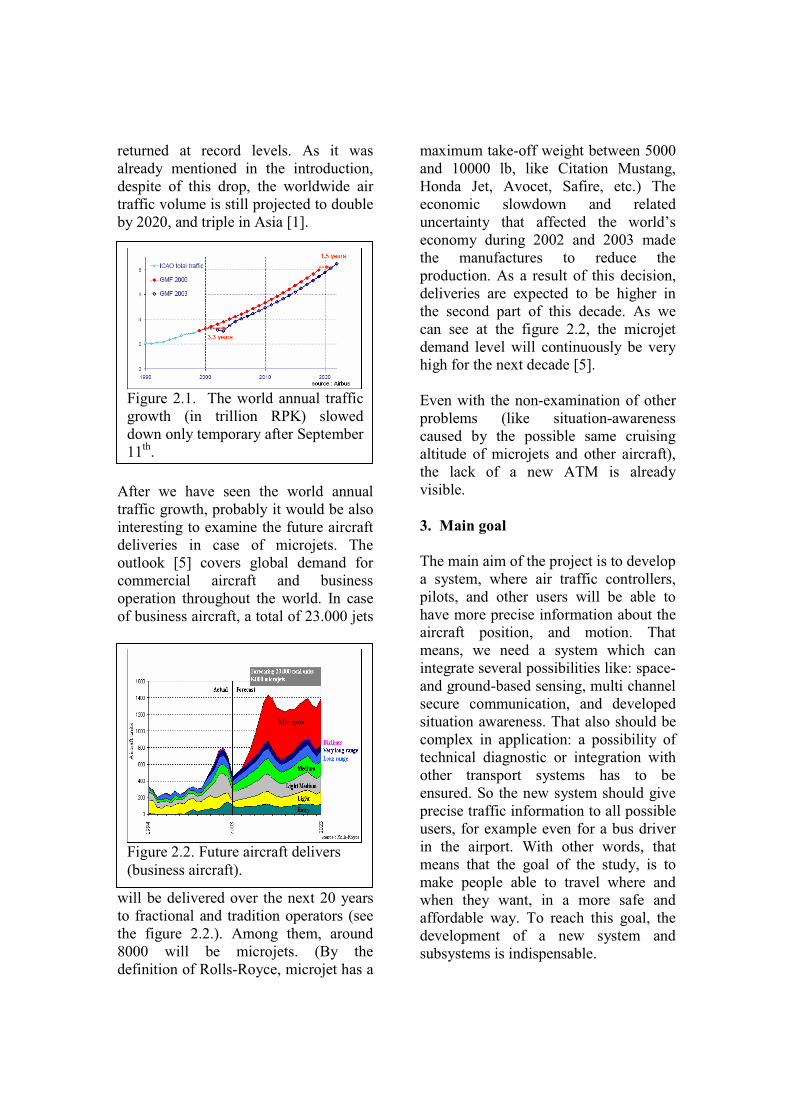
returned at record levels. As it was
already mentioned in the introduction,
despite of this drop, the worldwide air
traffic volume is still projected to double
by 2020, and triple in Asia [1].
After we have seen the world annual
traffic growth, probably it would be also
interesting to examine the future aircraft
deliveries in case of microjets. The
outlook [5] covers global demand for
commercial aircraft and business
operation throughout the world. In case
of business aircraft, a total of 23.000 jets
will be delivered over the next 20 years
to fractional and tradition operators (see
the figure 2.2.). Among them, around
8000 will be microjets. (By the
definition of Rolls-Royce, microjet has a
maximum take-off weight between 5000
and 10000 lb, like Citation Mustang,
Honda Jet, Avocet, Safire, etc.) The
economic slowdown and related
uncertainty that affected the world’s
economy during 2002 and 2003 made
the manufactures to reduce the
production. As a result of this decision,
deliveries are expected to be higher in
the second part of this decade. As we
can see at the figure 2.2, the microjet
demand level will continuously be very
high for the next decade [5].
Even with the non-examination of other
problems (like situation-awareness
caused by the possible same cruising
altitude of microjets and other aircraft),
the lack of a new ATM is already
visible.
3. Main goal
The main aim of the project is to develop
a system, where air traffic controllers,
pilots, and other users will be able to
have more precise information about the
aircraft position, and motion. That
means, we need a system which can
integrate several possibilities like: space-
and ground-based sensing, multi channel
secure communication, and developed
situation awareness. That also should be
complex in application: a possibility of
technical diagnostic or integration with
other transport systems has to be
ensured. So the new system should give
precise traffic information to all possible
users, for example even for a bus driver
in the airport. With other words, that
means that the goal of the study, is to
make people able to travel where and
when they want, in a more safe and
affordable way. To reach this goal, the
development of a new system and
subsystems is indispensable.
Figure 2.1. The world annual traffic
growth (in trillion RPK) slowed
down only temporary after September
11th
.
Figure 2.2. Future aircraft delivers
(business aircraft).
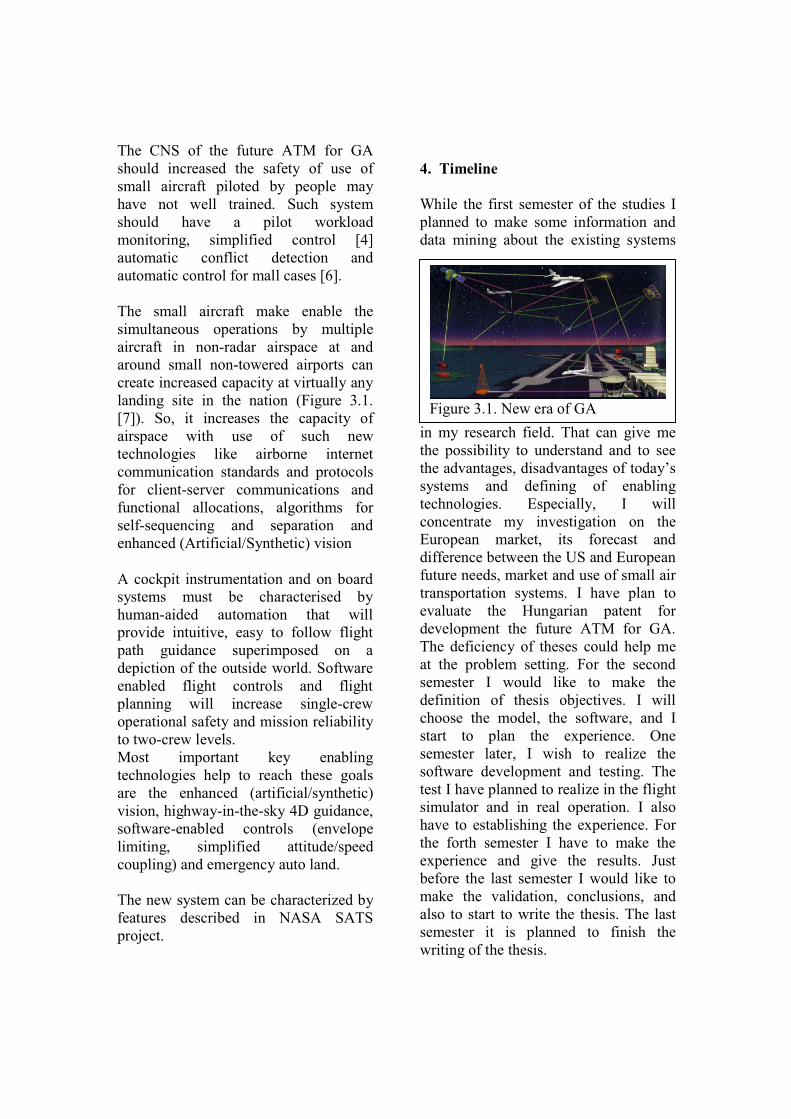
The CNS of the future ATM for GA
should increased the safety of use of
small aircraft piloted by people may
have not well trained. Such system
should have a pilot workload
monitoring, simplified control [4]
automatic conflict detection and
automatic control for mall cases [6].
The small aircraft make enable the
simultaneous operations by multiple
aircraft in non-radar airspace at and
around small non-towered airports can
create increased capacity at virtually any
landing site in the nation (Figure 3.1.
[7]). So, it increases the capacity of
airspace with use of such new
technologies like airborne internet
communication standards and protocols
for client-server communications and
functional allocations, algorithms for
self-sequencing and separation and
enhanced (Artificial/Synthetic) vision
A cockpit instrumentation and on board
systems must be characterised by
human-aided automation that will
provide intuitive, easy to follow flight
path guidance superimposed on a
depiction of the outside world. Software
enabled flight controls and flight
planning will increase single-crew
operational safety and mission reliability
to two-crew levels.
Most important key enabling
technologies help to reach these goals
are the enhanced (artificial/synthetic)
vision, highway-in-the-sky 4D guidance,
software-enabled controls (envelope
limiting, simplified attitude/speed
coupling) and emergency auto land.
The new system can be characterized by
features described in NASA SATS
project.
4. Timeline
While the first semester of the studies I
planned to make some information and
data mining about the existing systems
in my research field. That can give me
the possibility to understand and to see
the advantages, disadvantages of today’s
systems and defining of enabling
technologies. Especially, I will
concentrate my investigation on the
European market, its forecast and
difference between the US and European
future needs, market and use of small air
transportation systems. I have plan to
evaluate the Hungarian patent for
development the future ATM for GA.
The deficiency of theses could help me
at the problem setting. For the second
semester I would like to make the
definition of thesis objectives. I will
choose the model, the software, and I
start to plan the experience. One
semester later, I wish to realize the
software development and testing. The
test I have planned to realize in the flight
simulator and in real operation. I also
have to establishing the experience. For
the forth semester I have to make the
experience and give the results. Just
before the last semester I would like to
make the validation, conclusions, and
also to start to write the thesis. The last
semester it is planned to finish the
writing of the thesis.
Figure 3.1. New era of GA
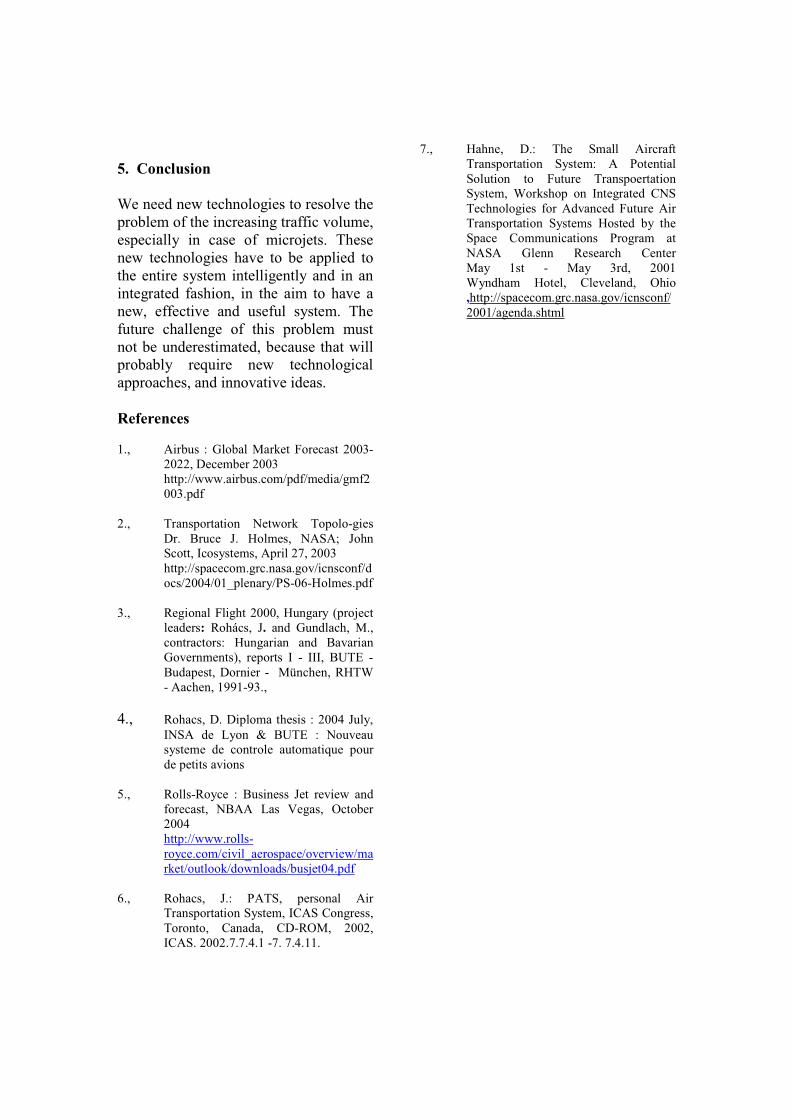
5. Conclusion
We need new technologies to resolve the
problem of the increasing traffic volume,
especially in case of microjets. These
new technologies have to be applied to
the entire system intelligently and in an
integrated fashion, in the aim to have a
new, effective and useful system. The
future challenge of this problem must
not be underestimated, because that will
probably require new technological
approaches, and innovative ideas.
References
1., Airbus : Global Market Forecast 2003-
2022, December 2003
http://www.airbus.com/pdf/media/gmf2
003.pdf
2., Transportation Network Topolo-gies
Dr. Bruce J. Holmes, NASA; John
Scott, Icosystems, April 27, 2003
http://spacecom.grc.nasa.gov/icnsconf/d
ocs/2004/01_plenary/PS-06-Holmes.pdf
3., Regional Flight 2000, Hungary (project
leaders: Rohács, J. and Gundlach, M.,
contractors: Hungarian and Bavarian
Governments), reports I - III, BUTE -
Budapest, Dornier - München, RHTW
- Aachen, 1991-93.,
4., Rohacs, D. Diploma thesis : 2004 July,
INSA de Lyon & BUTE : Nouveau
systeme de controle automatique pour
de petits avions
5., Rolls-Royce : Business Jet review and
forecast, NBAA Las Vegas, October
2004
http://www.rolls-
royce.com/civil_aerospace/overview/ma
rket/outlook/downloads/busjet04.pdf
6., Rohacs, J.: PATS, personal Air
Transportation System, ICAS Congress,
Toronto, Canada, CD-ROM, 2002,
ICAS. 2002.7.7.4.1 -7. 7.4.11.
7., Hahne, D.: The Small Aircraft
Transportation System: A Potential
Solution to Future Transpoertation
System, Workshop on Integrated CNS
Technologies for Advanced Future Air
Transportation Systems Hosted by the
Space Communications Program at
NASA Glenn Research Center
May 1st - May 3rd, 2001
Wyndham Hotel, Cleveland, Ohio
,http://spacecom.grc.nasa.gov/icnsconf/
2001/agenda.shtml


1
Project "Paradigm SHIFT"
Innovative Research Business AreaLaurent GUICHARD, Sandrine GUIBERT & Horst HERING - EEC
Jean NOBEL, Didier DOHY & Jean-Yves GRAU - STERIAKhaled BELAHCENE - CS
SHIFT proposes, through an analysis of the aeronautical system and ATM, innovativeconcepts for responding to safety, capacity and efficiency issues linked to the growth in airtraffic in Europe after 2015. The scope of SHIFT does not aim to deal with all aspects ofATM, but to focus its attention on the en-route part while maintaining a holistic approach, inparticular by strengthening the interfaces with the other components of the air transportsystem.
Now, there is an agreement for establishing the current air traffic management systempresents some limitations in order to cope with the challenges of future air transport system(ACARE, 2002 ; University Concept team, 2003 ; EUROCONTROL, 2004 ; Gate to Gateproject, 2004). The work achieved in the SHIFT project is in line with this vision, and was toidentify key-features of ATM for proposing ways of evolution. ATM key-featuresidentification rose in the analysis of Supersector project results and interviews withoperational air traffic controllers and ATM experts. The ATM key-features can besummarized in the following points:
- Air transport is a production system which exists only because it meets cost-efficiency criteria. In this context, air navigation is a link in a chain of production whichmeets financial, safety and efficiency targets. ATM costs refer both in taxes charged to theairlines, and consequences of ATM operations which penalise airline operations like delays.
- The nature of future European air traffic is very difficult to determine. Lastevolutions of air traffic show economical, social and geo-political factors can quickly modifythe demands and have great impacts on the air transport system. However, it seems reasonableto work on the following hypothesis: moderate growth of number of flights, complex latticenetwork, mains flows between north and south and between east and west, and high densitycentral area termed "core area".
- En-route Air traffic is a mix of climbing, descending and steady aircraft's. Each ofthese categories has different characteristics in terms of throughput, disruptions, bulk, shape,complexity, and services which require different solutions. The task and responsibility sharingamong ATM/ATC actors is funded on geographical division where all traffic categories arecombined. A better taking into account of the traffic characteristics in sector design and trafficorganisation is a fruitful way for having a more efficient task-sharing between ATM/ATCactors.
- ATM and ATC are continuously subjected to disruptions and the uncertaintymanagement is a key for the future. Disruptions can be classified into ad hoc (meteorology,runway capacity, aircraft failure, etc.), constant imprecision (inaccuracy of technology), andsystem-wide problems generated by interfaces between ATM/ATC components (ATFM vs.ATC, and ATC vs. aircraft crew). Future air navigation system needs to meet the solutionwith the levels of uncertainty and the required efficiency in relation to nature of eachdisruptive factor. The system should not be constrained if this brings no operational benefits,otherwise it will be too rigid and therefore incapable of managing the variability inherent inthe air navigation system.
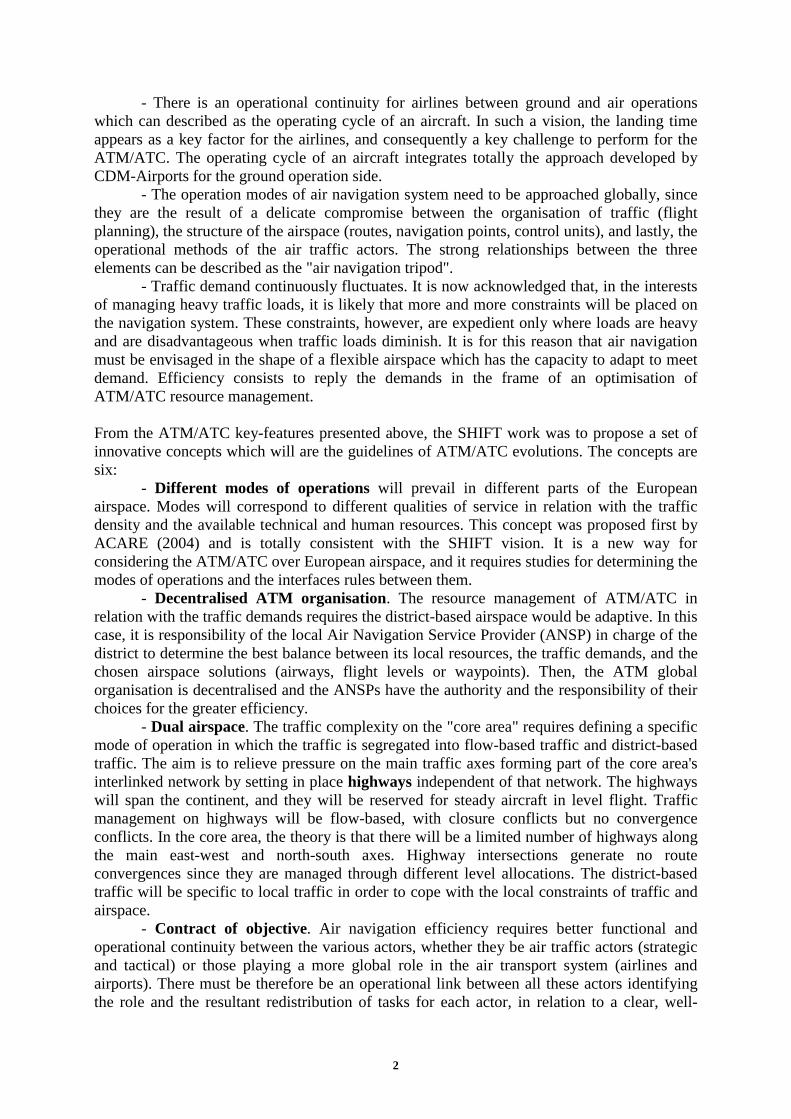
2
- There is an operational continuity for airlines between ground and air operationswhich can described as the operating cycle of an aircraft. In such a vision, the landing timeappears as a key factor for the airlines, and consequently a key challenge to perform for theATM/ATC. The operating cycle of an aircraft integrates totally the approach developed byCDM-Airports for the ground operation side.
- The operation modes of air navigation system need to be approached globally, sincethey are the result of a delicate compromise between the organisation of traffic (flightplanning), the structure of the airspace (routes, navigation points, control units), and lastly, theoperational methods of the air traffic actors. The strong relationships between the threeelements can be described as the "air navigation tripod".
- Traffic demand continuously fluctuates. It is now acknowledged that, in the interestsof managing heavy traffic loads, it is likely that more and more constraints will be placed onthe navigation system. These constraints, however, are expedient only where loads are heavyand are disadvantageous when traffic loads diminish. It is for this reason that air navigationmust be envisaged in the shape of a flexible airspace which has the capacity to adapt to meetdemand. Efficiency consists to reply the demands in the frame of an optimisation ofATM/ATC resource management.
From the ATM/ATC key-features presented above, the SHIFT work was to propose a set ofinnovative concepts which will are the guidelines of ATM/ATC evolutions. The concepts aresix:
- Different modes of operations will prevail in different parts of the Europeanairspace. Modes will correspond to different qualities of service in relation with the trafficdensity and the available technical and human resources. This concept was proposed first byACARE (2004) and is totally consistent with the SHIFT vision. It is a new way forconsidering the ATM/ATC over European airspace, and it requires studies for determining themodes of operations and the interfaces rules between them.
- Decentralised ATM organisation. The resource management of ATM/ATC inrelation with the traffic demands requires the district-based airspace would be adaptive. In thiscase, it is responsibility of the local Air Navigation Service Provider (ANSP) in charge of thedistrict to determine the best balance between its local resources, the traffic demands, and thechosen airspace solutions (airways, flight levels or waypoints). Then, the ATM globalorganisation is decentralised and the ANSPs have the authority and the responsibility of theirchoices for the greater efficiency.
- Dual airspace. The traffic complexity on the "core area" requires defining a specificmode of operation in which the traffic is segregated into flow-based traffic and district-basedtraffic. The aim is to relieve pressure on the main traffic axes forming part of the core area'sinterlinked network by setting in place highways independent of that network. The highwayswill span the continent, and they will be reserved for steady aircraft in level flight. Trafficmanagement on highways will be flow-based, with closure conflicts but no convergenceconflicts. In the core area, the theory is that there will be a limited number of highways alongthe main east-west and north-south axes. Highway intersections generate no routeconvergences since they are managed through different level allocations. The district-basedtraffic will be specific to local traffic in order to cope with the local constraints of traffic andairspace.
- Contract of objective. Air navigation efficiency requires better functional andoperational continuity between the various actors, whether they be air traffic actors (strategicand tactical) or those playing a more global role in the air transport system (airlines andairports). There must be therefore be an operational link between all these actors identifyingthe role and the resultant redistribution of tasks for each actor, in relation to a clear, well-
3
defined objective which is accepted by all concerned. This objective is general, of course, andwill be different for each actor in accordance with the actor's specific characteristics andworkload. The challenge, then, is to define a common operational minimum among the actorswhich is sufficient to strike the right balance between productivity and safety. For this reason,it is helpful to propose a global contract for the "air" segment of the aircraft's operating cycle.Firstly, this would facilitate functional and operational continuity with the ground segment,since it is compatible with the objectives of airports. Secondly, it would play a role inintegrating the flight segment into the rest of the system, by creating bonds of reciprocalresponsibility between the airlines, the aircrews and air traffic actors. The proposed name ofthis contract is the contract of objective. The contract of objective is associated with oneflight. The contract of objective is intended first of all as a guarantee of results offered to theairline by the air traffic system on the basis of known constraints at the time when the contractis drawn up. Consequently, it is the ATM/ATC responsibility to fulfil the contract once thisone was accepted by all actors. For controllers, the incorporation of the contract of objectiveinto their activities brings an additional task. It is clear that respecting the contract ofobjective is a key priority in their activities, but it is still secondary to safety. Safety is thecontroller's top priority. If the contract of objective cannot carry out during the flight, it isrenegotiated at strategic level in the operational plan process.
- Target windows. The target windows define milestones marking out trafficprogress. They are intermediate objectives assigned to ATM actors in order to ensureplanning is respected. Rather than precise 4D points, they are expressed in terms of intervalsof adapted width. Their size and localisation reflect constraints faced by downstreamcomponents, such as punctuality at destination, runway capacity, or congested en-route area.The room for adaptation left to operations ensure resilience to disruptions. Operationaldivergence from this planning frame is still possible, and triggers a specific decision processat strategic level called renegotiation.
- Operational plan. The process by which the contracts of service of all flights areelaborated is the operational plan. The operational plan design is a negotiation and refinementprocess between all actors involved in the air operations (airlines – airports – ATM/ATCproviders). Operational plan is a three-step process. It begins six month before the flights formanaging the scarce resources which are the runways capacities in relation with the airlinedemands. In a second step, ANSPs are involved for adjusting the first version of theoperational plan to the ATM/ATC resources and finding the best solutions in the districtairspace. The third step is a refinement and update process for managing the disruptions beingable to modify the second version of the operational plan. Operational plan is a continuousprocess which leads to the deliverance of contracts of service at each flight before itsdeparture from the airport block. The operational plan aims at increasing the decision makingprocess in the elaboration of contracts of service by a better transparency and data sharing.
The first stage of the SHIFT project is now finished and allowed to have an OperationalConcept Document. The following stage will demonstrate the relevance and the validity ofconcepts in the frame of safety, capacity and efficiency issues linked to the growth in airtraffic in Europe after 2015. For this, a research agenda was proposed for prioritising thestudies and the resource use.

1
COMPLEXITY OF SPEED RESOLUTIONS - CONFLICT DENSITY
Rudi Ehrmanntraut, EUROCONTROL Experimental Centre (EEC), Brétigny sur Orge, France
Abstract1
Knowledge about conflict densities as
complexity measures seems to be useful for the
understanding of complexity in Air Traffic
Management. The literature review finds that there
is little work done so far on this subject. This paper
defines some conflict and resolution related
complexity parameters and applies them to results
derived from model simulation using the
Reorganised ATC Mathematical Simulator (RAMS)
simulator. The performance of speed resolutions
concerning complexity is further interpreted based
on the new findings.
Introduction
Air Traffic Management is often modelled by a
multi layered planning process (Varela [1],
Goldmuntz et. al. [2], DFS [3], Haraldsdottir [4],
TORCH [5], de Jonge [6]). It is argued that the
existing concepts suffer from a major gap in the
planning process layers, between traffic
synchronisation with a look-ahead time of 45
minutes to 1 hour on one side and conflict
management with a look-ahead of typically 10
minutes on the other side. That missing conceptual
layer could be referred to as Traffic Organisation
(Ehrmanntraut [7]), and the Multi Sector Planner
(Meckiff [8]) and Super Sector (Gawinowski [9])
could be seen as examples for instantiations.
It is hypothesised that: 1. this functional layer
would provide major benefits on system safety and
capacity, and 2. the complexity of this function
exceeds human capabilities and is therefore suited
for automation.
Previous studies on traffic organisation have
investigated the potential of speed control
(Ehrmanntraut [10]) by conducting fast time
simulations with the Reorganised ATC
Mathematical Simulator (RAMS). It defined an
“executive planning controller” that was allowed to
1 Proceedings of the 3rd INO Workshop, Dec. 2004,
EUROCONTROL Experimental Centre
give speed orders to aircraft, with a look-ahead time
LPC=15 minutes and implementation interval of
R=800 seconds 2. The main result of this model is
that speed control in en-route air traffic control
could possibly resolve 50% to 70% of conflicts
depending on the separation minima and
uncertainties that are set, as summarised in Figure
1.
0%
10%
20%
30%
40%
50%
60%
70%
80%
90%
100 150 200 300 100
PC15-
TC10
150
PC15-
TC10
200
PC15-
TC10
0
2000
4000
6000
8000
10000
12000
14000
16000
% Resolved % PC resolved Nr Conflicts
Figure 1: Resolution rates and number of
conflicts.
This study further investigates the complexities
of the air situation when applying speed control
manoeuvres. It focuses on the analysis of conflict
densities, a complexity parameter that is hardly
covered by literature.
Complexity, Conflict Density and
Conflict Clusters Literature Review
The literature review uses two groups of
research areas: 1. the community working on ATC3
Complexity, and 2. the community working on
conflict resolution.
Mogford (1995) [11] does not mention the
term conflict density in the literature review on
complexity. From the high list of reviewed work,
only some basic parameters concerning conflicts are
extracted: the number of conflicts, overtaking
2 R=800 seconds is observed to be an optimisation, LPC was
set to allow conflicts to be resolved before entering into the controlled
sector.3 ATC – Air Traffic Control
2
conflicts, crossing conflicts and the time to go to
conflict. If the number of conflicts is related to
sector volumes, however, one can consider this a
conflict density metric. Furthermore, a reference is
given to clustering of aircraft in a small amount of
airspace, without further clarification.
The Wyndemere (1996) [12] study adds
complexity parameters specific to conflicts: the
convergence angle, closest point of approach,
aircraft neighbouring the conflict, and conflict near
sector boundary.
Sridhar et al. (1998) [13] does not use any
conflict related measure for the definition of
Dynamic Density.
Meckiff et al. (1998) [8] defines amongst other
complexity parameters the term conflict density as
the sum of the simultaneous presence of individual
aircraft in a particular airspace sub-volume. It is
used in the sector load window, a decision support
tool for the multi-sector planner. It visualises the
number of conflicts in a multi-sector over a time
line. This is equivalent to the definition of Conflict-
in-Sector Density in this paper.
Cloerec (1999) [14] concentrates on conflict
densities by describing potential problems that may
occur during conflict resolution, and classifies
environmental aircraft into surrounding,
constraining or interfering aircraft. The cluster is
defined as the transitive closure of conflicting
aircraft of time and distance. Conflict density is
further analysed in the sense of number of
conflicting environmental aircraft at a moment in
time for a specific target, similar to Ehrmanntraut
(2003) [15].
Kopadekar (2000, 2003) [16][17] does not add
any new parameters concerning conflicts in the
analysis of proposed parameters for Dynamic
Density.
Delahaye and Puechmorel (2000) [18] discuss
that a given traffic situation has a high complexity
when conflicts are close in time and space, i.e. high
density and frequent conflicts. They assume that
nearly uniform distribution of conflicts in time and
space indicate low complexity. Unfortunately, they
do not precise further formulations or studies.
Schäfer (2000) [19] mentions a conflict density
viewer as a decision support tool for the multi
sector planner, without going into detail.
From a different community of subjects, work
on conflict resolution has since a long time focussed
on conflicts, and there is some literature on conflict
clusters. However, the definitions of these conflict
clusters seem to be diverging. The following list is
not complete:
Niedringhaus (1989) [21] is possibly the first
literature speaking of clusters and “possible pair-
wise separation problems (possiblems)”, and gives
a first mathematical approach to the subject.
Granger (2002) [22] investigates clusters with
a reduced definition that discards the notion of time;
however, by studying the effect of uncertainties of
the prediction of trajectories, a time component is
indirectly considered.
From the long and difficult list of conflict-
cluster resolutions are selected Irvine (1997) [23]
and Visser (2003) [24]. They discuss a
mathematically formulated conflict cluster and its
resolutions. Interesting with the latter publication is
the use of complexity measures during resolution
coordination, i.e. the choice of the aircraft that are
moved. This presents a clear evolution from the
rather simple first-seen-first-served or purely
mathematical considerations like token distributions
towards choices that are based upon sets of
operational and situational criteria. This evolution
can also be found with Archambault (2004) [25]
who includes additional parameters for resolution
coordination like the numbers of aircraft in conflict
clusters, the severity of conflicts, and conflict
severity order. The term severity, however, is not
well defined. His work also adds a conflict
resolution parameter, which is the flag whether an
aircraft is already in a conflict resolution
manoeuvre.
It can be summarised that conflict density was
hardly treated in detail in literature up to now.
Therefore it seems to be useful to get more insight
in this phenomenon.
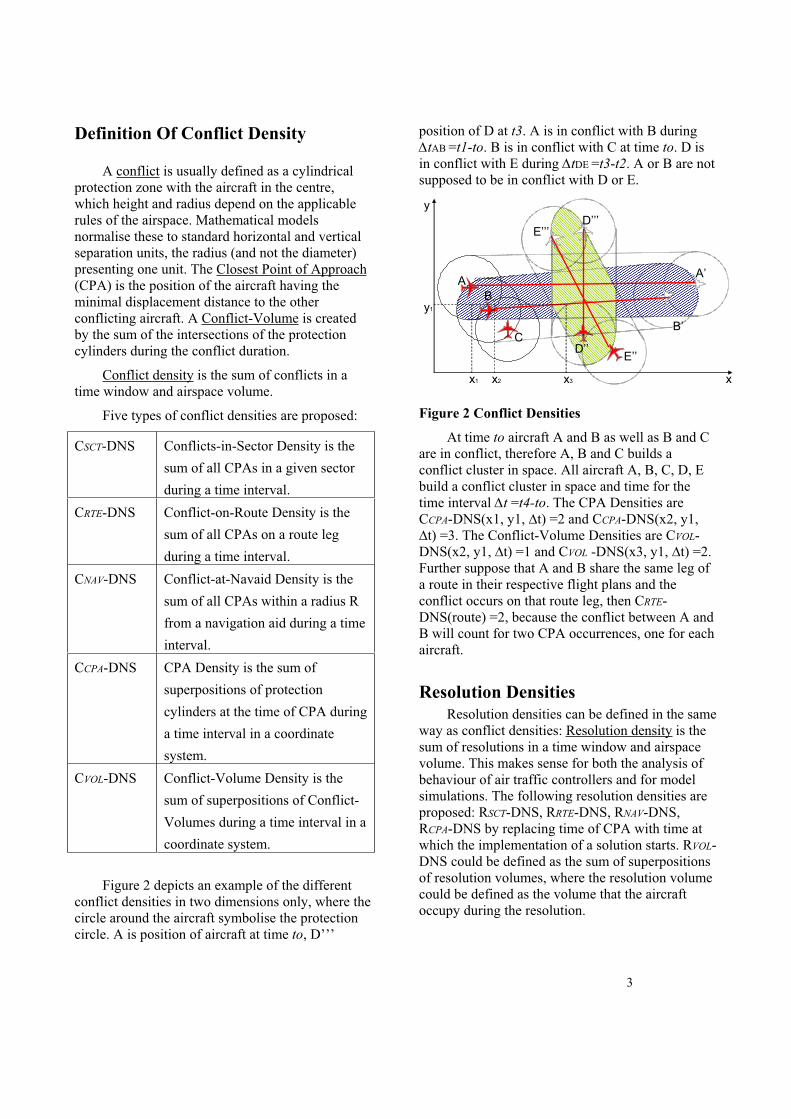
3
Definition Of Conflict Density
A conflict is usually defined as a cylindrical
protection zone with the aircraft in the centre,
which height and radius depend on the applicable
rules of the airspace. Mathematical models
normalise these to standard horizontal and vertical
separation units, the radius (and not the diameter)
presenting one unit. The Closest Point of Approach
(CPA) is the position of the aircraft having the
minimal displacement distance to the other
conflicting aircraft. A Conflict-Volume is created
by the sum of the intersections of the protection
cylinders during the conflict duration.
Conflict density is the sum of conflicts in a
time window and airspace volume.
Five types of conflict densities are proposed:
CSCT-DNS Conflicts-in-Sector Density is the
sum of all CPAs in a given sector
during a time interval.
CRTE-DNS Conflict-on-Route Density is the
sum of all CPAs on a route leg
during a time interval.
CNAV-DNS Conflict-at-Navaid Density is the
sum of all CPAs within a radius R
from a navigation aid during a time
interval.
CCPA-DNS CPA Density is the sum of
superpositions of protection
cylinders at the time of CPA during
a time interval in a coordinate
system.
CVOL-DNS Conflict-Volume Density is the
sum of superpositions of Conflict-
Volumes during a time interval in a
coordinate system.
Figure 2 depicts an example of the different
conflict densities in two dimensions only, where the
circle around the aircraft symbolise the protection
circle. A is position of aircraft at time to, D’’’
position of D at t3. A is in conflict with B during
tAB =t1-to. B is in conflict with C at time to. D is
in conflict with E during tDE =t3-t2. A or B are not
supposed to be in conflict with D or E.
x
A’
D’’
B
C
A
B’
E’’
E’’’D’’’
y
y1
x1 x2 x3
Figure 2 Conflict Densities
At time to aircraft A and B as well as B and C
are in conflict, therefore A, B and C builds a
conflict cluster in space. All aircraft A, B, C, D, E
build a conflict cluster in space and time for the
time interval t =t4-to. The CPA Densities are
CCPA-DNS(x1, y1, t) =2 and CCPA-DNS(x2, y1,
t) =3. The Conflict-Volume Densities are CVOL-
DNS(x2, y1, t) =1 and CVOL -DNS(x3, y1, t) =2.
Further suppose that A and B share the same leg of
a route in their respective flight plans and the
conflict occurs on that route leg, then CRTE-
DNS(route) =2, because the conflict between A and
B will count for two CPA occurrences, one for each
aircraft.
Resolution Densities
Resolution densities can be defined in the same
way as conflict densities: Resolution density is the
sum of resolutions in a time window and airspace
volume. This makes sense for both the analysis of
behaviour of air traffic controllers and for model
simulations. The following resolution densities are
proposed: RSCT-DNS, RRTE-DNS, RNAV-DNS,
RCPA-DNS by replacing time of CPA with time at
which the implementation of a solution starts. RVOL-
DNS could be defined as the sum of superpositions
of resolution volumes, where the resolution volume
could be defined as the volume that the aircraft
occupy during the resolution.
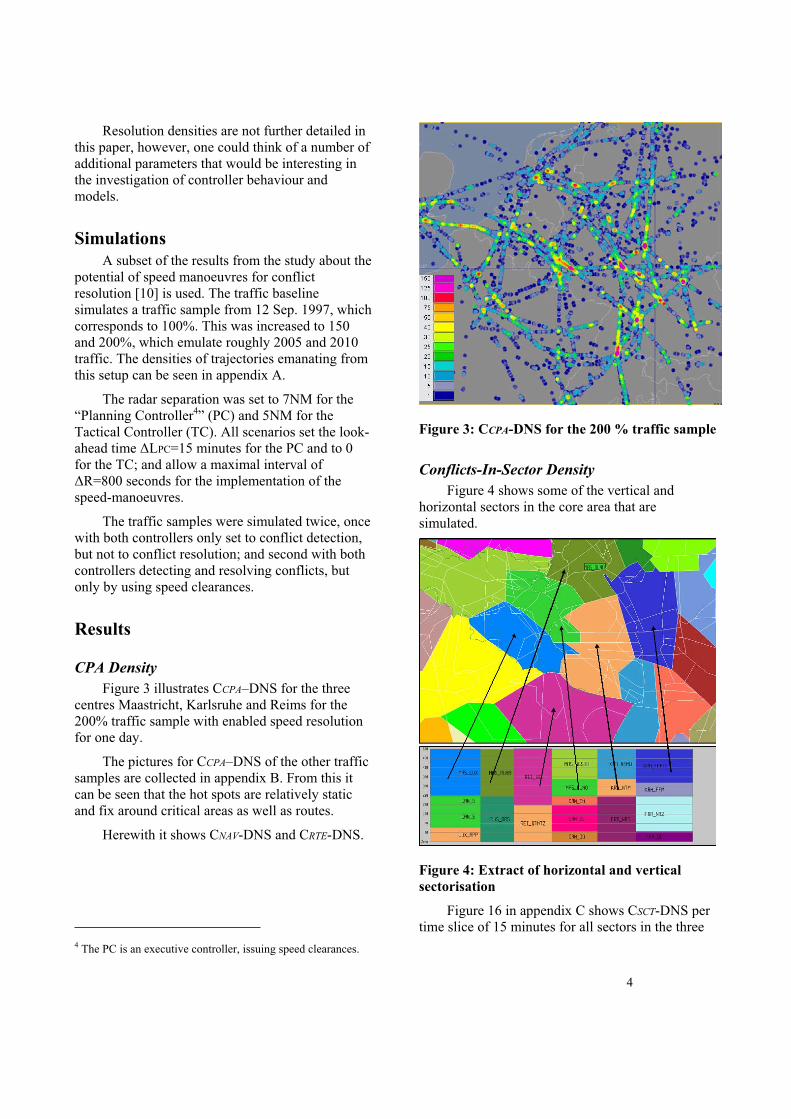
4
Resolution densities are not further detailed in
this paper, however, one could think of a number of
additional parameters that would be interesting in
the investigation of controller behaviour and
models.
Simulations
A subset of the results from the study about the
potential of speed manoeuvres for conflict
resolution [10] is used. The traffic baseline
simulates a traffic sample from 12 Sep. 1997, which
corresponds to 100%. This was increased to 150
and 200%, which emulate roughly 2005 and 2010
traffic. The densities of trajectories emanating from
this setup can be seen in appendix A.
The radar separation was set to 7NM for the
“Planning Controller4” (PC) and 5NM for the
Tactical Controller (TC). All scenarios set the look-
ahead time LPC=15 minutes for the PC and to 0
for the TC; and allow a maximal interval of
R=800 seconds for the implementation of the
speed-manoeuvres.
The traffic samples were simulated twice, once
with both controllers only set to conflict detection,
but not to conflict resolution; and second with both
controllers detecting and resolving conflicts, but
only by using speed clearances.
Results
CPA Density
Figure 3 illustrates CCPA–DNS for the three
centres Maastricht, Karlsruhe and Reims for the
200% traffic sample with enabled speed resolution
for one day.
The pictures for CCPA–DNS of the other traffic
samples are collected in appendix B. From this it
can be seen that the hot spots are relatively static
and fix around critical areas as well as routes.
Herewith it shows CNAV-DNS and CRTE-DNS.
4 The PC is an executive controller, issuing speed clearances.
Figure 3: CCPA-DNS for the 200 % traffic sample
Conflicts-In-Sector Density
Figure 4 shows some of the vertical and
horizontal sectors in the core area that are
simulated.
Figure 4: Extract of horizontal and vertical
sectorisation
Figure 16 in appendix C shows CSCT-DNS per
time slice of 15 minutes for all sectors in the three
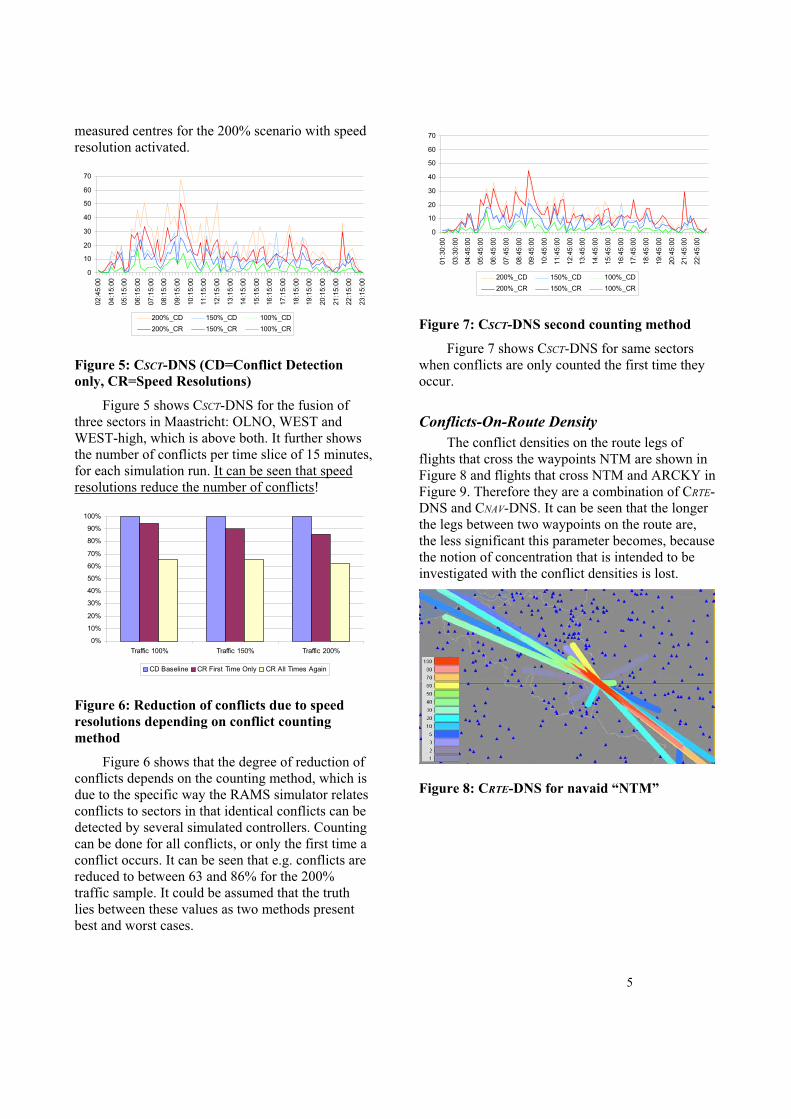
5
measured centres for the 200% scenario with speed
resolution activated.
0
10
20
30
40
50
60
70
02:4
5:0
0
04:1
5:0
0
05:1
5:0
0
06:1
5:0
0
07:1
5:0
0
08:1
5:0
0
09:1
5:0
0
10:1
5:0
0
11:1
5:0
0
12:1
5:0
0
13:1
5:0
0
14:1
5:0
0
15:1
5:0
0
16:1
5:0
0
17:1
5:0
0
18:1
5:0
0
19:1
5:0
0
20:1
5:0
0
21:1
5:0
0
22:1
5:0
0
23:1
5:0
0
200%_CD 150%_CD 100%_CD
200%_CR 150%_CR 100%_CR
Figure 5: CSCT-DNS (CD=Conflict Detection
only, CR=Speed Resolutions)
Figure 5 shows CSCT-DNS for the fusion of
three sectors in Maastricht: OLNO, WEST and
WEST-high, which is above both. It further shows
the number of conflicts per time slice of 15 minutes,
for each simulation run. It can be seen that speed
resolutions reduce the number of conflicts!
0%
10%
20%
30%
40%
50%
60%
70%
80%
90%
100%
Traffic 100% Traffic 150% Traffic 200%
CD Baseline CR First Time Only CR All Times Again
Figure 6: Reduction of conflicts due to speed
resolutions depending on conflict counting
method
Figure 6 shows that the degree of reduction of
conflicts depends on the counting method, which is
due to the specific way the RAMS simulator relates
conflicts to sectors in that identical conflicts can be
detected by several simulated controllers. Counting
can be done for all conflicts, or only the first time a
conflict occurs. It can be seen that e.g. conflicts are
reduced to between 63 and 86% for the 200%
traffic sample. It could be assumed that the truth
lies between these values as two methods present
best and worst cases.
0
10
20
30
40
50
60
70
01:3
0:0
0
03:3
0:0
0
04:4
5:0
0
05:4
5:0
0
06:4
5:0
0
07:4
5:0
0
08:4
5:0
0
09:4
5:0
0
10:4
5:0
0
11:4
5:0
0
12:4
5:0
0
13:4
5:0
0
14:4
5:0
0
15:4
5:0
0
16:4
5:0
0
17:4
5:0
0
18:4
5:0
0
19:4
5:0
0
20:4
5:0
0
21:4
5:0
0
22:4
5:0
0
200%_CD 150%_CD 100%_CD
200%_CR 150%_CR 100%_CR
Figure 7: CSCT-DNS second counting method
Figure 7 shows CSCT-DNS for same sectors
when conflicts are only counted the first time they
occur.
Conflicts-On-Route Density
The conflict densities on the route legs of
flights that cross the waypoints NTM are shown in
Figure 8 and flights that cross NTM and ARCKY in
Figure 9. Therefore they are a combination of CRTE-
DNS and CNAV-DNS. It can be seen that the longer
the legs between two waypoints on the route are,
the less significant this parameter becomes, because
the notion of concentration that is intended to be
investigated with the conflict densities is lost.
Figure 8: CRTE-DNS for navaid “NTM”
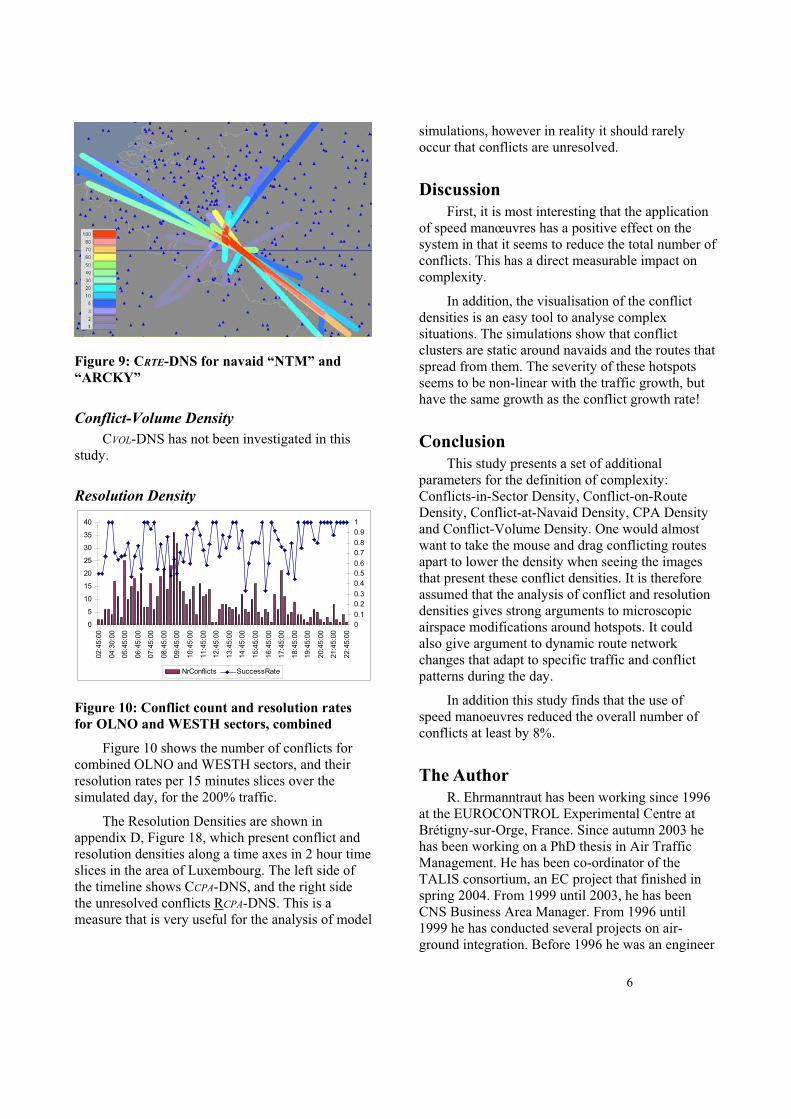
6
Figure 9: CRTE-DNS for navaid “NTM” and
“ARCKY”
Conflict-Volume Density
CVOL-DNS has not been investigated in this
study.
Resolution Density
0
5
10
15
20
25
30
35
40
02:4
5:0
0
04:3
0:0
0
05:4
5:0
0
06:4
5:0
0
07:4
5:0
0
08:4
5:0
0
09:4
5:0
0
10:4
5:0
0
11:4
5:0
0
12:4
5:0
0
13:4
5:0
0
14:4
5:0
0
15:4
5:0
0
16:4
5:0
0
17:4
5:0
0
18:4
5:0
0
19:4
5:0
0
20:4
5:0
0
21:4
5:0
0
22:4
5:0
0
0
0.1
0.2
0.3
0.4
0.5
0.6
0.7
0.8
0.9
1
NrConflicts SuccessRate
Figure 10: Conflict count and resolution rates
for OLNO and WESTH sectors, combined
Figure 10 shows the number of conflicts for
combined OLNO and WESTH sectors, and their
resolution rates per 15 minutes slices over the
simulated day, for the 200% traffic.
The Resolution Densities are shown in
appendix D, Figure 18, which present conflict and
resolution densities along a time axes in 2 hour time
slices in the area of Luxembourg. The left side of
the timeline shows CCPA-DNS, and the right side
the unresolved conflicts RCPA-DNS. This is a
measure that is very useful for the analysis of model
simulations, however in reality it should rarely
occur that conflicts are unresolved.
Discussion
First, it is most interesting that the application
of speed manœuvres has a positive effect on the
system in that it seems to reduce the total number of
conflicts. This has a direct measurable impact on
complexity.
In addition, the visualisation of the conflict
densities is an easy tool to analyse complex
situations. The simulations show that conflict
clusters are static around navaids and the routes that
spread from them. The severity of these hotspots
seems to be non-linear with the traffic growth, but
have the same growth as the conflict growth rate!
Conclusion
This study presents a set of additional
parameters for the definition of complexity:
Conflicts-in-Sector Density, Conflict-on-Route
Density, Conflict-at-Navaid Density, CPA Density
and Conflict-Volume Density. One would almost
want to take the mouse and drag conflicting routes
apart to lower the density when seeing the images
that present these conflict densities. It is therefore
assumed that the analysis of conflict and resolution
densities gives strong arguments to microscopic
airspace modifications around hotspots. It could
also give argument to dynamic route network
changes that adapt to specific traffic and conflict
patterns during the day.
In addition this study finds that the use of
speed manoeuvres reduced the overall number of
conflicts at least by 8%.
The Author
R. Ehrmanntraut has been working since 1996
at the EUROCONTROL Experimental Centre at
Brétigny-sur-Orge, France. Since autumn 2003 he
has been working on a PhD thesis in Air Traffic
Management. He has been co-ordinator of the
TALIS consortium, an EC project that finished in
spring 2004. From 1999 until 2003, he has been
CNS Business Area Manager. From 1996 until
1999 he has conducted several projects on air-
ground integration. Before 1996 he was an engineer
7
in information technologies for an industrial
company. He holds a diploma of
telecommunications engineer from RWTH Aachen,
Germany in 1991.
Acknowledgements
The pictures have been made with the ATC
Playback tool from Luciad company.
References
[1] J. Varela, 2004, EUROCONTROL
Operational Concept Document V2.1,
FCO.ET1.ST07.DEL01
[2] L. Goldmuntz, J. T. Kefaliotis, L. A. Kleinman, R. A. Rucker, L. Schuchman, D. Weathers, 1981, The AERA Concept, MITRE for FAA
[3] Anonym, Co-operative Air Traffic
Management Concept (CATMAC) -
Betriebskonzept für die Durchführung der
Flugsicherungsdienste im Bereich der
Bundesrepublik Deutschland, Bundesanstalt für Flugsicherung (DFS)
[4] A. Haraldsdottir, 1997, Air Traffic
Management Concept Baseline Definition,
NEXTOR Report # RR-97-3, Boeing
Commercial Airplane Group
[5] TORCH Consortium, 1999, D.2.2 Definition
of the Operational Concept,http://www.isdefe.es/torch/public/public.htm
[6] H. de Jonge, M. Sourimant, 2004, Gate to
Gate Integrated Operational Concept
(Consolidated Description) Issue 1.1, Gate to
Gate consortium
[7] R. Ehrmanntraut, 2003, Towards An
Operational Concept For Integrated Adaptive
And Predictive Air Traffic Management,
22nd Digital Avionics Systems Conference,
Indianapolis, Indiana, 12-16 October 2003
[8] C. Meckiff, R. Chone, J.-P. Nicolaon, 1998,
The Tactical Load Smoother For Multi-
Sector Planning, in proceedings of the 2nd
ATM R&D Seminar, Orlando, USA
[9] G. Gawinowski, V. Duong, J. Nobel, J.Y.
Grau, 2003, Bridging The Predictive And
Adaptive Issues In Air Traffic Management:
The Synchronous Paradigm, 22nd Digital
Avionics Systems Conference, Indianapolis,
Indiana, 12-16 October 2003
[10] R. Ehrmanntraut, 2004, The Potential Of
Speed Control, in proceedings of the 23rd
DASC, Salt Lake City, Utah, USA
[11] Mogford, R.H, Guttman, J.A., Morrow, S. L.,
& Kopardekar, P., 1995, The Complexity
Construct In Air Traffic Control: A Review
And Synthesis Of The Literature,
DOT/FAA/CT-TN-95/22, FAA Technical
Center: Atlantic City
[12] Wyndemere, Inc., 1996, An Evaluation of
Air Traffic Control Complexity, Final
Report. Contract Number NAS2-14284.
Boulder, CO: Wyndemere
[13] Sridhar, B., Seth, K.S., Grabbe, S., 1998,
Airspace Complexity And Its Application In
Air Traffic Management, 2nd USA/EUROPE
ATM R&D seminar, Orlando, December
1998.
[14] Cloerec, A., K. Zeghal, E. Hoffman, 1999,
Traffic Complexity Analysis To Evaluate
The Potential For Limited Delegation Of
Separation Assurance To The Cockpit, in
proceedings of the 18th DASC
[15] R. Ehrmanntraut, 2004, Analysis Of Aircraft
Conflict Geometries In Europe, in
proceedings of the 23rd DASC, Salt Lake
City, Utah, USA
[16] Kopardekar, P., 2000, Dynamic Density – A Review of Proposed Variables. FAA NAS Advanced Concepts Branch ACT-540: FAA
[17] Kopardekar, P., 2003, Measurement And Prediction Of Dynamic Density, http://www.tc.faa.gov/acb300/techreports/DD_ATM2003_7-03.pdf
[18] Delahaye, D., & Puechmorel, S., 2000, Air
Traffic Complexity: Towards Intrinsic
Metrics. Presented at the 3rd
FAA/EUROCONTROL ATM R&D
Seminar. Naples Italy, 13-16 June
[19] Schäfer, D. et al, 2001, Air Traffic
Complexity As A Key Concept For Multi-
Sector Planning, EUROCONTROL
8
Experimental Centre, in proceedings of the
21st DASC
[20] Histon et al, 2002, Structural Considerations
And Cognitive Complexity In Air Traffic
Control, MIT, in proceedings of the 22nd
DASC, Indianapolis, USA
[21] Niedringhaus, William P., 1989, Automated
Planning For AERA (Automated En-Route
Air Traffic Control) 3: Manoevre Option
Manager, PB89-233910, MRT 88W00048,
MITRE
[22] Granger, G., 2002, Détection et résolution de
conflits aériens : modélisations et analyse,
IPT, Toulouse, France
[23] R. Irvine, 1997, The Gears Conflict
Resolution Algorithm, EEC Report No. 321
[24] Hylkema, W, H.G. Visser, 2003, Aircraft
Conflict Resolution Taking Into Account
Controller Workload Using Mixed Integer
Linear Programming, Faculty of Aerospace
Engineering, Delft University of Technology,
The Netherlands
[25] N. Archambault, 2004, Scheduling Heuristics
For On-Board Sequential Air Conflict
Solving, in proceedings of the 23rd DASC,
Salt Lake City, Utah, USA

9
A. Appendix: Trajectory Density
The setup of the simulations filtered traffic that
passes the three measured centres Karlsruhe,
Maastricht and Reims. The traffic increase did not
take forecast into account, and simply adds a
percentage on the same routes. In addition, only
traffic above flight level 200 is selected. The
density is computed for the entire day. This leads to
the following trajectory densities.
Figure 11: Trajectory density for 100% traffic
Figure 12: Trajectory density for 150% traffic
Figure 13: Trajectory density for 200% traffic
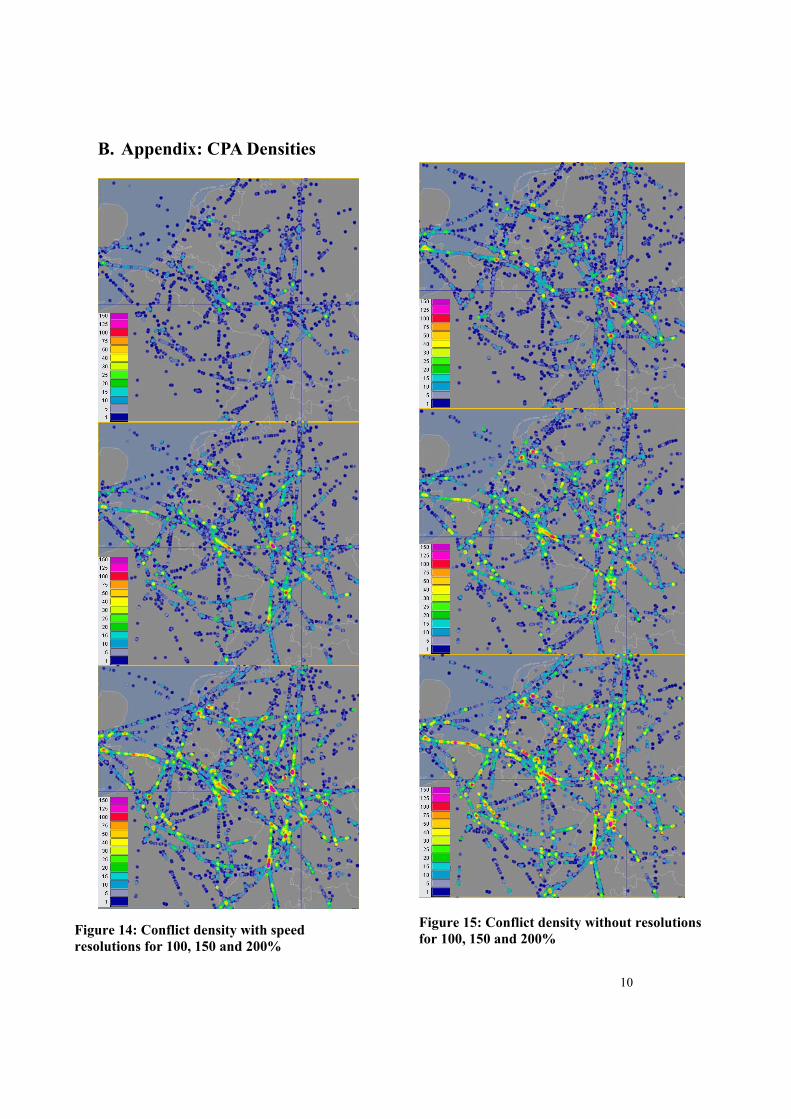
10
B. Appendix: CPA Densities
Figure 14: Conflict density with speed
resolutions for 100, 150 and 200%
Figure 15: Conflict density without resolutions
for 100, 150 and 200%
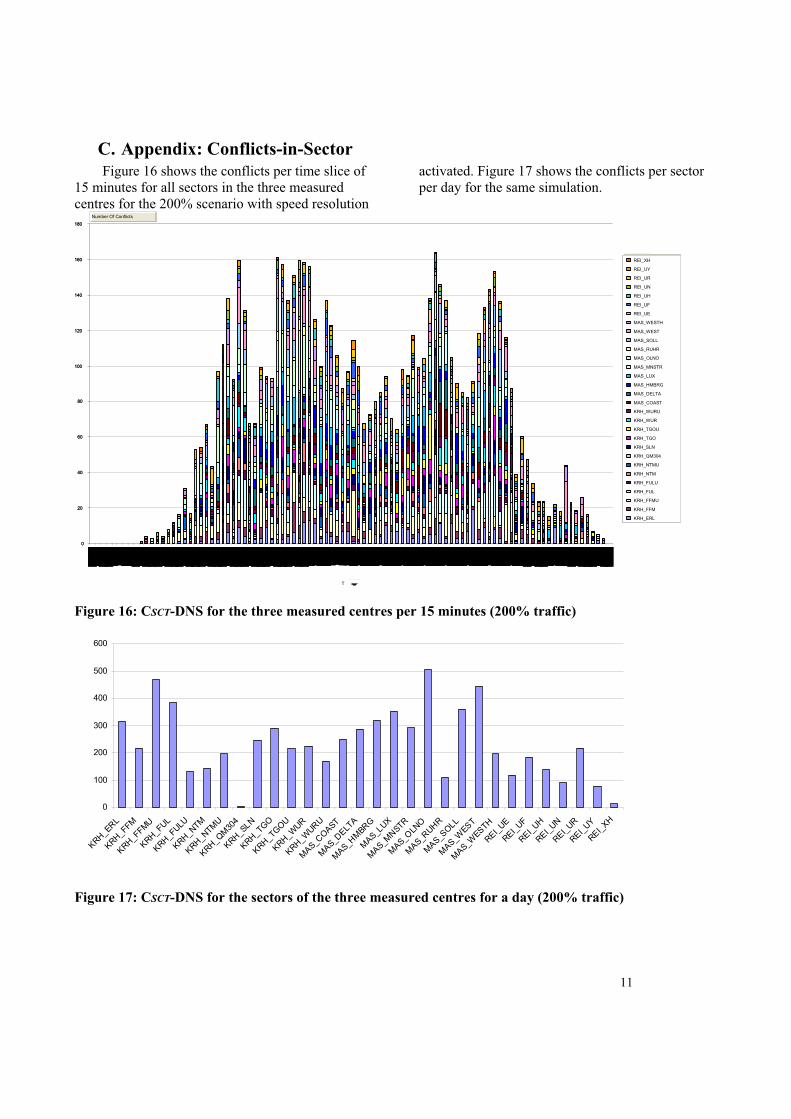
11
C. Appendix: Conflicts-in-Sector
Figure 16 shows the conflicts per time slice of
15 minutes for all sectors in the three measured
centres for the 200% scenario with speed resolution
activated. Figure 17 shows the conflicts per sector
per day for the same simulation.
0
20
40
60
80
100
120
140
160
180
0
20
40
60
80
100
120
140
160
180
REI_XH
REI_UY
REI_UR
REI_UN
REI_UH
REI_UF
REI_UE
MAS_WESTH
MAS_WEST
MAS_SOLL
MAS_RUHR
MAS_OLNO
MAS_MNSTR
MAS_LUX
MAS_HMBRG
MAS_DELTA
MAS_COAST
KRH_WURU
KRH_WUR
KRH_TGOU
KRH_TGO
KRH_SLN
KRH_QM304
KRH_NTMU
KRH_NTM
REI_XH
REI_UY
REI_UR
REI_UN
REI_UH
REI_UF
REI_UE
MAS_WESTH
MAS_WEST
MAS_SOLL
MAS_RUHR
MAS_OLNO
MAS_MNSTR
MAS_LUX
MAS_HMBRG
MAS_DELTA
MAS_COAST
KRH_WURU
KRH_WUR
KRH_TGOU
KRH_TGO
KRH_SLN
KRH_QM304
KRH_NTMU
KRH_NTM
KRH_FULU
KRH_FUL
KRH_FFMU
KRH_FFM
KRH_ERL
Number Of Conflicts
T
Figure 16: CSCT-DNS for the three measured centres per 15 minutes (200% traffic)
0
100
200
300
400
500
600
KRH_ER
L
KRH_FFM
KRH_FFM
U
KRH_FU
L
KRH_FU
LU
KRH_N
TM
KRH_N
TMU
KRH_Q
M30
4
KRH_SLN
KRH_TG
O
KRH_TG
OU
KRH_W
UR
KRH_W
URU
MAS_C
OAST
MAS_D
ELT
A
MAS_H
MBR
G
MAS_L
UX
MAS_M
NSTR
MAS_O
LNO
MAS_R
UHR
MAS_S
OLL
MAS_W
EST
MAS_W
ESTH
REI_
UE
REI_
UF
REI_
UH
REI_
UN
REI_
UR
REI_
UY
REI_
XH
Figure 17: CSCT-DNS for the sectors of the three measured centres for a day (200% traffic)

12
D. Appendix: Resolution Density
3h
4h
5h
6h
7h
8h
9h
10h
11h
12h
3h
4h
5h
6h
7h
8h
9h
10h
11h
12h
13h
14h
15h
16h
17h
18h
19h
20h
21h
22h
13h
14h
15h
16h
17h
18h
19h
20h
21h
22h
Figure 18: Conflict density CCPA-DNS and Un-Resolved Density RCPA-DNS close to Luxembourg,
Nattenheim, ARCKY (200% traffic)

Air Rail Intermodality from the Passenger Perspective
Antonia COKASOVA , PhD Student
EUROCONTROL Experimental Centre & Zilina University
1. Europe today and tomorrowIn order to better understand the futurepossibilities of air rail intermodalitythere is a need to examine passengerbehavior especially on short hauljourneys. Passengers are requesting fast,efficient and in many cases,environmentally friendly transportconnections. Considering the recentsituation in aviation, this requirement isvery hard to fulfill, especially because ofrising delays and congested airspace andairports. The European Union hasundergone significant changes with theaccession of ten new member states,bringing the population to approximately500 million. The accession of these tenstates to the EU will vastly enhance thepotential mobility of their citizens,offering both new employment andleisure possibilities. As a consequence,significant regional growth in airtransport demand can be expectedshifting the main traffic flow from north-south dominated to a more east-westoriented pattern (Source: InternationalRailway Journal, June 2003). Centraland Eastern European airports mightexperience capacity shortfall for the veryfirst time since most of the airports arenot ready for dramatic traffic increase.
Travel distances in Europe are such thatmore than 50 % of European flights areof less than 370 N.M., a statistic heavilyinfluenced by airlines’ use of a hub andspoke operation. European airlines areoperating fragmented networks. 10% of
the city-pairs in Europe represent 50% ofthe air traffic. (Source: NCD EEC 2004)
2. Passengers’ satisfaction
The central research theme of the thesis‘Inter-modality from passengerperspective’ investigates mutualsatisfaction of two sets of needs – how tomake air-rail inter-modality worktowards passenger satisfaction, sopassengers can assist in releasingconstrained airport and ATM capacityby using High Speed Train instead ofshort haul flights A shift in passengermovement from air to rail will ease thecongestion problems in the air transportindustry (which are expected tointensify).
It can release ATC and runwayresources, have a positive environmentalimpact, allow the growth of airlines andairports (in passenger numbers) andbring to the rail industry the standardand skills developed in the airlineindustry, as well as other benefits. Butmost of all it will allow more passengersto reach their destinations, withoutfacing difficult congestion constraints.
3. Understanding travel preferencerules
Individuals choose to travel by a modeof transport that offers a preferredbundle of levels of attributes which areimportant in making the choice betweenavailable alternative transport modes. Indetermining travel preference rules,
individuals implicitly attach weights to aset of attributes that influence theirchoice, and make a choice based on theavailable set. The challenge is to identifythese weights and in so doing obtainknowledge of what attributes drive anindividual’s choice. An attribute with avery low weight would be unimportant.
To complete the set of items needed toderive a demand function aquestionnaire was designed to identifythe homogeneity of passengers; mainpassenger groups and major travelattributes that most passengers findcrucial when deciding between air andrail transport.
4. Thalys & Eurostar, Lisbon &Roissy CDG
The aim of the questionnaire was toaddress passengers exposed to air/railcompetition, i.e. where a choice exists toundertake a journey by either high-speedtrain or airplane. Two questionnaireversions have been designed; onededicated to leisure the other to businesspassengers. The response rate wasaround 70% for Thalys and slightlyhigher for Eurostar. 19% of thequestionnaires were filled only partiallyand not valid for analyses. Aftereliminating incomplete and incorrectresponses we have collected 260 validquestionnaires from Thalys passengers(Paris-Amsterdam, Amsterdam-Paris)and 276 valid questionnaires fromEurostar passengers (Paris-London,London-Paris).
In case of air transport passengerquestionnaires the form of thequestionnaire had to be slightly changedwhile reducing the length and ensuringthat the time to fill out the questionnaireis significantly shorter. Airport is a very
dynamic environment, passengers tendto spend more time doing shopping andwalking than sitting still.
Questionnaire collection at airports wasrather challenging, however we havemanaged to collect 377 validquestionnaires from Paris Charles deGaulle and Lisbon International Airport.The response rate was 85% and only 7%of the questionnaires were not valid foranalyses.
To simulate a European transportnetwork and possible modal split we willneed to take into account passengerbehaviour, existing and forecasted high-speed train infrastructure and amongmany other things the situation in airtraffic in relation to congested airspaceand airports. Based on recent examplesin Europe we assume that there is a highpossibility in achieving significant en-route and airport capacity improvements,while satisfying passengers needs at thesame time. Thanks to intermodaltransport some congested hub airportswill be able to free as much as 10% oftheir runway capacity. In Spain, thereplacement of Madrid/Barcelona andValence/Barcelona services by HSTcould free up to 19% of the runway slotsat Barcelona.
5. ConclusionHowever the future evolution ofintegrated transport networks will mostlikely depend on the airlines’ willingnessto co-operate with railway operators.
Examples show that some airlines willprefer to maintain air services on certaincity-pairs (Madrid-Barcelona with 64flights a day) while competing head tohead with railway operators. In order tokeep up with competition and attract
more passengers airlines might need tooperate smaller aircraft with higherfrequency; resulting in more aircraftflying in the European sky each with lessseats on-board. Needless to say this kindof outcome will put more pressure on airtraffic services and create additionalproblems in the future.
In order to better understand the impactof intermodal transport on air trafficdifferent scenarios will have to beconsidered. The success of intermodalityand hopefully the possibility of easingcongestion will depend on passengers’willingness to experience new way oftravelling, operators’ willingness to co-operate and also the influence of low-cost airlines and their future evolution.

Technical Summary
Innovative Research Workshop 2004
Model Based Conflict Detection and Resolution
John Lygeros
Department of Electrical and Computer EngineeringUniversity of Patras, Rio, Patras, GR 26500, Greece
Tel. (30 2610) 996 458, Fax. (30 2610) 991 812Email: [email protected]
1 Introduction
In this presentation we will discuss progress in the area of model based trajectory prediction, conflictdetection and conflict resolution. The work builds on earlier results on modeling and simulation of ATMprocesses, reported at the Innovative Research Workshop 2003. The results covered in this presentationcan be roughly grouped into two categories:
• A Monte-Carlo based study of the effect of wind correlation on the probability of conflict.
• A randomized optimization based algorithm for conflict resolution.
The results were obtained in collaboration with researchers at the Department of Engineering, Universityof Cambridge, in particular Mr W. Glover and Dr A. Lecchini, under the supervision of Dr J. Maciejowski.
2 Background: Modeling and simulation
The main aim of the project is to develop tools to assist Air Traffic Controllers (ATC) with the taskof maintaining separation between aircraft. We will develop algorithms that analyze a given air trafficsituation, predict whether a safety critical encounter is likely to arise in the near future (e.g. over thenext 10-15 minutes), inform the air traffic controller of the potential problem and possibly suggest waysof resolving it. The work revolves around the idea of using dynamical models for all these tasks. A keyelement that needs to enter into these models is the uncertainty of the process. This uncertainty arisesfrom a number of sources, e.g. the wind and weather, the mass of the aircraft (which is typically unknownto ATC), etc.
The first step in this direction was the development of a physically motivated model to predict thefuture trajectories of aircraft. The model, which was presented in greater detail at the Innovative ResearchWorkshop 2003, has been implemented in an object oriented simulator coded in Java. It allows one tocapture many flights taking place at the same time. With each aircraft we associate a flight plan (basedon data from CFMU), aircraft dynamics (with parameter values obtained from the BADA database) anda flight management system (based on the BADA documentation).
The evolution of flights is also affected by the weather, in particular wind speed. Therefore, theevolutions of different flights are coupled to one another through a wind model. We model the wind asthe sum of two components: a deterministic component reflecting the nominal value of the wind availableto ATC through meteorological predictions and a stochastic component reflecting the difference betweenthe actual wind that the aircraft experiences from the nominal wind. The values of the deterministiccomponent of the wind are based on the Rapid Update Cycle (RUC) service developed by NASA. Thestochastic component exhibits a fairly complex spatio-temporal correlation structure. The qualitativeand quantitative properties of this structure were based on data found in the literature, dealing with thestatistics of deviations between actual wind and RUC predictions.
1
3 Wind correlation and conflict probability
The computation of correlated wind samples is rather costly. This is not a serious problem if the model isto be used off line for the validation of conflict detection and resolution algorithms. If the model is to beused on line, however, for conflict detection and resolution tasks (e.g. based on Monte-Carlo simulations)simplifications may be necessary.
Motivated by this, we set out to estimate the effect of ignoring wind correlation on the probability ofconflict predicted by the model. Even though there are several conjectures on the strength of this effect inthe literature, to the best of our knowledge there has been no systematic study to quantify it. In our studywe considered two aircraft in level flight. The probability of conflict was computed for encounters withminimum separation zero and various crossing angles and times to minimum separation. The computationwas done by Monte-Carlo simulation of the model with and without wind correlation. The results werecompared with the predictions of the standard Erzberger-Paielli conflict probe. In all cases the conflictprobe predictions were very close to the Monte-Carlo predictions when wind correlation was switchedoff. There was a substantial difference, however, whenever realistic correlation was included, especiallyfor shallow crossing angles (45 or 135 degrees). Moreover, our results suggest that instead of ignoringcorrelation, a much more accurate approximation can be obtained by assuming that the wind is constant(and correlated among aircraft) throughout the encounter.
These observations led us to propose an augmentation to the Erzberger-Paielli conflict probe to includeterms to capture correlation in the positions of different aircraft. The predictions of this modified probeclosely match the results of the Monte-Carlo simulations with realistic correlation.
4 Randomized conflict resolution
For the problem of conflict resolution we proposed a new approach based on concepts from randomizedoptimization. The aim in this case is to select a resolution maneuver that minimizes a certain cost criterionthat reflects safety and efficiency considerations. The optimization is carried out using random selections.Roughly speaking, a resolution maneuver is selected at random, according to a certain search distribution.The expected cost of the maneuver is then computed using Monte-Carlo simulation. The maneuver is“accepted” with some probability, that depends on how the computed cost compares with the cost ofmaneuvers selected earlier. Under certain mild assumptions on the search distribution it can be shownthat the distribution of the accepted maneuvers concentrates around the global optima of the cost function.
The main advantages of the propose approach are that:
• It is computationally efficient and amenable to sequential and/or parallel implementation.
• It can accommodate very complex trajectory prediction models.
• It can accommodate very complex cost criteria.
• Explicit performance guarantees can be provided.
The disadvantage is of course that it is still rather computationally intensive, most likely beyond thecapabilities of current computers for on-line implementation. A more subtle disadvantage is that, becausethe method is randomized, only probabilistic guarantees are possible: one cannot be sure that the resultingmaneuver is conflict free, even though the probability of it being conflict free can be made arbitrarily high.
The presentation will discuss the application of this method to two idealized examples, sequencing ofarrivals in the TMA and the extended TMA (ETMA).
2


1
STOCHASTIC UNCERTAINTIES IN AIR PATH PLANNING
Marc BUI and Devan SOHIER,
LRIA-LDCI, EPHE, 41 rue G. Lussac, 75005 Paris, FRANCE
[email protected], [email protected]
IntroductionCurrent computer solutions to Air Traffic
Control (ATC) are based on avoiding the flight of a
plane through a zone where a storm is feared to
occur. This strategy, though very safe, entails a
great amount of unused airspace, while the western
European airspace is becoming overloaded.
Likewise, the deviation of an aircraft from its
forecasted trajectory is treated by a deterministic
safety distance, surrounding the aircraft and in
which no other plane is allowed to enter, this safety
distance being computed by taking into account the
maximal deviation of the aircraft, and not the
distance at which two aircrafts influence one
another.
Those two policies do not take into account
the dynamicity of the problem: probabilities about
the storm are known, even if one does not know its
evolution for sure, and the deviation of an aircraft
is strongly dependent on the past deviations. Thus,
one can improve the use of the airspace by using all
the available information, and introducing
probabilities in the management of aircrafts
trajectories. Probabilities, of course, must not
lessen the safety level: one must be sure that no
aircraft enters a storm and that no two aircrafts
enter in conflict.
We propose to reduce the amount of airspace
spoiled by using more information about the
behavior of the system. We will use tools from the
operational research field and from the probability.
A switch from the current situation to a gate-to-gate management strategy is currently being
developed in Eurocontrol member states, leading to
the concept of European single sky: to manage each
flight as a whole, from its very early planning to its
accomplishing, the European sky should be
considered as a continuum, and ATM should not be
constrained by boundaries. Since many little states
are present in Europe, this should greatly ease
ATM (cf. [Euro03]).
The first section of this paper will introduce
the modeling we use. The second one will discuss
the deviation of an aircraft, while the last one will
present the tracks we are investigating to solve the
problem.
Modeling of the airspace and air
trajectoriesSafety requirements forbid two planes to be
too close in the airspace. The minimal distance
between two planes to ensure their safety is called
safety distance. Currently, the safety distance
between two planes is 5 to 20 nautical miles (NM)
horizontally and 1.000 to 2.000 feet vertically
(according to the sizes of the considered planes).
Those distances are fixed and do not depend on the
meteorological conditions. Most figures in this
paper are taken out [RNAV98].
Safety distances are, for the time being, fixed
and do not depend on the meteorological conditions
the aircrafts are facing. Now, the weather has an
important influence on the behavior of the
airplanes, particularly on the distances at which
they disturb one another.
Reducing the safety distances when weather is
good can greatly improve the use of the airspace. If
necessary, when weather is bad, safety distances
could be increased.
Thus, we think that a major adaptation of the
current solutions would be to take this into account
by introducing dynamicity of the safety distances.
One should determine the safety distances required
by the weather in a zone and apply them rather than
upper bounds. This way, in areas with high density
of planes, the airspace would be better used.
Many approaches are developed to ensure
safety distances. Most of them are based on
detecting couples of planes that break or are on the
edge to break the safety requirements and solving
the problem. Our approach is different since we try
to compute safe trajectories for a set of planes. We
do not have to solve breaks in the safety but to
avoid them.
However, those solutions introduce ways to
detect conflicts efficiently and to compute paths to
solve them. This can be reused in our point of view,
to detect conflicts in the forecasted trajectories and
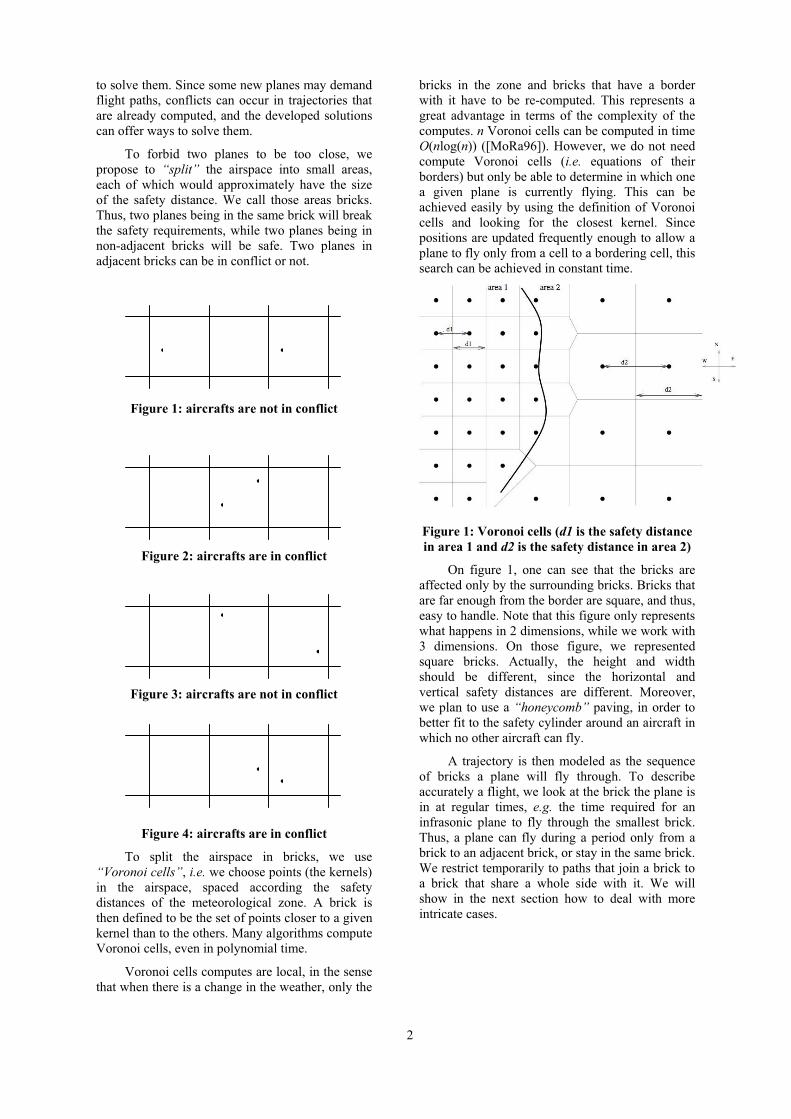
2
to solve them. Since some new planes may demand
flight paths, conflicts can occur in trajectories that
are already computed, and the developed solutions
can offer ways to solve them.
To forbid two planes to be too close, we
propose to “split” the airspace into small areas,
each of which would approximately have the size
of the safety distance. We call those areas bricks.
Thus, two planes being in the same brick will break
the safety requirements, while two planes being in
non-adjacent bricks will be safe. Two planes in
adjacent bricks can be in conflict or not.
Figure 1: aircrafts are not in conflict
Figure 2: aircrafts are in conflict
Figure 3: aircrafts are not in conflict
Figure 4: aircrafts are in conflict
To split the airspace in bricks, we use
“Voronoi cells”, i.e. we choose points (the kernels)
in the airspace, spaced according the safety
distances of the meteorological zone. A brick is
then defined to be the set of points closer to a given
kernel than to the others. Many algorithms compute
Voronoi cells, even in polynomial time.
Voronoi cells computes are local, in the sense
that when there is a change in the weather, only the
bricks in the zone and bricks that have a border
with it have to be re-computed. This represents a
great advantage in terms of the complexity of the
computes. n Voronoi cells can be computed in time
O(nlog(n)) ([MoRa96]). However, we do not need
compute Voronoi cells (i.e. equations of their
borders) but only be able to determine in which one
a given plane is currently flying. This can be
achieved easily by using the definition of Voronoi
cells and looking for the closest kernel. Since
positions are updated frequently enough to allow a
plane to fly only from a cell to a bordering cell, this
search can be achieved in constant time.
Figure 1: Voronoi cells (d1 is the safety distance
in area 1 and d2 is the safety distance in area 2)
On figure 1, one can see that the bricks are
affected only by the surrounding bricks. Bricks that
are far enough from the border are square, and thus,
easy to handle. Note that this figure only represents
what happens in 2 dimensions, while we work with
3 dimensions. On those figure, we represented
square bricks. Actually, the height and width
should be different, since the horizontal and
vertical safety distances are different. Moreover,
we plan to use a “honeycomb” paving, in order to
better fit to the safety cylinder around an aircraft in
which no other aircraft can fly.
A trajectory is then modeled as the sequence
of bricks a plane will fly through. To describe
accurately a flight, we look at the brick the plane is
in at regular times, e.g. the time required for an
infrasonic plane to fly through the smallest brick.
Thus, a plane can fly during a period only from a
brick to an adjacent brick, or stay in the same brick.
We restrict temporarily to paths that join a brick to
a brick that share a whole side with it. We will
show in the next section how to deal with more
intricate cases.
. .
..
.
.
. .
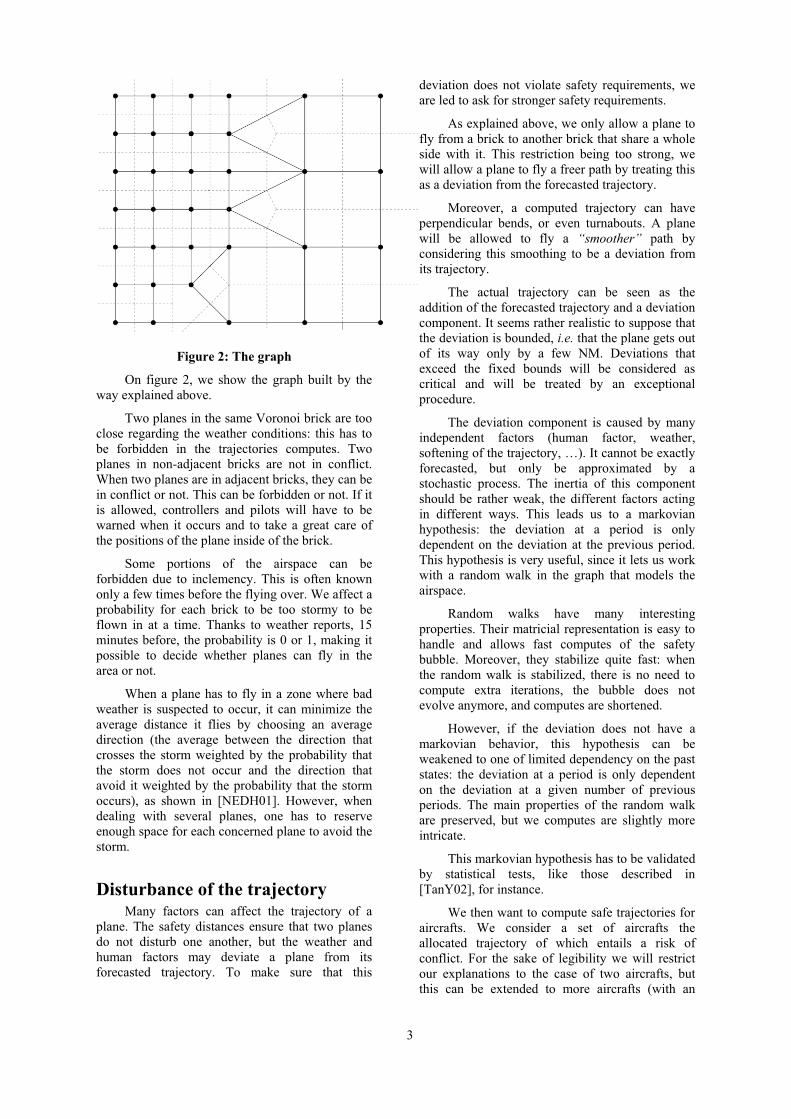
3
Figure 2: The graph
On figure 2, we show the graph built by the
way explained above.
Two planes in the same Voronoi brick are too
close regarding the weather conditions: this has to
be forbidden in the trajectories computes. Two
planes in non-adjacent bricks are not in conflict.
When two planes are in adjacent bricks, they can be
in conflict or not. This can be forbidden or not. If it
is allowed, controllers and pilots will have to be
warned when it occurs and to take a great care of
the positions of the plane inside of the brick.
Some portions of the airspace can be
forbidden due to inclemency. This is often known
only a few times before the flying over. We affect a
probability for each brick to be too stormy to be
flown in at a time. Thanks to weather reports, 15
minutes before, the probability is 0 or 1, making it
possible to decide whether planes can fly in the
area or not.
When a plane has to fly in a zone where bad
weather is suspected to occur, it can minimize the
average distance it flies by choosing an average
direction (the average between the direction that
crosses the storm weighted by the probability that
the storm does not occur and the direction that
avoid it weighted by the probability that the storm
occurs), as shown in [NEDH01]. However, when
dealing with several planes, one has to reserve
enough space for each concerned plane to avoid the
storm.
Disturbance of the trajectoryMany factors can affect the trajectory of a
plane. The safety distances ensure that two planes
do not disturb one another, but the weather and
human factors may deviate a plane from its
forecasted trajectory. To make sure that this
deviation does not violate safety requirements, we
are led to ask for stronger safety requirements.
As explained above, we only allow a plane to
fly from a brick to another brick that share a whole
side with it. This restriction being too strong, we
will allow a plane to fly a freer path by treating this
as a deviation from the forecasted trajectory.
Moreover, a computed trajectory can have
perpendicular bends, or even turnabouts. A plane
will be allowed to fly a “smoother” path by
considering this smoothing to be a deviation from
its trajectory.
The actual trajectory can be seen as the
addition of the forecasted trajectory and a deviation
component. It seems rather realistic to suppose that
the deviation is bounded, i.e. that the plane gets out
of its way only by a few NM. Deviations that
exceed the fixed bounds will be considered as
critical and will be treated by an exceptional
procedure.
The deviation component is caused by many
independent factors (human factor, weather,
softening of the trajectory, …). It cannot be exactly
forecasted, but only be approximated by a
stochastic process. The inertia of this component
should be rather weak, the different factors acting
in different ways. This leads us to a markovian
hypothesis: the deviation at a period is only
dependent on the deviation at the previous period.
This hypothesis is very useful, since it lets us work
with a random walk in the graph that models the
airspace.
Random walks have many interesting
properties. Their matricial representation is easy to
handle and allows fast computes of the safety
bubble. Moreover, they stabilize quite fast: when
the random walk is stabilized, there is no need to
compute extra iterations, the bubble does not
evolve anymore, and computes are shortened.
However, if the deviation does not have a
markovian behavior, this hypothesis can be
weakened to one of limited dependency on the past
states: the deviation at a period is only dependent
on the deviation at a given number of previous
periods. The main properties of the random walk
are preserved, but we computes are slightly more
intricate.
This markovian hypothesis has to be validated
by statistical tests, like those described in
[TanY02], for instance.
We then want to compute safe trajectories for
aircrafts. We consider a set of aircrafts the
allocated trajectory of which entails a risk of
conflict. For the sake of legibility we will restrict
our explanations to the case of two aircrafts, but
this can be extended to more aircrafts (with an

4
important increase in the complexity of the
computes).
Using a Markov Decision Process (cf.
[Pute94]) makes it then possible to compute
efficiently optimal or close to optimal trajectories.
A Markov Decision Process is a stochastic dynamic
program. The problem is modeled as a decision
problem: at each step, one can choose the
movement each of the studied aircrafts has to
realize. These movements are to be chosen among
a set of allowed movements that are physically
possible and will not entail any conflict. We call a
movement an action, and a situation a state. Also,
at each step, the position is affected by the
deviation.
The problem is to find an optimal sequence of
actions, from the start situation to a final situation,
taking into account the possible deviations, but not
knowing them. The start situation is given by the
positions of the two aircrafts at the beginning of the
critical part of their path, and a final situation is a
situation in which the two planes have crossed and
cannot enter in conflict anymore.
Each action in a given situation is associated
with a reward. The problem is to reach a final state
and maximize or minimize the reward. In this
application, the reward will be the flown distance,
and we will try to minimize it.
A state will consist in the positions of the two
aircrafts, i.e. in the two bricks in which the aircrafts
are located. Let order the states by their proximity
to a final state. We call policy a sequence of
decision rules. A policy will be monotone if, in all
its realization, the state of the system can only
increase (or can only decrease). A policy will be
called optimal if it gives the best possible reward
(in our case, the lowest) for all sequence of random
deviation. Algorithms exist to compute optimal
policies.
[Pute94] shows that in some cases, there
exists an optimal policy that is monotone. This
gives an efficient algorithm for the search of an
optimal policy. We have to go a little further in our
modeling to show the existence of an optimal
monotone policy, but this appears at least very
likely.
Then, an efficient implementation of an
algorithm to find optimal trajectories would be
easy. This approach would lead to a better use of
the airspace, less conservative than the current
solutions, while ensuring at least the same safety
level, since only actions that cannot entail a conflict
are allowed.
ConclusionCurrent Air Traffic Control solutions have
increasing difficulties to handle the growing
number of aircrafts in the airspace.
Thus, there is a need for new solutions, less
conservative, i.e. accepting planes to be closer, but
at least as safe: aircrafts must not enter in conflict.
Using all the available information can help to
reduce the amount of unused airspace, while
maintaining the safety at the same high level or
even increasing it. The information we propose to
use is the stochastic information: currently, if
something is supposed to be dangerous (a stormy
zone, or an action that could lead to a conflict), it is
forbidden before we know for sure the hazard will
prove real. Using the probabilities that the
dangerous situation occurs, one can design more
efficient algorithms, while maintaining the
possibility at each step to avoid the danger if it
turns to be necessary.
Then, a great amount of airspace will be freed
and given back to the other aircrafts, making ATC
easier and safer.
The same tools are also used at a strategic
level, in collaboration with A. d’Aspremont
(Princeton) and L. El Gahoui (Berkeley). The very
first results prove very encouraging. This is now
implemented.
There is a need for decentralizing those
decisions thanks to negotiation processes between
the aircrafts, to reduce the centralized computing
power used, and ensure a better fairness.
Bibliography[RNAV98] Area navigation equipment operational
requirements and functional requirements. Technical report,
EUROCONTROL, 1998.
[Euro03] Eurocontrol ATM strategy for the years 2000+
volume 1. Technical report, EUROCONTROL, 2003.
[MoRa96] Rajeev Motwani and Prabhakar Raghavan.
Randomized algorithms. ACM Computing Surveys, 28, 1996.
[NEDH01] Arnab Nilim, Laurent El Ghaoui, Vu Duong,
and Mark Hansen. Trajectory-based air traffic management (tb-
atm) under weather uncertainty. In Proceedings of the 4th
USA/Europe Air Traffic Management R&D Seminar, 2001.
[TaYi02] Baris Tan and Kamil Yilmaz. Markov chain test
for time dependence and homogeneity: An analytical and
empirical evaluation. European Journal of Operational Research,
137(3):524–543, 2002.
[Pute94] Martin L. Puterman. Markov Decision
Processes, Discrete Stochastic Dynamic Programming. John
Wiley & sons, inc, 1994


EN-ROUTE SLOT ALLOCATION UNDER UNCERTAINTYFrédéric Ferchaud, PhD Student
EUROCONTROL Experimental Centre & Bordeaux University
AbstractThe stochastic nature of Air Traffic
Management arises mainly from uncertainoperational events. This uncertainty may jeopardizethe Central Flow Management Unit (CFMU)planning leading to safety problems and suboptimally used capacity.
An absorption area is defined as one or severalfree slots in the planning so that the management ofuncertainty is easier. Its aim is to compensate theaircraft uncertainty. The issue is to use the free slotsin order to absorb uncertainty, and so not modifythe initial planning. Finding the best configurationof the absorption areas corresponds to balancingoptimally their size with the available capacity inorder to absorb uncertainty and minimize “loadloss” (unused capacity).
Types of UncertaintyOne major issue with ATM is to deal with
uncertainty. Current ATM is a complex sociotechnical system organizes to cope with uncertainty:controllers and pilots frequently make importantdecisions based on uncertain or incompleteinformation, especially in non nominal andemergency situation.
The culture of eliminating uncertaintytherefore seems quite deeply ingrained in ATM, butmay not be sustainable or optimal. New conceptsand tools, such as those for planning and conflictsdetection, tend to increase the amount of data thatcan be presented and the degree of reliability placedon predicted information.
The research problem described in this paperconcerns the reduction of disturbance caused byuncertainty in slot allocation. The goal of slotallocation is to guarantee that the ATCos workloadwill not be overload. Actually, the disturbance inslot allocation problem corresponds to aircraft nottaking theirs slots and requesting new ones. AA isintended to absorb these requests without disturbing
the scheduler slots. The issue with AA is that fullcapacity would not be used in pre-tactical planning.An optional trade-off shall be found in order tomaximize capacity while minimizing disturbances.
Experimental ResultsA simulator was developed to take into
account only the upper airspace area and the “en-route” control for experimental purpose. Thissimulator randomly creates an upper airspace andair routes. The results obtained were encouraging.Indeed, we can reduce disturbance and also increasethe average throughput (number of aircraft in theupper area in the same time) [1].
These empirical results encouraged us toinvestigate into a theoretical model that couldformally confirm the experimental results.
Decomposition of the Slot AllocationProblem (SAP)
To resolve the SAP [2], we have begun byconsidering fewer constraints, and then we addthem successively in order to find the SAP solutionand deduce impacts created by AA.
In resume, the case of one sector isdemonstrated without considering the reallocationtime. Then results with AA and those without AAare compared.
Notations• Let AA be the case that absorption areas
are used.
• Let AA be the case that absorption areasare not used.
• Let R be the case that some lost slots arereallocated.
• Let R be the case that some lost slots arenot reallocated.
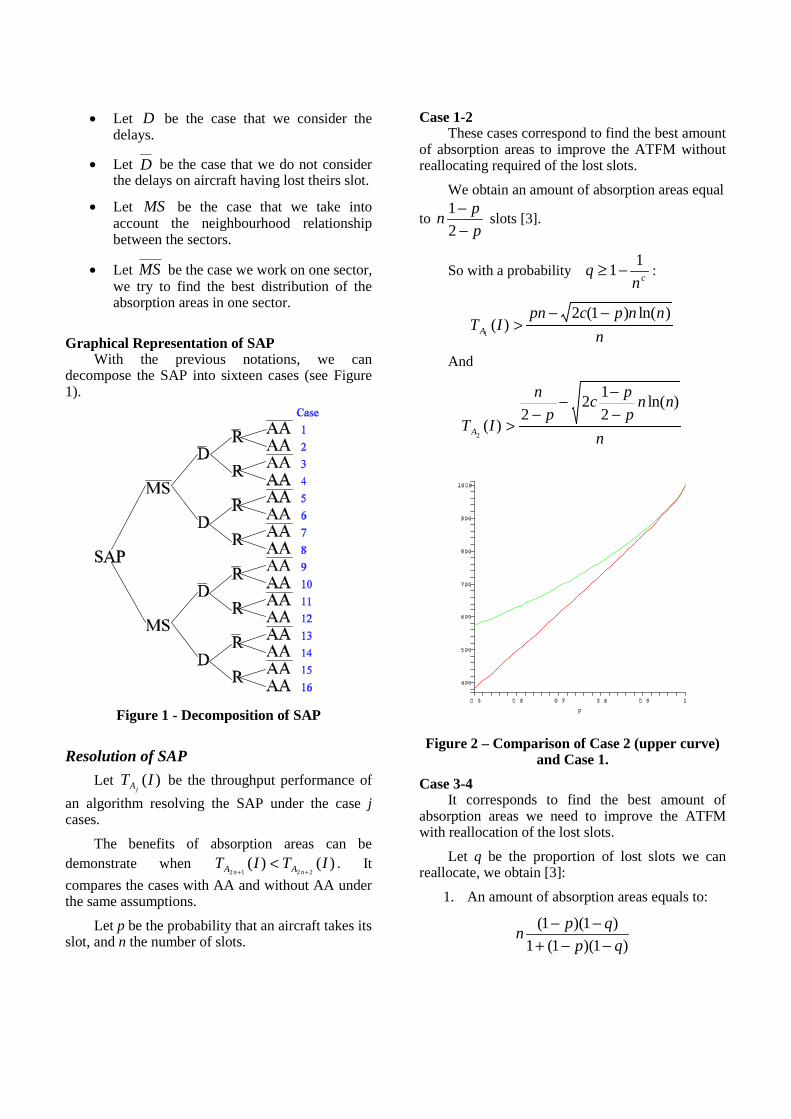
• Let D be the case that we consider thedelays.
• Let D be the case that we do not considerthe delays on aircraft having lost theirs slot.
• Let MS be the case that we take intoaccount the neighbourhood relationshipbetween the sectors.
• Let MS be the case we work on one sector,we try to find the best distribution of theabsorption areas in one sector.
Graphical Representation of SAP
With the previous notations, we candecompose the SAP into sixteen cases (see Figure1).
Figure 1 - Decomposition of SAP
Resolution of SAPLet )(IT
jA be the throughput performance ofan algorithm resolving the SAP under the case jcases.
The benefits of absorption areas can bedemonstrate when )()(
2212ITIT
nn AA ++< . It
compares the cases with AA and without AA underthe same assumptions.
Let p be the probability that an aircraft takes itsslot, and n the number of slots.
Case 1-2These cases correspond to find the best amount
of absorption areas to improve the ATFM withoutreallocating required of the lost slots.
We obtain an amount of absorption areas equal
to ppn
−−
21
slots [3].
So with a probability cnq 11−≥ :
nnnpcpn
ITA
)ln()1(2)(
1
−−>
And
n
nnppc
pn
ITA
)ln(212
2)(
2
−−−
−>
Figure 2 – Comparison of Case 2 (upper curve)and Case 1.
Case 3-4It corresponds to find the best amount of
absorption areas we need to improve the ATFMwith reallocation of the lost slots.
Let q be the proportion of lost slots we canreallocate, we obtain [3]:
1. An amount of absorption areas equals to:
)1)(1(1)1)(1(qp
qpn−−+
−−
2. An average )(3
ITA and )(4
ITA :
qppITA )1()(3
−+=
)1)(1(11)(
4 qpITA −−+
=
3. And we have:
0)1)(1(1
)²1)²(1()()(34
≥−−+
−−=−qp
qpITIT AA
showing the interest of AA.
Case 5 to 8 We want to guarantee that all aircraft will bereallocated in a reasonable time. We consider thedistribution of the unfilled slots.
The first results under this assumption showagain us the AA benefits. Nevertheless we simplifythe problem: we are under the assumption that thedelayed aircraft are independent and uniform [4].
Future WorkWe need to complete our results on the AA
distribution (take into account the dependentassumption…).
One other assumption shall be considered inthe next step (case 8 to 16): the neighbourhoodrelationship between the regulated sectors. If anaircraft looses its slots and requests a new one, wemust find a slot in all regulated sectors defined byflight plan.
To solve this problem, our approach uses theGraph Theory. Then the space-time dependenciescould be solved in SAP.
ConclusionThe first results obtained shown the benefits of
absorption areas to improve the ATFM. Each newassumption reduces these benefits, because in eachcase we increase the load loss (unused slots). Wewant to find an algorithm, according to theprobability of the uncertainty, which guarantees thatwe can improve the slot allocation. Ourexperimental results shown that such algorithm
must exist. Moreover, the declared capacities arelower than the real capacities, in order to have asafety margin. So the AA are already used with thissafety margin, but not considered by the CFMU.This safety margin is given according to the ATCosbut not according to the uncertainty. It correspondsto a continuous AA; each hour, we can add thesame number of aircraft. We want to distributethese unfilled slots more efficiently in the sectors inorder to minimize the load loss.
Another interest of absorption areas is that ifwe find an algorithm giving a good distribution ofunfilled slots, then its implementation will neitherchange sectors topologies, nor controller's work norflight plans submission procedure.
Conference 2005• RIVF 2005, Can Tho, Vietnam.
• 6th ATM R&D Seminar, USA.
• …
References [1]Ferchaud Frédéric, Gestion de flux du traficaérien: un modèle de graphe évolutif. MasterThesis, University of Bordeaux 1, June 2003.
[2]Duong, Ferchaud, Gavoille, Mosbah, usingabsorption Areas to Improve ATFM,23rd DASC,Salt Lake City, October 2004.
[3]Duong, Ferchaud, Gavoille, Mosbah. A NewSlot Allocation for ATFM. 7th InternationalConference on Intelligent Transport Systems,Washington D.C., October 2004.
[4]Duong, Ferchaud, Gavoille, Mosbah.Absorption Areas Distribution to ReduceDisturbances Cause by OperationalUncertainties, 1st ICRAT, Zilina, November2004.

ATFM PRE-TACTICAL PLANNING
Nabil Belouardy, PhD Student
EUROCONTROL Experimental Centre & ENST Paris
Air Traffic Flow Management is a service provided for the purpose of ensuring a safe and orderly traffic flow. Aircraft are subject to regulation delay when demand is expected to exceed the available capacity of the Air Traffic Control system.
The aim of this thesis is to establish a mathematical theory of ATFM, which allows setting the different parameters to its optimal values.
Slot allocation
In order to satisfy capacity constraints, each daily schedule of flight plans gives, when processed, a schedule of allocated slots. Computer Assisted Slot Allocation and then Innovative Slot Allocation algorithms have been carried out for the slot allocation task, but how the performance of an algorithm can be assessed?
• Open Loop: by measuring the total minutes of ATFM delay accumulated over all flights, or the average delay per flight.
• Stability: by measuring the total overflow still present in a sample of the actual air traffic, affected by uncertainty.
• Robustness: by measuring the total minutes of ATFM delay required to satisfy capacity constraints when uncertainty is supposed to be within some bounds, i.e. minimization of the worst case.
• Closed Loop: by minimizing the expectation rather than the worst case, when uncertainty is supposed to follow some probability law.
• Composite costs: as there is a trade-off between overflow and ATFM delay, it may be relevant to minimize the weighted cost " . Overflow + (1- ). ATFM delay", where is a parameter (for instance, =1 means the previous measures).
Sectors configuration
Airspace is divided into ATC units, for en-route airspace there are geographical units called Area
Control Centres, themselves constituted of elementary cells called sectors.
The team of controllers responsible of an ACCshares workload by handling groups (resulting from collapse of some adjacent sectors), each activated group shall be crossed by a reasonable number of aircraft per hour so that controllers maintain safety.
Several configurations are possible given any number of available controllers, but how to choose the best one? This problem has already been addressed in research, using tree search methods and genetic algorithms; here we are interested in the link with slot allocation
• ACC level: regulating the demand with respect to the ACC capacity may generate over-delivery in the controlled groups.
• Group level: regulating the demand with respect to the filed opening scheme capacity may generate more ATFM delay.
• Network: anyhow, controllers of the different ACC don’t decide together, propagation in the network generates more ATFM delay and suboptimal use of the airspace.
As far as the slot allocation algorithm is concerned, its performance does depend on:
• The considered level of airspace decomposition into units, the curse of dimensionality may force us to use sub-optimal approximations.
• The local nature of uncertainty, if the traffic density is heterogeneous inside the ACC, the regulation at ACC level is not able to protect the group with high density from congestion.
Workload
Controllers have monitoring, coordination workload and conflict workloads. Congestion is not well expressed by the number of crossing aircraft par hour:
• Complexity of its routes layout should be modelled as an indicator of conflict workload.
• The number of adjacent groups (or centres) is an indicator of coordination workload.
• Aircraft which leave the group immediately after getting into don’t generate the same monitoring workload as those who cross the group diagonally.
Previous "capacities" are to be understood in this context.
Systematic errors
Some flight plans contains route errors, nevertheless the ATC system may accept them. It’s the case if the flight plan of an aircraft, already in the air, has been received three hours before its estimated time of entering the European airspace.
While loading flight data with a genuine simulator (COSAAC), there is about 10% of non valid flight plans, and then are systematically ignored. This class of flight plans represents 10% of air traffic demand over Europe, but may be 40% of air traffic over the British Isles for example.
There is a need to check the data with meticulous care.
Uncertainty
Unlike systematic errors, uncertainty has no link with mistakes in flight data. The overall effect of air traffic operational events can be seen as a filter or a disturbance applied to the system.
Aircraft can
• have an arbitrary delay at take-off.
• miss its take-off slot and then ask for another one.
• be cancelled.
• be rerouted for some purposes.
Within the framework of this thesis, only the significant effects on air traffic are worth considering.
An aircraft can take-off from Bratislava two hours after its initial slot because it’s foggy in Paris and may land in Strasbourg if necessary, according to the available airborne instruments and the pilot know-how. Such event may be isolated and then
ignored, or in the contrary a new tendency and thus should be present somehow in the equations.
Admittedly the Common Simulator to AssessATFM Concept is a great tool for ATFM, but the best way to combine all the parameters together is still missing. Theory with no practice is blind and practice without theoretical background is absurd, Emmanuel Kant said.

Thesis overview 2004
PhD student: Claus Peter Gwiggner
November 3, 2004
Abstract
This thesis is about the problem that there are differences between the number ofaircraft planned to enter flight sectors and the number that really entered them. In thisreport we summarize the analysis of data from different flight sectors. As future work,we motivate a generative model of planning differences in their context of plannedtraffic.
1 General Background
Airspace is divided into geographical regions, called sectors. For safety reasons, nomore than a certain number of aircraft is allowed to enter certain sectors during onehour. Such numbers are called sector capacities. Airlines pose a demand to enter sectorsbefore their take-off by submitting a flight plan to a centralized traffic flow managementoffice. A flight plan is essentially a time stamped list of way-points. When demand ishigher than capacity either take-off is delayed or aircraft are rerouted. We speak ofinitial demand and regulated demand of a sector.
Although pilots have to follow their flight plans, there are differences between thenumber of aircraft planned to enter sectors and the number that really entered them(the real demand). By consequence, safety is not always guaranteed and availablecapacity is not always optimally used. We call these differences planning differences.They are consequences of uncertain events like weather conditions, delays, en-air rerout-ings or more. Such events are not taken into account by the current traffic planning.
At a first glance, planning differences occur from the deviation of a single aircraftfrom its flight plan. Analyzing this is difficult for different reasons:
• some aircraft may recover delays from the start, others may not
• there are dependencies between aircraft: a conflict resolution is made because ofthe presence of other aircraft, delays due to connecting flights are because otherflights arrive too late and so on
•
Moreover, for an air traffic controller, it is important how many aircraft arrive and notthat single aircraft follow precisely their routes. Thus we study the planning differences
1
of groups of aircraft and not of single aircraft. We hope to find regularities in datafrom such groups.
In the following sections we motivate our approach and summarize the results of adata analysis. In the annexes, we summarize the work done during this thesis and givea short profile of the student.
2 Approach
We analyze past flight data in order to better understand planning differences. Thistask is poorly formalized but oriented by the three axes:
• Relations in Time
• Relations in Space
• Relations in Scale
In the first one we analyze data from a single sector and from interactions of twoadjacent sectors. In the second, we compare data from two different sectors and inthe third we investigate the characteristics of planning differences w.r.t. the numberof aircraft considered.
What we mean with ’relation’ can be informally described by ’(...) variables thattend to (...) occur together in a way not expected on the basis of chance alone’, theentry for ’correlation’ in the Encyclopedia Britannica [1] but will be more formalizedin the paragraph below.
Data Description We focus on four sectors in the upper Berlin airspace whereplanning differences are reported to occur. The sectors are roughly equal in size. Theaverage traversal time of a sector is ten minutes.
We use regulated demand (number of aircraft planned to enter a sector) and realdemand data (number of aircraft that really entered a sector) for a total of 141 weekdaysin the period June 2003-April 2004 of the four sectors EDBBUR1-4.
Theories of Uncertainty We consider the data as a finite number of realizationsof random variables 1. As an example, we define REALS
t1;t2 = ’number of aircraftentering sector S between t1 and t2’ for the real demand. Similarly, we define REG
for regulated demand and DIFF = REG−REAL for the planning differences. Withthis abstraction, the data analysis can be formalized as a joint distribution estimationproblem. Statistical learning theory (e.g.[4]) serves to infer characteristics of the dis-tributions. Other theories of uncertainty are discussed in literature ([. . . still lookingfor good literature])], but in this report we will not make use of them.
1for a definition of terms from probability theory and statistics we refer to [2], [3] or any introductorybook
2
3 Results and Future Work
We have analyzed past flight data oriented by the three axes time, space and scale.Our main results are below. Please see [5],[6],[7] for detailed information.
Distributions of planning differences are bell shaped and zero centered invariantlyof time, space and number of aircraft considered. This certainly results from thehigh number of different reasons for one aircraft to deviate from its flight plan (e.g.delay, imprecise flight plan, weather conditions). However, these reasons are not allindependent from each other and planning differences are discrete variables. The shapeof the distributions of planning differences of one sector conditioned on its regulateddemand are right skewed. We currently generalize this observation to interactions withneighboring sectors before interpreting it.
Autocorrelation, cross-correlation and linear regression estimations showed thatthere are no non trivial linear dependencies in the temporal dimension alone. Werejected the hypothesis of a same underlying distribution of planning differences of twoadjacent sectors, found linear decision boundaries between them and also, that nonlinear boundaries do not substantially improve predictive accuracy.
This leads us to the idea to establish a generative model of planning differences andregulated demand. With such a model, one could optimize the regulated demand inorder to minimize expected planning differences.
References
[1] Encyclopedia Britannica. On-line Version: http://www.britannica.com.
[2] Probabilites, Analyse des Donnees et Statistique. G. Saporta. Editions Technip.Paris. 1990.
[3] Time Series Analysis. Forecasting and Control, 2nd Edition. G. Box, F.Jenkins.Holden-Day, San Francisco, CA. 1976.
[4] The Elements of Statistical Learning. T. Hastie, R. Tibshirani, J. Friedman.Springer-Verlag. 2001.
[5] Some Spatio Temporal Characteristics of the Planning Error in European ATFM.C. Gwiggner, P. Baptiste, V. Duong. Proceedings of the 7th International IEEEConference on Intelligent Transportation Systems. ITSC 2004.
[6] Finding Classes in Flight Data - Application of Logistic Regression and SupportVector Machines. C. Gwiggner, G. Lanckriet. International Conference on Re-search in Air Transportation. ICRAT 2004.
[7] Implicit Relations between Time Slots, Capacity and Real Demand in ATFM. C.Gwiggner. Proceedings of the 23rd Digital Avionics Systems Conference. DASC2004.
3

4 Annex A
The following articles have been written by the PhD student:
Conference Proceedings
The articles [5],[6],[7] were presentated on conferences with transportation/applicationprograms.
Technical Reports
• A Background to Better Understand Deviations in Flight Plans and Flight Routes.C. Gwiggner. Technical Report. Eurocontrol. 2003.
• Multiple Linear Regression on Adjacent ATC Sector Data. C. Gwiggner. Tech-nical Report. Eurocontrol. 2004.
5 Short Vita
Name: Claus Peter Gwiggneremail: [email protected]: http://www.lix.polytechnique.fr/Labo/Claus.Gwiggner/index.htmlEducation: Diploma in Computer Science (University of Munich, 1995-2001); Maitrised’Informatique (University of Paris 7, 1998-1999); Consultant (Temposoft S.A., 2001-2003); PhD candidate (Ecole Polytechnique Palaiseau, since 2003)Research Interests: computational complexity, data mining, random variables
4

Optimal flight level assignment: introducing uncertainty
S. Constans, N.E. El Faouzi, O Goldschmidt, R. Fondacci
LICIT (INRETS / ENTPE)
25, av F. Mitterrand
69675 Bron cedex - France
{sophie.constans, nour-eddin.elfaouzi, remy.fondacci}@inrets.fr
Commercial flights connecting two airports usually select their flight level so as to minimize fuel consumption. Because most commercial airliners have similar characteristics, traffic is practically split among very few flight levels, leading to high conflict risk between aircraft. Conflicts are managed by the air traffic controllers as emergency situations and summon up a large part of their attention. Controllers are responsible for a specific airspace sector in which they can treat only a limited number of conflicts simultaneously. If too many conflicts are feared in a controller’s sector, aircraft entrance in the sector can be delayed, which potentially leads to airspace saturation. Importance of the airspace saturation problem is going to grow fast; solutions are therefore to be found to ease traffic flow, lighten the controllers workload and limit delays.
The work presented here is carried out in the framework of a partnership involving a part of the LICIT laboratory and Eurocontrol. It addresses the problem of tactically assigning their flight levels to the aircraft before take-off so as to minimize the total conflict risk once they are airborne. In other words, this problem consists in a global flight plan optimization problem where the aircraft are to be distributed among time and airspace by modifying their requested flight levels only. Moreover, for each flight plan, the assigned flight level should be chosen close to the requested one so that fuel
over consumption and change in arrival time are limited.
Addressing this problem first requires the definition of several feasible levels for each flight. Each feasible pair (flight, flight level) is called an assignment in the following and corresponds to a binary variable in our problem. Assigning flight levels to the aircraft is equivalent to selecting exactly one of these variables for each flight, and hence set it to 1. Then, a definition of the global conflict indicator is also needed. Here, we have chosen to simply define it as the sum of all the local conflict indicators related to all the feasible pairs of assignments. Concretely, the value of this local conflict indicator is to be determined for each pair of feasible assignments. Once this problem is correctly formulated for a given traffic period, it can be solved by optimization techniques. In the case where the problem considered consists in more than a hundred flights, heuristic procedures have to be considered.
A first work has been carried out on this problem and some results can already be shown. First, a procedure has been developed to determine the conflict indicators of the feasible pairs of assignments. This procedure uses a simplified version of the trajectories followed by the aircraft. In particular, flight paths are considered to be straight lines from
origin to destination and the aircraft are supposed to respect their departure times, velocities and climbing and descending rates exactly, with an arbitrary safety margin. As regards the assignment process, several heuristic methods have also been defined and developed, based on a modeling of the problem by incompatibility graphs. These methods are thus designed to select one vertex per flight in this graph, in such a way that the resulting set of assignments induces a global indicator value as small as possible. They are inspired from algorithms designed for the independent set searching problem. The numerical tests carried out so far give encouraging results. In particular, we are able to treat a set of flights corresponding to a whole traffic day over Europe in less than one hour, getting a 50% enhancement of the global conflict indicator compared to the situation where the companies get their requested flight levels.
The efficiency of the proposed method in practice will depend largely on the uncertainty of the instant a given flight crosses a given geographical point. We have studied a method that allows taking into account real conflict probabilities instead of worst case conflict costs in our objective function. The conflict probability of two stable flights in the general case could be expressed as a function of deterministic parameters and of the density probability functions of the error on the instants when the two aircraft pass over the crossing point. This made it necessary to model the uncertainty of the time a flight passes a given point. Using CFMU correlated flight plans data, it was possible to express this uncertainty as the sum of a deterministic part and of a pure random part. The deterministic part, explaining 40% to almost 70% of the uncertainty variance could be expressed as a function mainly of departure airport, aircraft operator and aircraft type. Distance of crossing point to departure airport, or cruise flight level have no great importance. For the random part, we tried to fit several well-known probability density
functions. The gamma law seems to be appropriate. Statistical techniques used were linear models (regression, ANOVA, ANCOVA) and tree-based models. The precision of the data used being insufficient, it will be necessary to conduct this study again using better data, for instance radar data.
Now, this work opens wide perspectives. First, the trajectory model should be enhanced, and should take into account the fact that the flight paths are broken lines and not straight lines. Besides, the modifications imposed on the flight plans should not only affect the assigned flight level, but also the route and the departure time assigned to the flights, and research about the assignment heuristics has to be completed to enhance this part of the procedure. Finally, we consider the definition and the taking into account of uncertainties as a major centre of interest in our problem.

Column generation for dynamic ATFM
Rémy FONDACCI
LICIT (INRETS / ENTPE)
25, av F. Mitterrand
69675 Bron cedex - France
in collaboration with
Olivier RICHARD, Laboratoire d’Ingénierie Circulation Transports (LICIT) Wojciech BIENIA, Maurice QUEYRANNE
,Institut d'Informatique et de Mathématiques Appliquées de
Grenoble (IMAG)
This work is part of a research project carried out by the LICIT laboratory in partnership with Eurocontrol for designing a filter for short term Air Traffic Flow Management (ATFM). In section 1 we describe the general context of this project, the structure of our short term ATFM filter and the resulting optimization problem of constructing and allocating feasible 4-dimensional trajectories. In section 2, we outline the bases of the column generation technique and detail its application to this optimisation problem. The pricing sub-problem is studied in section 3. The concluding Section 4 lists future tasks needed to complete this project.
1. The short term ATFM filter and an Integer Programming model
The purpose of the CFMU (Central Flow Management Unit) is to provide an ATFM service to aircraft operators and to air traffic services. The main objectives are: smoothing of air traffic flows, protection against overload and minimisation of penalties due to congestion. The main actions used are ground delays. However the uncertainty on air traffic system makes these objectives hard to fulfil as pointed out in the Eurocontrol Performance Review Report 2003: ”Ground regulations are ineffective in controlling flows when demand is close to capacity, and yet cause significant delays and reduce aircraft/airport operators’ flexibility.”
The main principle of a short term ATFM filter is to take regulation actions just before the saturation occurs when the incertitude is greatly reduced; this means acting on airborne flights too. Here is the
structure of this filter: first, a regulation step is defined, and at each step an overload prediction on the whole European airspace is made. The regulation then aims to find a repartition of the traffic flows in order to avoid any overload. The possible regulation actions are: airborne and ground delay, vertical and horizontal rerouting, speed control. The resulting optimization problem is to determine for each concerned flight a feasible (within the performances of the aircraft, the navigation rules…) 4-D trajectory in order to avoid any sector overload while minimizing the cost of the regulation. This allocation problem can be formulated as an Integer Programming model: the constraints are to respect sector capacities and the objective function is to minimize the cost of the whole policy. There is one 0-1 decision variable for each feasible 4-D trajectory. Flight connections are directly embedded in the program to better evaluate delay costs. The sector capacities extend over several periods (hourly, quarterly…) in order to obtain a smooth solution. It is important to note that the determination of the feasible trajectories is part of the problem. The column generation technique which avoids an extensive enumeration of the 4-D trajectories is then particularly adapted to this problem.
2. Column generation applied to 4-D trajectories determination and allocation
Column generation is a technique to solve a huge linear program (called Master problem). When the variables of a linear program greatly outnumber the constraints, many variables will have a zero value in

an optimal solution. The main idea of the column generation technique is to solve a restricted problem (Restricted Master problem, RMP) with only a small subset of variables at first, and then to increase this subset by adding some promising variables not yet in the subset (variables with negative reduced cost). A sub-problem (pricing sub-problem) finds such variables from the dual multipliers using the cost structure. This is an iterative process that stops when the sub-problem doesn’t find new variables to add to the restricted problem.
Here the master problem is to find 4-D trajectories for each airborne flight in order to avoid any sector overload. The method consists of column generation embedded within a branch-and-bound framework in order to obtain integer solutions. Moreover an Air Traffic Simulator stores static and dynamic data on the air system. The first step of the process is the initialization of the subset of variables in the RMP by using pre-processed 3-D trajectories (usual routes from CFMU and other remarkable routes) and current trajectories of considered flights. The Air Traffic Simulator converts these 3-D trajectories into 4-D trajectories with real time data to initialize the RMP. The core process of column generation consists of solving the RMP to obtain a relaxed solution and duals multipliers. The pricing sub-problem then generates promising variables by solving dynamic shortest path problems with additional constraints in order to get feasible trajectories on the air network. Valuable trajectories found here can be stored in a 3-D trajectories database to initialize the process at a next regulation step. Variables with negative reduced cost are added to the restricted problem. This loop goes on until the sub-problem doesn’t find new variables to add to the subset. A branch-and-bound process coupled with rounding heuristics creates a branch-and-bound tree to get an integer solution. Some variables which were neglected may become attractive in a particular node of the tree: the column generation is started again in each node of the branch and bound tree. The process stops when an integer solution that meets all requirements is found or when all branches of the branch-and-bound tree have been explored. In this case the solution found is optimal.
3. Solving the pricing sub-problems
The goal of the sub-problem is to generate a set of variables, representing feasible 4-D trajectories, with negative reduced cost. If the sub-problem doesn’t find negative reduced cost variable, it must give a proof of the non-existence of such variables. This presents some specific difficulties: limited computing time, a different problem instance for each of hundreds or thousand flights being controlled, the need for a 3-D description of each trajectory, additional constraints defining feasible trajectory and the computational complexity (NP-hardness) of this dynamic shortest path problem.The framework of our solution is a branch-and-bound algorithm on the set of feasible trajectories. The principle is to build a search tree. Each node of the tree represents a subset of feasible trajectories included in the parent subset. The branching is made by choosing at each sector entry a route from a pre-processed set and a target flight level. The exploration of the tree is made with rules from labelling shortest path algorithms, in particular the A* algorithm. A lower bound on the reduced cost calculated here is also used to cut the search. This framework allows for an accurate description of the 4-D trajectories and for taking into account in the computation the characteristics of each flight.
4. Conclusion, further work
The final goal is to test the whole algorithm on real data and to obtain good solutions within short computing time. For this, parts of the process will have to be refined: the management of the initialization data base, the sub-problems solving, the rounding heuristics, the branching strategies and the definition of the cost function and of the capacity. Column generation allows an accurate, dynamic and reactive description of the air system and we hope it will lead to an efficient solving of the problem raised by a short term ATFM filter.

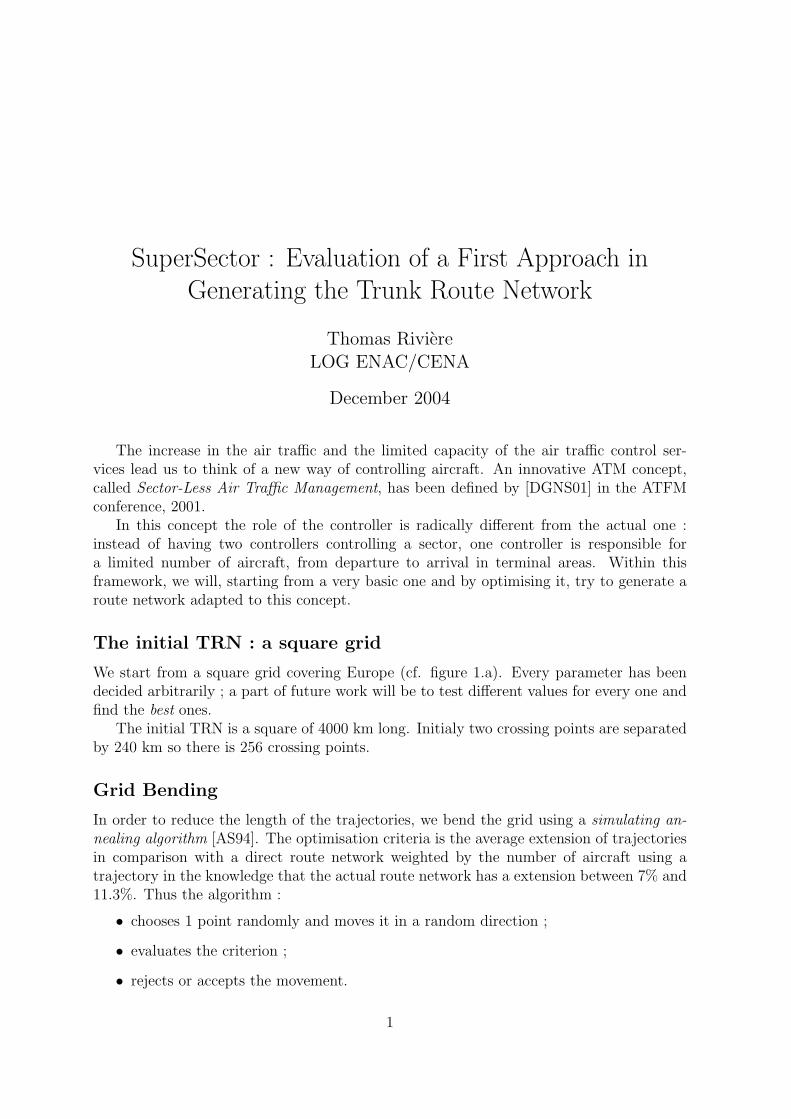
SuperSector : Evaluation of a First Approach inGenerating the Trunk Route Network
Thomas RiviereLOG ENAC/CENA
December 2004
The increase in the air traffic and the limited capacity of the air traffic control ser-vices lead us to think of a new way of controlling aircraft. An innovative ATM concept,called Sector-Less Air Traffic Management, has been defined by [DGNS01] in the ATFMconference, 2001.
In this concept the role of the controller is radically different from the actual one :instead of having two controllers controlling a sector, one controller is responsible fora limited number of aircraft, from departure to arrival in terminal areas. Within thisframework, we will, starting from a very basic one and by optimising it, try to generate aroute network adapted to this concept.
The initial TRN : a square grid
We start from a square grid covering Europe (cf. figure 1.a). Every parameter has beendecided arbitrarily ; a part of future work will be to test different values for every one andfind the best ones.
The initial TRN is a square of 4000 km long. Initialy two crossing points are separatedby 240 km so there is 256 crossing points.
Grid Bending
In order to reduce the length of the trajectories, we bend the grid using a simulating an-nealing algorithm [AS94]. The optimisation criteria is the average extension of trajectoriesin comparison with a direct route network weighted by the number of aircraft using atrajectory in the knowledge that the actual route network has a extension between 7% and11.3%. Thus the algorithm :
• chooses 1 point randomly and moves it in a random direction ;
• evaluates the criterion ;
• rejects or accepts the movement.
1
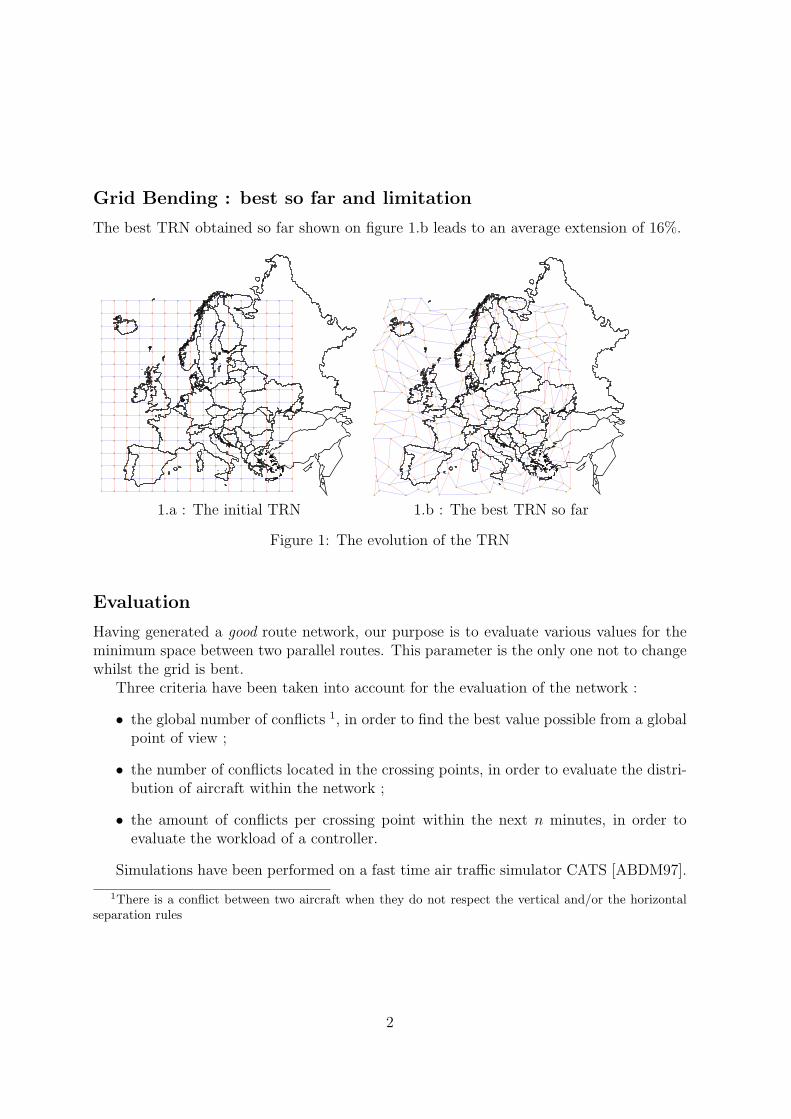
Grid Bending : best so far and limitation
The best TRN obtained so far shown on figure 1.b leads to an average extension of 16%.
1.a : The initial TRN 1.b : The best TRN so far
Figure 1: The evolution of the TRN
Evaluation
Having generated a good route network, our purpose is to evaluate various values for theminimum space between two parallel routes. This parameter is the only one not to changewhilst the grid is bent.
Three criteria have been taken into account for the evaluation of the network :
• the global number of conflicts 1, in order to find the best value possible from a globalpoint of view ;
• the number of conflicts located in the crossing points, in order to evaluate the distri-bution of aircraft within the network ;
• the amount of conflicts per crossing point within the next n minutes, in order toevaluate the workload of a controller.
Simulations have been performed on a fast time air traffic simulator CATS [ABDM97].
1There is a conflict between two aircraft when they do not respect the vertical and/or the horizontalseparation rules
2

Simulation
Every simulation has been performed using real European data from 2002. Arbitrarily thedata of June the 21st, which is one of the busiest days of this year with more than 28000flights 2, has been chosen. Conflicts are detected but unsolved with a minimum flight leveldetection on FL 100, an horizontal separation standard of 5 NM, a vertical separationstandard of 800 ft and if two aircraft are in conflict more than once, only one is consideredif the time between two conflict positions is smaller than 30 seconds.
Global number of conflicts
The route network has been evaluated in terms of number of conflicts during the day.
5000
10000
15000
20000
25000
30000
35000
40000
45000
50000
55000
0 10 20 30 40 50 60 70 80 90 100
Nb
of c
onfl
icts
Spacing between routes (in km)
ConflictsEvoluting conflicts
Conflicts above FL300
Figure 2: Evaluation of the global number of conflicts
Number of conflicts per crossing point
If the global number of conflicts gives a rough idea of the best values to use, it is important tounderstand how these conflicts are distributed. Only conflicts happening within a crossingsection are therefore considered valuable in this section.
Conclusion and Work in Progress
From the route network generation process point of view, the first results are encouragingbut a proper evaluation of a trunk route network proves difficult.
2This data contains 11024 point to point destinations with 1439 of these containing at least 5 aeroplanes,363 with at least 10 aeroplanes and 68 with at least 20.
3
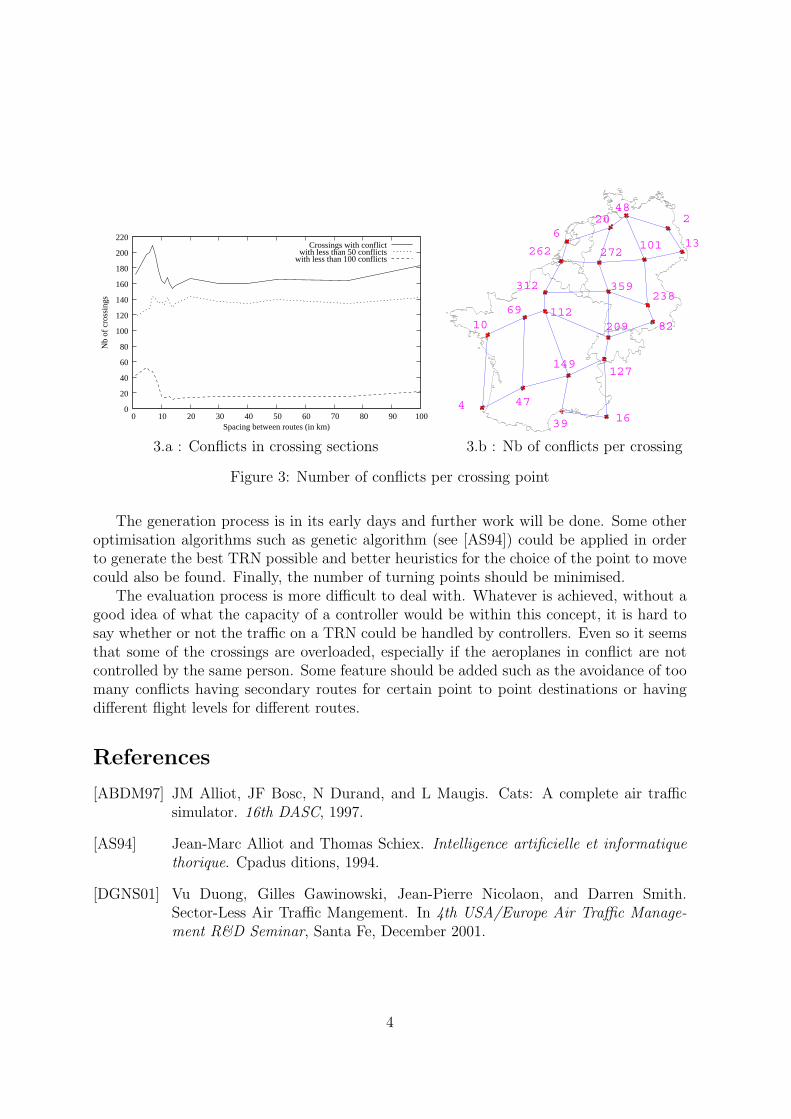
0
20
40
60
80
100
120
140
160
180
200
220
0 10 20 30 40 50 60 70 80 90 100
Nb
of c
ross
ings
Spacing between routes (in km)
Crossings with conflictwith less than 50 conflicts
with less than 100 conflicts
359
112209
2
4 4716
127
10
312
262
20
101272
238
82
13
48
69
39
149
6
3.a : Conflicts in crossing sections 3.b : Nb of conflicts per crossing
Figure 3: Number of conflicts per crossing point
The generation process is in its early days and further work will be done. Some otheroptimisation algorithms such as genetic algorithm (see [AS94]) could be applied in orderto generate the best TRN possible and better heuristics for the choice of the point to movecould also be found. Finally, the number of turning points should be minimised.
The evaluation process is more difficult to deal with. Whatever is achieved, without agood idea of what the capacity of a controller would be within this concept, it is hard tosay whether or not the traffic on a TRN could be handled by controllers. Even so it seemsthat some of the crossings are overloaded, especially if the aeroplanes in conflict are notcontrolled by the same person. Some feature should be added such as the avoidance of toomany conflicts having secondary routes for certain point to point destinations or havingdifferent flight levels for different routes.
References
[ABDM97] JM Alliot, JF Bosc, N Durand, and L Maugis. Cats: A complete air trafficsimulator. 16th DASC, 1997.
[AS94] Jean-Marc Alliot and Thomas Schiex. Intelligence artificielle et informatiquethorique. Cpadus ditions, 1994.
[DGNS01] Vu Duong, Gilles Gawinowski, Jean-Pierre Nicolaon, and Darren Smith.Sector-Less Air Traffic Mangement. In 4th USA/Europe Air Traffic Manage-ment R&D Seminar, Santa Fe, December 2001.
4
Speed uncertainty and speed regulation in conflict
detection and resolution in Air Traffic Control
Nicolas Archambault - LOG (CENA ENAC) / EEC
December 9-10 2004
With the predicted increase of air traffic volume, new air traffic managementmodels are under investigation in order to increase airspace capacity and keeplow delays while maintaining transportation safety standards.
Conflict resolution relies on conflict detection ; indeed predicting aircraft tra-jectories within a time window allows to detect the conflicts and apply avoidancemeasures. This approaches concerns both human control and models for auto-matic control resolution. The result of the conflict detection depends much onthe uncertainty model, and especially on the level of uncertainty on aircrafttrajectories. High uncertainty will lead to detect a high number of potentialconflicts, and put a high workload on the monitoring and solving of conflicts,all the more than clusters of several conflicts are more likely to appear. On theother hand, too low uncertainty will ignore conflicts.
We will first compute statistics of overestimation of conflict detection underuncertainty, as compared to actual conflicts. This is obtained by fast-time airtraffic simulation using real traffic data, based on a speed uncertainty model,with different uncertainty levels. Then we will discuss the interest of a precisespeed prediction and of the introduction of simple speed regulation maneuversin the early stages of conflict resolution, in order to ease the global conflictresolution process.
In an approach close to the ”subliminal” control concept, the amplitudeof speed regulations must remain below the speed uncertainty of the humanmodel, in order not to change the traffic perception ; yet above the unreductibleuncertainty, in order to actually solve the potential conflict.
Work in progress concerns the feasibility and efficiency of this prospectiveapproach.
1