Embed Size (px)
Citation preview
Maggi
COVID19 Impact on European Air Traffic EUROCONTROL Comprehensive Assessment
Air Traffic situation: Wednesday 10 June 2020 & mid Week 24 (08-10 June 2020)
(compared with equivalent period in 2019)
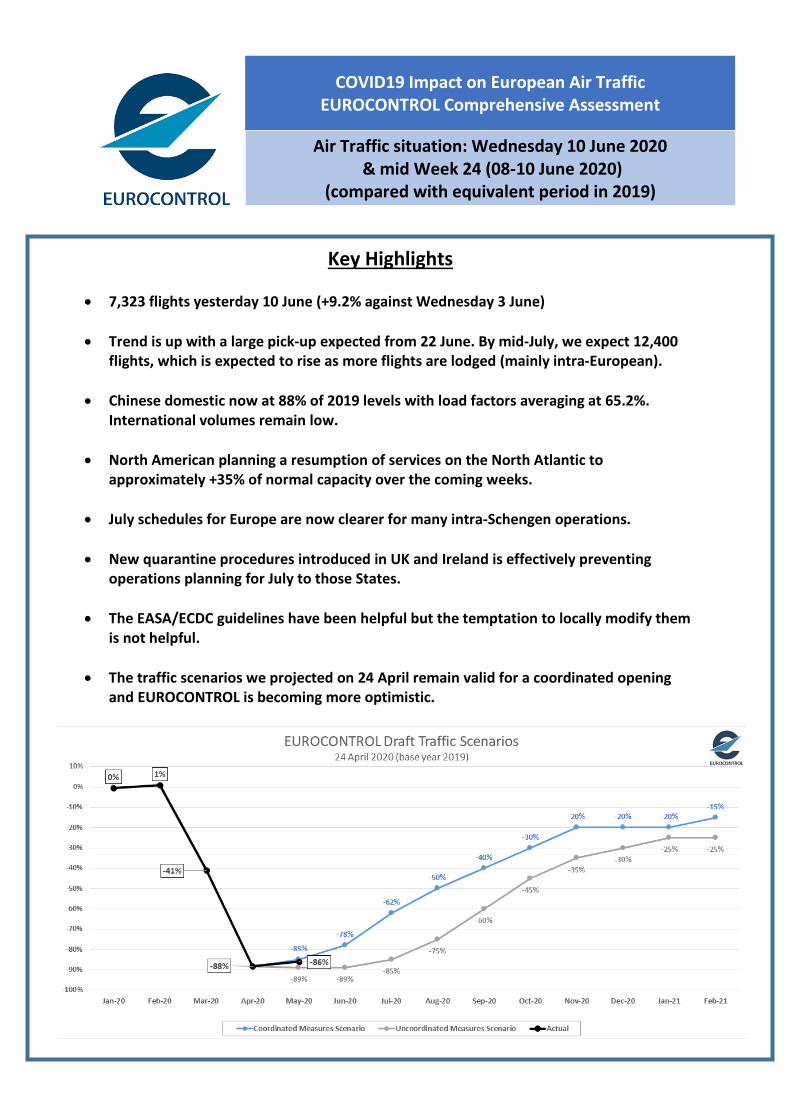
Key Highlights
• 7,323 flights yesterday 10 June (+9.2% against Wednesday 3 June)
• Trend is up with a large pick-up expected from 22 June. By mid-July, we expect 12,400 flights, which is expected to rise as more flights are lodged (mainly intra-European).
• Chinese domestic now at 88% of 2019 levels with load factors averaging at 65.2%. International volumes remain low.
• North American planning a resumption of services on the North Atlantic to approximately +35% of normal capacity over the coming weeks.
• July schedules for Europe are now clearer for many intra-Schengen operations.
• New quarantine procedures introduced in UK and Ireland is effectively preventing
operations planning for July to those States.
• The EASA/ECDC guidelines have been helpful but the temptation to locally modify them is not helpful.
• The traffic scenarios we projected on 24 April remain valid for a coordinated opening
and EUROCONTROL is becoming more optimistic.
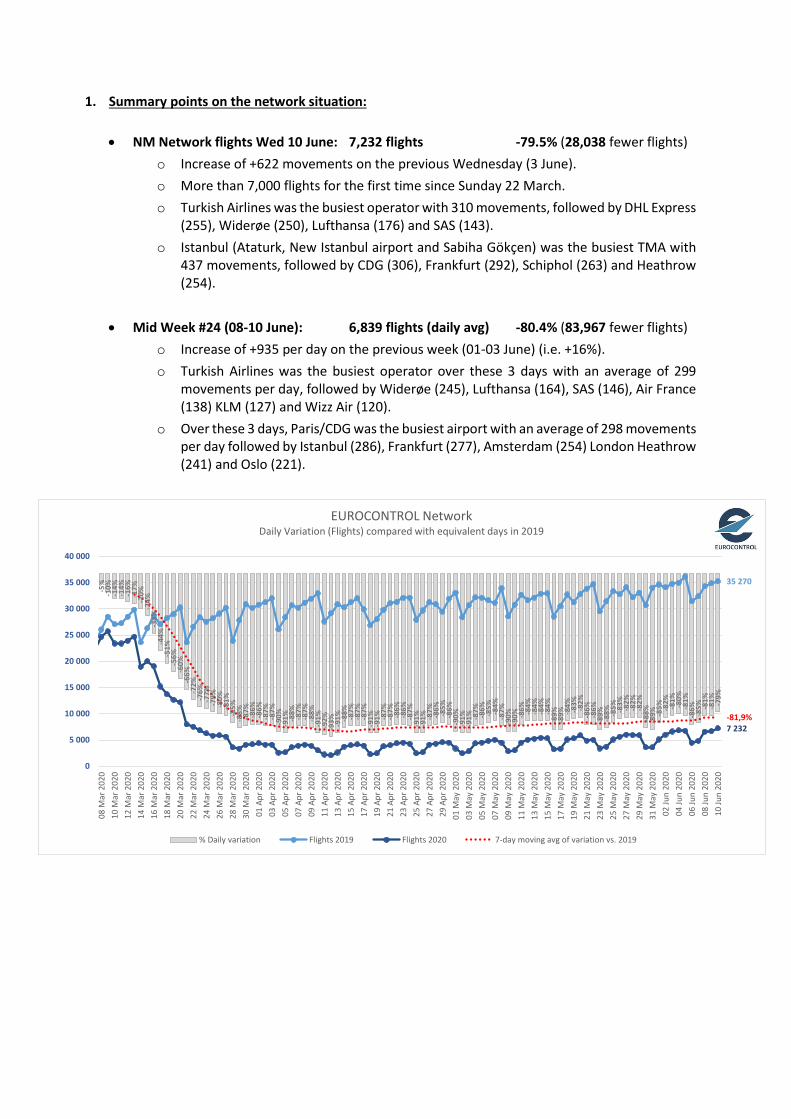
1. Summary points on the network situation:
• NM Network flights Wed 10 June: 7,232 flights -79.5% (28,038 fewer flights) o Increase of +622 movements on the previous Wednesday (3 June). o More than 7,000 flights for the first time since Sunday 22 March. o Turkish Airlines was the busiest operator with 310 movements, followed by DHL Express
(255), Widerøe (250), Lufthansa (176) and SAS (143). o Istanbul (Ataturk, New Istanbul airport and Sabiha Gökçen) was the busiest TMA with
437 movements, followed by CDG (306), Frankfurt (292), Schiphol (263) and Heathrow (254).
• Mid Week #24 (08-10 June): 6,839 flights (daily avg) -80.4% (83,967 fewer flights) o Increase of +935 per day on the previous week (01-03 June) (i.e. +16%). o Turkish Airlines was the busiest operator over these 3 days with an average of 299
movements per day, followed by Widerøe (245), Lufthansa (164), SAS (146), Air France (138) KLM (127) and Wizz Air (120).
o Over these 3 days, Paris/CDG was the busiest airport with an average of 298 movements per day followed by Istanbul (286), Frankfurt (277), Amsterdam (254) London Heathrow (241) and Oslo (221).
-5%
-10%
-14%
-14%
-16%
-17%
-20%
-24%
- 34%
-44%
-51%
-56%
-60%
-66%
-72%
-76%
-77%
-79%
-80%
-81%
-85%
-88% -87% -86%
-86%
-87%
-87%
-90%
-91% -8
8% -87%
-87%
-88%
-91%
-92%
-93% -91% -8
8% -87%
-87%
-87%
-91%
-91% -8
7%-8
7% -86%
-86%
-87%
-91%
-91% -8
7% -86% -85%
-86%
-90%
-91%
-91% -8
7% -86% -85% -84%
-87%
-90%
-90% -8
6% -84%
-84%
-84%
-84%
-89%
-89% -8
4% -83% -82%
-86%
-86%
-89% -88% -8
5% -83% -82%
-82%
-82%
-88%
-89% -8
5% -82% -81% -80%
-81%
-86% -85% -8
1%-8
1% -79%
35 270
7 232-81,9%
0
5 000
10 000
15 000
20 000
25 000
30 000
35 000
40 000
08 M
ar 2
020
10 M
ar 2
020
12 M
ar 2
020
14 M
ar 2
020
16 M
ar 2
020
18 M
ar 2
020
20 M
ar 2
020
22 M
ar 2
020
24 M
ar 2
020
26 M
ar 2
020
28 M
ar 2
020
30 M
ar 2
020
01 A
pr 2
020
03 A
pr 2
020
05 A
pr 2
020
07 A
pr 2
020
09 A
pr 2
020
11 A
pr 2
020
13 A
pr 2
020
15 A
pr 2
020
17 A
pr 2
020
19 A
pr 2
020
21 A
pr 2
020
23 A
pr 2
020
25 A
pr 2
020
27 A
pr 2
020
29 A
pr 2
020
01 M
ay 2
020
03 M
ay 2
020
05 M
ay 2
020
07 M
ay 2
020
09 M
ay 2
020
11 M
ay 2
020
13 M
ay 2
020
15 M
ay 2
020
17 M
ay 2
020
19 M
ay 2
020
21 M
ay 2
020
23 M
ay 2
020
25 M
ay 2
020
27 M
ay 2
020
29 M
ay 2
020
31 M
ay 2
020
02 Ju
n 20
2004
Jun
2020
06 Ju
n 20
2008
Jun
2020
10 Ju
n 20
20
EUROCONTROL NetworkDaily Variation (Flights) compared with equivalent days in 2019
% Daily variation Flights 2019 Flights 2020 7-day moving avg of variation vs. 2019
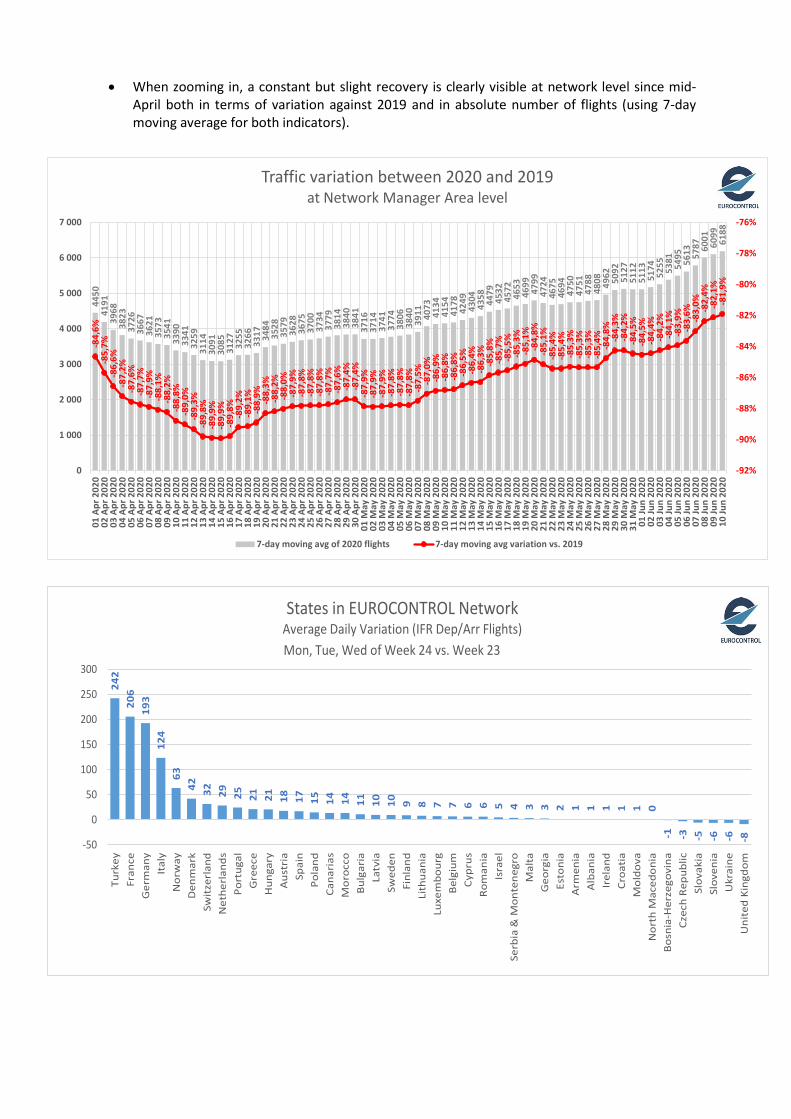
• When zooming in, a constant but slight recovery is clearly visible at network level since mid-
April both in terms of variation against 2019 and in absolute number of flights (using 7-day moving average for both indicators).
4450
4191
3968
3823
3726
3667
3621
3573
3541
3390
3341
3259
3114
3091
3085
3127 3255
3266
3317 34
8435
2835
7936
2836
7537
0037
3437
7938
1438
4038
4137
1637
1437
4137
7438
0638
4039
11 4073
4134
4154
4178
4249
4304
4358 4479
4532
4572
4653
4699
4799
4724
4675
4694
4750
4751
4788
4808 49
62 5092
5127
5112
5113
5174
5255 5381 5495 5613 57
87 6001
6099
6188
-84,
6%-8
5,7%
-86,
6%-8
7,2%
-87,
6%-8
7,7%
-87,
9%-8
8,1%
-88,
2%-8
8,8%
-89,
0%-8
9,3%
-89,
8%-8
9,9%
-89,
9%-8
9,8%
-89,
2%-8
9,1%
-88,
9% -88,
3%-8
8,2%
-88,
0%-8
7,9%
-87,
8%-8
7,8%
-87,
8%-8
7,7%
-87,
6%-8
7,4%
-87,
4%-8
7,9%
-87,
9%-8
7,9%
-87,
8%-8
7,8%
-87,
8%-8
7,5%
-87,
0%-8
6,9%
-86,
8%-8
6,8%
-86,
5%-8
6,4%
-86,
3%-8
5,8%
-85,
7%-8
5,5%
-85,
3%-8
5,1%
-84,
8%-8
5,1%
-85,
4%-8
5,4%
-85,
3%-8
5,3%
-85,
3%-8
5,4%
-84,
8%-8
4,3%
-84,
2%-8
4,5%
-84,
5%-8
4,4%
-84,
2%-8
4,1%
-83,
9%-8
3,6% -83,
0% -82,
4%-8
2,1%
-81,
9%
-92%
-90%
-88%
-86%
-84%
-82%
-80%
-78%
-76%
0
1 000
2 000
3 000
4 000
5 000
6 000
7 000
01 A
pr 2
020
02 A
pr 2
020
03 A
pr 2
020
04 A
pr 2
020
05 A
pr 2
020
06 A
pr 2
020
07 A
pr 2
020
08 A
pr 2
020
09 A
pr 2
020
10 A
pr 2
020
11 A
pr 2
020
12 A
pr 2
020
13 A
pr 2
020
14 A
pr 2
020
15 A
pr 2
020
16 A
pr 2
020
17 A
pr 2
020
18 A
pr 2
020
19 A
pr 2
020
20 A
pr 2
020
21 A
pr 2
020
22 A
pr 2
020
23 A
pr 2
020
24 A
pr 2
020
25 A
pr 2
020
26 A
pr 2
020
27 A
pr 2
020
28 A
pr 2
020
29 A
pr 2
020
30 A
pr 2
020
01 M
ay 2
020
02 M
ay 2
020
03 M
ay 2
020
04 M
ay 2
020
05 M
ay 2
020
06 M
ay 2
020
07 M
ay 2
020
08 M
ay 2
020
09 M
ay 2
020
10 M
ay 2
020
11 M
ay 2
020
12 M
ay 2
020
13 M
ay 2
020
14 M
ay 2
020
15 M
ay 2
020
16 M
ay 2
020
17 M
ay 2
020
18 M
ay 2
020
19 M
ay 2
020
20 M
ay 2
020
21 M
ay 2
020
22 M
ay 2
020
23 M
ay 2
020
24 M
ay 2
020
25 M
ay 2
020
26 M
ay 2
020
27 M
ay 2
020
28 M
ay 2
020
29 M
ay 2
020
30 M
ay 2
020
31 M
ay 2
020
01 Ju
n 20
2002
Jun
2020
03 Ju
n 20
2004
Jun
2020
05 Ju
n 20
2006
Jun
2020
07 Ju
n 20
2008
Jun
2020
09 Ju
n 20
2010
Jun
2020
Traffic variation between 2020 and 2019at Network Manager Area level
7-day moving avg of 2020 flights 7-day moving avg variation vs. 2019
242
206
193
124
6342 32 29 25 21 21 18 17 15 14 14 11 10 10 9 8 7 7 6 6 5 4 3 3 2 1 1 1 1 1 0
-1 -3 -5 -6 -6 -8-50
0
50
100
150
200
250
300
Turk
eyFr
ance
Ger
man
yIt
aly
Nor
way
Den
mar
kSw
itze
rlan
dN
ethe
rlan
dsPo
rtug
alG
reec
eH
unga
ryA
ustr
iaSp
ain
Pola
ndCa
nari
asM
oroc
coBu
lgar
iaLa
tvia
Swed
enFi
nlan
dLi
thua
nia
Luxe
mbo
urg
Belg
ium
Cypr
usRo
man
iaIs
rael
Serb
ia &
Mon
tene
gro
Mal
taG
eorg
iaEs
toni
aA
rmen
iaA
lban
iaIr
elan
dCr
oati
aM
oldo
vaN
orth
Mac
edon
iaBo
snia
-Her
zego
vina
Czec
h Re
publ
icSl
ovak
iaSl
oven
iaU
krai
neU
nite
d Ki
ngdo
m
States in EUROCONTROL NetworkAverage Daily Variation (IFR Dep/Arr Flights)Mon, Tue, Wed of Week 24 vs. Week 23
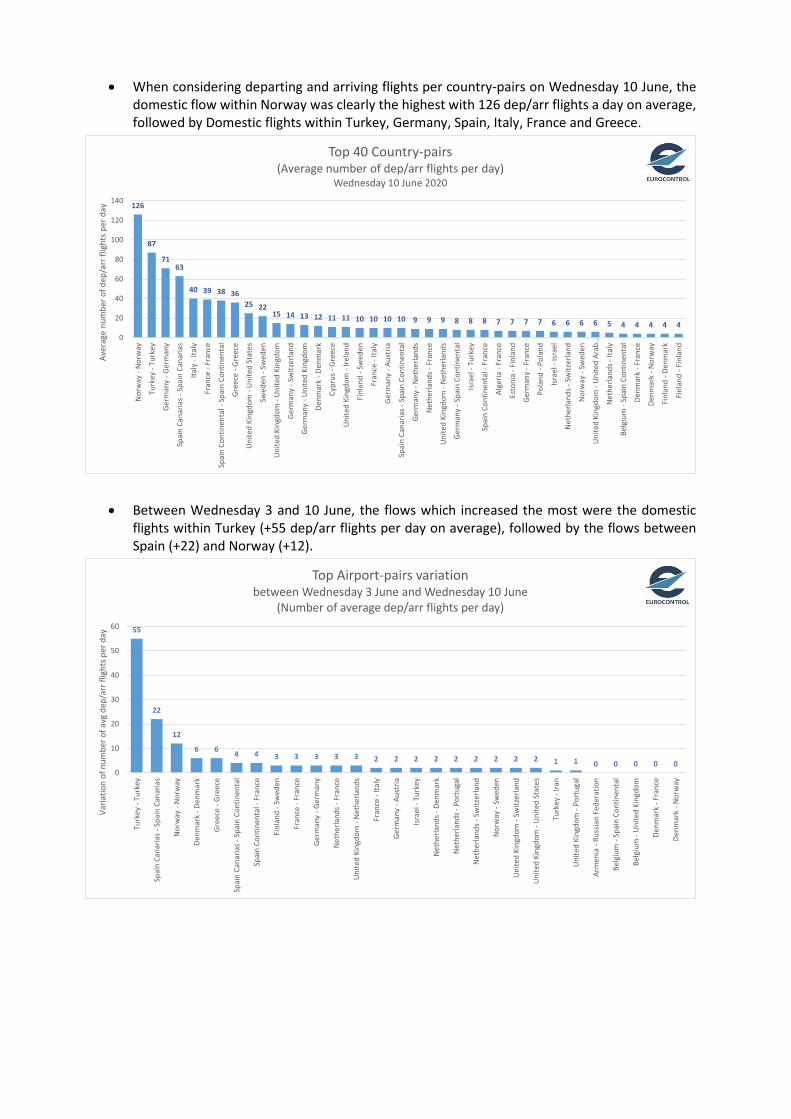
• When considering departing and arriving flights per country-pairs on Wednesday 10 June, the
domestic flow within Norway was clearly the highest with 126 dep/arr flights a day on average, followed by Domestic flights within Turkey, Germany, Spain, Italy, France and Greece.
• Between Wednesday 3 and 10 June, the flows which increased the most were the domestic flights within Turkey (+55 dep/arr flights per day on average), followed by the flows between Spain (+22) and Norway (+12).
126
87
7163
40 39 38 3625 22
15 14 13 12 11 11 10 10 10 10 9 9 9 8 8 8 7 7 7 7 6 6 6 6 5 4 4 4 4 40
20
40
60
80
100
120
140
Nor
way
- N
orw
ay
Turk
ey -
Turk
ey
Germ
any
- Ger
man
y
Spai
n Ca
naria
s - S
pain
Can
aria
s
Italy
- Ita
ly
Fran
ce -
Fran
ce
Spai
n Co
ntin
enta
l - S
pain
Con
tinen
tal
Gree
ce -
Gree
ce
Uni
ted
King
dom
- U
nite
d St
ates
Swed
en -
Swed
en
Uni
ted
King
dom
- U
nite
d Ki
ngdo
m
Germ
any
- Sw
itzer
land
Germ
any
- Uni
ted
King
dom
Denm
ark
- Den
mar
k
Cypr
us -
Gre
ece
Uni
ted
King
dom
- Ire
land
Finl
and
- Sw
eden
Fran
ce -
Italy
Germ
any
- Aus
tria
Spai
n Ca
naria
s - S
pain
Con
tinen
tal
Germ
any
- Net
herla
nds
Net
herla
nds -
Fra
nce
Uni
ted
King
dom
- N
ethe
rland
s
Germ
any
- Spa
in C
ontin
enta
l
Isra
el -
Turk
ey
Spai
n Co
ntin
enta
l - F
ranc
e
Alge
ria -
Fran
ce
Esto
nia
- Fin
land
Germ
any
- Fra
nce
Pola
nd -
Pola
nd
Isra
el -
Isra
el
Net
herla
nds -
Sw
itzer
land
Nor
way
- Sw
eden
Uni
ted
King
dom
- U
nite
d Ar
ab…
Net
herla
nds -
Ital
y
Belg
ium
- Sp
ain
Cont
inen
tal
Denm
ark
- Fra
nce
Denm
ark
- Nor
way
Finl
and
- Den
mar
k
Finl
and
- Fin
land
Aver
age
num
ber o
f dep
/arr
flig
hts p
er d
ay
Top 40 Country-pairs(Average number of dep/arr flights per day)
Wednesday 10 June 2020
55
22
12
6 6 4 4 3 3 3 3 3 2 2 2 2 2 2 2 2 2 1 1 0 0 0 0 00
10
20
30
40
50
60
Turk
ey -
Turk
ey
Spai
n Ca
naria
s - S
pain
Can
aria
s
Nor
way
- N
orw
ay
Denm
ark
- Den
mar
k
Gree
ce -
Gree
ce
Spai
n Ca
naria
s - S
pain
Con
tinen
tal
Spai
n Co
ntin
enta
l - F
ranc
e
Finl
and
- Sw
eden
Fran
ce -
Fran
ce
Germ
any
- Ger
man
y
Net
herla
nds -
Fra
nce
Uni
ted
King
dom
- N
ethe
rland
s
Fran
ce -
Italy
Germ
any
- Aus
tria
Isra
el -
Turk
ey
Net
herla
nds -
Den
mar
k
Net
herla
nds -
Por
tuga
l
Net
herla
nds -
Sw
itzer
land
Nor
way
- Sw
eden
Uni
ted
King
dom
- Sw
itzer
land
Uni
ted
King
dom
- U
nite
d St
ates
Turk
ey -
Iran
Uni
ted
King
dom
- Po
rtug
al
Arm
enia
- Ru
ssia
n Fe
dera
tion
Belg
ium
- Sp
ain
Cont
inen
tal
Belg
ium
- U
nite
d Ki
ngdo
m
Denm
ark
- Fra
nce
Denm
ark
- Nor
way
Varia
tion
of n
umbe
r of a
vg d
ep/a
rr fl
ight
s per
day
Top Airport-pairs variationbetween Wednesday 3 June and Wednesday 10 June
(Number of average dep/arr flights per day)
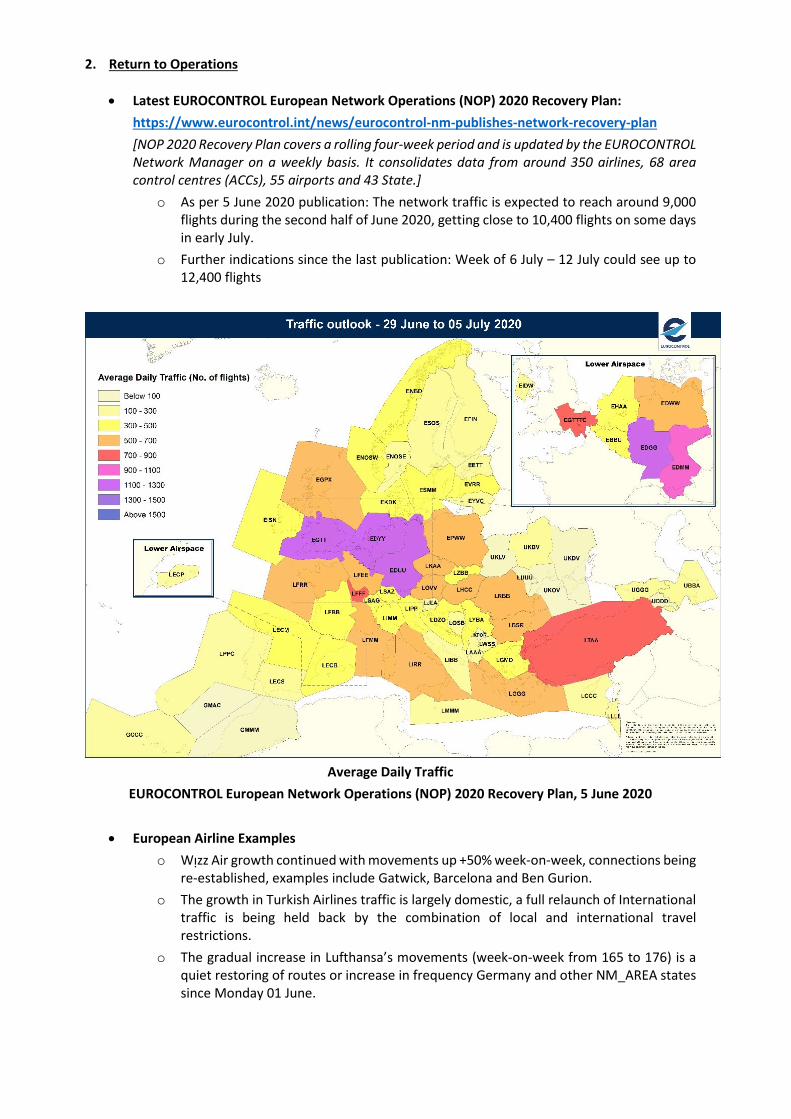
2. Return to Operations • Latest EUROCONTROL European Network Operations (NOP) 2020 Recovery Plan:
https://www.eurocontrol.int/news/eurocontrol-nm-publishes-network-recovery-plan [NOP 2020 Recovery Plan covers a rolling four-week period and is updated by the EUROCONTROL Network Manager on a weekly basis. It consolidates data from around 350 airlines, 68 area control centres (ACCs), 55 airports and 43 State.]
o As per 5 June 2020 publication: The network traffic is expected to reach around 9,000 flights during the second half of June 2020, getting close to 10,400 flights on some days in early July.
o Further indications since the last publication: Week of 6 July – 12 July could see up to 12,400 flights
Average Daily Traffic
EUROCONTROL European Network Operations (NOP) 2020 Recovery Plan, 5 June 2020
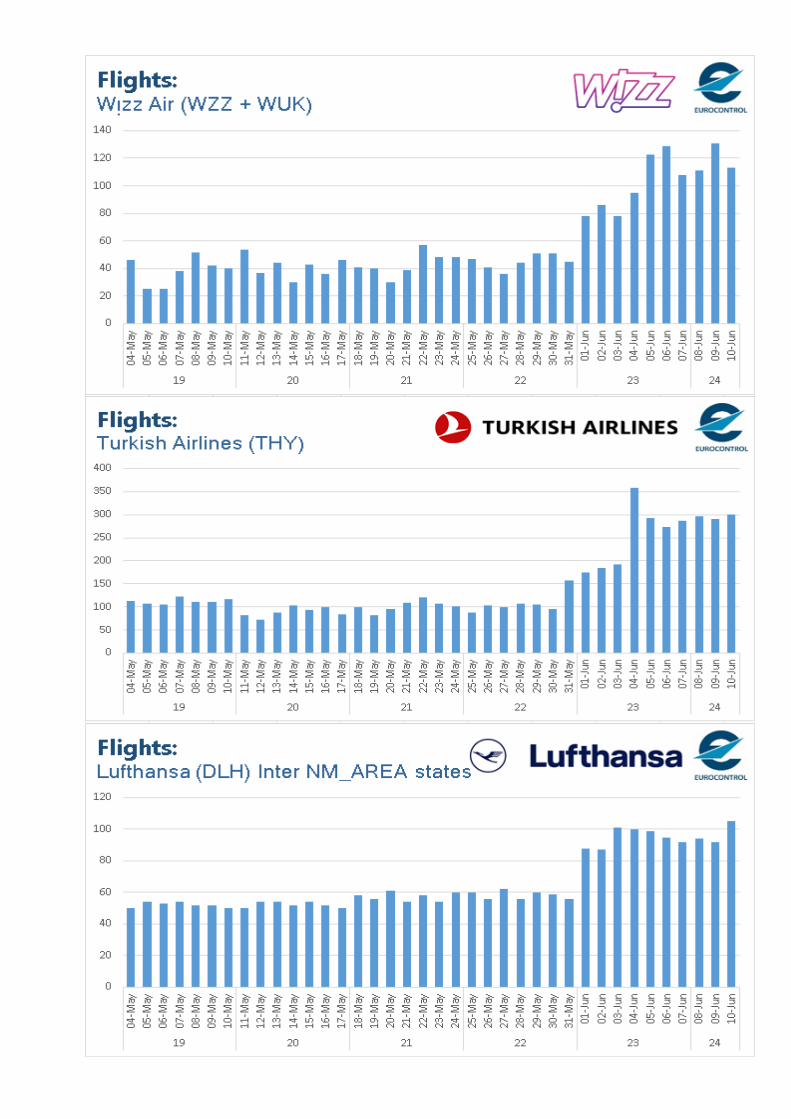
• European Airline Examples o Wᴉzz Air growth continued with movements up +50% week-on-week, connections being
re-established, examples include Gatwick, Barcelona and Ben Gurion. o The growth in Turkish Airlines traffic is largely domestic, a full relaunch of International
traffic is being held back by the combination of local and international travel restrictions.
o The gradual increase in Lufthansa’s movements (week-on-week from 165 to 176) is a quiet restoring of routes or increase in frequency Germany and other NM_AREA states since Monday 01 June.
• Return to Operations – North America
(sourced via US FAA and OAG) o The number of departure seats totalled 5.57 million (w/c May 25), a modest rise of 1.4%
compared with the previous seven days. However, the market remains 77% smaller than the same week a year ago. The US accounted for 5.35 million seats last week, while there were 214,910 departure seats in Canada.
o The upward trend appears set to continue over the coming weeks as airlines gradually begin to restore routes and frequencies. The latest schedules data shows that capacity from and within North America during June 2020 is expected to be about 3.28 million departure seats, a rise of 32% compared with May.
o North American Operations – Return to Operations Examples:
Southwest Airlines o Rremains the largest carrier in North America by capacity, offering 1.55 million seats
last week. This is equivalent to 39% of its weekly capacity a year ago.
United Airlines o As of July 06, United will add flights to London, Munich, Amsterdam, Brussels, Dublin,
Tel Aviv and Zurich. o 14 additional daily flights will be added in August to those same destinations. The rest
of their international European schedule has been pushed for an October 24 decision.
Delta Airlines o June schedule will include flights to Amsterdam, London and Tel Aviv o July schedule will add 8 additional daily flights o August schedule will add approximately 30 daily flights o Delta will double its domestic capacity in July from May, after adding back 100 flights
in June.
American Airlines o On June 4 resumed service to Amsterdam, Frankfurt Paris and London. o American Airlines will operate 55% of its original domestic schedule in July, citing
consistent improvement in summer leisure travel demand.
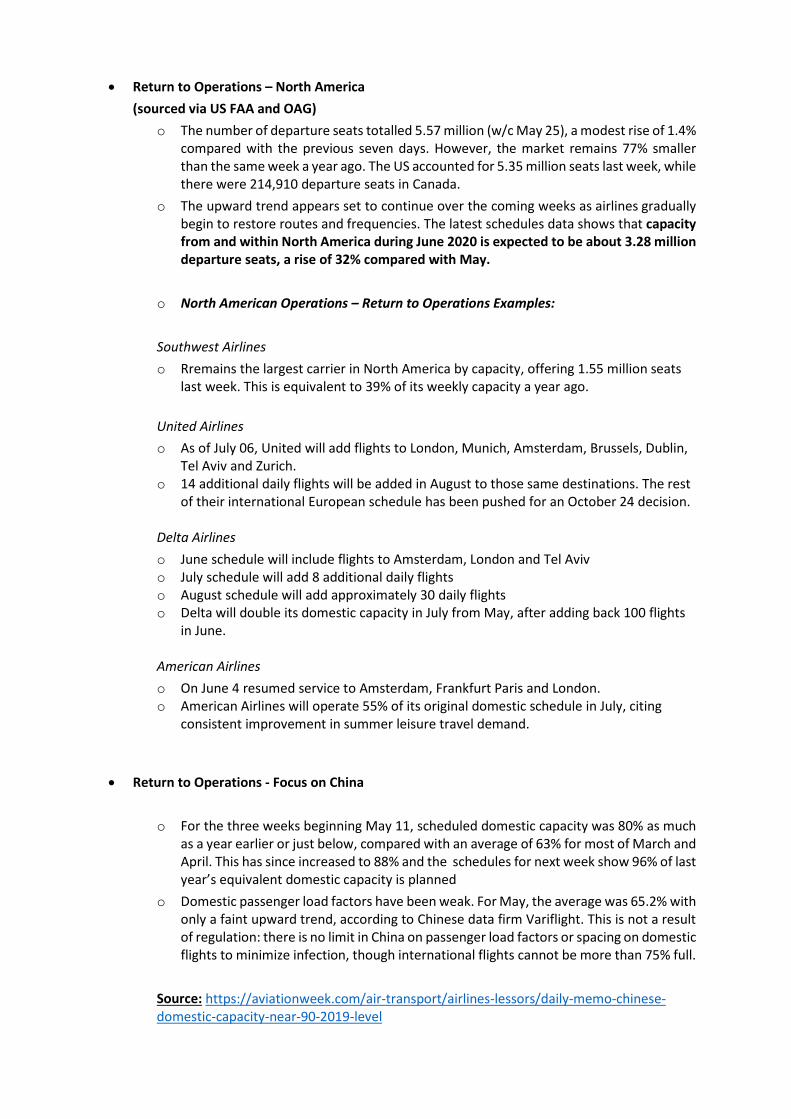
• Return to Operations - Focus on China
o For the three weeks beginning May 11, scheduled domestic capacity was 80% as much
as a year earlier or just below, compared with an average of 63% for most of March and April. This has since increased to 88% and the schedules for next week show 96% of last year’s equivalent domestic capacity is planned
o Domestic passenger load factors have been weak. For May, the average was 65.2% with only a faint upward trend, according to Chinese data firm Variflight. This is not a result of regulation: there is no limit in China on passenger load factors or spacing on domestic flights to minimize infection, though international flights cannot be more than 75% full.
Source: https://aviationweek.com/air-transport/airlines-lessors/daily-memo-chinese-domestic-capacity-near-90-2019-level
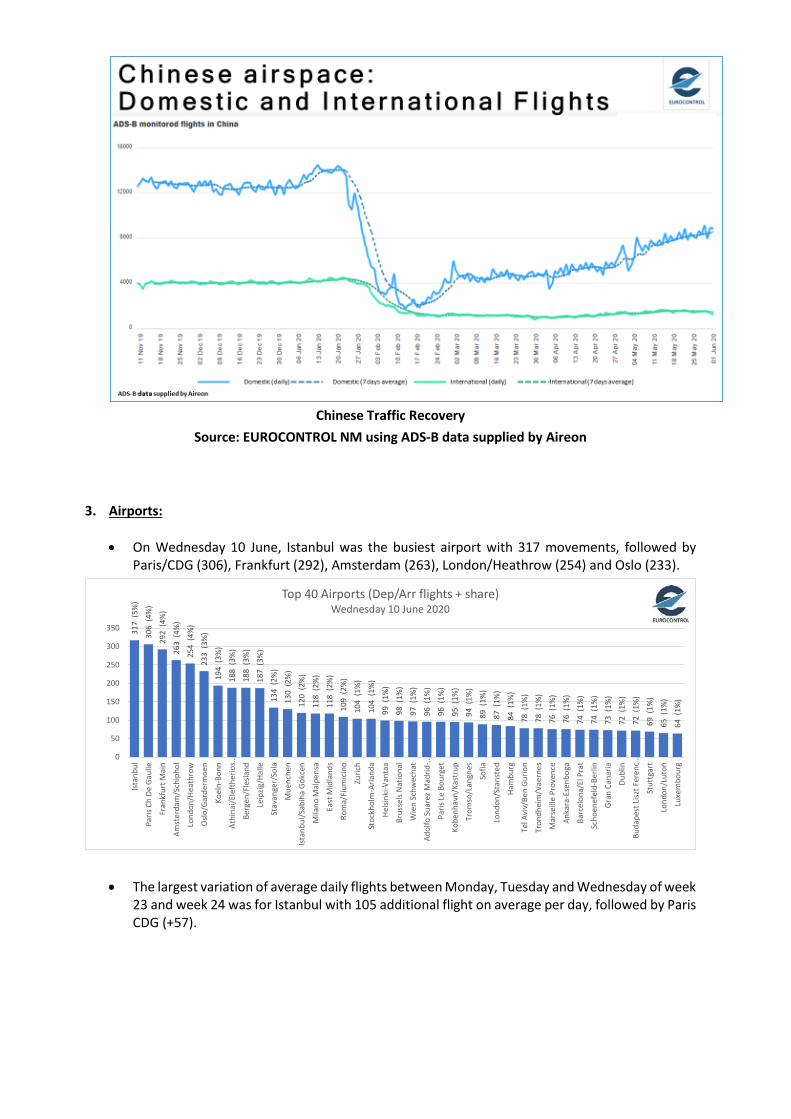
Chinese Traffic Recovery
Source: EUROCONTROL NM using ADS-B data supplied by Aireon
3. Airports: • On Wednesday 10 June, Istanbul was the busiest airport with 317 movements, followed by
Paris/CDG (306), Frankfurt (292), Amsterdam (263), London/Heathrow (254) and Oslo (233).
• The largest variation of average daily flights between Monday, Tuesday and Wednesday of week 23 and week 24 was for Istanbul with 105 additional flight on average per day, followed by Paris CDG (+57).
317
(5%
)
306
(4%
)
292
(4%
)
263
(4%
)
254
(4%
)
233
(3%
)
194
(3%
)
188
(3%
)
188
(3%
)
187
(3%
)
134
(2%
)
130
(2%
)
120
(2%
)
118
(2%
)
118
(2%
)
109
(2%
)
104
(1%
)
104
(1%
)
99 (
1%)
98 (
1%)
97 (
1%)
96 (
1%)
96 (
1%)
95 (
1%)
94 (
1%)
89 (
1%)
87 (
1%)
84 (
1%)
78 (
1%)
78 (
1%)
76 (
1%)
76 (
1%)
74 (
1%)
74 (
1%)
73 (
1%)
72 (
1%)
72 (
1%)
69 (
1%)
65 (
1%)
64 (
1%)
0
50
100
150
200
250
300
350
Ista
nbul
Paris
Ch
De G
aulle
Fran
kfur
t Mai
n
Amst
erda
m/S
chip
hol
Lond
on/H
eath
row
Oslo
/Gar
derm
oen
Koel
n-Bo
nn
Athi
nai/E
left
herio
s…
Berg
en/F
lesla
nd
Leip
zig/H
alle
Stav
ange
r/So
la
Mue
nche
n
Ista
nbul
/Sab
iha
Gokc
en
Mila
no M
alpe
nsa
East
Mid
land
s
Rom
a/Fi
umic
ino
Zuric
h
Stoc
khol
m-A
rland
a
Helsi
nki-V
anta
a
Brus
sels
Nat
iona
l
Wie
n Sc
hwec
hat
Adol
fo S
uare
z Mad
rid-…
Paris
Le
Bour
get
Kobe
nhav
n/Ka
stru
p
Trom
so/L
angn
es
Sofia
Lond
on/S
tans
ted
Ham
burg
Tel A
viv/
Ben
Gurio
n
Tron
dhei
m/V
aern
es
Mar
seill
e Pr
oven
ce
Anka
ra-E
senb
oga
Barc
elon
a/El
Pra
t
Scho
enef
eld-
Berli
n
Gran
Can
aria
Dubl
in
Buda
pest
Lisz
t Fer
enc…
Stut
tgar
t
Lond
on/L
uton
Luxe
mbo
urg
Top 40 Airports (Dep/Arr flights + share)Wednesday 10 June 2020
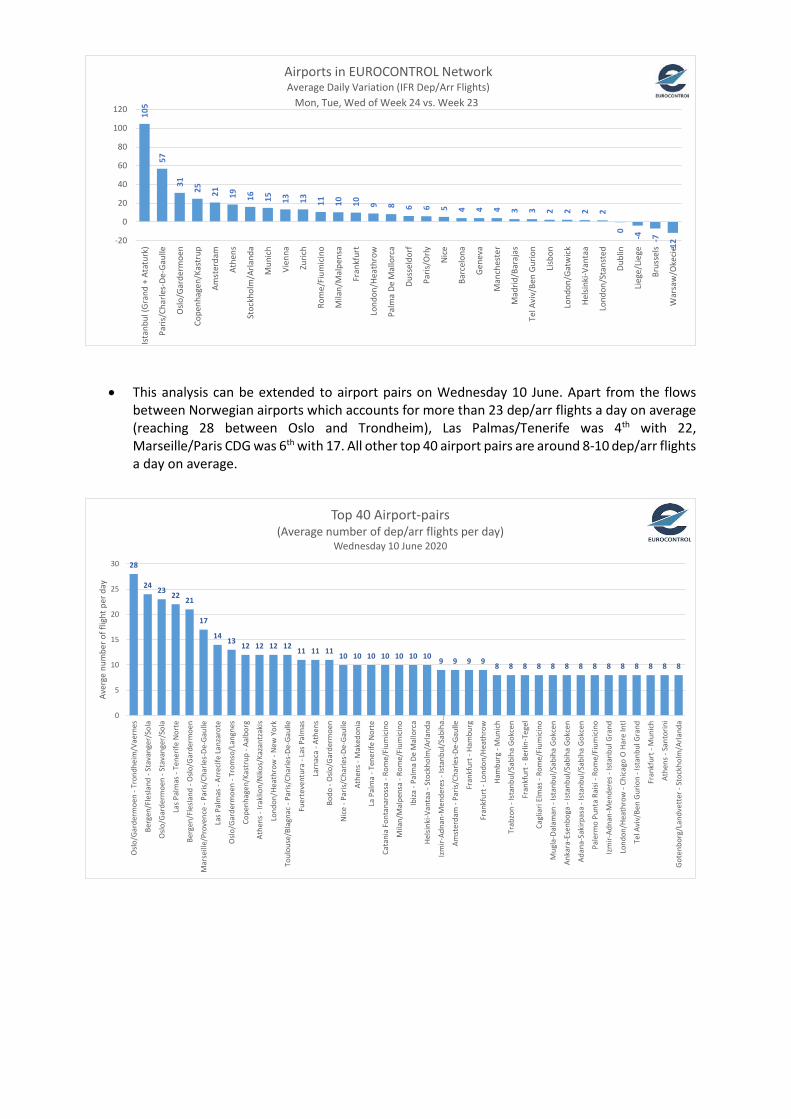
• This analysis can be extended to airport pairs on Wednesday 10 June. Apart from the flows between Norwegian airports which accounts for more than 23 dep/arr flights a day on average (reaching 28 between Oslo and Trondheim), Las Palmas/Tenerife was 4th with 22, Marseille/Paris CDG was 6th with 17. All other top 40 airport pairs are around 8-10 dep/arr flights a day on average.
105
57
31
25 21 19 16 15 13 13 11 10 10 9 8 6 6 5 4 4 4 3 3 2 2 2 2
0
-4 -7
-12-20
0
20
40
60
80
100
120
Ista
nbul
(Gra
nd +
Ata
turk
)
Paris
/Cha
rles-
De-G
aulle
Oslo
/Gar
derm
oen
Cope
nhag
en/K
astr
up
Amst
erda
m
Athe
ns
Stoc
khol
m/A
rland
a
Mun
ich
Vien
na
Zuric
h
Rom
e/Fi
umic
ino
Mila
n/M
alpe
nsa
Fran
kfur
t
Lond
on/H
eath
row
Palm
a De
Mal
lorc
a
Duss
eldo
rf
Paris
/Orly
Nic
e
Barc
elon
a
Gene
va
Man
ches
ter
Mad
rid/B
araj
as
Tel A
viv/
Ben
Gurio
n
Lisb
on
Lond
on/G
atw
ick
Helsi
nki-V
anta
a
Lond
on/S
tans
ted
Dubl
in
Lieg
e/Li
ege
Brus
sels
War
saw
/Oke
cie
Airports in EUROCONTROL NetworkAverage Daily Variation (IFR Dep/Arr Flights)
Mon, Tue, Wed of Week 24 vs. Week 23
28
24 23 22 21
17
14 13 12 12 12 12 11 11 11 10 10 10 10 10 10 10 9 9 9 9 8 8 8 8 8 8 8 8 8 8 8 8 8 8
0
5
10
15
20
25
30
Oslo
/Gar
derm
oen
- Tro
ndhe
im/V
aern
es
Berg
en/F
lesla
nd -
Stav
ange
r/So
la
Oslo
/Gar
derm
oen
- Sta
vang
er/S
ola
Las P
alm
as -
Tene
rife
Nor
te
Berg
en/F
lesla
nd -
Oslo
/Gar
derm
oen
Mar
seill
e/Pr
oven
ce -
Paris
/Cha
rles-
De-G
aulle
Las P
alm
as -
Arre
cife
Lan
zaro
te
Oslo
/Gar
derm
oen
- Tro
mso
/Lan
gnes
Cope
nhag
en/K
astr
up -
Aalb
org
Athe
ns -
Irakl
ion/
Nik
os/K
azan
tzak
is
Lond
on/H
eath
row
- N
ew Y
ork
Toul
ouse
/Bla
gnac
- Pa
ris/C
harle
s-De
-Gau
lle
Fuer
teve
ntur
a - L
as P
alm
as
Larn
aca
- Ath
ens
Bodo
- O
slo/G
arde
rmoe
n
Nic
e - P
aris/
Char
les-
De-G
aulle
Athe
ns -
Mak
edon
ia
La P
alm
a - T
ener
ife N
orte
Cata
nia
Font
anar
ossa
- Ro
me/
Fium
icin
o
Mila
n/M
alpe
nsa
- Rom
e/Fi
umic
ino
Ibiza
- Pa
lma
De M
allo
rca
Helsi
nki-V
anta
a - S
tock
holm
/Arla
nda
Izm
ir-Ad
nan-
Men
dere
s - Is
tanb
ul/S
abih
a…
Amst
erda
m -
Paris
/Cha
rles-
De-G
aulle
Fran
kfur
t - H
ambu
rg
Fran
kfur
t - L
ondo
n/He
athr
ow
Ham
burg
- M
unic
h
Trab
zon
- Ist
anbu
l/Sab
iha
Gokc
en
Fran
kfur
t - B
erlin
-Teg
el
Cagl
iari
Elm
as -
Rom
e/Fi
umic
ino
Mug
la-D
alam
an -
Ista
nbul
/Sab
iha
Gok
cen
Anka
ra-E
senb
oga
- Ist
anbu
l/Sab
iha
Gokc
en
Adan
a-Sa
kirp
asa
- Ist
anbu
l/Sab
iha
Gok
cen
Pale
rmo
Punt
a Ra
isi -
Rom
e/Fi
umic
ino
Izm
ir-Ad
nan-
Men
dere
s - Is
tanb
ul G
rand
Lond
on/H
eath
row
- Ch
icag
o O
Har
e In
tl
Tel A
viv/
Ben
Gurio
n - I
stan
bul G
rand
Fran
kfur
t - M
unic
h
Athe
ns -
Sant
orin
i
Gote
nbor
g/La
ndve
tter
- St
ockh
olm
/Arla
nda
Aver
ge n
umbe
r of f
light
per
day
Top 40 Airport-pairs(Average number of dep/arr flights per day)
Wednesday 10 June 2020
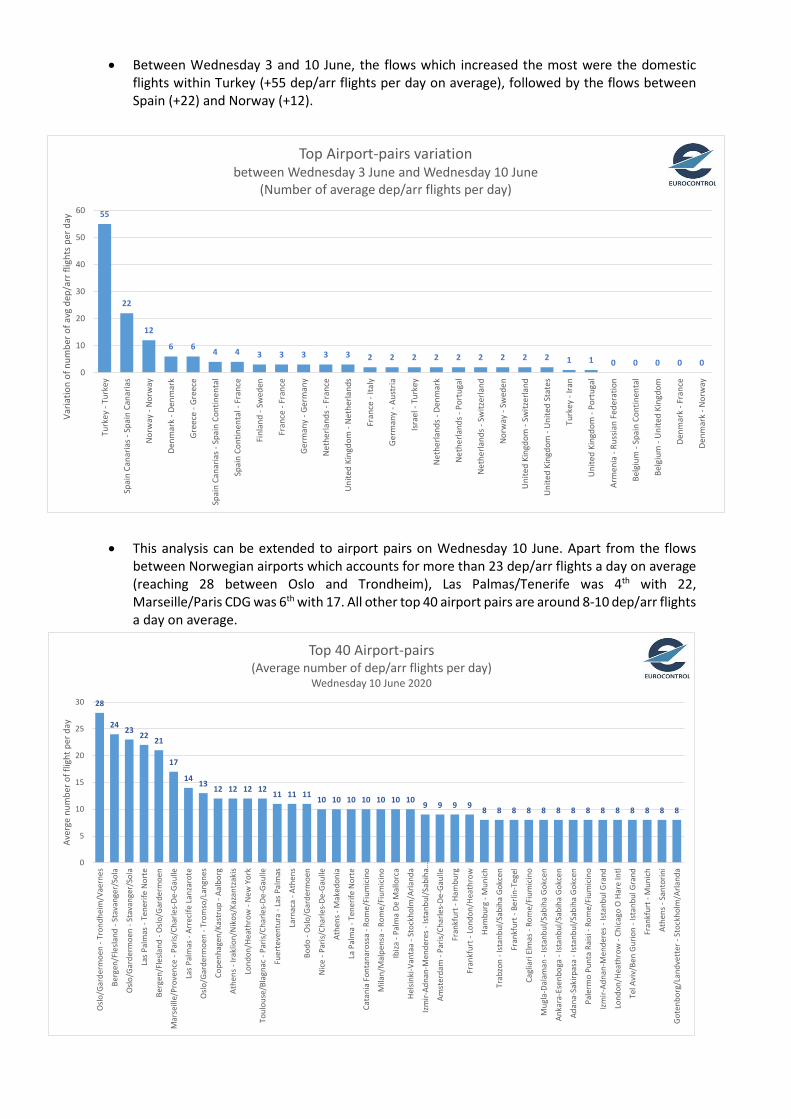
• Between Wednesday 3 and 10 June, the flows which increased the most were the domestic flights within Turkey (+55 dep/arr flights per day on average), followed by the flows between Spain (+22) and Norway (+12).
• This analysis can be extended to airport pairs on Wednesday 10 June. Apart from the flows between Norwegian airports which accounts for more than 23 dep/arr flights a day on average (reaching 28 between Oslo and Trondheim), Las Palmas/Tenerife was 4th with 22, Marseille/Paris CDG was 6th with 17. All other top 40 airport pairs are around 8-10 dep/arr flights a day on average.
55
22
12
6 6 4 4 3 3 3 3 3 2 2 2 2 2 2 2 2 2 1 1 0 0 0 0 00
10
20
30
40
50
60
Turk
ey -
Turk
ey
Spai
n Ca
naria
s - S
pain
Can
aria
s
Nor
way
- N
orw
ay
Denm
ark
- Den
mar
k
Gree
ce -
Gree
ce
Spai
n Ca
naria
s - S
pain
Con
tinen
tal
Spai
n Co
ntin
enta
l - F
ranc
e
Finl
and
- Sw
eden
Fran
ce -
Fran
ce
Germ
any
- Ger
man
y
Net
herla
nds -
Fra
nce
Uni
ted
King
dom
- N
ethe
rland
s
Fran
ce -
Italy
Germ
any
- Aus
tria
Isra
el -
Turk
ey
Net
herla
nds -
Den
mar
k
Net
herla
nds -
Por
tuga
l
Net
herla
nds -
Sw
itzer
land
Nor
way
- Sw
eden
Uni
ted
King
dom
- Sw
itzer
land
Uni
ted
King
dom
- U
nite
d St
ates
Turk
ey -
Iran
Uni
ted
King
dom
- Po
rtug
al
Arm
enia
- Ru
ssia
n Fe
dera
tion
Belg
ium
- Sp
ain
Cont
inen
tal
Belg
ium
- U
nite
d Ki
ngdo
m
Denm
ark
- Fra
nce
Denm
ark
- Nor
way
Varia
tion
of n
umbe
r of a
vg d
ep/a
rr fl
ight
s per
day
Top Airport-pairs variationbetween Wednesday 3 June and Wednesday 10 June
(Number of average dep/arr flights per day)
28
24 23 22 21
17
14 13 12 12 12 12 11 11 11 10 10 10 10 10 10 10 9 9 9 9 8 8 8 8 8 8 8 8 8 8 8 8 8 8
0
5
10
15
20
25
30
Oslo
/Gar
derm
oen
- Tro
ndhe
im/V
aern
es
Berg
en/F
lesla
nd -
Stav
ange
r/So
la
Oslo
/Gar
derm
oen
- Sta
vang
er/S
ola
Las P
alm
as -
Tene
rife
Nor
te
Berg
en/F
lesla
nd -
Oslo
/Gar
derm
oen
Mar
seill
e/Pr
oven
ce -
Paris
/Cha
rles-
De-G
aulle
Las P
alm
as -
Arre
cife
Lan
zaro
te
Oslo
/Gar
derm
oen
- Tro
mso
/Lan
gnes
Cope
nhag
en/K
astr
up -
Aalb
org
Athe
ns -
Irakl
ion/
Nik
os/K
azan
tzak
is
Lond
on/H
eath
row
- N
ew Y
ork
Toul
ouse
/Bla
gnac
- Pa
ris/C
harle
s-De
-Gau
lle
Fuer
teve
ntur
a - L
as P
alm
as
Larn
aca
- Ath
ens
Bodo
- O
slo/G
arde
rmoe
n
Nic
e - P
aris/
Char
les-
De-G
aulle
Athe
ns -
Mak
edon
ia
La P
alm
a - T
ener
ife N
orte
Cata
nia
Font
anar
ossa
- Ro
me/
Fium
icin
o
Mila
n/M
alpe
nsa
- Rom
e/Fi
umic
ino
Ibiza
- Pa
lma
De M
allo
rca
Helsi
nki-V
anta
a - S
tock
holm
/Arla
nda
Izm
ir-Ad
nan-
Men
dere
s - Is
tanb
ul/S
abih
a…
Amst
erda
m -
Paris
/Cha
rles-
De-G
aulle
Fran
kfur
t - H
ambu
rg
Fran
kfur
t - L
ondo
n/He
athr
ow
Ham
burg
- M
unic
h
Trab
zon
- Ist
anbu
l/Sab
iha
Gokc
en
Fran
kfur
t - B
erlin
-Teg
el
Cagl
iari
Elm
as -
Rom
e/Fi
umic
ino
Mug
la-D
alam
an -
Ista
nbul
/Sab
iha
Gok
cen
Anka
ra-E
senb
oga
- Ist
anbu
l/Sab
iha
Gokc
en
Adan
a-Sa
kirp
asa
- Ist
anbu
l/Sab
iha
Gok
cen
Pale
rmo
Punt
a Ra
isi -
Rom
e/Fi
umic
ino
Izm
ir-Ad
nan-
Men
dere
s - Is
tanb
ul G
rand
Lond
on/H
eath
row
- Ch
icag
o O
Har
e In
tl
Tel A
viv/
Ben
Gurio
n - I
stan
bul G
rand
Fran
kfur
t - M
unic
h
Athe
ns -
Sant
orin
i
Gote
nbor
g/La
ndve
tter
- St
ockh
olm
/Arla
nda
Aver
ge n
umbe
r of f
light
per
day
Top 40 Airport-pairs(Average number of dep/arr flights per day)
Wednesday 10 June 2020
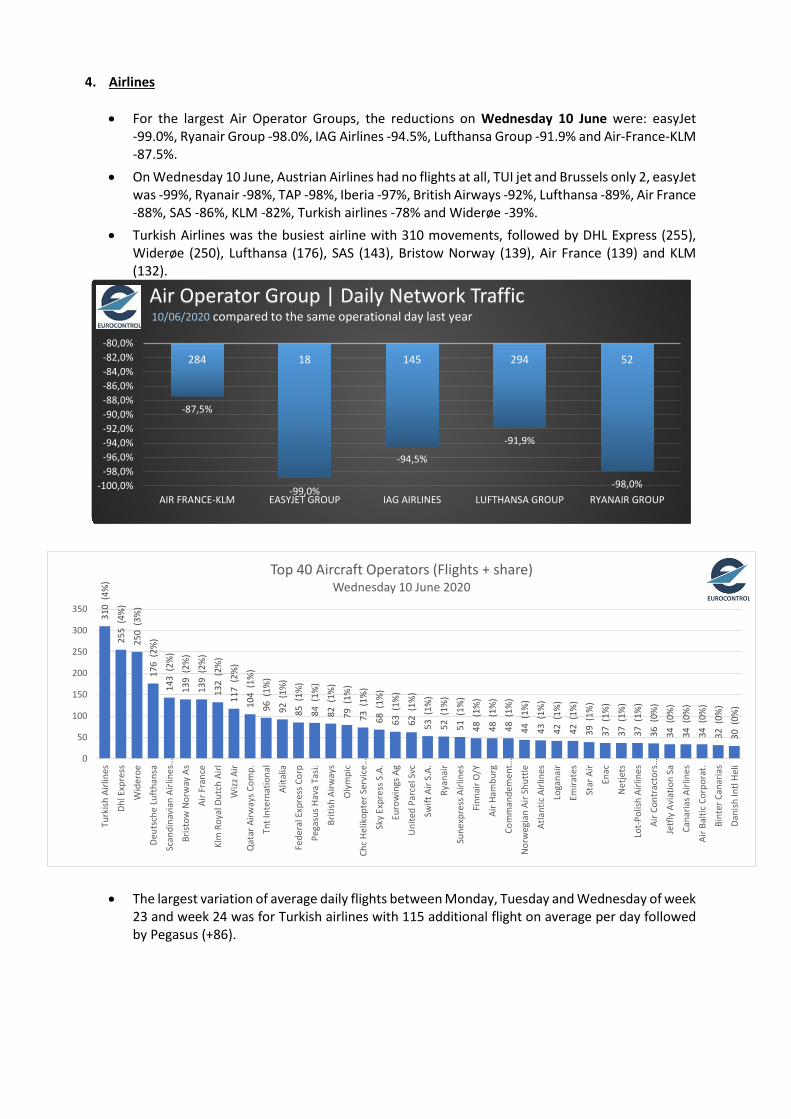
4. Airlines
• For the largest Air Operator Groups, the reductions on Wednesday 10 June were: easyJet
-99.0%, Ryanair Group -98.0%, IAG Airlines -94.5%, Lufthansa Group -91.9% and Air-France-KLM -87.5%.
• On Wednesday 10 June, Austrian Airlines had no flights at all, TUI jet and Brussels only 2, easyJet was -99%, Ryanair -98%, TAP -98%, Iberia -97%, British Airways -92%, Lufthansa -89%, Air France -88%, SAS -86%, KLM -82%, Turkish airlines -78% and Widerøe -39%.
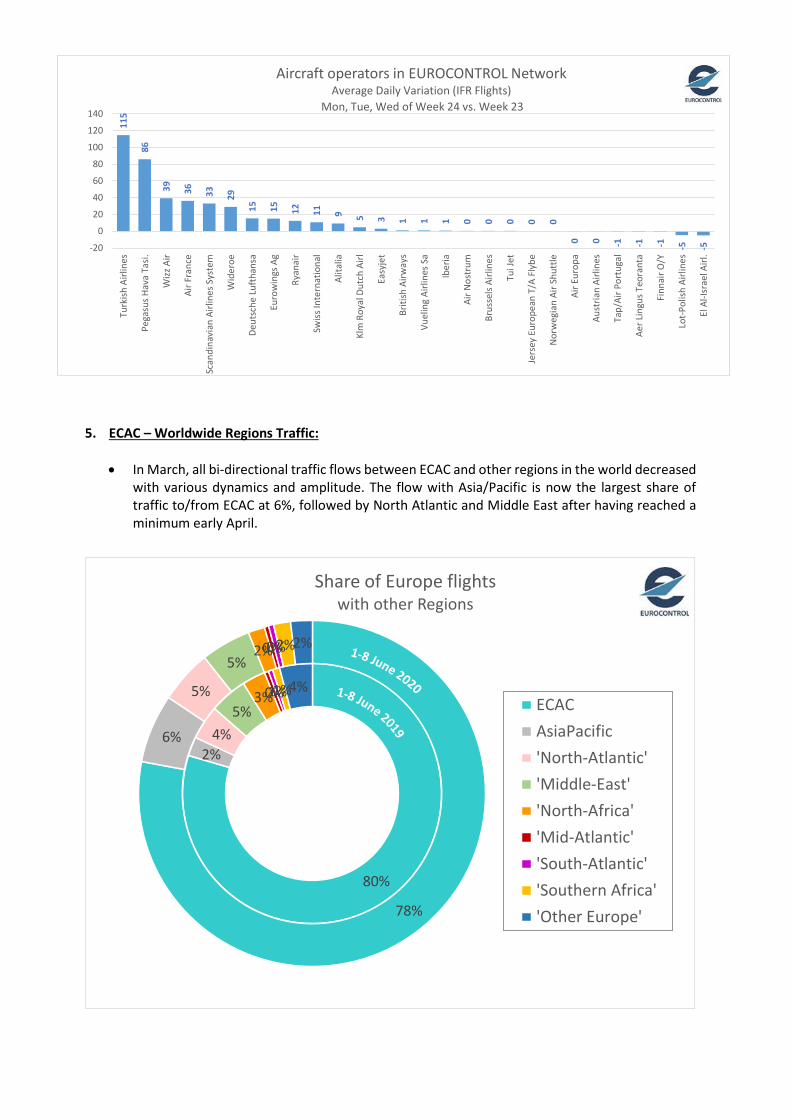
• Turkish Airlines was the busiest airline with 310 movements, followed by DHL Express (255), Widerøe (250), Lufthansa (176), SAS (143), Bristow Norway (139), Air France (139) and KLM (132).
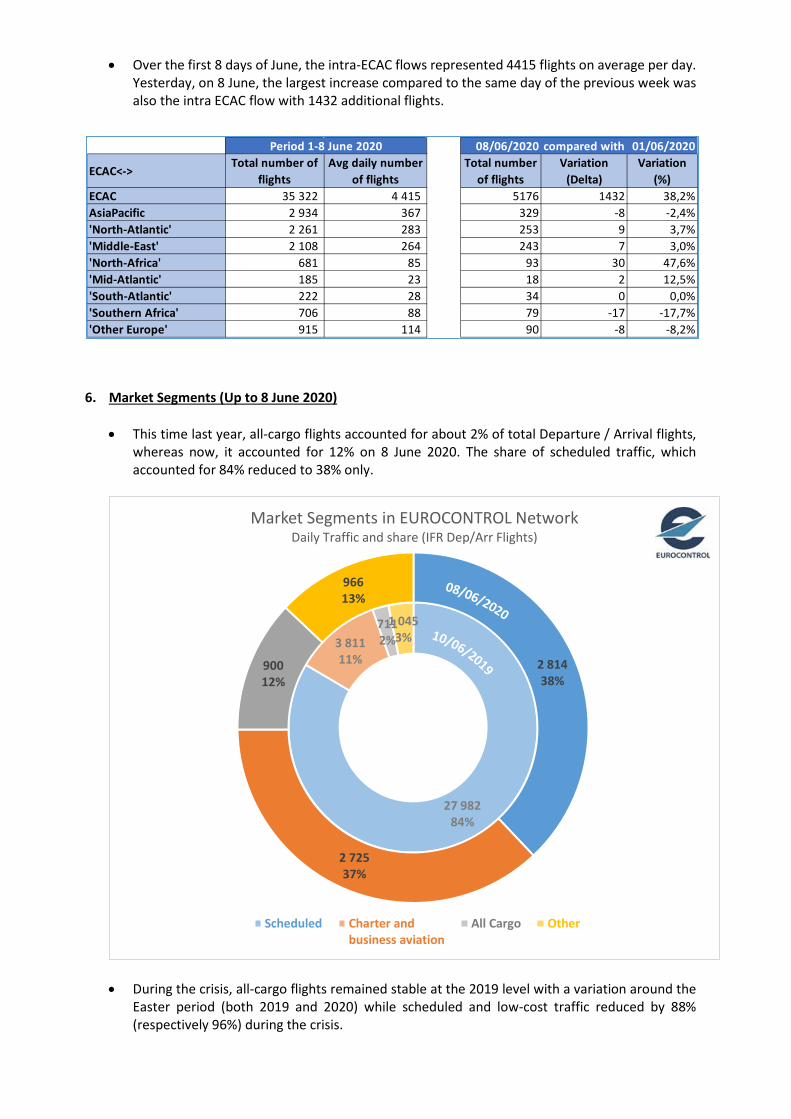
• The largest variation of average daily flights between Monday, Tuesday and Wednesday of week 23 and week 24 was for Turkish airlines with 115 additional flight on average per day followed by Pegasus (+86).
-87,5%
-99,0%
-94,5%
-91,9%
-98,0%
284 18 145 294 52
-100,0%-98,0%-96,0%-94,0%-92,0%-90,0%-88,0%-86,0%-84,0%-82,0%-80,0%
AIR FRANCE-KLM EASYJET GROUP IAG AIRLINES LUFTHANSA GROUP RYANAIR GROUP
Air Operator Group | Daily Network Trafficcompared to the same operational day last year10/06/2020
310
(4%
)
255
(4%
)
250
(3%
)
176
(2%
)
143
(2%
)
139
(2%
)
139
(2%
)
132
(2%
)
117
(2%
)
104
(1%
)
96 (
1%)
92 (
1%)
85 (
1%)
84 (
1%)
82 (
1%)
79 (
1%)
73 (
1%)
68 (
1%)
63 (
1%)
62 (
1%)
53 (
1%)
52 (
1%)
51 (
1%)
48 (
1%)
48 (
1%)
48 (
1%)
44 (
1%)
43 (
1%)
42 (
1%)
42 (
1%)
39 (
1%)
37 (
1%)
37 (
1%)
37 (
1%)
36 (
0%)
34 (
0%)
34 (
0%)
34 (
0%)
32 (
0%)
30 (
0%)
0
50
100
150
200
250
300
350
Turk
ish A
irlin
es
Dhl E
xpre
ss
Wid
eroe
Deut
sche
Luf
than
sa
Scan
dina
vian
Airl
ines
…
Brist
ow N
orw
ay A
s
Air F
ranc
e
Klm
Roy
al D
utch
Airl
Wizz
Air
Qat
ar A
irway
s Com
p.
Tnt I
nter
natio
nal
Alita
lia
Fede
ral E
xpre
ss C
orp
Pega
sus H
ava
Tasi.
Briti
sh A
irway
s
Oly
mpi
c
Chc
Helik
opte
r Ser
vice
…
Sky
Expr
ess S
.A.
Euro
win
gs A
g
Uni
ted
Parc
el S
vc
Swift
Air
S.A.
Ryan
air
Sune
xpre
ss A
irlin
es
Finn
air O
/Y
Air H
ambu
rg
Com
man
dem
ent…
Nor
weg
ian
Air S
hutt
le
Atla
ntic
Airl
ines
Loga
nair
Emira
tes
Star
Air
Enac
Net
jets
Lot-
Polis
h Ai
rline
s
Air C
ontr
acto
rs…
Jetf
ly A
viat
ion
Sa
Cana
rias A
irlin
es
Air B
altic
Cor
pora
t.
Bint
er C
anar
ias
Dani
sh In
tl He
li
Top 40 Aircraft Operators (Flights + share)Wednesday 10 June 2020
5. ECAC – Worldwide Regions Traffic: • In March, all bi-directional traffic flows between ECAC and other regions in the world decreased
with various dynamics and amplitude. The flow with Asia/Pacific is now the largest share of traffic to/from ECAC at 6%, followed by North Atlantic and Middle East after having reached a minimum early April.
115
86
39 36 33 29
15 15 12 11 9 5 3 1 1 1 0 0 0 0 0
0 0 -1 -1 -1 -5 -5-20
0
20
40
60
80
100
120
140Tu
rkish
Airl
ines
Pega
sus H
ava
Tasi.
Wizz
Air
Air F
ranc
e
Scan
dina
vian
Airl
ines
Sys
tem
Wid
eroe
Deut
sche
Luf
than
sa
Euro
win
gs A
g
Ryan
air
Swiss
Inte
rnat
iona
l
Alita
lia
Klm
Roy
al D
utch
Airl
Easy
jet
Briti
sh A
irway
s
Vuel
ing
Airli
nes S
a
Iber
ia
Air N
ostr
um
Brus
sels
Airli
nes
Tui J
et
Jers
ey E
urop
ean
T/A
Flyb
e
Nor
weg
ian
Air S
hutt
le
Air E
urop
a
Aust
rian
Airli
nes
Tap/
Air P
ortu
gal
Aer L
ingu
s Teo
rant
a
Finn
air O
/Y
Lot-
Polis
h Ai
rline
s
El A
l-Isr
ael A
irl.
Aircraft operators in EUROCONTROL NetworkAverage Daily Variation (IFR Flights)
Mon, Tue, Wed of Week 24 vs. Week 23
80%
2%4%
5%3%0%1%1%4%
78%
6%
5%
5%2%0%0%2%2%
Share of Europe flightswith other Regions
ECACAsiaPacific'North-Atlantic''Middle-East''North-Africa''Mid-Atlantic''South-Atlantic''Southern Africa''Other Europe'
• Over the first 8 days of June, the intra-ECAC flows represented 4415 flights on average per day. Yesterday, on 8 June, the largest increase compared to the same day of the previous week was also the intra ECAC flow with 1432 additional flights.
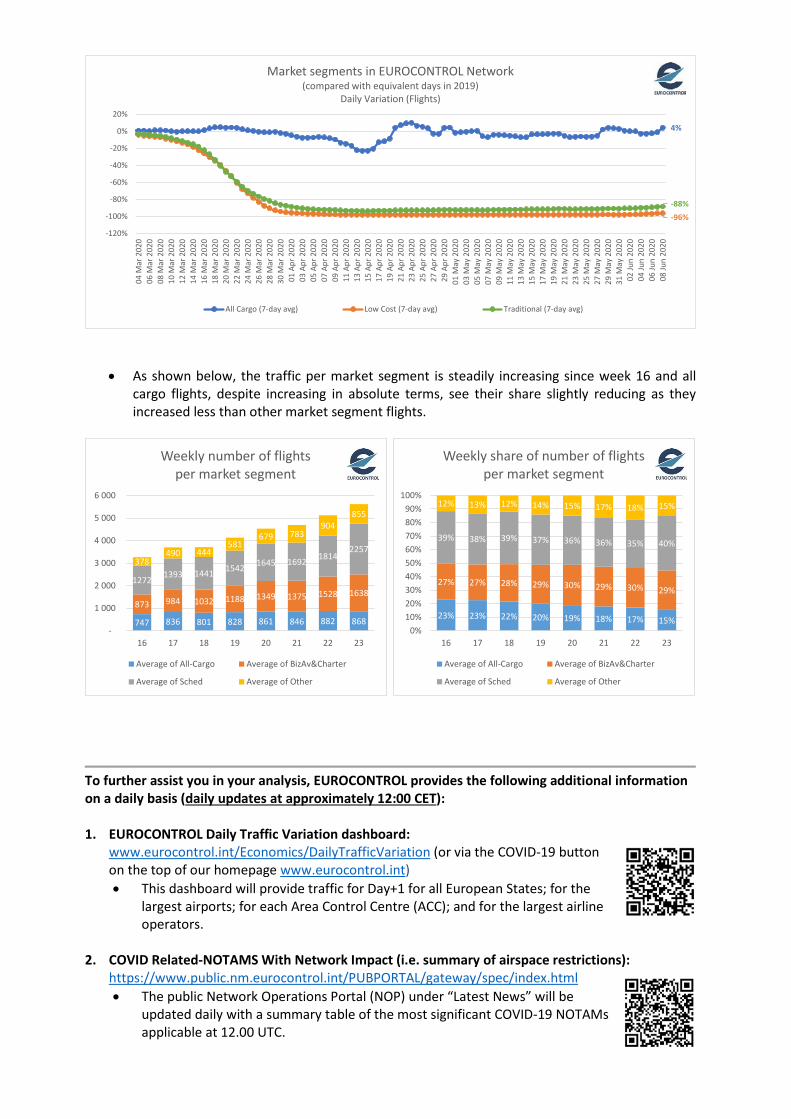
6. Market Segments (Up to 8 June 2020) • This time last year, all-cargo flights accounted for about 2% of total Departure / Arrival flights,
whereas now, it accounted for 12% on 8 June 2020. The share of scheduled traffic, which accounted for 84% reduced to 38% only.
• During the crisis, all-cargo flights remained stable at the 2019 level with a variation around the Easter period (both 2019 and 2020) while scheduled and low-cost traffic reduced by 88% (respectively 96%) during the crisis.
08/06/2020 compared with 01/06/2020
ECAC<->Total number of
flights Avg daily number
of flights Total number
of flights Variation
(Delta)Variation
(%)ECAC 35 322 4 415 5176 1432 38,2%AsiaPacific 2 934 367 329 -8 -2,4%'North-Atlantic' 2 261 283 253 9 3,7%'Middle-East' 2 108 264 243 7 3,0%'North-Africa' 681 85 93 30 47,6%'Mid-Atlantic' 185 23 18 2 12,5%'South-Atlantic' 222 28 34 0 0,0%'Southern Africa' 706 88 79 -17 -17,7%'Other Europe' 915 114 90 -8 -8,2%
Period 1-8 June 2020
27 98284%
3 81111%
7112%
1 0453%
2 81438%
2 72537%
90012%
96613%
Market Segments in EUROCONTROL NetworkDaily Traffic and share (IFR Dep/Arr Flights)
Scheduled Charter andbusiness aviation
All Cargo Other
• As shown below, the traffic per market segment is steadily increasing since week 16 and all cargo flights, despite increasing in absolute terms, see their share slightly reducing as they increased less than other market segment flights.
To further assist you in your analysis, EUROCONTROL provides the following additional information on a daily basis (daily updates at approximately 12:00 CET): 1. EUROCONTROL Daily Traffic Variation dashboard:
www.eurocontrol.int/Economics/DailyTrafficVariation (or via the COVID-19 button on the top of our homepage www.eurocontrol.int) • This dashboard will provide traffic for Day+1 for all European States; for the
largest airports; for each Area Control Centre (ACC); and for the largest airline operators.
2. COVID Related-NOTAMS With Network Impact (i.e. summary of airspace restrictions): https://www.public.nm.eurocontrol.int/PUBPORTAL/gateway/spec/index.html • The public Network Operations Portal (NOP) under “Latest News” will be
updated daily with a summary table of the most significant COVID-19 NOTAMs applicable at 12.00 UTC.
4%
-96%-88%
-120%
-100%
-80%
-60%
-40%
-20%
0%
20%
04 M
ar 2
020
06 M
ar 2
020
08 M
ar 2
020
10 M
ar 2
020
12 M
ar 2
020
14 M
ar 2
020
16 M
ar 2
020
18 M
ar 2
020
20 M
ar 2
020
22 M
ar 2
020
24 M
ar 2
020
26 M
ar 2
020
28 M
ar 2
020
30 M
ar 2
020
01 A
pr 2
020
03 A
pr 2
020
05 A
pr 2
020
07 A
pr 2
020
09 A
pr 2
020
11 A
pr 2
020
13 A
pr 2
020
15 A
pr 2
020
17 A
pr 2
020
19 A
pr 2
020
21 A
pr 2
020
23 A
pr 2
020
25 A
pr 2
020
27 A
pr 2
020
29 A
pr 2
020
01 M
ay 2
020
03 M
ay 2
020
05 M
ay 2
020
07 M
ay 2
020
09 M
ay 2
020
11 M
ay 2
020
13 M
ay 2
020
15 M
ay 2
020
17 M
ay 2
020
19 M
ay 2
020
21 M
ay 2
020
23 M
ay 2
020
25 M
ay 2
020
27 M
ay 2
020
29 M
ay 2
020
31 M
ay 2
020
02 Ju
n 20
2004
Jun
2020
06 Ju
n 20
2008
Jun
2020
Market segments in EUROCONTROL Network(compared with equivalent days in 2019)
Daily Variation (Flights)
All Cargo (7-day avg) Low Cost (7-day avg) Traditional (7-day avg)
747 836 801 828 861 846 882 868
873 984 1032 1188 1349 1375 1528 16381272 1393 1441 1542 1645 1692 1814
2257378
490 444581
679 783904
855
-
1 000
2 000
3 000
4 000
5 000
6 000
16 17 18 19 20 21 22 23
Weekly number of flightsper market segment
Average of All-Cargo Average of BizAv&Charter
Average of Sched Average of Other
23% 23% 22% 20% 19% 18% 17% 15%
27% 27% 28% 29% 30% 29% 30% 29%
39% 38% 39% 37% 36% 36% 35% 40%
12% 13% 12% 14% 15% 17% 18% 15%
0%10%20%30%40%50%60%70%80%90%
100%
16 17 18 19 20 21 22 23
Weekly share of number of flightsper market segment
Average of All-Cargo Average of BizAv&Charter
Average of Sched Average of Other