Embed Size (px)
Citation preview
- 1 -
KYOKUTO KOWA CORPORATION
Nonconsolidated Financial Statements for the year ended March 31, 2014 and Independent Auditor’s Report
- 2 -
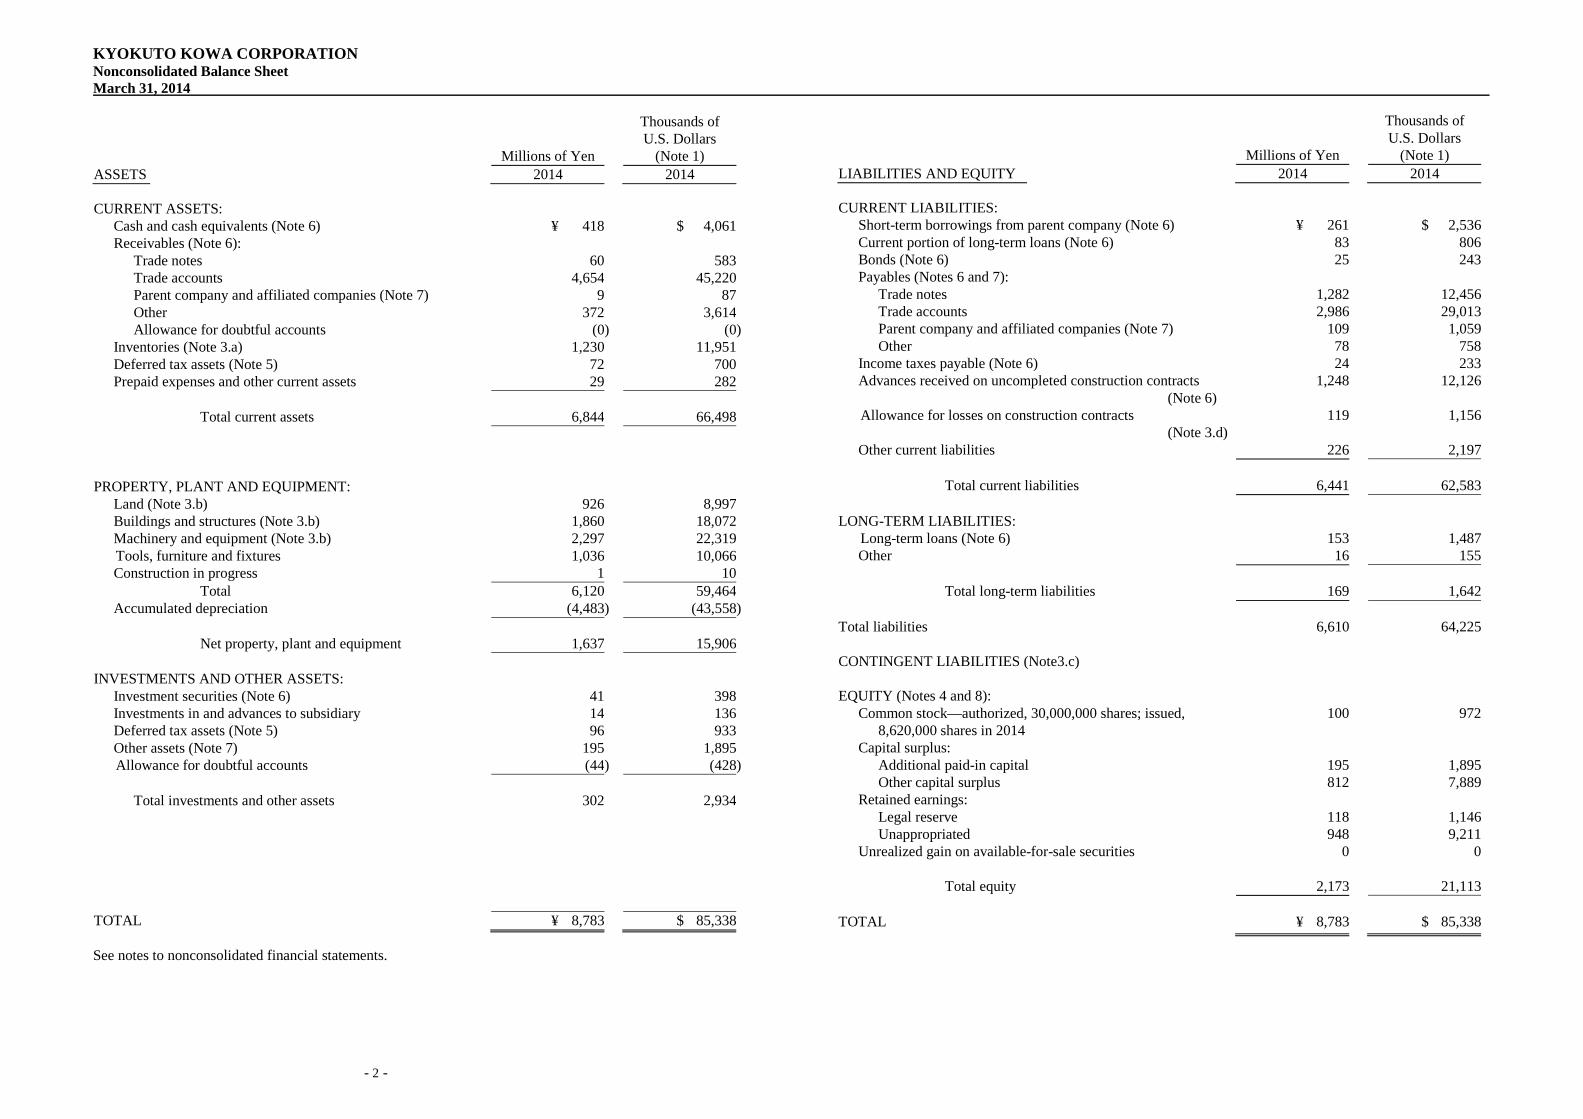
KYOKUTO KOWA CORPORATION Nonconsolidated Balance Sheet March 31, 2014
Millions of Yen
Thousands of U.S. Dollars
(Note 1) ASSETS 2014 2014 CURRENT ASSETS: Cash and cash equivalents (Note 6) ¥ 418 $ 4,061 Receivables (Note 6): Trade notes 60 583 Trade accounts 4,654 45,220 Parent company and affiliated companies (Note 7) 9 87 Other 372 3,614 Allowance for doubtful accounts (0 ) (0 ) Inventories (Note 3.a) 1,230 11,951 Deferred tax assets (Note 5) 72 700 Prepaid expenses and other current assets 29 282 Total current assets 6,844 66,498 PROPERTY, PLANT AND EQUIPMENT: Land (Note 3.b) 926 8,997 Buildings and structures (Note 3.b) 1,860 18,072 Machinery and equipment (Note 3.b) 2,297 22,319
Tools, furniture and fixtures 1,036 10,066 Construction in progress 1 10 Total 6,120 59,464 Accumulated depreciation (4,483 ) (43,558 ) Net property, plant and equipment 1,637 15,906 INVESTMENTS AND OTHER ASSETS: Investment securities (Note 6) 41 398 Investments in and advances to subsidiary 14 136 Deferred tax assets (Note 5) 96 933 Other assets (Note 7) 195 1,895 Allowance for doubtful accounts (44 ) (428 ) Total investments and other assets 302 2,934 TOTAL ¥ 8,783 $ 85,338 See notes to nonconsolidated financial statements.
Millions of Yen
Thousands of U.S. Dollars
(Note 1) LIABILITIES AND EQUITY 2014 2014 CURRENT LIABILITIES: Short-term borrowings from parent company (Note 6) ¥ 261 $ 2,536 Current portion of long-term loans (Note 6) 83 806 Bonds (Note 6) 25 243 Payables (Notes 6 and 7): Trade notes 1,282 12,456 Trade accounts 2,986 29,013 Parent company and affiliated companies (Note 7) 109 1,059 Other 78 758 Income taxes payable (Note 6) 24 233 Advances received on uncompleted construction contracts
(Note 6) 1,248 12,126
Allowance for losses on construction contracts (Note 3.d)
119 1,156
Other current liabilities 226 2,197 Total current liabilities 6,441 62,583 LONG-TERM LIABILITIES:
Long-term loans (Note 6) 153 1,487 Other 16 155 Total long-term liabilities 169 1,642 Total liabilities 6,610 64,225
CONTINGENT LIABILITIES (Note3.c)
EQUITY (Notes 4 and 8): Common stock—authorized, 30,000,000 shares; issued, 8,620,000 shares in 2014
100 972
Capital surplus: Additional paid-in capital 195 1,895 Other capital surplus 812 7,889 Retained earnings: Legal reserve 118 1,146 Unappropriated 948 9,211 Unrealized gain on available-for-sale securities 0 0 Total equity 2,173 21,113 TOTAL ¥ 8,783 $ 85,338
- 3 -
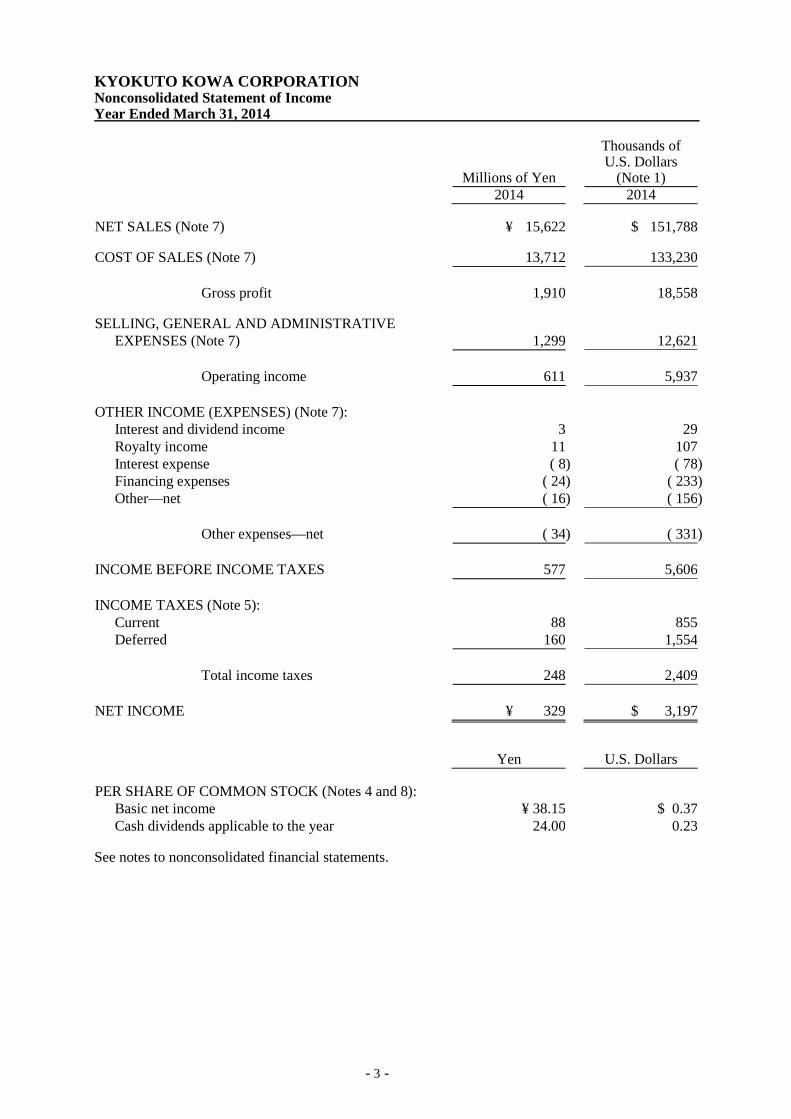
KYOKUTO KOWA CORPORATION Nonconsolidated Statement of Income Year Ended March 31, 2014
Millions of Yen
Thousands of U.S. Dollars
(Note 1) 2014 2014 NET SALES (Note 7) ¥ 15,622 $ 151,788 COST OF SALES (Note 7) 13,712 133,230 Gross profit 1,910 18,558 SELLING, GENERAL AND ADMINISTRATIVE EXPENSES (Note 7) 1,299 12,621
Operating income 611 5,937 OTHER INCOME (EXPENSES) (Note 7): Interest and dividend income 3 29 Royalty income 11 107 Interest expense ( 8 ) ( 78 ) Financing expenses ( 24 ) ( 233 ) Other—net ( 16 ) ( 156 ) Other expenses—net ( 34 ) ( 331 ) INCOME BEFORE INCOME TAXES 577 5,606 INCOME TAXES (Note 5): Current 88 855 Deferred 160 1,554 Total income taxes 248 2,409 NET INCOME ¥ 329 $ 3,197
Yen U.S. Dollars PER SHARE OF COMMON STOCK (Notes 4 and 8): Basic net income ¥ 38.15 $ 0.37 Cash dividends applicable to the year 24.00 0.23 See notes to nonconsolidated financial statements.
-4-
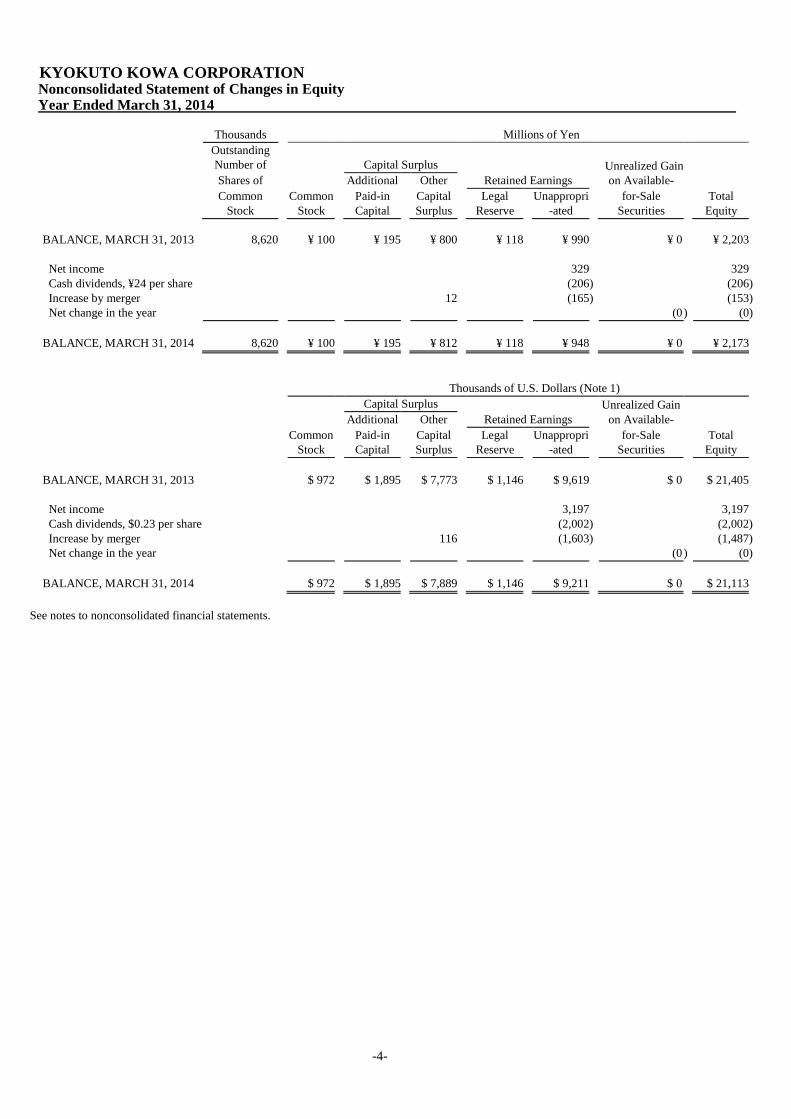
KYOKUTO KOWA CORPORATION Nonconsolidated Statement of Changes in Equity Year Ended March 31, 2014
Thousands Millions of Yen
Outstanding Number of Capital Surplus Unrealized Gain
on Available-
Shares of Additional Other Retained Earnings
Common
Stock Common
Stock Paid-in Capital
Capital Surplus
Legal Reserve
Unappropri-ated
for-Sale Securities
Total Equity
BALANCE, MARCH 31, 2013 8,620 ¥ 100 ¥ 195 ¥ 800 ¥ 118 ¥ 990 ¥ 0 ¥ 2,203
Net income 329 329 Cash dividends, ¥24 per share (206 ) (206 ) Increase by merger 12 (165 ) (153 ) Net change in the year (0 ) (0 )
BALANCE, MARCH 31, 2014 8,620 ¥ 100 ¥ 195 ¥ 812 ¥ 118 ¥ 948 ¥ 0 ¥ 2,173
Thousands of U.S. Dollars (Note 1) Capital Surplus Unrealized Gain
on Available-
Additional Other Retained Earnings
Common
Stock Paid-in Capital
Capital Surplus
Legal Reserve
Unappropri-ated
for-Sale Securities
Total Equity
BALANCE, MARCH 31, 2013 $ 972 $ 1,895 $ 7,773 $ 1,146 $ 9,619 $ 0 $ 21,405
Net income 3,197 3,197 Cash dividends, $0.23 per share (2,002 ) (2,002 ) Increase by merger 116 (1,603 ) (1,487 ) Net change in the year (0 ) (0 )
BALANCE, MARCH 31, 2014 $ 972 $ 1,895 $ 7,889 $ 1,146 $ 9,211 $ 0 $ 21,113
See notes to nonconsolidated financial statements.
-5-
KYOKUTO KOWA CORPORATION Notes to Nonconsolidated Financial Statements Year Ended March 31, 2014 1. BASIS OF PRESENTATION OF NONCONSOLIDATED FINANCIAL STATEMENTS
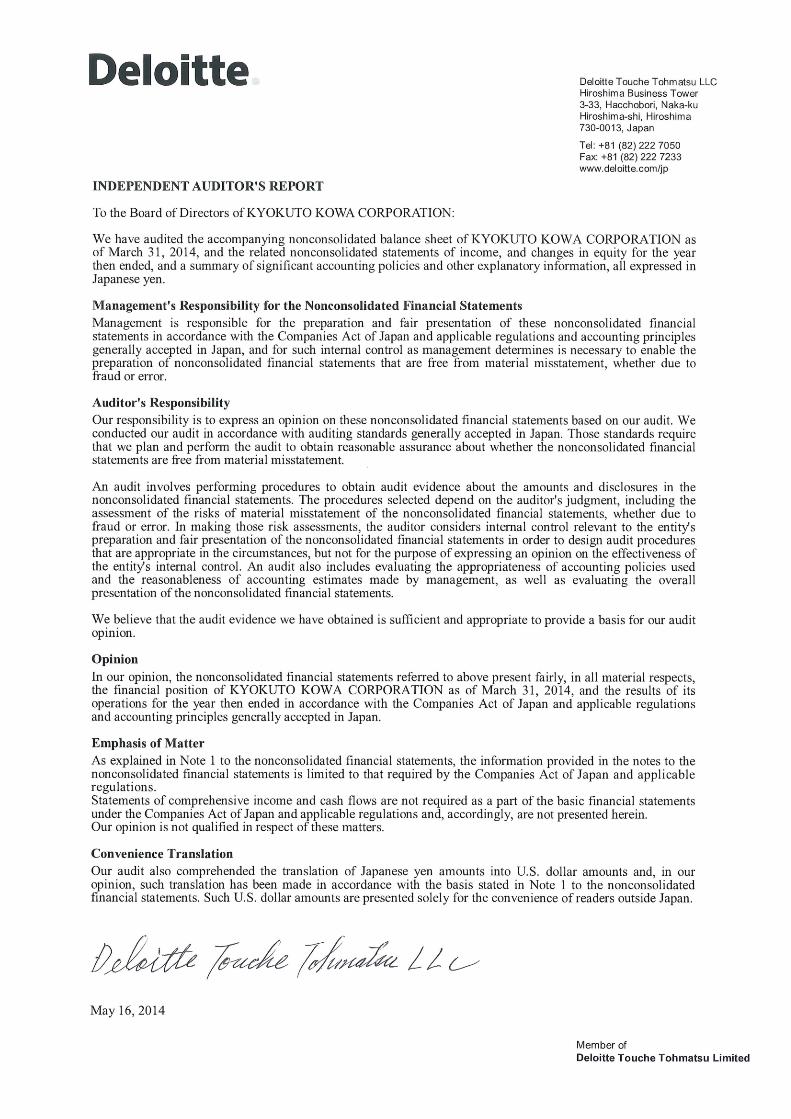
The accompanying nonconsolidated financial statements have been prepared from the accounts maintained by KYOKUTO KOWA CORPORATION (the "Company"), in accordance with the provisions set forth in the Companies Act of Japan and applicable regulations and in accordance with accounting principles generally accepted in Japan. The information provided in the notes to the nonconsolidated financial statements is limited to that required by the Companies Act of Japan and applicable regulations. Statements of comprehensive income and cash flows are not required as a part of the basic financial statements under the Companies Act of Japan and applicable regulations and, accordingly, are not presented herein. In preparing these nonconsolidated financial statements, certain reclassifications and rearrangements have been made to the Company's nonconsolidated financial statements issued domestically in order to present them in a form which is more familiar to readers outside Japan. The nonconsolidated financial statements are stated in Japanese yen, the currency of the country in which the Company is incorporated and operates. The translations of Japanese yen amounts into U.S. dollar amounts are included solely for the convenience of readers outside Japan and have been made at the rate of ¥102.92 to $1, the approximate rate of exchange at March 31, 2014. Such translations should not be construed as representations that the Japanese yen amounts could be converted into U.S. dollars at that or any other rate.
2. SUMMARY OF SIGNIFICANT ACCOUNTING POLICIES
a. Nonconsolidation—The nonconsolidated financial statements do not include the accounts of a subsidiary. Investments in the subsidiary are stated at cost.
b. Inventories—Construction projects in progress, finished products, and work in process are stated at cost as determined by the specific identification Method. Raw materials and supplies are stated at cost as determined by the moving-average method. The write-downs of inventories due to decreased profitability are reflected in the valuation of raw materials and supplies and the accompanying loss is recognized as cost of goods sold, in principle.
c. Property, plant and equipment—Property, plant and equipment are stated at cost. Depreciation is
computed by the declining-balance method based on the estimated useful lives of the assets, while the straight-line method is applied to the buildings, excluding building fixtures, acquired on or after April 1, 1998. The range of useful lives is principally from 2 to 40 years for building and structures and from 2 to 12 years for machinery and equipment and tools, furniture and fixtures.
d. Long-Lived Assets—The Company reviews it’s long lived assets for impairment whenever
events or changes in circumstance indicate the carrying amount of an asset or asset group may not be recoverable. An impairment loss would be recognized if the carrying amount of an asset or asset group exceeds the sum of the undiscounted future cash flows expected to result from the continued use and eventual disposition of the asset or asset group. The impairment loss would be measured as the amount by which the carrying amount of the asset exceeds its recoverable amount, which is the higher of the discounted cash flows from the continued use and eventual disposition of the asset or the net selling price at disposition.
e. Investment securities—Marketable and investment securities are classified and accounted for,
depending on management's intent, as available-for-sale securities. They are reported at fair value, with unrealized gains and losses, net of applicable taxes, reported in a separate component of equity. Nonmarketable available-for-sale securities are stated at cost determined by the moving-average
-6-
method. For other-than-temporary declines in fair value, investment securities are reduced to net realizable value by a charge to income.
f. Allowance for Doubtful Accounts—The allowance for doubtful accounts is provided for at an amount sufficient to cover possible losses on collection. It consists of the estimated uncollectible amount with respect to identified doubtful receivables and an amount calculated by applying the percentage of actual losses on collection experienced in the past to remaining receivables.
g. Allowance for Losses on Construction Contract—To cover losses which have a high probability
of occurring at the future time of work completion, the allowance for estimated losses is provided based on the amount of orders received and the estimated cost.
h. Retirement Benefits—The Company has a defined contribution pension plan. Retirement allowances for directors are included in Long-term liabilities (other) in the amount of ¥3 million ($29 thousand) for the year ended March 31, 2014, which would be required if all directors retired at the balance sheet date.
i. Construction Contracts— In December 2007, the Accounting Standards Board of Japan (ASBJ)
issued ASBJ Statement No. 15 "Accounting Standard for Construction Contracts" and ASBJ Guidance No. 18 "Guidance on Accounting Standard for Construction Contracts." Under this accounting standard, construction revenue and construction costs should be recognized by the percentage-of-completion method, if the outcome of a construction contract can be estimated reliably. When total construction revenue, total construction costs and the stage of completion of the contract at the balance sheet date can be reliably measured, the outcome of a construction contract is deemed to be estimated reliably. If the outcome of a construction contract cannot be reliably estimated, the completed-contract method should be applied. When it is probable that the total construction costs will exceed total construction revenue, an estimated loss on the contract should be immediately recognized by providing for a loss on construction contracts.
The revenues recognized by the percentage-of-completion method for the year ended March 31, 2014 were ¥10,334 million ($100,408 thousand).
j. Income tax—The provision for income taxes is computed based on the pretax income included
in the nonconsolidated statement of income. The asset and liability approach is used to recognize deferred tax assets and liabilities for the expected future tax consequences of temporary differences between the carrying amounts and the tax bases of assets and liabilities. Deferred taxes are measured by applying currently enacted income tax rates to the temporary differences.
The Company's parent company files a tax return under the consolidated corporate-tax system, which allows companies to base tax payments on the combined profits or losses of the parent company and its wholly owned domestic subsidiaries. The Company is included in the consolidated corporate-tax system.
k. Per Share Information—Basic net income per share is computed by dividing net income
available to common shareholders by the weighted-average number of common shares outstanding for the period.
Cash dividends per share presented in the accompanying nonconsolidated statement of income are dividends applicable to the fiscal year, including dividends to be paid after the end of the year.
-7-
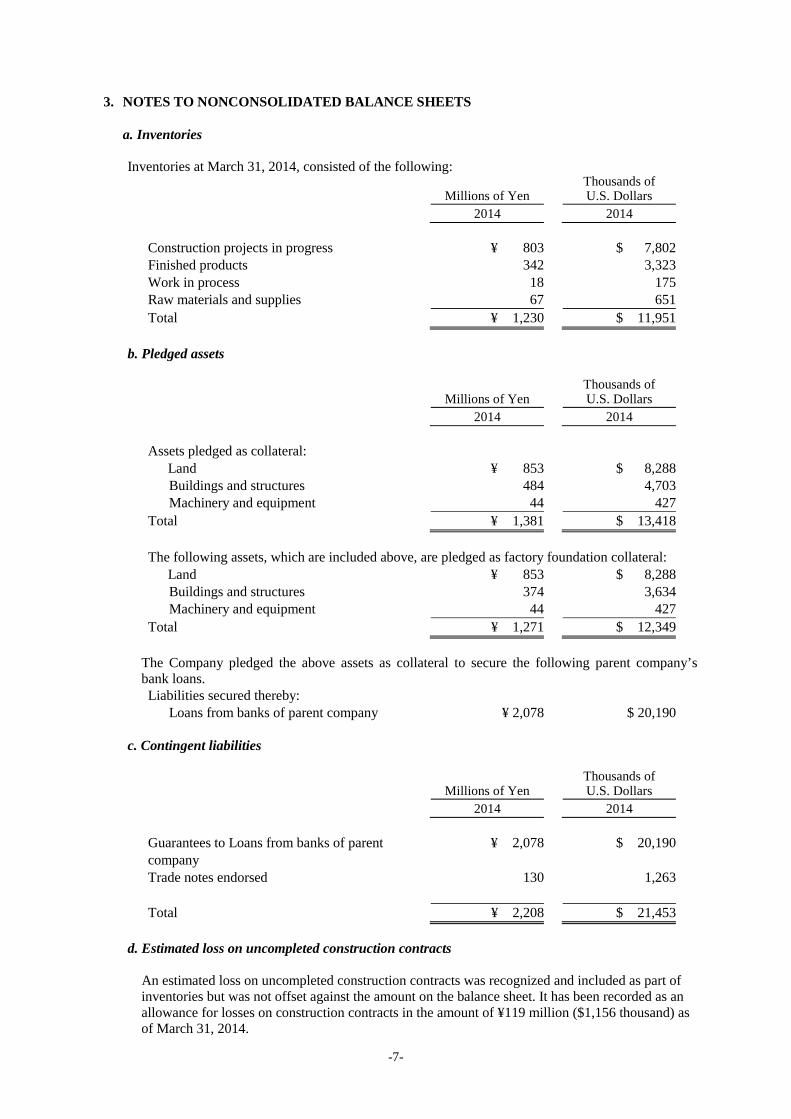
3. NOTES TO NONCONSOLIDATED BALANCE SHEETS
a. Inventories Inventories at March 31, 2014, consisted of the following:
Millions of Yen
Thousands of U.S. Dollars
2014 2014 Construction projects in progress ¥ 803 $ 7,802 Finished products 342 3,323 Work in process 18 175 Raw materials and supplies 67 651 Total ¥ 1,230 $ 11,951
b. Pledged assets
Millions of Yen
Thousands of U.S. Dollars
2014 2014 Assets pledged as collateral: Land ¥ 853 $ 8,288 Buildings and structures 484 4,703 Machinery and equipment 44 427 Total ¥ 1,381 $ 13,418
The following assets, which are included above, are pledged as factory foundation collateral: Land ¥ 853 $ 8,288 Buildings and structures 374 3,634 Machinery and equipment 44 427 Total ¥ 1,271 $ 12,349
The Company pledged the above assets as collateral to secure the following parent company’s bank loans. Liabilities secured thereby: Loans from banks of parent company ¥ 2,078 $ 20,190
c. Contingent liabilities
Millions of Yen Thousands of
U.S. Dollars
2014 2014 Guarantees to Loans from banks of parent company
¥ 2,078 $ 20,190
Trade notes endorsed 130 1,263 Total ¥ 2,208 $ 21,453
d. Estimated loss on uncompleted construction contracts An estimated loss on uncompleted construction contracts was recognized and included as part of
inventories but was not offset against the amount on the balance sheet. It has been recorded as an allowance for losses on construction contracts in the amount of ¥119 million ($1,156 thousand) as of March 31, 2014.
-8-
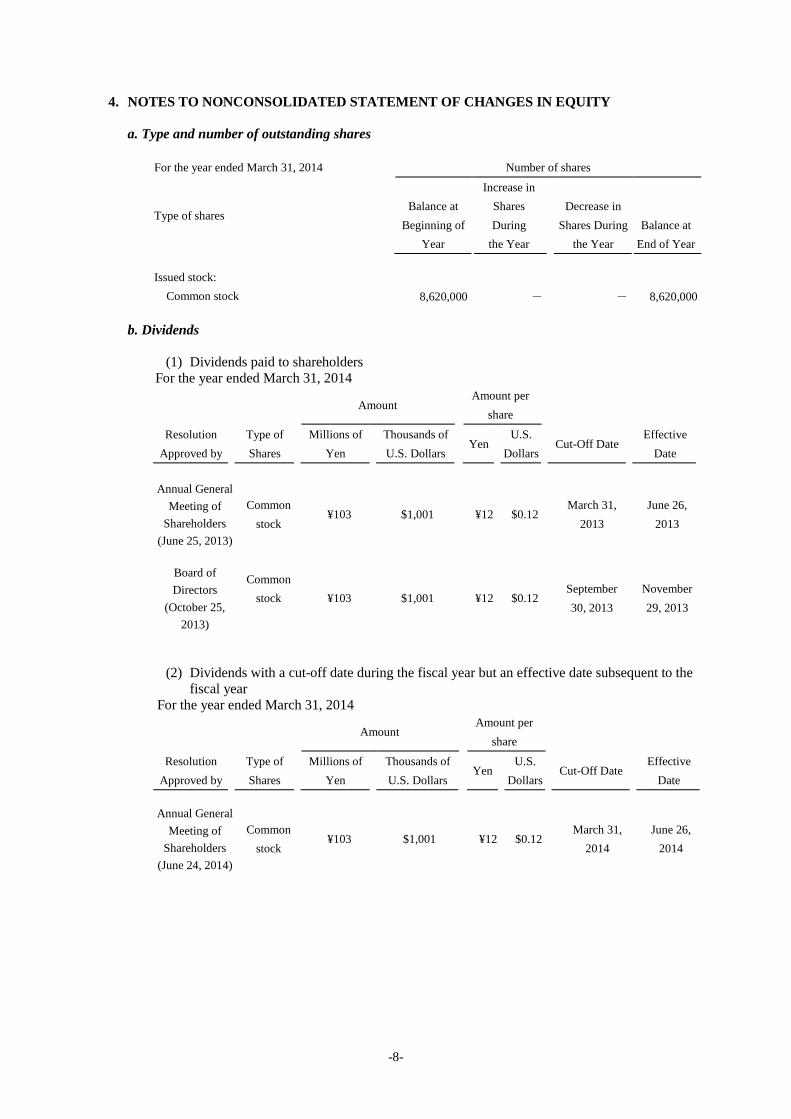
4. NOTES TO NONCONSOLIDATED STATEMENT OF CHANGES IN EQUITY a. Type and number of outstanding shares
For the year ended March 31, 2014 Number of shares
Type of shares
Balance at Beginning of
Year
Increase in Shares During
the Year
Decrease in Shares During
the Year Balance at
End of Year
Issued stock: Common stock 8,620,000 - - 8,620,000
b. Dividends
(1) Dividends paid to shareholders
For the year ended March 31, 2014
Amount Amount per
share
Resolution Approved by
Type of Shares
Millions of Yen
Thousands of U.S. Dollars
Yen U.S. Dollars
Cut-Off Date
Effective Date
Annual General
Meeting of Shareholders
(June 25, 2013)
Common stock
¥103 $1,001 ¥12 $0.12 March 31,
2013
June 26, 2013
Board of Directors
(October 25, 2013)
Common stock
¥103 $1,001 ¥12 $0.12
September 30, 2013
November 29, 2013
(2) Dividends with a cut-off date during the fiscal year but an effective date subsequent to the fiscal year
For the year ended March 31, 2014
Amount Amount per
share
Resolution Approved by
Type of Shares
Millions of Yen
Thousands of U.S. Dollars
Yen U.S. Dollars
Cut-Off Date
Effective Date
Annual General
Meeting of Shareholders
(June 24, 2014)
Common stock
¥103 $1,001 ¥12 $0.12 March 31,
2014
June 26, 2014
-9-
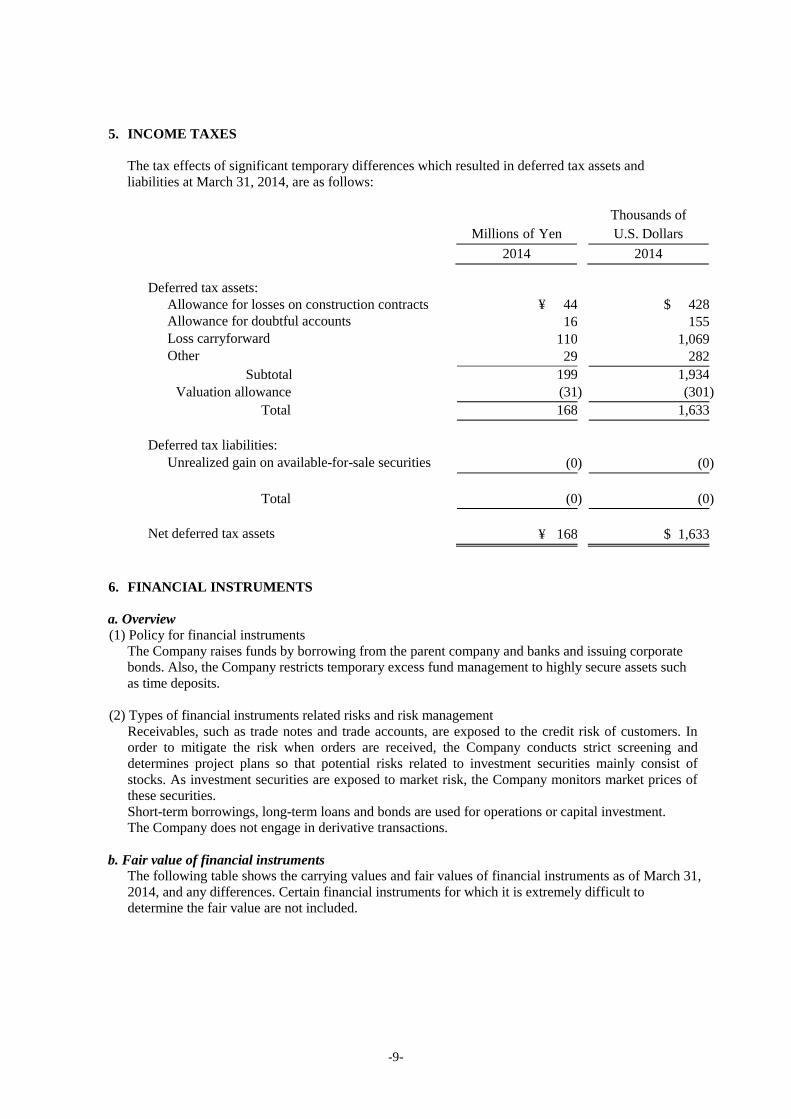
5. INCOME TAXES
The tax effects of significant temporary differences which resulted in deferred tax assets and liabilities at March 31, 2014, are as follows:
Millions of Yen Thousands of
U.S. Dollars 2014 2014
Deferred tax assets: Allowance for losses on construction contracts ¥ 44 $ 428 Allowance for doubtful accounts 16 155 Loss carryforward 110 1,069 Other 29 282
Subtotal 199 1,934 Valuation allowance (31 ) (301 ) Total 168 1,633 Deferred tax liabilities: Unrealized gain on available-for-sale securities (0 ) (0 ) Total (0 ) (0 ) Net deferred tax assets ¥ 168 $ 1,633
6. FINANCIAL INSTRUMENTS
a. Overview (1) Policy for financial instruments
The Company raises funds by borrowing from the parent company and banks and issuing corporate bonds. Also, the Company restricts temporary excess fund management to highly secure assets such as time deposits.
(2) Types of financial instruments related risks and risk management Receivables, such as trade notes and trade accounts, are exposed to the credit risk of customers. In order to mitigate the risk when orders are received, the Company conducts strict screening and determines project plans so that potential risks related to investment securities mainly consist of stocks. As investment securities are exposed to market risk, the Company monitors market prices of these securities. Short-term borrowings, long-term loans and bonds are used for operations or capital investment. The Company does not engage in derivative transactions.
b. Fair value of financial instruments
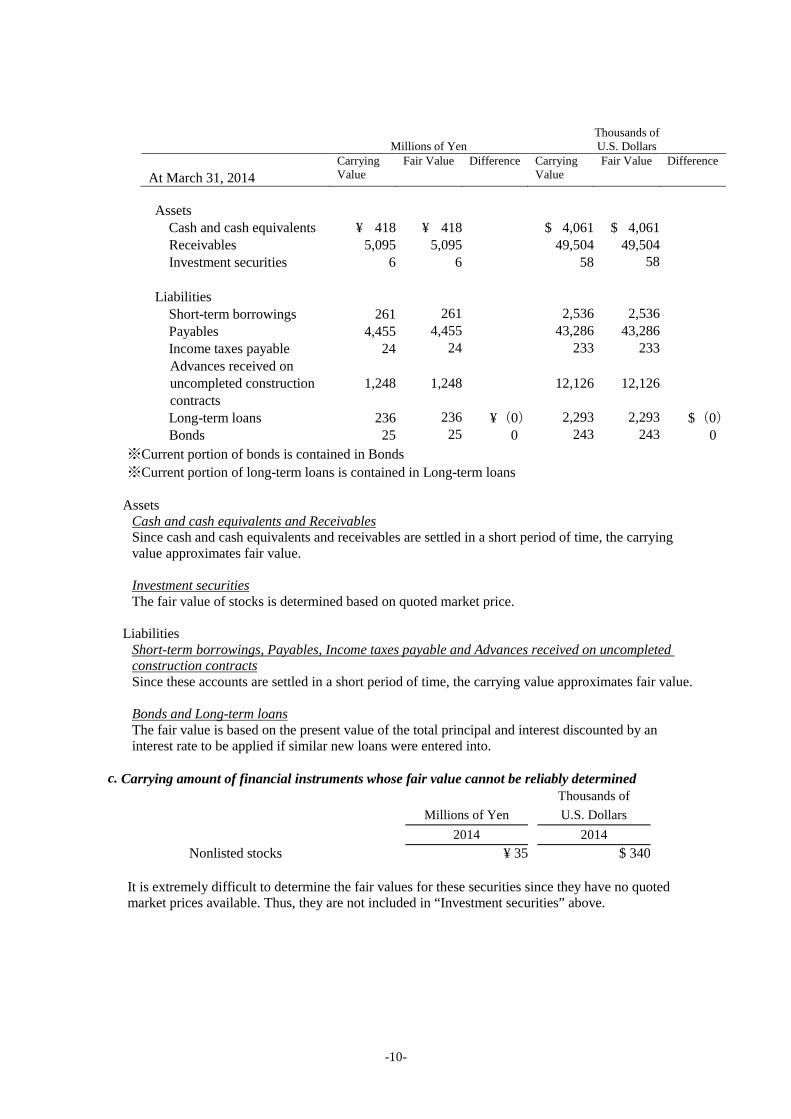
The following table shows the carrying values and fair values of financial instruments as of March 31, 2014, and any differences. Certain financial instruments for which it is extremely difficult to determine the fair value are not included.
-10-
Millions of Yen
Thousands of U.S. Dollars
At March 31, 2014
Carrying Value
Fair Value Difference Carrying Value
Fair Value Difference
Assets
Cash and cash equivalents ¥ 418 ¥ 418 $ 4,061 $ 4,061 Receivables 5,095 5,095 49,504 49,504 Investment securities 6 6 58 58 Liabilities
Short-term borrowings 261 261 2,536 2,536 Payables 4,455 4,455 43,286 43,286 Income taxes payable 24 24 233 233 Advances received on uncompleted construction contracts
1,248 1,248 12,126 12,126
Long-term loans 236 236 ¥(0) 2,293 2,293 $(0) Bonds 25 25 0 243 243 0
※Current portion of bonds is contained in Bonds ※Current portion of long-term loans is contained in Long-term loans
Assets Cash and cash equivalents and Receivables Since cash and cash equivalents and receivables are settled in a short period of time, the carrying value approximates fair value. Investment securities The fair value of stocks is determined based on quoted market price.
Liabilities Short-term borrowings, Payables, Income taxes payable and Advances received on uncompleted construction contracts Since these accounts are settled in a short period of time, the carrying value approximates fair value. Bonds and Long-term loans The fair value is based on the present value of the total principal and interest discounted by an interest rate to be applied if similar new loans were entered into.
c. Carrying amount of financial instruments whose fair value cannot be reliably determined
Millions of Yen
Thousands of U.S. Dollars
2014 2014 Nonlisted stocks ¥ 35 $ 340
It is extremely difficult to determine the fair values for these securities since they have no quoted market prices available. Thus, they are not included in “Investment securities” above.
-11-
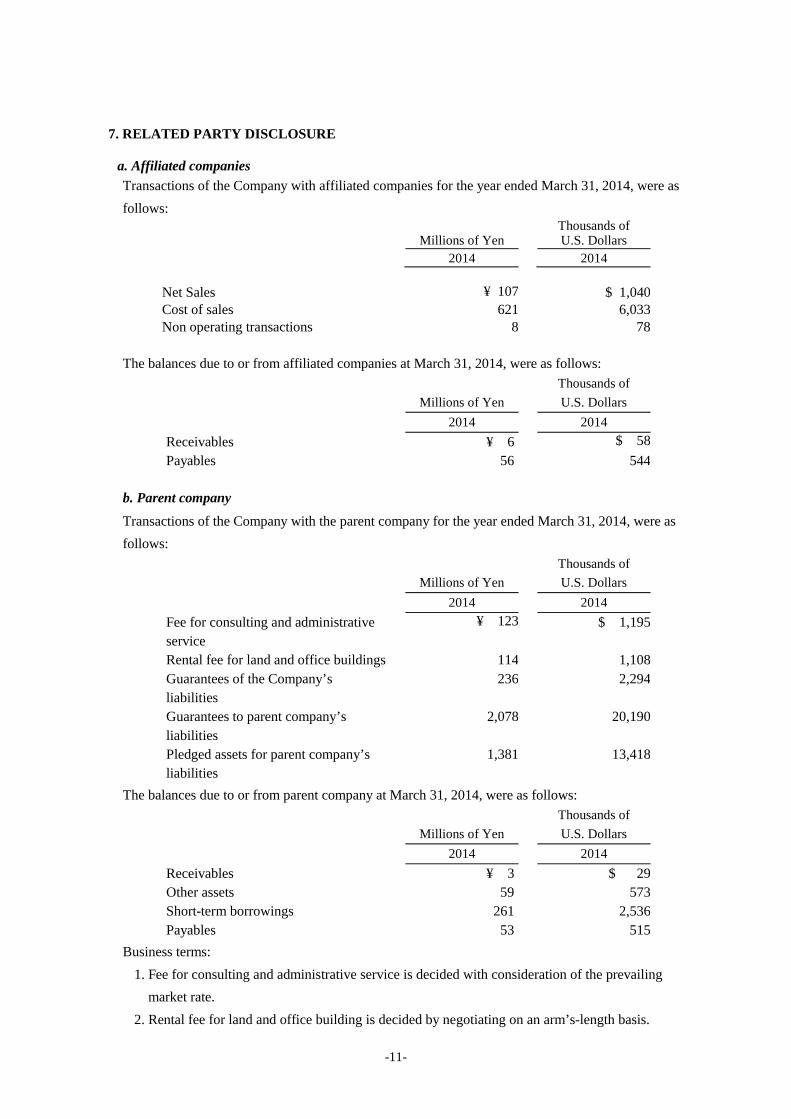
7. RELATED PARTY DISCLOSURE
a. Affiliated companies Transactions of the Company with affiliated companies for the year ended March 31, 2014, were as follows:
Millions of Yen
Thousands of U.S. Dollars
2014 2014
Net Sales ¥ 107 $ 1,040 Cost of sales 621 6,033 Non operating transactions 8 78
The balances due to or from affiliated companies at March 31, 2014, were as follows:
Millions of Yen
Thousands of U.S. Dollars
2014 2014 Receivables ¥ 6 $ 58 Payables 56 544
b. Parent company Transactions of the Company with the parent company for the year ended March 31, 2014, were as follows:
Millions of Yen
Thousands of U.S. Dollars
2014 2014 Fee for consulting and administrative service
¥ 123 $ 1,195
Rental fee for land and office buildings 114 1,108 Guarantees of the Company’s liabilities
236 2,294
Guarantees to parent company’s liabilities
2,078 20,190
Pledged assets for parent company’s liabilities
1,381 13,418
The balances due to or from parent company at March 31, 2014, were as follows:
Millions of Yen Thousands of
U.S. Dollars 2014 2014
Receivables ¥ 3 $ 29 Other assets 59 573 Short-term borrowings 261 2,536 Payables 53 515
Business terms: 1. Fee for consulting and administrative service is decided with consideration of the prevailing
market rate. 2. Rental fee for land and office building is decided by negotiating on an arm’s-length basis.
-12-
3. The parent company uses a Cash Management System (CMS) for their subsidiaries to control the cash surplus and spend their money efficiently at the group level. The interest rates on loans within the CMS are generally decided based on the current market interest rates available. Because the loans within the group are made as needed, the amounts of the transactions are omitted in the table above.
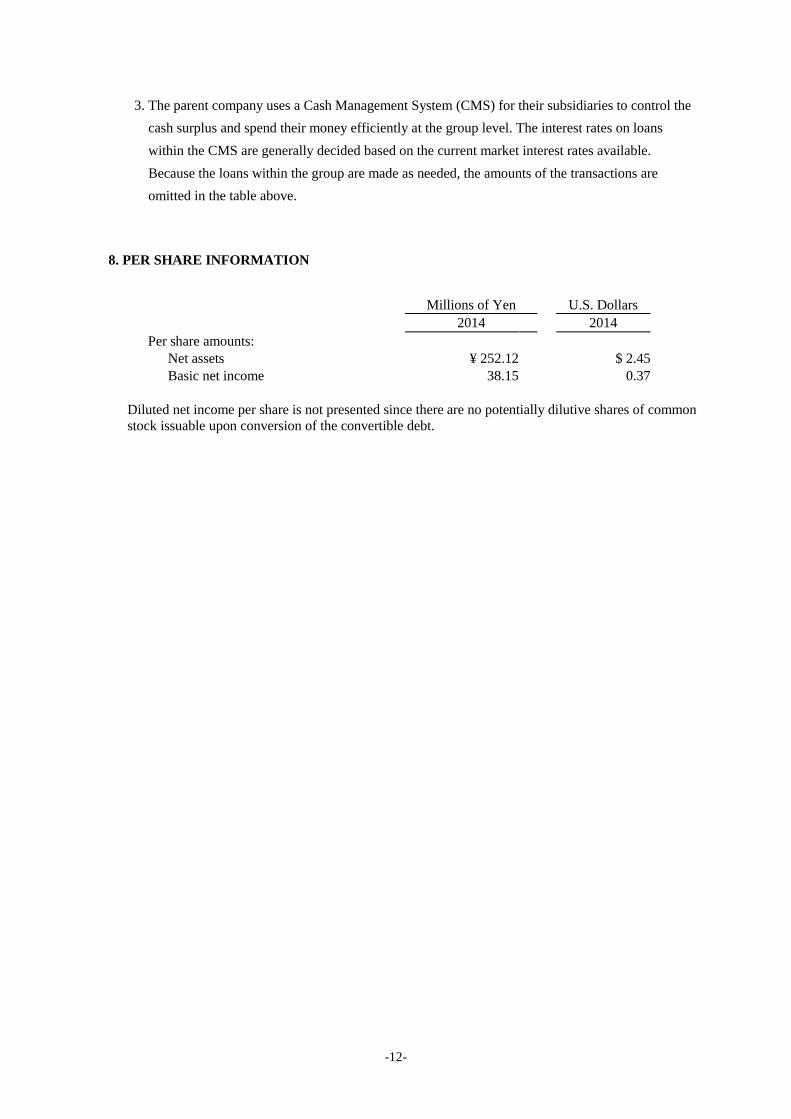
8. PER SHARE INFORMATION
Millions of Yen
U.S. Dollars
2014 2014 Per share amounts: Net assets ¥ 252.12 $ 2.45 Basic net income 38.15 0.37
Diluted net income per share is not presented since there are no potentially dilutive shares of common stock issuable upon conversion of the convertible debt.