Embed Size (px)
Citation preview
Analytical Study on Evaluation of Subgrade Modulus Using Portable FWD
T. Kubodera & K. Himeno Department of Civil Engineering, Chuo Universiq, Tokyo, Japan
E. Sekine Railway Technical Research Institute, Tokyo, Japan
ABSTRACT: In a portable FWD test, the variations on the loading time and its integration influences the estimated elastic modulus and K-value of subgrade even if the peak load is the same. The aforementioned could not be found from the impact numerical FEM analysis of elastic model for the portable FWD. In this research, analytical study has been carried out to investigate the influence of various parameters, such as the mass and the drop height of the falling weight, on the loading time and its integration from the numerical analysis of visco- elastic model.
KEY WORDS: Portable FWD, FEM, visco-elasticity, impact analysis.
1 INTRODUCTION
The portable FWD is a device that measures time histories of load and deflection caused by a falling weight onto a loading plate. The elastic modulus E and the K-value of subgrade are estimated from the peak load and the peak deflection at the same time. A portable FWD test can be used to estimate the rigidity of the subgrade in insufficient spaces where it is not possible to use a FWD. Compared with the static plate loading test used for evaluation of bearing capacity of subgrade, the portable FWD test does not require setting up a large scale reaction device, and the test time is short and no labour-intensive.
In a portable FWD test, the mass and the drop height of the falling weight can be adjusted to meet the bearing capacity of the subgrade. Therefore, it is possible to generate a reference deflection to define the K-value with the static plate loading test of the road (JSCE, 2002). It is desirable that a portable FWD test can be carried out to obtain the same evaluation as the static plate loading test. However, although the peak load is the same, the peak deflection from the portable FWD test is smaller than that from the static plate loading test. As a result, the portable FWD test gives larger K-values than the plate loading test due to its dynamic effect, especially for more higher bearing capacity of subgrades.
In a FWD test, it is noted that the loading time (the time being from zero to the peak load) and its integration (the integration against the loading time) varies with the mass and the drop height of the falling weight as well as the rigidity of rubber buffer even if the peak load is the same. Accordingly, the peak deflection is different, and it has influence on the estimated elastic modulus and K-value of subgrade (Himeno etal., 1996).
To investigate how the rubber buffer rigidity influences the time histories of load and deflection in a portable FWD test, the impact analysis was carried out using the elastic model (Kubodera etal., 2001). It was found that the time histories of load and deflection increased and decreased at the same ratio. The change in K-value was not observed. On the other hand, the difference of peak deflection was not seen for an identical peak load even if the loading time was different. Thus, the result obtained from the impact analysis has no difference compared with that of static analysis using the elastic model.
The purpose of this study is to investigate the changes on the influence of loading time on the peak deflection under the identical peak load using a visco-elastic material model to characterize the subgrade and rubber buffer. Furthermore, varying the mass and the drop height of the falling weight, they have influences on the loading time to be determined with the numerical impact analysis. Furthermore, varying the mass and the drop height of the falling weight, they have influences on the loading time to be determined with the numerical impact analysis.
2 NUMERICAL SIMULATION
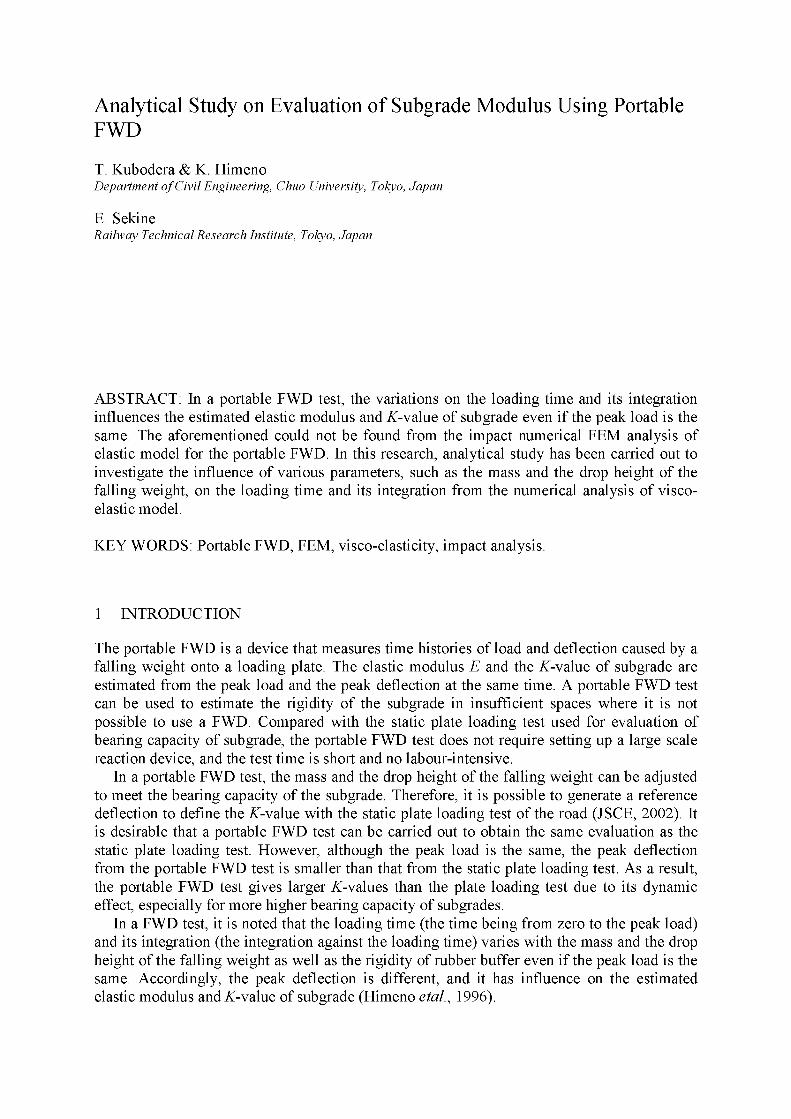
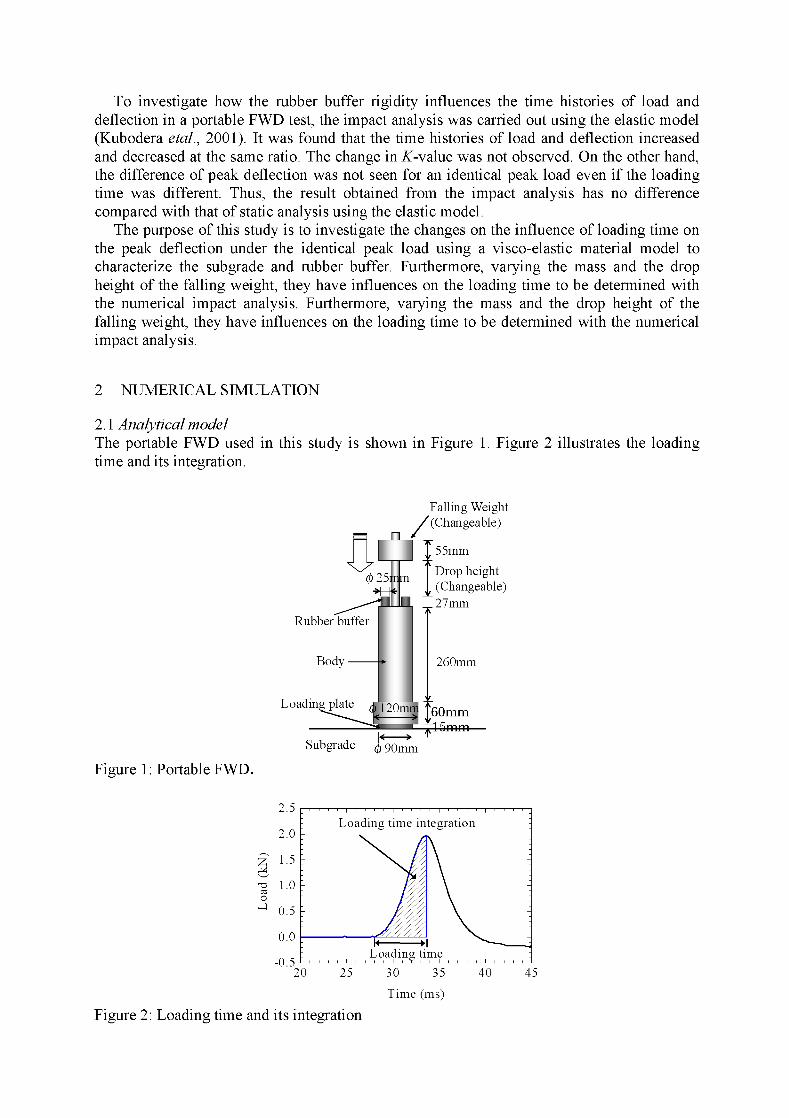
2.1 Analytical model The portable FWD used in this study is shown in Figure 1. Figure 2 illustrates the loading time and its integration.
Falling Weight /(changeable)
Figure 1 : Portable FWD.
Loading time integration
Time (ms)
Figure 2: Loading time and its integration
The E modulus and K-value in practical can be calculated by equations (1) and (2). When the sensor is at the center of loading plate, the E modulus for radius being equal to zero can be expressed in the form of equation (1) with help of Burmister theory.
where E is the elastic modulus (MPa), K is the coefficient of subgrade reaction ( G N I ~ ~ ) , P is the peak load (N), D is the peak deflection (mm), a is the radius of loading plate (mm), A is the area of loading (mm2) and v is the Poisson's ratio.
When the E modulus and the K-value of the subgrade considered are calculated from equations (1) and (2), it is confirmed that there exists difference within the estimated values for different peak deflection under the identical peak load.
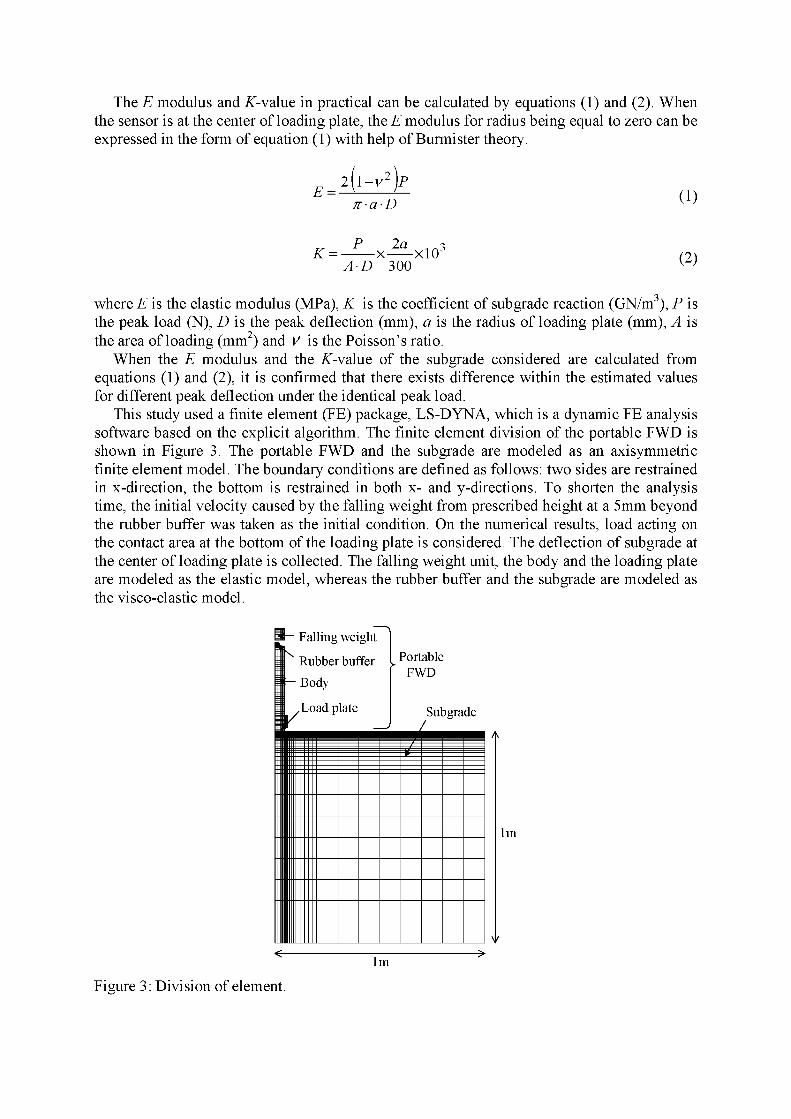
This study used a finite element (FE) package, LS-DYNA, which is a dynamic FE analysis software based on the explicit algorithm. The finite element division of the portable FWD is shown in Figure 3. The portable FWD and the subgrade are modeled as an axisymmetric finite element model. The boundary conditions are defined as follows: two sides are restrained in x-direction, the bottom is restrained in both x- and y-directions. To shorten the analysis time, the initial velocity caused by the falling weight from prescribed height at a 5mm beyond the rubber buffer was taken as the initial condition. On the numerical results, load acting on the contact area at the bottom of the loading plate is considered. The deflection of subgrade at the center of loading plate is collected. The falling weight unit, the body and the loading plate are modeled as the elastic model, whereas the rubber buffer and the subgrade are modeled as the visco-elastic model.
Figure 3 : Division
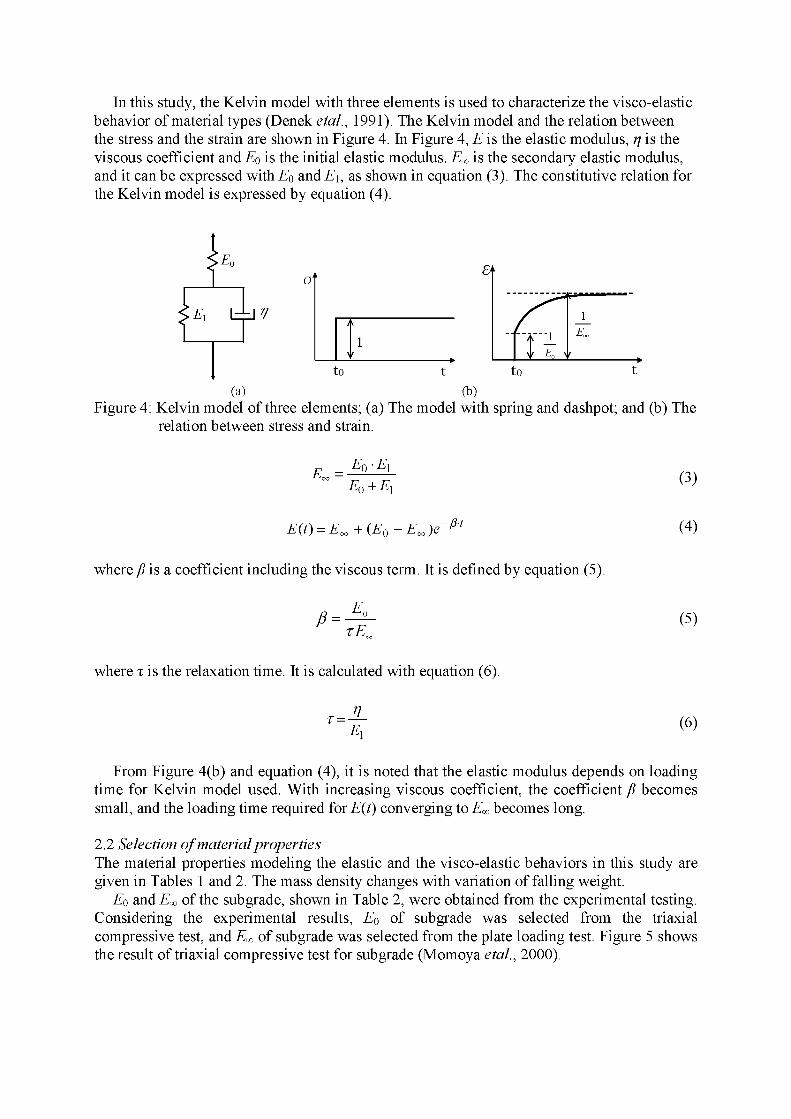
In this study, the Kelvin model with three elements is used to characterize the visco-elastic behavior of material types (Denek etal., 1991). The Kelvin model and the relation between the stress and the strain are shown in Figure 4. In Figure 4, E is the elastic modulus, q is the viscous coefficient and Eo is the initial elastic modulus. Em is the secondary elastic modulus, and it can be expressed with Eo and El, as shown in equation (3). The constitutive relation for the Kelvin model is expressed by equation (4).
1 t o t t o t
(a> (b> Figure 4: Kelvin model of three elements; (a) The model with spring and dashpot; and (b) The
relation between stress and strain.
where p is a coefficient including the viscous term. It is defined by equation (5).
where z is the relaxation time. It is calculated with equation (6).
From Figure 4(b) and equation (4), it is noted that the elastic modulus depends on loading time for Kelvin model used. With increasing viscous coefficient, the coefficient p becomes small, and the loading time required for E(t) converging to Em becomes long.
2.2 Selection of material properties The material properties modeling the elastic and the visco-elastic behaviors in this study are given in Tables 1 and 2. The mass density changes with variation of falling weight.
Eo and Em of the subgrade, shown in Table 2, were obtained from the experimental testing. Considering the experimental results, Eo of subgrade was selected from the triaxial compressive test, and Em of subgrade was selected from the plate loading test. Figure 5 shows the result of triaxial compressive test for subgrade (Momoya etal., 2000).
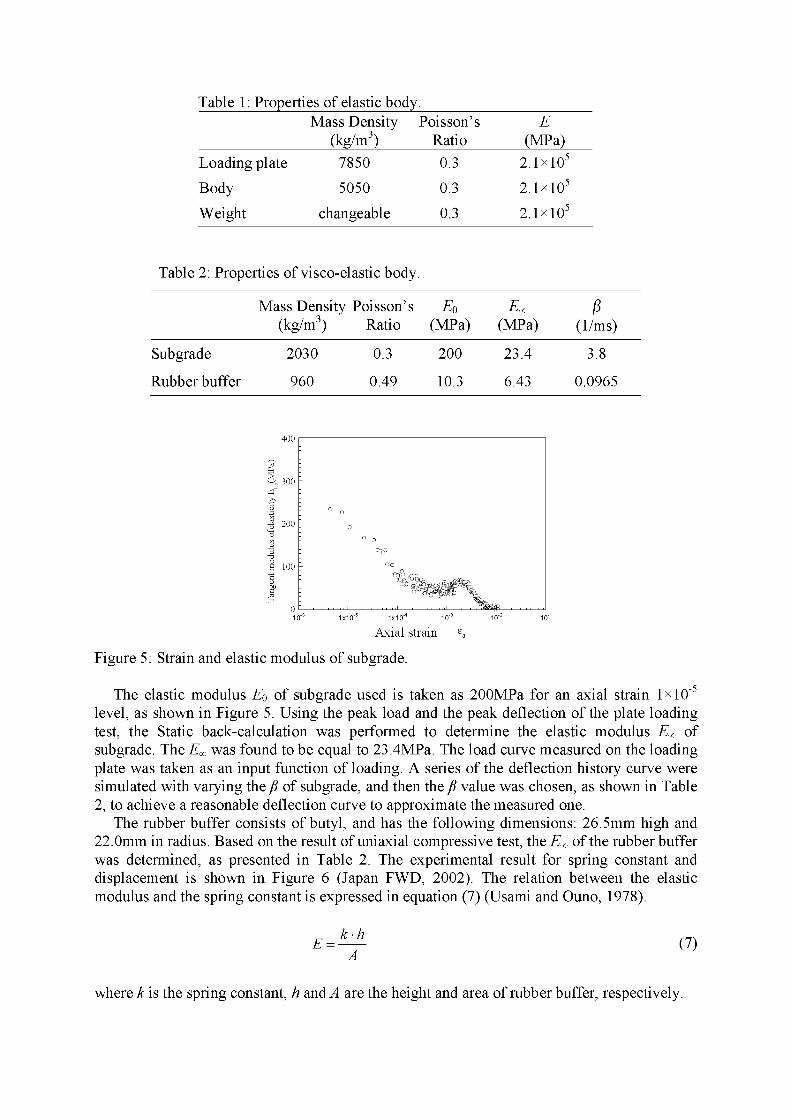
Table 1 : Properties of elastic bodv Mass Density Poisson's E
(k&) Ratio ( m a ) Loading plate 7850 0.3 2.1 x lo5
Body 5050 0.3 2.1 x lo5
Weight changeable 0.3 2.1 x lo5
Table 2: Properties of visco-elastic body.
Mass Density Poisson's Eo Em f l (kg/m3) Ratio (MPa) (MPa) (llms)
Subgrade 2030 0.3 200 23.4 3.8
Rubber buffer 960 0.49 10.3 6.43 0.0965
Axial strain
Figure 5: Strain and elastic modulus of subgrade.
The elastic modulus Eo of subgrade used is taken as 200MPa for an axial strain 1x10-~ level, as shown in Figure 5. Using the peak load and the peak deflection of the plate loading test, the Static back-calculation was performed to determine the elastic modulus Em of subgrade. The Em was found to be equal to 23.4MPa. The load curve measured on the loading plate was taken as an input function of loading. A series of the deflection history curve were simulated with varying the p of subgrade, and then the p value was chosen, as shown in Table 2, to achieve a reasonable deflection curve to approximate the measured one.
The rubber buffer consists of butyl, and has the following dimensions: 26.5mm high and 22.0mm in radius. Based on the result of uniaxial compressive test, the Em of the rubber buffer was determined, as presented in Table 2. The experimental result for spring constant and displacement is shown in Figure 6 (Japan FWD, 2002). The relation between the elastic modulus and the spring constant is expressed in equation (7) (Usami and Ouno, 1978).
where k is the spring constant, h and A are the height and area of rubber buffer, respectively.
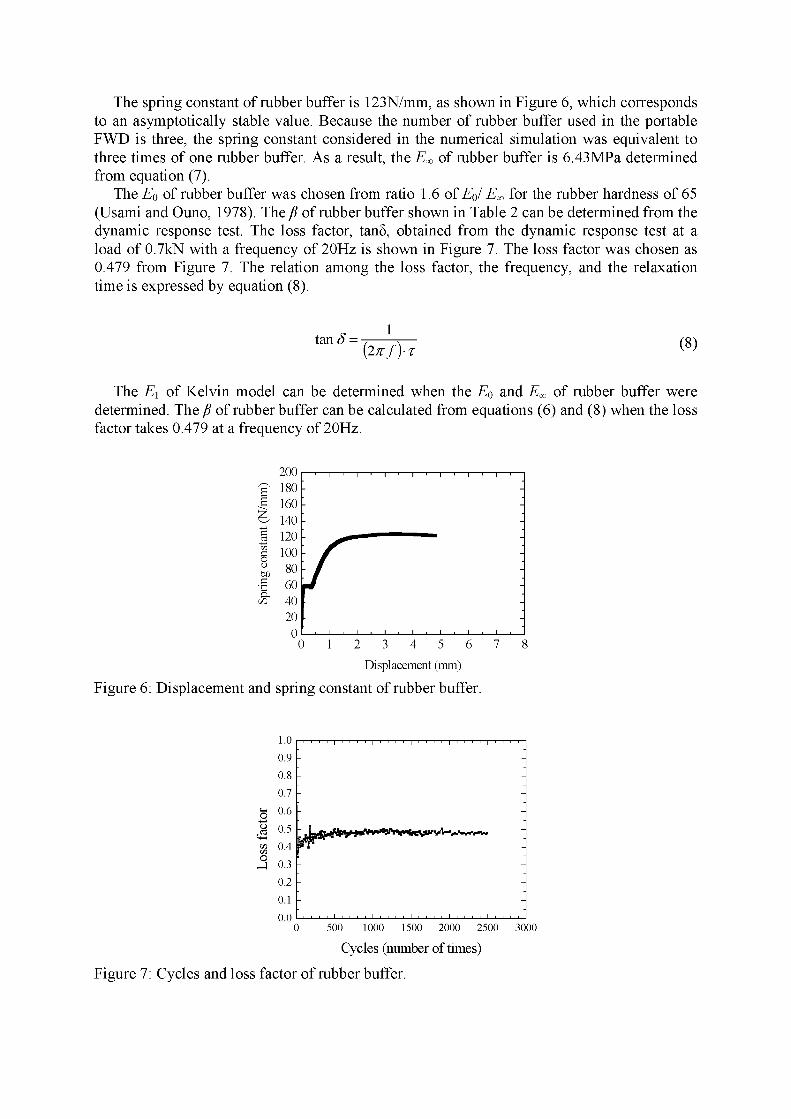
The spring constant of rubber buffer is 123N/mm, as shown in Figure 6, which corresponds to an asymptotically stable value. Because the number of rubber buffer used in the portable FWD is three, the spring constant considered in the numerical simulation was equivalent to three times of one rubber buffer. As a result, the Em of rubber buffer is 6.43MPa determined from equation (7).
The Eo of rubber buffer was chosen from ratio 1.6 of Eol Em for the rubber hardness of 65 (Usami and Ouno, 1978). The p of rubber buffer shown in Table 2 can be determined from the dynamic response test. The loss factor, tan& obtained from the dynamic response test at a load of 0.7kN with a frequency of 20Hz is shown in Figure 7. The loss factor was chosen as 0.479 from Figure 7. The relation among the loss factor, the frequency, and the relaxation time is expressed by equation (8).
tan S = 1
( 2 n f 1. t7
The El of Kelvin model can be determined when the Eo and Em of rubber buffer were determined. The p of rubber buffer can be calculated from equations (6) and (8) when the loss factor takes 0.479 at a frequency of 20Hz.
asplacement (mm)
Figure 6: Displacement and spring constant of rubber buffer.
Cycles (number of times)
Figure 7: Cycles and loss factor of rubber buffer
3 COMPARISON BETWEEN MEASUREMENT AND ANALYSIS
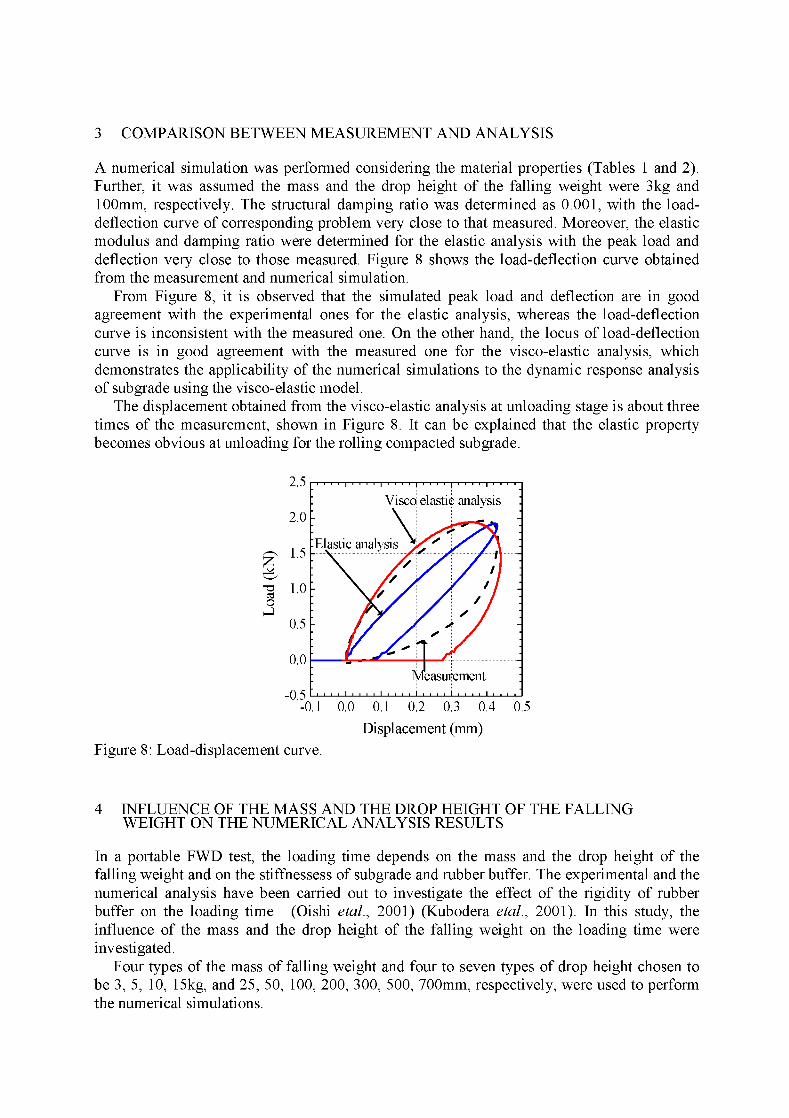
A numerical simulation was performed considering the material properties (Tables 1 and 2). Further, it was assumed the mass and the drop height of the falling weight were 3kg and 100mm, respectively. The structural damping ratio was determined as 0.001, with the load- deflection curve of corresponding problem very close to that measured. Moreover, the elastic modulus and damping ratio were determined for the elastic analysis with the peak load and deflection very close to those measured. Figure 8 shows the load-deflection curve obtained from the measurement and numerical simulation.
From Figure 8, it is observed that the simulated peak load and deflection are in good agreement with the experimental ones for the elastic analysis, whereas the load-deflection curve is inconsistent with the measured one. On the other hand, the locus of load-deflection curve is in good agreement with the measured one for the visco-elastic analysis, which demonstrates the applicability of the numerical simulations to the dynamic response analysis of subgrade using the visco-elastic model.
The displacement obtained from the visco-elastic analysis at unloading stage is about three times of the measurement, shown in Figure 8. It can be explained that the elastic property becomes obvious at unloading for the rolling compacted subgrade.
Visco elastic analysis 4 2.0 1 \ -
Elastic analysis
I \ Displacement (mm)
Figure 8: Load-displacement curve.
4 INFLUENCE OF THE MASS AND THE DROP HEIGHT OF THE FALLING WEIGHT ON THE NUMERICAL ANALYSIS RESULTS
In a portable FWD test, the loading time depends on the mass and the drop height of the falling weight and on the stiffnessess of subgrade and rubber buffer. The experimental and the numerical analysis have been carried out to investigate the effect of the rigidity of rubber buffer on the loading time (Oishi etal., 2001) (Kubodera etal., 2001). In this study, the influence of the mass and the drop height of the falling weight on the loading time were investigated.
Four types of the mass of falling weight and four to seven types of drop height chosen to be 3, 5, 10, 15kg, and 25, 50, 100, 200, 300, 500, 700mm, respectively, were used to perform the numerical simulations.
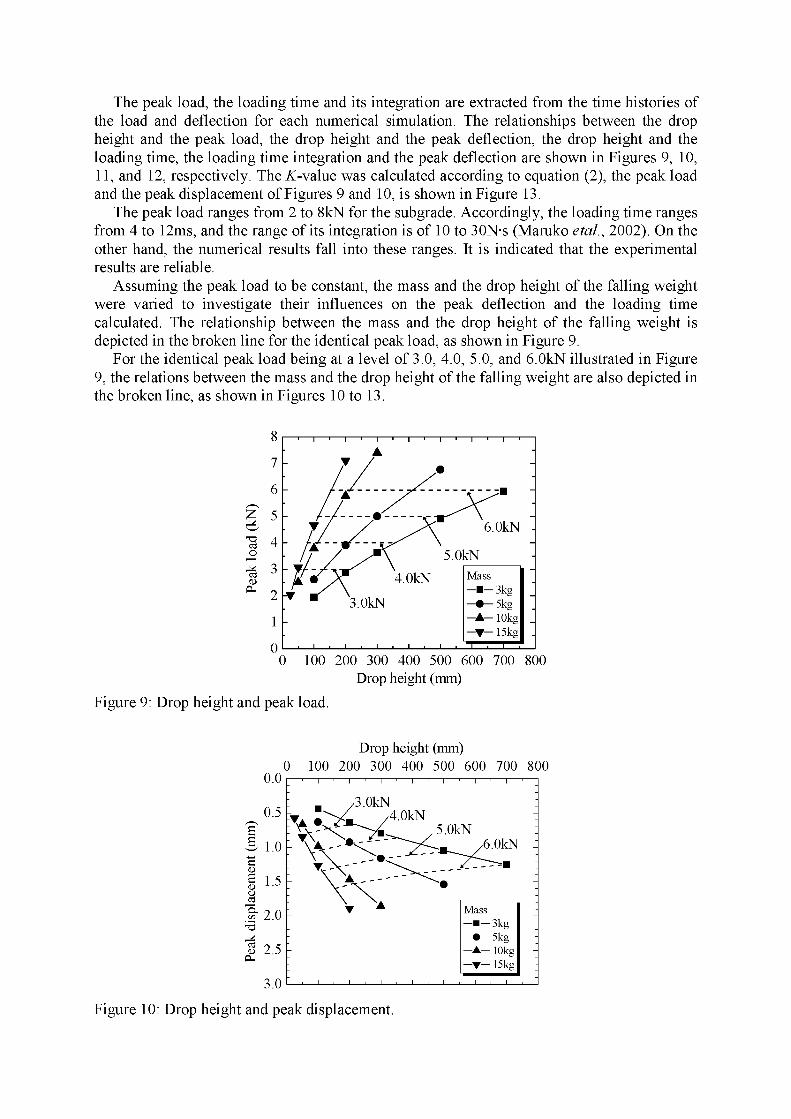
The peak load, the loading time and its integration are extracted from the time histories of the load and deflection for each numerical simulation. The relationships between the drop height and the peak load, the drop height and the peak deflection, the drop height and the loading time, the loading time integration and the peak deflection are shown in Figures 9, 10, 11, and 12, respectively. The K-value was calculated according to equation (2), the peak load and the peak displacement of Figures 9 and 10, is shown in Figure 13.
The peak load ranges from 2 to 8kN for the subgrade. Accordingly, the loading time ranges from 4 to 12ms, and the range of its integration is of 10 to 30N-s (Maruko etal., 2002). On the other hand, the numerical results fall into these ranges. It is indicated that the experimental results are reliable.
Assuming the peak load to be constant, the mass and the drop height of the falling weight were varied to investigate their influences on the peak deflection and the loading time calculated. The relationship between the mass and the drop height of the falling weight is depicted in the broken line for the identical peak load, as shown in Figure 9.
For the identical peak load being at a level of 3.0, 4.0, 5.0, and 6.0kN illustrated in Figure 9, the relations between the mass and the drop height of the falling weight are also depicted in the broken line, as shown in Figures 10 to 13.
0 100 200 300 400 500 600 700 800 Drop height (mm)
Figure 9: Drop height and peak load.
Drop height (mm) 0 100 200 300 400 500 600 700
O . O , . l ' l ' l ' l ' l ' l ' l '
Figure 10: Drop height and peak displacement.
~ " ' 1 ' " 1 " ' ~ " ' ~ Mass
Drop height (mm)
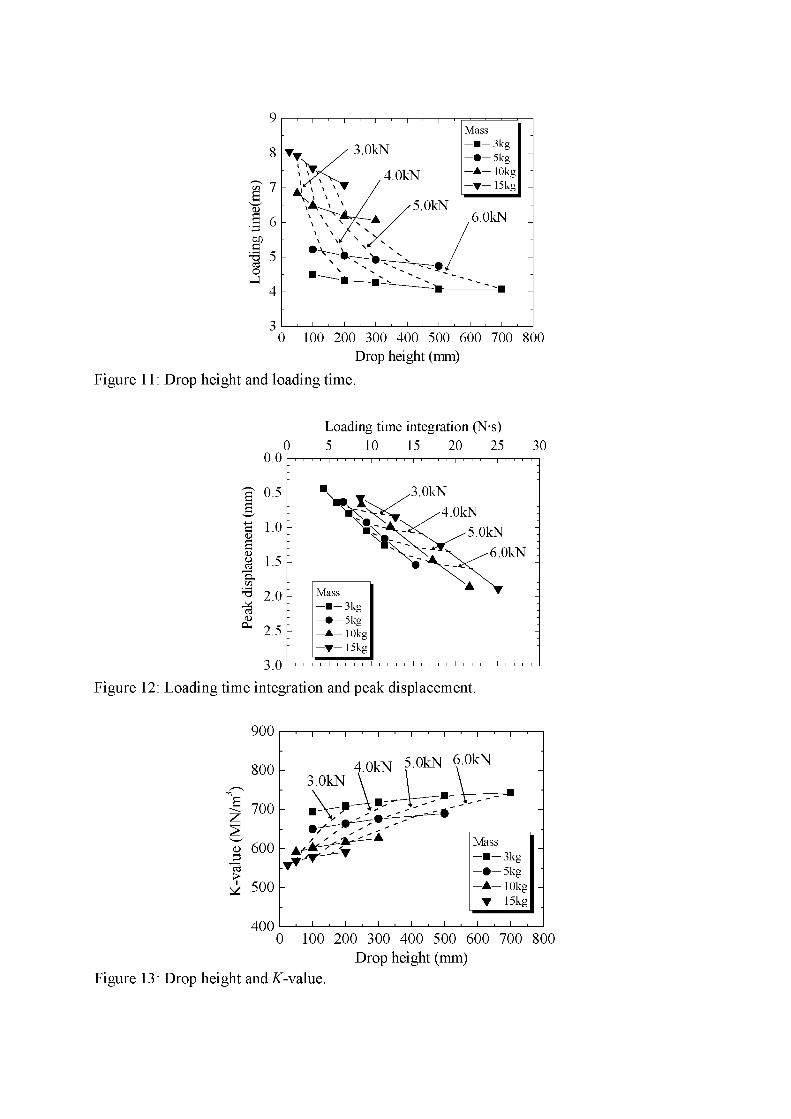
Figure 1 1 : Drop height and loading time.
Loading time integration (N.s) 0 5 10 15 20 25 30
0.0 " " , " " , " " , " " , " " , " "
3 0.5 ; -
E w
8 1 .01 E a, 2 1.5: 3
-.- 3kg -@- 5kg -A- lOkg -v- 15kg
3.0
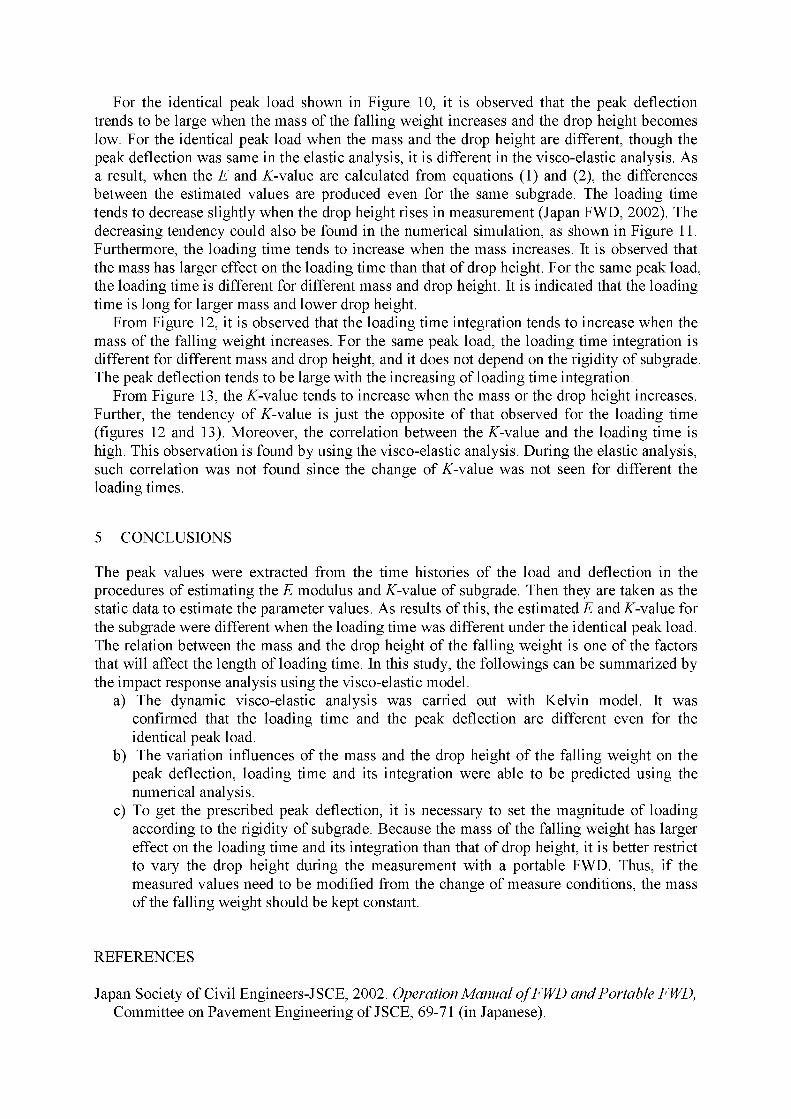
Figure 12: Loading time integration and peak displacement.
900 ~ 1 ~ 1 ~ 1 ~ 1 ~ 1 ~ 1 ~ 1 ~
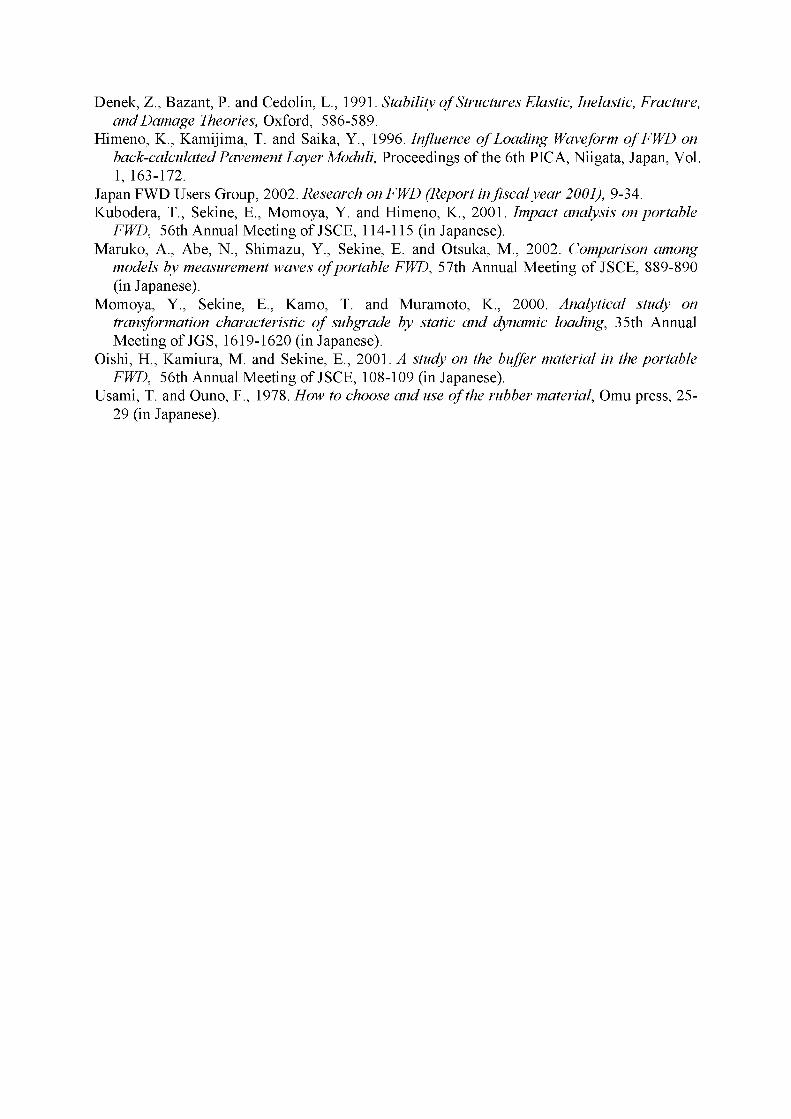
Figure 13 : Drop
800 - n
w
-=- 3kg
> -0- 5kg & 500 - -A- 1 kg
400 a 1 8 1 a 1
Drop height (mm) 0 100 200 300 400 500 600 700 800
height and K-value.
For the identical peak load shown in Figure 10, it is observed that the peak deflection trends to be large when the mass of the falling weight increases and the drop height becomes low. For the identical peak load when the mass and the drop height are different, though the peak deflection was same in the elastic analysis, it is different in the visco-elastic analysis. As a result, when the E and K-value are calculated from equations (1) and (2), the differences between the estimated values are produced even for the same subgrade. The loading time tends to decrease slightly when the drop height rises in measurement (Japan FWD, 2002). The decreasing tendency could also be found in the numerical simulation, as shown in Figure 11. Furthermore, the loading time tends to increase when the mass increases. It is observed that the mass has larger effect on the loading time than that of drop height. For the same peak load, the loading time is different for different mass and drop height. It is indicated that the loading time is long for larger mass and lower drop height.
From Figure 12, it is observed that the loading time integration tends to increase when the mass of the falling weight increases. For the same peak load, the loading time integration is different for different mass and drop height, and it does not depend on the rigidity of subgrade. The peak deflection tends to be large with the increasing of loading time integration.
From Figure 13, the K-value tends to increase when the mass or the drop height increases. Further, the tendency of K-value is just the opposite of that observed for the loading time (figures 12 and 13). Moreover, the correlation between the K-value and the loading time is high. This observation is found by using the visco-elastic analysis. During the elastic analysis, such correlation was not found since the change of K-value was not seen for different the loading times.
5 CONCLUSIONS
The peak values were extracted from the time histories of the load and deflection in the procedures of estimating the E modulus and K-value of subgrade. Then they are taken as the static data to estimate the parameter values. As results of this, the estimated E and K-value for the subgrade were different when the loading time was different under the identical peak load. The relation between the mass and the drop height of the falling weight is one of the factors that will affect the length of loading time. In this study, the followings can be summarized by the impact response analysis using the visco-elastic model.
a) The dynamic visco-elastic analysis was carried out with Kelvin model. It was confirmed that the loading time and the peak deflection are different even for the identical peak load.
b) The variation influences of the mass and the drop height of the falling weight on the peak deflection, loading time and its integration were able to be predicted using the numerical analysis.
c) To get the prescribed peak deflection, it is necessary to set the magnitude of loading according to the rigidity of subgrade. Because the mass of the falling weight has larger effect on the loading time and its integration than that of drop height, it is better restrict to vary the drop height during the measurement with a portable FWD. Thus, if the measured values need to be modified from the change of measure conditions, the mass of the falling weight should be kept constant.
REFERENCES
Japan Society of Civil Engineers-JSCE, 2002. Operation Manual ofFWD andportable FWD, Committee on Pavement Engineering of JSCE, 69-71 (in Japanese).
Denek, Z., Bazant, P. and Cedolin, L., 1991. Stabiliv of Structures Elastic, Inelastic, Fracture, and Damage Theories, Oxford, 5 86-5 89.
Himeno, K., Kamijima, T. and Saika, Y., 1996. InJluence of Loading Waveform of FWD on back-calculated Pavement Layer Moduli, Proceedings of the 6th PICA, Niigata, Japan, Vol. 1, 163-172.
Japan FWD Users Group, 2002. Research on FWD (Report infiscal year 2001), 9-34. Kubodera, T., Sekine, E., Momoya, Y. and Himeno, K., 2001. Impact analysis on portable
FWD, 56th Annual Meeting of JSCE, 114-1 15 (in Japanese). Maruko, A,, Abe, N., Shimazu, Y., Sekine, E. and Otsuka, M., 2002. Comparison among
models by measurement waves of portable FED, 57th Annual Meeting of JSCE, 889-890 (in Japanese).
Momoya, Y., Sekine, E., Kamo, T. and Muramoto, K., 2000. Analytical study on transformation characteristic of subgrade by static and dynamic loading, 35th Annual Meeting of JGS, 1619-1620 (in Japanese).
Oishi, H., Kamiura, M. and Sekine, E., 2001. A study on the buffer material in the portable FWD, 56th Annual Meeting of JSCE, 108-109 (in Japanese).
Usami, T. and Ouno, F., 1978. How to choose and use of the rubber material, Omu press, 25- 29 (in Japanese).