Embed Size (px)
Citation preview
Proceedings of the 2016 International Conference on Industrial Engineering and Operations Management Kuala Lumpur, Malaysia, March 8-10, 2016
Application of Decoupled Harmonic Power Flow for Assessment of Harmonic Passive Filter Size and Location
Agus Ulinuha Department of Electrical Engineering UniversitasMuhammadiyah Surakarta
A. Yani St, Po Box 1, Pabelan, Kartasura, Sukoharjo, Central Java, Indonesia, [email protected]
Abstract—The extensive and ever increasing application of nonlinear loads have introduced power quality problem in distribution system. The nonlinear relation between voltage and current may cause harmonic currents that propagate through the distribution network causing voltage distortion. The presence of higher frequency components in the distorted voltage may lead to a possible dangerous resonance and significant voltage increment that can be destructive. The higher frequency components of the voltage may be suppressed using filter and the distortion may then be mitigated. For the purpose of analyzing the system including nonlinear loads and the related voltage distortions, a harmonic power flow calculation is developed. A relatively fast and accurate approach for harmonic analyses using decoupled technique is proposed. The system with a number of harmonic generating devices may be analyzed and a number of passive filters are then installed to alleviate the distortion assuring the compliant to the IEEE 519 Standard. The size and location of the filters are tentatively determined and the system improvement is observed. The effectiveness of the proposed strategy is implemented on a 123-bus IEEE distribution system including a number of nonlinear loads. The capability of the decouple approach accepting measurement results may lead to real implementation.
Keywords—harmonic, distortion, passive filter, decoupled approach
I. INTRODUCTION
The objective of the electric utility is to supply the customers with sinusoidal voltage of fairly constant magnitude. The system generators normally generate a very close approximation to a sinusoidal signal. In some typical loads the voltage and current waveform are nearly sinusoidal. These loads are known linear, since the relation between voltage and current is approximately linear. However, in modern electric power systems some loads are nonlinear. The sinusoidal voltage applied to these loads produces a distorted or nonsinusoidal current waveform. In other words, the relation between voltage and current is nonlinear.
The nonlinearity of these loads causes nonsinusoidal load currents, which are periodic and retains Fourier expansions. The nonsinusoidal load currents passing through the network result in nonsinusoidal periodic voltages which also posses Fourier expansions. The higher frequency terms in these expansions are called harmonics. For most cases, the effect of the nonlinear loads distributed all over the system is additive. As a result, the rms value of harmonic voltages may have large magnitudes, which can be potentially dangerous. The distortions in voltage and current waveforms can be studied by expressing the harmonic sources as a Fourier series with the fundamental frequency equal to the power frequency then utilizing harmonic analysis to investigate the generation and propagation of these components throughout the system.
This is a growing concern on harmonics of power system due to the extensive applications of harmonic generating devices. One of harmonic sources is line-commutated converters that are extensively applied for HVDC transmission, rective power compensator, battery charger, AC and DC drives, etc [1]. On the other hand, for power factor correction purpose, a large number of capacitors are normally used [2][3]. While the capacitors do not generate harmonics, they affect the system response and can cause resonance which magnifies harmonic distortion. Most nonlinear loads are characterized by low apparent voltampere however they are also considered due to widespread application.
Harmonic analysis is an important factor for system design and analysis. It is used to quantify the distortion in voltage and current waveforms and to determine whether dangerous resonance problem exists and how they can be mitigated. Harmonic resonance is one of important issues in the system analysis taking harmonics into account. Harmonic resonance takes place due to the energy exchange between capacitive and inductive elements in a system. It is caused by inherent characteristics of the system and is not related to or caused by a particular bus current injection [4]. Mathematically, harmonic resonance is associated with the system admittance matrix. Harmonic resonance may result in significant increase in THD or the presence of harmonic resonance will lead the system to be highly distorted [5]. Acceptable levels of voltage and current are influenced by the harmonics. Such analysis has become quite important since the increase use of nonlinear loads. As a result, taking harmonics into account is very essential for distribution system analysis [6][7].
In this paper harmonic analyses are carried out to evaluate the voltage and current distortions due to the presence a number of nonlinear loads in distribution system. A decoupled approach is employed for the distortion analyses considering the
1507© IEOM Society International
Proceedings of the 2016 International Conference on Industrial Engineering and Operations Management Kuala Lumpur, Malaysia, March 8-10, 2016
computation affordability and acceptable accuracy. A number of passive filters are installed in the system and an assessment is then carried out for the system in term of harmonic mitigation. The size and location of the filters are tentatively decided and the impacts of size and location of filter(s) are evaluated. The strategy is implemented on the IEEE 123-bus system including some nonlinear loads. A further real application is possible due to the acceptance of the proposed Decoupled Harmonic Power Flow (DHPF) to accept the harmonic spectra from real system.
II. HARMONIC POWER FLOW
The concept of harmonic power flow is introduced as a mean of determining the interaction between the fundamental power flow and the characteristic harmonic currents injected by nonlinear loads. Therefore, the conventional power flow may be extended into harmonic power flow. Fundamental power flow is formulated on the basis that power sources are the system generators and power “sinks” are the loads. Harmonic power flow is more general in that loads may be the “source” of harmonic energy [8]. It should be noted, that the main source of system energy is the generators however harmonic distortion occurs at the buses containing nonlinear loads may be viewed as sources of harmonic signals. The nature of the harmonic signals strongly depends on the type of nonlinear load. Therefore, nonlinear load modelling is crucial in harmonic power flow calculation due to its significant contribution to the accuracy of the generated results.
The concept of harmonic power flow was initially introduced by including nonlinear loads in power flow calculation [9]. The concept is then extended for the system consisting of multiple nonlinear loads, where harmonic currents are injected by a number of nonlinear loads [10]. In addition to results normally generated by power flow, harmonic power flow also provides results that can be used to quantify voltage distortion and to determine whether dangerous resonant problem exists.
The basic characteristics of the harmonics (orders, magnitudes and phases) depend on the type of nonlinear load and, therefore, modeling of the load will be the most essential part of harmonic power flow calculation. Different nonlinear load requires to be specifically modeled. For a system including several types of nonlinear loads, specific model for every nonlinear load is required. Nonlinear loads can be modeled in time and/or frequency domain [11]. Time domain modeling is based on transient-state analysis while frequency domain modeling uses frequency-scan process to calculate the frequency response of a system. Time domain modeling requires detailed representation of the device that increases problem complexity resulting in prohibitively long computation time. Therefore, frequency domain methods are commonly used for harmonic analysis to reduce the computation charge. For nonlinear loads that can be presented as voltage-independent current sources, frequency domain model can be applied for harmonic power flow analysis [12][10].
In general, harmonic power flow may be classified into coupled and decoupled approach. Coupled approach solves all harmonic orders simultaneously. This approach has good accuracy but may lead to a greater computational charge as the problem becomes quite complicated. It also requires exact formulation of nonlinear loads that is sometimes practically unavailable resulting in limited applications [13]. While decoupled method assumes that the coupling between harmonic orders can be rationally disregarded enabling calculations that can be separately carried out for every harmonic order. This approach requires less computational cost. Furthermore, since nonlinear loads are modeled with harmonic current or voltage sources, it will be easy to include them in the calculations using measured non-sinusoidal current and/or voltage waveforms. For the system serving multiple nonlinear loads, the different type of nonlinear loads can be easily involved in calculations by simultaneously considering harmonic currents injected by the nonlinear loads.
At harmonic frequencies, power system can be modeled as combination of passive elements and current sources [5]. The system can be viewed as a passive element with multiple harmonic injection currents. The generalized model is suggested for a linear load, which is composed by a resistance in parallel with an inductance to account for the respective active and reactive loads at fundamental frequency [14]. Nonlinear loads are generally considered as ideal harmonic current sources that generate harmonic currents and inject them into the system. The admittance-matrix-based harmonic power flow is the most widely used method as it is based on the frequency-scan process [15]. In this approach, admittance of system components varies with the harmonic order. If skin effect is ignored at higher frequencies, the resulting hth harmonic frequency load admittance, shunt capacitor admittance and feeder admittance are respectively given by the following equations [10]:
2121i
li
i
lihli
Vh
QjV
Py −= (1)
1ci
hci hyy = (2)
1,1,1,
1
+++ +
=iiii
hii jhXR
y (3)
1508© IEOM Society International
Proceedings of the 2016 International Conference on Industrial Engineering and Operations Management Kuala Lumpur, Malaysia, March 8-10, 2016
Where lili QP and are the respective active and reactive linear loads at bus i. The nonlinear load is considered as harmonic current sources and the hth harmonic current injected at bus i introduced by the nonlinear load with real power Pn and reactive power Qn is derived as follows:
*]/)[( 11ininii VjQPI += (4)
1)( ihi IhCI = (5)
Where 1iI is the fundamental current and h
iI is the hth harmonic current determined by C(h), which is the ratio of the hth harmonic to the fundamental current. C(h) can be obtained by field test and Fourier analysis for all customers along the distribution feeder [16]. For decouple harmonic power flow calculation, loop equations are written at each harmonic frequency of interest. Each loop is formed including the source nodes. After modifying admittance matrix and the associated harmonic currents, the harmonic load flow problem can then be calculated using the following equation:
hhh IVY = (6)
At any bus i, the rms voltage is defined as:
2/1
1
2⎟⎟⎠
⎞⎜⎜⎝
⎛= ∑
=
H
h
hii VV (7)
Where H is the maximum harmonic orders considered. After solving load flow for different harmonic orders, the distortion of voltage indicated by total harmonic distortion at bus i (THDvi) is expressed by the following equation.
%100(%)1
2/1
1
2
×
⎥⎥⎥⎥⎥⎥
⎦
⎤
⎢⎢⎢⎢⎢⎢
⎣
⎡
⎟⎟⎠
⎞⎜⎜⎝
⎛
=∑≠
i
H
nh
i
viV
VTHD (8)
At the hth harmonic frequency, real power loss in the line section between buses i and i+1is expressed below
2
1,1,1,)1,( ⎟⎠⎞⎜
⎝⎛ −= ++++
hii
hi
hiiii
hiiloss yVVRP (9)
The total power loss including the loss at fundamental frequency is given by the following equation.
∑=
∑=
+ ⎟⎟⎠
⎞⎜⎜⎝
⎛=
H
h
m
ih
iilossh
loss PP1 1
)1,( (10)
Where m is number of bus.
For verification purpose, the developed DHPF has been implemented for calculation of harmonic power flow for the IEEE 18-bus distribution system. The system includes one nonlinear load, i.e. 6-pulse IEEE rectifier, installed at bus 5 with the real and reactive power of 1.3 MW and 2.26 MVAR, respectively. The nonlinear is modeled as current sources and the generated results are then compared with those generated by standard packages (HARMFLOW and ETAP). The comparisons are summarized in Table 1 demonstrating the fine accuracy of the proposed DHPF approach [10].
TABLE 1 AVERAGE DEVIATION OF THE RESULTS GENERATED BY DHPF AND HARMFLOW AND ETAP [10]
Results Average deviation (%) withHARMFLOW ETAP
Vfund 0.005870 0.002134 Vrms 0.027797 0.026716 THDv 0.572418 0.499733
1509© IEOM Society International
Proceedings of the 2016 International Conference on Industrial Engineering and Operations Management Kuala Lumpur, Malaysia, March 8-10, 2016
III. FILTER DESIGN AND ASSESSMENT Electric utilities are very concern on the fast growth of harmonic generating devices used in the industry and distribution
system. Attention of these problems includes investigation of their impacts on power system devices, loads and equipments and, if necessary, followed by suppression or prevention of their distortion. A number of approaches are proposed to mitigate harmonic injections of nonlinear loads including (passive, active and hybride) power filters, unified power quality conditioners (UPQCs) and active power line conditioners (APLCs) [1]. The easiest and cost effective method for harmonic suppression is to allocate harmonic filter(s) at the terminal of nonlinear load(s) and tune them to attenuate the injected harmonic currents without considering their effects on the rest of the power system. However, for the power system serving a number of nonlinear loads, a vast variety of harmonic currents with different orders, magnitudes and phase angles are injected at different locations and, as a result, accurate filter modeling and the related propagation of harmonics on the rest of the power system need to be accurately calculated [1].
In this paper, hybrid of shunt passive filters (tuned at the dominated harmonic frequencies) is used to compensate the injected harmonics from several nonlinear loads. Hence, the impact of injected harmonic currents is extensively evaluated for the entire system. The aforementioned DHPF will be employed to assess the system conditions taking into account the distortions from harmonic generating devices. The power quality of the system (including the overall THD and individual THD level of each bus) is examined before and after the placement of the filters. The effects of filter location as well as the size of filter units will also be investigated.
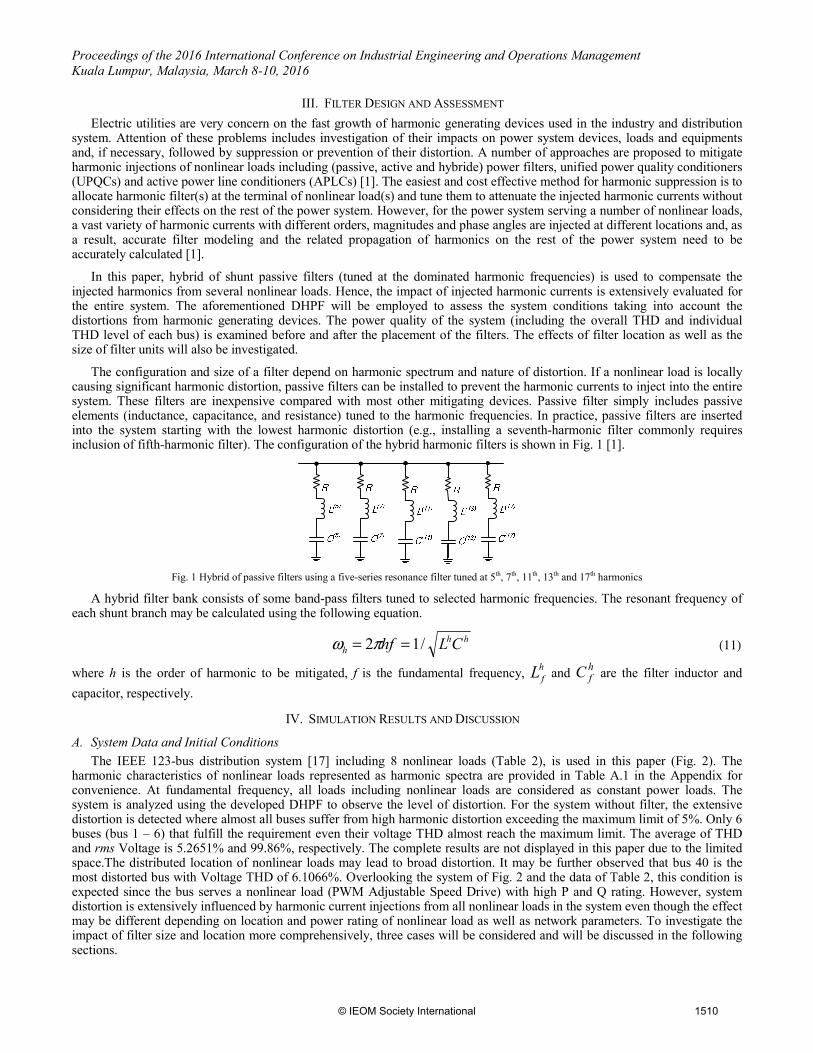
The configuration and size of a filter depend on harmonic spectrum and nature of distortion. If a nonlinear load is locally causing significant harmonic distortion, passive filters can be installed to prevent the harmonic currents to inject into the entire system. These filters are inexpensive compared with most other mitigating devices. Passive filter simply includes passive elements (inductance, capacitance, and resistance) tuned to the harmonic frequencies. In practice, passive filters are inserted into the system starting with the lowest harmonic distortion (e.g., installing a seventh-harmonic filter commonly requires inclusion of fifth-harmonic filter). The configuration of the hybrid harmonic filters is shown in Fig. 1 [1].
Fig. 1 Hybrid of passive filters using a five-series resonance filter tuned at 5th, 7th, 11th, 13th and 17th harmonics
A hybrid filter bank consists of some band-pass filters tuned to selected harmonic frequencies. The resonant frequency of each shunt branch may be calculated using the following equation.
hhh CLhf /12 == πω (11)
where h is the order of harmonic to be mitigated, f is the fundamental frequency, Lfh and h
fC are the filter inductor and capacitor, respectively.
IV. SIMULATION RESULTS AND DISCUSSION
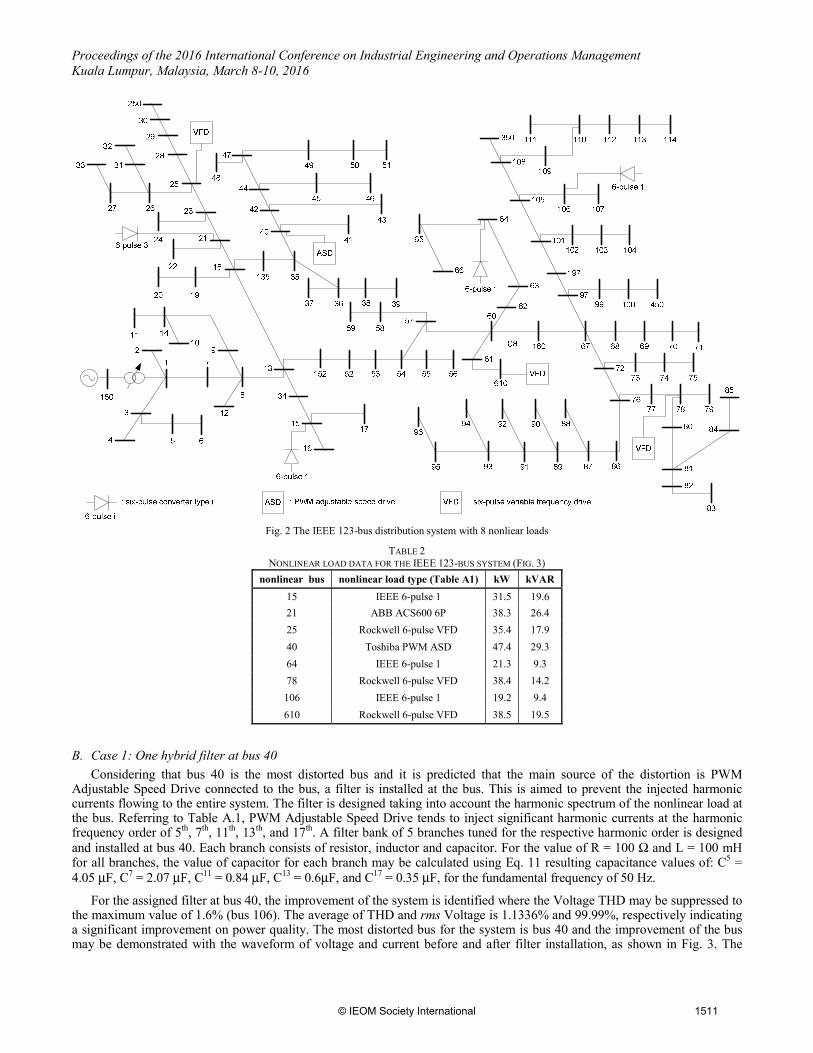
A. System Data and Initial Conditions The IEEE 123-bus distribution system [17] including 8 nonlinear loads (Table 2), is used in this paper (Fig. 2). The
harmonic characteristics of nonlinear loads represented as harmonic spectra are provided in Table A.1 in the Appendix for convenience. At fundamental frequency, all loads including nonlinear loads are considered as constant power loads. The system is analyzed using the developed DHPF to observe the level of distortion. For the system without filter, the extensive distortion is detected where almost all buses suffer from high harmonic distortion exceeding the maximum limit of 5%. Only 6 buses (bus 1 – 6) that fulfill the requirement even their voltage THD almost reach the maximum limit. The average of THD and rms Voltage is 5.2651% and 99.86%, respectively. The complete results are not displayed in this paper due to the limited space.The distributed location of nonlinear loads may lead to broad distortion. It may be further observed that bus 40 is the most distorted bus with Voltage THD of 6.1066%. Overlooking the system of Fig. 2 and the data of Table 2, this condition is expected since the bus serves a nonlinear load (PWM Adjustable Speed Drive) with high P and Q rating. However, system distortion is extensively influenced by harmonic current injections from all nonlinear loads in the system even though the effect may be different depending on location and power rating of nonlinear load as well as network parameters. To investigate the impact of filter size and location more comprehensively, three cases will be considered and will be discussed in the following sections.
1510© IEOM Society International
Proceedings of the 2016 International Conference on Industrial Engineering and Operations Management Kuala Lumpur, Malaysia, March 8-10, 2016
Fig. 2 The IEEE 123-bus distribution system with 8 nonliear loads
TABLE 2 NONLINEAR LOAD DATA FOR THE IEEE 123-BUS SYSTEM (FIG. 3)
nonlinear bus nonlinear load type (Table A1) kW kVAR 15 IEEE 6-pulse 1 31.5 19.6 21 ABB ACS600 6P 38.3 26.4 25 Rockwell 6-pulse VFD 35.4 17.9 40 Toshiba PWM ASD 47.4 29.3 64 IEEE 6-pulse 1 21.3 9.3 78 Rockwell 6-pulse VFD 38.4 14.2 106 IEEE 6-pulse 1 19.2 9.4 610 Rockwell 6-pulse VFD 38.5 19.5
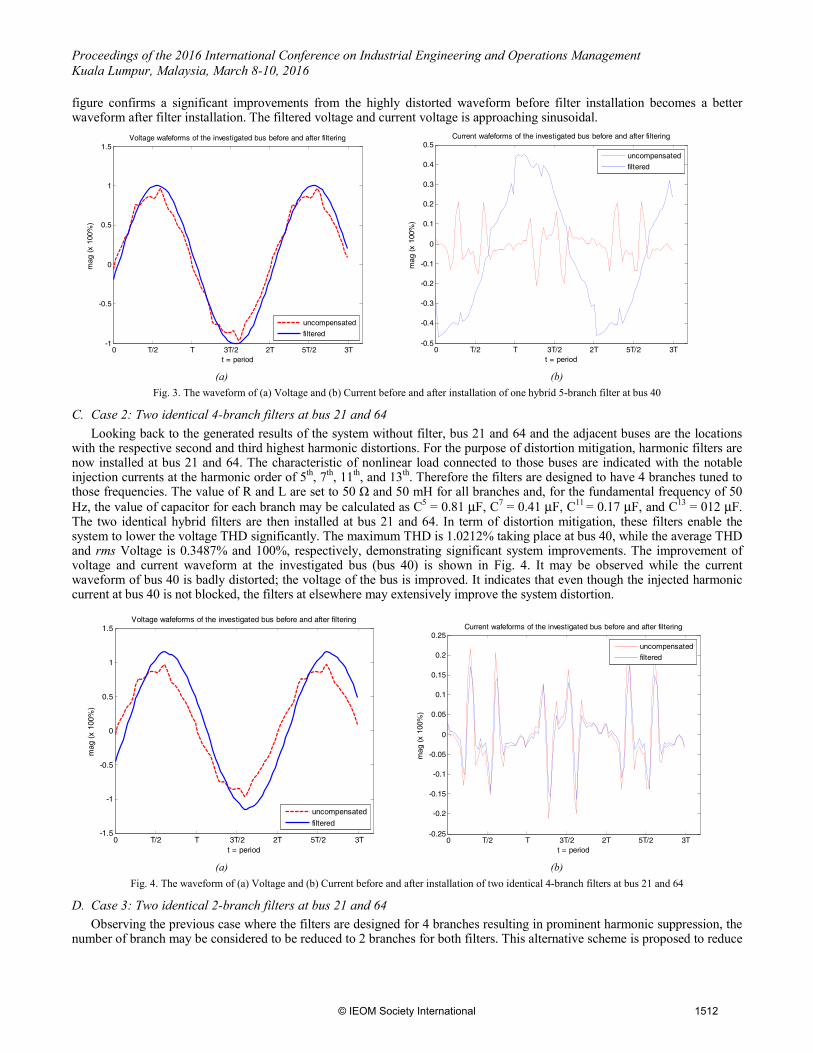
B. Case 1: One hybrid filter at bus 40 Considering that bus 40 is the most distorted bus and it is predicted that the main source of the distortion is PWM
Adjustable Speed Drive connected to the bus, a filter is installed at the bus. This is aimed to prevent the injected harmonic currents flowing to the entire system. The filter is designed taking into account the harmonic spectrum of the nonlinear load at the bus. Referring to Table A.1, PWM Adjustable Speed Drive tends to inject significant harmonic currents at the harmonic frequency order of 5th, 7th, 11th, 13th, and 17th. A filter bank of 5 branches tuned for the respective harmonic order is designed and installed at bus 40. Each branch consists of resistor, inductor and capacitor. For the value of R = 100 Ω and L = 100 mH for all branches, the value of capacitor for each branch may be calculated using Eq. 11 resulting capacitance values of: C5 = 4.05 μF, C7 = 2.07 μF, C11 = 0.84 μF, C13 = 0.6μF, and C17 = 0.35 μF, for the fundamental frequency of 50 Hz.
For the assigned filter at bus 40, the improvement of the system is identified where the Voltage THD may be suppressed to the maximum value of 1.6% (bus 106). The average of THD and rms Voltage is 1.1336% and 99.99%, respectively indicating a significant improvement on power quality. The most distorted bus for the system is bus 40 and the improvement of the bus may be demonstrated with the waveform of voltage and current before and after filter installation, as shown in Fig. 3. The
1511© IEOM Society International
Proceedings of the 2016 International Conference on Industrial Engineering and Operations Management Kuala Lumpur, Malaysia, March 8-10, 2016
figure confirms a significant improvements from the highly distorted waveform before filter installation becomes a better waveform after filter installation. The filtered voltage and current voltage is approaching sinusoidal.
0 T/2 T 3T/2 2T 5T/2 3T-1
-0.5
0
0.5
1
1.5
t = period
mag
(x
100%
)
Voltage wafeforms of the investigated bus before and after filtering
uncompensated
filtered
0 T/2 T 3T/2 2T 5T/2 3T-0.5
-0.4
-0.3
-0.2
-0.1
0
0.1
0.2
0.3
0.4
0.5
t = period
mag
(x
100%
)
Current wafeforms of the investigated bus before and after filtering
uncompensated
filtered
(a) (b)
Fig. 3. The waveform of (a) Voltage and (b) Current before and after installation of one hybrid 5-branch filter at bus 40
C. Case 2: Two identical 4-branch filters at bus 21 and 64 Looking back to the generated results of the system without filter, bus 21 and 64 and the adjacent buses are the locations
with the respective second and third highest harmonic distortions. For the purpose of distortion mitigation, harmonic filters are now installed at bus 21 and 64. The characteristic of nonlinear load connected to those buses are indicated with the notable injection currents at the harmonic order of 5th, 7th, 11th, and 13th. Therefore the filters are designed to have 4 branches tuned to those frequencies. The value of R and L are set to 50 Ω and 50 mH for all branches and, for the fundamental frequency of 50 Hz, the value of capacitor for each branch may be calculated as C5 = 0.81 μF, C7 = 0.41 μF, C11 = 0.17 μF, and C13 = 012 μF. The two identical hybrid filters are then installed at bus 21 and 64. In term of distortion mitigation, these filters enable the system to lower the voltage THD significantly. The maximum THD is 1.0212% taking place at bus 40, while the average THD and rms Voltage is 0.3487% and 100%, respectively, demonstrating significant system improvements. The improvement of voltage and current waveform at the investigated bus (bus 40) is shown in Fig. 4. It may be observed while the current waveform of bus 40 is badly distorted; the voltage of the bus is improved. It indicates that even though the injected harmonic current at bus 40 is not blocked, the filters at elsewhere may extensively improve the system distortion.
0 T/2 T 3T/2 2T 5T/2 3T-1.5
-1
-0.5
0
0.5
1
1.5
t = period
mag
(x
100%
)
Voltage wafeforms of the investigated bus before and after filtering
uncompensated
filtered
0 T/2 T 3T/2 2T 5T/2 3T-0.25
-0.2
-0.15
-0.1
-0.05
0
0.05
0.1
0.15
0.2
0.25
t = period
mag
(x
100%
)
Current wafeforms of the investigated bus before and after filtering
uncompensated
filtered
(a) (b)
Fig. 4. The waveform of (a) Voltage and (b) Current before and after installation of two identical 4-branch filters at bus 21 and 64
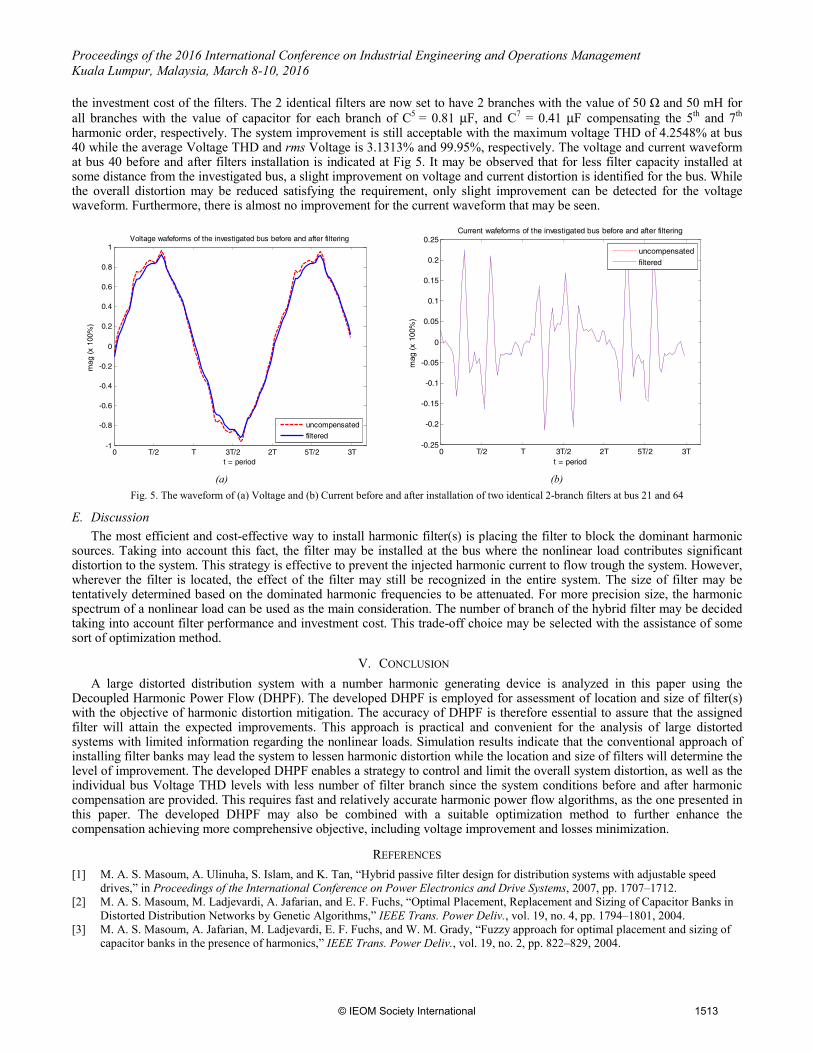
D. Case 3: Two identical 2-branch filters at bus 21 and 64 Observing the previous case where the filters are designed for 4 branches resulting in prominent harmonic suppression, the
number of branch may be considered to be reduced to 2 branches for both filters. This alternative scheme is proposed to reduce
1512© IEOM Society International
Proceedings of the 2016 International Conference on Industrial Engineering and Operations Management Kuala Lumpur, Malaysia, March 8-10, 2016
the investment cost of the filters. The 2 identical filters are now set to have 2 branches with the value of 50 Ω and 50 mH for all branches with the value of capacitor for each branch of C5 = 0.81 μF, and C7 = 0.41 μF compensating the 5th and 7th harmonic order, respectively. The system improvement is still acceptable with the maximum voltage THD of 4.2548% at bus 40 while the average Voltage THD and rms Voltage is 3.1313% and 99.95%, respectively. The voltage and current waveform at bus 40 before and after filters installation is indicated at Fig 5. It may be observed that for less filter capacity installed at some distance from the investigated bus, a slight improvement on voltage and current distortion is identified for the bus. While the overall distortion may be reduced satisfying the requirement, only slight improvement can be detected for the voltage waveform. Furthermore, there is almost no improvement for the current waveform that may be seen.
0 T/2 T 3T/2 2T 5T/2 3T-1
-0.8
-0.6
-0.4
-0.2
0
0.2
0.4
0.6
0.8
1
t = period
mag
(x
100%
)
Voltage wafeforms of the investigated bus before and after filtering
uncompensated
filtered
0 T/2 T 3T/2 2T 5T/2 3T-0.25
-0.2
-0.15
-0.1
-0.05
0
0.05
0.1
0.15
0.2
0.25
t = period
mag
(x
100%
)
Current wafeforms of the investigated bus before and after filtering
uncompensated
filtered
(a) (b)Fig. 5. The waveform of (a) Voltage and (b) Current before and after installation of two identical 2-branch filters at bus 21 and 64
E. DiscussionThe most efficient and cost-effective way to install harmonic filter(s) is placing the filter to block the dominant harmonic
sources. Taking into account this fact, the filter may be installed at the bus where the nonlinear load contributes significant distortion to the system. This strategy is effective to prevent the injected harmonic current to flow trough the system. However, wherever the filter is located, the effect of the filter may still be recognized in the entire system. The size of filter may be tentatively determined based on the dominated harmonic frequencies to be attenuated. For more precision size, the harmonic spectrum of a nonlinear load can be used as the main consideration. The number of branch of the hybrid filter may be decided taking into account filter performance and investment cost. This trade-off choice may be selected with the assistance of some sort of optimization method.
V. CONCLUSION
A large distorted distribution system with a number harmonic generating device is analyzed in this paper using the Decoupled Harmonic Power Flow (DHPF). The developed DHPF is employed for assessment of location and size of filter(s) with the objective of harmonic distortion mitigation. The accuracy of DHPF is therefore essential to assure that the assigned filter will attain the expected improvements. This approach is practical and convenient for the analysis of large distorted systems with limited information regarding the nonlinear loads. Simulation results indicate that the conventional approach of installing filter banks may lead the system to lessen harmonic distortion while the location and size of filters will determine the level of improvement. The developed DHPF enables a strategy to control and limit the overall system distortion, as well as the individual bus Voltage THD levels with less number of filter branch since the system conditions before and after harmonic compensation are provided. This requires fast and relatively accurate harmonic power flow algorithms, as the one presented in this paper. The developed DHPF may also be combined with a suitable optimization method to further enhance the compensation achieving more comprehensive objective, including voltage improvement and losses minimization.
REFERENCES [1] M. A. S. Masoum, A. Ulinuha, S. Islam, and K. Tan, “Hybrid passive filter design for distribution systems with adjustable speed
drives,” in Proceedings of the International Conference on Power Electronics and Drive Systems, 2007, pp. 1707–1712.[2] M. A. S. Masoum, M. Ladjevardi, A. Jafarian, and E. F. Fuchs, “Optimal Placement, Replacement and Sizing of Capacitor Banks in
Distorted Distribution Networks by Genetic Algorithms,” IEEE Trans. Power Deliv., vol. 19, no. 4, pp. 1794–1801, 2004.[3] M. A. S. Masoum, A. Jafarian, M. Ladjevardi, E. F. Fuchs, and W. M. Grady, “Fuzzy approach for optimal placement and sizing of
capacitor banks in the presence of harmonics,” IEEE Trans. Power Deliv., vol. 19, no. 2, pp. 822–829, 2004.
1513© IEOM Society International
Proceedings of the 2016 International Conference on Industrial Engineering and Operations Management Kuala Lumpur, Malaysia, March 8-10, 2016
[4] W. Xu, Z. Huang, Y. Cui, and H. Wang, “Harmonic Resonance Mode Analysis,” IEEE Trans. Power Deliv., vol. 20, no. 2, pp. 1182–1190, 2005.
[5] H.-C. Chin, “Optimal shunt capacitor allocation by fuzzy dynamic programming,” Electr. Power Syst. Res., vol. 35, no. 2, pp. 133–139, 1995.
[6] A. Ulinuha, M. A. S. Masoum, and S. M. Islam, “Optimal Scheduling of LTC and Shunt Capacitors in Large Distorted DistributionSystems using Evolutionary-Based Algorithms,” IEEE Trans. Power Deliv., vol. 23, no. 1, pp. 434–441, 2008.
[7] A. Ulinuha, M. A. S. Masoum, and S. Islam, “Hybrid genetic-fuzzy algorithm for volt/var/total harmonic distortion control ofdistribution systems with high penetration of non-linear loads,” IET Generation, Transmission & Distribution, vol. 5, no. 4. p. 425,2011.
[8] A. Semlyen and M. Shlash, “Principles of modular harmonic power flow methodology,” IEE Proceedings-Generation, Transm.Distrib., vol. 147, no. 1, pp. 1–6, 2000.
[9] G. T. Heydt, “Harmonic power flow studies, part I - Formulation and Solution,” IEEE Trans. Power Appar. Syst., vol. 101, no. 6, pp.1257–1265, 1982.
[10] A. Ulinuha, M. A. S. Masoum, and S. M. Islam, “Harmonic power flow calculations for a large power system with multiple nonlinearloads using decoupled approach,” in 2007 Australasian Universities Power Engineering Conference, AUPEC, 2007.
[11] M. A. Moreno Lopez de Saa and J. Usaola Garcia, “Three-phase harmonic load flow in frequency and time domains,” IEE Proc. -Electr. Power Appl., vol. 150, no. 3, pp. 295–300, 2003.
[12] Y.-Y. Hong, J.-S. Lin, and C.-H. Liu, “Fuzzy harmonic power flow analyses,” in International Conference on Power SystemTechnology, PowerCon, 2000, vol. 1, pp. 121–125.
[13] S. M. Williams, G. T. Brownfield, and J. W. Duffus, “Harmonic propagation on an electric distribution system: field measurementscompared with computer simulation,” IEEE Trans. Power Deliv., vol. 8, no. 2, pp. 547–552, 1993.
[14] A.Ulinuha and M. A. S. Masoum, “The Accuracy and Efficiency Issues of Decouple Approach for Harmonic Power FlowCalculation,” in Regional Postgraduate Conference on Engineering and Science (RPCES) , 2006, vol. 1, pp. 213–218.
[15] J.-H. Teng and C.-Y. Chang, “Fast harmonic analysis method for unbalanced distribution systems,” in Power Engineering SocietyGeneral Meeting, 2003, IEEE, 2003, vol. 2, p. 1249 Vol. 2.
[16] T. S. Chung and H. C. Leung, “A genetic algorithm approach in optimal capacitor selection with harmonic distortion considerations,”Int. J. Electr. Power Energy Syst., vol. 21, no. 8, pp. 561–569, 1999.
[17] W. H. Kersting, “Radial distribution test feeders,” IEEE Trans. Power Syst., vol. 6, no. 3, pp. 975–985, 1991.
BIOGRAPHY Agus Ulinuha is an Academic Staff at the Department of Electrical Engineering, Universitas Muhammadiyah Surakarta, Indonesia. He is currently appointed as the head of University Research Office. He received BS degree in 1994 from Universitas Diponegoro, Indonesia, MS degree in 1999 from Universitas Gadjah Mada, Indonesia, and Ph.D. degree from Curtin University of Technology, Australia in 2007. His research interest includes optimization of electrical system, power quality, and harmonics. He has successfully secured a number of research grants on power quality and optimization.
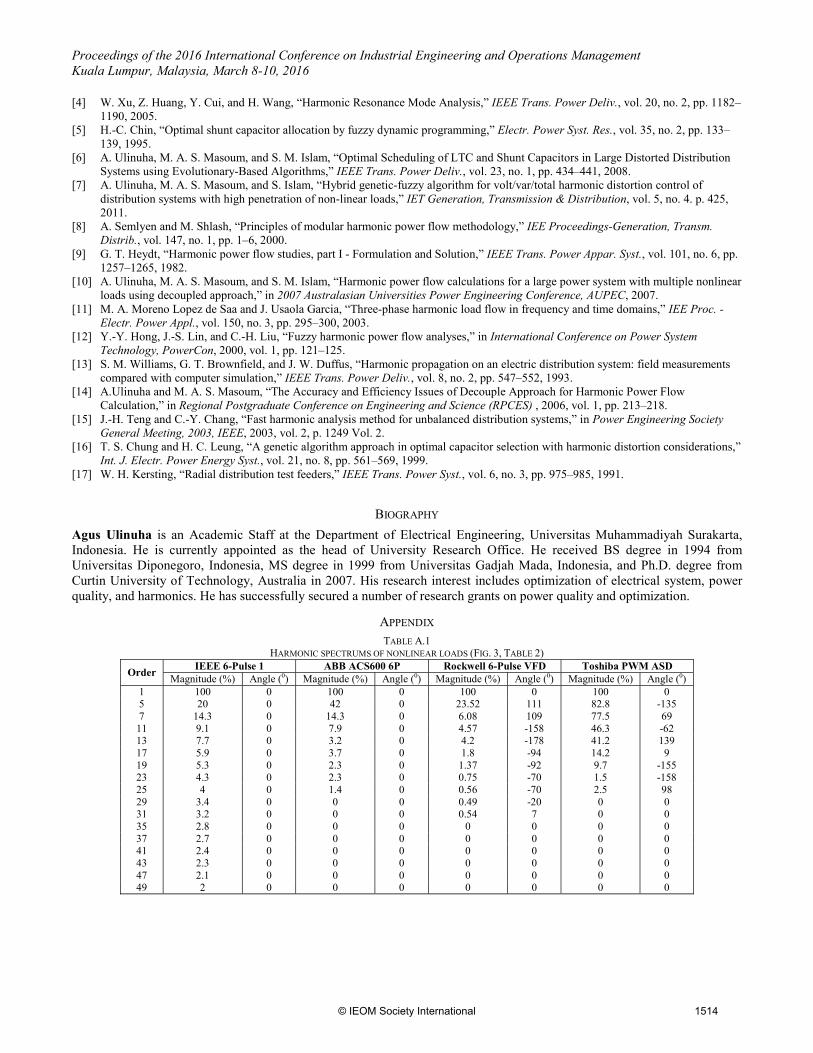
APPENDIX TABLE A.1
HARMONIC SPECTRUMS OF NONLINEAR LOADS (FIG. 3, TABLE 2)
Order IEEE 6-Pulse 1 ABB ACS600 6P Rockwell 6-Pulse VFD Toshiba PWM ASD Magnitude (%) Angle (0) Magnitude (%) Angle (0) Magnitude (%) Angle (0) Magnitude (%) Angle (0)
1 100 0 100 0 100 0 100 05 20 0 42 0 23.52 111 82.8 -1357 14.3 0 14.3 0 6.08 109 77.5 69
11 9.1 0 7.9 0 4.57 -158 46.3 -6213 7.7 0 3.2 0 4.2 -178 41.2 13917 5.9 0 3.7 0 1.8 -94 14.2 919 5.3 0 2.3 0 1.37 -92 9.7 -15523 4.3 0 2.3 0 0.75 -70 1.5 -15825 4 0 1.4 0 0.56 -70 2.5 9829 3.4 0 0 0 0.49 -20 0 031 3.2 0 0 0 0.54 7 0 035 2.8 0 0 0 0 0 0 037 2.7 0 0 0 0 0 0 041 2.4 0 0 0 0 0 0 043 2.3 0 0 0 0 0 0 047 2.1 0 0 0 0 0 0 049 2 0 0 0 0 0 0 0
1514© IEOM Society International


![Development of Sustainable Performance …ieomsociety.org/ieom_2016/pdfs/311.pdfpresent generation without compromising the ability of future generations to meet economy needs [1],](https://img.pdfslide.us/doc/110x75/5b0334b47f8b9a3c378be27b/development-of-sustainable-performance-generation-without-compromising-the-ability.jpg)