Embed Size (px)
Citation preview
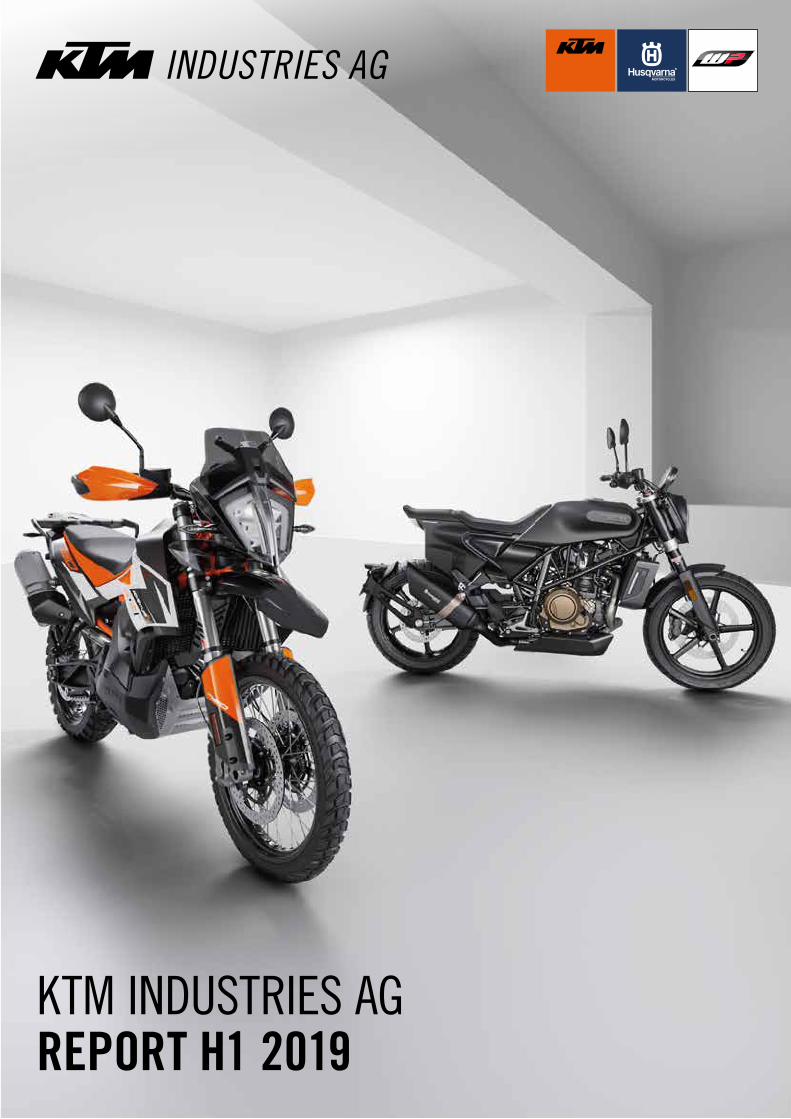
KTM INDUSTRIES AGREPORT H1 2019
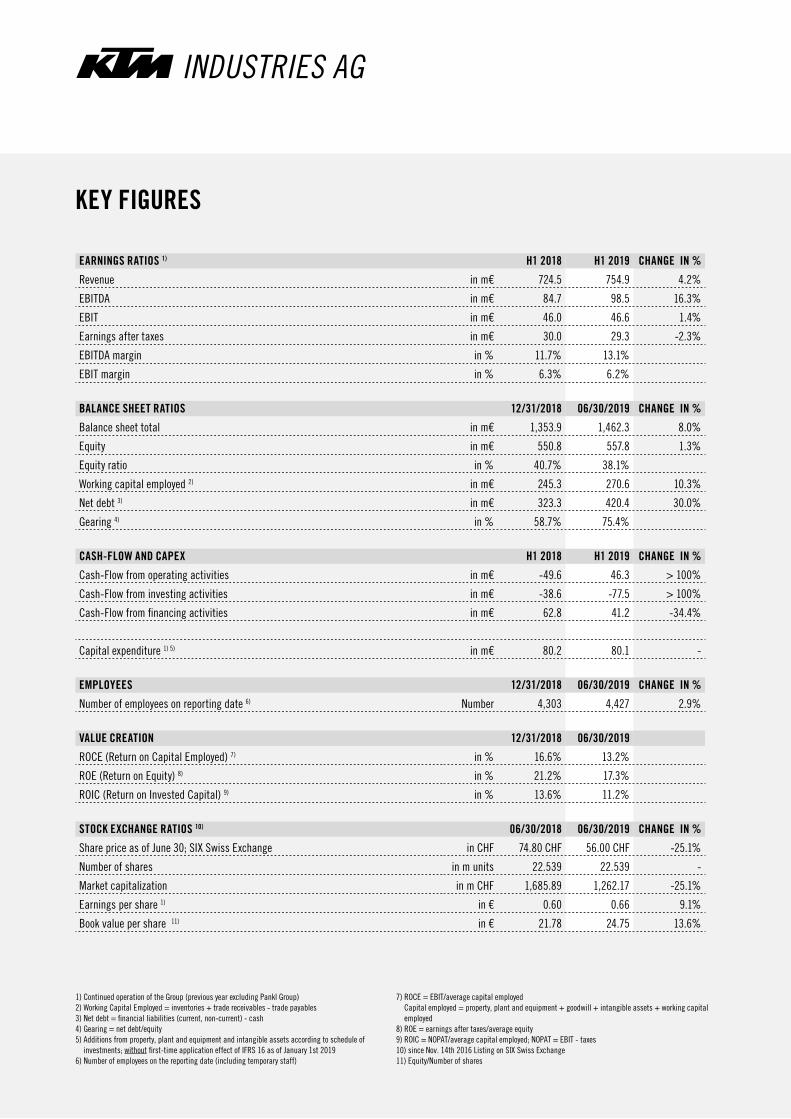
KEY FIGURES
EARNINGS RATIOS 1) H1 2018 H1 2019 CHANGE IN %
Revenue in m€ 724.5 754.9 4.2%
EBITDA in m€ 84.7 98.5 16.3%
EBIT in m€ 46.0 46.6 1.4%
Earnings after taxes in m€ 30.0 29.3 -2.3%
EBITDA margin in % 11.7% 13.1%
EBIT margin in % 6.3% 6.2%
BALANCE SHEET RATIOS 12/31/2018 06/30/2019 CHANGE IN %
Balance sheet total in m€ 1,353.9 1,462.3 8.0%
Equity in m€ 550.8 557.8 1.3%
Equity ratio in % 40.7% 38.1%
Working capital employed 2) in m€ 245.3 270.6 10.3%
Net debt 3) in m€ 323.3 420.4 30.0%
Gearing 4) in % 58.7% 75.4%
CASH-FLOW AND CAPEX H1 2018 H1 2019 CHANGE IN %
Cash-Flow from operating activities in m€ -49.6 46.3 > 100%
Cash-Flow from investing activities in m€ -38.6 -77.5 > 100%
Cash-Flow from financing activities in m€ 62.8 41.2 -34.4%
Capital expenditure 1) 5) in m€ 80.2 80.1 -
EMPLOYEES 12/31/2018 06/30/2019 CHANGE IN %
Number of employees on reporting date 6) Number 4,303 4,427 2.9%
VALUE CREATION 12/31/2018 06/30/2019
ROCE (Return on Capital Employed) 7) in % 16.6% 13.2%
ROE (Return on Equity) 8) in % 21.2% 17.3%
ROIC (Return on Invested Capital) 9) in % 13.6% 11.2%
STOCK EXCHANGE RATIOS 10) 06/30/2018 06/30/2019 CHANGE IN %
Share price as of June 30; SIX Swiss Exchange in CHF 74.80 CHF 56.00 CHF -25.1%
Number of shares in m units 22.539 22.539 -
Market capitalization in m CHF 1,685.89 1,262.17 -25.1%
Earnings per share 1) in € 0.60 0.66 9.1%
Book value per share 11) in € 21.78 24.75 13.6%
1) Continued operation of the Group (previous year excluding Pankl Group) 2) Working Capital Employed = inventories + trade receivables - trade payables3) Net debt = financial liabilities (current, non-current) - cash4) Gearing = net debt/equity5) Additions from property, plant and equipment and intangible assets according to schedule of
investments; without first-time application effect of IFRS 16 as of January 1st 20196) Number of employees on the reporting date (including temporary staff)
7) ROCE = EBIT/average capital employed Capital employed = property, plant and equipment + goodwill + intangible assets + working capital employed
8) ROE = earnings after taxes/average equity9) ROIC = NOPAT/average capital employed; NOPAT = EBIT - taxes10) since Nov. 14th 2016 Listing on SIX Swiss Exchange11) Equity/Number of shares
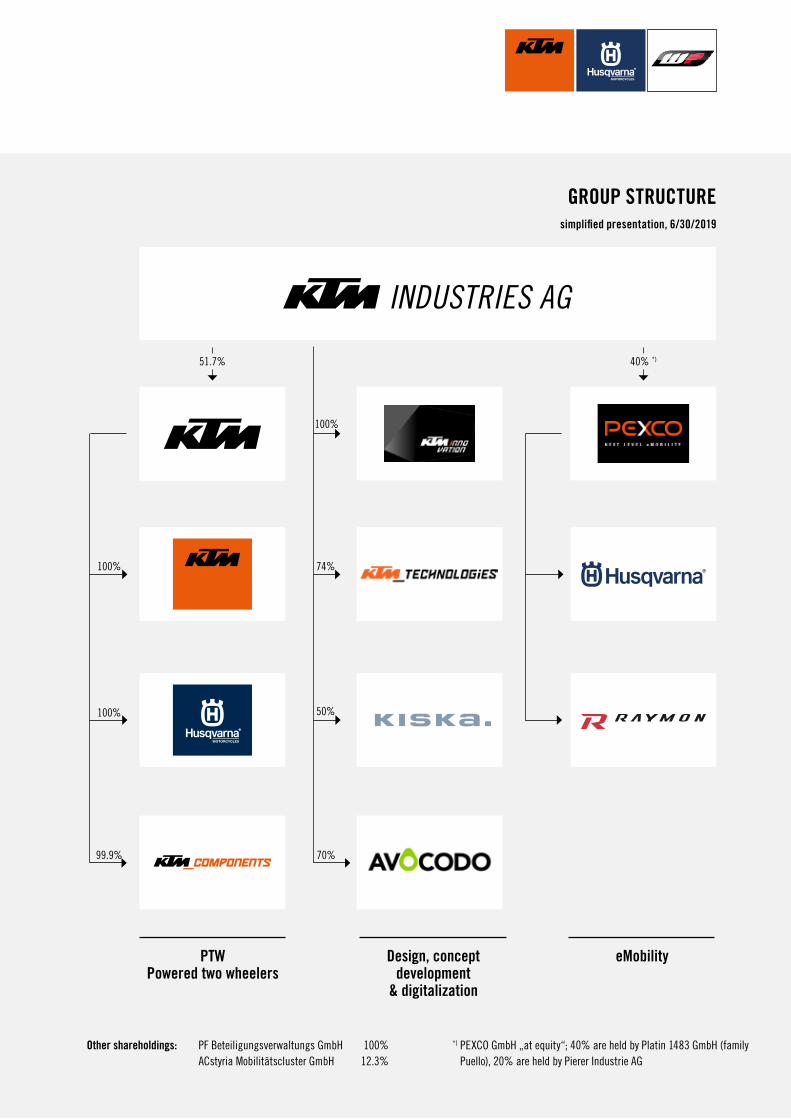
PF Beteiligungsverwaltungs GmbH 100%ACstyria Mobilitätscluster GmbH 12.3%
Other shareholdings:
*) PEXCO GmbH „at equity“; 40% are held by Platin 1483 GmbH (family Puello), 20% are held by Pierer Industrie AG
GROUP STRUCTUREsimplified presentation, 6/30/2019
PTWPowered two wheelers
Design, concept development
& digitalization
eMobility
51.7% 40% *)
99.9% 70%
74%
50%
100%
100%
100%
4 KTM INDUSTRIES GROUP INTERIM CONSOLIDATED MANAGEMENT REPORT INTERIM CONSOLIDATED FINANCIAL STATEMENTS CONDENSED NOTES
DEVELOPMENT OF THE KTM INDUSTRIES GROUP
The KTM Industries Group is Europe’s largest manufacturer of sports motorcycles with a strategic focus on sports motorcycles and electric mobility. There is a high degree of technological integration within the Group, which in this form is unique in Europe. Strategic partnerships at operating level strengthen our competitiveness in the relevant markets. All these factors form the foundation for the high level of innovation within the KTM Indust-ries Group and secure our organic growth course in the long term.
Sales and Development of Revenue in the First Half-Year 2019
The KTM Industries Group continued its growth in the first half-year of 2019, registering Group revenue of EUR 754.9 million. This corresponds to growth of +4.2 % compared with the same period of the previous year*) and lies at the upper end of our expectations. With a total of 135,711 (+7 % compared to the previous year) motorcycles sold in the first half-year – 115,318 KTM motorcycles and 20,393 Husqvarna motorcycles – KTM Industries strengthened its position as Europe’s largest motorcycle manufacturer. The first half-year of 2019 was partly characterized by the start of series production of the new KTM 690 Enduro R and 690 SMC R as well as performance revisions to the Enduro Competition model series. The market introduction of the completely new series 2-cylinder Adventure bikes – KTM 790 ADVENTURE and KTM 790 ADVENTURE R – was successfully started in the first quarter of 2019. The first Husqvarna E-motorcycle – the Minicycle EE5 – was brought onto the market in June, representing the next step into the future of electric mobility after the KTM FREERIDE E. The implementation of our global project strategy and expansion to all continents was consistently pursued in the first six months of the current financial year.
*) for the purposes of better comparability in relation to the Group’s continued operation (excluding Pankl Group)
In order to ensure the continuation of the steps taken in the 2018 efficiency program and to adjust the term of the Executive Board contracts to the current medium-term planning, the Supervisory Board of KTM Industries AG prematurely extended by five years the Executive Board contracts of Ste-fan Pierer (CEO), Friedrich Roithner (CFO), and Hubert Trunkenpolz (CSO), due to expire in spring 2020. Harald Plöckinger resigned from the Executive Board of KTM Industries AG on February 28th 2019.
Market Share Gains on the U.S. and Indian Markets – Market Share in Europe at a high level
In the first six months of the current financial year, the KTM Industries Group (“KTM”) performed better than expected in the most important motorcycle markets (>120 cc) with its brands KTM and Husqvarna Motorcycles with an increase in registrations of 5.2 % (overall market: +2.7 %).
In Europe, the overall market grew by around 8.5 % in the first half-year of 2019. In the same period, KTM increased registrations by 6.6 %, thereby maintaining its high market share in Europe at around 11.4 %. In the difficult U.S. market, which continued to decline (-2.3 %) in the first half-year of 2019, KTM was exceptionally successful in positioning itself. KTM increased its registrations by 5.2 %, thereby raising its market share as of June 30th 2019 from 8.4 % to 9.0 %. In the most important future market for KTM, India, its registrations (brand KTM) in the first half-year increased by over 35 % in comparison with the previous year. The newly launched models - the 125 DUKE and RC 125 - are celebrating a major success here, with their market share rose from around 4.3% to around 6.8%. 32,539 (+7,672) KTM bikes have already been sold in India and Indonesia via our strategic partner Bajaj.
Electric Vehicle Alliance with Bajaj
In June 2019, KTM Industries AG and Bajaj Auto Ltd. decided to launch a series development project for PTW (“powered two wheeler”) electric vehicles in the performance range of between 3 and 10 kW (48 V) at the level of KTM AG. The platform will support various product variants – powered two wheelers and electric bicycles – under the brands of both partners. Along with the KTM FREERIDE E, the current launch of the E-Miniserie and the existing activities with PEXCO in the HUSQVARNA e-bike sector, this strategic step is a significant milestone in the field of electromobility. Series production will begin by 2022 at Bajaj’s production location in Pune, India. The required development budget is covered in the medium-term planning. This is a further important step in the deepening of the cooperation with Bajaj.
INTERIM CONSOLIDATED MANAGEMENT REPORT FOR THE FIRST HALF-YEAR 2019OF THE KTM INDUSTRIES AG, WELS
5REPORT H1 2019KTM INDUSTRIES GROUP INTERIM CONSOLIDATED MANAGEMENT REPORT INTERIM CONSOLIDATED FINANCIAL STATEMENTS CONDENSED NOTES
Stronger Market Presence in Australia
In July 2019, KTM AG increased its equity holding in Motorcycle Distributors Australia Pty Ltd from 26 % to 100 %, whereby the sales subsidiaries in Australia and New Zealand became wholly owned subsidiaries of the KTM Group as a result of the complete takeover of the company shares. With over 10,000 KTM and Husqvarna motorcycles sold, the Australian and New Zealand business has developed into the world’s third-largest market, making Motorcycle Distributors Australia Pty Ltd KTM AG’s third-largest subsidiary.
New Models
The KTM 790 Adventure and KTM 790 Adventure R, presented in the fall of 2018 and awaited with anticipation, are already being sold via KTM’s network of dealers. The completely new series 2 cylinder in these adventure bikes was developed together with KTM’s Dakar-winning bike, the KTM 450 RALLY, and it forms the link between the Enduros and KTM’s 2019 street model series. The KTM 690 Enduro R and the KTM 690 SMC R are also available from dealers. Both bikes are powered by the world’s most powerful series-produced 1-cylinder engine. The new KTM SX-Motocross model series of 2020, from the KTM 50 SX to the KTM 450 SX-F, underwent improvements and performance revisions. The market leading EXC model series was also improved. This new generation of model year 2020 was presented in May 2019. The new Enduro lineup from KTM includes new 2-stroke and 4-stroke motorcycles, as well as the KTM SIX DAYS premium model and the special model KTM 300 EXC TPI ERZBERGRODEO. The first motorcycle with electric powertrain from Husqvarna Motorcycles – Minicycle EE 5 – has also been on the market since June 2019.
Participating Interests
In the first quarter of 2019, the KTM Industries Group increased its equity holding in KTM Innovation GmbH from 74 % to 100 %. The company, foun-ded in 2018, focuses on trending topics from various technology fields in the area of digitalization such as artificial intelligence, big data, block chain and business modeling. It concentrates on digital products and services for the core product. The aim is to facilitate a profound digital transformation in all areas; on the motorcycle, in production and in the supply chain, in marketing, in sales and with dealers, in communication with riders and in services for riders.
The KTM Industries Group holds a 70 % stake in AVOCODO GmbH since the second quarter of 2019. The full-service provider is a specialist for mobile applications, web applications and business solutions, particularly in relation to digital solutions and custom developments.
ECONOMY AND MARKET DEVELOPMENT
According to the report of the International Monetary Fund (IMF) as of July 2019, global economic output will grow by 3.2 % in 2019. It forecasts growth of 1.9 % for this year and 1.7 % for next year in industrialized nations. For the euro area, a development of 1.3 % is expected for 2019. For 2020, the IMF anticipates global economic growth of 3.5 %, and for the euro area growth of 1.6 %.
For emerging markets and developing economies, a growth in economic output of 4.1 % and 4.7 % is expected for 2019 and 2020 respectively. For China, a growth rate of 6.2 % for 2019 and 6.0 % for 2020 is forecast. The highest growth rate is expected for India, with a 7.0 % increase in economic output for the current year and 7.2 % for next year.
The European motorcycle market 1 grew by 8.5 % in the first half-year of 2019 compared with the previous year with 364,094 registered vehicles, and this increase is predominantly attributed to the development in European markets such as Germany (+6.0 %), France (+18.7 %) and Italy (+8.2 %). The market share of KTM and Husqvarna for motorcycles registered for road use in Europe stood at 11.4 % (previous year: 11.6 %) in the first half-year.
The number of registrations in the U.S. motorcycle market 2 fell during the first half-year 2019 with around 211,205 registered vehicles (-2.3 % compared with the previous year). However, KTM and Husqvarna increased their market share in the U.S. from 8.4 % last year to 9.0 %.
1 Motorcycles >= 120 cc without Motocross, Scooters and ATVs, incl. electric motorcycles in the markets DE, FR, IT, UK, ES, SE, BE, AT, CH, FI, DN, NO2 Motorcycles >= 120 cc including Motocross, excluding scooters and ATVs, including electric motorcycles
6 KTM INDUSTRIES GROUP INTERIM CONSOLIDATED MANAGEMENT REPORT INTERIM CONSOLIDATED FINANCIAL STATEMENTS CONDENSED NOTES
BUSINESS DEVELOPMENT AND ANALYSIS OF EARNINGS RATIOS
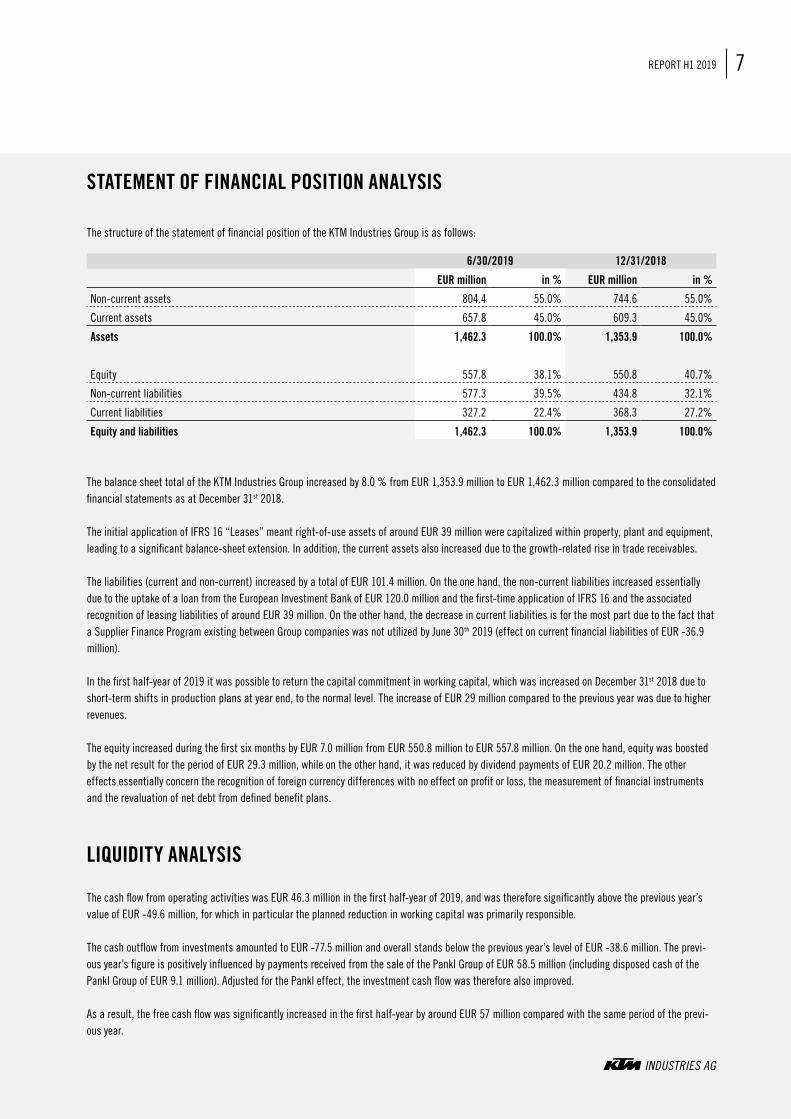
In the first half-year 2019 the KTM Industries Group generated revenue of EUR 754.9 million (+4.2 %) following EUR 724.5 million in the same period of the previous year. Approximately 95 % of revenues were earned outside Austria. From a regional point of view, some 61 % of the revenue was attributable to Europe (-3 % compared with the previous year), 21 % to North America including Mexico (+3 % compared with the previous year) and 18 % to the rest of the world (no change compared with the previous year).
At EUR 46.6 million, the earnings before interest and taxes (EBIT) exceeded the planned expectations in the first half of 2019 (previous year: EUR 46.0 million). Adjusted for one-time effects in the previous year, the EBIT margin increased by 0.5 percentage points to 6.2%. At EUR 98.5 million, the earnings before interest, taxes, depreciation and amortization (EBITDA) is significantly above the previous year’s figure of EUR 84.7 million. The net result after tax for the first half-year is EUR 29.3 million, a slim EUR 0.7 million below the previous year’s level.
All earnings ratios of the Group described relate to improved comparability with the Group’s continued operation (i.e. excluding the Pankl Group sold in June 2018 and the associated deconsolidation effects).
As a continuing division of the Group, KTM AG is now the main division of the KTM Industries Group due to the disposal of the Pankl Group at the end of June 2018.
KTM AG
The company generated revenue of EUR 749.9 million in the first half-year 2019, corresponding to an increase of 3.8 % compared with the same period of the previous year.
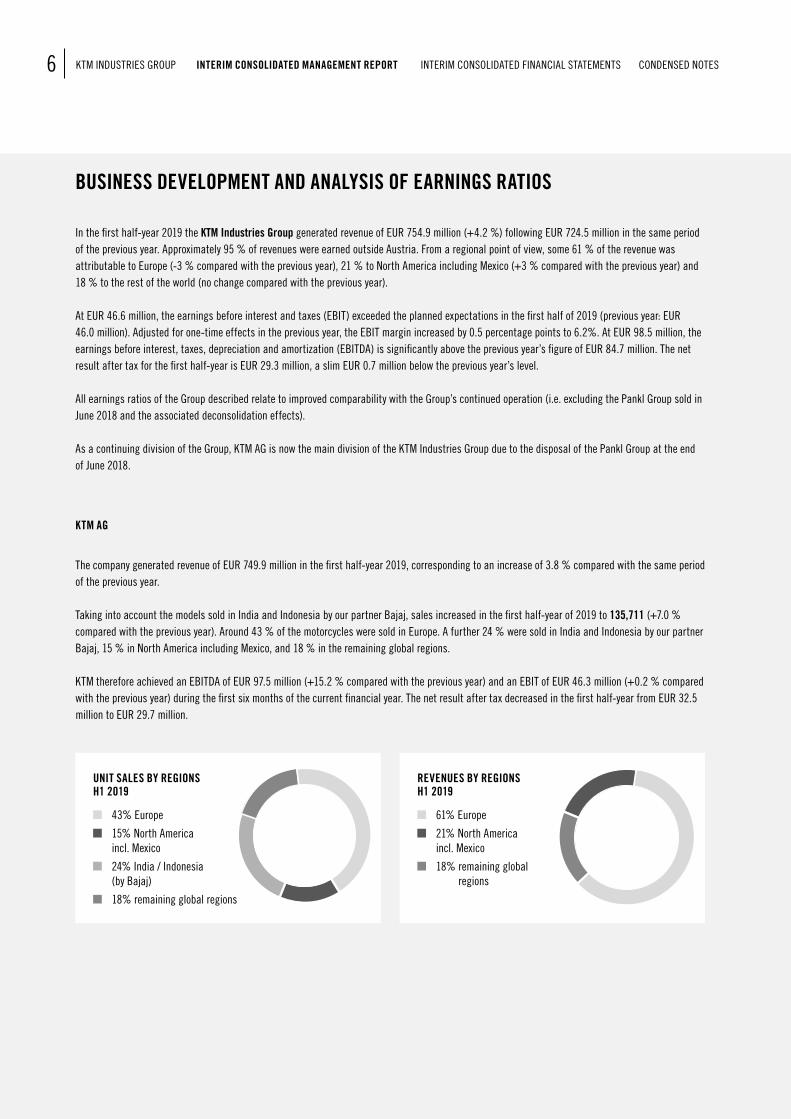
Taking into account the models sold in India and Indonesia by our partner Bajaj, sales increased in the first half-year of 2019 to 135,711 (+7.0 % compared with the previous year). Around 43 % of the motorcycles were sold in Europe. A further 24 % were sold in India and Indonesia by our partner Bajaj, 15 % in North America including Mexico, and 18 % in the remaining global regions.
KTM therefore achieved an EBITDA of EUR 97.5 million (+15.2 % compared with the previous year) and an EBIT of EUR 46.3 million (+0.2 % compared with the previous year) during the first six months of the current financial year. The net result after tax decreased in the first half-year from EUR 32.5 million to EUR 29.7 million.
43% Europe
15% North America incl. Mexico
24% India / Indonesia (by Bajaj)
18% remaining global regions
UNIT SALES BY REGIONSH1 2019
61% Europe
21% North America incl. Mexico
18% remaining global regions
REVENUES BY REGIONSH1 2019
7REPORT H1 2019KTM INDUSTRIES GROUP INTERIM CONSOLIDATED MANAGEMENT REPORT INTERIM CONSOLIDATED FINANCIAL STATEMENTS CONDENSED NOTES
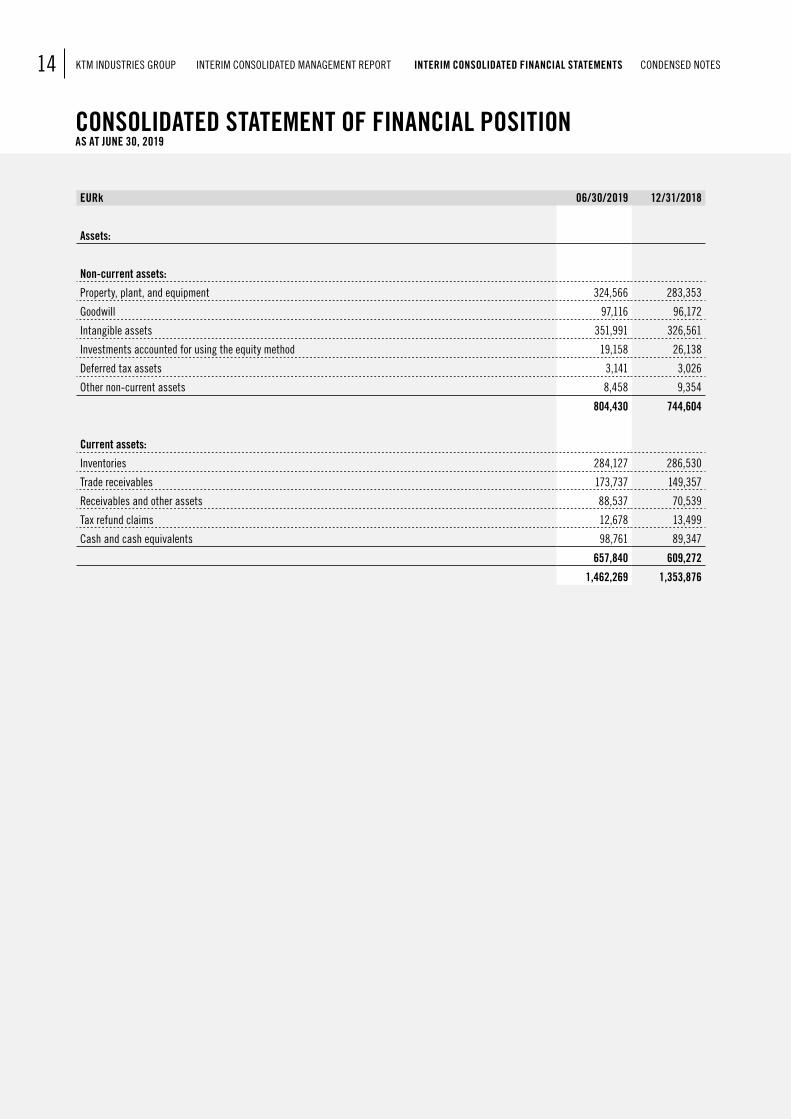
STATEMENT OF FINANCIAL POSITION ANALYSIS
The structure of the statement of financial position of the KTM Industries Group is as follows:
6/30/2019 12/31/2018
EUR million in % EUR million in %
Non-current assets 804.4 55.0% 744.6 55.0%
Current assets 657.8 45.0% 609.3 45.0%
Assets 1,462.3 100.0% 1,353.9 100.0%
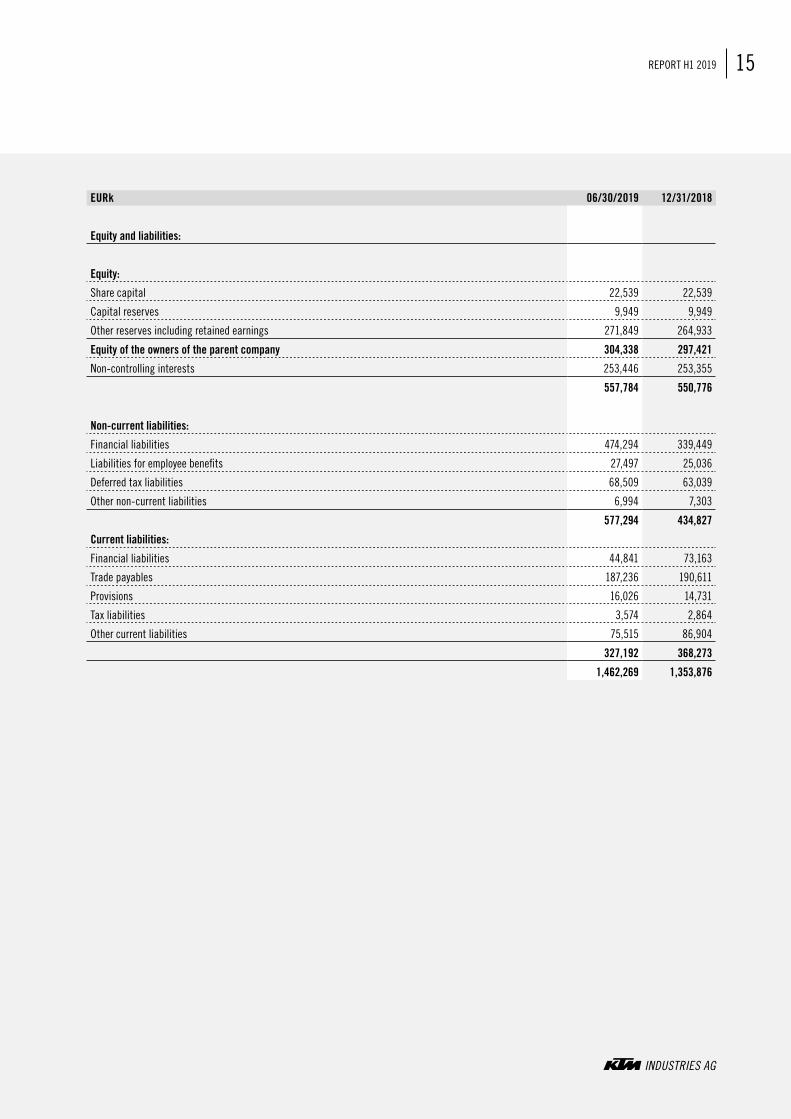
Equity 557.8 38.1% 550.8 40.7%
Non-current liabilities 577.3 39.5% 434.8 32.1%
Current liabilities 327.2 22.4% 368.3 27.2%
Equity and liabilities 1,462.3 100.0% 1,353.9 100.0%
The balance sheet total of the KTM Industries Group increased by 8.0 % from EUR 1,353.9 million to EUR 1,462.3 million compared to the consolidated financial statements as at December 31st 2018.
The initial application of IFRS 16 “Leases” meant right-of-use assets of around EUR 39 million were capitalized within property, plant and equipment, leading to a significant balance-sheet extension. In addition, the current assets also increased due to the growth-related rise in trade receivables.
The liabilities (current and non-current) increased by a total of EUR 101.4 million. On the one hand, the non-current liabilities increased essentially due to the uptake of a loan from the European Investment Bank of EUR 120.0 million and the first-time application of IFRS 16 and the associated recognition of leasing liabilities of around EUR 39 million. On the other hand, the decrease in current liabilities is for the most part due to the fact that a Supplier Finance Program existing between Group companies was not utilized by June 30th 2019 (effect on current financial liabilities of EUR -36.9 million).
In the first half-year of 2019 it was possible to return the capital commitment in working capital, which was increased on December 31st 2018 due to short-term shifts in production plans at year end, to the normal level. The increase of EUR 29 million compared to the previous year was due to higher revenues.
The equity increased during the first six months by EUR 7.0 million from EUR 550.8 million to EUR 557.8 million. On the one hand, equity was boosted by the net result for the period of EUR 29.3 million, while on the other hand, it was reduced by dividend payments of EUR 20.2 million. The other effects essentially concern the recognition of foreign currency differences with no effect on profit or loss, the measurement of financial instruments and the revaluation of net debt from defined benefit plans.
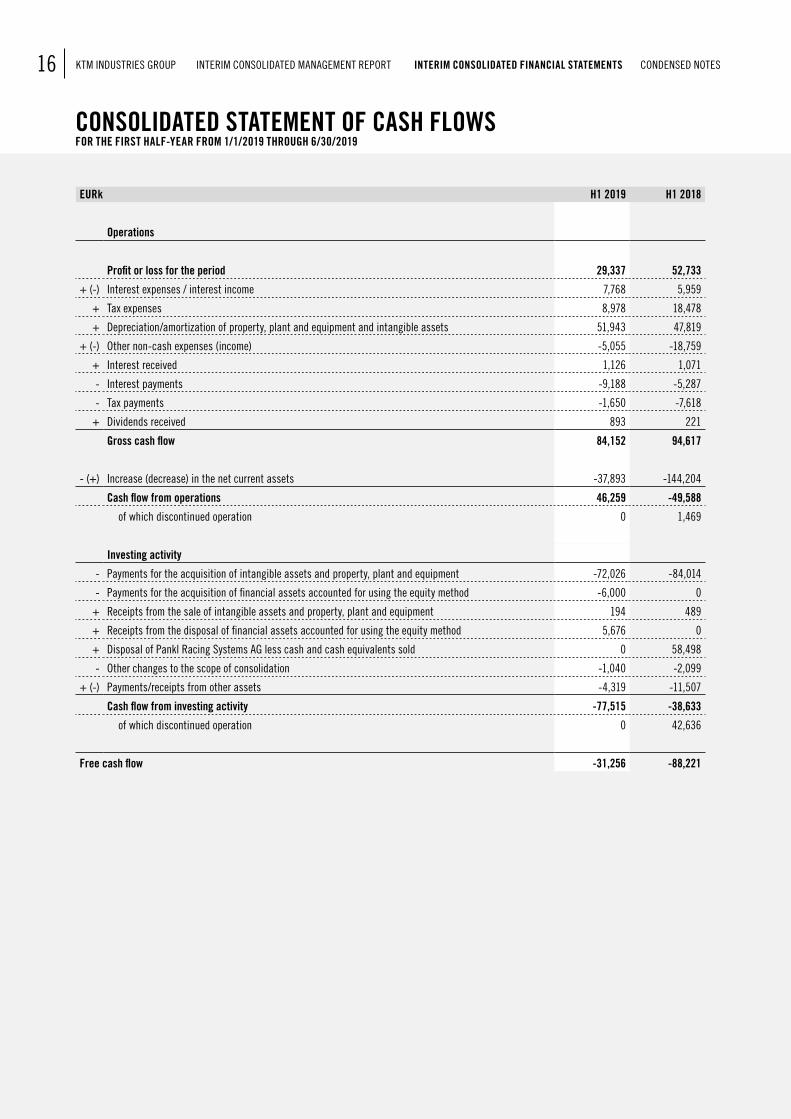
LIQUIDITY ANALYSIS
The cash flow from operating activities was EUR 46.3 million in the first half-year of 2019, and was therefore significantly above the previous year’s value of EUR -49.6 million, for which in particular the planned reduction in working capital was primarily responsible.
The cash outflow from investments amounted to EUR -77.5 million and overall stands below the previous year’s level of EUR -38.6 million. The previ-ous year’s figure is positively influenced by payments received from the sale of the Pankl Group of EUR 58.5 million (including disposed cash of the Pankl Group of EUR 9.1 million). Adjusted for the Pankl effect, the investment cash flow was therefore also improved.
As a result, the free cash flow was significantly increased in the first half-year by around EUR 57 million compared with the same period of the previ-ous year.
8 KTM INDUSTRIES GROUP INTERIM CONSOLIDATED MANAGEMENT REPORT INTERIM CONSOLIDATED FINANCIAL STATEMENTS CONDENSED NOTES
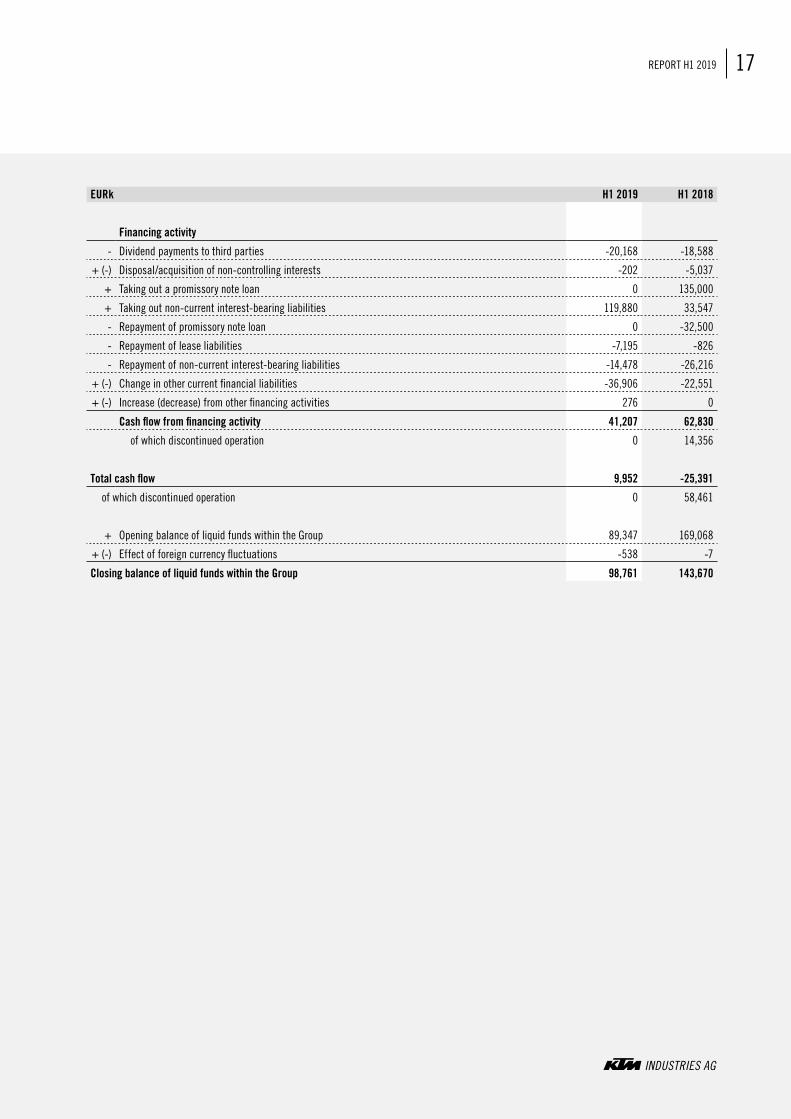
After taking into account the cash flow from financing activities amounting to EUR 41.2 million, cash and cash equivalents increased by EUR 9.4 million (including foreign currency effects of EUR -0.5 million) to EUR 98.8 million compared to December 31st 2018. In addition to dividend payments of EUR -20.2 million, the financing cash flow was primarily characterized by the uptake of a loan from the European Investment Bank of EUR 120.0 million and the repayment of financial liabilities of EUR 58.6 million.
INVESTMENTS
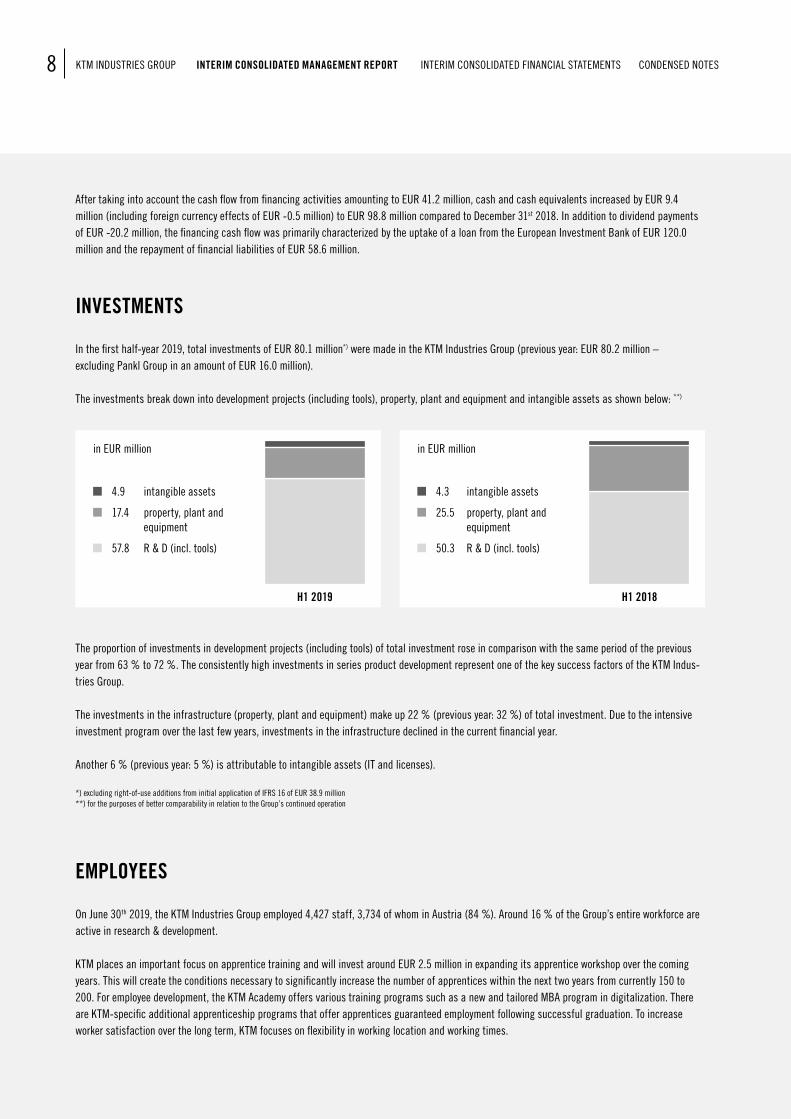
In the first half-year 2019, total investments of EUR 80.1 million*) were made in the KTM Industries Group (previous year: EUR 80.2 million – excluding Pankl Group in an amount of EUR 16.0 million).
The investments break down into development projects (including tools), property, plant and equipment and intangible assets as shown below: **)
4.9 intangible assets
17.4 property, plant and equipment
57.8 R & D (incl. tools)
in EUR million
H1 2019
4.3 intangible assets
25.5 property, plant and equipment
50.3 R & D (incl. tools)
in EUR million
H1 2018
The proportion of investments in development projects (including tools) of total investment rose in comparison with the same period of the previous year from 63 % to 72 %. The consistently high investments in series product development represent one of the key success factors of the KTM Indus-tries Group.
The investments in the infrastructure (property, plant and equipment) make up 22 % (previous year: 32 %) of total investment. Due to the intensive investment program over the last few years, investments in the infrastructure declined in the current financial year.
Another 6 % (previous year: 5 %) is attributable to intangible assets (IT and licenses).
*) excluding right-of-use additions from initial application of IFRS 16 of EUR 38.9 million**) for the purposes of better comparability in relation to the Group’s continued operation
EMPLOYEES
On June 30th 2019, the KTM Industries Group employed 4,427 staff, 3,734 of whom in Austria (84 %). Around 16 % of the Group’s entire workforce are active in research & development.
KTM places an important focus on apprentice training and will invest around EUR 2.5 million in expanding its apprentice workshop over the coming years. This will create the conditions necessary to significantly increase the number of apprentices within the next two years from currently 150 to 200. For employee development, the KTM Academy offers various training programs such as a new and tailored MBA program in digitalization. There are KTM-specific additional apprenticeship programs that offer apprentices guaranteed employment following successful graduation. To increase worker satisfaction over the long term, KTM focuses on flexibility in working location and working times.
9REPORT H1 2019KTM INDUSTRIES GROUP INTERIM CONSOLIDATED MANAGEMENT REPORT INTERIM CONSOLIDATED FINANCIAL STATEMENTS CONDENSED NOTES
RISK REPORT
For details of the risk report, please refer to the consolidated financial statements as at December 31st 2018. There have been no changes to the risk assessment since that time.
RELATED PARTY DISCLOSURES
Please refer to the notes to the interim financial statements for information.
EVENTS AFTER THE REPORTING DATE
Please refer to the notes to the interim financial statements for information.
OUTLOOK
In the 2019 financial year, KTM Industries Group expects a positive trend in the European motorcycle market. A further slight market decline is expected for the American market due to the continuing weakness of the Cruiser segment. The objective is to further increase the market shares in the markets that are important to KTM and Husqvarna, despite a challenging global economic environment. Following the relocation of production of Husqvarna road motorcycles (up to 400 cm³) to our strategic partner Bajaj at the end of 2019, we anticipate the largest relative growth rates above all in the ASEAN region and in India.
The complete takeover of the company shares in Motorcycle Distributors Australia Pty Ltd, means the subsidiaries in Australia and New Zealand are supported and our presence in the Australian and New Zealand market is given a boost from the second half-year of 2019.
The investment focus for 2019 will be on new development projects in particular.
At around 8 % of revenue, investments in research & development will remain at the high level seen in previous years.
For the 2019 financial year the Executive Board expects consolidated sales growth (continued operation) between 3 % and 5 % and operating EBIT of over EUR 130 million. As a result of the measures taken in the first half of the year to reduce the working capital, the free cash flow will be above the guidance.
Wels, August 26th 2019
The Executive Board of KTM Industries AG
Dipl.-Ing. Stefan Pierer, CEO Mag. Friedrich Roithner, CFO Mag. Ing. Hubert Trunkenpolz, CSO
10 KTM INDUSTRIES GROUP INTERIM CONSOLIDATED MANAGEMENT REPORT INTERIM CONSOLIDATED FINANCIAL STATEMENTS CONDENSED NOTES
CONSOLIDATED INCOME STATEMENT FOR THE FIRST HALF-YEAR FROM 1/1/2019 THROUGH 6/30/2019
EURk H1 2019 H1 2018Continued operation
of the Group
Discontinued operation(IFRS 5)
Total Continued operation
of the Group
Discontinued operation(IFRS 5)
Total
Operating activities
Result from the sale
Operating activities
Result from the sale
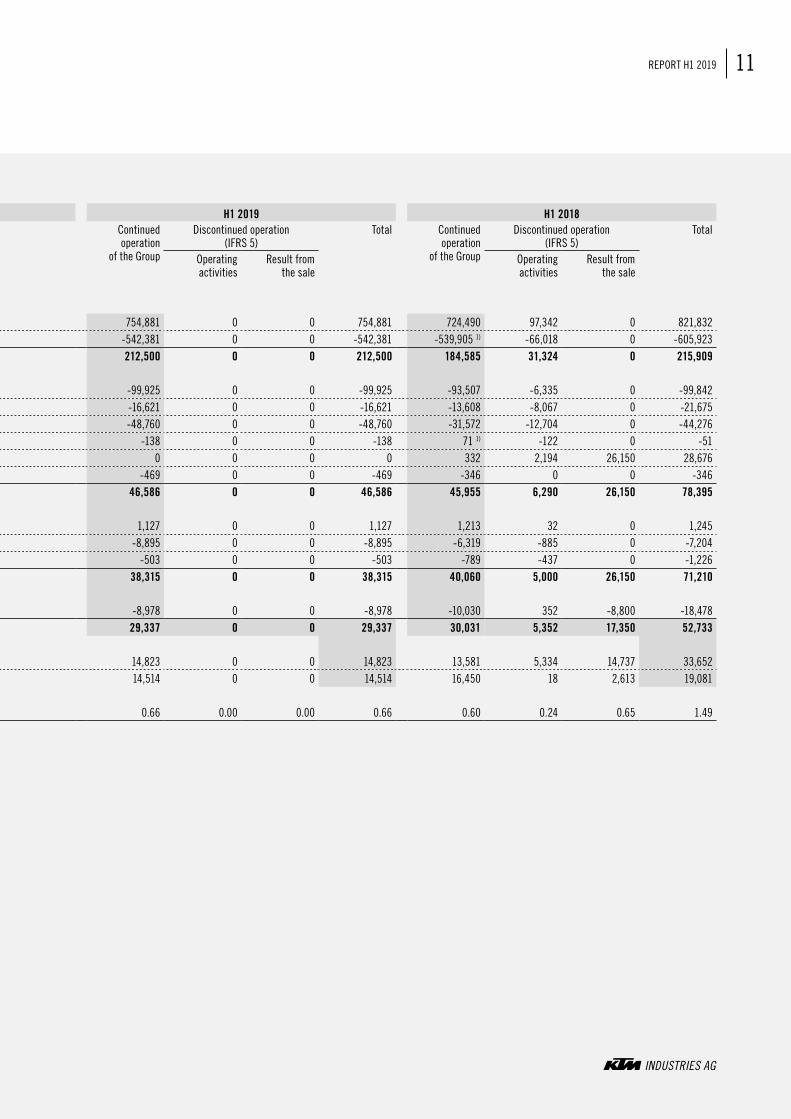
Revenue 754,881 0 0 754,881 724,490 97,342 0 821,832Production costs of the services provided to generate the revenue -542,381 0 0 -542,381 -539,905 1) -66,018 0 -605,923Gross profit from sales 212,500 0 0 212,500 184,585 31,324 0 215,909
Selling and racing expenses -99,925 0 0 -99,925 -93,507 -6,335 0 -99,842Research and development expenses -16,621 0 0 -16,621 -13,608 -8,067 0 -21,675Administration expenses -48,760 0 0 -48,760 -31,572 -12,704 0 -44,276Other operating expenses -138 0 0 -138 71 1) -122 0 -51Other operating income 0 0 0 0 332 2,194 26,150 28,676Earnings from at-equity holdings -469 0 0 -469 -346 0 0 -346Result from operating activities 46,586 0 0 46,586 45,955 6,290 26,150 78,395
Interest income 1,127 0 0 1,127 1,213 32 0 1,245Interest expenses -8,895 0 0 -8,895 -6,319 -885 0 -7,204Other financial and investment income (expenses) -503 0 0 -503 -789 -437 0 -1,226Result before taxes 38,315 0 0 38,315 40,060 5,000 26,150 71,210
Income taxes -8,978 0 0 -8,978 -10,030 352 -8,800 -18,478Profit or loss for the period 29,337 0 0 29,337 30,031 5,352 17,350 52,733
thereof owners of the parent company 14,823 0 0 14,823 13,581 5,334 14,737 33,652 thereof non-controlling shareholders 14,514 0 0 14,514 16,450 18 2,613 19,081
Undiluted (=diluted) earnings per share (EUR) 0.66 0.00 0.00 0.66 0.60 0.24 0.65 1.49
Presentation of income statement in accordance with IAS 1
1) adjusted, see Notes „Principles of financial reporting“
11REPORT H1 2019KTM INDUSTRIES GROUP INTERIM CONSOLIDATED MANAGEMENT REPORT INTERIM CONSOLIDATED FINANCIAL STATEMENTS CONDENSED NOTES
EURk H1 2019 H1 2018Continued operation
of the Group
Discontinued operation(IFRS 5)
Total Continued operation
of the Group
Discontinued operation(IFRS 5)
Total
Operating activities
Result from the sale
Operating activities
Result from the sale
Revenue 754,881 0 0 754,881 724,490 97,342 0 821,832Production costs of the services provided to generate the revenue -542,381 0 0 -542,381 -539,905 1) -66,018 0 -605,923Gross profit from sales 212,500 0 0 212,500 184,585 31,324 0 215,909
Selling and racing expenses -99,925 0 0 -99,925 -93,507 -6,335 0 -99,842Research and development expenses -16,621 0 0 -16,621 -13,608 -8,067 0 -21,675Administration expenses -48,760 0 0 -48,760 -31,572 -12,704 0 -44,276Other operating expenses -138 0 0 -138 71 1) -122 0 -51Other operating income 0 0 0 0 332 2,194 26,150 28,676Earnings from at-equity holdings -469 0 0 -469 -346 0 0 -346Result from operating activities 46,586 0 0 46,586 45,955 6,290 26,150 78,395
Interest income 1,127 0 0 1,127 1,213 32 0 1,245Interest expenses -8,895 0 0 -8,895 -6,319 -885 0 -7,204Other financial and investment income (expenses) -503 0 0 -503 -789 -437 0 -1,226Result before taxes 38,315 0 0 38,315 40,060 5,000 26,150 71,210
Income taxes -8,978 0 0 -8,978 -10,030 352 -8,800 -18,478Profit or loss for the period 29,337 0 0 29,337 30,031 5,352 17,350 52,733
thereof owners of the parent company 14,823 0 0 14,823 13,581 5,334 14,737 33,652 thereof non-controlling shareholders 14,514 0 0 14,514 16,450 18 2,613 19,081
Undiluted (=diluted) earnings per share (EUR) 0.66 0.00 0.00 0.66 0.60 0.24 0.65 1.49
Presentation of income statement in accordance with IAS 1
12 KTM INDUSTRIES GROUP INTERIM CONSOLIDATED MANAGEMENT REPORT INTERIM CONSOLIDATED FINANCIAL STATEMENTS CONDENSED NOTES
CONSOLIDATED STATEMENT OF COMPREHENSIVE INCOME FOR THE FIRST HALF-YEAR FROM 1/1/2019 THROUGH 6/30/2019
EURk H1 2019 H1 2018Continued operation
of the Group
Discontinued operation (IFRS 5)
Total Continued operation
of the Group
Discontinued operation (IFRS 5)
Total
Operating activities
Result from the sale
Operating activities
Result from the sale
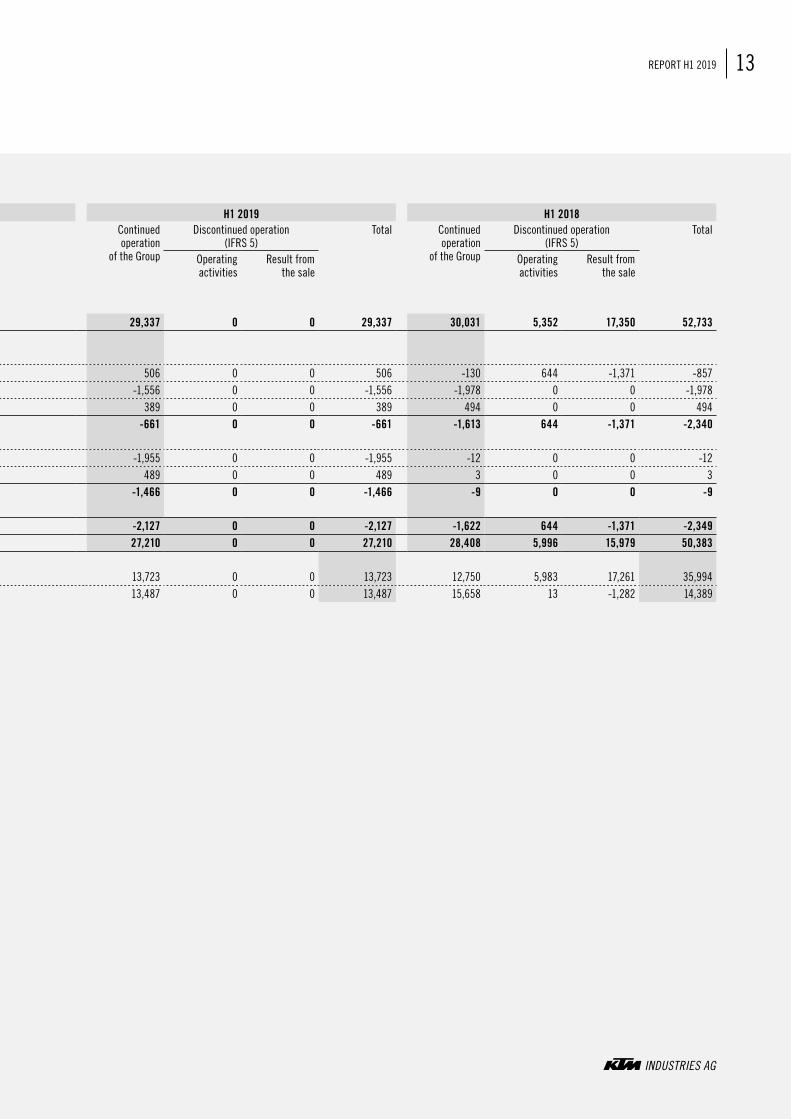
Profit or loss for the period 29,337 0 0 29,337 30,031 5,352 17,350 52,733
Items reclassified to profit or loss or which can be subsequently reclassified Foreign currency translation 506 0 0 506 -130 644 -1,371 -857 Valuation of cash flow hedges -1,556 0 0 -1,556 -1,978 0 0 -1,978 Deferred tax on valuation of cash flow hedges 389 0 0 389 494 0 0 494
-661 0 0 -661 -1,613 644 -1,371 -2,340Items not reclassified to profit or loss Revaluation of net debt from defined benefit plans -1,955 0 0 -1,955 -12 0 0 -12 Tax effect 489 0 0 489 3 0 0 3
-1,466 0 0 -1,466 -9 0 0 -9
Other net result after tax -2,127 0 0 -2,127 -1,622 644 -1,371 -2,349Total comprehensive income 27,210 0 0 27,210 28,408 5,996 15,979 50,383
thereof owners of the parent company 13,723 0 0 13,723 12,750 5,983 17,261 35,994 thereof non-controlling shareholders 13,487 0 0 13,487 15,658 13 -1,282 14,389
Presentation of comprehensive income statement in accordance with IAS 1
13REPORT H1 2019KTM INDUSTRIES GROUP INTERIM CONSOLIDATED MANAGEMENT REPORT INTERIM CONSOLIDATED FINANCIAL STATEMENTS CONDENSED NOTES
EURk H1 2019 H1 2018Continued operation
of the Group
Discontinued operation (IFRS 5)
Total Continued operation
of the Group
Discontinued operation (IFRS 5)
Total
Operating activities
Result from the sale
Operating activities
Result from the sale
Profit or loss for the period 29,337 0 0 29,337 30,031 5,352 17,350 52,733
Items reclassified to profit or loss or which can be subsequently reclassified Foreign currency translation 506 0 0 506 -130 644 -1,371 -857 Valuation of cash flow hedges -1,556 0 0 -1,556 -1,978 0 0 -1,978 Deferred tax on valuation of cash flow hedges 389 0 0 389 494 0 0 494
-661 0 0 -661 -1,613 644 -1,371 -2,340Items not reclassified to profit or loss Revaluation of net debt from defined benefit plans -1,955 0 0 -1,955 -12 0 0 -12 Tax effect 489 0 0 489 3 0 0 3
-1,466 0 0 -1,466 -9 0 0 -9
Other net result after tax -2,127 0 0 -2,127 -1,622 644 -1,371 -2,349Total comprehensive income 27,210 0 0 27,210 28,408 5,996 15,979 50,383
thereof owners of the parent company 13,723 0 0 13,723 12,750 5,983 17,261 35,994 thereof non-controlling shareholders 13,487 0 0 13,487 15,658 13 -1,282 14,389
Presentation of comprehensive income statement in accordance with IAS 1
14 KTM INDUSTRIES GROUP INTERIM CONSOLIDATED MANAGEMENT REPORT INTERIM CONSOLIDATED FINANCIAL STATEMENTS CONDENSED NOTES
CONSOLIDATED STATEMENT OF FINANCIAL POSITION AS AT JUNE 30, 2019
EURk 06/30/2019 12/31/2018
Assets:
Non-current assets:
Property, plant, and equipment 324,566 283,353
Goodwill 97,116 96,172
Intangible assets 351,991 326,561
Investments accounted for using the equity method 19,158 26,138
Deferred tax assets 3,141 3,026
Other non-current assets 8,458 9,354
804,430 744,604
Current assets:
Inventories 284,127 286,530
Trade receivables 173,737 149,357
Receivables and other assets 88,537 70,539
Tax refund claims 12,678 13,499
Cash and cash equivalents 98,761 89,347
657,840 609,272
1,462,269 1,353,876
15REPORT H1 2019KTM INDUSTRIES GROUP INTERIM CONSOLIDATED MANAGEMENT REPORT INTERIM CONSOLIDATED FINANCIAL STATEMENTS CONDENSED NOTES
EURk 06/30/2019 12/31/2018
Equity and liabilities:
Equity:
Share capital 22,539 22,539
Capital reserves 9,949 9,949
Other reserves including retained earnings 271,849 264,933
Equity of the owners of the parent company 304,338 297,421
Non-controlling interests 253,446 253,355
557,784 550,776
Non-current liabilities:
Financial liabilities 474,294 339,449
Liabilities for employee benefits 27,497 25,036
Deferred tax liabilities 68,509 63,039
Other non-current liabilities 6,994 7,303
577,294 434,827
Current liabilities:
Financial liabilities 44,841 73,163
Trade payables 187,236 190,611
Provisions 16,026 14,731
Tax liabilities 3,574 2,864
Other current liabilities 75,515 86,904
327,192 368,273
1,462,269 1,353,876
16 KTM INDUSTRIES GROUP INTERIM CONSOLIDATED MANAGEMENT REPORT INTERIM CONSOLIDATED FINANCIAL STATEMENTS CONDENSED NOTES
CONSOLIDATED STATEMENT OF CASH FLOWSFOR THE FIRST HALF-YEAR FROM 1/1/2019 THROUGH 6/30/2019
EURk H1 2019 H1 2018
Operations
Profit or loss for the period 29,337 52,733
+ (-) Interest expenses / interest income 7,768 5,959
+ Tax expenses 8,978 18,478
+ Depreciation/amortization of property, plant and equipment and intangible assets 51,943 47,819
+ (-) Other non-cash expenses (income) -5,055 -18,759
+ Interest received 1,126 1,071
- Interest payments -9,188 -5,287
- Tax payments -1,650 -7,618
+ Dividends received 893 221
Gross cash flow 84,152 94,617
- (+) Increase (decrease) in the net current assets -37,893 -144,204
Cash flow from operations 46,259 -49,588
of which discontinued operation 0 1,469
Investing activity
- Payments for the acquisition of intangible assets and property, plant and equipment -72,026 -84,014
- Payments for the acquisition of financial assets accounted for using the equity method -6,000 0
+ Receipts from the sale of intangible assets and property, plant and equipment 194 489
+ Receipts from the disposal of financial assets accounted for using the equity method 5,676 0
+ Disposal of Pankl Racing Systems AG less cash and cash equivalents sold 0 58,498
- Other changes to the scope of consolidation -1,040 -2,099
+ (-) Payments/receipts from other assets -4,319 -11,507
Cash flow from investing activity -77,515 -38,633
of which discontinued operation 0 42,636
Free cash flow -31,256 -88,221
17REPORT H1 2019KTM INDUSTRIES GROUP INTERIM CONSOLIDATED MANAGEMENT REPORT INTERIM CONSOLIDATED FINANCIAL STATEMENTS CONDENSED NOTES
EURk H1 2019 H1 2018
Financing activity
- Dividend payments to third parties -20,168 -18,588
+ (-) Disposal/acquisition of non-controlling interests -202 -5,037
+ Taking out a promissory note loan 0 135,000
+ Taking out non-current interest-bearing liabilities 119,880 33,547
- Repayment of promissory note loan 0 -32,500
- Repayment of lease liabilities -7,195 -826
- Repayment of non-current interest-bearing liabilities -14,478 -26,216
+ (-) Change in other current financial liabilities -36,906 -22,551
+ (-) Increase (decrease) from other financing activities 276 0
Cash flow from financing activity 41,207 62,830
of which discontinued operation 0 14,356
Total cash flow 9,952 -25,391
of which discontinued operation 0 58,461
+ Opening balance of liquid funds within the Group 89,347 169,068
+ (-) Effect of foreign currency fluctuations -538 -7
Closing balance of liquid funds within the Group 98,761 143,670
18 KTM INDUSTRIES GROUP INTERIM CONSOLIDATED MANAGEMENT REPORT INTERIM CONSOLIDATED FINANCIAL STATEMENTS CONDENSED NOTES
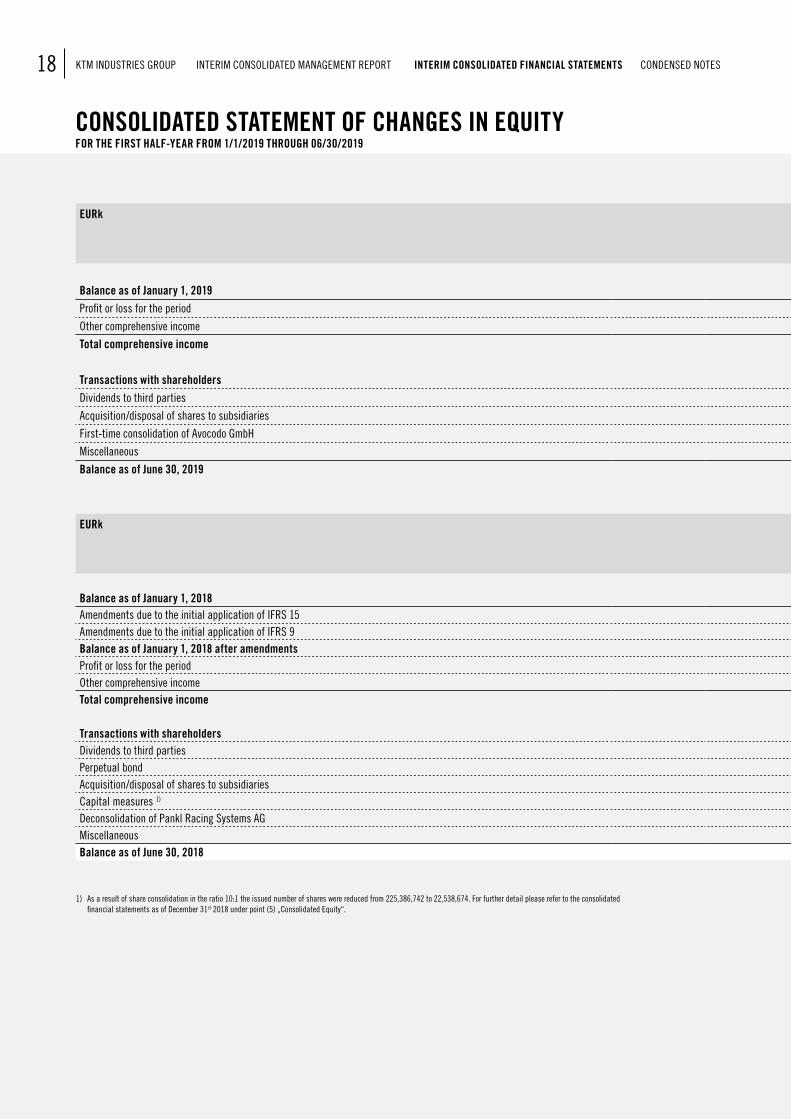
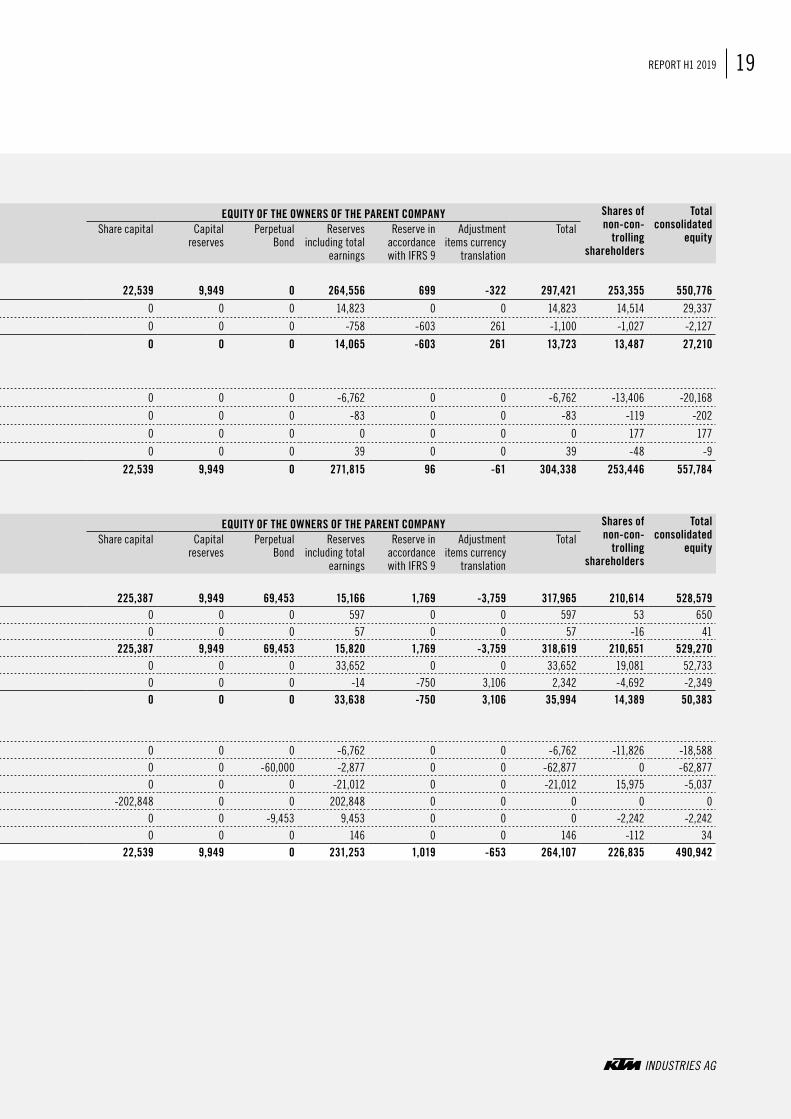
CONSOLIDATED STATEMENT OF CHANGES IN EQUITYFOR THE FIRST HALF-YEAR FROM 1/1/2019 THROUGH 06/30/2019
EURk EQUITY OF THE OWNERS OF THE PARENT COMPANY Shares of non-con-
trolling shareholders
Total consolidated
equityShare capital Capital
reservesPerpetual
BondReserves
including total earnings
Reserve in accordance with IFRS 9
Adjustment items currency
translation
Total
Balance as of January 1, 2019 22,539 9,949 0 264,556 699 -322 297,421 253,355 550,776Profit or loss for the period 0 0 0 14,823 0 0 14,823 14,514 29,337
Other comprehensive income 0 0 0 -758 -603 261 -1,100 -1,027 -2,127
Total comprehensive income 0 0 0 14,065 -603 261 13,723 13,487 27,210
Transactions with shareholdersDividends to third parties 0 0 0 -6,762 0 0 -6,762 -13,406 -20,168
Acquisition/disposal of shares to subsidiaries 0 0 0 -83 0 0 -83 -119 -202
First-time consolidation of Avocodo GmbH 0 0 0 0 0 0 0 177 177
Miscellaneous 0 0 0 39 0 0 39 -48 -9
Balance as of June 30, 2019 22,539 9,949 0 271,815 96 -61 304,338 253,446 557,784
EURk EQUITY OF THE OWNERS OF THE PARENT COMPANY Shares of non-con-
trolling shareholders
Total consolidated
equityShare capital Capital
reservesPerpetual
BondReserves
including total earnings
Reserve in accordance with IFRS 9
Adjustment items currency
translation
Total
Balance as of January 1, 2018 225,387 9,949 69,453 15,166 1,769 -3,759 317,965 210,614 528,579Amendments due to the initial application of IFRS 15 0 0 0 597 0 0 597 53 650Amendments due to the initial application of IFRS 9 0 0 0 57 0 0 57 -16 41Balance as of January 1, 2018 after amendments 225,387 9,949 69,453 15,820 1,769 -3,759 318,619 210,651 529,270Profit or loss for the period 0 0 0 33,652 0 0 33,652 19,081 52,733Other comprehensive income 0 0 0 -14 -750 3,106 2,342 -4,692 -2,349Total comprehensive income 0 0 0 33,638 -750 3,106 35,994 14,389 50,383
Transactions with shareholdersDividends to third parties 0 0 0 -6,762 0 0 -6,762 -11,826 -18,588Perpetual bond 0 0 -60,000 -2,877 0 0 -62,877 0 -62,877Acquisition/disposal of shares to subsidiaries 0 0 0 -21,012 0 0 -21,012 15,975 -5,037Capital measures 1) -202,848 0 0 202,848 0 0 0 0 0Deconsolidation of Pankl Racing Systems AG 0 0 -9,453 9,453 0 0 0 -2,242 -2,242Miscellaneous 0 0 0 146 0 0 146 -112 34Balance as of June 30, 2018 22,539 9,949 0 231,253 1,019 -653 264,107 226,835 490,942
1) As a result of share consolidation in the ratio 10:1 the issued number of shares were reduced from 225,386,742 to 22,538,674. For further detail please refer to the consolidated financial statements as of December 31st 2018 under point (5) „Consolidated Equity“.
19REPORT H1 2019KTM INDUSTRIES GROUP INTERIM CONSOLIDATED MANAGEMENT REPORT INTERIM CONSOLIDATED FINANCIAL STATEMENTS CONDENSED NOTES
EURk EQUITY OF THE OWNERS OF THE PARENT COMPANY Shares of non-con-
trolling shareholders
Total consolidated
equityShare capital Capital
reservesPerpetual
BondReserves
including total earnings
Reserve in accordance with IFRS 9
Adjustment items currency
translation
Total
Balance as of January 1, 2019 22,539 9,949 0 264,556 699 -322 297,421 253,355 550,776Profit or loss for the period 0 0 0 14,823 0 0 14,823 14,514 29,337
Other comprehensive income 0 0 0 -758 -603 261 -1,100 -1,027 -2,127
Total comprehensive income 0 0 0 14,065 -603 261 13,723 13,487 27,210
Transactions with shareholdersDividends to third parties 0 0 0 -6,762 0 0 -6,762 -13,406 -20,168
Acquisition/disposal of shares to subsidiaries 0 0 0 -83 0 0 -83 -119 -202
First-time consolidation of Avocodo GmbH 0 0 0 0 0 0 0 177 177
Miscellaneous 0 0 0 39 0 0 39 -48 -9
Balance as of June 30, 2019 22,539 9,949 0 271,815 96 -61 304,338 253,446 557,784
EURk EQUITY OF THE OWNERS OF THE PARENT COMPANY Shares of non-con-
trolling shareholders
Total consolidated
equityShare capital Capital
reservesPerpetual
BondReserves
including total earnings
Reserve in accordance with IFRS 9
Adjustment items currency
translation
Total
Balance as of January 1, 2018 225,387 9,949 69,453 15,166 1,769 -3,759 317,965 210,614 528,579Amendments due to the initial application of IFRS 15 0 0 0 597 0 0 597 53 650Amendments due to the initial application of IFRS 9 0 0 0 57 0 0 57 -16 41Balance as of January 1, 2018 after amendments 225,387 9,949 69,453 15,820 1,769 -3,759 318,619 210,651 529,270Profit or loss for the period 0 0 0 33,652 0 0 33,652 19,081 52,733Other comprehensive income 0 0 0 -14 -750 3,106 2,342 -4,692 -2,349Total comprehensive income 0 0 0 33,638 -750 3,106 35,994 14,389 50,383
Transactions with shareholdersDividends to third parties 0 0 0 -6,762 0 0 -6,762 -11,826 -18,588Perpetual bond 0 0 -60,000 -2,877 0 0 -62,877 0 -62,877Acquisition/disposal of shares to subsidiaries 0 0 0 -21,012 0 0 -21,012 15,975 -5,037Capital measures 1) -202,848 0 0 202,848 0 0 0 0 0Deconsolidation of Pankl Racing Systems AG 0 0 -9,453 9,453 0 0 0 -2,242 -2,242Miscellaneous 0 0 0 146 0 0 146 -112 34Balance as of June 30, 2018 22,539 9,949 0 231,253 1,019 -653 264,107 226,835 490,942
20 KTM INDUSTRIES GROUP INTERIM CONSOLIDATED MANAGEMENT REPORT INTERIM CONSOLIDATED FINANCIAL STATEMENTS CONDENSED NOTES
COMPANY INFORMATION
The KTM Industries Group is Europe’s largest manufacturer of motorcycles with a focus on highly innovative sports motorcycles and electric mobility. Its globally recognized brands KTM, Husqvarna Motorcycles, and WP make it a technology and market leader in its respective segments.
KTM Industries AG has its headquarters at Edisonstrasse 1, 4600 Wels, and is registered in the commercial register at the Provincial Court as Com-mercial Court of Wels, under the registration number FN 78112 x.
The stocks of KTM Industries AG are listed on the “Swiss Performance Index (SPI)” of the SIX Swiss Exchange in Zurich and on the Vienna Stock Exchange in the “standard market auction” segment.
PRINCIPLES OF FINANCIAL REPORTING
The condensed interim consolidated financial statements for the reporting period from January 1st until June 30th 2019 of KTM Industries AG were prepared in accordance with the International Financial Reporting Standards (IFRS), as applied in the EU, applying IAS 34 (interim reporting).
These condensed interim consolidated financial statements for the first half-year 2019 have not been audited or been subject to review.
The condensed interim consolidated financial statements do not include all of the notes and disclosures required for year-end consolidated financial statements and should therefore be read in conjunction with the consolidated financial statements as of December 31st 2018.
The interim consolidated financial statements are prepared in euros, which is the functional currency of the parent company. Unless specifically indicated, all amounts are rounded to the nearest 1,000 euros (EURk), which may give rise to rounding differences. The use of automated calculating tools may result in rounding differences with accumulation of rounded figures and with percentages.
The accounting policies used on December 31st 2018 were applied without change, with the exception of the IFRS, the use of which is mandatory from January 1st 2019. The financial reporting of the companies included in the condensed interim consolidated financial statements is subject to uniform accounting principles, and these principles were applied by all consolidated entities.
Pursuant to IAS 34, income tax expenses for the interim consolidated financial statements have been calculated using the average annual tax rate expected for the financial year as a whole.
The provisions for obligations for severance pay and anniversary bonuses were measured according to the years of service method (projected unit credit method). Actuarial reports for the measurement are generated as of the end of the reporting period. These values are adjusted for the interim consolidated financial statements. If significant changes to the parameters occur during the year the net debt is revalued. As of June 30th 2019 the applicable interest rate was reduced from 2.0 % to 1.3 %.
At the start of the financial year, the presentation of product-specific warranty expenses within the Group‘s income statement was adjusted with retroactive effect. As of 2019, product-specific warranty expenses of EUR 11.8 million (previous year: EUR 14.9 million) will be reported in the cost of sales. These were previously reported in the other operating expenses.
CONDENSED NOTES TO THE CONSOLIDATED FINANCIAL STATEMENTS FOR THE FIRST HALF-YEAR 2019
21REPORT H1 2019KTM INDUSTRIES GROUP INTERIM CONSOLIDATED MANAGEMENT REPORT INTERIM CONSOLIDATED FINANCIAL STATEMENTS CONDENSED NOTES
NEWLY APPLIED STANDARDS AND INTERPRETATIONS
The table below shows the standards and interpretations mandatorily applied for the first time that had also already been endorsed by the European Commission as of January 1st 2019:
First-time application New standards and interpretations Published by the IASBJanuary 1st 2019
Amendments to IFRS 9: Financial assets with Negative Compensation October 12th 2017IFRIC 23: Uncertainty over Income Tax Treatments June 7th 2017Annual Improvements to IFRS 2015-2017: Amendments to IFRS 3, IFRS 11, IAS 12 and IAS 23
December 12th 2017
Amendments to IAS 19: Plan Amendment, Curtailment or Settlement February 7th 2018Amendments to IAS 28: Long-term Investments in Associates and Joint Ventures October 12th 2017IFRS 16 Leases January 13th 2016
The first-time application of IFRS 16 has effects on the consolidated financial statements of KTM Industries AG. All other amended standards and interpretations are either irrelevant to the KTM Industries Group or have no material impact.
IFRS 16 governs the identification, recognition, measurement, reporting, and disclosure requirements for leasing agreements. The standard specifies a single accounting treatment for lessees. This model requires the lessee to record all assets and liabilities under lease arrangements in the statement of financial position, except where the lease is for a term of twelve months or fewer or the asset is of low value (in which cases application is optional).
For the consolidated financial statements of KTM Industries AG, IFRS 16 is recognized from January 1st 2019 using modified retrospective recognition. The comparative figures for the 2018 financial year were therefore not adjusted. In applying IFRS 16 for the first time, the KTM Industries Group made use of the following concessions:
All leasing contracts that expire within 12 months from the date of initial application (i.e. by December 31st 2019) can be recognized as short-term leases. This option can be applied to each individual lease.
The right-of-use asset is capitalized in the amount of the leasing liability to ensure that the leasing liability as at January 1st 2019 corresponds to the right-of-use asset, meaning that no equity amendments are required.
The application of a single discount rate on a portfolio of similarly designed leasing contracts (similar characteristics). The non-consideration of initial direct costs in measuring the right-of-use assets on the date of first-time application. The retrospective determination of the term of leases in the case of contracts with extension or termination options.
The Group has also decided not to re-examine leasing contracts concluded and already recognized pursuant to IAS 17 before the transition date as to whether a contract is, or includes, a lease on the date of first-time application, but rather to maintain the assessment previously made under IAS 17.
In the case of finance leases for which KTM Industries is the lessee, assets and liabilities have already been recognized in the previous year pursuant to IAS 17. The existing carrying amount of the leased asset pursuant to IAS 17 existing immediately before the initial application of IFRS 16 and the carrying value of the leasing liability pursuant to IAS 17 is recognized as first-time carrying value of the right-of-use asset and the leasing liability pursuant to IFRS 16. The accounting principles of IFRS 16 will be applied from this point onwards; no measurement adjustments to that effect were made.
The irredeemable term of the lease was used to determine the present value of the lease payments. In determining the term, the management takes account of all facts and circumstances that offer economic incentive for the exercise of options for prolongation or non-exercise of termination op-tions. Term alterations are then integrated into the contractual term only if an extension or non-exercise of a termination option is sufficiently certain.
22 KTM INDUSTRIES GROUP INTERIM CONSOLIDATED MANAGEMENT REPORT INTERIM CONSOLIDATED FINANCIAL STATEMENTS CONDENSED NOTES
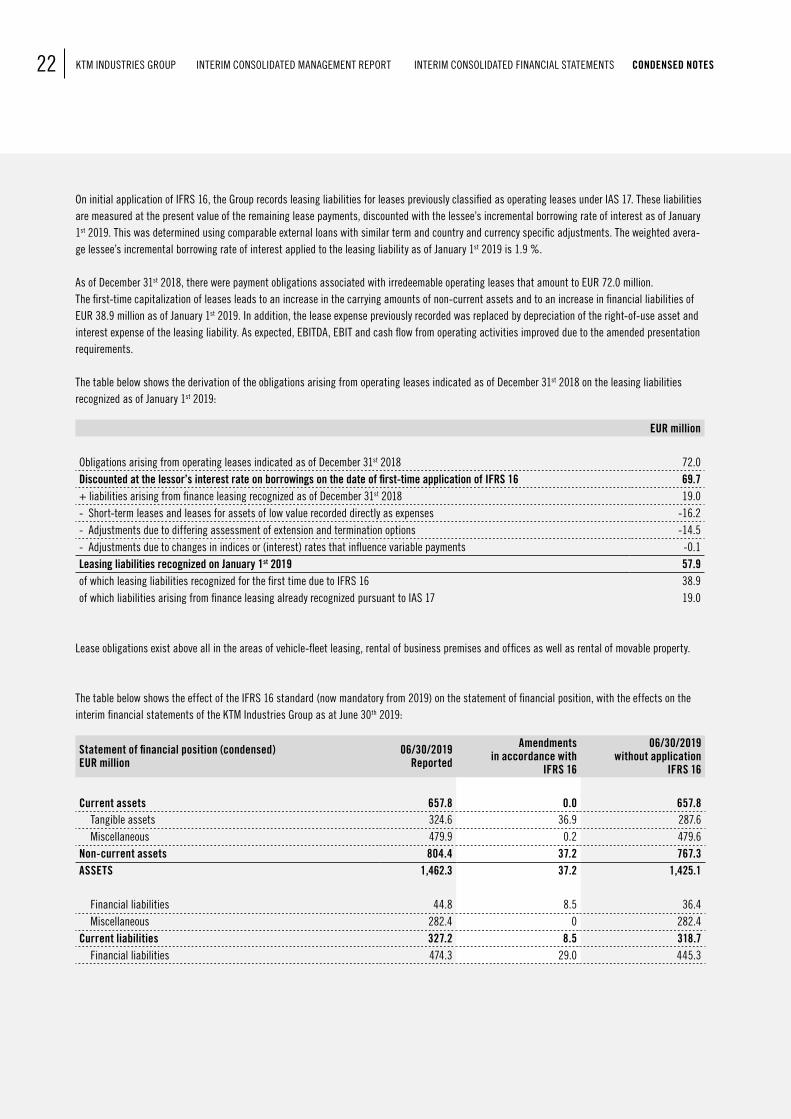
On initial application of IFRS 16, the Group records leasing liabilities for leases previously classified as operating leases under IAS 17. These liabilities are measured at the present value of the remaining lease payments, discounted with the lessee’s incremental borrowing rate of interest as of January 1st 2019. This was determined using comparable external loans with similar term and country and currency specific adjustments. The weighted avera-ge lessee’s incremental borrowing rate of interest applied to the leasing liability as of January 1st 2019 is 1.9 %.
As of December 31st 2018, there were payment obligations associated with irredeemable operating leases that amount to EUR 72.0 million. The first-time capitalization of leases leads to an increase in the carrying amounts of non-current assets and to an increase in financial liabilities of EUR 38.9 million as of January 1st 2019. In addition, the lease expense previously recorded was replaced by depreciation of the right-of-use asset and interest expense of the leasing liability. As expected, EBITDA, EBIT and cash flow from operating activities improved due to the amended presentation requirements.
The table below shows the derivation of the obligations arising from operating leases indicated as of December 31st 2018 on the leasing liabilities recognized as of January 1st 2019:
EUR million
Obligations arising from operating leases indicated as of December 31st 2018 72.0Discounted at the lessor’s interest rate on borrowings on the date of first-time application of IFRS 16 69.7+ liabilities arising from finance leasing recognized as of December 31st 2018 19.0- Short-term leases and leases for assets of low value recorded directly as expenses -16.2- Adjustments due to differing assessment of extension and termination options -14.5- Adjustments due to changes in indices or (interest) rates that influence variable payments -0.1Leasing liabilities recognized on January 1st 2019 57.9of which leasing liabilities recognized for the first time due to IFRS 16 38.9of which liabilities arising from finance leasing already recognized pursuant to IAS 17 19.0
Lease obligations exist above all in the areas of vehicle-fleet leasing, rental of business premises and offices as well as rental of movable property.
The table below shows the effect of the IFRS 16 standard (now mandatory from 2019) on the statement of financial position, with the effects on the interim financial statements of the KTM Industries Group as at June 30th 2019:
Statement of financial position (condensed)EUR million
06/30/2019Reported
Amendments in accordance with
IFRS 16
06/30/2019without application
IFRS 16
Current assets 657.8 0.0 657.8 Tangible assets 324.6 36.9 287.6 Miscellaneous 479.9 0.2 479.6Non-current assets 804.4 37.2 767.3ASSETS 1,462.3 37.2 1,425.1
Financial liabilities 44.8 8.5 36.4 Miscellaneous 282.4 0 282.4Current liabilities 327.2 8.5 318.7 Financial liabilities 474.3 29.0 445.3
23REPORT H1 2019KTM INDUSTRIES GROUP INTERIM CONSOLIDATED MANAGEMENT REPORT INTERIM CONSOLIDATED FINANCIAL STATEMENTS CONDENSED NOTES
Statement of financial position (condensed)EUR million
06/30/2019Reported
Amendments in accordance with
IFRS 16
06/30/2019without application
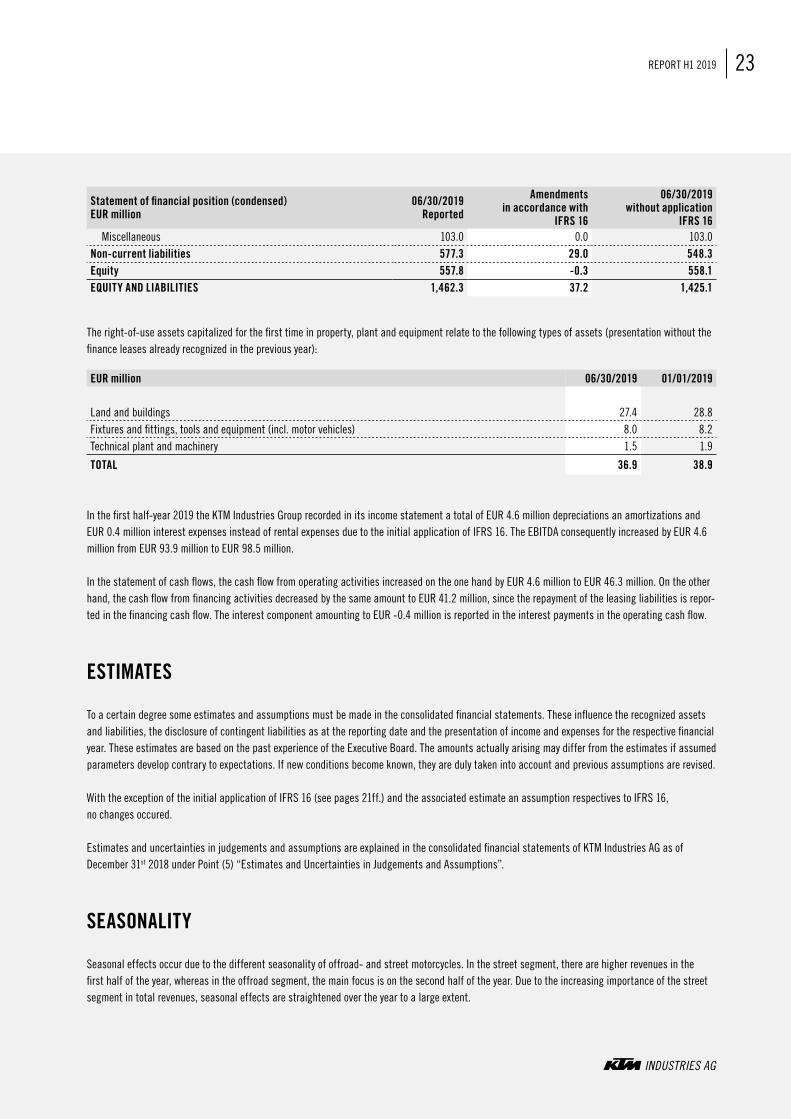
IFRS 16 Miscellaneous 103.0 0.0 103.0Non-current liabilities 577.3 29.0 548.3Equity 557.8 -0.3 558.1EQUITY AND LIABILITIES 1,462.3 37.2 1,425.1
The right-of-use assets capitalized for the first time in property, plant and equipment relate to the following types of assets (presentation without the finance leases already recognized in the previous year):
EUR million 06/30/2019 01/01/2019
Land and buildings 27.4 28.8Fixtures and fittings, tools and equipment (incl. motor vehicles) 8.0 8.2Technical plant and machinery 1.5 1.9
TOTAL 36.9 38.9
In the first half-year 2019 the KTM Industries Group recorded in its income statement a total of EUR 4.6 million depreciations an amortizations and EUR 0.4 million interest expenses instead of rental expenses due to the initial application of IFRS 16. The EBITDA consequently increased by EUR 4.6 million from EUR 93.9 million to EUR 98.5 million.
In the statement of cash flows, the cash flow from operating activities increased on the one hand by EUR 4.6 million to EUR 46.3 million. On the other hand, the cash flow from financing activities decreased by the same amount to EUR 41.2 million, since the repayment of the leasing liabilities is repor-ted in the financing cash flow. The interest component amounting to EUR -0.4 million is reported in the interest payments in the operating cash flow.
ESTIMATES
To a certain degree some estimates and assumptions must be made in the consolidated financial statements. These influence the recognized assets and liabilities, the disclosure of contingent liabilities as at the reporting date and the presentation of income and expenses for the respective financial year. These estimates are based on the past experience of the Executive Board. The amounts actually arising may differ from the estimates if assumed parameters develop contrary to expectations. If new conditions become known, they are duly taken into account and previous assumptions are revised.
With the exception of the initial application of IFRS 16 (see pages 21ff.) and the associated estimate an assumption respectives to IFRS 16, no changes occured.
Estimates and uncertainties in judgements and assumptions are explained in the consolidated financial statements of KTM Industries AG as of December 31st 2018 under Point (5) “Estimates and Uncertainties in Judgements and Assumptions”.
SEASONALITY
Seasonal effects occur due to the different seasonality of offroad- and street motorcycles. In the street segment, there are higher revenues in the first half of the year, whereas in the offroad segment, the main focus is on the second half of the year. Due to the increasing importance of the street segment in total revenues, seasonal effects are straightened over the year to a large extent.
24 KTM INDUSTRIES GROUP INTERIM CONSOLIDATED MANAGEMENT REPORT INTERIM CONSOLIDATED FINANCIAL STATEMENTS CONDENSED NOTES
SCOPE OF CONSOLIDATION
All subsidiaries that are either legally or de facto under the control of KTM Industries AG are included in the interim consolidated financial statements as at June 30th 2019.
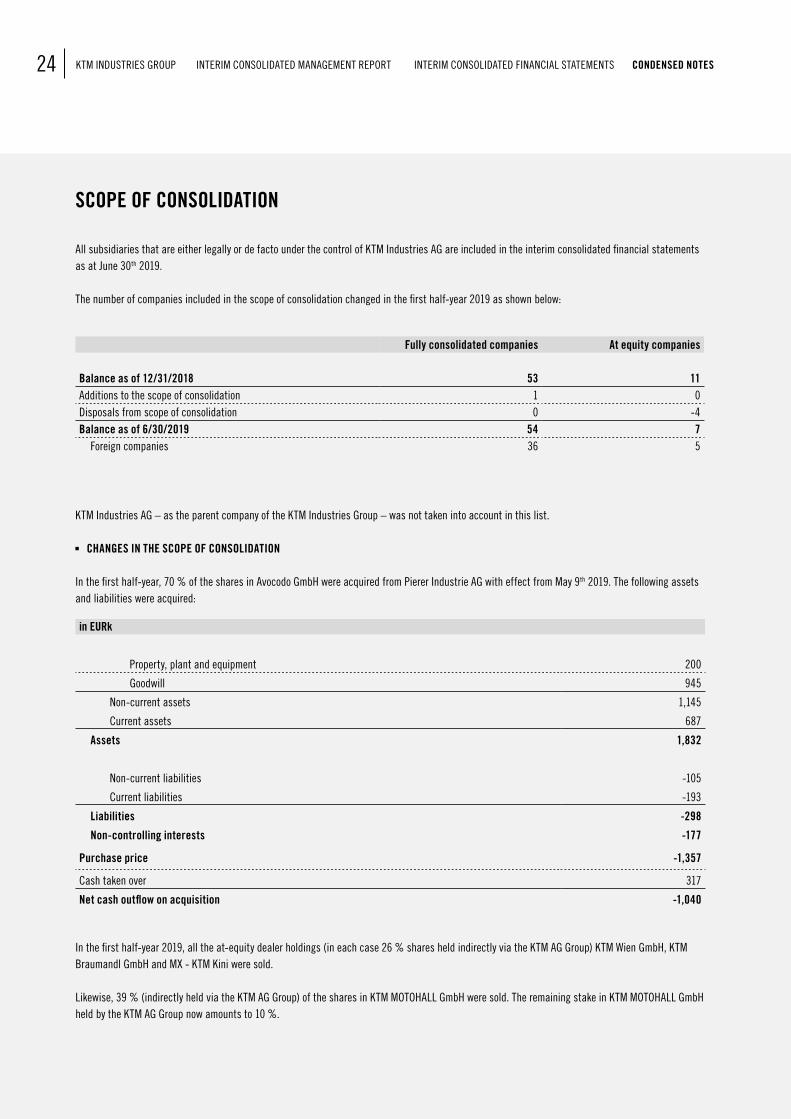
The number of companies included in the scope of consolidation changed in the first half-year 2019 as shown below:
Fully consolidated companies At equity companies
Balance as of 12/31/2018 53 11Additions to the scope of consolidation 1 0Disposals from scope of consolidation 0 -4Balance as of 6/30/2019 54 7 Foreign companies 36 5
KTM Industries AG – as the parent company of the KTM Industries Group – was not taken into account in this list.
CHANGES IN THE SCOPE OF CONSOLIDATION
In the first half-year, 70 % of the shares in Avocodo GmbH were acquired from Pierer Industrie AG with effect from May 9th 2019. The following assets and liabilities were acquired:
in EURk
Property, plant and equipment 200
Goodwill 945
Non-current assets 1,145
Current assets 687
Assets 1,832
Non-current liabilities -105
Current liabilities -193
Liabilities -298
Non-controlling interests -177
Purchase price -1,357
Cash taken over 317
Net cash outflow on acquisition -1,040
In the first half-year 2019, all the at-equity dealer holdings (in each case 26 % shares held indirectly via the KTM AG Group) KTM Wien GmbH, KTM Braumandl GmbH and MX - KTM Kini were sold.
Likewise, 39 % (indirectly held via the KTM AG Group) of the shares in KTM MOTOHALL GmbH were sold. The remaining stake in KTM MOTOHALL GmbH held by the KTM AG Group now amounts to 10 %.
25REPORT H1 2019KTM INDUSTRIES GROUP INTERIM CONSOLIDATED MANAGEMENT REPORT INTERIM CONSOLIDATED FINANCIAL STATEMENTS CONDENSED NOTES
DISCONTINUED OPERATION (IFRS 5) – SALE OF PANKL RACING SYSTEMS AG
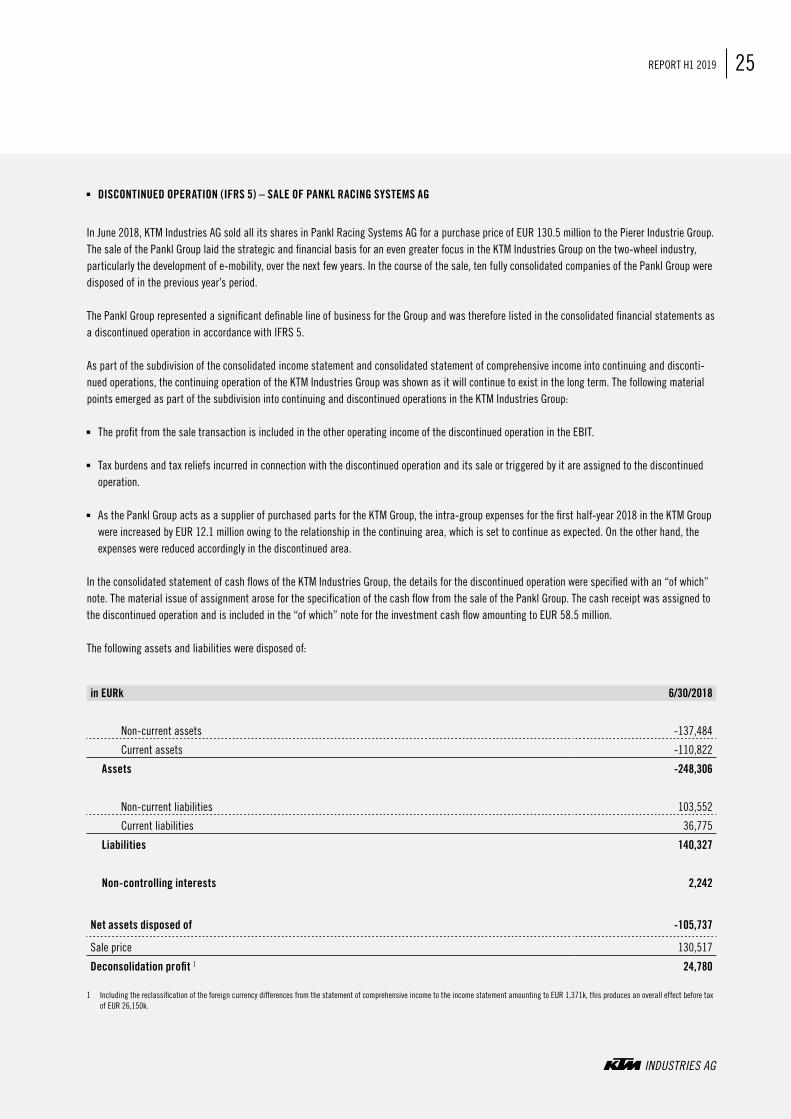
In June 2018, KTM Industries AG sold all its shares in Pankl Racing Systems AG for a purchase price of EUR 130.5 million to the Pierer Industrie Group. The sale of the Pankl Group laid the strategic and financial basis for an even greater focus in the KTM Industries Group on the two-wheel industry, particularly the development of e-mobility, over the next few years. In the course of the sale, ten fully consolidated companies of the Pankl Group were disposed of in the previous year’s period.
The Pankl Group represented a significant definable line of business for the Group and was therefore listed in the consolidated financial statements as a discontinued operation in accordance with IFRS 5.
As part of the subdivision of the consolidated income statement and consolidated statement of comprehensive income into continuing and disconti-nued operations, the continuing operation of the KTM Industries Group was shown as it will continue to exist in the long term. The following material points emerged as part of the subdivision into continuing and discontinued operations in the KTM Industries Group:
The profit from the sale transaction is included in the other operating income of the discontinued operation in the EBIT.
Tax burdens and tax reliefs incurred in connection with the discontinued operation and its sale or triggered by it are assigned to the discontinued operation.
As the Pankl Group acts as a supplier of purchased parts for the KTM Group, the intra-group expenses for the first half-year 2018 in the KTM Group were increased by EUR 12.1 million owing to the relationship in the continuing area, which is set to continue as expected. On the other hand, the expenses were reduced accordingly in the discontinued area.
In the consolidated statement of cash flows of the KTM Industries Group, the details for the discontinued operation were specified with an “of which” note. The material issue of assignment arose for the specification of the cash flow from the sale of the Pankl Group. The cash receipt was assigned to the discontinued operation and is included in the “of which” note for the investment cash flow amounting to EUR 58.5 million.
The following assets and liabilities were disposed of:
in EURk 6/30/2018
Non-current assets -137,484
Current assets -110,822
Assets -248,306
Non-current liabilities 103,552
Current liabilities 36,775
Liabilities 140,327
Non-controlling interests 2,242
Net assets disposed of -105,737
Sale price 130,517
Deconsolidation profit 1 24,780
1 Including the reclassification of the foreign currency differences from the statement of comprehensive income to the income statement amounting to EUR 1,371k, this produces an overall effect before tax of EUR 26,150k.
26 KTM INDUSTRIES GROUP INTERIM CONSOLIDATED MANAGEMENT REPORT INTERIM CONSOLIDATED FINANCIAL STATEMENTS CONDENSED NOTES
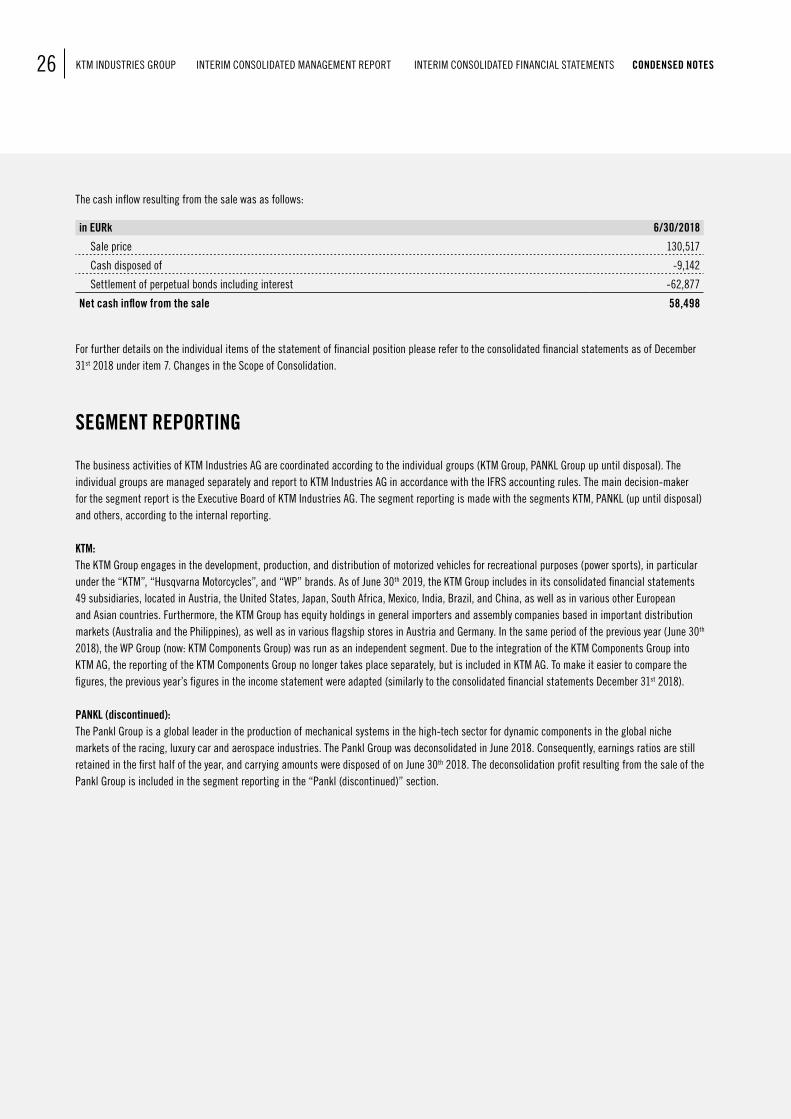
The cash inflow resulting from the sale was as follows:
in EURk 6/30/2018
Sale price 130,517
Cash disposed of -9,142
Settlement of perpetual bonds including interest -62,877
Net cash inflow from the sale 58,498
For further details on the individual items of the statement of financial position please refer to the consolidated financial statements as of December 31st 2018 under item 7. Changes in the Scope of Consolidation.
SEGMENT REPORTING
The business activities of KTM Industries AG are coordinated according to the individual groups (KTM Group, PANKL Group up until disposal). The individual groups are managed separately and report to KTM Industries AG in accordance with the IFRS accounting rules. The main decision-maker for the segment report is the Executive Board of KTM Industries AG. The segment reporting is made with the segments KTM, PANKL (up until disposal) and others, according to the internal reporting.
KTM:The KTM Group engages in the development, production, and distribution of motorized vehicles for recreational purposes (power sports), in particular under the “KTM”, “Husqvarna Motorcycles”, and “WP” brands. As of June 30th 2019, the KTM Group includes in its consolidated financial statements 49 subsidiaries, located in Austria, the United States, Japan, South Africa, Mexico, India, Brazil, and China, as well as in various other European and Asian countries. Furthermore, the KTM Group has equity holdings in general importers and assembly companies based in important distribution markets (Australia and the Philippines), as well as in various flagship stores in Austria and Germany. In the same period of the previous year (June 30th 2018), the WP Group (now: KTM Components Group) was run as an independent segment. Due to the integration of the KTM Components Group into KTM AG, the reporting of the KTM Components Group no longer takes place separately, but is included in KTM AG. To make it easier to compare the figures, the previous year’s figures in the income statement were adapted (similarly to the consolidated financial statements December 31st 2018).
PANKL (discontinued):The Pankl Group is a global leader in the production of mechanical systems in the high-tech sector for dynamic components in the global niche markets of the racing, luxury car and aerospace industries. The Pankl Group was deconsolidated in June 2018. Consequently, earnings ratios are still retained in the first half of the year, and carrying amounts were disposed of on June 30th 2018. The deconsolidation profit resulting from the sale of the Pankl Group is included in the segment reporting in the “Pankl (discontinued)” section.
27REPORT H1 2019KTM INDUSTRIES GROUP INTERIM CONSOLIDATED MANAGEMENT REPORT INTERIM CONSOLIDATED FINANCIAL STATEMENTS CONDENSED NOTES
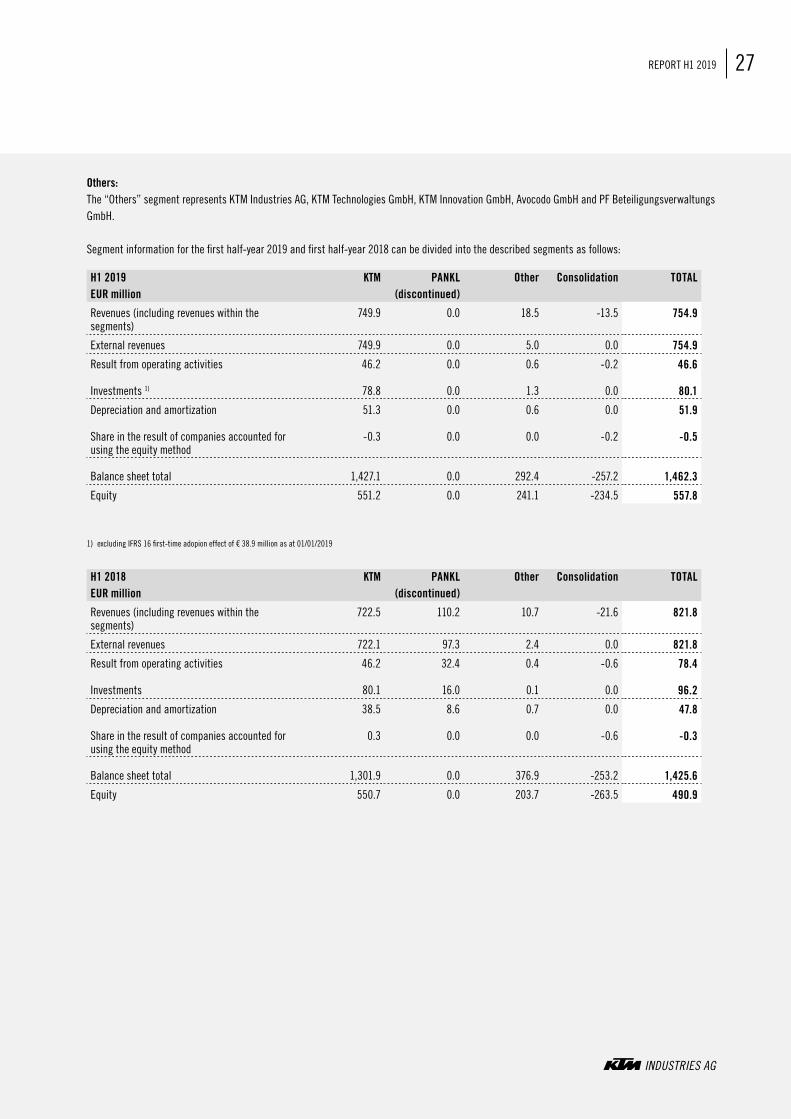
Others:The “Others” segment represents KTM Industries AG, KTM Technologies GmbH, KTM Innovation GmbH, Avocodo GmbH and PF Beteiligungsverwaltungs GmbH.
Segment information for the first half-year 2019 and first half-year 2018 can be divided into the described segments as follows:
H1 2019 EUR million
KTM PANKL (discontinued)
Other Consolidation TOTAL
Revenues (including revenues within the segments)
749.9 0.0 18.5 -13.5 754.9
External revenues 749.9 0.0 5.0 0.0 754.9
Result from operating activities 46.2 0.0 0.6 -0.2 46.6
Investments 1) 78.8 0.0 1.3 0.0 80.1
Depreciation and amortization 51.3 0.0 0.6 0.0 51.9
Share in the result of companies accounted for using the equity method
-0.3 0.0 0.0 -0.2 -0.5
Balance sheet total 1,427.1 0.0 292.4 -257.2 1,462.3
Equity 551.2 0.0 241.1 -234.5 557.8
1) excluding IFRS 16 first-time adopion effect of € 38.9 million as at 01/01/2019
H1 2018 EUR million
KTM PANKL (discontinued)
Other Consolidation TOTAL
Revenues (including revenues within the segments)
722.5 110.2 10.7 -21.6 821.8
External revenues 722.1 97.3 2.4 0.0 821.8
Result from operating activities 46.2 32.4 0.4 -0.6 78.4
Investments 80.1 16.0 0.1 0.0 96.2
Depreciation and amortization 38.5 8.6 0.7 0.0 47.8
Share in the result of companies accounted for using the equity method
0.3 0.0 0.0 -0.6 -0.3
Balance sheet total 1,301.9 0.0 376.9 -253.2 1,425.6
Equity 550.7 0.0 203.7 -263.5 490.9
28 KTM INDUSTRIES GROUP INTERIM CONSOLIDATED MANAGEMENT REPORT INTERIM CONSOLIDATED FINANCIAL STATEMENTS CONDENSED NOTES
NOTES TO THE CONSOLIDATED INCOME STATEMENT
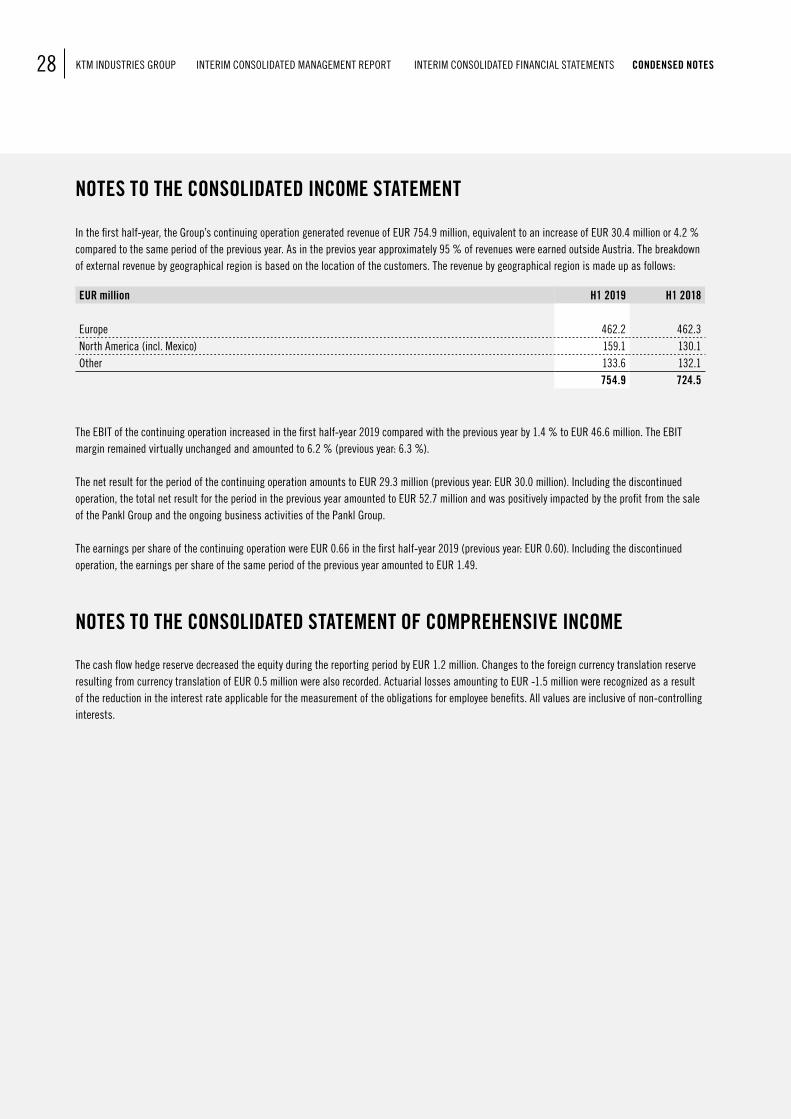
In the first half-year, the Group’s continuing operation generated revenue of EUR 754.9 million, equivalent to an increase of EUR 30.4 million or 4.2 % compared to the same period of the previous year. As in the previos year approximately 95 % of revenues were earned outside Austria. The breakdown of external revenue by geographical region is based on the location of the customers. The revenue by geographical region is made up as follows:
EUR million H1 2019 H1 2018
Europe 462.2 462.3North America (incl. Mexico) 159.1 130.1Other 133.6 132.1
754.9 724.5
The EBIT of the continuing operation increased in the first half-year 2019 compared with the previous year by 1.4 % to EUR 46.6 million. The EBIT margin remained virtually unchanged and amounted to 6.2 % (previous year: 6.3 %).
The net result for the period of the continuing operation amounts to EUR 29.3 million (previous year: EUR 30.0 million). Including the discontinued operation, the total net result for the period in the previous year amounted to EUR 52.7 million and was positively impacted by the profit from the sale of the Pankl Group and the ongoing business activities of the Pankl Group.
The earnings per share of the continuing operation were EUR 0.66 in the first half-year 2019 (previous year: EUR 0.60). Including the discontinued operation, the earnings per share of the same period of the previous year amounted to EUR 1.49.
NOTES TO THE CONSOLIDATED STATEMENT OF COMPREHENSIVE INCOME
The cash flow hedge reserve decreased the equity during the reporting period by EUR 1.2 million. Changes to the foreign currency translation reserve resulting from currency translation of EUR 0.5 million were also recorded. Actuarial losses amounting to EUR -1.5 million were recognized as a result of the reduction in the interest rate applicable for the measurement of the obligations for employee benefits. All values are inclusive of non-controlling interests.
29REPORT H1 2019KTM INDUSTRIES GROUP INTERIM CONSOLIDATED MANAGEMENT REPORT INTERIM CONSOLIDATED FINANCIAL STATEMENTS CONDENSED NOTES
NOTES TO THE CONSOLIDATED STATEMENT OF FINANCIAL POSITION AND CONSOLI-DATED STATEMENT OF CHANGES IN EQUITY
Current and non-current assets both increased in the first half of the year by around 8 %. The increase in non-current assets is essentially due to the effect of the initial application of IFRS 16 “Leases”. Current assets increased essentially due to the seasonal rise in trade receivables.
Non-current liabilities increased in the first half of the year by around 33 %. A loan of EUR 120.0 million was drawn from the European Investment Bank in March 2019. Another effect of the increase was the recognition of leasing liabilities on the liabilities side of the statement of financial position due to the initial application of IFRS 16 in the current financial year. The current liabilities were reduced by around 11 %. The decrease is the result of non-utilization of the existing Supplier Finance Program between Group companies and consequently the reduction in current financial liabilities.
Consolidated equity increased in the first six months by EUR 7.0 million to EUR 557.8 million. On the one hand, dividend payments of EUR 20.2 million led to a reduction in equity, on the other hand total comprehensive income increased internal funds by EUR 27.2 million. The equity ratio was 38.1 % on the reporting date (December 31st 2018: 40.7 %). The reduction in the equity ratio is for the most part due to the first-time capitalization of right-of-use assets in property, plant and equipment (IFRS 16) and the investment level (particularly in development projects), which continues to exceed amortizations, and the associated balance sheet extension.
NOTES TO THE STATEMENT OF CASH FLOWS
During the first half-year 2019, the level of cash and cash equivalents in the Group increased by EUR 9.4 million to EUR 98.8 million. The change comprised the cash flow from operating activities of EUR 46.3 million, the cash flow from investing activities of EUR -77.5 million, and the cash flow from financing activities of EUR 41.2 million. Foreign exchange effects of EUR -0.5 million also arose.
The free cash flow of the first half-year 2019 improved by around EUR 57 million compared with the same period of the previous year and amounted to EUR -31.3 million as of June 30th 2019. The significant improvement is the result essentially of the clear decline in net current assets compared with the same period of the previous year. The previous year was also positively impacted by the cash inflow from the Pankl sale in the amount of EUR 58.5 million, which when adjusted corresponds to an even greater improvement in the free cash flow.
DISCLOSURES RELATING TO FINANCIAL INSTRUMENTS
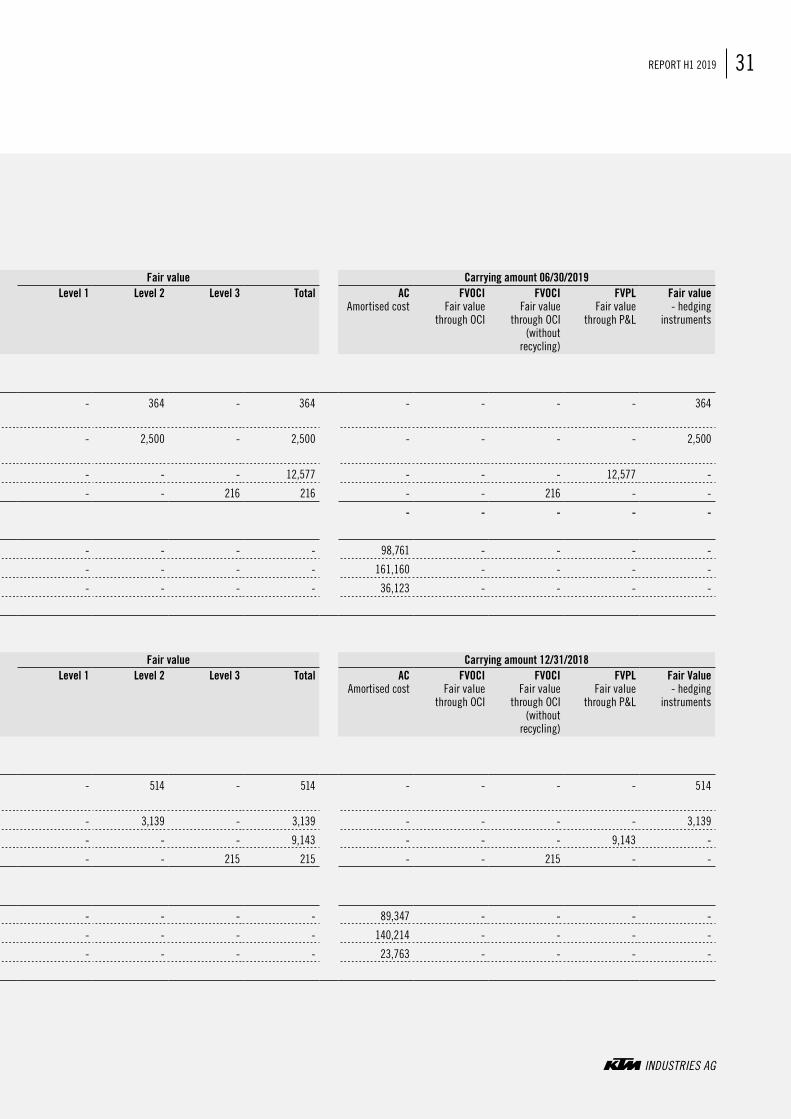
The measurement categories of IFRS 9 were used to classify and measure the assets side. The fair value of a financial instrument is determined by means of quoted market prices for identical instruments in active markets (Level 1). If no quoted market prices in active markets are available for the instrument, the fair value is determined by means of measurement techniques for which the material inputs are based exclusively on observable mar-ket data (Level 2). In all other cases, the fair value is determined on the basis of measurement techniques for which at least one input is not based on observable market data (Level 3).
30 KTM INDUSTRIES GROUP INTERIM CONSOLIDATED MANAGEMENT REPORT INTERIM CONSOLIDATED FINANCIAL STATEMENTS CONDENSED NOTES
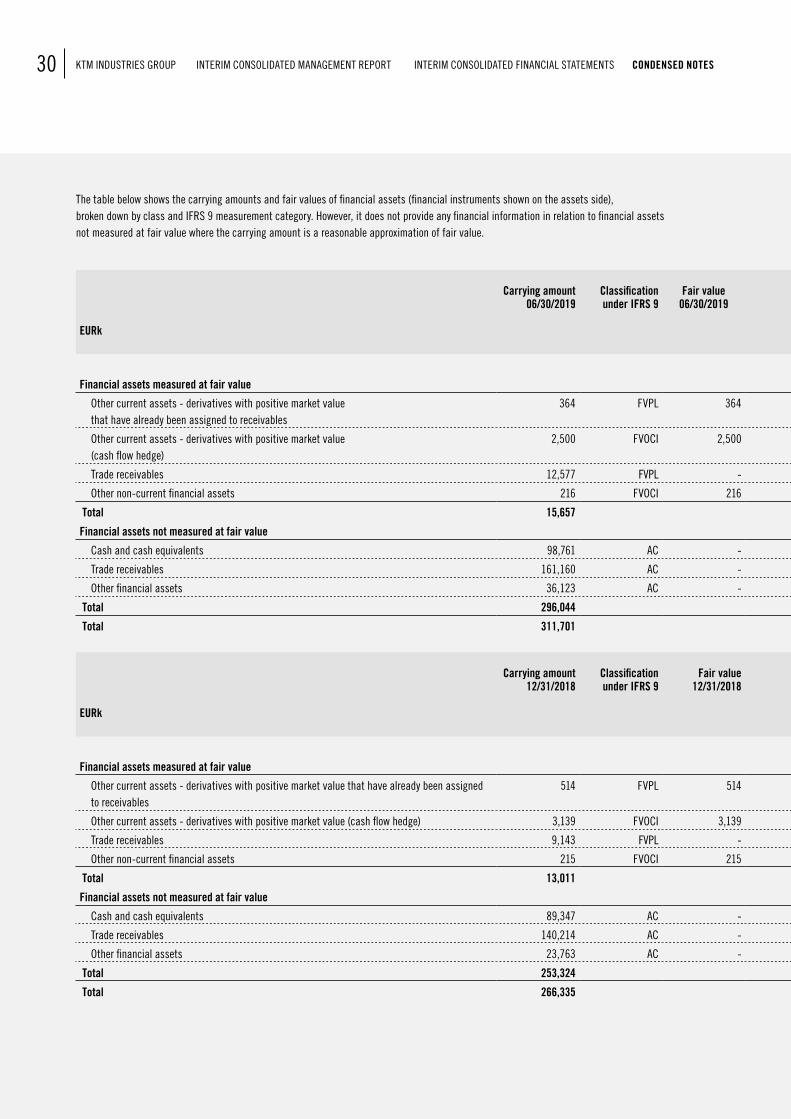
The table below shows the carrying amounts and fair values of financial assets (financial instruments shown on the assets side), broken down by class and IFRS 9 measurement category. However, it does not provide any financial information in relation to financial assets not measured at fair value where the carrying amount is a reasonable approximation of fair value.
EURk
Carrying amount
06/30/2019 Classification
under IFRS 9
Fair value
06/30/2019
Fair value Carrying amount 06/30/2019 Level 1 Level 2 Level 3 Total AC
Amortised costFVOCI
Fair value through OCI
FVOCI Fair value
through OCI (without
recycling)
FVPL Fair value
through P&L
Fair value - hedging
instruments
Financial assets measured at fair value
Other current assets - derivatives with positive market value that have already been assigned to receivables
364 FVPL 364 - 364 - 364 - - - - 364
Other current assets - derivatives with positive market value (cash flow hedge)
2,500 FVOCI 2,500 - 2,500 - 2,500 - - - - 2,500
Trade receivables 12,577 FVPL - - - - 12,577 - - - 12,577 -
Other non-current financial assets 216 FVOCI 216 - - 216 216 - - 216 - -
Total 15,657 - - - - -
Financial assets not measured at fair value
Cash and cash equivalents 98,761 AC - - - - - 98,761 - - - -
Trade receivables 161,160 AC - - - - - 161,160 - - - -
Other financial assets 36,123 AC - - - - - 36,123 - - - -
Total 296,044
Total 311,701
EURk
Carrying amount
12/31/2018
Classification under IFRS 9
Fair value
12/31/2018
Fair value Carrying amount 12/31/2018 Level 1 Level 2 Level 3 Total AC
Amortised costFVOCI
Fair value through OCI
FVOCIFair value
through OCI(without
recycling)
FVPLFair value
through P&L
Fair Value- hedging
instruments
Financial assets measured at fair value
Other current assets - derivatives with positive market value that have already been assigned to receivables
514 FVPL 514 - 514 - 514 - - - - 514
Other current assets - derivatives with positive market value (cash flow hedge) 3,139 FVOCI 3,139 - 3,139 - 3,139 - - - - 3,139
Trade receivables 9,143 FVPL - - - - 9,143 - - - 9,143 -
Other non-current financial assets 215 FVOCI 215 - - 215 215 - - 215 - -
Total 13,011
Financial assets not measured at fair value
Cash and cash equivalents 89,347 AC - - - - - 89,347 - - - -
Trade receivables 140,214 AC - - - - - 140,214 - - - -
Other financial assets 23,763 AC - - - - - 23,763 - - - -
Total 253,324
Total 266,335
31REPORT H1 2019KTM INDUSTRIES GROUP INTERIM CONSOLIDATED MANAGEMENT REPORT INTERIM CONSOLIDATED FINANCIAL STATEMENTS CONDENSED NOTES
The table below shows the carrying amounts and fair values of financial assets (financial instruments shown on the assets side), broken down by class and IFRS 9 measurement category. However, it does not provide any financial information in relation to financial assets not measured at fair value where the carrying amount is a reasonable approximation of fair value.
EURk
Carrying amount
06/30/2019 Classification
under IFRS 9
Fair value
06/30/2019
Fair value Carrying amount 06/30/2019 Level 1 Level 2 Level 3 Total AC
Amortised costFVOCI
Fair value through OCI
FVOCI Fair value
through OCI (without
recycling)
FVPL Fair value
through P&L
Fair value - hedging
instruments
Financial assets measured at fair value
Other current assets - derivatives with positive market value that have already been assigned to receivables
364 FVPL 364 - 364 - 364 - - - - 364
Other current assets - derivatives with positive market value (cash flow hedge)
2,500 FVOCI 2,500 - 2,500 - 2,500 - - - - 2,500
Trade receivables 12,577 FVPL - - - - 12,577 - - - 12,577 -
Other non-current financial assets 216 FVOCI 216 - - 216 216 - - 216 - -
Total 15,657 - - - - -
Financial assets not measured at fair value
Cash and cash equivalents 98,761 AC - - - - - 98,761 - - - -
Trade receivables 161,160 AC - - - - - 161,160 - - - -
Other financial assets 36,123 AC - - - - - 36,123 - - - -
Total 296,044
Total 311,701
EURk
Carrying amount
12/31/2018
Classification under IFRS 9
Fair value
12/31/2018
Fair value Carrying amount 12/31/2018 Level 1 Level 2 Level 3 Total AC
Amortised costFVOCI
Fair value through OCI
FVOCIFair value
through OCI(without
recycling)
FVPLFair value
through P&L
Fair Value- hedging
instruments
Financial assets measured at fair value
Other current assets - derivatives with positive market value that have already been assigned to receivables
514 FVPL 514 - 514 - 514 - - - - 514
Other current assets - derivatives with positive market value (cash flow hedge) 3,139 FVOCI 3,139 - 3,139 - 3,139 - - - - 3,139
Trade receivables 9,143 FVPL - - - - 9,143 - - - 9,143 -
Other non-current financial assets 215 FVOCI 215 - - 215 215 - - 215 - -
Total 13,011
Financial assets not measured at fair value
Cash and cash equivalents 89,347 AC - - - - - 89,347 - - - -
Trade receivables 140,214 AC - - - - - 140,214 - - - -
Other financial assets 23,763 AC - - - - - 23,763 - - - -
Total 253,324
Total 266,335
32 KTM INDUSTRIES GROUP INTERIM CONSOLIDATED MANAGEMENT REPORT INTERIM CONSOLIDATED FINANCIAL STATEMENTS CONDENSED NOTES
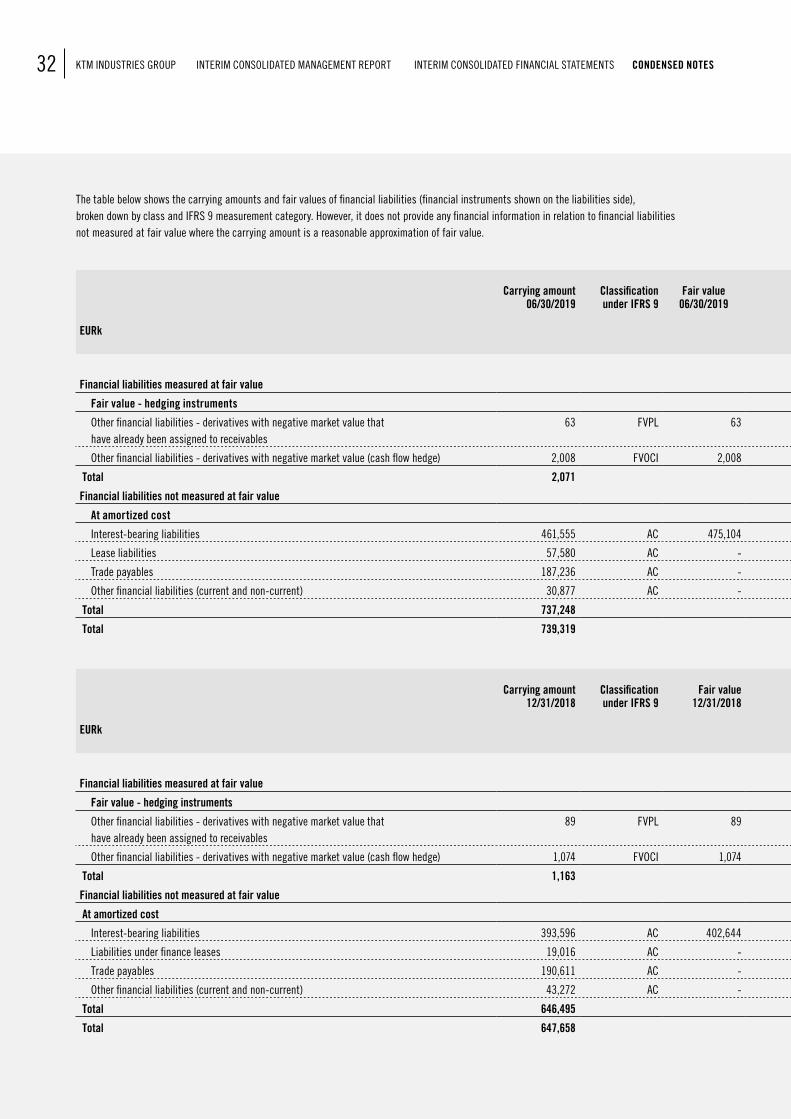
The table below shows the carrying amounts and fair values of financial liabilities (financial instruments shown on the liabilities side), broken down by class and IFRS 9 measurement category. However, it does not provide any financial information in relation to financial liabilities not measured at fair value where the carrying amount is a reasonable approximation of fair value.
EURk
Carrying amount
06/30/2019 Classification under IFRS 9
Fair value 06/30/2019
Fair value Carrying amount 06/30/2019 Level 1 Level 2 Level 3 Total AC
Amortised costFVOCI
Fair value through OCI
FVOCIFair value
through OCI(without
recycling)
FVPLFair value
through P&L
Fair Value -hedging
Instruments
Financial liabilities measured at fair value
Fair value - hedging instruments
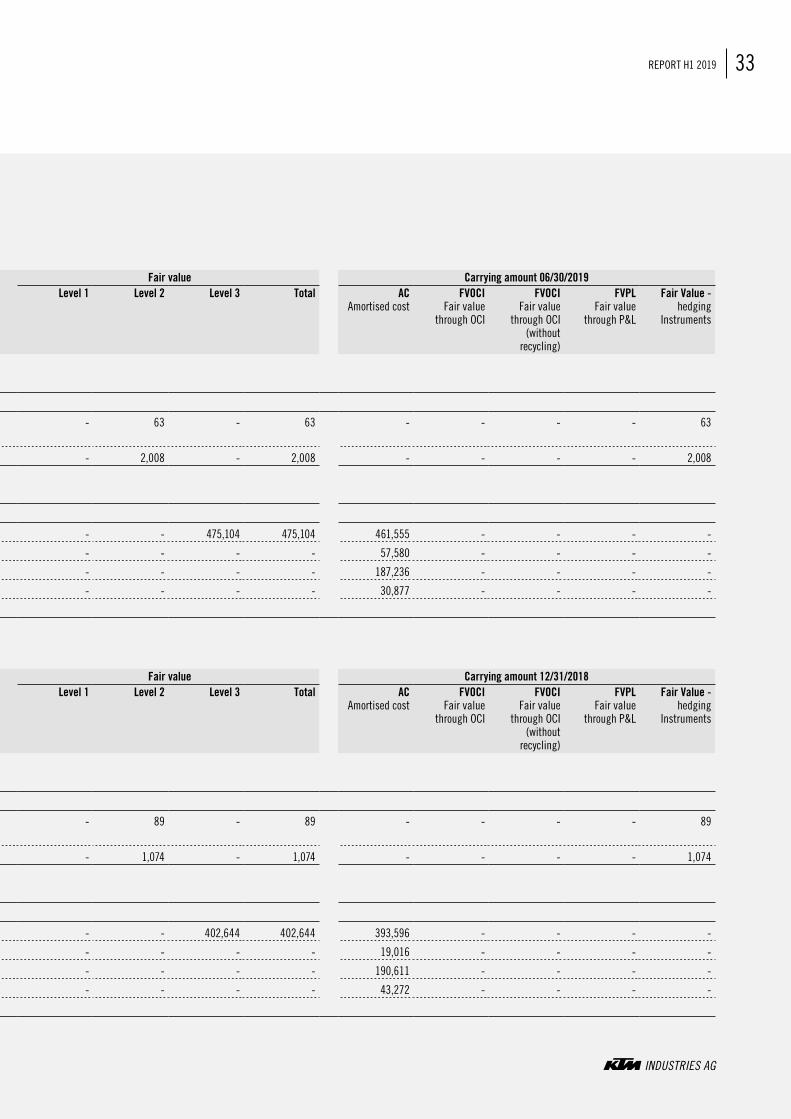
Other financial liabilities - derivatives with negative market value that have already been assigned to receivables
63 FVPL 63 - 63 - 63 - - - - 63
Other financial liabilities - derivatives with negative market value (cash flow hedge) 2,008 FVOCI 2,008 - 2,008 - 2,008 - - - - 2,008
Total 2,071
Financial liabilities not measured at fair value
At amortized cost
Interest-bearing liabilities 461,555 AC 475,104 - - 475,104 475,104 461,555 - - - -
Lease liabilities 57,580 AC - - - - - 57,580 - - - -
Trade payables 187,236 AC - - - - - 187,236 - - - -
Other financial liabilities (current and non-current) 30,877 AC - - - - - 30,877 - - - -
Total 737,248
Total 739,319
EURk
Carrying amount 12/31/2018
Classification under IFRS 9
Fair value 12/31/2018
Fair value Carrying amount 12/31/2018 Level 1 Level 2 Level 3 Total AC
Amortised costFVOCI
Fair value through OCI
FVOCIFair value
through OCI(without
recycling)
FVPLFair value
through P&L
Fair Value -hedging
Instruments
Financial liabilities measured at fair value
Fair value - hedging instruments
Other financial liabilities - derivatives with negative market value that have already been assigned to receivables
89 FVPL 89 - 89 - 89 - - - - 89
Other financial liabilities - derivatives with negative market value (cash flow hedge) 1,074 FVOCI 1,074 - 1,074 - 1,074 - - - - 1,074
Total 1,163
Financial liabilities not measured at fair value
At amortized cost
Interest-bearing liabilities 393,596 AC 402,644 - - 402,644 402,644 393,596 - - - -
Liabilities under finance leases 19,016 AC - - - - - 19,016 - - - -
Trade payables 190,611 AC - - - - - 190,611 - - - -
Other financial liabilities (current and non-current) 43,272 AC - - - - - 43,272 - - - -
Total 646,495
Total 647,658
33REPORT H1 2019KTM INDUSTRIES GROUP INTERIM CONSOLIDATED MANAGEMENT REPORT INTERIM CONSOLIDATED FINANCIAL STATEMENTS CONDENSED NOTES
The table below shows the carrying amounts and fair values of financial liabilities (financial instruments shown on the liabilities side), broken down by class and IFRS 9 measurement category. However, it does not provide any financial information in relation to financial liabilities not measured at fair value where the carrying amount is a reasonable approximation of fair value.
EURk
Carrying amount
06/30/2019 Classification under IFRS 9
Fair value 06/30/2019
Fair value Carrying amount 06/30/2019 Level 1 Level 2 Level 3 Total AC
Amortised costFVOCI
Fair value through OCI
FVOCIFair value
through OCI(without
recycling)
FVPLFair value
through P&L
Fair Value -hedging
Instruments
Financial liabilities measured at fair value
Fair value - hedging instruments
Other financial liabilities - derivatives with negative market value that have already been assigned to receivables
63 FVPL 63 - 63 - 63 - - - - 63
Other financial liabilities - derivatives with negative market value (cash flow hedge) 2,008 FVOCI 2,008 - 2,008 - 2,008 - - - - 2,008
Total 2,071
Financial liabilities not measured at fair value
At amortized cost
Interest-bearing liabilities 461,555 AC 475,104 - - 475,104 475,104 461,555 - - - -
Lease liabilities 57,580 AC - - - - - 57,580 - - - -
Trade payables 187,236 AC - - - - - 187,236 - - - -
Other financial liabilities (current and non-current) 30,877 AC - - - - - 30,877 - - - -
Total 737,248
Total 739,319
EURk
Carrying amount 12/31/2018
Classification under IFRS 9
Fair value 12/31/2018
Fair value Carrying amount 12/31/2018 Level 1 Level 2 Level 3 Total AC
Amortised costFVOCI
Fair value through OCI
FVOCIFair value
through OCI(without
recycling)
FVPLFair value
through P&L
Fair Value -hedging
Instruments
Financial liabilities measured at fair value
Fair value - hedging instruments
Other financial liabilities - derivatives with negative market value that have already been assigned to receivables
89 FVPL 89 - 89 - 89 - - - - 89
Other financial liabilities - derivatives with negative market value (cash flow hedge) 1,074 FVOCI 1,074 - 1,074 - 1,074 - - - - 1,074
Total 1,163
Financial liabilities not measured at fair value
At amortized cost
Interest-bearing liabilities 393,596 AC 402,644 - - 402,644 402,644 393,596 - - - -
Liabilities under finance leases 19,016 AC - - - - - 19,016 - - - -
Trade payables 190,611 AC - - - - - 190,611 - - - -
Other financial liabilities (current and non-current) 43,272 AC - - - - - 43,272 - - - -
Total 646,495
Total 647,658
34 KTM INDUSTRIES GROUP INTERIM CONSOLIDATED MANAGEMENT REPORT INTERIM CONSOLIDATED FINANCIAL STATEMENTS CONDENSED NOTES
FAIR VALUE DETERMINATION
Please refer to the consolidated financial statements of KTM Industries as of December 31st 2018 Point 43 (Classification and Fair Value) in relation to valuation technique.
RELATED PARTY DISCLOSURES
The outstanding purchase price liability in respect of Kiska Holding GmbH as of December 31st 2018 arising from the acquisition of a further 24 % of shares in Kiska GmbH amounting to EUR 6.0 million was paid in the first half-year 2019.
In the first half-year, 70 % of shares in Avocodo GmbH were acquired from Pierer Industrie AG. The purchase price amounted to EUR 1.4 million.
KTM AG sold 39 % of the shares in KTM MOTOHALL GmbH to PIERER IMMOREAL GmbH at a sale price of EUR 5.7 million.
In the first half-year 2019, KTM Industries AG granted Pexco GmbH a short-term arm’s-length, interest-bearing loan of EUR 6.0 million.
All business transactions within related companies and individuals as stated in the consolidated financial statements as of December 31st 2018 are carried out at arm’s length.
EVENTS AFTER THE BALANCE SHEET DATE
On July 1st 2019, the KTM Group increased its equity holding in Motorcycle Distributors Australia Pty Ltd., its importer for the markets in Australia and New Zealand, from 26 % to 100 %. This boosted the presence of both brands KTM and Husqvarna Motorcycles in Australia and New Zealand.
In addition, 100 % of shares in KTM Components (Dalian) Co. Ltd., China (previously: WP Cooling Systems (Dalian) Co. Ltd.), which acts as radiator manufacturer for KTM AG, were sold to Pankl Racing Systems AG in July 2019.
35REPORT H1 2019KTM INDUSTRIES GROUP INTERIM CONSOLIDATED MANAGEMENT REPORT INTERIM CONSOLIDATED FINANCIAL STATEMENTS CONDENSED NOTES
DECLARATION OF THE EXECUTIVE BOARD PURSUANT TO SECTION 87 PARA 1 NO. 3 OF THE AUSTRIAN STOCK EXCHANGE ACT
We confirm to the best of our knowledge that the condensed consolidated interim financial statements created in line with the applicable accounting standards give a true and fair view of the assets, liabilities, financial position and profit or loss of the KTM Industries Group and that the interim Group management report gives a true and fair view of the assets, liabilities, financial position and profit or loss of the Group in relation to important events that have occurred during the first six months of the financial year and their impact on the condensed consolidated interim financial state-ments, to the principal risks and uncertainties for the remaining six months of the financial year and to the major related party transactions to be disclosed.
Wels, August 26th 2019
The Executive Board of KTM Industries AG
Dipl.-Ing. Stefan Pierer, CEO Mag. Friedrich Roithner, CFO Mag. Ing. Hubert Trunkenpolz, CSO
36 KTM INDUSTRIES GROUP INTERIM CONSOLIDATED MANAGEMENT REPORT INTERIM CONSOLIDATED FINANCIAL STATEMENTS CONDENSED NOTES
FINANCIAL CALENDARFebruary 3, 2020 Announcement of preliminary results 2019 (after the close of trading)
March 31, 2020 Publication of annual financial statements 2019
April 20, 2020 Record date annual general meeting
April 30, 2020 23rd annual general meeting
August 31, 2020 Report on the 1st half-year 2020 (after the close of trading)
MORE INFORMATION ON THE
KTM INDUSTRIES SHAREInvestor Relations ................................................ Michaela FriepessPhone .................................................................... +43 7242 69 402Fax ................................................................. +43 7242 69 402 109e-mail .......................................................... [email protected]
ISIN Code ................................................................. AT0000KTMI02Valor number (Switzerland) ............................................... 41860974Share category ........................................no-bar value bearer sharesShare capital .......... EUR 22,538,674 devided into 22,538,674 sharesNumber of listed shares ...................................... 22,538,674 sharesAuthorized capital ...................................... up to 11,269,337 sharesFree Float .............................................................approx. 38 PercentSecurities Symbol ...................................................................... KTMIReuters ................................................................................. KTMI:VIBloomberg ........................................................................... KTMI: AVStock Listing: SIX Swiss Exchange, International Reporting Standard, Vienna Stock Exchange, Official Market
37REPORT H1 2019KTM INDUSTRIES GROUP INTERIM CONSOLIDATED MANAGEMENT REPORT INTERIM CONSOLIDATED FINANCIAL STATEMENTS CONDENSED NOTES
IMPRINTOwner and publisherKTM Industries AGEdisonstrasse 14600 Wels, AustriaFN 78112 x / Wels Provincial and Commercial Court
Concept and design: Grafik-Buero Elena Gratzer, 4615 Holzhausen, www.grafik-buero.atPhotos: KTM archive, Husqvarna archive, Pankl archive, WP archive, Adobe Stock © C. Schüßler, Grafik-Buero Elena Gratzer
The present half-year report has been prepared with the utmost care and the correctness of the data was checked. Nevertheless, slight differences in the calculations may arise as result of the summation of rounded amounts and percentages, and typographical and printing errors cannot be ruled out.
References to persons such as “employees” or “staff members” are intended to be gender-neutral and insofar as the contrary appears this is solely for purposes of legibility.
This report and the forward-looking statements it contains were prepared on the basis of all the data and information available at the time of going to press. However, we are must point out that various factors may cause the actual results to deviate from the forward-looking statements given in the report.
This half-year report is published in German and English. In the event of ambiguity, the German version shall take precedence.
KTM Industries AG
Edisonstraße 1, 4600 WelsPhone: +43 (0)7242 / 69402Fax: +43 (0)7242 / 69402 / [email protected]