Embed Size (px)
Citation preview

Cell Reports, Volume 18
Supplemental Information
Cell of Origin Links Histotype Spectrum to Immune
Microenvironment Diversity in Non-small-Cell
Lung Cancer Driven by Mutant Kras and Loss of Lkb1
Ashwini S. Nagaraj, Jenni Lahtela, Annabrita Hemmes, Teijo Pellinen, SamiBlom, Jennifer R. Devlin, Kaisa Salmenkivi, Olli Kallioniemi, Mikko I. Mäyränpää, KatjaNärhi, and Emmy W. Verschuren

Figure S1
B
Anti-LKB1C
Anti-E-Cadherin
Ad5
-SPC
-Cre
Ad5-
CC10
-Cre
Ant
i-GFP
Ant
i-CC
10
Ad5-SPC-Cre
Ant
i-GFP
Ant
i-SPC
PAC
PAC
PAC
PAC PAC
PAC
PAC PACAIS AISMAC
PAC
AIS
PAC
PACPAC
PACPAC
PAC
PAC
PAC PACAIS
AIS
AISMAC
Anti-SOX2
ASC
EAnti-Krt5
Kras;Lkb1
Ant
i-SO
X2
SCC region AC regionHuman ASC
G HMAC PAC
Ant
i-p63
Ad5-CC10-Cre Ad5-SPC-Cre
NKX2-1 p63
6 wpi
H&E 9 wpi NKX2-1 p63H&E
Ad5
-CC
10-C
reA
d5-S
PC-C
re
I6 wpi
F
D
Kras;Lkb1
Kras;p53Anti-E-CadherinAnti-LKB1
Ad5
-SPC
-Cre
Ad5-
CC10
-Cre
AAd5-CC10-Cre
1%
0.8%
13.3%
0.8%
Ad5-CC10-Cre Ad5-SPC-Cre
Anti-
GFP
Supplemental Figures

Figure S1. Cell-of-origin defines histopathology spectrum in Kras;Lkb1 mice. Related to Figure 1.(A) Representative images of anti-GFP stained Ad5-CC10-Cre and Ad5-SPC-Cre infected Kras;Lkb1;Rosa26mT/mG
mice (2 and 4 wk post infection respectively). The majority of GFP positive cells in Ad5-CC10-Cre infected lungs werelocated in bronchiolar regions (arrows), and at bronchioalveolar duct junctions (arrowhead). GFP positive cells in Ad5-SPC-Cre virus infected lungs were mainly seen in the alveolar region (arrows). Scale bars: 100 µm. (B) Representativeimages of anti-GFP, anti-CC10 and anti-SPC stained sections (left), plus corresponding Definiens analysis snapshots(right), of lungs isolated from Ad5-CC10-Cre and Ad5-SPC-Cre infected Kras;Lkb1;Rosa26mT/mG mice (3 and 4 wkpost infection respectively, n=2 mice). Arrows indicate that GFP+ cells are localized to CC10+ or SPC+ regions in Ad5-CC10-Cre or Ad5-SPC-Cre infected lungs, respectively. Quantification showed that of the total number of hematoxylinpositive nuclei per lung, 1% were CC10+ or 13.3 % were SPC+ cells. Following infection with either 1x10⁷ plaqueforming units (pfu) of Ad5-CC10-Cre or 2.5x10⁹ pfu Ad5-SPC-Cre, 0.8% of the total number of cells per lung wereGFP+ cells. Pseudo-colored snapshots (right) indicate negative (blue), high intensity (red), or medium intensity (yellow)nuclear detection levels performed with Definiens. Scale bars: 100 µm. (C) Representative images of anti-LKB1 andanti-E-Cadherin stained Ad5-CC10-Cre and Ad5-SPC-Cre-infected Kras;Lkb1 and Kras;p53 lungs. All lesions fromKras;Lkb1 mice infected with Ad5-CC10-Cre or Ad5-SPC-Cre viruses were negative for LKB1 (Table S1). Arrowsindicate areas depicted in higher magnification. Scale bars: 2000 µM for lung lobes, 50 µM for magnified images. (D)Tumor lesion quantification. Representative image of H&E-stained lung sections from Ad5-CC10-Cre infectedKras;Lkb1 mice, and corresponding pseudo-colored image depicting tumor segmentation performed with Definienssoftware. PAC: papillary AC, MAC: mucinous AC, AIS: adenocarcinoma in situ. Small boxes indicate regions ofhigher magnification. (E) Representative IHC images of KRT5 and SOX2 for Ad5-CC10-Cre-induced ASC tumors. AllASCs showed expression of KRT5, but lacked SOX2 expression. Scale bars: 50 µm. (F) Representative images ofSOX2 IHC on human ASC (n=12) TMA. Nuclear SOX2 was detected predominantly in the samples representing SCCregions (8/13 spots) compared to AC region (2/5 spots) (See also Table S1). Scale bars: 50 µm. (G) Representativeimages from H&E-stained lung sections from Ad5-CC10-Cre infected Kras;Lkb1 mice showing the invasive AChistopathology class. Scale bars: 100 µm. (H) Representative images of anti-p63 stained Ad5-CC10-Cre MACs andPACs, showing rare p63 positive nuclei. Scale bars: 50 µm. (I) Time point analysis of Kras;Lkb1 mice infected withAd5-CC10-Cre and Ad5-SPC-Cre viruses. Representative images of H&E, anti-NKX2-1 and anti-p63 stained lungsshow papillary hyperplasias of bronchiolar epithelial cells in Ad5-CC10-Cre-infected lungs and AIS lesions in Ad5-SPC-Cre infected lungs at six wk post infection (n=2). At nine wk post infection pure squamous cell carcinoma (SCC)lesions were detected in one out of four mice in Ad5-CC10-Cre-infected lungs, and invasive AC or invasive papillaryAC in Ad5-SPC-Cre infected lungs (n=4). Arrows indicate areas depicted in higher magnification. Scale bars: 2000 µMfor lung lobes, 50 µM for magnified images.

D E
A B
CASCMACPAC AACIAC
Invasive AC subtypes
NK
X2-1
PAS
Bronchiolar HP
NK
X2-1
PAS
AAC
PACIAC ASCH
MG
A2
Ad5-CC10-Cre / Ad5-SPC-Cre
Ad5-CC10-Cre
F
HM
GA
2
MAC

Figure S2. Cell-of-origin defines histopathology spectrum in Kras;Lkb1 mice. Related to Figure 1.(A) Ki67 IHC quantification. Representative image of anti-Ki67 stained lung sections from Ad5-CC10-Cre-infectedKras;Lkb1 mice, and the corresponding pseudo-colored images describing Ki67 positive (yellow) and negative (blue)nuclear detection performed with Definiens. Scale bars: 50 µm. (B) Representative images of anti-HMGA2 stainedAd5-CC10-Cre- and Ad5-SPC-Cre-induced Kras;Lkb1 tumors. All ASCs showed homogenous staining for HMGA2,whereas all other histopathologies showed negative staining or pockets of positive regions. Arrows indicate areasdepicted in higher magnification. Scale bars: 1000 µM for lung lobes, 50 µM for magnified images. (C) Representativeimages of PAS and NKX2-1 immunostaining of Ad5-CC10-Cre-derived lesions. Scale bars: 100 µm. (D) PAS stainingquantification. Representative image of lung sections from Ad5-CC10-Cre infected Kras;Lkb1 mice, and correspondingpseudo-colored images showing PAS positive (yellow) and negative (purple) area detection performed with Definiens.Scale bars: 50 µm. (E) NKX2-1 immunohistochemistry quantification. Representative image of anti-NKX2-1 stainedlung sections from Ad5-CC10-Cre-infected Kras;Lkb1 mice, and corresponding pseudo-colored image describingNKX2-1 low (yellow), NKX2-1 medium (orange), NKX2-1 high (dark brown) and negative (blue) nuclear detectionperformed with Definiens. Scale bars: 50 µm. (F) Representative images of PAS and anti-NKX2-1 immunostaining ofAd5-CC10-Cre-derived bronchiolar hyperplasia. Scale bars: 100 µm.

0
Figure S3
AAd5-CC10-Cre
ASCAd5-SPC-Cre
PAC
Ad5-CC10-Cre(n=3 mice)
Ad5-SPC-Cre(n=3 mice)
n= 2 tumors/mouse) n= 2 tumors/mouse
Kras;Lkb1
RNA
HistologyProtein
Tumor
B
p63b-actin
C
0
5
10
15 Ad5-SPC-Cre/ASCAd5-CC10-Cre/PAC
Il1b
Arg1H2-D
1
H2-M2
Nor
mal
ized
exp
ress
ion
33 122575 1272
Airway basal cells vs epithelial cells
123109
D154163
53149
Kras;Lkb1 Ad5-CC10-Cre ASC vs Ad5-SPC-Cre PAC
221
Kras;Lkb1 Ad5-CMV-Cre ASC
vs AC
E
F
Kras;Lkb1 Ad5-CC10-Cre ASC vs Ad5-SPC-Cre PAC
G
101 103105 107
101
103
105
Ly-6
C
CD11b
107
32,6 %
101 103 105 107
101
103
105
107
4,3 %
100 103 106
CD4
100
102
104
106
CD
3
0,02
100 103 106
100
102
104
1060.02 %
100
102
104
106
100 103106
0.99 %
CD8
CD
3
100 103106
100
102
104
106 1.51 %
0.043%
Ad5-CC10-Cre ASC
Ad5-SPC-Cre PAC
0,0
20,0
40,0
60,0
ASC PACLy-6
C C
D11
b ce
lls (%
)+
+
***
0,0
2,0
4,0
6,0
8,0
0,0
2,0
4,0
6,0
8,0
ASC PAC
ASC PAC
NS
NS
CD
3 C
D4
cells
(%)
+
+
CD
3 C
D8
cells
(%)
+
+

Figure S3. KrasG12D/+;Lkb1fl/fl tumors exhibit histotype-specific gene expression signatures and immune cellinfiltrations. Related to Figure 2, 3 and 4. (A) Workflow describing comparative gene expression analysis of ASCand PAC tumors from Kras;Lkb1 mice. (B) Western blot analysis of tumors selected for microarray profiling using anti-p63 and anti-ß-actin antibodies. (C) Comparison of Kras;Lkb1 Ad5-CC10-Cre ASC vs Ad5-SPC-Cre PACdifferentially expressed genes with normal airway basal cells vs epithelial differentially expressed genes (GSE15724)and Kras;Lkb1 Ad5-CMV-Cre ASC vs AC tumors (GSE6135). (D) qPCR validation of immune-related genes in Ad5-SPC-Cre-induced ASC tumors (n=2) and Ad5-CC10-Cre-induced PAC (n=1). Gene expression was normalized againstthe housekeeping Rpl19 mRNA. Error bars represent mean ± StDev. (E) Gr-1 immunohistochemistry quantification.Representative image of anti-Gr-1 stained lung sections from Ad5-CC10-Cre-infected Kras;Lkb1 mice, and thecorresponding pseudo-colored image describing Gr-1 low (yellow), Gr-1 medium (orange), Gr-1 high (dark brown) andnegative (blue) nuclear detection performed with Definiens. Tightened filtering was performed to exclude any falsepositive staining detection (grey nuclei). Identical quantification settings were used for CD11b and CD3 stainings. Scalebars: 50 µm. (F) Flow cytometry analyses, and (G) quantification of Ly-6C+ CD11b+ cells, CD3+ CD4+ cells, and CD3+
CD8+ cells in Ad5-CC10-Cre induced ASC (n=9; 3 mice) and Ad5-SPC-Cre induced PAC (n=9; 3 mice), doublepositive cells are represented as percentages of total CD45+ cells.
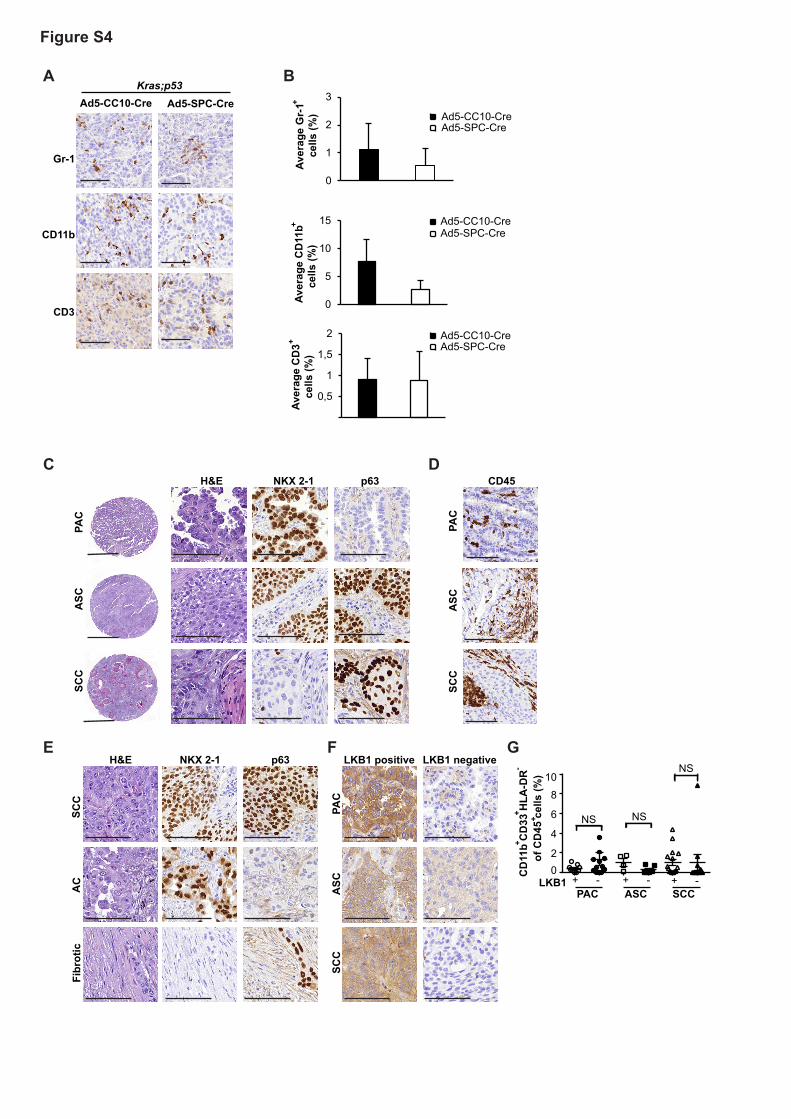
Figure S4
CH&E NKX 2-1 p63
SCC
ASC
PAC
E
AC
H&E NKX 2-1 p63
SCC
Fibr
otic
SCC
ASC
PAC
CD45D
F
SCC
ASC
PAC
LKB1 positiveG
NSNS
NS
LKB1 + - + -PAC ASC SCC
+ -02
4
6
8
10
CD
11b
CD
33 H
LA-D
R o
f CD
45 c
ells
(%)
LKB1 negative
++
-
+
0,5
1
1,5
2
0
5
10
15
0
1
2
3
Aver
age
CD
11b
cells
(%)
Aver
age
CD
3
ce
lls (%
)
B
Aver
age
Gr-
1 c
ells
(%)
Ad5-SPC-Cre
Ad5-SPC-Cre
Ad5-SPC-Cre
Ad5-CC10-Cre
Ad5-CC10-Cre
Ad5-CC10-Cre
++
+
Ad5-SPC-CreAd5-CC10-CreKras;p53
A
Gr-1
CD11b
CD3

Figure S4. Histotype-specific immune cell profiling of murine and human lung tumors. Related to Figure 4.(A) Representative images of anti-Gr-1, anti-CD11b and anti-CD3 stained Ad5-CC10-Cre and Ad5-SPC-Cre-inducedKras;p53 tumors. Scale bars: 50 µm. (B) Quantification of immunostainings for Gr-1, CD11b and CD3 in Kras;p53mice infected with Ad5-CC10-Cre (n=2) and Ad5-SPC-Cre (n=2). Error bars represent mean ± StDev. (C)Representative images of H&E, anti-NKX2-1, and anti-p63 for human PAC, ASC and SCC. Scale bar 1000 µm forTMA spots, 50 µm for magnified images. (D) Representative immunohistochemistry images of anti-CD45 on humanPAC, ASC, and SCC. Scale bar 100 µm. (E) Representative images of H&E, NKX2-1 and p63 immunostained ASCTMA spots representing SCC, AC and fibrotic regions. Scale bar 50 µm. (F) Representative IHC images of LKB1positive and negative tumors on TMAs of human PAC, ASC, and SCC tumors. Scale bar 50 µm. (G) Quantification ofCD11b+ CD33+ HLA-DR- cells as % of CD45+ cells in LKB1 expressing (+) and non-expressing (-) TMA samples.
Table S1. Related to Figure 1 and Figure S1.Quantification of all lesions analyzed from Kras;Lkb1 Ad5-CC10-Cre and Ad5-SPC-Cre infected mice (n=5), andanalysis of SOX2 and LKB1 IHC on human ASC TMA samples.
Table S2. Related to Figure 2 and Figure 3.List of commonly up- and downregulated genes from the comparative gene expression analysis represented as log foldchanges and p-values from the Kras;Lkb1 Ad5-CC10-Cre ASC vs Ad5-SPC-Cre PAC comparison.
Supplemental Experimental Procedures
Mouse breeding and recombinant adenovirus administrationCohorts of Kras;Lkb1 mice were generated by breeding Kras mice on a C57Bl/6J background with Lkb1fl/fl on a F4ICR;BALB/cByJ;FVB/N background. Kras;Lkb1 mice were crossed with Rosa26mT/mG Cre-reporter mice (Muzumdar etal., 2007), resulting in mixed background cohorts (C57Bl/6J, F4 ICR;BALB/cByJ;FVB/N, 29X1/SvJ;ICR). Eight to tenwk old mice were intranasally administered with 1-20x107 pfu of Ad5-CC10-Cre or 2.5-7.5x10⁹ pfu of Ad5-SPC-Creviruses (Viral Vector Core Facility, University of Iowa, USA) under isoflurane anaesthesia.
Tissue preparation and histopathology analysisFor immunohistochemistry of murine tissues, lungs were fixed overnight at room temperature in 4% formaldehyde,embedded in paraffin, sectioned (4 µm) from two distinct regions representing the surface and middle regions of thelungs. Histopathology analysis was performed for H&E-stained paraffin sections. Whole slide scans of stained tissuesections were acquired with a Pannoramic 250 3DHISTECH digital slide scanner. Scans were assessed for lesionnumbers and sizes using the Tissue studio image analysis solution of Definiens Developer XD 64 2.1 software(Definiens, Munich, Germany). Histopathology diagnoses were made by an expert pathologist.
Human Lung Cancer Samples and Tissue Microarray (TMA)Archived formalin-fixed paraffin-embedded tumor specimens were collected from 65 NSCLC patients operated during2000-2015 at the Hospital District of Helsinki and Uusimaa (HUS), Finland under an approval of the ethics committeesof Joint Authority for the HUS, Finland. Based on the IASLC/ATS/ERS NSCLC classification system (Travis et al.,2011), 12 of the patients were diagnosed as ASC, 25 as PAC, and 28 as SCC. The TMAs were prepared manually using2mm diameter cores. Depending on the available tumor tissue amount one to three replicate cores were made persample (Supplementary Table S1). Histopathology diagnoses were made by an expert pathologist.
AntibodiesThe following antibodies were used for immunohistochemistry, immunoblotting, and flow cytometry:
Antibody Company Catalogue no. Antigen retrieval
Immunohistochemistry - Human TMA tissues
CD45 Cell SignalingTechnology
13917 10mM Tris/1mM EDTA pH9.0
CD3 Thermo RM-9107 10mM Tris/1mM EDTA pH9.0

CD8 Dako M7103 10mM Tris/1mM EDTA pH9.0
CD4 Abcam 133616 10mM Tris/1mM EDTA pH9.0
CD33 LSbio C338084 10mM Tris/1mM EDTA pH9.0
CD11b BioSB 6441 10mM Tris/1mM EDTA pH9.0
HLA-DR Abcam 20181 10mM Tris/1mM EDTA pH9.0
Immunohistochemistry - Murine paraffin sections
HMGA2 Biocheck BC-59210AP 10mM sodium citrate pH 6.0
LKB1 Cell SignalingTechnology
13031 10mM sodium citrate pH 6.0
E-cadherin Cell SignalingTechnology
3195 10mM sodium citrate pH 6.0
p63 Abcam ab53039 10mM sodium citrate pH 6.0
NKX2-1 Abcam ab133638 10mM sodium citrate pH 6.0
Ki67 Thermo Fisher scientific RM-9106-S0 10mM sodium citrate pH 6.0
GFP (Lahtela et al., 2013)
Keratin 5 Abcam ab52635 10mM sodium citrate pH 6.0
Gr-1 E-Bioscience 14-5931 Trypsin
CD11b BioSB BSB6441 10mM sodium citrate pH 6.0
CD3 Abcam ab5690 10mM sodium citrate pH 6.0
SOX2 Santa CruzBiotechnology
sc-17320 10mM sodium citrate pH 6.0
SPC Millipore Ab3786 No antigen retrieval
CC10 Millipore AB-07632 No antigen retrieval
Immunoblotting
β-actin Sigma A1978
Flow cytometry analysis Dilution
CD45-PE E-Biosciences 12-0451-82 1:200
CD3-APC Biolegend 100236 1:100
CD4-PerCP BD Biosciences 553052 1:50
CD8-FITC E-Biosciences 11-0083-81 1:100
CD11b-FITC Biolegend 101206 1:100

Ly-6c-PerCP Biolegend 128027 1:50
Gr1-APC Biolegend 108412 1:200
Immunohistochemistry and quantitationHuman TMA sections were rehydrated and heat-mediated epitope retrieval was done in 10mM Tris/ 1mM EDTA pH9buffer in a PT heating module (Thermo Scientific) for 20 min at 99°C. Endogenous peroxidase was blocked in TBScontaining 0,9% H2O2 after which unspecific binding sites were blocked in TBS containing 0,05% Tween-20 and 10%normal goat serum. Primary antibodies were incubated for 1-2 hrs at room temperature. For fluorescent triple stainingsthe 488 fluorescent signal was obtained by applying 1:10 diluted HRP conjugated secondary (Bright Vision,Immunologic, Duiven, the Netherlands) antibodies for 30 min at room temperature after which the signal was enhancedby using the TSA-Alexa Fluor-488 substrate (Life Technologies). After the TSA-488 reaction, remaining peroxidasereactivity was blocked by immersing the slides in TBS containing 0.9% H2O2 and 15mM NaN3. The second primaryantibody was incubated for 1 hr at room temperature and 555 fluorescent signal was obtained by applying 1:10 dilutedHRP conjugated secondary antibodies (Bright Vision, Immunologic, Duiven, the Netherlands) for 30 min at roomtemperature after which the signal was enhanced by using the TSA-555 substrate (Life Technologies). To denature theprevious bound antibodies, slides were heated in 10mM Tris/ 1mM EDTA pH9 in a PT module at 99°C for 20 min.Then the third primary antibody was applied for 2 hrs at room temperature. Alexa fluor-647 conjugated goat anti-mouseor -rabbit antibodies (Life Technologies) were used as secondaries and nuclei were counterstained with DAPI (Roche,Mannheim, Germany). Whole slide scans of the fluorescent triple stained TMA slides were acquired with AxioImager.Z2 (Zeiss, Germany) with the Metafer 4 slide scanning system (MetaSystems GmbH, Germany).
Mouse paraffin sections were rehydrated and antigenic epitopes were exposed using an optimized antigen retrievalmethod. Tissue sections were blocked with 1% BSA and 10% Normal Goat Serum in 1x PBS. Primary antibodystaining was overnight at 4°C (SOX2) or 1-2 hrs at ambient temperature (all others). BrightVision poly-HRP Goat anti-rabbit (IL ImmunoLogic, AD Duiven, the Netherlands) or Peroxidase Goat anti-rat IgG (H+L) (Invitrogen Corporation,Camarillo, CA) were used as secondary antibodies. Detection was done with DAB (Bright DAB, IL ImmunoLogic,Duiven, The Netherlands). Whole slide scans of immunohistologically-stained lung sections were acquired with aPanoramic 250 3DHISTECH (3DHISTECH Kft. Budapest, Hungary) digital slide scanner using a 20x objective.. Scanswere assessed for quantitation of PAS or immunohistological stainings using the Tissue StudioTM image analysissolution of the Definiens Developer XD 64 2.1 software (Definiens, Munich, Germany). Fluorescent scans wereassessed for quantitation of immune cell stainings using the Tissue StudioTM IF image analysis solution of the DefiniensDeveloper XD 64 2.1 software (Definiens, Munich, Germany).
Microarray gene expression profiling and quantitative PCR analysisFor gene expression analyses, two tumors per tumor-bearing mouse were excized from the lung lobes. Each tumor wasdivided into three parts; one each for RNA and protein isolation, and one as a histology reference. Total RNA fromsnap-frozen tumors was extracted using the NucleoSpin RNA II kit (MACHEREY-NAGEL, Duren, Germany).Expression profiling was done with Illumina Mouse WT-6 version 2 expression arrays (Illumina, San Diego, CA,USA). For the quantitative PCR analysis the total RNA isolated from snap-frozen tumors was quantified using theNanoDrop 1000 (Thermo Fisher Scientific Inc., Waltham, USA). A high-capacity cDNA reverse transcription kit (Lifetechnologies, Waltham, USA) was used to synthesize complementary DNA (cDNA). Triplicate reactions using iQ™SYBR® Green Supermix (Bio-Rad, Hercules, USA) were run and analyzed on a CFX384 TouchTM Real-Time PCRDetection System (Bio-Rad, Hercules, USA), using relative quantitation against the housekeeping Rpl19 mRNA. Thefollowing primers flanking exon-exon boundaries were designed and verified for specific amplification: Il-1β, fwd5’TGCCACCTTTTGACAGTGATGAGA3’ rev 5’CCTGGAAGGTCCACGGGAA3’; Arginase1, fwd5’TCGTGTACATTGGCTTGCGA3’ rev 5’GCCAATCCCCAGCTTGTCTA3’; H2-D1, fwd5’CTGAAGAACGGGAACGCGAC3’ rev 5’TGTAAGAGTCAGTGGACGGAGG3’; H2-M2, fwd5’GTGCCTTGGATGGAACAGAT3’; rev 5’CCAGTCATCCTTTGGATGGT3’; Rpl19 fwd5’CGGGAATCCAAGAAGATTGA3’ rev 5’TTCAGCTTGTGGATGTGCTC3’. Cycles started with three mindenaturation at 95 °C, followed by 40 cycles of 15s at 95°C, and 1m at 60°C. A melting curve ranging from 57°C to95°C was included in every analysis to confirm specific amplification. For Arginase 1, an annealing temperature of58°C was used.
Microarray gene expression data analysisData analysis consisted of data pre-processing, quality analysis and detection of statistically differentially expressedgenes between different samples. All methods used were implemented in the beadarray, limma, and BioMart packagesof the Bioconductor Project. The result sheets from GenomeStudio were loaded to R, normalized, log2-transformed and

background corrected. Additional gene information was extracted from Ensembl using BioMart. Matching was done viaEnsembl gene names.
Comparative gene expression analysisDifferentially expressed genes were compared to publicly available gene expression data sets made available via theNCBI-GEO (http://www.ncbi.nlm.nih.gov/geo/) database. Differentially expressed genes using a p<0,01 and LogFC>1cut-off value from the following studies were included in the analysis: GSE54352 (Xu et al., 2014), GSE15724 (Rock etal., 2009), GSE10245 (Kuner et al., 2009) and GSE6135 (Ji et al., 2007). Venn diagrams were generated using Venny2.0.2 (http://bioinfogp.cnb.csic.es/tools/venny/). Heatmaps were generated using the R statistical programminglanguage heatmap function from the Heatplus Bioconductor package. R version 2.15.3 (http://www.r-project.org/) wasused to visualize genes commonly upregulated across data sets. BioMart Ensembl online tool was used to classifycommonly altered genes into different biological processes.
Immunoblotting analysisProtein lysates from snap-frozen tissues were prepared using a Precellys® tissue homogenizer (Bertin technologies,France). Cell lysates were prepared in RIPA buffer and protein concentrations were measured using a BCA kit. Proteinsamples (20 µg) were analyzed by immunoblotting.
Flow cytometry analysisTumors were dissected from the lungs of moribund mice and single cell suspensions were prepared by incubating thetumor tissue in HBSS containing 2mg/ml Collagenase 1A (Sigma Aldrich, USA) and 0,3 mg/ml Dispase (LifeTechnologies, Thermo Fisher Scientific, USA) for 30 min at 37°C, after which the tissue was disrupted using the gentleMACS Dissociator (Miltenyi Biotec, Germany) in DMEM medium containing 20mM Hepes and 5U/ml DNAse(Promega, USA). Single cell suspensions were stained with the antibodies mentioned in table. The antibodies wereincubated in HBSS/2%BSA for 30 min at 4°C. Dead cells were stained with 1µg/ml Propidium Iodide (Sigma Aldrich,USA). Analysis of the cells was performed using a BD Accuri flow cytometer, and data were analyzed with the BDAccuri C6 software (Becton, Dickinson and Company, USA).
Supplemental References
Ji, H., Ramsey, M.R., Hayes, D.N., Fan, C., McNamara, K., Kozlowski, P., Torrice, C., Wu, M.C., Shimamura, T.,Perera, S.A., et al. (2007). LKB1 modulates lung cancer differentiation and metastasis. Nature 448, 807-810.Kuner, R., Muley, T., Meister, M., Ruschhaupt, M., Buness, A., Xu, E.C., Schnabel, P., Warth, A., Poustka, A.,Sultmann, H., et al. (2009). Global gene expression analysis reveals specific patterns of cell junctions in non-small celllung cancer subtypes. Lung Cancer 63, 32-38.Lahtela, J., Corson, L.B., Hemmes, A., Brauer, M.J., Koopal, S., Lee, J., Hunsaker, T.L., Jackson, P.K., andVerschuren, E.W. (2013). A high-content cellular senescence screen identifies candidate tumor suppressors, includingEPHA3. Cell Cycle 12, 625-634.Muzumdar, M.D., Tasic, B., Miyamichi, K., Li, L., and Luo, L. (2007). A global double-fluorescent Cre reportermouse. Genesis 45, 593-605.Rock, J.R., Onaitis, M.W., Rawlins, E.L., Lu, Y., Clark, C.P., Xue, Y., Randell, S.H., and Hogan, B.L. (2009). Basalcells as stem cells of the mouse trachea and human airway epithelium. Proc Natl Acad Sci U S A 106, 12771-12775.Travis, W.D., Brambilla, E., Noguchi, M., Nicholson, A.G., Geisinger, K., Yatabe, Y., Powell, C.A., Beer, D., Riely,G., Garg, K., et al. (2011). International Association for the Study of Lung Cancer/American ThoracicSociety/European Respiratory Society: international multidisciplinary classification of lung adenocarcinoma: executivesummary. Proc Am Thorac Soc 8, 381-385.Xu, C., Fillmore, C.M., Koyama, S., Wu, H., Zhao, Y., Chen, Z., Herter-Sprie, G.S., Akbay, E.A., Tchaicha, J.H.,Altabef, A., et al. (2014). Loss of Lkb1 and Pten leads to lung squamous cell carcinoma with elevated PD-L1expression. Cancer Cell 25, 590-604.