Embed Size (px)
Citation preview

KPMG’s 2016 Internal SOXSurvey
An internal survey of KPMG teams and their current experiences serving clients with regards to SOX program governance and execution

Executive Summary
3© 2016 KPMG LLP, a Delaware limited liability partnership and the U.S. member firm of the KPMG network of independent member firms affiliated with KPMG International Cooperative (“KPMG International”), a Swiss entity. All rights reserved.
AppendixSurvey Demographics
LessonsLearned
Technologyand Tools
Reportingand
MonitoringTesting
Scopingand
Planning
RiskAssessment
ProgramBudgets
Program Structure /
Governance
Executive Summary
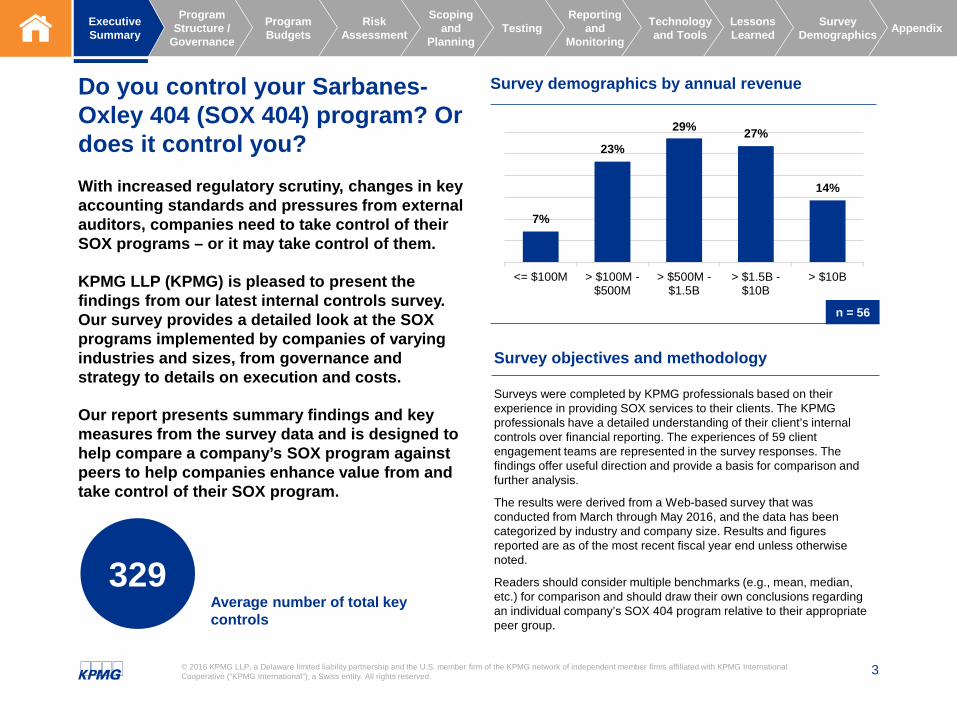
Do you control your Sarbanes-Oxley 404 (SOX 404) program? Or does it control you? With increased regulatory scrutiny, changes in key accounting standards and pressures from external auditors, companies need to take control of their SOX programs – or it may take control of them.
KPMG LLP (KPMG) is pleased to present the findings from our latest internal controls survey. Our survey provides a detailed look at the SOX programs implemented by companies of varying industries and sizes, from governance and strategy to details on execution and costs.
Our report presents summary findings and key measures from the survey data and is designed to help compare a company’s SOX program against peers to help companies enhance value from and take control of their SOX program.
329Average number of total key controls
Survey objectives and methodology
Surveys were completed by KPMG professionals based on their experience in providing SOX services to their clients. The KPMG professionals have a detailed understanding of their client’s internal controls over financial reporting. The experiences of 59 client engagement teams are represented in the survey responses. The findings offer useful direction and provide a basis for comparison and further analysis.
The results were derived from a Web-based survey that was conducted from March through May 2016, and the data has been categorized by industry and company size. Results and figures reported are as of the most recent fiscal year end unless otherwise noted.
Readers should consider multiple benchmarks (e.g., mean, median, etc.) for comparison and should draw their own conclusions regarding an individual company’s SOX 404 program relative to their appropriate peer group.
7%
23%
29% 27%
14%
<= $100M > $100M -$500M
> $500M -$1.5B
> $1.5B -$10B
> $10B
n = 56
Survey demographics by annual revenue

4© 2016 KPMG LLP, a Delaware limited liability partnership and the U.S. member firm of the KPMG network of independent member firms affiliated with KPMG International Cooperative (“KPMG International”), a Swiss entity. All rights reserved.
AppendixSurvey Demographics
LessonsLearned
Technologyand Tools
Reportingand
MonitoringTesting
Scopingand
Planning
RiskAssessment
ProgramBudgets
Program Structure /
Governance
Executive Summary
Take control of your internal controlsThe following are the key findings and insights on KPMG’s point of view for using this information to help take control of your internal controls. Companies can benefit from taking a proactive approach to maturing their SOX program along the controls journey. Specifically, the journey to reduce risk, reduce cost, reduce variability in the financial statements and drive value by improving processes and controls.
Companies are very focused on minimizing costs, but are focused on compliance costs rather than also considering performance costs, which is the larger opportunity
Key findings
— The main strategy for SOX programs in 2016 is to minimize compliance costs (83% of companies), whereas only 57% indicated they are focused on improving business processes to decrease the cost of control performance, reduce risk and add value as part of their strategy.
— In ranking reducing control performer efforts from ‘no concerns’ to ‘greatest focus’, only 15% of respondents indicated it as an area of greatest focus versus 35% indicating reducing control testing costs as a greatest focus.
Our point of view
— In efforts to minimize SOX costs, companies are primarily looking at compliance costs (testing and auditing) as these costs are more ‘visible’ to the company. However, most of the total cost of controls is generally related to the performance of controls (design, execution and administration).
— When companies focus solely on compliance costs, there may be a misalignment between their efforts and where the majority of the burden is actually occurring within their organization.
— To help achieve more value from the SOX program, companies should focus on the total cost of controls and the quality, effectiveness and efficiency of the controls.
Companies may be overly focused on aligning with the external auditor and maximizing reliance
Key findings
— A primary strategy for SOX programs in 2016 is to maximize external auditor reliance (81% of companies).
— 69% of companies do not have a difference between what the company has in scope / tests and what the external auditor has in scope / tests.
Our point of view
— Companies should take a proactive role in establishing their own strategy and making decisions related to their controls and overall ICOFR program.
— Companies need to regain control of their SOX programs and make an economic and risk-based, thoughtful decision about external auditor reliance.

5© 2016 KPMG LLP, a Delaware limited liability partnership and the U.S. member firm of the KPMG network of independent member firms affiliated with KPMG International Cooperative (“KPMG International”), a Swiss entity. All rights reserved.
AppendixSurveyDemographics
LessonsLearned
Technologyand Tools
Reportingand
MonitoringTesting
Scopingand
Planning
RiskAssessment
ProgramBudgets
Program Structure /
Governance
Executive Summary
Key findings and insights, continued
Companies are not fully leveraging technology to transform their control portfolios and SOX programs
Key findings
— On average, only 18% of total controls are automated.
— Only 8% of companies are using data analytic procedures in the execution of their SOX program and only 14% use continuous monitoring.
Our point of view
— A healthy and efficient internal controls program should include both automated and manual controls.
— Companies generally have invested significant resources into implementing enterprise resource planning and other key systems, as well as designing information technology general controls over those systems. Companies now need to continue focusing on implementing and monitoring additional automated controls within those systems to reduce risk and reduce the cost of controls.
— Data analytics and continuous monitoring can yield significant benefits, such as:
- Delivering regular insight into the status of controls and transactions across the company
- Enhancing overall risk and control oversight capability through early detection and monitoring
- Enabling an efficient way to vary the nature, timing and extent of testing based on risk.
Companies are not using SOX as a way to add value to their processes
Key findings
— In companies where Internal Audit participates in SOX activities, 55% of the Internal Audit departments spend 75% or more of their total hours on SOX.
— Only 57% of companies indicated improving business processes to decrease the cost of control performance, reduce risk and add value as part of their strategy.
Our point of view
— Companies spending a large proportion of their total Internal Audit hours on SOX should consider how to move their SOX program to a more mature and efficient state where more time and money can be focused towards broader Internal Audit and value creation initiatives.
— When SOX is part of a company’s culture and the program isworking efficiently, it can add value rather than just being a compliance exercise. A mature SOX program supports the company’s broader corporate values and strategies and can reduce risk, reduce costs and drive value.
55%of companies vary the number of sample selections based on the associated risk level; This is an approach more companies could use to align the nature and extent of evaluation procedures to risk

6© 2016 KPMG LLP, a Delaware limited liability partnership and the U.S. member firm of the KPMG network of independent member firms affiliated with KPMG International Cooperative (“KPMG International”), a Swiss entity. All rights reserved.
ContentsProgram Structure / Governance 07
Program Budgets 12
Risk Assessment 17
Scoping and Planning 21
Testing 25
Reporting and Monitoring 30
Technology and Tools 34
Lessons Learned 37
Survey Demographics 39
Appendix 42
Executive Summary 02
AppendixSurvey Demographics
LessonsLearned
Technologyand Tools
Reportingand
MonitoringTesting
Scopingand
Planning
RiskAssessment
ProgramBudgets
Program Structure /
Governance
Executive Summary
Program Structure / GovernanceKey takeaways

8© 2016 KPMG LLP, a Delaware limited liability partnership and the U.S. member firm of the KPMG network of independent member firms affiliated with KPMG International Cooperative (“KPMG International”), a Swiss entity. All rights reserved.
58%Companies where the SOX program’s day-to-day activities are owned by the Controller / Chief Accounting Officer or Director of Controls Compliance
64%Companies with involvement by the Controller / Chief Accounting Officer in developing the SOX strategy
71%
83%
43%
55%
40%
57%
78%81%
0%
10%
20%
30%
40%
50%
60%
70%
80%
90%
2015 2016 2015 2016 2015 2016 2015 2016
Minimize SOXcompliance costs
Controlsoptimization
Improve businessprocesses
Maximum relianceby external auditors
83% of companies focused their 2016 SOX strategy on minimizing costs related to documentation and testing of processesFocus on reducing costs has increased from 2015 but on a limited portion of the costs, as only 57% of companies are potentially considering the cost of control performance through improving business processes.
Q. What were the company’s strategies for its SOX program in 2015 and 2016?
n = 58
AppendixSurvey Demographics
LessonsLearned
Technologyand Tools
Reportingand
MonitoringTesting
Scopingand
Planning
RiskAssessment
ProgramBudgets
Program Structure /
Governance
Executive Summary
Respondents could select more than one option.
81%Companies focused on maximizing reliance by the external auditors

9© 2016 KPMG LLP, a Delaware limited liability partnership and the U.S. member firm of the KPMG network of independent member firms affiliated with KPMG International Cooperative (“KPMG International”), a Swiss entity. All rights reserved.
9%
36%
18%
28%
9%
Company doesnot perform
No reliance
Minimal
Moderate
Fully, to theextent possible
2%15%
12%
38%
33%Company doesnot perform
No reliance
Minimal
Moderate
Fully, to theextent possible
“Savings related to External Audit reliance are unknown.” – Survey commentary
“External Audit has not historically relied on management’s control testing as the SOX testing was performed too late in the year to allow for appropriate planning and reliance.” – Survey commentary
For 71% of companies, the external auditor relies on the organization’s test of effectiveness activities either moderately or fully, to the extent possible. This is significantly higher than the 37% at the same extent of reliance for the test of design. Despite these levels of external audit reliance and that companies are focused on maximizing that reliance, based on the experiences of KPMG professionals, only 19% of companies were able to quantify the savings from reliance either in terms of hours or dollars.
Q. To what extent does the external auditor rely on test of design activities performed by the company?
Q. To what extent does the external auditor rely on test of effectiveness activities performed by the company?
n = 58n = 56
AppendixSurvey Demographics
LessonsLearned
Technologyand Tools
Reportingand
MonitoringTesting
Scopingand
Planning
RiskAssessment
ProgramBudgets
Program Structure /
Governance
Executive Summary

10© 2016 KPMG LLP, a Delaware limited liability partnership and the U.S. member firm of the KPMG network of independent member firms affiliated with KPMG International Cooperative (“KPMG International”), a Swiss entity. All rights reserved.
77%
16%
41%
5%
4%
4%
100%
18%
80%
55%
Other
Outside-Firm
Business
Internal SOX Team
Yes Sometimes No
External auditors are only relying on work performed by an internal SOX team in 41% of companies compared to 77% when performed by an outside firm.
Q. Will the external auditor rely on the work performed by departments other than IA?
n
51
49
57
29
AppendixSurvey Demographics
LessonsLearned
Technologyand Tools
Reportingand
MonitoringTesting
Scopingand
Planning
RiskAssessment
ProgramBudgets
Program Structure /
Governance
Executive Summary

11© 2016 KPMG LLP, a Delaware limited liability partnership and the U.S. member firm of the KPMG network of independent member firms affiliated with KPMG International Cooperative (“KPMG International”), a Swiss entity. All rights reserved.
53%47%
Yes No
16%
16%
13%26%
29%
10% 25% 50% 75% 100%
Of the companies where Internal Audit participates in SOX activities, 55% of the Internal Audit departments spend 75% or more of their total hours on SOX, although internal audits are typically considered the more “value add” activity.
Q. Does the Internal Audit Department participate in the SOX Program?
Q. For Internal Audit departments participating in SOX, what percentage of total Internal Audit hours were related to SOX?
AppendixSurvey Demographics
LessonsLearned
Technologyand Tools
Reportingand
MonitoringTesting
Scopingand
Planning
RiskAssessment
ProgramBudgets
Program Structure /
Governance
Executive Summary
n = 58n = 56

Program BudgetsKey takeaways

13© 2016 KPMG LLP, a Delaware limited liability partnership and the U.S. member firm of the KPMG network of independent member firms affiliated with KPMG International Cooperative (“KPMG International”), a Swiss entity. All rights reserved.
39%
38%
23%
Decreasing Staying the same
Increasing
14%
50%
36%
Decreasing Staying the same
Increasing
20%
37%
43%
Decreasing Staying the same
Increasing
43% of companies experienced increasing costs in their SOX program from 2014 to 2015The cost trends below reflect costs related to control documentation, testing, SOX program governance, etc. (and do not include the cost of control performance). Companies with annual revenue of $500M - $10B were the most likely to experience increasing SOX program costs from 2014 to 2015. These trends reflect the pressures and challenges companies have faced in recent years related to:— Growing scrutiny from regulators, including the SEC and PCAOB;— Efforts to examine their SOX 404 internal controls environment based on the COSO 2013 framework; and— An increased focus on management review controls and information provided by entity. For companies that have already embraced these challenges and used them to update and enhance their SOX 404 programs, cost trends may begin to flatten out in the coming years.
2013-2014 2014-2015 2015-2016 (Expected)
AppendixSurvey Demographics
LessonsLearned
Technologyand Tools
Reportingand
MonitoringTesting
Scopingand
Planning
RiskAssessment
ProgramBudgets
Program Structure /
Governance
Executive Summary
n = 50 n = 53 n = 57

14© 2016 KPMG LLP, a Delaware limited liability partnership and the U.S. member firm of the KPMG network of independent member firms affiliated with KPMG International Cooperative (“KPMG International”), a Swiss entity. All rights reserved.
82% of companies, including companies of all sizes, spent more than 1,000 hours performing testing of effectiveness.
5%
2%
14%
6%
12%
2%
79%
70%
55%
14%
10%
35%
43%
49%
11%
18%
18%
14%
10%
24%
29%
27%
5%
4%
6%
20%
23%
9%
27%
12%
12%
6%
6%
16%
17%
7%
8%
12%
6%
29%
29%
82%
6%
4%
6%
0% 10% 20% 30% 40% 50% 60% 70% 80% 90% 100%
SOX Strategy
SOX Risk Assessment
ELC Assessment
Controls Documentation
Test of Design
Test of Effectiveness
Remediation Coordination
Reporting
Coordinating with External Auditor
Not performed this year 1‐100 hours 101‐200 hours 201‐500 hours 500‐1000 hours >1,000 hours
Q. What was the approximate total effort for each of the following during the most recent SOX compliance year?
49
51
51
56
52
49
49
50
38
n
AppendixSurvey Demographics
LessonsLearned
Technologyand Tools
Reportingand
MonitoringTesting
Scopingand
Planning
RiskAssessment
ProgramBudgets
Program Structure /
Governance
Executive Summary

15© 2016 KPMG LLP, a Delaware limited liability partnership and the U.S. member firm of the KPMG network of independent member firms affiliated with KPMG International Cooperative (“KPMG International”), a Swiss entity. All rights reserved.
8.4
average hours to perform a process walkthrough
On average it takes 20 hours per process to update process documentation, including the narrative, flowchart and risk and control matrix (RACM). The average time to create documentation for a new process is 35 hours; however, this average more than doubles (73 hours) when looking at the time to create new process documentation for first-year SOX filers.
14.1
9.5
11.4
8.8
4.6
6.6
8.4
0.0
2.0
4.0
6.0
8.0
10.0
12.0
14.0
16.0
NewDocumentation
- Narrative
NewDocumentation
- Flowchart
NewDocumentation
- RACM
UpdateDocumentation
- Narrative
UpdateDocumentation
- Flowchart
UpdateDocumentation
- RACM
PerformWalkthrough
Aver
age
Hou
rs
Total = 35
Total = 20
Q. What are the average hours per process to perform each of the following activities?
n = 59
AppendixSurvey Demographics
LessonsLearned
Technologyand Tools
Reportingand
MonitoringTesting
Scopingand
Planning
RiskAssessment
ProgramBudgets
Program Structure /
Governance
Executive Summary

16© 2016 KPMG LLP, a Delaware limited liability partnership and the U.S. member firm of the KPMG network of independent member firms affiliated with KPMG International Cooperative (“KPMG International”), a Swiss entity. All rights reserved.
82% of companies spent more than 1,000 hours performing testing of effectiveness
9.4
6.3
7.6
10.3
11.7
12.3
8.4
8.3
0.0 2.0 4.0 6.0 8.0 10.0 12.0 14.0
ITGC
Entity-Level Control
Application Control
Transactional Control without MRC or IPE
Financial Control with MRC
Financial Control with IPE
Financial Control without MRC
Financial Control without IPE
Financial controls involving information provided by entity (IPE) have the highest average testing hours at 12.3 hours per control. On average, the testing of IPE adds four hours to the testing of financial controls. This appears to be the most significant driver of increased testing time, followed by controls including management review control (MRC) considerations. Transactional controls also have higher average testing times due to the larger sample sizes tested for controls with frequencies of daily or more than daily.
Q. What are the average hours per control to test controls of each type?
9.3
average testing hours per control (across all control types)
n = 59
AppendixSurvey Demographics
LessonsLearned
Technologyand Tools
Reportingand
MonitoringTesting
Scopingand
Planning
RiskAssessment
ProgramBudgets
Program Structure /
Governance
Executive Summary

Risk AssessmentKey takeaways

18© 2016 KPMG LLP, a Delaware limited liability partnership and the U.S. member firm of the KPMG network of independent member firms affiliated with KPMG International Cooperative (“KPMG International”), a Swiss entity. All rights reserved.
98% of companies perform their SOX risk assessment at least annuallyHaving a robust risk assessment process is key for a company to take control of their SOX program and support their overall compliance strategy. A well-documented, comprehensive risk assessment helps companies to:
— Support their entity-level, IT application and process-level control selection
— Support the risk-based testing strategy for varying the nature, timing and extent of testing
— Defend their position (related to control selection, testing strategy, etc.) to the external auditor when met with last minute requests or findings
84%
of companies refresh their SOX risk assessment annually; 14% refresh their risk assessment more then annually and only 2% refresh it less than annually
73%
of companies perform a fraud risk assessment annually
75%
of companies performed their COSO 2013 assessment at the points of focus level, rather than only the principle level
AppendixSurvey Demographics
LessonsLearned
Technologyand Tools
Reportingand
MonitoringTesting
Scopingand
Planning
RiskAssessment
ProgramBudgets
Program Structure /
Governance
Executive Summary
Although the COSO 2013 Framework does not require controls related to each point of focus in order to demonstrate an effective system of internal control, the majority of companies mapped their controls at the point of focus level. The points of focus provide useful attributes for consideration in the design of controls to achieve each of the 17 principles within the framework.

19© 2016 KPMG LLP, a Delaware limited liability partnership and the U.S. member firm of the KPMG network of independent member firms affiliated with KPMG International Cooperative (“KPMG International”), a Swiss entity. All rights reserved.
96%
77%
75%
59%
43%
25%
0% 20% 40% 60% 80% 100%
Financial statement line level (balances and assertions)
Nature of transactions (routine vs. complex, automated vs. manual)
Fraud risk in conducting the day-to-day transactions
Complex accounting rules and principles
3rd party involvement
Regulatory and other legal requirements
Companies
Only 25% of companies considered regulatory and other legal requirements to help align their SOX risk assessment with other compliance risksTypical attributes of a strong SOX risk assessment process include:
— Considering multiple qualitative and quantitative factors to develop a comprehensive view of the organization’s risks
— Updating the risk assessment at least annually— Establishing an ongoing, iterative process to identify and assess risks, including changes in risks from new
markets, regulatory changes, significant transactions, leadership changes, etc.
Q. What factors were considered during the SOX risk assessment?
n = 56
AppendixSurvey Demographics
LessonsLearned
Technologyand Tools
Reportingand
MonitoringTesting
Scopingand
Planning
RiskAssessment
ProgramBudgets
Program Structure /
Governance
Executive Summary
Respondents could select more than one option.

20© 2016 KPMG LLP, a Delaware limited liability partnership and the U.S. member firm of the KPMG network of independent member firms affiliated with KPMG International Cooperative (“KPMG International”), a Swiss entity. All rights reserved.
69% of companies have no differences between what the company has in scope / tests and what the external auditor has in scope / testsFor companies focused on aligning key controls with the external auditor, consider why:
— To help comply with the COSO 2013 points of focus?
— To try to reduce external auditor fees?
— Do you have doubts in your process and fear the external auditor will ‘find something first’?
— You did not realize you have an option to do it differently?
20%
69%
11%
Yes No Depends
Q. Are there differences between what the client has in scope / tests and the external auditor?
n = 56
AppendixSurvey Demographics
LessonsLearned
Technologyand Tools
Reportingand
MonitoringTesting
Scopingand
Planning
RiskAssessment
ProgramBudgets
Program Structure /
Governance
Executive Summary

Scoping and PlanningKey takeaways

22© 2016 KPMG LLP, a Delaware limited liability partnership and the U.S. member firm of the KPMG network of independent member firms affiliated with KPMG International Cooperative (“KPMG International”), a Swiss entity. All rights reserved.
0 100 200 300 400 500
Total
Key Non-Key
139227
340
0100200300400
Bottom Quartile Median Top Quartile
46055% 45%
329 Average number of total key controls (all companies)
47% of companies do not have documented non-key controls
Companies are split nearly 50/50 in whether they maintain documentation of their non-key control activitiesQuestions to consider related to maintaining documentation of non-key controls:
— Does your company do a good job of identifying the total population of controls and then sub-selecting down to the key controls?
— What benefits could you obtain from documenting non-key controls (for example, identifying mitigating / compensating controls, identifying additional controls for coverage within internal audits, available documentation if a certain location or process becomes material, additional control certifications, etc.)?
— What would be the costs associated with preparing and maintaining documentation that includes the non-key control activities?
For companies documenting non-key controls, average total key and non-key controls
Total key controls (all companies)
n = 58
n = 31
AppendixSurvey Demographics
LessonsLearned
Technologyand Tools
Reportingand
MonitoringTesting
Scopingand
Planning
RiskAssessment
ProgramBudgets
Program Structure /
Governance
Executive Summary
23© 2016 KPMG LLP, a Delaware limited liability partnership and the U.S. member firm of the KPMG network of independent member firms affiliated with KPMG International Cooperative (“KPMG International”), a Swiss entity. All rights reserved.
0 100 200 300 400 500
Total
Manual Automated
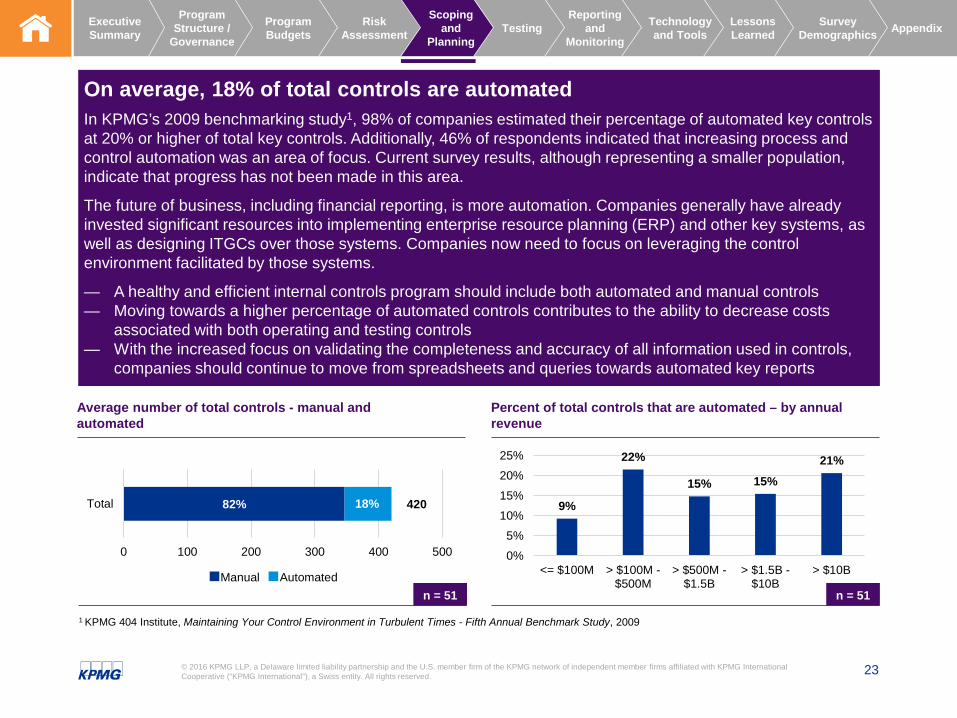
42082% 18%
On average, 18% of total controls are automatedIn KPMG’s 2009 benchmarking study1, 98% of companies estimated their percentage of automated key controls at 20% or higher of total key controls. Additionally, 46% of respondents indicated that increasing process and control automation was an area of focus. Current survey results, although representing a smaller population, indicate that progress has not been made in this area.
The future of business, including financial reporting, is more automation. Companies generally have already invested significant resources into implementing enterprise resource planning (ERP) and other key systems, as well as designing ITGCs over those systems. Companies now need to focus on leveraging the control environment facilitated by those systems.
— A healthy and efficient internal controls program should include both automated and manual controls— Moving towards a higher percentage of automated controls contributes to the ability to decrease costs
associated with both operating and testing controls— With the increased focus on validating the completeness and accuracy of all information used in controls,
companies should continue to move from spreadsheets and queries towards automated key reports
Average number of total controls - manual and automated
Percent of total controls that are automated – by annual revenue
n = 51 n = 51
AppendixSurvey Demographics
LessonsLearned
Technologyand Tools
Reportingand
MonitoringTesting
Scopingand
Planning
RiskAssessment
ProgramBudgets
Program Structure /
Governance
Executive Summary
1 KPMG 404 Institute, Maintaining Your Control Environment in Turbulent Times - Fifth Annual Benchmark Study, 2009
9%
22%
15% 15%21%
0%
5%
10%
15%
20%
25%
<= $100M > $100M -$500M
> $500M -$1.5B
> $1.5B -$10B
> $10B

24© 2016 KPMG LLP, a Delaware limited liability partnership and the U.S. member firm of the KPMG network of independent member firms affiliated with KPMG International Cooperative (“KPMG International”), a Swiss entity. All rights reserved.
59% of companies spending time on controls rationalization experienced a reduction in the key control countHowever, to achieve more value from the SOX program, rationalization efforts should be expanded to a controls transformation view to focus on the total cost of control and the quality, effectiveness and efficiency of the controls. Currently, only 15% of respondents reported reduced time and costs associated with control performance which is typically the larger component of the total cost of controls.
Q. How many hours were spent on controls rationalization for the prior year?
Q. What impact did the controls rationalization effort have on the SOX program?
53%
22%
8%
5%
12%
Insignificant/Nothing specific 40 - 100 hours
101 - 200 hours 201 - 400 hours
More than 400 hours
16
10
8
4
0
2
4
6
8
10
12
14
16
18
Reduced keycontrol count
Reducedtesting time
Increased keycontrol count
Reducedcontrol
performancetime
n = 59 n = 27
AppendixSurvey Demographics
LessonsLearned
Technologyand Tools
Reportingand
MonitoringTesting
Scopingand
Planning
RiskAssessment
ProgramBudgets
Program Structure /
Governance
Executive Summary
Respondents could select more than one option.

TestingKey takeaways

26© 2016 KPMG LLP, a Delaware limited liability partnership and the U.S. member firm of the KPMG network of independent member firms affiliated with KPMG International Cooperative (“KPMG International”), a Swiss entity. All rights reserved.
of companies test their controls in two or more phases each year93%
of companies update and confirm their control documentation and wording annually63%
7%
54%
37%
2%
Controls are tested in one phase each year
Controls are tested in two phases each year
Controls are tested in three phases each year
Controls are tested in more than three phases each year
11%
5%
9%
63%
3%9%
Regularly via Control Self‐Assessment (CSA)
Quarterly
Twice a year
Annually
Risk based determination
Only after process changes occur
Q. How many test of effectiveness phases occur each compliance year?
Q. How often is the control documentation and wording updated and confirmed?
n = 57 n = 57
AppendixSurvey Demographics
LessonsLearned
Technologyand Tools
Reportingand
MonitoringTesting
Scopingand
Planning
RiskAssessment
ProgramBudgets
Program Structure /
Governance
Executive Summary

27© 2016 KPMG LLP, a Delaware limited liability partnership and the U.S. member firm of the KPMG network of independent member firms affiliated with KPMG International Cooperative (“KPMG International”), a Swiss entity. All rights reserved.
77% of companies assess risk at the control level for testing purposes. 37% of the companies only use the control level and 40% use the control level as well as the account and/or process level.
Respondents could select more than one option.
27
31
44
0
5
10
15
20
25
30
35
40
45
50
Accounts Process Controls
24%
22%
26%
42%
36%
34%
34%
42%
40%
0% 20% 40% 60% 80% 100%
ERP Standard
ERP Customized
Business Warehouse
AnnuallyOnly after system upgrade/implementationRisk based determination
77% of companies assess risk at the control level for testing purposes37% of the companies only use the control level and 40% use the control level as well as the account and/or process level.
Q. At what level is risk assessed for testing purposes? Q. How often are key reports base-lined?
n
47
50
50
n = 57
AppendixSurvey Demographics
LessonsLearned
Technologyand Tools
Reportingand
MonitoringTesting
Scopingand
Planning
RiskAssessment
ProgramBudgets
Program Structure /
Governance
Executive Summary

28© 2016 KPMG LLP, a Delaware limited liability partnership and the U.S. member firm of the KPMG network of independent member firms affiliated with KPMG International Cooperative (“KPMG International”), a Swiss entity. All rights reserved.
66%
45%49%
54% 55%
86%
95%100%
34%
55%51%
46% 45%
14%
5%0%
0%
10%
20%
30%
40%
50%
60%
70%
80%
90%
100%
As Needed Several Times aDay
Daily Weekly Monthly Quarterly Semi Annually Annually
Frequency of Controls
No Yes As the frequency of the control decreases, there is less opportunity to vary the sample
size as there are fewer occurrences.
55% of the respondents vary the number of samples required for testing based on the associated risk level.Based on the 2007 SEC Interpretative Guidance for management, the nature and extent of evaluation procedures should align with those areas of highest risk to reliable financial reporting. Varying the sample size based on risk is one way to implement this guidance.
Q. Does the sample size vary based on the risk level?
AppendixSurvey Demographics
LessonsLearned
Technologyand Tools
Reportingand
MonitoringTesting
Scopingand
Planning
RiskAssessment
ProgramBudgets
Program Structure /
Governance
Executive Summary

29© 2016 KPMG LLP, a Delaware limited liability partnership and the U.S. member firm of the KPMG network of independent member firms affiliated with KPMG International Cooperative (“KPMG International”), a Swiss entity. All rights reserved.
91%
86%
92%
9%
14%
8%
0% 10% 20% 30% 40% 50% 60% 70% 80% 90% 100%
Control Self-Assessments
Continuous Monitoring Controls
Data Analytic Procedures
No Yes
“Tripwire is used for monitoring changes to financially significant applications. Tripwire sends near real-time notifications to application owners of any changes.”
– Example continuous monitoring control per survey
“Data analytics are used regularly during the risk assessment.”
– Example data analytics use per survey
Very few companies are leveraging approaches such as data analytics, continuous monitoring or control self-assessments in their SOX programs.
Q. What approaches are used in the execution of the SOX program?
AppendixSurvey Demographics
LessonsLearned
Technologyand Tools
Reportingand
MonitoringTesting
Scopingand
Planning
RiskAssessment
ProgramBudgets
Program Structure /
Governance
Executive Summary
n
59
56
57

Reporting and MonitoringKey takeaways

31© 2016 KPMG LLP, a Delaware limited liability partnership and the U.S. member firm of the KPMG network of independent member firms affiliated with KPMG International Cooperative (“KPMG International”), a Swiss entity. All rights reserved.
7% of the companies represented in the survey reported one or more material weaknesses in the prior year. 40% of companies represented reported one or more significant deficiencies in the prior year.
1
1
2
1
1
0 1 2
Order to cash
Inventory management
Fixed assets
Financial reporting
Disclosures
12
1
8
2
1
3
14
2
3
7
0 5 10 15
Other
Treasury
Tax
Procure to pay
Payroll
Order to cash
ITGC
Inventory management
Fixed assets
Financial reporting
Count of material weaknesses Count of significant deficiencies
n = 56 n = 57
AppendixSurveyDemographics
LessonsLearned
Technologyand Tools
Reportingand
MonitoringTesting
Scopingand
Planning
RiskAssessment
ProgramBudgets
Program Structure /
Governance
Executive Summary
Four companies represented in the survey reported material weaknesses, with a total of six material
weaknesses across those companies.
Twenty-three companies represented in the survey reported significant deficiencies, with a total of 53 significant deficiencies across those companies.

32© 2016 KPMG LLP, a Delaware limited liability partnership and the U.S. member firm of the KPMG network of independent member firms affiliated with KPMG International Cooperative (“KPMG International”), a Swiss entity. All rights reserved.
73% of companies represented in the survey reported one or more control deficiencies for the prior compliance year The most common process for control deficiencies was information technology general controls (ITGC), which accounts for 32% of the total control deficiencies.
5121
1350
4160
18539
3180
4
0 20 40 60 80 100 120 140 160 180 200
Other
Treasury
Tax
Procure to Pay
Payroll
Order to Cash
ITGC
Inventory Management
Fixed Assets
Financial Reporting
Derivative /Hedge Management
n = 56
Count of control deficiencies
AppendixSurvey Demographics
LessonsLearned
Technologyand Tools
Reportingand
MonitoringTesting
Scopingand
Planning
RiskAssessment
ProgramBudgets
Program Structure /
Governance
Executive Summary
average control deficiencies per company10

33© 2016 KPMG LLP, a Delaware limited liability partnership and the U.S. member firm of the KPMG network of independent member firms affiliated with KPMG International Cooperative (“KPMG International”), a Swiss entity. All rights reserved.
Q. What elements are included in the audit committee communications?
AppendixSurvey Demographics
LessonsLearned
Technologyand Tools
Reportingand
MonitoringTesting
Scopingand
Planning
RiskAssessment
ProgramBudgets
Program Structure /
Governance
Executive Summary
Respondents could select more than one option.
81%
55%
77%
78%
60%
69%
4%
27%
8%
15%
29%
20%
2%
2%
4%
5%
22%
11%
13%
16%
13%
5%
4%
0% 20% 40% 60% 80% 100%
Risk Assessment
Control Count
Controls Testing Calendar
Testing Progress
Control Exceptions/Deficiencies
Remediation Activities
High Level Only By Process In Details Not Communicated
n
54
55
53
55
55
55
Control exceptions and remediation activities are the most likely elements of a SOX program to be communicated to Audit Committees at a detailed level.

Technology and ToolsKey takeaways

35© 2016 KPMG LLP, a Delaware limited liability partnership and the U.S. member firm of the KPMG network of independent member firms affiliated with KPMG International Cooperative (“KPMG International”), a Swiss entity. All rights reserved.
Only 41% of the KPMG clients represented in the survey utilize a GRC technology for their SOX program.
41%
59%
Yes No
3
1 1
3
1 1 1
3
1 1
2
7
0
1
2
3
4
5
6
7
8
Cus
tom
in-h
ouse
bui
ld
Kai
ros
Met
ricSt
ream
Ope
nPag
es (I
BM
)
Pai
sley
Pro
tivity
GR
C
RS
A Ar
cher
(EM
C)
SAP
SIR
IS
Team
Mat
e
Thom
son
Reu
ters
Acc
elus
Wor
kiva
Q. Does the company use a GRC technology for its SOX program?
Q. What GRC technologies are utilized in the SOX program?
n = 59 n = 24
AppendixSurvey Demographics
LessonsLearned
Technologyand Tools
Reportingand
MonitoringTesting
Scopingand
Planning
RiskAssessment
ProgramBudgets
Program Structure /
Governance
Executive Summary
Respondents could select more than one option.

36© 2016 KPMG LLP, a Delaware limited liability partnership and the U.S. member firm of the KPMG network of independent member firms affiliated with KPMG International Cooperative (“KPMG International”), a Swiss entity. All rights reserved.
A few modules
52%Most
modules39%
All modules and features
9%
No18%
Yes82%
In process of being
implemented9%
Implemented less than a year ago
35%
Implemented and stable
43%
Implemented, but looking for a
new tool13%
Disappointed8%
Somewhat frustrated
22%
Somewhat satisfied
48%
Very satisfied
22%
Q. To what extent is GRC technology used? Q. Does the external auditor have access to the GRC technology?
Q. What is the current status of the GRC technology utilized for the SOX program?
Q. Based on our experience, what is the company’s satisfaction level with the current GRC technology?
n = 23 n = 23
AppendixSurvey Demographics
LessonsLearned
Technologyand Tools
Reportingand
MonitoringTesting
Scopingand
Planning
RiskAssessment
ProgramBudgets
Program Structure /
Governance
Executive Summary
n = 22n = 23

Lessons LearnedKey takeaways

38© 2016 KPMG LLP, a Delaware limited liability partnership and the U.S. member firm of the KPMG network of independent member firms affiliated with KPMG International Cooperative (“KPMG International”), a Swiss entity. All rights reserved.
2%
4%
6%
8%
9%
15%
20%
35%
0% 5% 10% 15% 20% 25% 30% 35% 40%
Communication w/ audit committee
Communication w/ senior leadership
Communication w/ control performers
Communication w/ management
Control performance quality
Reduce control performer efforts
Communications w/ external auditors
Reduce control testing cost/effort
In ranking reducing control performer efforts from ‘no concerns’ to ‘greatest focus’, only 15% of respondents indicated it as an area of greatest focus for their client. However, control performance is typically the largest component of the total cost of controls, rather than the testing / compliance costs which were more frequently indicated as an area of greatest focus (35%).
Q. What are the areas of the SOX program with the greatest focus for improvement this year?
n
55
56
53
54
53
54
52
AppendixSurvey Demographics
LessonsLearned
Technologyand Tools
Reportingand
MonitoringTesting
Scopingand
Planning
RiskAssessment
ProgramBudgets
Program Structure /
Governance
Executive Summary
52
“More communication and coordination to maximize external audit's ability to leverage work performed by the company.” – Survey commentary
“Communication and timeliness of feedback from External Audit to SOX compliance team.” –Survey commentary
“Increased communication related to emerging audit issues.” –Survey commentary

Survey DemographicsKey takeaways

40© 2016 KPMG LLP, a Delaware limited liability partnership and the U.S. member firm of the KPMG network of independent member firms affiliated with KPMG International Cooperative (“KPMG International”), a Swiss entity. All rights reserved.
24%
5%
10%
19%
10%
15%
17%
0% 5% 10% 15% 20% 25%
Technology
Retail
Industrial Manufacturing
Healthcare & Life Sciences
Food, Drink & Consumer Goods
Financial Services
Energy, Natural Resources & Chemicals
92% public companies 93% not publicly traded outside of the United States
Primary Industry
n = 59
AppendixSurvey Demographics
LessonsLearned
Technologyand Tools
Reportingand
MonitoringTesting
Scopingand
Planning
RiskAssessment
ProgramBudgets
Program Structure /
Governance
Executive Summary

41© 2016 KPMG LLP, a Delaware limited liability partnership and the U.S. member firm of the KPMG network of independent member firms affiliated with KPMG International Cooperative (“KPMG International”), a Swiss entity. All rights reserved.
7%
23%
29%27%
14%
<= $100M > $100M -$500M
> $500M -$1.5B
> $1.5B -$10B
> $10B
4%
23%
16%
36%
21%
<= $100M > $100M -$500M
> $500M -$1.5B
> $1.5B -$10B
> $10B
Survey demographics by annual revenue Survey demographics by total assets
n = 56 n = 56
AppendixSurvey Demographics
LessonsLearned
Technologyand Tools
Reportingand
MonitoringTesting
Scopingand
Planning
RiskAssessment
ProgramBudgets
Program Structure /
Governance
Executive Summary
17%15%
10%
19%
10%
5%
24%
Energy, NaturalResources &Chemicals
Financial Services Food, Drink &Consumer Goods
Healthcare & LifeSciences
IndustrialManufacturing
Retail Technology
Survey demographics by industry
n = 59

AppendixAdditional details

43© 2016 KPMG LLP, a Delaware limited liability partnership and the U.S. member firm of the KPMG network of independent member firms affiliated with KPMG International Cooperative (“KPMG International”), a Swiss entity. All rights reserved.
Total controls by company size
0 200 400 600 800 1000 1200 1400
> $10B
> $1.5B - $10B
> $500M - $1.5B
> $100M - $500M
<= $100M
Ann
ual R
even
ue
Key Controls Non-Key Controls
0 200 400 600 800 1000 1200
> $10B
> $1.5B - $10B
> $500M - $1.5B
> $100M - $500M
<= $100M
Ann
ual R
even
ue
Manual Controls Automated Controls
1%99% 146
Average number of total controls – key and non-key
Average number of total controls – manual and automated
9%91% 201
1623%77% 255
29%71% 530 15
30%70% 1,259 8
n
4
13
n
49%91% 161
1322%78% 212
1715%85% 260
1615%85% 530
1021%79% 1,011
AppendixSurvey Demographics
LessonsLearned
Technologyand Tools
Reportingand
MonitoringTesting
Scopingand
Planning
RiskAssessment
ProgramBudgets
Program Structure /
Governance
Executive Summary

44© 2016 KPMG LLP, a Delaware limited liability partnership and the U.S. member firm of the KPMG network of independent member firms affiliated with KPMG International Cooperative (“KPMG International”), a Swiss entity. All rights reserved.
0 200 400 600 800 1000
Technology
Retail
Industrial Manufacturing
Healthcare & Life Sciences
Food, Drink & Consumer Goods
Financial Services
Energy, Natural Resources & Chemicals
Key Controls Non-Key Controls
Average key & non-key controls by industry
47%
90%
n
10% 298 10
53% 734 9
6
11
6
3
13
77% 23% 994
85% 15% 356
92% 8% 459
74% 26% 358
90% 10% 171
AppendixSurvey Demographics
LessonsLearned
Technologyand Tools
Reportingand
MonitoringTesting
Scopingand
Planning
RiskAssessment
ProgramBudgets
Program Structure /
Governance
Executive Summary

45© 2016 KPMG LLP, a Delaware limited liability partnership and the U.S. member firm of the KPMG network of independent member firms affiliated with KPMG International Cooperative (“KPMG International”), a Swiss entity. All rights reserved.
Average manual & automated controls by industry
0 100 200 300 400 500 600 700 800 900
Technology
Retail
Industrial Manufacturing
Healthcare & Life Sciences
Food, Drink & Consumer Goods
Financial Services
Energy, Natural Resources & Chemicals
Manual Controls Automated Controls
93%
78%
n
22% 311 9
7% 813 8
5
10
6
3
11
84% 16% 595
73% 27% 372
81% 19% 459
69% 31% 358
78% 22% 184
AppendixSurvey Demographics
LessonsLearned
Technologyand Tools
Reportingand
MonitoringTesting
Scopingand
Planning
RiskAssessment
ProgramBudgets
Program Structure /
Governance
Executive Summary

46© 2016 KPMG LLP, a Delaware limited liability partnership and the U.S. member firm of the KPMG network of independent member firms affiliated with KPMG International Cooperative (“KPMG International”), a Swiss entity. All rights reserved.
0 10 20 30 40 50 60 70
Financial Reporting
Order-to-Cash
Procure-to-pay
Inventory Mgmt.
Derivative/Hedge Mgmt.
Treasury
Payroll
Fixed Assets
Tax
ITGC
Key Non-Key
24%76%
n
30
32%68%
72
56
44
40
12
18
30
20
14
68
33%67%
27%73%
51% 49%
70% 30%
67% 33%
76% 24%
74% 26%
84% 16%
27
30
20
9
29
30
26
29
29
Average key & non-key controls by process
AppendixSurvey Demographics
LessonsLearned
Technologyand Tools
Reportingand
MonitoringTesting
Scopingand
Planning
RiskAssessment
ProgramBudgets
Program Structure /
Governance
Executive Summary
Companies average 57 key ITGCs (84% of the total ITGCs)

47© 2016 KPMG LLP, a Delaware limited liability partnership and the U.S. member firm of the KPMG network of independent member firms affiliated with KPMG International Cooperative (“KPMG International”), a Swiss entity. All rights reserved.
0 10 20 30 40 50 60 70
Financial Reporting
Order-to-Cash
Procure-to-pay
Inventory Mgmt.
Derivative/Hedge Mgmt.
Treasury
Payroll
Fixed Assets
Tax
ITGC
Manual Automated
n
56
50
55
34
18
54
53
49
52
49
60
60
39
45
11
16
24
20
14
67
12%88%
17%83%
21%79%
16%84%
91% 9%
88%
95% 5%
100%
64% 36%
12%
88% 12%
Average manual & automated controls by process
AppendixSurvey Demographics
LessonsLearned
Technologyand Tools
Reportingand
MonitoringTesting
Scopingand
Planning
RiskAssessment
ProgramBudgets
Program Structure /
Governance
Executive Summary

48© 2016 KPMG LLP, a Delaware limited liability partnership and the U.S. member firm of the KPMG network of independent member firms affiliated with KPMG International Cooperative (“KPMG International”), a Swiss entity. All rights reserved.
Control details by processFinancial Reporting
Order-to-Cash
Procure-to-Pay
Inventory Mgmt.
Derivative / Hedge Mgmt. Treasury Payroll Fixed
Assets Tax ITGC
Tota
l C
ontr
ols
Minimum 8 5 3 2 3 1 3 1 1 0
Maximum 435 652 384 505 40 106 135 219 92 253
Average 60 60 39 45 11 16 24 20 14 67
Key
C
ontr
ols
Minimum 5 5 0 2 0 1 0 1 0 0
Maximum 330 652 384 505 31 106 56 219 92 253
Average 47 47 28 36 8 12 17 18 11 57
Aut
omat
ed
Con
trol
s
Minimum 0 0 0 0 0 0 0 0 0 0
Maximum 135 70 54 41 5 16 31 9 1 176
Average 7 10 8 7 1 2 3 1 0 24
Man
agem
ent
Rev
iew
C
ontr
ols
Minimum 0 0 0 0 0 0 0 0 0 0
Maximum 159 56 79 38 9 29 61 27 26 76
Average 20 10 6 7 3 3 7 5 6 8
Proc
ess
Leve
l EL
Cs
Minimum 0 0 0 0 0 0 0 0 0 0
Maximum 46 14 12 0 0 4 8 4 4 20
Average 12 3 2 0 0 1 4 1 1 5
AppendixSurvey Demographics
LessonsLearned
Technologyand Tools
Reportingand
MonitoringTesting
Scopingand
Planning
RiskAssessment
ProgramBudgets
Program Structure /
Governance
Executive Summary

49© 2016 KPMG LLP, a Delaware limited liability partnership and the U.S. member firm of the KPMG network of independent member firms affiliated with KPMG International Cooperative (“KPMG International”), a Swiss entity. All rights reserved.
High Risk Medium Risk Low Risk
Control Frequency Minimum Maximum Average Minimum Maximum Average Minimum Maximum Average
As Needed 5 60 33 5 45 27 5 26 22
Several Times a Day 5 60 34 5 45 30 5 35 23
Daily 5 40 25 5 40 23 5 25 18
Weekly 2 15 8 2 10 7 2 10 5
Monthly 1 5 3 1 5 3 1 3 2
Quarterly 1 2 2 1 2 2 1 2 2
Semi Annually 1 2 1 1 2 1 1 2 1
Annually 1 1 1 1 1 1 1 1 1
Some respondents also indicated that the sample sizes were based off a percentage of the population, sometimes also with a minimum and maximum sample size (e.g., 10% of the population with a minimum of five samples, or 10% of the population not to exceed 20). These values were not included for the purposes of this chart.
AppendixSurvey Demographics
LessonsLearned
Technologyand Tools
Reportingand
MonitoringTesting
Scopingand
Planning
RiskAssessment
ProgramBudgets
Program Structure /
Governance
Executive Summary
Sample sizes by control frequency & risk

Thank you
51© 2016 KPMG LLP, a Delaware limited liability partnership and the U.S. member firm of the KPMG network of independent member firms affiliated with KPMG International Cooperative (“KPMG International”), a Swiss entity. All rights reserved.
Paige Woolery Paige is a director in KPMG’s Risk Consulting practice with nine years of experience in internal audit, SOX assistance and other advisory services.
Paige’s scope of work includes leading financial and operational internal audits, SOX 404 documentation and testing, COSO 2013 transition evaluations, risk assessments and business integration initiatives. Paige has led large SOX engagements with responsibilities to plan and execute all phases, and to increase the efficiency and value of the SOX program.
Paige has conducted client trainings regarding SOX compliance and the COSO 2013 Framework. She is also involved in developing and delivering technical trainings for KPMG professionals.
Susan Burkom Susan is a Managing Director in KPMG’s Risk Consulting practice with over 22 years of risk consulting and audit experience. She has a strong background in Sarbanes Oxley (SOX) assistance, internal audit (IA) and enterprise risk management (ERM), as well as a strong accounting background.
Prior to joining KPMG’s Risk Consulting practice, Susan spent 12 years in KPMG’s external audit practice. This experience allows her to bring the perspective of the external auditor to her clients and assist her clients with anticipating external auditor needs.
Susan has substantial experience leading and coordinating global advisory engagements. Her experience crosses industries and has included manufacturing, finance, healthcare and services. Her work includes planning and conducting global internal audits, SOX planning, scoping, documentation and testing, as well as ERM.
Susan has a national role within KPMG’s SOX practice which involves establishing leading practices and developing tools and guidance to assist companies on their controls journey to reduce risk, reduce cost, increase reliance and drive value by improving processes and controls. Susan also serves as a National Instructor for KPMG’s internal SOX training.
Sue King Sue is a partner in KPMG’s Advisory, Risk Consulting practice with more than 25 years of experience. She has a strong background across the full spectrum of internal audit services including risk assessments, risk based internal audit project delivery, SOX 404 implementation and ERM. Sue’s experience spans many industries including manufacturing, technology, retail, software and healthcare.
Sue started her career spending eight years in KPMG’s external audit practice. Since then she has delivered advisory services to a wide variety of companies. Her experience in both external audit and advisory allows her to bring a balanced perspective to her clients.
Sue has assisted over 30 companies with their SOX 404 projects from initial implementation of 404 through to rationalizing programs to be sustainable and cost effective, and managing programs on a co-sourced or outsourced basis. Her clients range across many phases of the business cycle, from Fortune 1000 companies to pre-IPO companies.
Sue oversees the development of knowledge management and thought leadership for KPMG’s internal audit and SOX practice, as well as leads the development and delivery of technical training for KPMG’s US internal audit professionals.
About the authors

52© 2016 KPMG LLP, a Delaware limited liability partnership and the U.S. member firm of the KPMG network of independent member firms affiliated with KPMG International Cooperative (“KPMG International”), a Swiss entity. All rights reserved.
We acknowledge the contribution of the following individuals in the development of this survey:Jarrod BassmanPartner, Risk Consulting Markets Leader, KPMG LLP
Thiru AedunuthulaDirector, Advisory, KPMG LLP
Jeff ChadwickDirector, Advisory, KPMG LLP
John GarciaManager, Advisory, KPMG LLP
For additional information, please contact any of the following:Eric HoltPartner, Global and US IARCS Service Line LeaderT: [email protected]
Deon MinnaarPartner, US IA & SOAS Strategic Sourcing Service Network LeaderT: [email protected]
Susan BurkomManaging Director, Advisory, IA & SOAS Strategic SourcingT: [email protected]
Sue KingPartner, Advisory, IA & SOAS Strategic SourcingT: [email protected]
About KPMG:Our Internal Audit, Risk & Compliance Services (IARCS) are designed to enhance the efficiency and effectiveness of internal audit functions, enterprise risk management programs, reviews of third party relationships and risk and controls management. Our IARCSprofessionals can augment and enhance an organization’s existing risk management capabilities through the use of experienced risk and controls professionals, supplemented by multidisciplinary skills from each of our Advisory service lines.
KPMG’s Advisory professionals combine technical, market and business skills that allow them to deliver objective advice and guidance that helps the firm’s clients grow their businesses, improve their performance, and manage risk more effectively.
Our professionals have extensive experience working with global companies ranging from FORTUNE 500 companies to pre-IPO start-ups. We go beyond today’s challenges to anticipate the potential long-and short-term consequences of shifting business and technology. With a worldwide presence, KPMG continues to build on our member firms’ successes, thanks to our clear vision, values, and our people in 155 countries. We have the knowledge and experience to help clients navigate the global landscape.
Contact us

© 2016 KPMG LLP, a Delaware limited liability partnership and the U.S. member firm of the KPMG network of independent member firms affiliated with KPMG International Cooperative (“KPMG International”), a Swiss entity. All rights reserved.
The KPMG name and logo are registered trademarks or trademarks of KPMG International.
The information contained herein is of a general nature and is not intended to address the circumstances of any particular individual or entity. Although we endeavor to provide accurate and timely information, there can be no guarantee that such information is accurate as of the date it is received or that it will continue to be accurate in the future. No one should act on such information without appropriate professional advice after a thorough examination of the particular situation.
kpmg.com/socialmedia