Embed Size (px)
Citation preview

HSDC 2010-7
Korean Population
by County, Island and Census Tract in the State of Hawaii: 2010
State of Hawaii Department of Business, Economic Development & Tourism
Research and Economic Analysis Division Hawaii State Data Center
February 2012

This report has been cataloged as followed: Hawaii. Dept. of Business, Economic Development and Tourism. Research and Economic Analysis Division. Statistics and Data Support Branch. Hawaii State Data Center. Korean population by county, island and census tract in the State of Hawaii: 2010. Honolulu: 2012. Hawaii State Data Center Report Number 2010-7. 1. Ethnic groups-Hawaii-Statistics. 2. Census districts-Hawaii-Statistics. 3. United States -- Census, 2010. HA4007 .U89 2011

3
INTRODUCTION About This Report This report, Korean Population by County, Island and Census Tract in the State of Hawaii: 2010, was produced by the Hawaii State Data Center which is part of the Hawaii State Department of Business, Economic Development & Tourism (DBEDT) . The data included here were obtained from the U.S. Census Bureau, 2010 Census Summary File 1. The thematic maps were produced by the Hawaii State Office of Planning’s GIS Program. The category of “race alone” consisted of individuals who chose only that one race. “Race alone or in combination” referred to the number of responses in which an individual chose either that one race or that same race in combination with another race or races. For example, if an individual chose the race groups of both Korean and Chinese, that individual’s response would be counted in both the Korean “race alone or in combination” column as well as the Chinese “race alone or in combination” column. For the Korean group, this count represented all persons saying they were, for example, either a full or part “Korean”. It should be noted that “race alone or in combination” figures refer to number of “responses” and not individuals, so their sum would exceed the total population. The small areas used in this report were based on the U.S. Census Bureau’s geographic level of census tracts. In 2010, there were 321 census tracts in our state which contained population. Populations in the census tracts ranged from 1 to 11,012 people. The following tables and maps show the distribution of “race alone” and “race alone or in combination” populations. The tables and maps show the actual number as well as the percentage of the total population that number represents in each geographic area. Data on the number of people in a racial group are useful, especially when searching for large numbers of that specific group. The percentage of the area’s population composed of a certain racial group is a good indicator of population concentration. Having statistical information locating where clusters of racial groups currently live in Hawaii may be beneficial to businesses as well as to other organizations. Businesses will be able to make more knowledgeable decisions based on where their target population is located or knowing who their customers are in a specific location. Some crucial questions regarding the area may be answered by knowing its demographic characteristics. For example, a certain type of ethnic food may sell much better in one place versus another. Familiarity of cultural practices and sensitivities might add to the success of a business, too. Other types of organizations may use this data in deciding where they should open an office or how to best serve the majority of their clientele in a particular area. If an area has a significant number of people in a specific racial group, having people who speak their language on the organization’s staff may be helpful. Careful consideration of interactions and customs of families of that racial group may also add to the effectiveness of their staff in delivering services.

4
It should be noted, though, that other factors influence the needs and characteristics of racial groups. For example, was the person born here or did they come from another country? If they are from another country, when did they migrate here? This report provides some basic data. Researchers who are interested in more in-depth analyses of detailed race groups by small areas will be able to use additional census data being released by the Census Bureau’s American Community Survey. The present report is a part of the 2010 Census racial group report series being released by DBEDT. Availability of Data This report may be viewed or downloaded from the Hawaii State Department of Business, Economic Development & Tourism’s Internet site at:
http://hawaii.gov/dbedt/info/census/Census_2010/SF1/index_html
Census maps (online, thematic and reference) are available on the Hawaii State Office of Planning GIS Program Internet site at:
http://hawaii.gov/dbedt/gis/miscmaps.htm An earlier Hawaii State Data Center publication containing 2010 Census data by major race groups may be found on our DBEDT Internet site at:
http://hawaii.gov/dbedt/info/census/Census_2010/PL94-171/index_html Similar data from the Census 2000 may be found on our DBEDT Internet site at:
http://hawaii.gov/dbedt/info/census/Folder.2005-10-13.2927/hsdc-tables-sf1 The U.S. Census Bureau Internet site is at:
http://www.census.gov/
Information from the Census Bureau’s annual American Community Survey may be obtained through its American FactFinder website at:
http://factfinder2.census.gov/faces/nav/jsf/pages/index.xhtml
For further information, call the Hawaii State Data Center at (808) 586-2499.

5
Table 1.-- RANKING OF SELECTED RACES IN HAWAII: 2010
Rank RaceRace alone Rank Race
Race alone or in
combi-nation
1 White 336,599 1 White 564,323 2 Filipino 197,497 2 Filipino 342,095 3 Japanese 185,502 3 Japanese 312,292 4 Native Haw aiian 80,337 4 Native Haw aiian 289,970 5 Chinese 54,861 5 Chinese 199,872 6 Korean 24,203 6 Korean 48,699 7 Black or African American 21,424 7 Black or African American 38,820 8 Samoan 18,287 8 Samoan 37,463 9 Vietnamese 9,779 9 American Indian/Alaska Native 33,470
10 Marshallese 6,316 10 Vietnamese 13,266 11 Tongan 4,830 11 Tongan 8,085 12 American Indian and Alaska Native 4,164 12 Marshallese 7,412 13 Guamanian or Chamorro 2,700 13 Guamanian or Chamorro 6,647 14 Asian Indian 2,201 14 Asian Indian 4,737 15 Thai 2,006 15 Thai 3,701 16 Laotian 1,844 16 Laotian 2,620 17 Taiw anese 898 17 Taiw anese 1,161 18 Cambodian 464 18 Indonesian 990 19 Indonesian 399 19 Fijian 711 20 Fijian 282 20 Cambodian 705 21 Burmese 199 21 Pakistani 303 22 Sri Lankan 186 22 Malaysian 297 23 Pakistani 174 23 Burmese 281 24 Nepalese 125 24 Sri Lankan 231 25 Malaysian 86 25 Nepalese 146 26 Hmong 70 26 Hmong 87 27 Bangladeshi 60 27 Bangladeshi 74 28 Bhutanese 7 28 Bhutanese 13

6
Distribution of the Korean Population in Hawaii
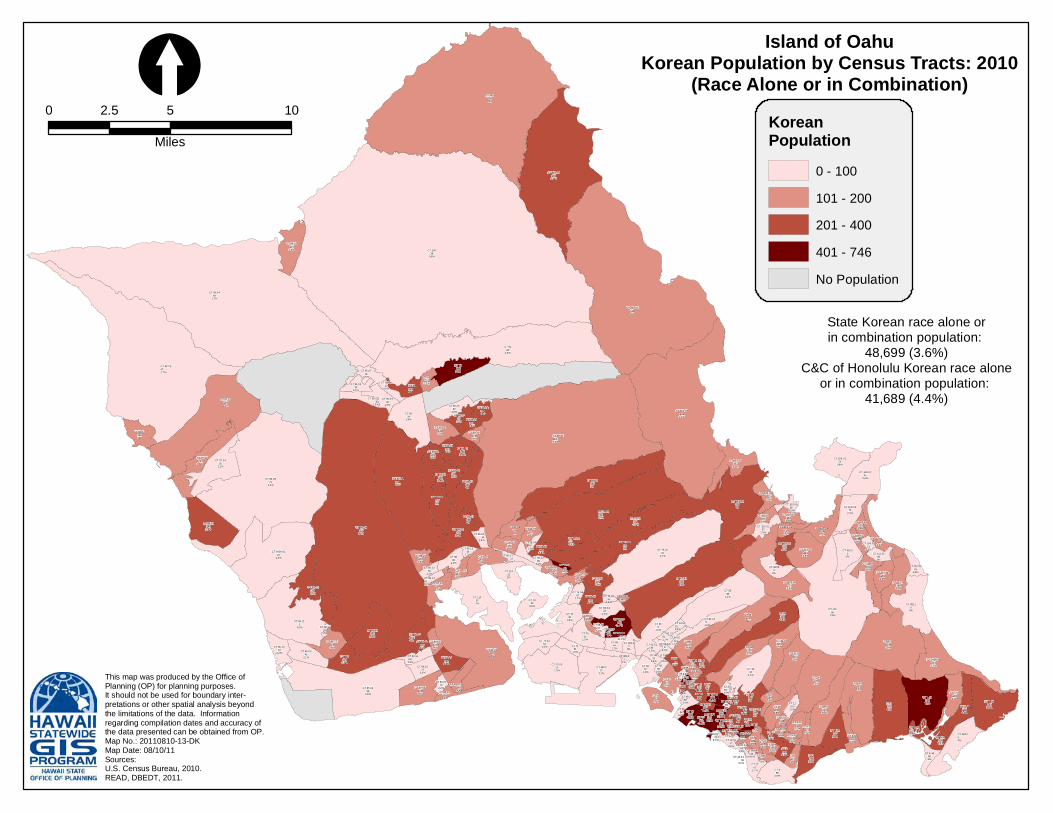
Statewide, there were 24,203 people in the Korean “race alone” group. The Koreans were the 6th largest “race alone” group in Hawaii and comprised two percent of our resident population in 2010. In our State of Hawaii, there were 48,699 people in the Korean “race alone or in combination” group. This group was the 6th largest “race alone or in combination” group and made up about four percent of Hawaii’s population.
Table 2.‐‐ KOREAN POPULATION BY RACE ALONE AND RACE ALONE OR IN COMBINATION BY COUNTY AND ISLAND, STATE OF HAWAII: 2010
AreaTotal
population Race alone Race alone or in combination
Race alone: % of total
population
Race alone or in combination: %
of total population
STATE 1,360,301 24,203 48,699 1.8 3.6
CITY AND COUNTY OF HONOLULU 953,207 22,179 41,689 2.3 4.4 Oahu Island 953,207 22,179 41,689 2.3 4.4 Northwestern Hawaiian Islands ‐ ‐ ‐ (X) (X)
HAWAII COUNTY 185,079 1,005 3,511 0.5 1.9
MAUI COUNTY 1/ 154,924 872 2,788 0.6 1.8 Maui Island 144,444 856 2,580 0.6 1.8 Lanai Island 3,135 11 90 0.4 2.9 Molokai Island 1/ 7,345 5 118 0.1 1.6 Kahoolawe Island ‐ ‐ ‐ (X) (X)
KAUAI COUNTY 67,091 147 711 0.2 1.1 Kauai Island 66,921 147 711 0.2 1.1 Niihau and Kaula Islands 170 ‐ ‐ (X) (X)
‐ Represents zero or rounds to 0.0.
(X) Percentage changes involving negative numbers or zero are meaningless.
1/ Includes Kalawao County (Census Tract 319) which is administered by the Hawaii State Department of Health. Source: U.S. Census Bureau, 2010 Census Summary File 1, Tables QT‐P8 and QT‐P9; extracted by the Hawaii State Department of Business, Economic Development & Tourism, Hawaii State Data Center.

7
All of the census tracts with the largest population of the Korean “race alone” group were located in urban Honolulu. A part of this group included the contiguous census tracts of Kaheka Street-Makaloa Street, Ala Moana, Ahana Street and Sheridan Street.
The census tracts with the highest percentage of the Korean “race alone” group were Kaheka Street-Makaloa Street and Ahana Street ranking #1 and #2, respectively.
Table 3.‐‐ TOP TEN CENSUS TRACTS ‐ NUMBER OF KOREAN RACE ALONE: 2010
RankCensus tract number Island Census tract name
Total population
Number of Korean race
alone1 36.04 Oahu Kaheka Street‐Makaloa Street 2,519 6032 37 Oahu Ala Moana 5,579 5753 36.03 Oahu Ahana Street 2,807 5614 68.05 Oahu Salt Lake Country Club 6,167 5605 38 Oahu Kakaako 3,970 5316 34.06 Oahu Lower Makiki 5,777 5127 34.04 Oahu Makiki Fire Station 4,716 5078 68.08 Oahu Ala Ilima Mauka 4,423 4959 35.02 Oahu Upper Pawaa 3,876 48710 36.01 Oahu Sheridan Street 4,109 467
Table 4.‐‐ TOP TEN CENSUS TRACTS ‐ PERCENT OF TOTAL POPULATION OF KOREAN RACE ALONE: 2010
RankCensus tract number Island Census tract name
Total population
% Korean race alone
1 36.04 Oahu Kaheka Street‐Makaloa Street 2,519 23.92 36.03 Oahu Ahana Street 2,807 20.03 38 Oahu Kakaako 3,970 13.44 35.02 Oahu Upper Pawaa 3,876 12.65 35.01 Oahu Academy of Arts 2,282 11.86 51 Oahu Foster Botanical Garden 3,090 11.57 36.01 Oahu Sheridan Street 4,109 11.48 68.08 Oahu Ala Ilima Mauka 4,423 11.29 34.04 Oahu Makiki Fire Station 4,716 10.810 37 Oahu Ala Moana 5,579 10.3

8
Almost all of the top census tracts for the Korean “race alone and in combination” group were in the urban Honolulu area. The largest number in this group lived in the Salt Lake Country Club area. Most of the remaining areas were in the Ala Moana and Makiki sections of the island. The only area outside urban Honolulu was Hahaiona-Mariners Ridge which is located in East Honolulu.
All of the census tracts with the highest percentage of the Korean “race alone or in combination” group were in the urban Honolulu area, with the highest percentage in the Kaheka Street-Makaloa Street and Ahana Street census tracts.
Table 5.‐‐ TOP TEN CENSUS TRACTS ‐ NUMBER OF KOREAN RACE ALONE OR IN COMBINATION: 2010
RankCensus tract number Island Census tract name
Total population
Number of Korean
race alone or in
combination1 68.05 Oahu Salt Lake Country Club 6,167 7462 37 Oahu Ala Moana 5,579 6933 34.04 Oahu Makiki Fire Station 4,716 6474 36.04 Oahu Kaheka Street‐Makaloa Street 2,519 6465 34.06 Oahu Lower Makiki 5,777 6376 38 Oahu Kakaako 3,970 6287 68.08 Oahu Ala Ilima Mauka 4,423 6188 36.03 Oahu Ahana Street 2,807 6079 1.06 Oahu Hahaione‐Mariners Ridge 7,704 59010 35.02 Oahu Upper Pawaa 3,876 575
Table 6.‐‐ TOP TEN CENSUS TRACTS ‐ PERCENT OF TOTAL POPULATION OF KOREAN RACE ALONE OR IN COMBINATION: 2010
RankCensus tract number Island Census tract name
Total population
% Korean race alone or in combination
1 36.04 Oahu Kaheka Street‐Makaloa Street 2,519 25.62 36.03 Oahu Ahana Street 2,807 21.63 38 Oahu Kakaako 3,970 15.84 35.02 Oahu Upper Pawaa 3,876 14.85 35.01 Oahu Academy of Arts 2,282 14.86 68.08 Oahu Ala Ilima Mauka 4,423 14.07 36.01 Oahu Sheridan Street 4,109 13.98 34.04 Oahu Makiki Fire Station 4,716 13.79 51 Oahu Foster Botanical Garden 3,090 12.910 37 Oahu Ala Moana 5,579 12.4

Table 7.‐‐ POPULATION BY KOREAN RACE ALONE AND RACE ALONE OR IN COMBINATION BY ISLAND AND CENSUS TRACT, STATE OF HAWAII: 2010
Island and 2010 census tract Name
Total population Korean alone
Korean alone or in
combination % of Korean
alone
% of Korean alone or in combination
State total 1,360,301 24,203 48,699 1.8 3.6
Oahu 953,207 22,179 41,689 2.3 4.41.06 Hahaione‐Mariners Ridge 7,704 391 590 5.1 7.71.07 Kuapa Isle 2,818 95 188 3.4 6.71.08 Hawaii Kai Marina 3,264 142 237 4.4 7.31.10 Kalama Valley 4,288 98 241 2.3 5.61.11 Lunalilo Park Subdivision 5,035 115 308 2.3 6.11.12 Koko Marina 5,555 221 398 4.0 7.21.14 Portlock 1,594 37 80 2.3 5.02 Kuliouou 5,742 93 265 1.6 4.63.01 Aina Haina‐Hawaii Loa Ridge 3,307 96 157 2.9 4.73.02 Wailupe 2,990 74 162 2.5 5.44.01 Waialae Nui Ridge‐Ainakoa 2,893 40 132 1.4 4.64.02 Waialae Iki 3,999 208 323 5.2 8.15 Waialae‐Kahala 3,807 137 209 3.6 5.56 Diamond Head 1,218 32 58 2.6 4.87 Kaimuki: 22nd Avenue 2,966 67 177 2.3 6.08 Kaimuki: Kapiolani Community College 3,771 88 216 2.3 5.79.01 Waialae Nui Valley 2,736 132 177 4.8 6.59.02 Maunalani Heights 4,088 92 151 2.3 3.79.03 Lower Wilhelmina 2,858 60 165 2.1 5.810 Upper Palolo 3,096 33 140 1.1 4.511 Central Palolo 3,862 39 100 1.0 2.612.01 Waialae Avenue‐Pukele Avenue 2,924 92 157 3.1 5.412.02 Lower Palolo 3,030 62 118 2.0 3.913 Kaimuki: 6th Avenue 4,207 115 246 2.7 5.814 Kapaolono Field 2,550 86 139 3.4 5.515 Upper Kapahulu 3,527 99 189 2.8 5.416 Lower Kapahulu 3,783 110 191 2.9 5.017 Kapiolani Park 2,437 41 67 1.7 2.718.01 Koa Avenue 1,717 43 55 2.5 3.218.03 Tusitala Street 3,360 118 141 3.5 4.218.04 Jefferson School 1,849 70 84 3.8 4.519.01 Waikiki Beach 837 19 27 2.3 3.219.03 Ena Road 2,770 180 213 6.5 7.719.04 Hobron Lane 3,912 179 224 4.6 5.720.03 Seaside Avenue 2,477 124 139 5.0 5.620.04 International Market Place 1,398 62 69 4.4 4.920.05 Ala Wai‐Niu Street 2,389 85 102 3.6 4.320.06 Ala Wai‐Olohana Street 2,364 75 98 3.2 4.121 Olokele Avenue 3,864 112 189 2.9 4.922.01 Kamoku Street‐Iolani School 3,684 221 325 6.0 8.822.02 Ala Wai Park‐Lauiki Street 3,400 322 411 9.5 12.123 Moiliili 5,523 297 401 5.4 7.324.01 Lower McCully 3,096 141 204 4.6 6.624.02 Upper McCully 3,228 197 289 6.1 9.025 Lower Pawaa 3,915 209 264 5.3 6.726 Bingham Tract 4,249 221 330 5.2 7.827.01 UH Manoa Campus 5,093 111 204 2.2 4.027.02 Punahou School 5,057 211 297 4.2 5.928 St. Louis Heights 3,678 76 178 2.1 4.8
Continued on next page.
9

Table 7.‐‐ POPULATION BY KOREAN RACE ALONE AND RACE ALONE OR IN COMBINATION BY ISLAND AND CENSUS TRACT, STATE OF HAWAII: 2010 ‐‐ Con.
Island and 2010 census tract Name
Total population Korean alone
Korean alone or in
combination % of Korean
alone
% of Korean alone or in combination
Oahu (con.):29 East Manoa 2,415 147 184 6.1 7.630 Judd Hillside‐Lowrey Avenue 4,321 113 214 2.6 5.031.01 Woodlawn 3,687 51 103 1.4 2.831.02 Upper Manoa 3,335 82 196 2.5 5.932 Round Top‐Tantalus 833 30 34 3.6 4.133 Makiki Heights 1,132 29 64 2.6 5.734.03 Thurston Street 5,530 455 563 8.2 10.234.04 Makiki Fire Station 4,716 507 647 10.8 13.734.05 Poki Street 3,250 310 372 9.5 11.434.06 Lower Makiki 5,777 512 637 8.9 11.034.07 Maryknoll School 913 46 55 5.0 6.035.01 Academy of Arts 2,282 270 337 11.8 14.835.02 Upper Pawaa 3,876 487 575 12.6 14.836.01 Sheridan Street 4,109 467 570 11.4 13.936.03 Ahana Street 2,807 561 607 20.0 21.636.04 Kaheka Street‐Makaloa Street 2,519 603 646 23.9 25.637 Ala Moana 5,579 575 693 10.3 12.438 Kakaako 3,970 531 628 13.4 15.839 Civic Center 655 25 34 3.8 5.240 Financial District 1,552 54 69 3.5 4.441 Queen's Hospital 4,504 267 366 5.9 8.142 Queen Emma Gardens 3,432 186 253 5.4 7.443 Punchbowl 5,591 101 221 1.8 4.044 Pauoa 5,165 43 139 0.8 2.745 Dowsett Highlands 5,145 117 278 2.3 5.446 Puunui‐Waokanaka Street 3,735 54 154 1.4 4.147 Alewa‐Kawananakoa 4,553 78 211 1.7 4.648 Kamehameha Heights 6,707 52 168 0.8 2.549 Lanakila 3,198 55 119 1.7 3.750 Kuakini 4,049 77 156 1.9 3.951 Foster Botanical Garden 3,090 356 399 11.5 12.952 Chinatown 3,293 231 244 7.0 7.453 Aala 3,636 363 414 10.0 11.454 Mayor Wright Housing 1,637 4 9 0.2 0.555 Palama 2,078 74 81 3.6 3.956 Kapalama 6,749 192 247 2.8 3.757 Iwilei‐Anuenue 2,148 86 117 4.0 5.458 Waiakamilo Road 3,440 52 89 1.5 2.659 Mokauea Street 3,353 27 42 0.8 1.360 Umi Street 5,421 10 31 0.2 0.661 Kalihi Waena 4,175 11 19 0.3 0.562.01 Kam IV Road 6,047 30 76 0.5 1.362.02 Linapuni Street 1,701 1 3 0.1 0.263.01 Kalihi Valley Park 3,773 30 65 0.8 1.763.02 Kalena Drive 2,720 3 13 0.1 0.564.01 Gulick Avenue‐Likelike 2,059 5 23 0.2 1.164.02 Kamanaiki Street 6,387 23 77 0.4 1.265 Upper Kalihi Valley 4,541 31 98 0.7 2.266 Kahauiki Street 374 6 6 1.6 1.667.01 Tripler‐Moanalua 5,830 106 262 1.8 4.567.02 Red Hill 1,989 116 160 5.8 8.0
Continued on next page.
10

Table 7.‐‐ POPULATION BY KOREAN RACE ALONE AND RACE ALONE OR IN COMBINATION BY ISLAND AND CENSUS TRACT, STATE OF HAWAII: 2010 ‐‐ Con.
Island and 2010 census tract Name
Total population Korean alone
Korean alone or in
combination % of Korean
alone
% of Korean alone or in combination
Oahu (con.):68.02 Aliamanu 6,842 49 107 0.7 1.668.04 Aliamanu Crater 2,835 14 34 0.5 1.268.05 Salt Lake Country Club 6,167 560 746 9.1 12.168.06 Ala Lilikoi 1,704 60 97 3.5 5.768.08 Ala Ilima Mauka 4,423 495 618 11.2 14.068.09 Ala Ilima Makai 5,040 368 512 7.3 10.269 Arizona Road 3,823 10 44 0.3 1.270 Navy Marine Golf Course 4,041 26 62 0.6 1.571 Nimitz Elementary School 2,713 26 51 1.0 1.973.02 Hangar Avenue‐Vickers Avenue 3,866 33 57 0.9 1.573.03 Hickam Air Force Base 341 1 8 0.3 2.374 Ford Island 3,981 20 30 0.5 0.875.02 Halawa Valley 1,376 9 10 0.7 0.775.03 Halawa Heights 5,160 76 202 1.5 3.975.04 Aloha Stadium 3,171 31 87 1.0 2.775.05 Foster Village 5,338 119 222 2.2 4.275.06 Red Hill Military Housing 933 5 15 0.5 1.677.01 Lower Aiea 4,240 50 118 1.2 2.877.02 Aiea Heights 5,098 97 254 1.9 5.078.04 Lower Pearl City 1,907 31 67 1.6 3.578.05 Waiau Townhouses 5,136 131 275 2.6 5.478.07 Pearl Ridge High Rise 5,405 364 492 6.7 9.178.08 Pearlridge Center 3,346 62 114 1.9 3.478.09 Newtown 3,377 84 223 2.5 6.678.10 Royal Summit 5,450 120 292 2.2 5.478.11 Pearl Country Club 4,990 135 264 2.7 5.380.01 Hale Mohalu Hospital 2,005 26 72 1.3 3.680.02 Lower Waiau 2,837 31 89 1.1 3.180.03 Manana 4,668 86 170 1.8 3.680.05 Pacific Palisades 6,864 84 341 1.2 5.080.06 Pearl City 4,858 72 196 1.5 4.080.07 Pearl City Highlands 5,306 65 197 1.2 3.783.01 Iroquois Point 4,661 16 110 0.3 2.483.02 Campbell High School 6,749 8 108 0.1 1.684.02 Ewa Beach 8,206 28 155 0.3 1.984.05 Holomua School 4,664 28 117 0.6 2.584.06 Hawaii Prince Golf Course 5,997 62 230 1.0 3.884.07 Ocean Pointe 3,325 23 73 0.7 2.284.08 Hoakalei Country Club 4,728 49 132 1.0 2.884.10 Coral Creek Golf Course 2,346 21 77 0.9 3.384.11 Geiger Road 3,448 27 100 0.8 2.984.12 Ewa Gentry 6,543 53 205 0.8 3.185.02 Kalaeloa 2,136 11 59 0.5 2.886.06 Kapolei Golf Course 9,693 123 352 1.3 3.686.09 Ko Olina‐Honokai Hale 2,066 10 43 0.5 2.186.10 Ko Olina Resort 1,051 15 23 1.4 2.286.11 Kahe 84 1 3 1.2 3.686.12 Upper Makakilo 6,017 58 201 1.0 3.386.13 Makakilo: Wainohia Street 904 6 18 0.7 2.086.14 Kunia West 8,232 114 318 1.4 3.986.17 Ewa Villages 9,364 117 285 1.2 3.0
Continued on next page.
11

Table 7.‐‐ POPULATION BY KOREAN RACE ALONE AND RACE ALONE OR IN COMBINATION BY ISLAND AND CENSUS TRACT, STATE OF HAWAII: 2010 ‐‐ Con.
Island and 2010 census tract Name
Total population Korean alone
Korean alone or in
combination % of Korean
alone
% of Korean alone or in combination
Oahu (con.):86.22 Lower Makakilo 4,068 37 153 0.9 3.887.01 Leeward Community College 8,787 42 144 0.5 1.687.02 St. Joseph School 5,593 93 142 1.7 2.587.03 West Loch 6,837 43 114 0.6 1.788 Managers Drive 8,054 40 98 0.5 1.289.06 Mililani Golf Course 3,771 88 209 2.3 5.589.07 Mililani High School 4,232 79 207 1.9 4.989.08 Mililani Marketplace 5,837 98 289 1.7 5.089.09 Mililani District Park 3,806 78 206 2.0 5.489.12 August Ahrens School 2,570 12 34 0.5 1.389.13 Robinson Heights 4,116 14 50 0.3 1.289.14 Honowai School 5,098 11 63 0.2 1.289.15 Waipio Acres 5,236 67 171 1.3 3.389.17 Mililani Town Center 4,554 87 245 1.9 5.489.18 Mililani: Nob Hill 5,429 110 301 2.0 5.589.20 Waipio Gentry 4,296 109 256 2.5 6.089.21 Waipio 2,668 10 44 0.4 1.689.22 Waikele 7,479 169 379 2.3 5.189.23 Seaview 4,737 82 235 1.7 5.089.24 Royal Kunia 7,623 104 251 1.4 3.389.25 Village Park 6,902 64 172 0.9 2.589.26 Laulani Valley‐Mililani Technology Park 1,572 15 60 1.0 3.889.27 Koolani Drive 5,180 137 371 2.6 7.289.28 Mililani Mauka Middle School 3,884 96 314 2.5 8.189.29 Mililani Mauka‐Meheula Parkway 4,836 85 233 1.8 4.889.30 Mililani: Ainamakua Drive 2,560 60 176 2.3 6.989.31 Waiawa 3,310 49 183 1.5 5.590 Wheeler‐East Range 1,634 8 29 0.5 1.891 Kaukonahua Road 5,332 16 83 0.3 1.692 Wahiawa Mauka 7,963 112 465 1.4 5.893 Wahiawa Waena 4,762 64 151 1.3 3.294 Wahiawa Makai 5,155 102 208 2.0 4.095.01 Kolekole Avenue 4,893 24 63 0.5 1.395.02 Menoher Street 4,243 12 30 0.3 0.795.03 Foote Avenue 3,403 32 42 0.9 1.295.04 Leilehua Avenue 1,271 9 12 0.7 0.995.07 Schofield: McCarthy Field 2,560 5 14 0.2 0.596.03 Maili 10,289 37 248 0.4 2.496.08 Lualualei Transmitter 5,682 5 75 0.1 1.397.01 Waianae Kai 6,635 4 101 0.1 1.597.03 Lualualei‐Camp Waianae 6,227 8 129 0.1 2.197.04 Lualualei: Halona Road 3,066 20 65 0.7 2.198.01 Makua Valley 2,834 12 47 0.4 1.798.02 Makaha 6,386 15 130 0.2 2.099.02 Haleiwa 3,740 10 107 0.3 2.999.04 Kaena Point 5,986 11 69 0.2 1.2100 Kawailoa 3,320 10 28 0.3 0.8101 Waimea‐Kahuku 7,881 29 108 0.4 1.4102.01 Hauula‐Kaaawa 5,882 14 115 0.2 2.0102.02 Laie 7,643 110 205 1.4 2.7103.03 Kahaluu‐Waikane 4,766 25 109 0.5 2.3
Continued on next page.
12

Table 7.‐‐ POPULATION BY KOREAN RACE ALONE AND RACE ALONE OR IN COMBINATION BY ISLAND AND CENSUS TRACT, STATE OF HAWAII: 2010 ‐‐ Con.
Island and 2010 census tract Name
Total population Korean alone
Korean alone or in
combination % of Korean
alone
% of Korean alone or in combination
Oahu (con.):103.05 Ahuimanu 5,063 27 167 0.5 3.3103.06 Haiku 6,369 59 256 0.9 4.0103.08 Kapunahala 3,319 33 121 1.0 3.6105.03 Kaneohe District Park 1,980 10 57 0.5 2.9105.04 Waikalua Road 5,115 33 184 0.6 3.6105.05 Heeia Kea 3,531 34 125 1.0 3.5105.07 Kahuhipa Street 5,421 47 185 0.9 3.4105.08 Lilipuna Road 2,569 30 86 1.2 3.3106.01 Puohala 3,422 25 131 0.7 3.8106.02 Castle High School‐Halekou Road 5,449 57 226 1.0 4.1107.01 Kokokahi 3,661 37 135 1.0 3.7107.02 Mokulele Drive 3,666 32 141 0.9 3.8108.01 Mokapu West 2,969 12 24 0.4 0.8108.02 Mokapu East 6,548 15 41 0.2 0.6109.01 Kalaheo Hillside 3,140 20 74 0.6 2.4109.03 Oneawa Street‐Kawainui 4,133 34 135 0.8 3.3109.04 Maluniu Avenue 3,570 22 122 0.6 3.4109.05 Ulupaina Street 2,513 15 53 0.6 2.1110 Maunawili 4,151 23 95 0.6 2.3111.03 Olomana 3,796 34 148 0.9 3.9111.04 Enchanted Lakes 4,860 42 139 0.9 2.9111.05 Kailua Town 3,205 52 95 1.6 3.0111.06 Keolu 5,924 61 196 1.0 3.3112.01 Kalaheo Avenue 4,380 25 102 0.6 2.3112.02 Lanikai 1,609 11 23 0.7 1.4113 Waimanalo 5,451 15 160 0.3 2.9114 Waipio Peninsula 5,372 24 52 0.4 1.0115 Kapolei 5,493 33 204 0.6 3.79400.01 Waimanalo Beach‐Homesteads 4,551 6 101 0.1 2.29400.02 Nanakuli 7,400 6 87 0.1 1.29800 Hanauma Bay 5 ‐ ‐ (X) (X)9802 Honolulu International Airport 704 11 22 1.6 3.19803 Campbell Industrial Park ‐ ‐ ‐ (X) (X)9806 Schofield Forest Reserve ‐ ‐ ‐ (X) (X)9807 Schofield Barracks East Range ‐ ‐ ‐ (X) (X)9808 Hoomaluhia Botanical Garden 1 ‐ ‐ (X) (X)9810 Kawainui Marsh 13 ‐ ‐ (X) (X)9811 Bellows Air Force Base 19 ‐ ‐ (X) (X)9813 Mapunapuna Industrial 8 ‐ ‐ (X) (X)9814 Nimitz‐Airport Commercial 97 1 1 1.0 1.0
Northwestern Hawaiian Islands ‐ ‐ ‐ (X) (X)9812 Northwestern Hawaiian Islands ‐ ‐ ‐ (X) (X)
Hawaii 185,079 1,005 3,511 0.5 1.9201 Pauka‘a‐Wailea 5,213 22 109 0.4 2.1202.02 Hilo: Upper Waiakea Forest Reserve 2,568 21 61 0.8 2.4203 Hilo: Pu‘u‘eo‐Downtown 3,934 34 98 0.9 2.5204 Hilo: Villa Franca‐Kaiko'o 5,924 78 206 1.3 3.5
Continued on next page.
13

Table 7.‐‐ POPULATION BY KOREAN RACE ALONE AND RACE ALONE OR IN COMBINATION BY ISLAND AND CENSUS TRACT, STATE OF HAWAII: 2010 ‐‐ Con.
Island and 2010 census tract Name
Total population Korean alone
Korean alone or in
combination % of Korean
alone
% of Korean alone or in combination
Hawaii (con.):205 Hilo: University‐Houselots 3,294 26 95 0.8 2.9206 Hilo: Keaukaha‐Pana‘ewa 5,391 29 134 0.5 2.5207.01 Hilo: Puainako 4,507 60 152 1.3 3.4207.02 Hilo: Kawailani 4,861 45 179 0.9 3.7208.01 Hilo: Kahuku‐Kaumana 4,310 36 151 0.8 3.5208.02 Hilo: Piihonua‐Kaumana 6,196 66 195 1.1 3.1209 Hilo: Haihai 4,729 44 131 0.9 2.8210.03 Orchidland‐Ainaloa 6,391 22 98 0.3 1.5210.05 Hawaiian Paradise Park 11,012 36 208 0.3 1.9210.10 Upper Puna (Puna Mauka) 7,884 15 120 0.2 1.5210.11 Volcano‐Mt. View 4,009 14 54 0.3 1.3210.13 Kea‘au 4,970 10 88 0.2 1.8211.01 Kalapana‐Kapoho 3,531 6 29 0.2 0.8211.06 Pahoa 7,529 5 68 0.1 0.9212.02 Ka‘u 8,451 10 77 0.1 0.9213 South Kona 5,972 20 121 0.3 2.0214.02 Konawaena 4,025 7 52 0.2 1.3215.02 Hualalai 4,844 8 51 0.2 1.1215.04 Kealakehe 3,965 1 61 0.0 1.5215.07 Kalaoa 8,503 40 174 0.5 2.0215.09 Kaumalumalu‐Keahou 5,154 7 55 0.1 1.1216.01 Kailua 7,822 182 222 2.3 2.8216.04 Holualoa 7,587 47 97 0.6 1.3217.02 Waimea‐Pu‘u Anahulu 9,540 59 186 0.6 1.9217.04 Kawaihae‐Waikoloa 8,087 34 76 0.4 0.9218 North Kohala 6,322 9 82 0.1 1.3219.02 Honoka‘a‐Kukuihaele 3,925 4 35 0.1 0.9220 Pa‘auhau‐Pa‘auilo 2,588 2 34 0.1 1.3221.02 North Hilo 2,041 6 12 0.3 0.6
Maui 144,444 856 2,580 0.6 1.8301 Hana 2,291 ‐ 63 (X) 2.7302.01 Huelo 2,453 3 19 0.1 0.8302.02 Ha'iku 7,635 21 95 0.3 1.2303.01 Kula 8,013 36 119 0.4 1.5303.03 Wailea 3,567 19 40 0.5 1.1304.02 Pukalani 8,652 38 194 0.4 2.2304.03 Makawao 3,269 8 38 0.2 1.2304.04 Hali'imaile 5,609 16 99 0.3 1.8305.01 Pa'ia 2,689 14 22 0.5 0.8307.05 Kihei Mauka 3,791 7 57 0.2 1.5307.06 Kealia 2,448 5 31 0.2 1.3307.07 Waipuilani 8,009 29 90 0.4 1.1307.08 Halama 2,909 13 35 0.4 1.2307.09 Kamaole 3,727 8 26 0.2 0.7307.10 Keawakapu 2,441 13 24 0.5 1.0308 Waihee‐Waikapu 6,907 55 198 0.8 2.9309.01 West Central Wailuku 2,617 22 66 0.8 2.5309.02 East Central Wailuku 3,205 59 115 1.8 3.6309.03 North Wailuku 6,481 64 187 1.0 2.9310 South Wailuku 8,426 169 314 2.0 3.7
Continued on next page.
14

Table 7.‐‐ POPULATION BY KOREAN RACE ALONE AND RACE ALONE OR IN COMBINATION BY ISLAND AND CENSUS TRACT, STATE OF HAWAII: 2010 ‐‐ Con.
Island and 2010 census tract Name
Total population Korean alone
Korean alone or in
combination % of Korean
alone
% of Korean alone or in combination
Maui (con.):311.01 West Kahului 8,167 80 194 1.0 2.4311.02 Central Kahului 5,426 24 73 0.4 1.3311.03 Southeast Kahului 7,580 33 118 0.4 1.6314.02 Kahoma 3,003 5 46 0.2 1.5314.04 Lahaina 3,250 31 49 1.0 1.5314.05 Lahainaluna 5,491 10 51 0.2 0.9315.01 Kapalua 2,368 11 37 0.5 1.6315.02 Honokahua 5,036 31 59 0.6 1.2315.03 Honokowai 2,366 9 20 0.4 0.8319 Spreckelsville 5,624 19 93 0.3 1.7320 Launiupoko 994 4 8 0.4 0.8
Lanai 3,135 11 90 0.4 2.9316.01 Lana'i 3,135 11 90 0.4 2.9
Molokai 7,345 5 118 0.1 1.6317 East Moloka'i 4,503 4 57 0.1 1.3318.01 West Moloka'i 2,752 1 61 0.0 2.2319 Kalawao 90 ‐ ‐ (X) (X)
Kahoolawe ‐ ‐ ‐ (X) (X)9800 Kaho'olawe ‐ ‐ ‐ (X) (X)
Kauai 66,921 147 711 0.2 1.1401.03 Princeville‐Kilauea 6,484 6 35 0.1 0.5401.04 Ha'ena‐Hanalei 1,344 1 6 0.1 0.4402.04 Wailua Houselots 5,047 11 70 0.2 1.4402.05 Wailua Homesteads 3,845 12 45 0.3 1.2403 Kapa'a 8,385 22 78 0.3 0.9404 Puhi‐Hanama'ulu 8,740 27 90 0.3 1.0405 Lihu'e 5,943 16 66 0.3 1.1406.03 Koloa‐Po'ipu 2,544 6 16 0.2 0.6406.04 Omao‐Kukui'ula 3,139 5 18 0.2 0.6407 Eleele‐Kalaheo 8,403 25 116 0.3 1.4408 Kaumakani‐Hanapepe 3,771 4 56 0.1 1.5409 Kekaha‐Waimea 5,561 9 83 0.2 1.59400 Anahola 3,715 3 32 0.1 0.9
Niihau and Kaula 170 ‐ ‐ (X) (X)412 Ni'ihau‐Kaula 170 ‐ ‐ (X) (X)
‐ Represents zero or rounds to 0.0. (X) Percentage changes involving negative numbers or zero are meaningless. Source: U.S. Census Bureau, 2010 Census Summary File 1, Tables QT‐P8 and QT‐P9; calculations by the Hawaii State Department of
Business, Economic Development & Tourism, Hawaii State Data Center.
15

CT 11424
0.4%
CT 7420
0.5%
CT 57864%
CT 97.0380.1%
CT 96.085
0.1%
CT 95.075
0.2%
CT 98.01120.4%
CT 99.0411
0.2%
CT 10010
0.3%
CT 89.2896
2.5%
CT 89.3060
2.3%
CT 89.2985
1.8%
CT 89.24104
1.4%
CT 86.136
0.7%
CT 9400.026
0.1%
CT 86.14114
1.4%
CT 86.111
1.2%
CT 86.2237
0.9%
CT 85.0211
0.5%
CT 3.0274
2.5%
CT 12.02622%
CT 107.0232
0.9%
CT 71261%
CT 98130
0%
CT 112.0125
0.6%
CT 84.0528
0.6%
CT 84.11270.8%
CT 84.1253
0.8%
CT 84.0723
0.7%CT 84.08491%
CT 84.1021
0.9%
CT 84.06621%
CT 87.03430.6%
CT 5927
0.8%
CT 767
2.3%
CT 62.021
0.1%CT 61
110.3%
CT 13115
2.7%
CT 86.17117
1.2%
CT 73.031
0.3%
CT 73.0233
0.9%
CT 980211
1.6%
CT 98141
1%
CT 36.04603
23.9%
CT 36.0356120%
CT 35.02487
12.6%
CT 12.0192
3.1%
CT 63.01300.8%
CT 5137
3.6%
CT 888
2.3%
CT 103.0659
0.9%
CT 544
0.2%
CT 4852
0.8%
CT 1.06391
5.1%
CT 22.02322
9.5%
CT 19.03180
6.5%
CT 20.0462
4.4%
CT 18.0470
3.8%
CT 1.122214%
CT 89.3149
1.5%
CT 89.26151%
CT 1.1437
2.3%
CT 666
1.6%
CT 99.0210
0.3%
CT 36.01467
11.4%
CT 80.0584
1.2%
CT 89.1314
0.3%
CT 4443
0.8%
CT 112.0211
0.7%
CT 98.0215
0.2%
CT 78.05131
2.6%
CT 980000%
CT 86.0910
0.5%
CT 5574
3.6%
CT 68.0849511.2%
CT 9.0360
2.1%
CT 87.0142
0.5%
CT 64.015
0.2%
CT 7420
0.5%
CT 80.0231
1.1%
CT 522317% CT 40
543.5%
CT 109.0334
0.8%
CT 75.065
0.5%
CT 83.028
0.1%
CT 89.22169
2.3%
CT 95.0332
0.9%
CT 95.0212
0.3%
CT 21112
2.9%
CT 111.06611%
CT 107.01371%
CT 78.09842.5%
CT 105.0433
0.6%
CT 5077
1.9%
CT 92112
1.4%
CT 89.1567
1.3%
CT 89.2382
1.7%
CT 89.14110.2%
CT 89.0779
1.9%
CT 89.0898
1.7%
CT 86.1015
1.4%
CT 86.06123
1.3%
CT 67.01106
1.8%
CT 7026
0.6%
CT 68.05560
9.1%
CT 27.02211
4.2%
CT 25209
5.3%
CT 68.0249
0.7%
CT 97.014
0.1%
CT 80.0765
1.2%
CT 1.081424.4%
CT 632
2.6%
CT 3.0196
2.9%
CT 4.0140
1.4%
CT 9.0292
2.3%
CT 1.0795
3.4%
CT 64.02230.4%
CT 83.01160.3%
CT 77.01501.2%
CT 62.0130
0.5%
CT 105.0310
0.5%
CT 9.01132
4.8%
CT 16110
2.9%
CT 28762.1%
CT 1486
3.4%
CT 24.02197
6.1%
CT 29147
6.1%
CT 84.0228
0.3%
CT 26221
5.2%
CT 89.20109
2.5%
CT 45117
2.3%
CT 9080.5%
CT 3230
3.6%
CT 105.0534
1%
CT 89.1212
0.5%
CT 51356
11.5%
CT 11391%
CT 34.0746
5%
CT 33292.6%
CT 31.0151
1.4%
CT 109.0422
0.6%
CT 109.0515
0.6%
CT 80.0672
1.5%
CT 19.0119
2.3%
CT 89.181102%
CT 5852
1.5%
CT 6010
0.2%
CT 96.0337
0.4%CT 106.01
250.7%
CT 78.0431
1.6%
CT 68.09368
7.3%
CT 111.0334
0.9%CT 87.0293
1.7%
CT 4955
1.7%
CT 5336310%
CT 67.02116
5.8%
CT 80.0126
1.3%
CT 111.0442
0.9%
CT 4654
1.4%
CT 102.0114
0.2%
CT 293
1.6%
CT 89.2110
0.4%
CT 9400.016
0.1%
CT 75.029
0.7%
CT 4778
1.7%
CT 68.0660
3.5%
CT 78.101202.2%
CT 34.0450710.8%
CT 106.02571%
CT 232975.4%
CT 89.1787
1.9%
CT 941022%
CT 63.0230.1%
CT 4.02208
5.2%
CT 56192
2.8%
CT 75.04311%
CT 95.049
0.7%
CT 6910
0.3%
CT 86.12581%
CT 1.11115
2.3%
CT 11533
0.6%
CT 11424
0.4%
CT 78.11135
2.7%
CT 89.09782%
CT 78.0862
1.9%
CT 9364
1.3%
CT 1741
1.7%
CT 89.0688
2.3%
CT 6531
0.7%
CT 1033
1.1%
CT 3757510.3%
CT 103.0527
0.5%
CT 42186
5.4%CT 57
864%
CT 75.0376
1.5%
CT 43101
1.8%
CT 98100
0%
CT 89.27137
2.6%
CT 89.2564
0.9%
CT 35.01270
11.8%
CT 22.012216%
CT 20.031245%
CT 11315
0.3%
CT 109.0120
0.6%
CT 1599
2.8%
CT 8840
0.5%
CT 34.03455
8.2%
CT 75.05119
2.2%
CT 30113
2.6%
CT 9116
0.3%
CT 38531
13.4%
CT 80.0386
1.8%
CT 41267
5.9%
CT 78.07364
6.7%
CT 1.1098
2.3%
CT 102.02110
1.4%
CT 103.0325
0.5%
CT 77.0297
1.9%
CT 98110
0%
CT 108.0215
0.2%
CT 108.0112
0.4%
CT 105.0747
0.9%
CT 105.0830
1.2%
CT 98080
0%
CT 103.08331%
CT 11023
0.6%
CT 10129
0.4%
CT 97.0420
0.7%
CT 31.0282
2.5%
CT 95.0124
0.5%
CT 68.0414
0.5%
CT 27.01111
2.2%
CT 3925
3.8%
CT 111.0552
1.6%
[0 5 102.5
Miles
This map was produced by the Office ofPlanning (OP) for planning purposes.It should not be used for boundary inter-pretations or other spatial analysis beyond the limitations of the data. Informationregarding compilation dates and accuracy ofthe data presented can be obtained from OP.Map No.: 20110810-08-DKMap Date: 08/10/11Sources:U.S. Census Bureau, 2010.READ, DBEDT, 2011.
KoreanPopulation
0 - 5051 - 100101 - 200201 - 603No Population
State Korean race alone population: 24,203 (1.8%)
C&C of Honolulu Korean race alone population: 22,179 (2.3%)
Island of OahuKorean Population by Census Tracts: 2010
(Race Alone)

CT 57302
14.1%
CT 12.02622%
CT 5927
0.8%
CT 767
2.3%
CT 62.021
0.1%
CT 6111
0.3%
CT 13115
2.7%
CT 980211
1.6%
CT 98141
1% CT 36.04603
23.9%
CT 36.0356120%
CT 35.02487
12.6%
CT 12.0192
3.1%
CT 63.0130
0.8%
CT 5137
3.6%
CT 888
2.3%CT 54
40.2%
CT 4852
0.8%
CT 20.0585
3.6%
CT 22.02322
9.5%
CT 19.04179
4.6%
CT 19.03180
6.5%CT 20.06
753.2% CT 20.04
624.4%
CT 18.0470
3.8%
CT 666
1.6%
CT 36.01467
11.4%
CT 4443
0.8%
CT 5574
3.6%
CT 24.011414.6%
CT 9.0360
2.1%
CT 64.015
0.2%
CT 522317% CT 40
543.5%
CT 211122.9%
CT 5077
1.9%
CT 67.01106
1.8%
CT 27.02211
4.2%
CT 25209
5.3%
CT 632
2.6%
CT 4.0140
1.4%
CT 9.0292
2.3%
CT 64.02230.4%
CT 62.0130
0.5%
CT 9.01132
4.8%
CT 18.0143
2.5%
CT 16110
2.9%
CT 2876
2.1%
CT 1486
3.4%CT 24.02
1976.1%
CT 29147
6.1%
CT 26221
5.2%
CT 45117
2.3%
CT 3230
3.6%
CT 51356
11.5%
CT 11391%
CT 34.07465%
CT 3329
2.6%
CT 31.0151
1.4%
CT 19.0119
2.3%
CT 5852
1.5%
CT 6010
0.2%
CT 4955
1.7%
CT 5336310%
CT 4654
1.4%
CT 4778
1.7%
CT 34.04507
10.8%
CT 23297
5.4%
CT 63.023
0.1%
CT 4.02208
5.2%
CT 56192
2.8%
CT 34.05310
9.5%
CT 34.06512
8.9%
CT 1741
1.7%
CT 6531
0.7% CT 1033
1.1%
CT 37575
10.3%
CT 42186
5.4%
CT 57864%
CT 43101
1.8%
CT 35.01270
11.8%CT 22.01
2216%
CT 20.031245%
CT 18.03118
3.5%
CT 1599
2.8%
CT 34.03455
8.2%
CT 30113
2.6%
CT 38531
13.4%
CT 41267
5.9%
CT 31.0282
2.5%
CT 27.01111
2.2%
CT 3925
3.8%
[0 1 20.5
Miles
This map was produced by the Office ofPlanning (OP) for planning purposes.It should not be used for boundary inter-pretations or other spatial analysis beyond the limitations of the data. Informationregarding compilation dates and accuracy ofthe data presented can be obtained from OP.Map No.: 20120213-05-DKMap Date: 02/13/12Sources:U.S. Census Bureau, 2010.READ, DBEDT, 2011.
KoreanPopulation
0 - 5051 - 100101 - 200201 - 603No Population
HonoluluKorean Population by Census Tracts: 2010
(Race Alone)
Note: For each tract, the numbers shown are 1) the census tract number, 2) the number of peoplein the population group, and 3) the % of the census tract consisting of that population group.
Map Area
Oahu
State Korean race alone population: 24,203 (1.8%)
C&C of Honolulu Korean race alone population: 22,179 (2.3%)

CT 215.041
0%
CT 211.016
0.2%
CT 217.0434
0.4%
CT 215.0740
0.5%
CT 216.0447
0.6%
CT 215.097
0.1%
CT 219.024
0.1%
CT 214.0270.2%
CT 211.065
0.1%
CT 210.0322
0.3%
CT 210.0536
0.3%
CT 210.1310
0.2%
CT 210.1015
0.2%
CT 212.0210
0.1%
CT 221.0260.3%
CT 210.1114
0.3%
CT 202.0221
0.8%
CT 216.01182
2.3%
CT 21320
0.3%
CT 217.0259
0.6%
CT 201220.4%CT 220
20.1%
CT 215.028
0.2%
CT 2189
0.1%
CT 20944
0.9%
CT 208.0266
1.1%CT 207.02
450.9%
CT 207.0160
1.3%
CT 20578
1.3%CT 20426
0.8%
CT 203340.9%
CT 208.0136
0.8%
CT 20629
0.5%
[0 10 205
MilesThis map was produced by the Office ofPlanning (OP) for planning purposes.It should not be used for boundary inter-pretations or other spatial analysis beyond the limitations of the data. Informationregarding compilation dates and accuracy ofthe data presented can be obtained from OP.Map No.: 20110810-04-DKMap Date: 08/10/11Sources:U.S. Census Bureau, 2010.READ, DBEDT, 2011.
KoreanPopulation
0 - 5051 - 100101 - 200201 - 603No Population
State Korean race alone population: 24,203 (1.8%)
Hawaii County Korean race alone population: 1,005 (0.5%)
Island of HawaiiKorean Population by Census Tracts: 2010
(Race Alone)

CT 314.0510
0.2%
CT 315.039
0.4%
CT 315.0111
0.5%
CT 98000
0%
CT 307.0729
0.4%
CT 307.065
0.2%
CT 315.0231
0.6%
CT 314.04311%
CT 307.098
0.2%
CT 3204
0.4%
CT 307.057
0.2%
CT 304.038
0.2%
CT 31919
0.3%
CT 307.1013
0.5%
CT 303.0319
0.5%
CT 307.0813
0.4%
CT 304.0416
0.3%CT 302.01
30.1%
CT 302.0221
0.3%CT 305.0114
0.5%
CT 309.0122
0.8% CT 311.0224
0.4%CT 311.01
801%
CT 3010
0%
CT 311.03330.4%
CT 309.03641% CT 309.02
591.8%
CT 3101692%
CT 30855
0.8%
CT 304.0238
0.4%
CT 314.025
0.2%
CT 303.0136
0.4%[
0 5 102.5
Miles
This map was produced by the Office ofPlanning (OP) for planning purposes.It should not be used for boundary inter-pretations or other spatial analysis beyond the limitations of the data. Informationregarding compilation dates and accuracy ofthe data presented can be obtained from OP.Map No.: 20110810-06-DKMap Date: 08/10/11Sources:U.S. Census Bureau, 2010.READ, DBEDT, 2011.
KoreanPopulation
0 - 5051 - 100101 - 200201 - 603No Population
State Korean race alone population: 24,203 (1.8%)
Maui County Korean race alone population: 872 (0.6%)
Island of MauiKorean Population by Census Tracts: 2010
(Race Alone)

CT 3190
0%
CT 314.0510
0.2%
CT 316.0111
0.4%
CT 315.039
0.4%
CT 315.0111
0.5%
CT 318.011
0%
CT 315.0231
0.6%
CT 3174
0.1%
CT 314.025
0.2%
[0 5 102.5
Miles
This map was produced by the Office ofPlanning (OP) for planning purposes.It should not be used for boundary inter-pretations or other spatial analysis beyond the limitations of the data. Informationregarding compilation dates and accuracy ofthe data presented can be obtained from OP.Map No.: 20110810-07-DKMap Date: 08/10/11Sources:U.S. Census Bureau, 2010.READ, DBEDT, 2011.
KoreanPopulation
0 - 5051 - 100101 - 200201 - 603No Population
State Korean race alone population: 24,203 (1.8%)
Maui County Korean race alone population: 872 (0.6%)
Islands of Molokai and LanaiKorean Population by Census Tracts: 2010
(Race Alone)

CT 4120
0%
CT 401.0360.1%
CT 406.036
0.2%
CT 406.045
0.2%
CT 402.0512
0.3%
CT 402.0411
0.2%
CT 401.041
0.1%
CT 40427
0.3%CT 405
160.3%
CT 4099
0.2% CT 4084
0.1%
CT 40322
0.3%
CT 40725
0.3%
CT 94003
0.1%
[0 5 102.5
MilesThis map was produced by the Office ofPlanning (OP) for planning purposes.It should not be used for boundary inter-pretations or other spatial analysis beyond the limitations of the data. Informationregarding compilation dates and accuracy ofthe data presented can be obtained from OP.Map No.: 20110810-05-DKMap Date: 08/10/11Sources:U.S. Census Bureau, 2010.READ, DBEDT, 2011.
KoreanPopulation
0 - 5051 - 100101 - 200201 - 603No Population
State Korean race alone population: 24,203 (1.8%)
Kauai County Korean race alone population: 147 (0.2%)
Islands of Kauai and NiihauKorean Population by Census Tracts: 2010
(Race Alone)
CT 114521%
CT 7430
0.8%
CT 57117
5.4%
CT 97.031292.1%
CT 96.0875
1.3%
CT 95.0714
0.5%
CT 98.01471.7%
CT 99.0469
1.2%
CT 10028
0.8%
CT 89.28314
8.1%
CT 89.30176
6.9%
CT 89.29233
4.8%
CT 89.24251
3.3%
CT 86.13182%
CT 9400.0287
1.2%
CT 86.14318
3.9%
CT 86.113
3.6%
CT 86.22153
3.8%
CT 85.0259
2.8%
CT 3.02162
5.4%
CT 12.02118
3.9%
CT 107.02141
3.8%
CT 7151
1.9%
CT 98130
0%
CT 112.01102
2.3%
CT 84.05117
2.5%
CT 84.111002.9%
CT 84.12205
3.1%
CT 84.0773
2.2%CT 84.08132
2.8%
CT 84.1077
3.3%
CT 84.06230
3.8%
CT 87.03114
1.7%
CT 5942
1.3%
CT 71776%
CT 62.023
0.2%CT 61
190.5%
CT 13246
5.8%
CT 86.172853%
CT 73.038
2.3%
CT 73.0257
1.5%
CT 980222
3.1%
CT 98141
1%
CT 36.04646
25.6%
CT 36.03607
21.6%
CT 12.01157
5.4%
CT 63.01651.7%
CT 5209
5.5%
CT 8216
5.7%
CT 103.062564%
CT 549
0.5%
CT 48168
2.5%
CT 1.06590
7.7%
CT 19.04224
5.7%
CT 19.03213
7.7%
CT 20.0469
4.9% CT 18.0484
4.5%
CT 1.12398
7.2%
CT 89.311835.5%
CT 89.2660
3.8%
CT 1.14805%
CT 666
1.6%
CT 99.02107
2.9%
CT 36.01570
13.9%
CT 80.053415%
CT 89.1350
1.2%
CT 44139
2.7%
CT 112.0223
1.4%
CT 98.021302%
CT 78.05275
5.4%
CT 980000%
CT 86.0943
2.1%
CT 5581
3.9%
CT 24.012046.6%
CT 68.0861814%
CT 9.03165
5.8%
CT 87.011441.6%
CT 64.0123
1.1%
CT 7430
0.8%
CT 80.0289
3.1%
CT 52244
7.4%CT 40
694.4%
CT 109.03135
3.3%
CT 75.0615
1.6%
CT 83.02108
1.6%
CT 89.22379
5.1%
CT 95.0342
1.2%
CT 95.0230
0.7%
CT 211894.9%
CT 111.06196
3.3%
CT 107.01135
3.7%CT 78.092236.6%
CT 105.04184
3.6%
CT 50156
3.9%
CT 92465
5.8%
CT 89.15171
3.3%
CT 89.232355%
CT 89.14631.2%
CT 89.07207
4.9%
CT 89.082895%
CT 86.1023
2.2%
CT 86.06352
3.6%
CT 67.01262
4.5%
CT 7062
1.5%
CT 68.05746
12.1%
CT 27.02297
5.9%
CT 25264
6.7%
CT 68.02107
1.6%
CT 97.01101
1.5%
CT 80.07197
3.7%
CT 1.082377.3%
CT 658
4.8%
CT 3.01157
4.7%
CT 4.01132
4.6%
CT 9.02151
3.7%
CT 1.07188
6.7%
CT 64.02771.2%
CT 83.01110
2.4%
CT 77.011182.8%
CT 62.0176
1.3%
CT 105.0357
2.9%
CT 9.01177
6.5%
CT 18.0155
3.2%
CT 161915%
CT 281784.8%
CT 14139
5.5%
CT 24.022899%
CT 29184
7.6%
CT 84.02155
1.9%
CT 263307.8%
CT 89.202566%
CT 45278
5.4%
CT 9029
1.8%
CT 3234
4.1%
CT 105.05125
3.5%
CT 89.1234
1.3%
CT 51399
12.9%
CT 11100
2.6%
CT 34.07556%
CT 33645.7%
CT 31.01103
2.8%
CT 109.04122
3.4%
CT 109.0553
2.1%
CT 80.061964%
CT 19.0127
3.2%
CT 89.18301
5.5%
CT 5889
2.6%
CT 6031
0.6%
CT 96.03248
2.4% CT 106.01131
3.8%
CT 78.0467
3.5%
CT 68.09512
10.2%
CT 111.03148
3.9%CT 87.021422.5%
CT 49119
3.7%
CT 53414
11.4%
CT 67.021608%
CT 80.0172
3.6%
CT 111.04139
2.9%
CT 46154
4.1%
CT 102.011152%
CT 2265
4.6%
CT 89.2144
1.6%
CT 9400.01101
2.2%
CT 75.0210
0.7%
CT 47211
4.6%
CT 68.0697
5.7%
CT 78.102925.4%
CT 106.02226
4.1%
CT 23401
7.3%
CT 89.17245
5.4%
CT 942084%
CT 63.02130.5%
CT 4.02323
8.1%
CT 56247
3.7%
CT 75.0487
2.7%
CT 95.0412
0.9%
CT 6944
1.2%
CT 86.12201
3.3%
CT 1.11308
6.1%
CT 115204
3.7%
CT 114521%
CT 78.11264
5.3%
CT 89.09206
5.4%
CT 34.05372
11.4%
CT 78.08114
3.4%
CT 93151
3.2%
CT 1767
2.7%
CT 89.06209
5.5%
CT 6598
2.2%
CT 10140
4.5%
CT 37693
12.4%
CT 103.05167
3.3%
CT 42253
7.4%CT 57
1175.4%
CT 75.03202
3.9%
CT 432214%
CT 98100
0%
CT 89.27371
7.2%
CT 89.25172
2.5%
CT 35.01337
14.8%
CT 22.013258.8%
CT 113160
2.9%
CT 109.0174
2.4%
CT 15189
5.4%
CT 8898
1.2%
CT 34.03563
10.2%
CT 75.05222
4.2%
CT 302145%
CT 9183
1.6%
CT 38628
15.8%
CT 80.03170
3.6%
CT 41366
8.1%
CT 78.07492
9.1%
CT 1.10241
5.6%
CT 102.02205
2.7%
CT 103.03109
2.3%
CT 77.022545%
CT 98110
0%
CT 108.0241
0.6%
CT 108.0124
0.8%
CT 105.07185
3.4%
CT 105.0886
3.3%
CT 98080
0%
CT 103.08121
3.6%
CT 11095
2.3%
CT 101108
1.4%
CT 97.0465
2.1%
CT 31.021965.9%
CT 95.0163
1.3%
CT 68.0434
1.2%
CT 27.012044%
CT 3934
5.2%
CT 111.05953%
[0 5 102.5
Miles
This map was produced by the Office ofPlanning (OP) for planning purposes.It should not be used for boundary inter-pretations or other spatial analysis beyond the limitations of the data. Informationregarding compilation dates and accuracy ofthe data presented can be obtained from OP.Map No.: 20110810-13-DKMap Date: 08/10/11Sources:U.S. Census Bureau, 2010.READ, DBEDT, 2011.
KoreanPopulation
0 - 100101 - 200201 - 400401 - 746No Population
State Korean race alone orin combination population:
48,699 (3.6%)C&C of Honolulu Korean race alone
or in combination population: 41,689 (4.4%)
Island of OahuKorean Population by Census Tracts: 2010
(Race Alone or in Combination)

CT 57302
14.1%
CT 12.02118
3.9%
CT 5942
1.3%
CT 71776%
CT 62.023
0.2%
CT 6119
0.5%CT 13246
5.8%
CT 980222
3.1%
CT 98141
1% CT 36.04646
25.6%
CT 36.03607
21.6%
CT 35.02575
14.8%
CT 12.01157
5.4%
CT 63.0165
1.7%
CT 5209
5.5%
CT 8216
5.7%CT 54
90.5%
CT 48168
2.5%
CT 20.05102
4.3%
CT 22.02411
12.1%
CT 19.04224
5.7%
CT 19.03213
7.7%CT 20.06
984.1% CT 20.04
694.9%
CT 18.0484
4.5%
CT 666
1.6%
CT 36.01570
13.9%
CT 44139
2.7%
CT 5581
3.9%
CT 24.012046.6%
CT 9.03165
5.8%
CT 64.0123
1.1%
CT 52244
7.4% CT 4069
4.4%
CT 211894.9%
CT 50156
3.9%
CT 67.01262
4.5%
CT 27.02297
5.9%
CT 25264
6.7%
CT 658
4.8%
CT 4.01132
4.6%
CT 9.02151
3.7%
CT 64.02771.2%
CT 62.0176
1.3%
CT 9.01177
6.5%
CT 18.0155
3.2%
CT 161915%
CT 28178
4.8%
CT 14139
5.5%CT 24.02
2899%
CT 29184
7.6%
CT 26330
7.8%
CT 45278
5.4%
CT 3234
4.1%
CT 51399
12.9%
CT 11100
2.6%
CT 34.07556%
CT 3364
5.7%
CT 31.01103
2.8%
CT 19.0127
3.2%
CT 5889
2.6%
CT 6031
0.6%
CT 49119
3.7%
CT 53414
11.4%
CT 46154
4.1%
CT 47211
4.6%
CT 34.04647
13.7%
CT 23401
7.3%
CT 63.0213
0.5%
CT 4.02323
8.1%
CT 56247
3.7%
CT 34.05372
11.4%
CT 34.0663711%
CT 1767
2.7%
CT 6598
2.2% CT 10140
4.5%
CT 37693
12.4%
CT 42253
7.4%
CT 57117
5.4%
CT 432214%
CT 35.01337
14.8%CT 22.01
3258.8%
CT 20.03139
5.6%
CT 18.03141
4.2%
CT 15189
5.4%
CT 34.03563
10.2%
CT 302145%
CT 38628
15.8%
CT 41366
8.1%
CT 31.02196
5.9%
CT 27.012044%
CT 3934
5.2%
[0 1 20.5
Miles
This map was produced by the Office ofPlanning (OP) for planning purposes.It should not be used for boundary inter-pretations or other spatial analysis beyond the limitations of the data. Informationregarding compilation dates and accuracy ofthe data presented can be obtained from OP.Map No.: 20120213-06-DKMap Date: 02/13/12Sources:U.S. Census Bureau, 2010.READ, DBEDT, 2011.
KoreanPopulation
0 - 100101 - 200201 - 400401 - 746No Population
HonoluluKorean Population by Census Tracts: 2010
(Race Alone or in Combination)
Note: For each tract, the numbers shown are 1) the census tract number, 2) the number of peoplein the population group, and 3) the % of the census tract consisting of that population group.
Map Area
Oahu
State Korean race alone orin combination population:
48,699 (3.6%)C&C of Honolulu Korean race alone
or in combination population: 41,689 (4.4%)

CT 215.0461
1.5%
CT 211.0129
0.8%
CT 217.0476
0.9%
CT 215.071742%
CT 216.0497
1.3%
CT 215.0955
1.1%
CT 219.0235
0.9%
CT 214.0252
1.3%
CT 211.0668
0.9%
CT 210.0398
1.5%
CT 210.05208
1.9%
CT 210.1388
1.8%
CT 210.10120
1.5%
CT 212.0277
0.9%
CT 221.0212
0.6%
CT 210.1154
1.3%
CT 202.0261
2.4%
CT 216.01222
2.8%
CT 2131212%
CT 217.02186
1.9%
CT 201109
2.1%CT 22034
1.3%
CT 215.0251
1.1%
CT 21882
1.3%
CT 209131
2.8%
CT 208.02195
3.1% CT 207.02179
3.7%CT 207.011523.4%
CT 205206
3.5%CT 20495
2.9%
CT 203982.5%
CT 208.011513.5%
CT 206134
2.5%
[0 10 205
Miles
This map was produced by the Office ofPlanning (OP) for planning purposes.It should not be used for boundary inter-pretations or other spatial analysis beyond the limitations of the data. Informationregarding compilation dates and accuracy ofthe data presented can be obtained from OP.Map No.: 20110810-09-DKMap Date: 08/10/11Sources:U.S. Census Bureau, 2010.READ, DBEDT, 2011.
KoreanPopulation
0 - 100101 - 200201 - 400401 - 746No Population
State Korean race alone or in combination population: 48,699 (3.6%)
Hawaii County Korean race alone or in combination population: 3,511 (1.9%)
Island of HawaiiKorean Population by Census Tracts: 2010
(Race Alone or in Combination)

CT 314.0551
0.9%
CT 315.0320
0.8%
CT 315.0137
1.6%
CT 307.0790
1.1%
CT 307.0631
1.3%
CT 315.0259
1.2%
CT 314.0449
1.5%
CT 307.0926
0.7%
CT 3208
0.8%
CT 307.0557
1.5%
CT 304.0338
1.2%
CT 31993
1.7%
CT 307.10241%
CT 303.0340
1.1%
CT 307.0835
1.2%
CT 304.0499
1.8%CT 302.01
190.8%
CT 302.0295
1.2%CT 305.0122
0.8%
CT 309.0166
2.5% CT 311.0273
1.3%CT 311.011942.4%
CT 30163
2.7%
CT 311.03118
1.6%
CT 309.03187
2.9% CT 309.02115
3.6%
CT 310314
3.7%
CT 308198
2.9%
CT 304.02194
2.2%
CT 314.0246
1.5%
CT 303.01119
1.5%[
0 5 102.5
Miles
This map was produced by the Office ofPlanning (OP) for planning purposes.It should not be used for boundary inter-pretations or other spatial analysis beyond the limitations of the data. Informationregarding compilation dates and accuracy ofthe data presented can be obtained from OP.Map No.: 20110810-11-DKMap Date: 08/10/11Sources:U.S. Census Bureau, 2010.READ, DBEDT, 2011.
KoreanPopulation
0 - 100101 - 200201 - 400401 - 746No Population
State Korean race alone orin combination population:
48,699 (3.6%)Maui County Korean race aloneor in combination population:
2,788 (1.8%)
Island of MauiKorean Population by Census Tracts: 2010
(Race Alone or in Combination)

CT 3190
0%
CT 314.0551
0.9%
CT 316.0190
2.9%
CT 315.0320
0.8%
CT 315.0137
1.6%
CT 318.0161
2.2%
CT 315.0259
1.2%
CT 31757
1.3%
CT 314.0246
1.5%
[0 5 102.5
Miles
This map was produced by the Office ofPlanning (OP) for planning purposes.It should not be used for boundary inter-pretations or other spatial analysis beyond the limitations of the data. Informationregarding compilation dates and accuracy ofthe data presented can be obtained from OP.Map No.: 20110810-12-DKMap Date: 08/10/11Sources:U.S. Census Bureau, 2010.READ, DBEDT, 2011.
KoreanPopulation
0 - 100101 - 200201 - 400401 - 746No Population
State Korean race alone or in combination population: 48,699 (3.6%)
Maui County Korean race alone or in combination population: 2,788 (1.8%)
Islands of Molokai and LanaiKorean Population by Census Tracts: 2010
(Race Alone or in Combination)

CT 4120
0%
CT 401.0335
0.5%
CT 406.0316
0.6%CT 406.04
180.6%
CT 402.0545
1.2%
CT 402.0470
1.4%
CT 401.046
0.4%
CT 404901%
CT 40566
1.1%
CT 40983
1.5%CT 408
561.5%
CT 40378
0.9%
CT 407116
1.4%
CT 940032
0.9%
[0 5 102.5
MilesThis map was produced by the Office ofPlanning (OP) for planning purposes.It should not be used for boundary inter-pretations or other spatial analysis beyond the limitations of the data. Informationregarding compilation dates and accuracy ofthe data presented can be obtained from OP.Map No.: 20110810-10-DKMap Date: 08/10/11Sources:U.S. Census Bureau, 2010.READ, DBEDT, 2011.
KoreanPopulation
0 - 100101 - 200201 - 400401 - 746No Population
State Korean race alone or in combination population: 48,699 (3.6%)
Kauai County Korean race alone or in combination population: 711 (1.1%)
Islands of Kauai and NiihauKorean Population by Census Tracts: 2010
(Race Alone or in Combination)