Embed Size (px)
Citation preview
CT 215.04389
9.8%
CT 211.01231
6.5%
CT 217.04581
7.2%
CT 215.07397
4.7%
CT 216.04599
7.9%
CT 215.09181
3.5%
CT 219.02728
18.5%
CT 214.02346
8.6%
CT 211.066839.1%
CT 210.03800
12.5%
CT 210.051208
11.0%
CT 210.131070
21.5%
CT 210.10209
2.7%
CT 212.02962
11.4%
CT 221.02334
16.4%
CT 210.11200
5.0%
CT 202.02433
16.9%CT 216.01
7259.3%
CT 213284
4.8%
CT 217.02706
7.4%
CT 201838
16.1%CT 220399
15.4%
CT 215.02123
2.5%
CT 218772
12.2%
CT 209250
5.3%
CT 208.02398
6.4%CT 207.02
4469.2%
CT 207.01325
7.2%
CT 205304
5.1%CT 204265
8.0%
CT 203186
4.7%
CT 208.01217
5.0%
CT 206245
4.5%
[0 10 205
MilesThis map was produced by the Office ofPlanning (OP) for planning purposes.It should not be used for boundary inter-pretations or other spatial analysis beyond the limitations of the data. Informationregarding compilation dates and accuracy ofthe data presented can be obtained from OP.Map No.: 20110805-05-DKMap Date: 08/05/11Sources:U.S. Census Bureau, 2010.READ, DBEDT, 2011.
FilipinoPopulation
0 - 500501 - 15001501 - 30003000 - 5702No Population
State Filipino race alone population: 197,497 (14.5%)
Hawaii County Filipino race alone population: 15,834 (8.6%)
Island of HawaiiFilipino Population by Census Tracts: 2010
(Race Alone)
Note: For each tract, the numbers shown are 1) the census tract number, 2) the number of peoplein the population group, and 3) the % of the census tract consisting of that population group.
CT 4128
4.7%
CT 401.035478.4%
CT 406.03577
22.7%
CT 406.04344
11.0%
CT 402.05379
9.9%
CT 402.04365
7.2%
CT 401.0417
1.3%
CT 4043431
39.3%CT 405
98216.5%
CT 4091029
18.5%CT 408
118631.5%
CT 4031545
18.4%
CT 4071565
18.6%
CT 9400133
3.6%
[0 5 102.5
MilesThis map was produced by the Office ofPlanning (OP) for planning purposes.It should not be used for boundary inter-pretations or other spatial analysis beyond the limitations of the data. Informationregarding compilation dates and accuracy ofthe data presented can be obtained from OP.Map No.: 20110805-04-DKMap Date: 08/05/11Sources:U.S. Census Bureau, 2010.READ, DBEDT, 2011.
FilipinoPopulation
0 - 500501 - 15001501 - 30003000 - 5702No Population
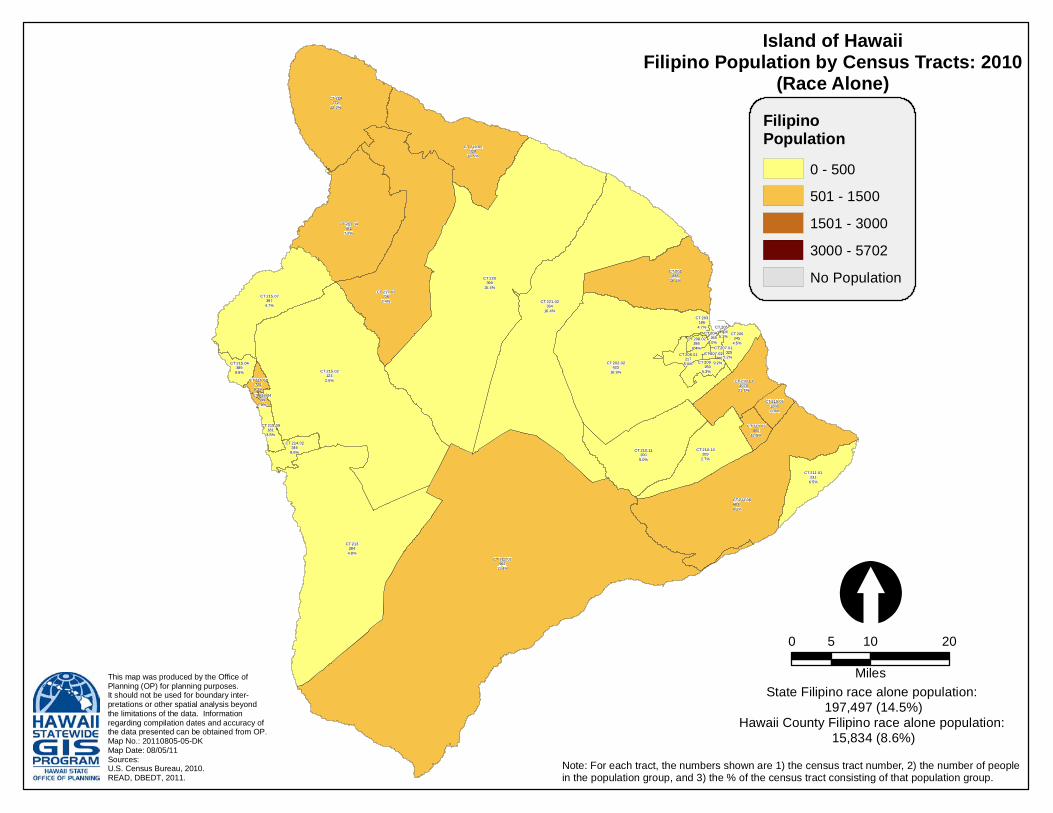
State Filipino race alone population: 197,497 (14.5%)
Kauai County Filipino race alone population: 12,108 (18.0%)
Islands of Kauai and NiihauFilipino Population by Census Tracts: 2010
(Race Alone)
Note: For each tract, the numbers shown are 1) the census tract number, 2) the number of peoplein the population group, and 3) the % of the census tract consisting of that population group.
CT 3193
3.3%
CT 316.011419
45.3%
CT 318.01218
7.9%
CT 317550
12.2%
[0 5 102.5
Miles
This map was produced by the Office ofPlanning (OP) for planning purposes.It should not be used for boundary inter-pretations or other spatial analysis beyond the limitations of the data. Informationregarding compilation dates and accuracy ofthe data presented can be obtained from OP.Map No.: 20110805-03-DKMap Date: 08/05/11Sources:U.S. Census Bureau, 2010.READ, DBEDT, 2011.
FilipinoPopulation
0 - 500501 - 15001501 - 30003000 - 5702No Population
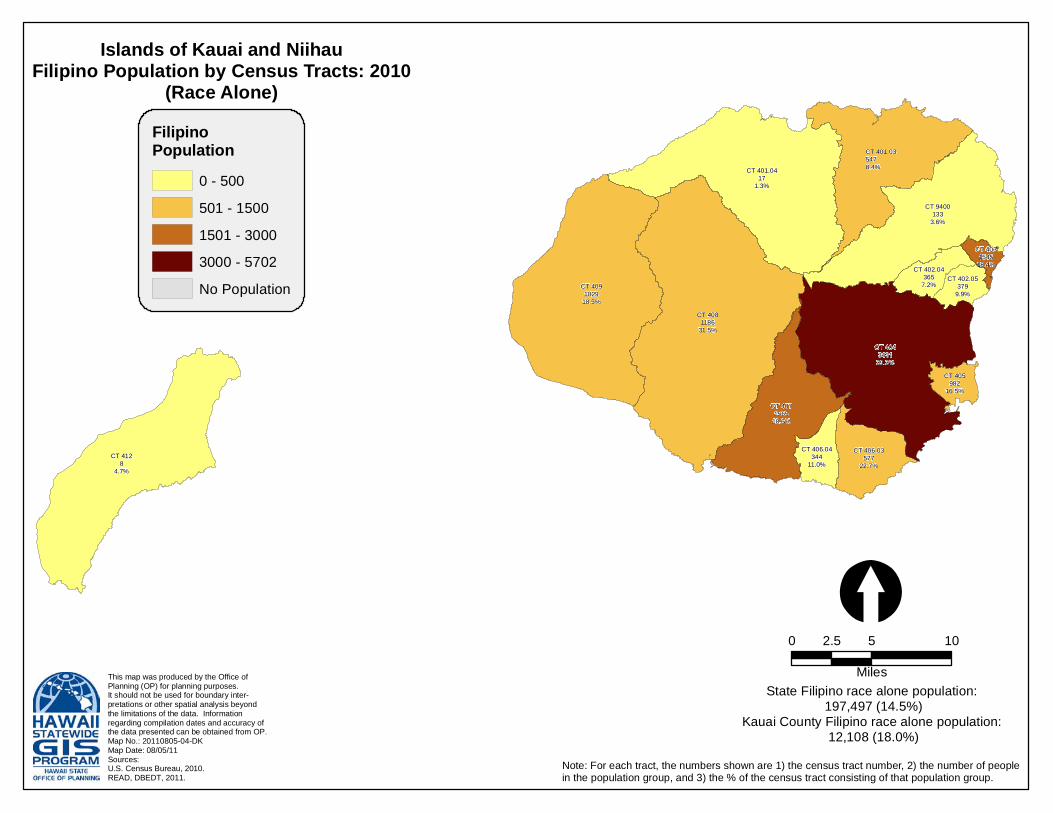
State Filipino race alone population: 197,497 (14.5%)
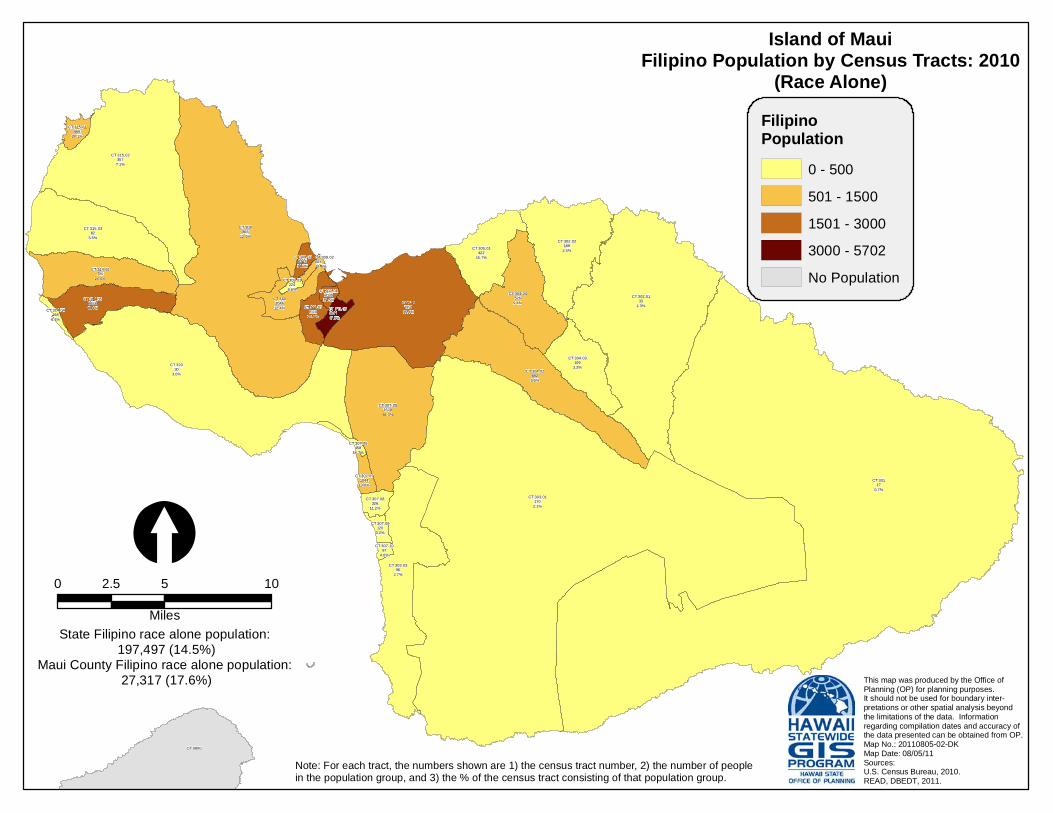
Maui County Filipino race alone population: 27,317 (17.6%)
Islands of Molokai and LanaiFilipino Population by Census Tracts: 2010
(Race Alone)
Note: For each tract, the numbers shown are 1) the census tract number, 2) the number of peoplein the population group, and 3) the % of the census tract consisting of that population group.
CT 9800
CT 314.052658
48.4%
CT 315.0382
3.5%
CT 315.01666
28.1%
CT 307.071044
13.0%
CT 307.06458
18.7%
CT 315.02357
7.1%
CT 314.04198
6.1%
CT 307.09120
3.2%
CT 32030
3.0%
CT 307.051378
36.3%
CT 304.03109
3.3%
CT 3191991
35.4%
CT 307.1097
4.0%
CT 303.0396
2.7%
CT 307.08326
11.2%
CT 304.04526
9.4%CT 302.01
331.3%
CT 302.02189
2.5%CT 305.01422
15.7%
CT 309.01224
8.6% CT 311.022035
37.5%CT 311.01
211025.8%
CT 30117
0.7%
CT 311.03363147.9%
CT 309.032215
34.2%CT 309.0262419.5%
CT 3101046
12.4%
CT 308863
12.5%
CT 304.02692
8.0%
CT 314.02720
24.0%
CT 303.01170
2.1%
[0 5 102.5
Miles
This map was produced by the Office ofPlanning (OP) for planning purposes.It should not be used for boundary inter-pretations or other spatial analysis beyond the limitations of the data. Informationregarding compilation dates and accuracy ofthe data presented can be obtained from OP.Map No.: 20110805-02-DKMap Date: 08/05/11Sources:U.S. Census Bureau, 2010.READ, DBEDT, 2011.
FilipinoPopulation
0 - 500501 - 15001501 - 30003000 - 5702No Population
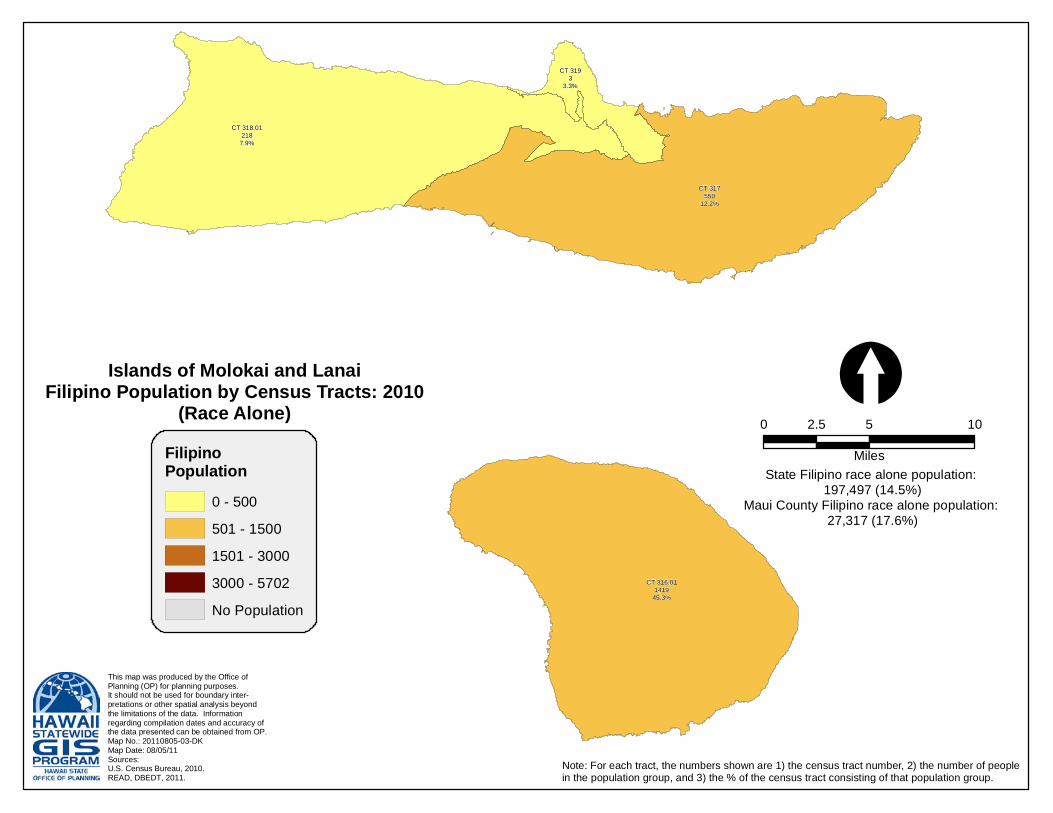
State Filipino race alone population: 197,497 (14.5%)
Maui County Filipino race alone population: 27,317 (17.6%)
Island of MauiFilipino Population by Census Tracts: 2010
(Race Alone)
Note: For each tract, the numbers shown are 1) the census tract number, 2) the number of peoplein the population group, and 3) the % of the census tract consisting of that population group.

CT 114264
4.9%
CT 74221
5.6%
CT 57390
18.2%
CT 9814
CT 9806CT 9807
CT 9803
CT 97.036189.9%
CT 96.08630
11.1%
CT 95.0725
1.0%
CT 98.0193
3.3%
CT 99.041286
21.5%
CT 100120
3.6%
CT 89.28488
12.6%
CT 89.30191
7.5%
CT 89.29596
12.3%
CT 89.243157
41.4%
CT 86.13177
19.6%
CT 9400.02198
2.7%
CT 86.141685
20.5%
CT 86.1111
13.1%
CT 86.221039
25.5%
CT 85.02115
5.4%
CT 3.0263
2.1%
CT 12.0274
2.4%
CT 107.02208
5.7%
CT 71111
4.1%
CT 98131
12.5%
CT 112.0164
1.5%
CT 84.051621
34.8%
CT 84.1194627.4%
CT 84.121662
25.4%
CT 84.07654
19.7%CT 84.08769
16.3%
CT 84.10703
30.0%
CT 84.061654
27.6%
CT 87.03172425.2%
CT 591132
33.8%
CT 771
2.4%
CT 62.0235
2.1%CT 612913
69.8%
CT 13164
3.9%
CT 86.174103
43.8%
CT 73.031
0.3%
CT 73.0293
2.4%
CT 980282
11.6%
CT 981411
11.3%
CT 36.04106
4.2%CT 12.01
822.8%
CT 63.011790
47.4%
CT 557
1.5%
CT 8161
4.3%
CT 103.06198
3.1%
CT 481686
25.1%
CT 1.06241
3.1%
CT 22.02120
3.5%
CT 19.0396
3.5%
CT 20.0456
4.0%
CT 18.0492
5.0%
CT 1.12114
2.1%
CT 89.31399
12.1%
CT 89.26815.2%
CT 1.1434
2.1%
CT 6613
3.5%
CT 99.02926
24.8%
CT 36.01260
6.3%
CT 80.05793
11.6%
CT 89.132135
51.9%
CT 44213
4.1%
CT 112.0213
0.8%
CT 98.02509
8.0%
CT 78.05752
14.6%
CT 980000.0%
CT 86.09513
24.8%
CT 55719
34.6%
CT 68.0866114.9%
CT 9.0353
1.9%
CT 87.015531
62.9%
CT 64.011363
66.2%
CT 74221
5.6%
CT 80.02604
21.3%
CT 522688.1% CT 40
1147.3%
CT 109.03156
3.8%
CT 75.0621
2.3%
CT 83.023142
46.6%
CT 89.221383
18.5%
CT 95.0326
0.8%
CT 95.0275
1.8%
CT 211704.4%
CT 111.06216
3.6%
CT 107.0184
2.3%CT 78.093159.3%
CT 105.04321
6.3%
CT 50394
9.7%
CT 921275
16.0%
CT 89.15814
15.5%
CT 89.23803
17.0%
CT 89.142513
49.3%
CT 89.07582
13.8%
CT 89.08593
10.2%
CT 86.1032
3.0%
CT 86.062189
22.6%
CT 67.01546
9.4%
CT 70210
5.2%
CT 68.05593
9.6%
CT 27.021803.6%
CT 25209
5.3%
CT 68.023508
51.3%
CT 97.01471
7.1%
CT 80.07713
13.4%
CT 1.0868
2.1%
CT 615
1.2%
CT 3.0170
2.1%
CT 4.0137
1.3%CT 9.02
872.1%
CT 1.0789
3.2%
CT 64.023397
53.2%
CT 83.01341
7.3%
CT 77.011178
27.8%
CT 62.012706
44.7%
CT 105.03209
10.6%
CT 9.0138
1.4%
CT 16123
3.3%
CT 28782.1%
CT 1467
2.6%
CT 24.02181
5.6%
CT 2969
2.9%
CT 84.023120
38.0%
CT 26239
5.6%
CT 89.20586
13.6%
CT 45132
2.6%
CT 9043
2.6%
CT 3213
1.6%
CT 105.05124
3.5%
CT 89.121689
65.7%
CT 5179
2.6%
CT 1184
2.2%
CT 3316
1.4%
CT 31.0147
1.3%
CT 109.04154
4.3%
CT 109.05120
4.8%
CT 80.06669
13.8%
CT 19.0116
1.9%
CT 89.18535
9.9%
CT 581727
50.2%
CT 604048
74.7%
CT 96.031308
12.7% CT 106.012808.2%
CT 78.0428514.9%
CT 68.09758
15.0%
CT 111.03173
4.6%CT 87.023288
58.8%
CT 49476
14.9%
CT 532186.0%
CT 67.02143
7.2%
CT 80.01516
25.7%
CT 111.04121
2.5%
CT 46171
4.6%
CT 102.01104
1.8%
CT 2122
2.1%
CT 89.211255
47.0%
CT 9400.0172
1.6%
CT 75.02132
9.6%
CT 472425.3%
CT 68.0622313.1%
CT 78.104778.8%
CT 106.02228
4.2%
CT 232544.6%
CT 89.17574
12.6%
CT 94960
18.6%
CT 63.02405
14.9%
CT 4.02105
2.6%
CT 56313646.5%
CT 75.0457718.2%
CT 95.0427
2.1%
CT 69134
3.5%
CT 86.12769
12.8%
CT 1.11174
3.5%
CT 115809
14.7%
CT 114264
4.9%
CT 78.11464
9.3%
CT 89.09441
11.6%
CT 34.05130
4.0%
CT 78.08922
27.6%
CT 931183
24.8%
CT 34.06296
5.1%
CT 1748
2.0%
CT 89.06414
11.0%
CT 651843
40.6%
CT 1093
3.0%
CT 37210
3.8%
CT 103.05193
3.8%
CT 42148
4.3%CT 57
39018.2%
CT 75.03737
14.3%
CT 434498.0%
CT 98100
0.0%
CT 89.27600
11.6%
CT 89.252663
38.6%
CT 35.011376.0%
CT 22.012206.0%
CT 20.031445.8%
CT 113806
14.8%
CT 109.0162
2.0%
CT 15133
3.8%
CT 885149
63.9%
CT 34.032143.9%
CT 75.051512
28.3%
CT 3076
1.8%
CT 912668
50.0%
CT 381874.7%
CT 80.03887
19.0%
CT 41330
7.3%
CT 78.07653
12.1%
CT 1.10107
2.5%
CT 102.02145
1.9%
CT 103.03210
4.4%
CT 77.02473
9.3%
CT 98111
5.3%
CT 108.02131
2.0%
CT 108.0143
1.4%
CT 105.072254.2%
CT 105.0893
3.6%
CT 98080
0.0%
CT 103.081805.4%
CT 110127
3.1%
CT 101756
9.6%
CT 97.04356
11.6%
CT 31.0263
1.9%
CT 95.01103
2.1%
CT 68.0470
2.5%
CT 27.012845.6%
CT 39426.4%
CT 111.0561
1.9%
[0 5 102.5
Miles
This map was produced by the Office ofPlanning (OP) for planning purposes.It should not be used for boundary inter-pretations or other spatial analysis beyond the limitations of the data. Informationregarding compilation dates and accuracy ofthe data presented can be obtained from OP.Map No.: 20110805-01-DKMap Date: 08/05/11Sources:U.S. Census Bureau, 2010.READ, DBEDT, 2011.
FilipinoPopulation
0 - 500501 - 15001501 - 30003000 - 5702No Population
State Filipino race alone population: 197,497 (14.5%)
C&C of Honolulu Filipino race alone population: 142,238 (14.9%)
Island of OahuFilipino Population by Census Tracts: 2010
(Race Alone)
Note: For each tract, the numbers shown are 1) the census tract number, 2) the number of peoplein the population group, and 3) the % of the census tract consisting of that population group.
CT 57390
18.2%
CT 9814
CT 12.0274
2.4%
CT 591132
33.8%
CT 771
2.4%
CT 62.0235
2.1%CT 612913
69.8%
CT 13164
3.9%
CT 980282
11.6%
CT 981411
11.3% CT 36.04106
4.2%
CT 36.03132
4.7%
CT 35.02136
3.5%
CT 12.0182
2.8%
CT 63.011790
47.4%
CT 557
1.5%
CT 8161
4.3%CT 54104
6.4%
CT 481686
25.1%
CT 20.05129
5.4%
CT 22.02120
3.5%
CT 19.04156
4.0%
CT 19.0396
3.5%CT 20.06
1124.7% CT 20.04
564.0%
CT 18.0492
5.0%
CT 6613
3.5%
CT 36.01260
6.3%
CT 44213
4.1%
CT 55719
34.6%
CT 24.012558.2%
CT 9.0353
1.9%
CT 64.011363
66.2%
CT 52268
8.1% CT 40114
7.3%
CT 211704.4%
CT 50394
9.7%
CT 67.01546
9.4%
CT 27.02180
3.6%
CT 25209
5.3%
CT 615
1.2%
CT 4.0137
1.3%
CT 9.0287
2.1%
CT 64.023397
53.2%
CT 62.012706
44.7%
CT 9.0138
1.4%
CT 18.01128
7.5%
CT 16123
3.3%
CT 2878
2.1%
CT 1467
2.6%CT 24.02
1815.6%
CT 2969
2.9%
CT 26239
5.6%
CT 45132
2.6%
CT 3213
1.6%
CT 5179
2.6%
CT 1184
2.2%
CT 34.07242.6%
CT 3316
1.4%
CT 31.0147
1.3%
CT 19.0116
1.9%
CT 581727
50.2%
CT 604048
74.7%
CT 49476
14.9%
CT 53218
6.0%
CT 46171
4.6%
CT 47242
5.3%
CT 34.04207
4.4%
CT 23254
4.6%
CT 63.02405
14.9%
CT 4.02105
2.6%
CT 563136
46.5%
CT 34.05130
4.0%
CT 34.06296
5.1%
CT 1748
2.0%
CT 651843
40.6% CT 1093
3.0%
CT 37210
3.8%
CT 42148
4.3%
CT 57390
18.2%
CT 43449
8.0%
CT 35.01137
6.0%CT 22.01
2206.0%
CT 20.03144
5.8%
CT 18.03213
6.3%
CT 15133
3.8%
CT 34.03214
3.9%
CT 3076
1.8%
CT 38187
4.7%
CT 41330
7.3%
CT 31.0263
1.9%
CT 27.01284
5.6%
CT 3942
6.4%
[0 1 20.5
Miles
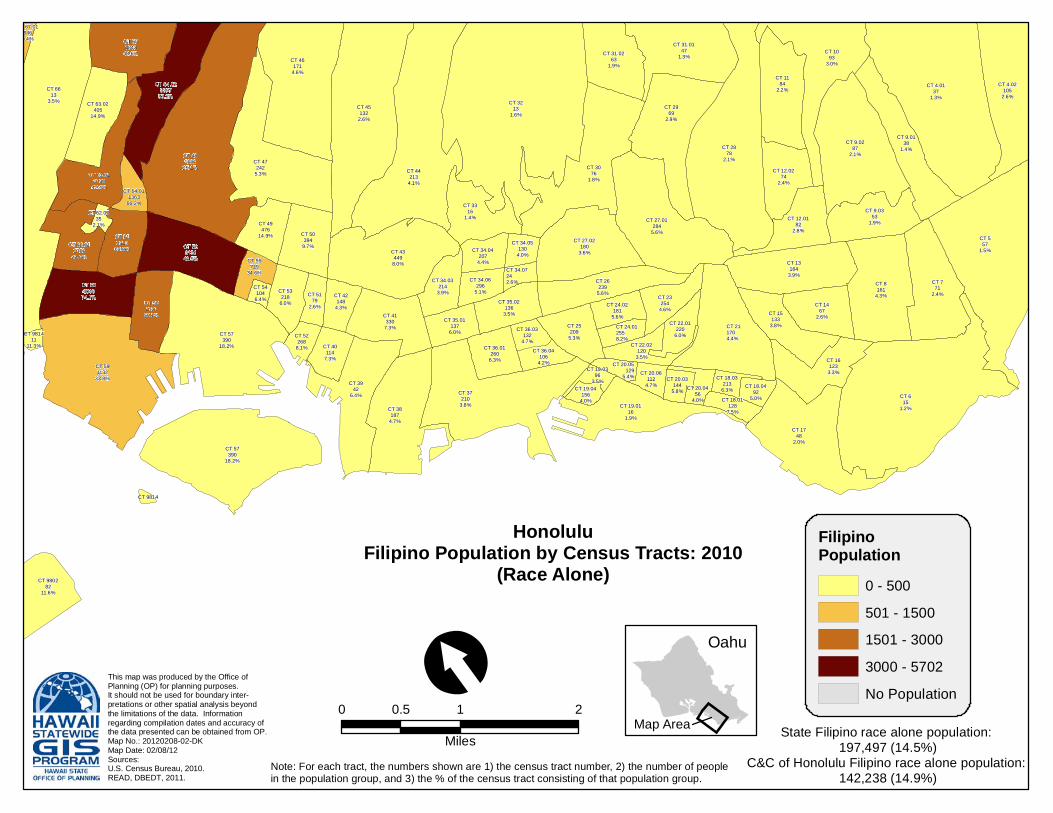
This map was produced by the Office ofPlanning (OP) for planning purposes.It should not be used for boundary inter-pretations or other spatial analysis beyond the limitations of the data. Informationregarding compilation dates and accuracy ofthe data presented can be obtained from OP.Map No.: 20120208-02-DKMap Date: 02/08/12Sources:U.S. Census Bureau, 2010.READ, DBEDT, 2011.
FilipinoPopulation
0 - 500501 - 15001501 - 30003000 - 5702No Population
HonoluluFilipino Population by Census Tracts: 2010
(Race Alone)
Note: For each tract, the numbers shown are 1) the census tract number, 2) the number of peoplein the population group, and 3) the % of the census tract consisting of that population group.
Map Area
Oahu
State Filipino race alone population: 197,497 (14.5%)
C&C of Honolulu Filipino race alone population: 142,238 (14.9%)