Embed Size (px)
Citation preview
THIS REPORT CONTAINS ASSESSMENTS OF COMMODITY AND TRADE ISSUES MADE BY
USDA STAFF AND NOT NECESSARILY STATEMENTS OF OFFICIAL U.S. GOVERNMENT
POLICY
Date:
GAIN Report Number:
Approved By:
Prepared By:
Report Highlights: In 2014, $56 billion in local dairy product sales were one-percent higher than 2013. Domestic raw fluid milk production
increased 5.8 percent; however total raw fluid milk consumption increased by only 2.1 percent, which was satisfied by a
12.2-percent increase in imports. Drinking milk products by value decreased by 2.7% in 2014 to reach 1.64 million metric
tons. New government price controls pushed average drinking milk prices higher in 2014. The value of drinking milk
products are expected to increase at a rate of 3% between 2014 and 2018, at constant 2014 prices. The local raw fluid milk
price jumped13 percent to $1 per liter since January 2015, recording the highest raw fluid milk price in the world. Cheese
sales increased by 9% in current volume terms to reach 118,000 metric tons in 2014. Unprocessed cheese sales increased by
12% in 2014, contributing 80% of overall sales volume for cheese in the year.
Youngsook, Oh, Ag. Marketing Specialist
Kevin Sage-EL, ATO Director
Dairy Product Update - ATO Seoul
Dairy and Products Annual
Korea - Republic of
KS1536
10/15/2015
Required Report - public distribution
Executive Summary: With the growing interest in higher quality cheese, the cheese products market is expecting to grow. U.S. and European
manufacturers are keen to export their cheeses to Korea, with both the Korea-U.S. and Korea-EU free trade agreements. By
2026, there will be a 0% tariff on cheese from the U.S. and European countries. Due to the high price of domestic raw fluid
milk, the local cheese industry is in an unfavorable position and suffers from the threat posed by imported cheese. Korea is
still at a beginning stage in terms of product variety and consumption patterns. Local manufacturers continue to develop new
products to induce additional purchases and to create new demand. Also, the importation of premium products is likely to
accelerate due to favorable free trade agreements.
Drinking milk products posted current value growth of 3% which was driven by demand for healthier premium products
despite a decline in volume sales. Due to the consciousness of nutritional benefits of milk, many consumers traded up to
products with more health benefits. Currently, the majority of local drinking milk products are pasteurized at very high
temperatures in order to maximize efficiency against cost. The drinking milk product is pasteurized at 63 degrees and is
available in both full fat and reduced fat versions. The rapid growth of lower-temperature pasteurized milk has a higher
average unit price as it is characterized as a type of premium-ization.
Probiotics has become the new buzzword in the health food industry in Korea. In 2014 yoghurt posted current value growth
of 8% to reach sales of U.S. $ 2.5 billion. Drinking yoghurt was the best sales product in 2014 with current value growth of
10%, mainly due to the popularity of functional variants.
Ice cream product showed a modest recovery, with retail volume and current sales value growing by 2% and 3%
respectively. Retail volume sales of ice cream grew by 2% in 2014 to reach 222,800 Metric Tons; current sales value grew
by 3% to reach U.S. $1.8 billion. After three consecutive years of decline through 2011 – 2013, the hot summer weather and
increased demand during the FIFA World Cup supported a recovery in ice cream consumption for 2014. Frozen yoghurt was
the most dynamic ice cream product in 2014, with retail volume and current value sales growing by 21% and 24%
respectively.
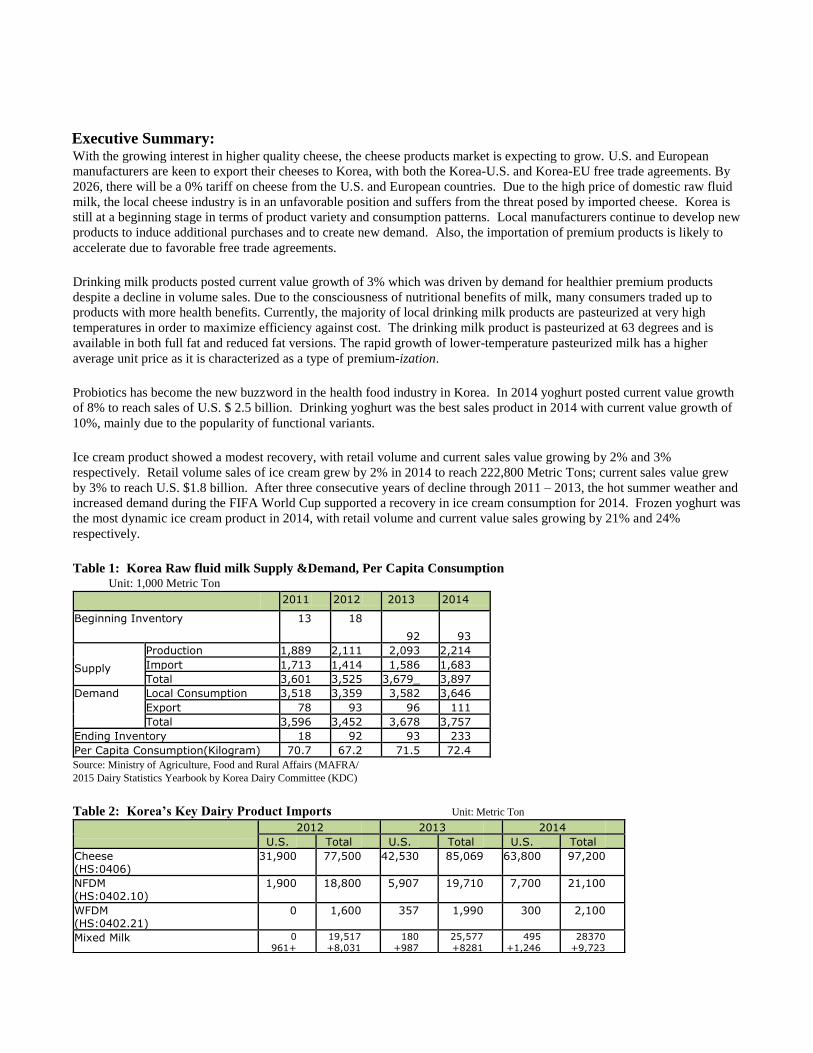
Table 1: Korea Raw fluid milk Supply &Demand, Per Capita Consumption Unit: 1,000 Metric Ton
2011 2012 2013 2014
Beginning Inventory 13 18 92
93
Supply
Production 1,889 2,111 2,093 2,214 Import 1,713 1,414 1,586 1,683 Total 3,601 3,525 3,679_ 3,897
Demand Local Consumption 3,518 3,359 3,582 3,646 Export 78 93 96 111 Total 3,596 3,452 3,678 3,757
Ending Inventory 18 92 93 233 Per Capita Consumption(Kilogram) 70.7 67.2 71.5 72.4 Source: Ministry of Agriculture, Food and Rural Affairs (MAFRA/ 2015 Dairy Statistics Yearbook by Korea Dairy Committee (KDC)
Table 2: Korea’s Key Dairy Product Imports Unit: Metric Ton
2012 2013 2014 U.S. Total U.S. Total U.S. Total
Cheese (HS:0406)
31,900 77,500 42,530 85,069 63,800 97,200
NFDM (HS:0402.10)
1,900 18,800 5,907 19,710 7,700 21,100
WFDM (HS:0402.21)
0 1,600 357 1,990 300 2,100
Mixed Milk 0 961+
19,517 +8,031
180 +987
25,577 +8281
495 +1,246
28370 +9,723
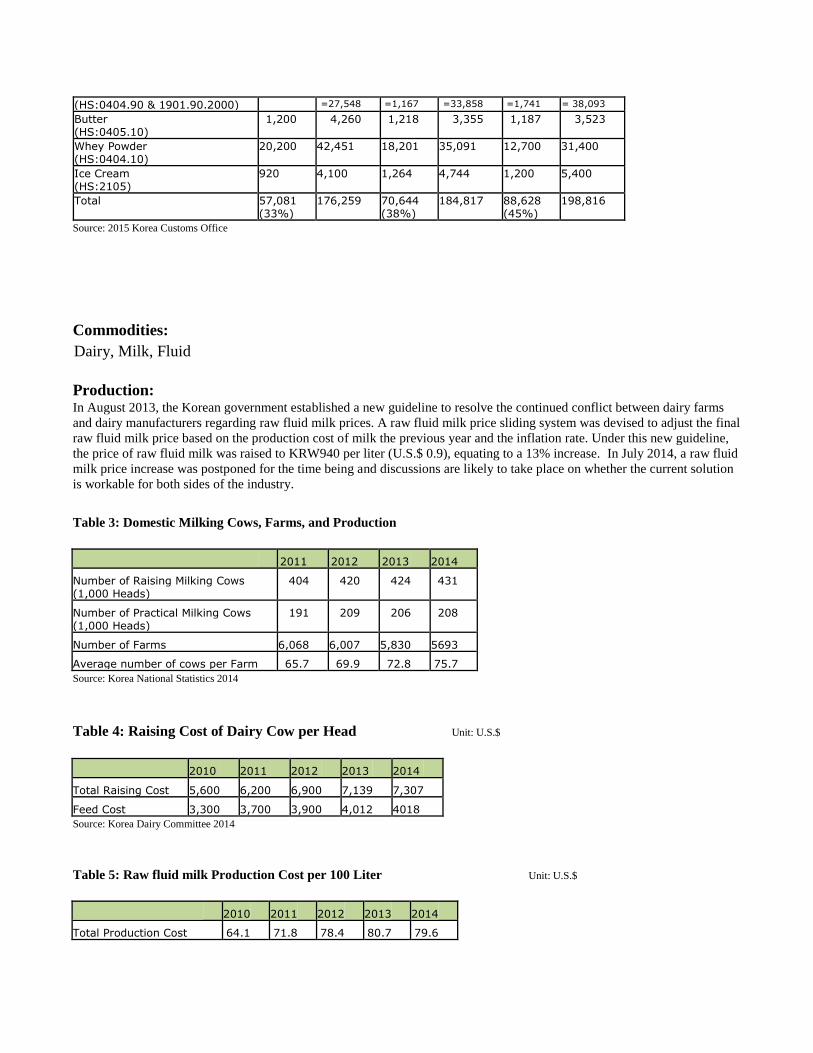
(HS:0404.90 & 1901.90.2000) =27,548 =1,167 =33,858 =1,741 = 38,093 Butter (HS:0405.10)
1,200 4,260 1,218 3,355 1,187 3,523
Whey Powder (HS:0404.10)
20,200 42,451 18,201 35,091 12,700 31,400
Ice Cream (HS:2105)
920 4,100 1,264 4,744 1,200 5,400
Total 57,081 (33%)
176,259 70,644 (38%)
184,817 88,628 (45%)
198,816
Source: 2015 Korea Customs Office
Commodities:
Production: In August 2013, the Korean government established a new guideline to resolve the continued conflict between dairy farms
and dairy manufacturers regarding raw fluid milk prices. A raw fluid milk price sliding system was devised to adjust the final
raw fluid milk price based on the production cost of milk the previous year and the inflation rate. Under this new guideline,
the price of raw fluid milk was raised to KRW940 per liter (U.S.$ 0.9), equating to a 13% increase. In July 2014, a raw fluid
milk price increase was postponed for the time being and discussions are likely to take place on whether the current solution
is workable for both sides of the industry.
Table 3: Domestic Milking Cows, Farms, and Production
2011 2012 2013 2014
Number of Raising Milking Cows (1,000 Heads)
404 420 424 431
Number of Practical Milking Cows (1,000 Heads)
191 209 206 208
Number of Farms 6,068 6,007 5,830 5693
Average number of cows per Farm 65.7 69.9 72.8 75.7 Source: Korea National Statistics 2014
Table 4: Raising Cost of Dairy Cow per Head Unit: U.S.$
2010 2011 2012 2013 2014
Total Raising Cost 5,600 6,200 6,900 7,139 7,307
Feed Cost 3,300 3,700 3,900 4,012 4018 Source: Korea Dairy Committee 2014
Table 5: Raw fluid milk Production Cost per 100 Liter Unit: U.S.$
2010 2011 2012 2013 2014
Total Production Cost 64.1 71.8 78.4 80.7 79.6
Dairy, Milk, Fluid
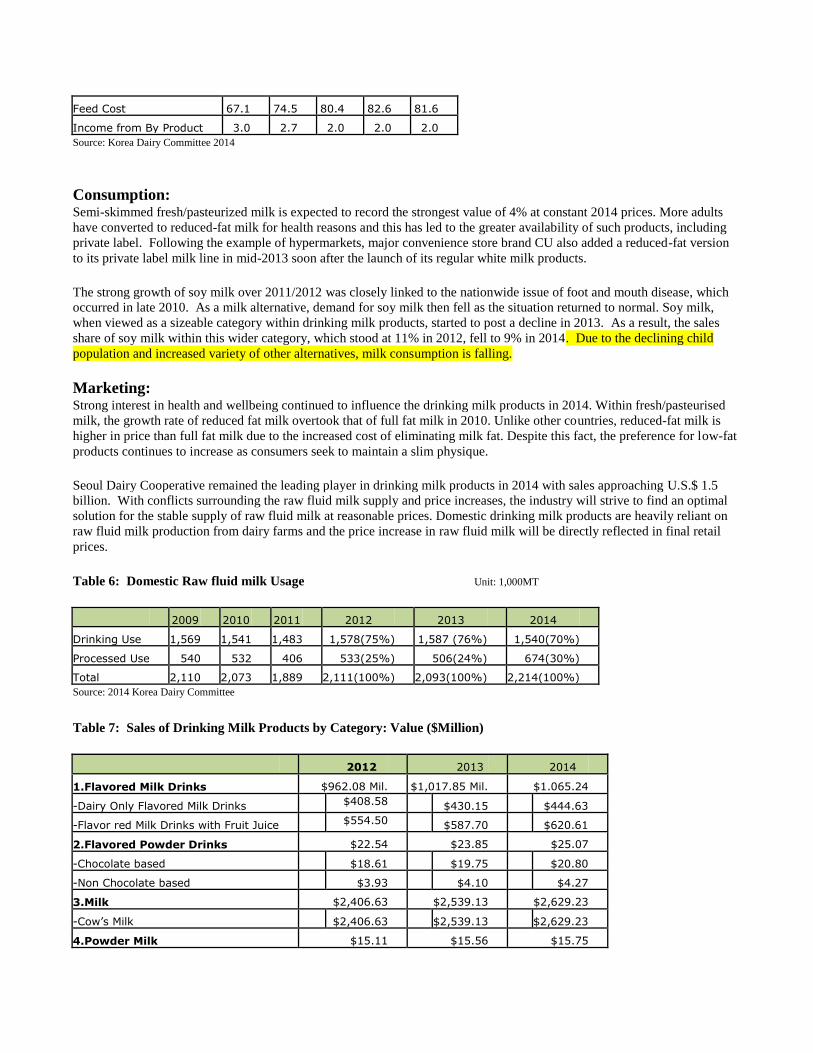
Feed Cost 67.1 74.5 80.4 82.6 81.6
Income from By Product 3.0 2.7 2.0 2.0 2.0 Source: Korea Dairy Committee 2014
Consumption: Semi-skimmed fresh/pasteurized milk is expected to record the strongest value of 4% at constant 2014 prices. More adults
have converted to reduced-fat milk for health reasons and this has led to the greater availability of such products, including
private label. Following the example of hypermarkets, major convenience store brand CU also added a reduced-fat version
to its private label milk line in mid-2013 soon after the launch of its regular white milk products.
The strong growth of soy milk over 2011/2012 was closely linked to the nationwide issue of foot and mouth disease, which
occurred in late 2010. As a milk alternative, demand for soy milk then fell as the situation returned to normal. Soy milk,
when viewed as a sizeable category within drinking milk products, started to post a decline in 2013. As a result, the sales
share of soy milk within this wider category, which stood at 11% in 2012, fell to 9% in 2014. Due to the declining child
population and increased variety of other alternatives, milk consumption is falling.
Marketing: Strong interest in health and wellbeing continued to influence the drinking milk products in 2014. Within fresh/pasteurised
milk, the growth rate of reduced fat milk overtook that of full fat milk in 2010. Unlike other countries, reduced-fat milk is
higher in price than full fat milk due to the increased cost of eliminating milk fat. Despite this fact, the preference for low-fat
products continues to increase as consumers seek to maintain a slim physique.
Seoul Dairy Cooperative remained the leading player in drinking milk products in 2014 with sales approaching U.S.$ 1.5
billion. With conflicts surrounding the raw fluid milk supply and price increases, the industry will strive to find an optimal
solution for the stable supply of raw fluid milk at reasonable prices. Domestic drinking milk products are heavily reliant on
raw fluid milk production from dairy farms and the price increase in raw fluid milk will be directly reflected in final retail
prices.
Table 6: Domestic Raw fluid milk Usage Unit: 1,000MT
2009 2010 2011 2012 2013 2014
Drinking Use 1,569 1,541 1,483 1,578(75%) 1,587 (76%) 1,540(70%)
Processed Use 540 532 406 533(25%) 506(24%) 674(30%)
Total 2,110 2,073 1,889 2,111(100%) 2,093(100%) 2,214(100%) Source: 2014 Korea Dairy Committee
Table 7: Sales of Drinking Milk Products by Category: Value ($Million)
2012 2013 2014
1.Flavored Milk Drinks $962.08 Mil. $1,017.85 Mil. $1.065.24
-Dairy Only Flavored Milk Drinks $408.58 $430.15 $444.63
-Flavor red Milk Drinks with Fruit Juice $554.50 $587.70 $620.61
2.Flavored Powder Drinks $22.54 $23.85 $25.07
-Chocolate based $18.61 $19.75 $20.80
-Non Chocolate based $3.93 $4.10 $4.27
3.Milk $2,406.63 $2,539.13 $2,629.23
-Cow’s Milk $2,406.63 $2,539.13 $2,629.23
4.Powder Milk $15.11 $15.56 $15.75
5.Non-Dairy Milk Alternatives $411.41 $380.56 $358.86
-Soy Milk $411.41 $380.56 $358.86
Total Drinking Milk Products (1+2+3+4+5)
$3,817.78 Mil. $3,958.24 Mil. $4,094.16
Source: Euromonitor 2015
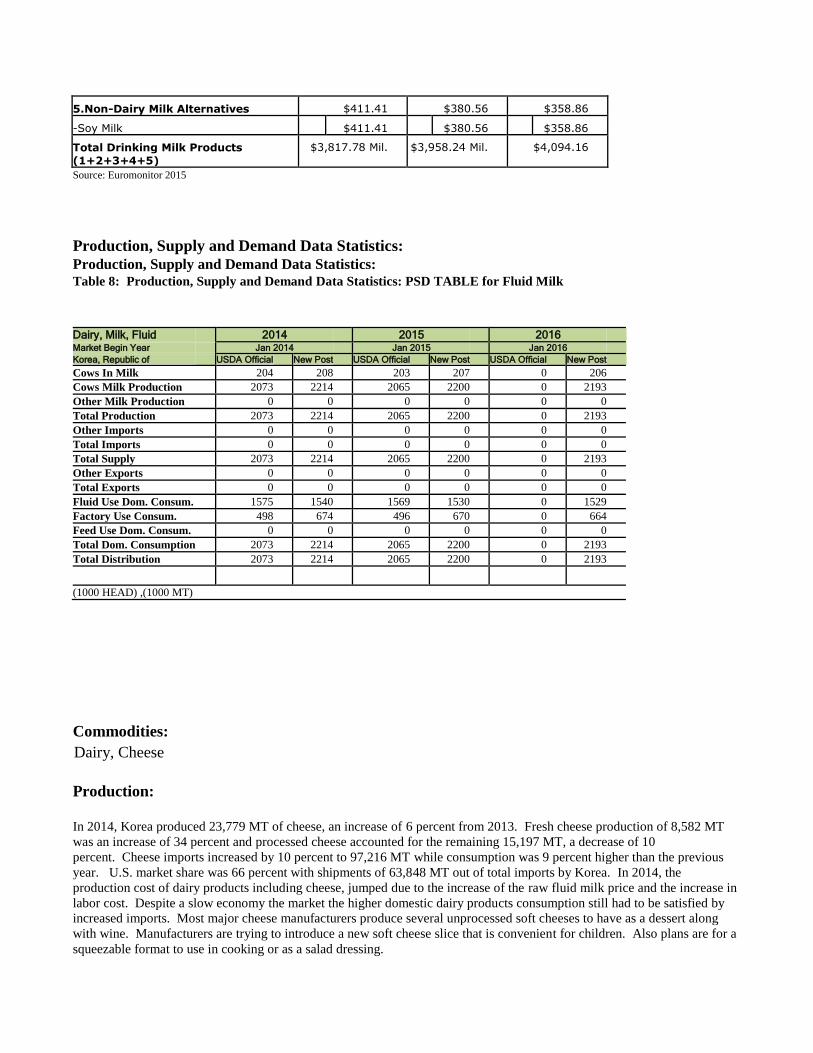
Production, Supply and Demand Data Statistics: Production, Supply and Demand Data Statistics: Table 8: Production, Supply and Demand Data Statistics: PSD TABLE for Fluid Milk
Dairy, Milk, Fluid 2014 2015 2016 Market Begin Year Jan 2014 Jan 2015 Jan 2016 Korea, Republic of USDA Official New Post USDA Official New Post USDA Official New Post Cows In Milk 204 208 203 207 0 206 Cows Milk Production 2073 2214 2065 2200 0 2193 Other Milk Production 0 0 0 0 0 0 Total Production 2073 2214 2065 2200 0 2193 Other Imports 0 0 0 0 0 0 Total Imports 0 0 0 0 0 0 Total Supply 2073 2214 2065 2200 0 2193 Other Exports 0 0 0 0 0 0 Total Exports 0 0 0 0 0 0 Fluid Use Dom. Consum. 1575 1540 1569 1530 0 1529 Factory Use Consum. 498 674 496 670 0 664 Feed Use Dom. Consum. 0 0 0 0 0 0 Total Dom. Consumption 2073 2214 2065 2200 0 2193 Total Distribution 2073 2214 2065 2200 0 2193
(1000 HEAD) ,(1000 MT)
Commodities:
Production: In 2014, Korea produced 23,779 MT of cheese, an increase of 6 percent from 2013. Fresh cheese production of 8,582 MT
was an increase of 34 percent and processed cheese accounted for the remaining 15,197 MT, a decrease of 10
percent. Cheese imports increased by 10 percent to 97,216 MT while consumption was 9 percent higher than the previous
year. U.S. market share was 66 percent with shipments of 63,848 MT out of total imports by Korea. In 2014, the
production cost of dairy products including cheese, jumped due to the increase of the raw fluid milk price and the increase in
labor cost. Despite a slow economy the market the higher domestic dairy products consumption still had to be satisfied by
increased imports. Most major cheese manufacturers produce several unprocessed soft cheeses to have as a dessert along
with wine. Manufacturers are trying to introduce a new soft cheese slice that is convenient for children. Also plans are for a
squeezable format to use in cooking or as a salad dressing.
Dairy, Cheese
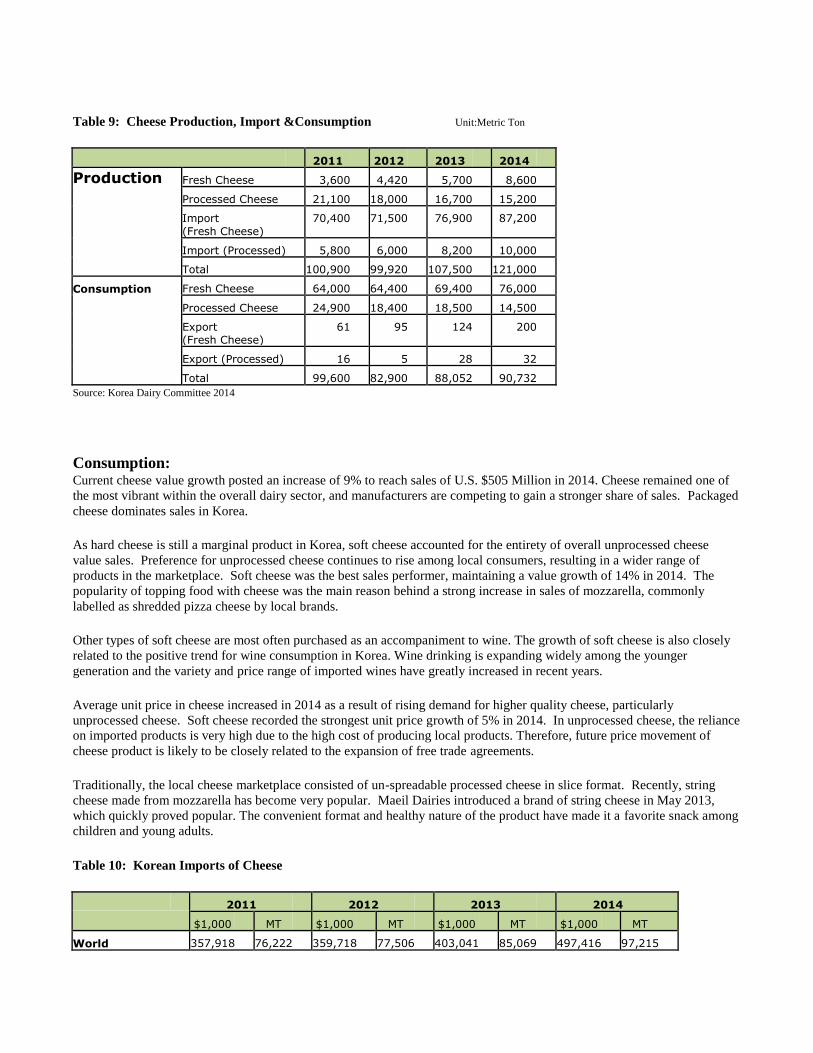
Table 9: Cheese Production, Import &Consumption Unit:Metric Ton
2011 2012 2013 2014
Production Fresh Cheese 3,600 4,420 5,700 8,600
Processed Cheese 21,100 18,000 16,700 15,200
Import (Fresh Cheese)
70,400 71,500 76,900 87,200
Import (Processed) 5,800 6,000 8,200 10,000
Total 100,900 99,920 107,500 121,000
Consumption Fresh Cheese 64,000 64,400 69,400 76,000
Processed Cheese 24,900 18,400 18,500 14,500
Export (Fresh Cheese)
61 95 124 200
Export (Processed) 16 5 28 32
Total 99,600 82,900 88,052 90,732 Source: Korea Dairy Committee 2014
Consumption: Current cheese value growth posted an increase of 9% to reach sales of U.S. $505 Million in 2014. Cheese remained one of
the most vibrant within the overall dairy sector, and manufacturers are competing to gain a stronger share of sales. Packaged
cheese dominates sales in Korea.
As hard cheese is still a marginal product in Korea, soft cheese accounted for the entirety of overall unprocessed cheese
value sales. Preference for unprocessed cheese continues to rise among local consumers, resulting in a wider range of
products in the marketplace. Soft cheese was the best sales performer, maintaining a value growth of 14% in 2014. The
popularity of topping food with cheese was the main reason behind a strong increase in sales of mozzarella, commonly
labelled as shredded pizza cheese by local brands.
Other types of soft cheese are most often purchased as an accompaniment to wine. The growth of soft cheese is also closely
related to the positive trend for wine consumption in Korea. Wine drinking is expanding widely among the younger
generation and the variety and price range of imported wines have greatly increased in recent years.
Average unit price in cheese increased in 2014 as a result of rising demand for higher quality cheese, particularly
unprocessed cheese. Soft cheese recorded the strongest unit price growth of 5% in 2014. In unprocessed cheese, the reliance
on imported products is very high due to the high cost of producing local products. Therefore, future price movement of
cheese product is likely to be closely related to the expansion of free trade agreements.
Traditionally, the local cheese marketplace consisted of un-spreadable processed cheese in slice format. Recently, string
cheese made from mozzarella has become very popular. Maeil Dairies introduced a brand of string cheese in May 2013,
which quickly proved popular. The convenient format and healthy nature of the product have made it a favorite snack among
children and young adults.
Table 10: Korean Imports of Cheese
2011 2012 2013 2014
$1,000 MT $1,000 MT $1,000 MT $1,000 MT
World 357,918 76,222 359,718 77,506 403,041 85,069 497,416 97,215
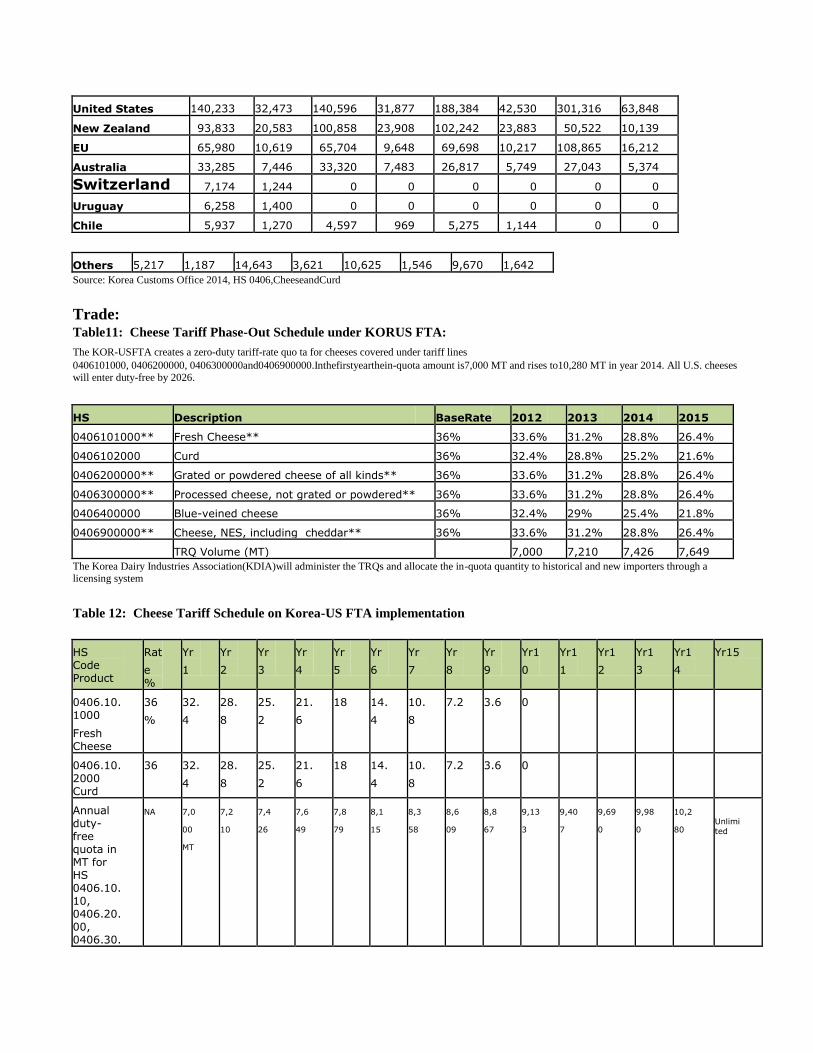
United States 140,233 32,473 140,596 31,877 188,384 42,530 301,316 63,848
New Zealand 93,833 20,583 100,858 23,908 102,242 23,883 50,522 10,139
EU 65,980 10,619 65,704 9,648 69,698 10,217 108,865 16,212
Australia 33,285 7,446 33,320 7,483 26,817 5,749 27,043 5,374
Switzerland 7,174 1,244 0 0 0 0 0 0
Uruguay 6,258 1,400 0 0 0 0 0 0
Chile 5,937 1,270 4,597 969 5,275 1,144 0 0
Others 5,217 1,187 14,643 3,621 10,625 1,546 9,670 1,642 Source: Korea Customs Office 2014, HS 0406,CheeseandCurd
Trade: Table11: Cheese Tariff Phase-Out Schedule under KORUS FTA:
The KOR-USFTA creates a zero-duty tariff-rate quo ta for cheeses covered under tariff lines 0406101000, 0406200000, 0406300000and0406900000.Inthefirstyearthein-quota amount is7,000 MT and rises to10,280 MT in year 2014. All U.S. cheeses will enter duty-free by 2026.
HS Description BaseRate 2012 2013 2014 2015
0406101000** Fresh Cheese** 36% 33.6% 31.2% 28.8% 26.4%
0406102000 Curd 36% 32.4% 28.8% 25.2% 21.6%
0406200000** Grated or powdered cheese of all kinds** 36% 33.6% 31.2% 28.8% 26.4%
0406300000** Processed cheese, not grated or powdered** 36% 33.6% 31.2% 28.8% 26.4%
0406400000 Blue-veined cheese 36% 32.4% 29% 25.4% 21.8%
0406900000** Cheese, NES, including cheddar** 36% 33.6% 31.2% 28.8% 26.4%
TRQ Volume (MT) 7,000 7,210 7,426 7,649 The Korea Dairy Industries Association(KDIA)will administer the TRQs and allocate the in-quota quantity to historical and new importers through a licensing system
Table 12: Cheese Tariff Schedule on Korea-US FTA implementation
HS Code Product
Rat
e %
Yr
1 Yr
2 Yr
3 Yr
4 Yr
5 Yr
6 Yr
7 Yr
8 Yr
9 Yr1
0 Yr1
1 Yr1
2 Yr1
3 Yr1
4 Yr15
0406.10. 1000
Fresh Cheese
36
%
32.
4
28.
8
25.
2
21.
6
18 14.
4
10.
8
7.2 3.6 0
0406.10. 2000 Curd
36 32.
4
28.
8
25.
2
21.
6
18 14.
4
10.
8
7.2 3.6 0
Annual duty- free quota in MT for HS 0406.10.10, 0406.20.00, 0406.30.
NA 7,0
00 MT
7,2
10 7,4
26 7,6
49 7,8
79 8,1
15 8,3
58 8,6
09 8,8
67 9,13
3 9,40
7 9,69
0 9,98
0 10,2
80
Unlimi
ted
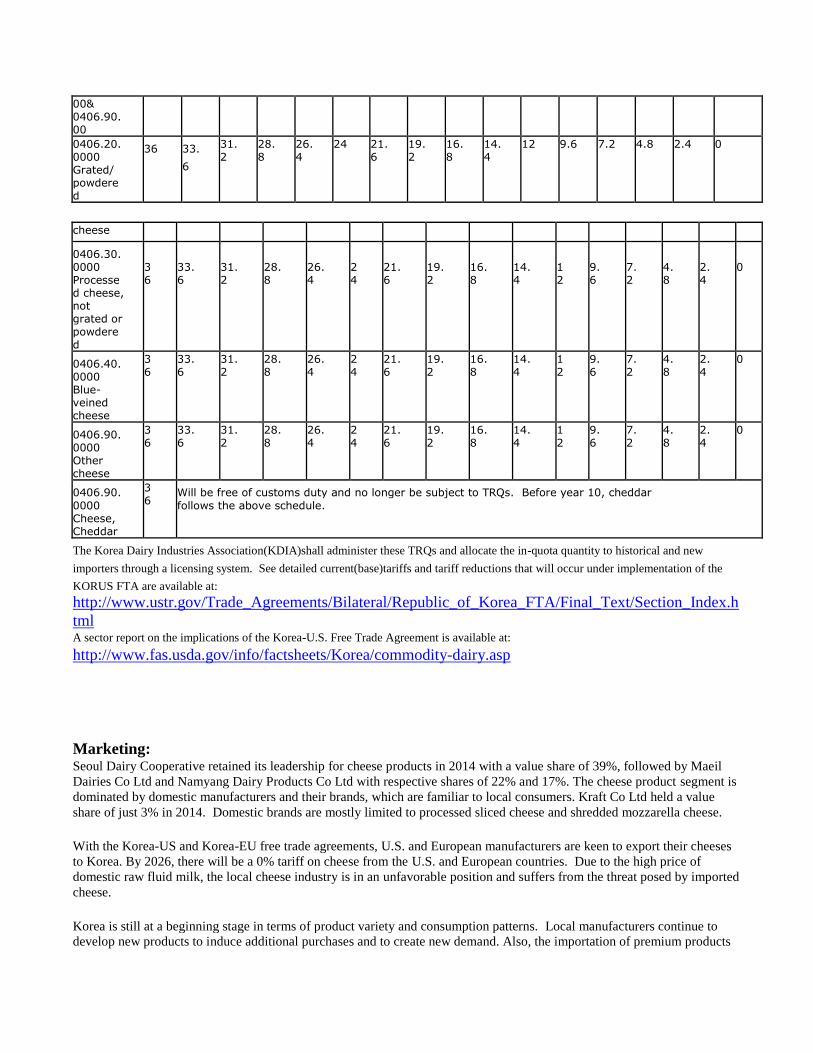
00& 0406.90.00 0406.20. 0000 Grated/ powdered
36 33.
6
31.2
28.8
26.4
24 21.6
19.2
16.8
14.4
12 9.6 7.2 4.8 2.4 0
cheese
0406.30. 0000 Processed cheese, not grated or powdered
36
33.6
31.2
28.8
26.4
24
21.6
19.2
16.8
14.4
12
9.6
7.2
4.8
2.4
0
0406.40. 0000 Blue- veined cheese
36
33.6
31.2
28.8
26.4
24
21.6
19.2
16.8
14.4
12
9.6
7.2
4.8
2.4
0
0406.90. 0000 Other cheese
36
33.6
31.2
28.8
26.4
24
21.6
19.2
16.8
14.4
12
9. 6
7.2
4.8
2.4
0
0406.90. 0000 Cheese, Cheddar
36
Will be free of customs duty and no longer be subject to TRQs. Before year 10, cheddar follows the above schedule.
The Korea Dairy Industries Association(KDIA)shall administer these TRQs and allocate the in-quota quantity to historical and new
importers through a licensing system. See detailed current(base)tariffs and tariff reductions that will occur under implementation of the
KORUS FTA are available at:
http://www.ustr.gov/Trade_Agreements/Bilateral/Republic_of_Korea_FTA/Final_Text/Section_Index.h
tml A sector report on the implications of the Korea-U.S. Free Trade Agreement is available at:
http://www.fas.usda.gov/info/factsheets/Korea/commodity-dairy.asp
Marketing: Seoul Dairy Cooperative retained its leadership for cheese products in 2014 with a value share of 39%, followed by Maeil
Dairies Co Ltd and Namyang Dairy Products Co Ltd with respective shares of 22% and 17%. The cheese product segment is
dominated by domestic manufacturers and their brands, which are familiar to local consumers. Kraft Co Ltd held a value
share of just 3% in 2014. Domestic brands are mostly limited to processed sliced cheese and shredded mozzarella cheese.
With the Korea-US and Korea-EU free trade agreements, U.S. and European manufacturers are keen to export their cheeses
to Korea. By 2026, there will be a 0% tariff on cheese from the U.S. and European countries. Due to the high price of
domestic raw fluid milk, the local cheese industry is in an unfavorable position and suffers from the threat posed by imported
cheese.
Korea is still at a beginning stage in terms of product variety and consumption patterns. Local manufacturers continue to
develop new products to induce additional purchases and to create new demand. Also, the importation of premium products
is likely to accelerate due to favorable free trade agreements. With the growing interest in higher quality cheese, the cheese
product’s market is expecting to grow.
Consumers value the nutritional benefits of cheese and favor its unique taste which is difficult to be replaced by other food
types. Price resistance in cheese is relatively low compared to other dairy products. Cheese has been positioned at the high
end of dairy products from the beginning and is perceived as a premium food item. The popularity of cheese will continue to
rise among younger generations who are accustomed to Western types of cuisines and wines. Currently, Korea’s
unprocessed cheese product is entirely accounted for by soft cheese as hard cheese is almost non-existent.
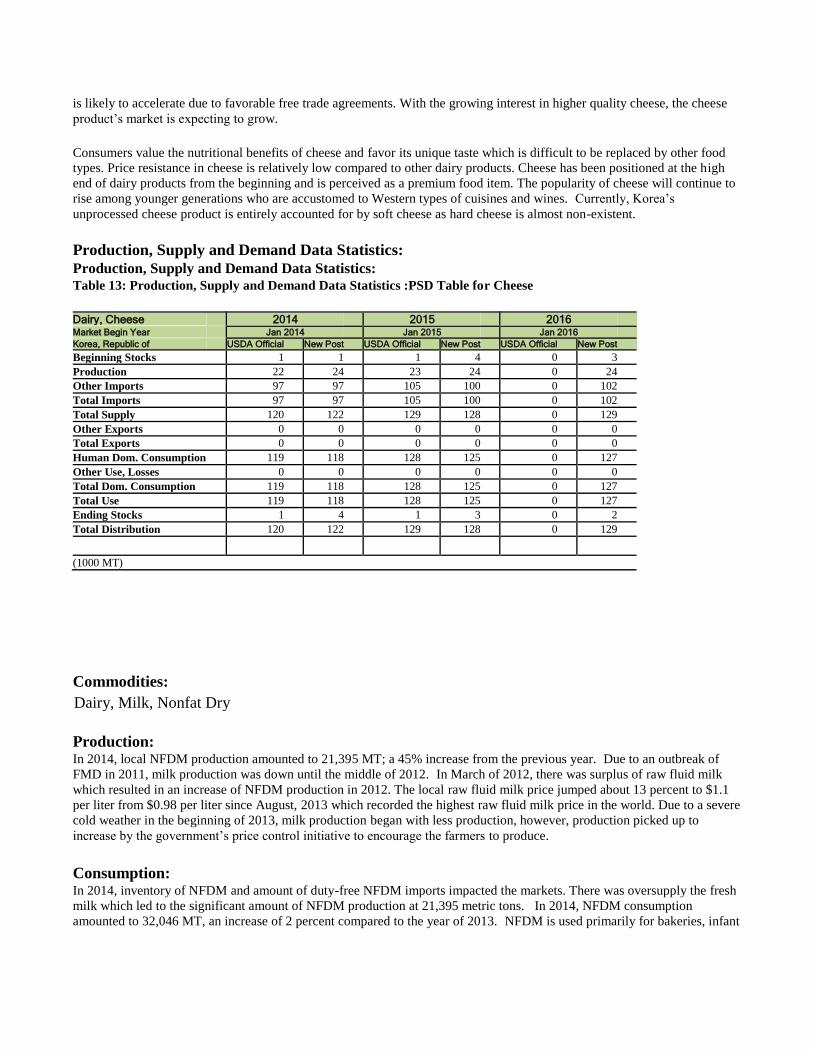
Production, Supply and Demand Data Statistics: Production, Supply and Demand Data Statistics: Table 13: Production, Supply and Demand Data Statistics :PSD Table for Cheese
Dairy, Cheese 2014 2015 2016 Market Begin Year Jan 2014 Jan 2015 Jan 2016 Korea, Republic of USDA Official New Post USDA Official New Post USDA Official New Post Beginning Stocks 1 1 1 4 0 3 Production 22 24 23 24 0 24 Other Imports 97 97 105 100 0 102 Total Imports 97 97 105 100 0 102 Total Supply 120 122 129 128 0 129 Other Exports 0 0 0 0 0 0 Total Exports 0 0 0 0 0 0 Human Dom. Consumption 119 118 128 125 0 127 Other Use, Losses 0 0 0 0 0 0 Total Dom. Consumption 119 118 128 125 0 127 Total Use 119 118 128 125 0 127 Ending Stocks 1 4 1 3 0 2 Total Distribution 120 122 129 128 0 129
(1000 MT)
Commodities:
Production: In 2014, local NFDM production amounted to 21,395 MT; a 45% increase from the previous year. Due to an outbreak of
FMD in 2011, milk production was down until the middle of 2012. In March of 2012, there was surplus of raw fluid milk
which resulted in an increase of NFDM production in 2012. The local raw fluid milk price jumped about 13 percent to $1.1
per liter from $0.98 per liter since August, 2013 which recorded the highest raw fluid milk price in the world. Due to a severe
cold weather in the beginning of 2013, milk production began with less production, however, production picked up to
increase by the government’s price control initiative to encourage the farmers to produce.
Consumption: In 2014, inventory of NFDM and amount of duty-free NFDM imports impacted the markets. There was oversupply the fresh
milk which led to the significant amount of NFDM production at 21,395 metric tons. In 2014, NFDM consumption
amounted to 32,046 MT, an increase of 2 percent compared to the year of 2013. NFDM is used primarily for bakeries, infant
Dairy, Milk, Nonfat Dry
formula and as an ingredient in other dairy products. Since NFDM production is largely a result of marketing quota policies,
consumption is expected to continue to track closely with production.
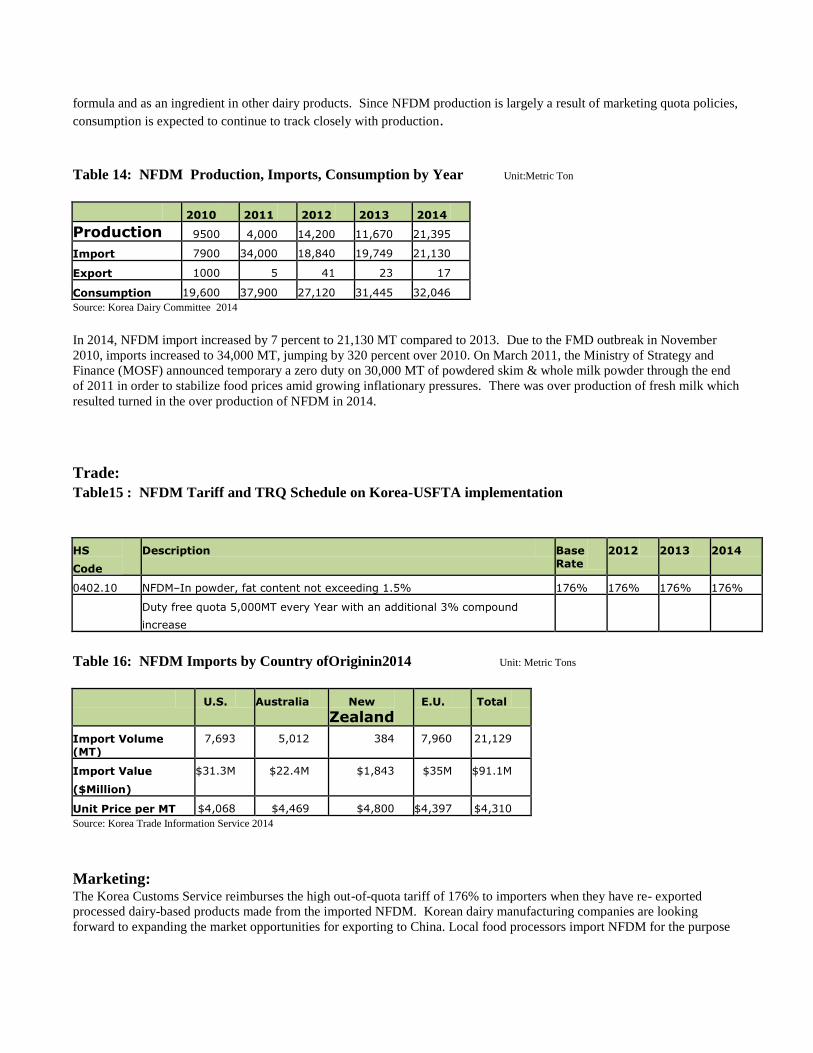
Table 14: NFDM Production, Imports, Consumption by Year Unit:Metric Ton
2010 2011 2012 2013 2014
Production 9500 4,000 14,200 11,670 21,395
Import 7900 34,000 18,840 19,749 21,130
Export 1000 5 41 23 17
Consumption 19,600 37,900 27,120 31,445 32,046 Source: Korea Dairy Committee 2014
In 2014, NFDM import increased by 7 percent to 21,130 MT compared to 2013. Due to the FMD outbreak in November
2010, imports increased to 34,000 MT, jumping by 320 percent over 2010. On March 2011, the Ministry of Strategy and
Finance (MOSF) announced temporary a zero duty on 30,000 MT of powdered skim & whole milk powder through the end
of 2011 in order to stabilize food prices amid growing inflationary pressures. There was over production of fresh milk which
resulted turned in the over production of NFDM in 2014.
Trade:
Table15 : NFDM Tariff and TRQ Schedule on Korea-USFTA implementation
HS
Code
Description Base Rate
2012 2013 2014
0402.10 NFDM–In powder, fat content not exceeding 1.5% 176% 176% 176% 176%
Duty free quota 5,000MT every Year with an additional 3% compound
increase
Table 16: NFDM Imports by Country ofOriginin2014 Unit: Metric Tons
U.S. Australia New Zealand
E.U. Total
Import Volume (MT)
7,693 5,012 384 7,960 21,129
Import Value
($Million)
$31.3M $22.4M $1,843 $35M $91.1M
Unit Price per MT $4,068 $4,469 $4,800 $4,397 $4,310 Source: Korea Trade Information Service 2014
Marketing: The Korea Customs Service reimburses the high out-of-quota tariff of 176% to importers when they have re- exported
processed dairy-based products made from the imported NFDM. Korean dairy manufacturing companies are looking
forward to expanding the market opportunities for exporting to China. Local food processors import NFDM for the purpose
of processing into infant formula, bakery use and re-exporting to other countries, including China. However, in 2014, most
imported NFDM was used for bakery ingredients and infant formula.
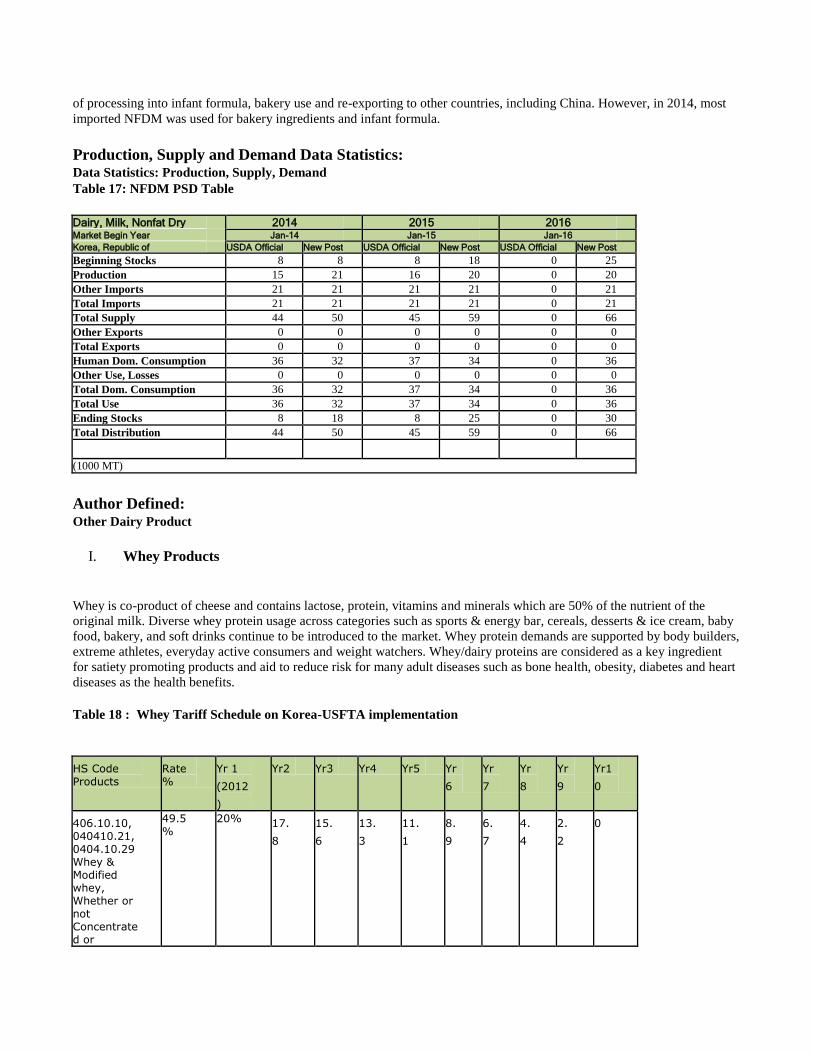
Production, Supply and Demand Data Statistics: Data Statistics: Production, Supply, Demand Table 17: NFDM PSD Table
Dairy, Milk, Nonfat Dry 2014 2015 2016 Market Begin Year Jan-14 Jan-15 Jan-16 Korea, Republic of USDA Official New Post USDA Official New Post USDA Official New Post Beginning Stocks 8 8 8 18 0 25 Production 15 21 16 20 0 20 Other Imports 21 21 21 21 0 21 Total Imports 21 21 21 21 0 21 Total Supply 44 50 45 59 0 66 Other Exports 0 0 0 0 0 0 Total Exports 0 0 0 0 0 0 Human Dom. Consumption 36 32 37 34 0 36 Other Use, Losses 0 0 0 0 0 0 Total Dom. Consumption 36 32 37 34 0 36 Total Use 36 32 37 34 0 36 Ending Stocks 8 18 8 25 0 30 Total Distribution 44 50 45 59 0 66
(1000 MT)
Author Defined: Other Dairy Product
I. Whey Products
Whey is co-product of cheese and contains lactose, protein, vitamins and minerals which are 50% of the nutrient of the
original milk. Diverse whey protein usage across categories such as sports & energy bar, cereals, desserts & ice cream, baby
food, bakery, and soft drinks continue to be introduced to the market. Whey protein demands are supported by body builders,
extreme athletes, everyday active consumers and weight watchers. Whey/dairy proteins are considered as a key ingredient
for satiety promoting products and aid to reduce risk for many adult diseases such as bone health, obesity, diabetes and heart
diseases as the health benefits. Table 18 : Whey Tariff Schedule on Korea-USFTA implementation
HS Code Products
Rate %
Yr 1 (2012
)
Yr2 Yr3 Yr4 Yr5 Yr
6 Yr
7 Yr
8 Yr
9 Yr1
0
406.10.10, 040410.21, 0404.10.29 Whey & Modified whey, Whether or not Concentrated or
49.5%
20% 17.
8 15.
6 13.
3 11.
1 8.
9 6.
7 4.
4 2.
2 0
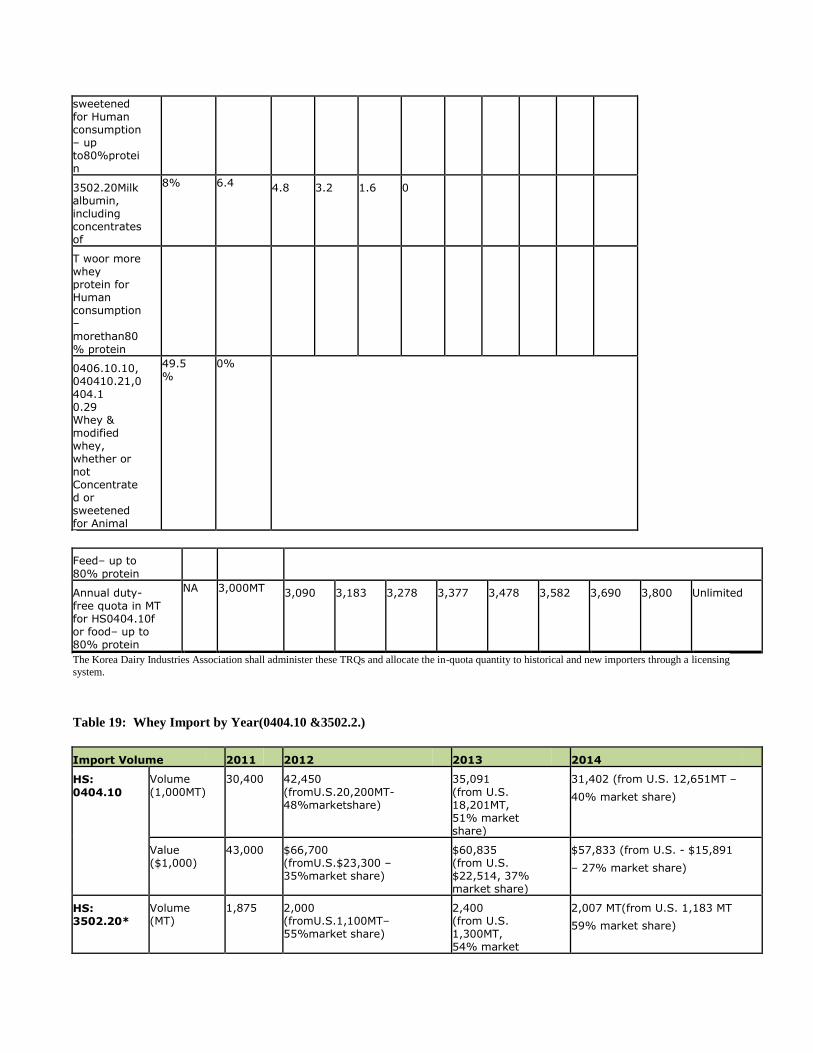
sweetened for Human consumption – up to80%protei n
3502.20Milk albumin, including concentrates of
8% 6.4 4.8 3.2 1.6 0
T woor more whey protein for Human consumption – morethan80 % protein
0406.10.10, 040410.21,0 404.1 0.29 Whey & modified whey, whether or not Concentrated or sweetened for Animal
49.5%
0%
Feed– up to 80% protein
Annual duty- free quota in MT for HS0404.10f or food– up to 80% protein
NA 3,000MT 3,090 3,183 3,278 3,377 3,478 3,582 3,690 3,800 Unlimited
The Korea Dairy Industries Association shall administer these TRQs and allocate the in-quota quantity to historical and new importers through a licensing
system.
Table 19: Whey Import by Year(0404.10 &3502.2.)
Import Volume 2011 2012 2013 2014
HS: 0404.10
Volume (1,000MT)
30,400 42,450 (fromU.S.20,200MT- 48%marketshare)
35,091 (from U.S. 18,201MT, 51% market share)
31,402 (from U.S. 12,651MT –
40% market share)
Value ($1,000)
43,000 $66,700 (fromU.S.$23,300 – 35%market share)
$60,835 (from U.S. $22,514, 37% market share)
$57,833 (from U.S. - $15,891
– 27% market share)
HS: 3502.20*
Volume (MT)
1,875 2,000 (fromU.S.1,100MT– 55%market share)
2,400 (from U.S. 1,300MT, 54% market
2,007 MT(from U.S. 1,183 MT
59% market share)
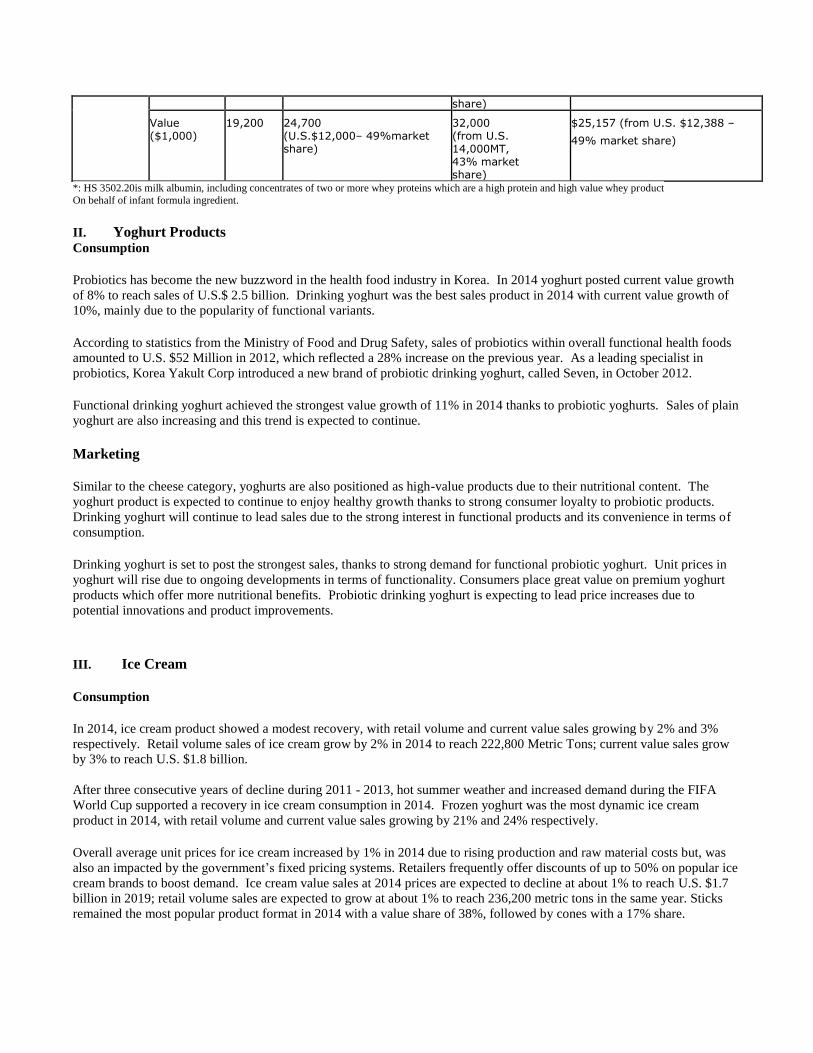
share)
Value ($1,000)
19,200 24,700 (U.S.$12,000– 49%market share)
32,000 (from U.S. 14,000MT, 43% market share)
$25,157 (from U.S. $12,388 –
49% market share)
*: HS 3502.20is milk albumin, including concentrates of two or more whey proteins which are a high protein and high value whey product On behalf of infant formula ingredient.
II. Yoghurt Products Consumption Probiotics has become the new buzzword in the health food industry in Korea. In 2014 yoghurt posted current value growth
of 8% to reach sales of U.S.$ 2.5 billion. Drinking yoghurt was the best sales product in 2014 with current value growth of
10%, mainly due to the popularity of functional variants. According to statistics from the Ministry of Food and Drug Safety, sales of probiotics within overall functional health foods
amounted to U.S. $52 Million in 2012, which reflected a 28% increase on the previous year. As a leading specialist in
probiotics, Korea Yakult Corp introduced a new brand of probiotic drinking yoghurt, called Seven, in October 2012. Functional drinking yoghurt achieved the strongest value growth of 11% in 2014 thanks to probiotic yoghurts. Sales of plain
yoghurt are also increasing and this trend is expected to continue.
Marketing Similar to the cheese category, yoghurts are also positioned as high-value products due to their nutritional content. The
yoghurt product is expected to continue to enjoy healthy growth thanks to strong consumer loyalty to probiotic products.
Drinking yoghurt will continue to lead sales due to the strong interest in functional products and its convenience in terms of
consumption. Drinking yoghurt is set to post the strongest sales, thanks to strong demand for functional probiotic yoghurt. Unit prices in
yoghurt will rise due to ongoing developments in terms of functionality. Consumers place great value on premium yoghurt
products which offer more nutritional benefits. Probiotic drinking yoghurt is expecting to lead price increases due to
potential innovations and product improvements.
III. Ice Cream Consumption In 2014, ice cream product showed a modest recovery, with retail volume and current value sales growing by 2% and 3%
respectively. Retail volume sales of ice cream grow by 2% in 2014 to reach 222,800 Metric Tons; current value sales grow
by 3% to reach U.S. $1.8 billion.
After three consecutive years of decline during 2011 - 2013, hot summer weather and increased demand during the FIFA
World Cup supported a recovery in ice cream consumption in 2014. Frozen yoghurt was the most dynamic ice cream
product in 2014, with retail volume and current value sales growing by 21% and 24% respectively. Overall average unit prices for ice cream increased by 1% in 2014 due to rising production and raw material costs but, was
also an impacted by the government’s fixed pricing systems. Retailers frequently offer discounts of up to 50% on popular ice
cream brands to boost demand. Ice cream value sales at 2014 prices are expected to decline at about 1% to reach U.S. $1.7
billion in 2019; retail volume sales are expected to grow at about 1% to reach 236,200 metric tons in the same year. Sticks
remained the most popular product format in 2014 with a value share of 38%, followed by cones with a 17% share.
Marketing Lotte Confectionery Co maintained its leading position in ice cream in 2014 with an overall value share of 36%. Domestic
manufacturing companies dominate ice cream in Korea with strong consumer loyalty towards their brands. The presence of
international brands is largely limited to the premium price segment, particularly in bulk dairy ice cream. Growth in retail volume of impulse-sales of ice cream is expected to be modest, while sales value at 2014 prices are
projected to decline slightly. Aside from rising health awareness among consumers and low birth rates in Korea, retail
volume growth will be hampered by increasing competition from on-trade operators such as ice cream fast food chain Baskin
Robbins, as well as from homemade alternatives like shaved ice desserts. Sluggish growth in retail volume sales will
contribute to the projected decline in ice cream value sales at constant 2014 prices. Despite challenging conditions, ice cream is expected to perform slightly better in both retail volume and value terms. Retail
volume growth will be boosted by increasing price competition, as well as by the longer term trend of rising summer
temperatures in Korea. At the same time, trading up to higher quality and more expensive products should help to ensure that
ice cream value sales decline at a slower pace than they did over 2009-2014. Frozen yoghurt will remain by far the most dynamic ice cream product in terms of retail volume growth and value sales
growth at 2014 prices. Hypermarkets will remain the leading retail distribution channel for both impulse and take- home ice
cream. This is mainly because hypermarkets operators can offer much wider assortments and more competitive prices than
other retailers. Supermarkets will continue to be the second most important distribution channel for take-home ice cream,
while independent small grocers will remain the second leading channel in impulse-sales ice cream. EXPORT REQUIREMENT:
See APHIS’website(http://www.aphis.usda.gov/regulations/vs/iregs/products/ for any sanitary requirements for shipping
cheese to Korea.
For more information, please contact the U.S.AgriculturalTradeOffice, U.S.Embassy Seoul,Korea,at
[email protected],Tel:82-2-6951-6845,Fax:82-2-720-7921,or visitwww.atoseoul.com
Commodities:
Select