Embed Size (px)
Citation preview
Analysts who prepared this report are registered as research analysts in Korea but not in any other jurisdiction, including tAnalysts who prepared this report are registered as research analysts in Korea but not in any other jurisdiction, including tAnalysts who prepared this report are registered as research analysts in Korea but not in any other jurisdiction, including tAnalysts who prepared this report are registered as research analysts in Korea but not in any other jurisdiction, including the U.S. he U.S. he U.S. he U.S.
PLEASE SEE ANALYST CERTIFICATIONS AND IMPORTANT DISCLOSURES & DISCLAIMERS IN APPENDIX 1 AT THE END OF REPORT.PLEASE SEE ANALYST CERTIFICATIONS AND IMPORTANT DISCLOSURES & DISCLAIMERS IN APPENDIX 1 AT THE END OF REPORT.PLEASE SEE ANALYST CERTIFICATIONS AND IMPORTANT DISCLOSURES & DISCLAIMERS IN APPENDIX 1 AT THE END OF REPORT.PLEASE SEE ANALYST CERTIFICATIONS AND IMPORTANT DISCLOSURES & DISCLAIMERS IN APPENDIX 1 AT THE END OF REPORT.
Kolon Industries (120110 KS)
Stability plus growth
A diversified chemicals company
Kolon Industries is a diversified chemicals company engaged in the industrial materials,
chemicals, films/electronic materials, and fashion businesses. The company has a
number of products that lead the global ranks, such as tire cords, airbags, and
hydrocarbon resins. The films/electronic materials unit produces PET films for a variety
of applications as well as nylon films, while the fashion unit owns a diversified brand
portfolio that includes the flagship brand Kolon Sport.
Margin gains in industrial materials/chemicals and rise of new brands in fashion
1) We expect tire cord supply/demand to continue to improve. Massive capacity
expansions in 2011-12 led to increased supply, but demand proved weaker than
anticipated, resulting in a supply glut. However, the exit of rival Toyobo from the tire
cord business and a pickup in tire demand have helped reduce excess capacity, and as a
result, supply/demand conditions have been improving since 2014. With no meaningful
capacity ramp-ups on the horizon, we expect tire cord earnings to continue to grow.
2) We believe hydrocarbon resins will serve as the company’s cash cow, supporting the
earnings stability of the chemicals unit. Chemicals earnings have remained robust,
underpinned by hydrocarbon volume growth following capacity ramp-ups and an
improving product mix. Given growing demand and high product prices (despite the
recent fall in raw material prices), we anticipate the chemicals unit to generate double-
digit margins.
3) We expect new designer brands and entry into China to drive the growth of the
fashion business. The fashion unit has diversified its brand portfolio to accessories and
women’s designer brands, and has launched several major brands in China, which should
offset the impact of the slowing domestic outdoor clothing market. We believe the
rapid growth of new brands (Couronne, Suecomma Bonnie, and Lucky Chouette) and
China operations should be watched closely.
Initiate coverage with Buy and TP of W82,000
We initiate our coverage on Kolon Industries with a Buy rating and target price of
W82,000. We derived our target price using a sum-of-the-parts methodology based on
2016 estimates. The stock is currently trading at a 2016F P/E of 7.6x and P/B of 0.9x.
Kolon Industries’ shares have performed poorly due to the aramid lawsuit with DuPont
and the weakness of the films/electronic materials business. However, the company
reached a settlement with DuPont in May 2015, which should allow business to get back
on track. It will likely take some time for the film market to recover, but we believe
further downside risks to earnings are limited and already priced in. At current share
prices, the company looks undervalued relative to its competitors. We expect valuation
to normalize on the back of robust earnings resulting from the stable growth of major
industrial materials products and an improving chemicals mix.
FY (Dec.) 12/12 12/13 12/14 12/15F 12/16F 12/17F
Revenue (Wbn) 5,313 5,261 5,338 4,896 5,026 5,107
OP (Wbn) 294 232 169 299 340 352
OP margin (%) 5.5 4.4 3.2 6.1 6.8 6.9
NP (Wbn) 167 112 42 -117 242 261
EPS (W) 6,010 4,008 1,517 -4,195 8,674 9,362
ROE (%) 9.6 6.2 2.3 -6.3 12.5 12.0
P/E (x) 10.6 13.6 31.9 - 7.6 7.0
P/B (x) 0.9 0.8 0.7 1.0 0.9 0.8
Note: All figures are based on consolidated K-IFRS; NP refers to net profit attributable to controlling interests
Source: Company data, KDB Daewoo Securities Research estimates
Chemicals
Initiation Report
December 2, 2015
(Initiate) Buy
Target Price (12M, W) 82,000
Share Price (12/01/15, W) 65,800
Expected Return 25%
OP (15F, Wbn) 299
Consensus OP (15F, Wbn) 297
EPS Growth (15F, %) -
Market EPS Growth (15F, %) 22.6
P/E (15F, x) -
Market P/E (15F, x) 11.4
KOSPI 2,023.93
Market Cap (Wbn) 1,653
Shares Outstanding (mn) 28
Free Float (%) 61.3
Foreign Ownership (%) 16.8
Beta (12M) 1.09
52-Week Low 42,250
52-Week High 73,900
(%)(%)(%)(%) 1M1M1M1M 6M6M6M6M 12M12M12M12M
Absolute 6.0 1.1 41.1
Relative 6.2 5.0 37.0
Daewoo Daewoo Daewoo Daewoo Securities CSecurities CSecurities CSecurities Co., Ltd.o., Ltd.o., Ltd.o., Ltd.
[Oil Refining/Chemicals]
Young-jee Bae
+822-768-4123
Yeon-ju Park
+822-768-3061
80
100
120
140
160
180
11.14 3.15 7.15 11.15
Kolon Industries KOSPI
Kolon Industries
2
December 2, 2015
KDB Daewoo Securities Research
C O N T E N T S
I. Investment points 3 1. Industrial materials: Tire cord earnings to improve on easing of oversupply 3 2. Chemicals: Hydrocarbon resins to serve as cash cow, supporting earnings stability 5 3. Fashion: Focus shifting to designer brands and Chinese market 6
II. Earnings outlook 8 Margin improvement and steady growth of major businesses
III. Valuation 9 Initiate coverage with Buy and TP of W82,000
IV. Risks 11 Unfavorable films/electronic materials market conditions already priced in
V. Company overview 12 A diversified chemicals company
Kolon Industries
3
December 2, 2015
KDB Daewoo Securities Research
I. Investment points
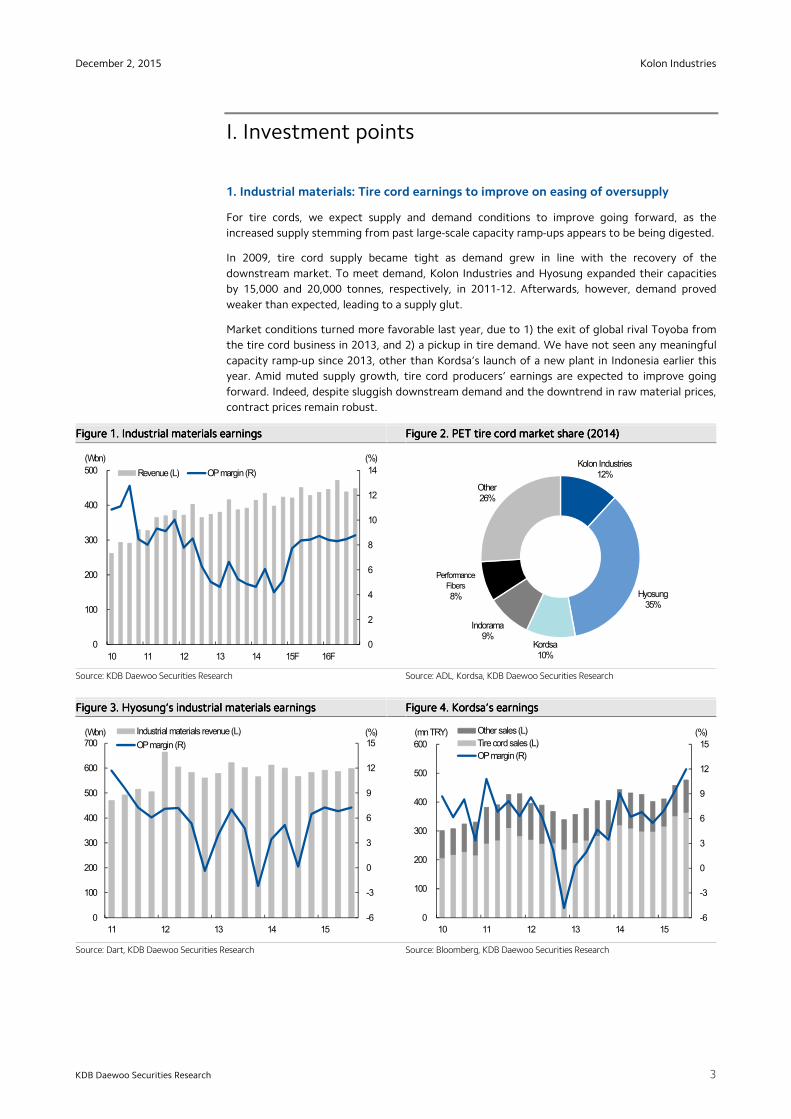
1. Industrial materials: Tire cord earnings to improve on easing of oversupply
For tire cords, we expect supply and demand conditions to improve going forward, as the
increased supply stemming from past large-scale capacity ramp-ups appears to be being digested.
In 2009, tire cord supply became tight as demand grew in line with the recovery of the
downstream market. To meet demand, Kolon Industries and Hyosung expanded their capacities
by 15,000 and 20,000 tonnes, respectively, in 2011-12. Afterwards, however, demand proved
weaker than expected, leading to a supply glut.
Market conditions turned more favorable last year, due to 1) the exit of global rival Toyoba from
the tire cord business in 2013, and 2) a pickup in tire demand. We have not seen any meaningful
capacity ramp-up since 2013, other than Kordsa’s launch of a new plant in Indonesia earlier this
year. Amid muted supply growth, tire cord producers’ earnings are expected to improve going
forward. Indeed, despite sluggish downstream demand and the downtrend in raw material prices,
contract prices remain robust.
Figure Figure Figure Figure 1111. . . . Industrial materials earningsIndustrial materials earningsIndustrial materials earningsIndustrial materials earnings Figure Figure Figure Figure 2222. . . . PET tire cord market share (2014)PET tire cord market share (2014)PET tire cord market share (2014)PET tire cord market share (2014)
Source: KDB Daewoo Securities Research Source: ADL, Kordsa, KDB Daewoo Securities Research
Figure Figure Figure Figure 3333. . . . HyosungHyosungHyosungHyosung’’’’s industrial materials earningss industrial materials earningss industrial materials earningss industrial materials earnings Figure Figure Figure Figure 4444. . . . KordsaKordsaKordsaKordsa’’’’s earningss earningss earningss earnings
Source: Dart, KDB Daewoo Securities Research Source: Bloomberg, KDB Daewoo Securities Research
0
2
4
6
8
10
12
14
0
100
200
300
400
500
10 11 12 13 14 15F 16F
Revenue (L) OP margin (R)
(Wbn) (%)Kolon Industries
12%
Hyosung35%
Kordsa10%
Indorama9%
Performance
Fibers
8%
Other26%
-6
-3
0
3
6
9
12
15
0
100
200
300
400
500
600
700
11 12 13 14 15
Industrial materials revenue (L)
OP margin (R)
(Wbn) (%)
-6
-3
0
3
6
9
12
15
0
100
200
300
400
500
600
10 11 12 13 14 15
Other sales (L)
Tire cord sales (L)
OP margin (R)
(mn TRY) (%)
Kolon Industries
4
December 2, 2015
KDB Daewoo Securities Research
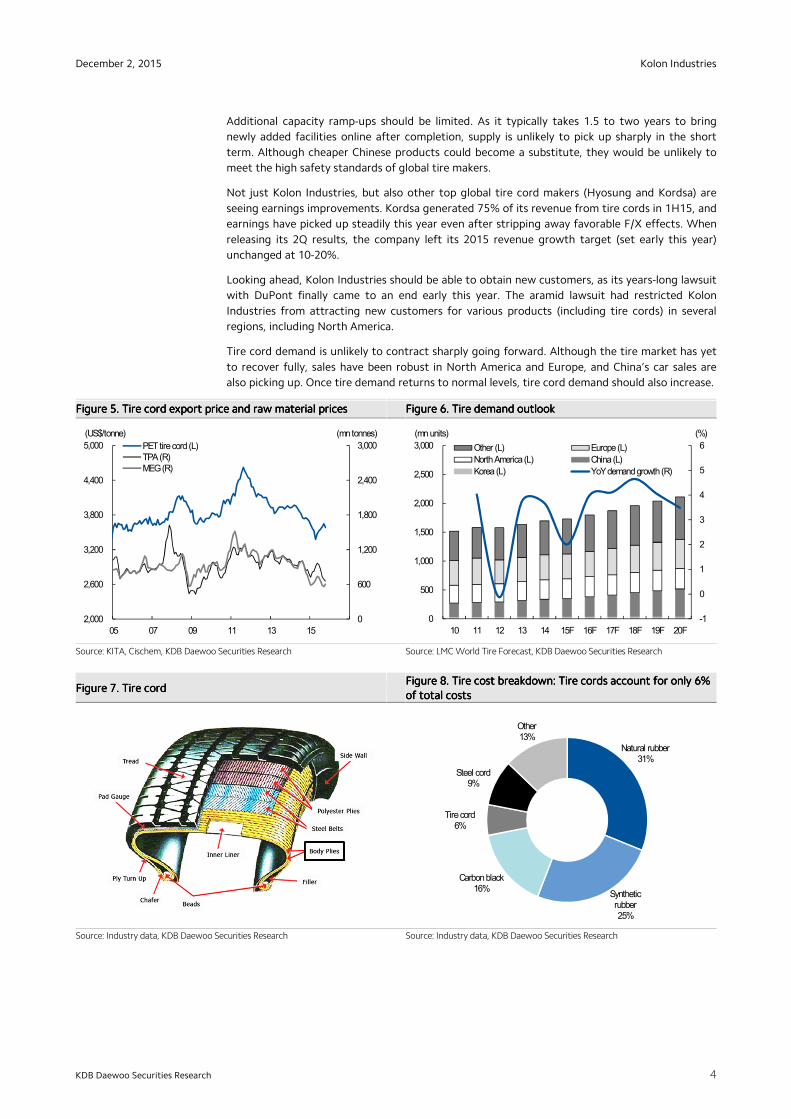
Additional capacity ramp-ups should be limited. As it typically takes 1.5 to two years to bring
newly added facilities online after completion, supply is unlikely to pick up sharply in the short
term. Although cheaper Chinese products could become a substitute, they would be unlikely to
meet the high safety standards of global tire makers.
Not just Kolon Industries, but also other top global tire cord makers (Hyosung and Kordsa) are
seeing earnings improvements. Kordsa generated 75% of its revenue from tire cords in 1H15, and
earnings have picked up steadily this year even after stripping away favorable F/X effects. When
releasing its 2Q results, the company left its 2015 revenue growth target (set early this year)
unchanged at 10-20%.
Looking ahead, Kolon Industries should be able to obtain new customers, as its years-long lawsuit
with DuPont finally came to an end early this year. The aramid lawsuit had restricted Kolon
Industries from attracting new customers for various products (including tire cords) in several
regions, including North America.
Tire cord demand is unlikely to contract sharply going forward. Although the tire market has yet
to recover fully, sales have been robust in North America and Europe, and China’s car sales are
also picking up. Once tire demand returns to normal levels, tire cord demand should also increase.
Figure Figure Figure Figure 5555. . . . Tire cord export price and raw material pricesTire cord export price and raw material pricesTire cord export price and raw material pricesTire cord export price and raw material prices Figure Figure Figure Figure 6666. . . . Tire demand outlookTire demand outlookTire demand outlookTire demand outlook
Source: KITA, Cischem, KDB Daewoo Securities Research Source: LMC World Tire Forecast, KDB Daewoo Securities Research
Figure Figure Figure Figure 7777. . . . Tire cordTire cordTire cordTire cord Figure Figure Figure Figure 8888. . . . Tire cost breakdown: Tire cost breakdown: Tire cost breakdown: Tire cost breakdown: Tire cordsTire cordsTire cordsTire cords account for only account for only account for only account for only 6%6%6%6% of total costsof total costsof total costsof total costs
Source: Industry data, KDB Daewoo Securities Research Source: Industry data, KDB Daewoo Securities Research
0
600
1,200
1,800
2,400
3,000
2,000
2,600
3,200
3,800
4,400
5,000
05 07 09 11 13 15
PET tire cord (L)TPA (R)MEG (R)
(US$/tonne) (mn tonnes)
-1
0
1
2
3
4
5
6
0
500
1,000
1,500
2,000
2,500
3,000
10 11 12 13 14 15F 16F 17F 18F 19F 20F
Other (L) Europe (L)
North America (L) China (L)
Korea (L) YoY demand growth (R)
(mn units) (%)
Natural rubber31%
Synthetic rubber25%
Carbon black16%
Tire cord6%
Steel cord9%
Other13%
Kolon Industries
5
December 2, 2015
KDB Daewoo Securities Research
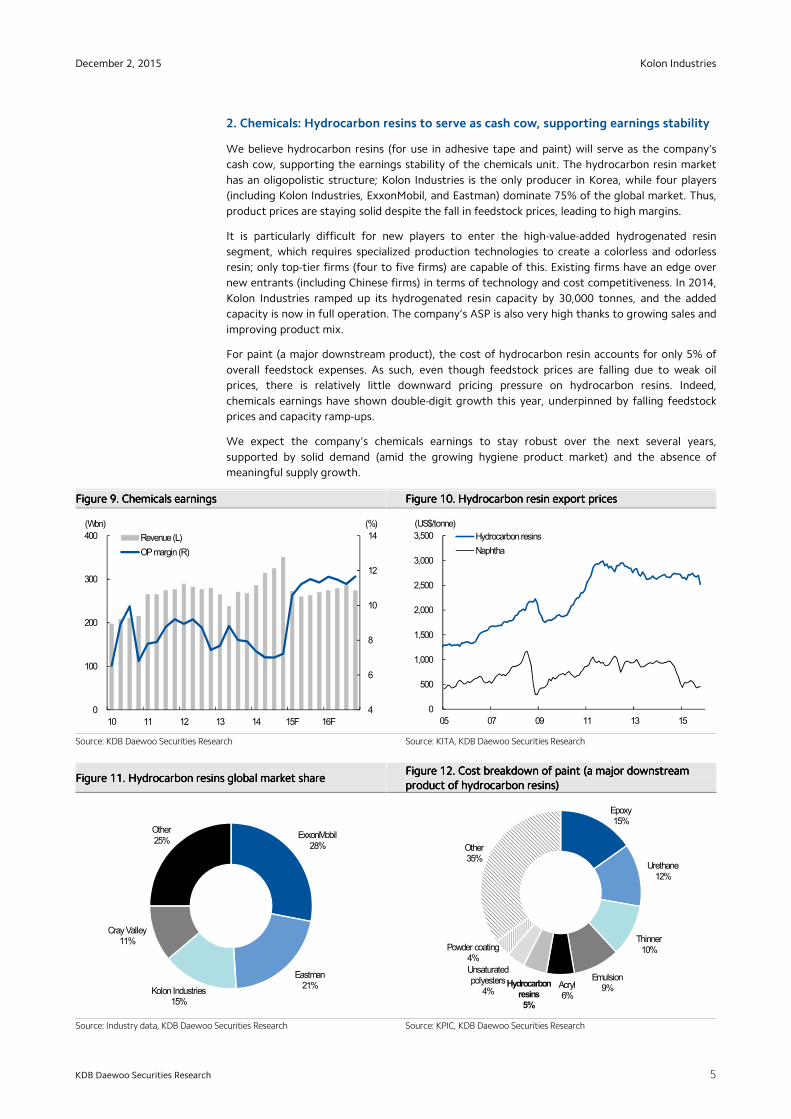
2. Chemicals: Hydrocarbon resins to serve as cash cow, supporting earnings stability
We believe hydrocarbon resins (for use in adhesive tape and paint) will serve as the company’s
cash cow, supporting the earnings stability of the chemicals unit. The hydrocarbon resin market
has an oligopolistic structure; Kolon Industries is the only producer in Korea, while four players
(including Kolon Industries, ExxonMobil, and Eastman) dominate 75% of the global market. Thus,
product prices are staying solid despite the fall in feedstock prices, leading to high margins.
It is particularly difficult for new players to enter the high-value-added hydrogenated resin
segment, which requires specialized production technologies to create a colorless and odorless
resin; only top-tier firms (four to five firms) are capable of this. Existing firms have an edge over
new entrants (including Chinese firms) in terms of technology and cost competitiveness. In 2014,
Kolon Industries ramped up its hydrogenated resin capacity by 30,000 tonnes, and the added
capacity is now in full operation. The company’s ASP is also very high thanks to growing sales and
improving product mix.
For paint (a major downstream product), the cost of hydrocarbon resin accounts for only 5% of
overall feedstock expenses. As such, even though feedstock prices are falling due to weak oil
prices, there is relatively little downward pricing pressure on hydrocarbon resins. Indeed,
chemicals earnings have shown double-digit growth this year, underpinned by falling feedstock
prices and capacity ramp-ups.
We expect the company’s chemicals earnings to stay robust over the next several years,
supported by solid demand (amid the growing hygiene product market) and the absence of
meaningful supply growth.
Figure Figure Figure Figure 9999. . . . ChemicalChemicalChemicalChemicals earningss earningss earningss earnings Figure Figure Figure Figure 10101010. . . . Hydrocarbon resin export pricesHydrocarbon resin export pricesHydrocarbon resin export pricesHydrocarbon resin export prices
Source: KDB Daewoo Securities Research Source: KITA, KDB Daewoo Securities Research
Figure Figure Figure Figure 11111111. . . . Hydrocarbon resins global market shareHydrocarbon resins global market shareHydrocarbon resins global market shareHydrocarbon resins global market share Figure Figure Figure Figure 12121212. . . . Cost breakdown of pCost breakdown of pCost breakdown of pCost breakdown of paint (aint (aint (aint (a major downstream a major downstream a major downstream a major downstream product ofproduct ofproduct ofproduct of hydrocarbon resins) hydrocarbon resins) hydrocarbon resins) hydrocarbon resins)
Source: Industry data, KDB Daewoo Securities Research Source: KPIC, KDB Daewoo Securities Research
4
6
8
10
12
14
0
100
200
300
400
10 11 12 13 14 15F 16F
Revenue (L)
OP margin (R)
(Wbn) (%)
0
500
1,000
1,500
2,000
2,500
3,000
3,500
05 07 09 11 13 15
Hydrocarbon resins
Naphtha
(US$/tonne)
ExxonMobil28%
Eastman21%
Kolon Industries15%
Cray Valley11%
Other25%
Epoxy15%
Urethane12%
Thinner10%
Emulsion9%Acryl
6%
Hydrocarbon resins5%
Unsaturated polyesters
4%
Powder coating4%
Other35%
Kolon Industries
6
December 2, 2015
KDB Daewoo Securities Research
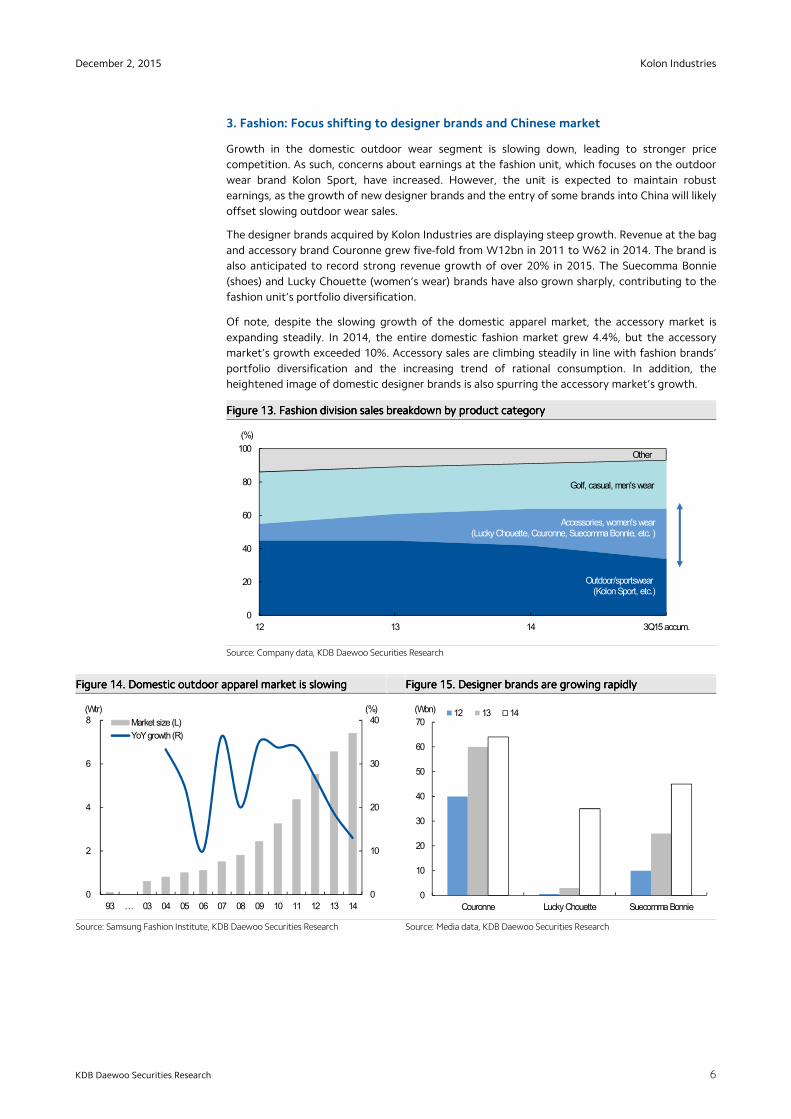
3. Fashion: Focus shifting to designer brands and Chinese market
Growth in the domestic outdoor wear segment is slowing down, leading to stronger price
competition. As such, concerns about earnings at the fashion unit, which focuses on the outdoor
wear brand Kolon Sport, have increased. However, the unit is expected to maintain robust
earnings, as the growth of new designer brands and the entry of some brands into China will likely
offset slowing outdoor wear sales.
The designer brands acquired by Kolon Industries are displaying steep growth. Revenue at the bag
and accessory brand Couronne grew five-fold from W12bn in 2011 to W62 in 2014. The brand is
also anticipated to record strong revenue growth of over 20% in 2015. The Suecomma Bonnie
(shoes) and Lucky Chouette (women’s wear) brands have also grown sharply, contributing to the
fashion unit’s portfolio diversification.
Of note, despite the slowing growth of the domestic apparel market, the accessory market is
expanding steadily. In 2014, the entire domestic fashion market grew 4.4%, but the accessory
market’s growth exceeded 10%. Accessory sales are climbing steadily in line with fashion brands’
portfolio diversification and the increasing trend of rational consumption. In addition, the
heightened image of domestic designer brands is also spurring the accessory market’s growth.
Figure Figure Figure Figure 13131313. . . . FFFFashion division sales breakdown by product ashion division sales breakdown by product ashion division sales breakdown by product ashion division sales breakdown by product categorycategorycategorycategory
Source: Company data, KDB Daewoo Securities Research
Figure Figure Figure Figure 14141414. . . . Domestic outdoor apparel market Domestic outdoor apparel market Domestic outdoor apparel market Domestic outdoor apparel market is is is is slowingslowingslowingslowing Figure Figure Figure Figure 15151515. . . . Designer brands Designer brands Designer brands Designer brands are are are are growgrowgrowgrowinginginging rapidlyrapidlyrapidlyrapidly
Source: Samsung Fashion Institute, KDB Daewoo Securities Research Source: Media data, KDB Daewoo Securities Research
0
20
40
60
80
100
12 13 14 3Q15 accum.
(%)
Other
Golf, casual, men'swear
Accessories, women's wear(Lucky Chouette, Couronne, Suecomma Bonnie, etc. )
Outdoor/sportswear(Kolon Sport, etc.)
0
10
20
30
40
0
2
4
6
8
93 B 03 04 05 06 07 08 09 10 11 12 13 14
Market size (L)
YoY growth (R)
(Wtr) (%)
0
10
20
30
40
50
60
70
Couronne Lucky Chouette Suecomma Bonnie
12 13 14(Wbn)
Kolon Industries
7
December 2, 2015
KDB Daewoo Securities Research
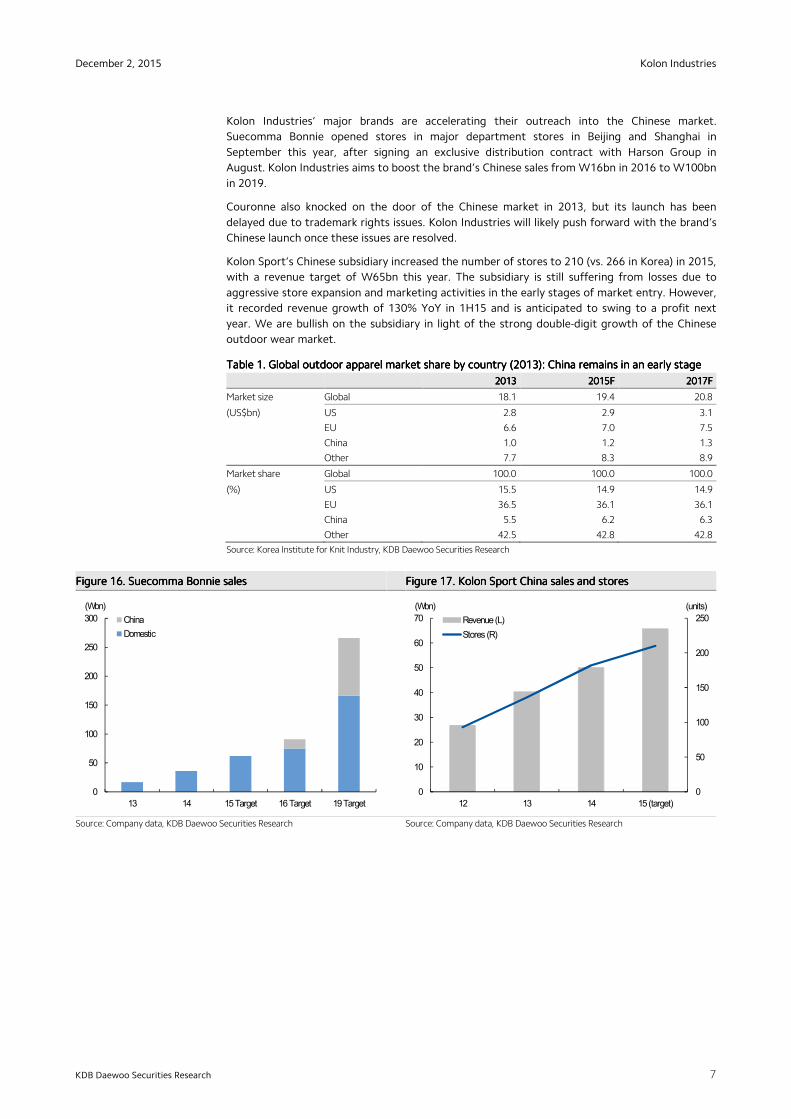
Kolon Industries’ major brands are accelerating their outreach into the Chinese market.
Suecomma Bonnie opened stores in major department stores in Beijing and Shanghai in
September this year, after signing an exclusive distribution contract with Harson Group in
August. Kolon Industries aims to boost the brand’s Chinese sales from W16bn in 2016 to W100bn
in 2019.
Couronne also knocked on the door of the Chinese market in 2013, but its launch has been
delayed due to trademark rights issues. Kolon Industries will likely push forward with the brand’s
Chinese launch once these issues are resolved.
Kolon Sport’s Chinese subsidiary increased the number of stores to 210 (vs. 266 in Korea) in 2015,
with a revenue target of W65bn this year. The subsidiary is still suffering from losses due to
aggressive store expansion and marketing activities in the early stages of market entry. However,
it recorded revenue growth of 130% YoY in 1H15 and is anticipated to swing to a profit next
year. We are bullish on the subsidiary in light of the strong double-digit growth of the Chinese
outdoor wear market.
TableTableTableTable 1111. . . . Global outdoor apparel market share by country Global outdoor apparel market share by country Global outdoor apparel market share by country Global outdoor apparel market share by country (2013): (2013): (2013): (2013): China China China China remains in anremains in anremains in anremains in an early stageearly stageearly stageearly stage
2013201320132013 2015F2015F2015F2015F 2017F2017F2017F2017F
Market size Global 18.1 19.4 20.8
(US$bn) US 2.8 2.9 3.1
EU 6.6 7.0 7.5
China 1.0 1.2 1.3
Other 7.7 8.3 8.9
Market share Global 100.0 100.0 100.0
(%) US 15.5 14.9 14.9
EU 36.5 36.1 36.1
China 5.5 6.2 6.3
Other 42.5 42.8 42.8
Source: Korea Institute for Knit Industry, KDB Daewoo Securities Research
Figure Figure Figure Figure 16161616. . . . Suecomma Bonnie salesSuecomma Bonnie salesSuecomma Bonnie salesSuecomma Bonnie sales Figure Figure Figure Figure 17171717. . . . Kolon Sport China sales and storeKolon Sport China sales and storeKolon Sport China sales and storeKolon Sport China sales and storessss
Source: Company data, KDB Daewoo Securities Research Source: Company data, KDB Daewoo Securities Research
0
50
100
150
200
250
300
13 14 15 Target 16 Target 19 Target
China
Domestic
(Wbn)
아웃도어
0
50
100
150
200
250
0
10
20
30
40
50
60
70
12 13 14 15 (target)
Revenue (L)
Stores (R)
(Wbn) (units)
Kolon Industries
8
December 2, 2015
KDB Daewoo Securities Research
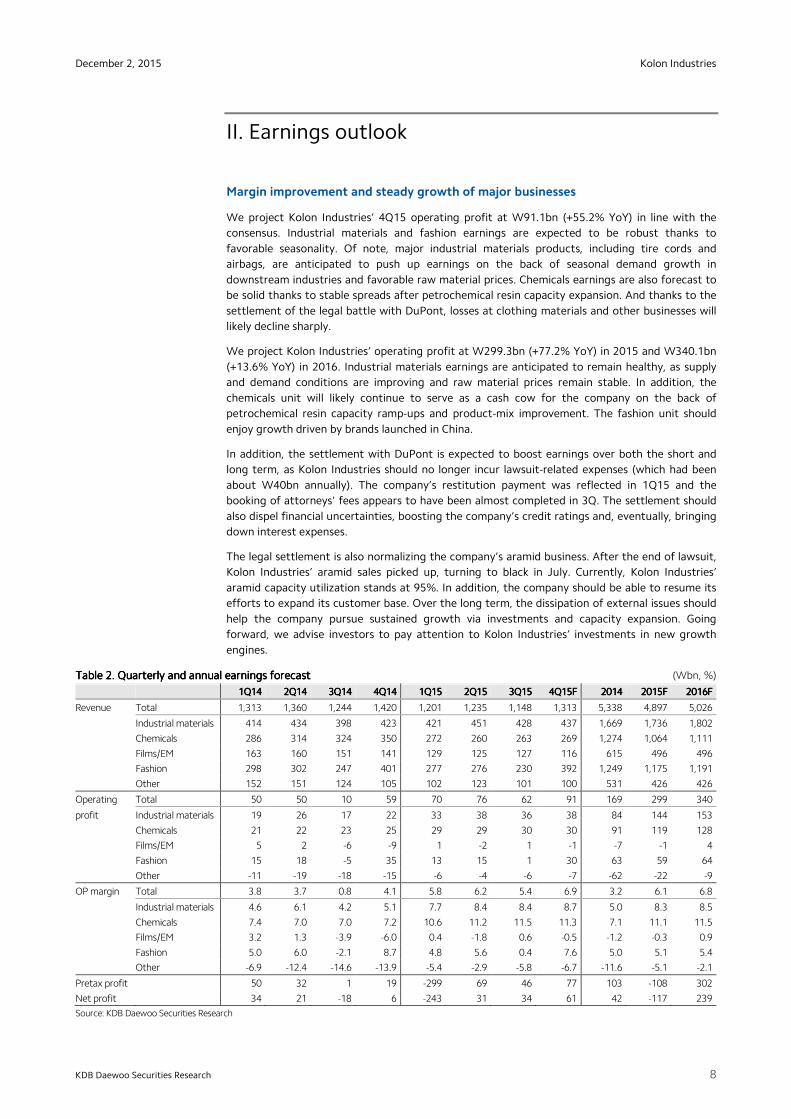
II. Earnings outlook
Margin improvement and steady growth of major businesses
We project Kolon Industries’ 4Q15 operating profit at W91.1bn (+55.2% YoY) in line with the
consensus. Industrial materials and fashion earnings are expected to be robust thanks to
favorable seasonality. Of note, major industrial materials products, including tire cords and
airbags, are anticipated to push up earnings on the back of seasonal demand growth in
downstream industries and favorable raw material prices. Chemicals earnings are also forecast to
be solid thanks to stable spreads after petrochemical resin capacity expansion. And thanks to the
settlement of the legal battle with DuPont, losses at clothing materials and other businesses will
likely decline sharply.
We project Kolon Industries’ operating profit at W299.3bn (+77.2% YoY) in 2015 and W340.1bn
(+13.6% YoY) in 2016. Industrial materials earnings are anticipated to remain healthy, as supply
and demand conditions are improving and raw material prices remain stable. In addition, the
chemicals unit will likely continue to serve as a cash cow for the company on the back of
petrochemical resin capacity ramp-ups and product-mix improvement. The fashion unit should
enjoy growth driven by brands launched in China.
In addition, the settlement with DuPont is expected to boost earnings over both the short and
long term, as Kolon Industries should no longer incur lawsuit-related expenses (which had been
about W40bn annually). The company’s restitution payment was reflected in 1Q15 and the
booking of attorneys' fees appears to have been almost completed in 3Q. The settlement should
also dispel financial uncertainties, boosting the company’s credit ratings and, eventually, bringing
down interest expenses.
The legal settlement is also normalizing the company’s aramid business. After the end of lawsuit,
Kolon Industries’ aramid sales picked up, turning to black in July. Currently, Kolon Industries’
aramid capacity utilization stands at 95%. In addition, the company should be able to resume its
efforts to expand its customer base. Over the long term, the dissipation of external issues should
help the company pursue sustained growth via investments and capacity expansion. Going
forward, we advise investors to pay attention to Kolon Industries’ investments in new growth
engines.
TableTableTableTable 2222. . . . Quarterly and annual earnings Quarterly and annual earnings Quarterly and annual earnings Quarterly and annual earnings forecastforecastforecastforecast (Wbn, %)
1Q141Q141Q141Q14 2Q142Q142Q142Q14 3Q143Q143Q143Q14 4Q144Q144Q144Q14 1Q151Q151Q151Q15 2Q152Q152Q152Q15 3Q153Q153Q153Q15 4Q15F4Q15F4Q15F4Q15F 2020202014141414 2020202015F15F15F15F 2020202016F16F16F16F
Revenue Total 1,313 1,360 1,244 1,420 1,201 1,235 1,148 1,313 5,338 4,897 5,026
Industrial materials 414 434 398 423 421 451 428 437 1,669 1,736 1,802
Chemicals 286 314 324 350 272 260 263 269 1,274 1,064 1,111
Films/EM 163 160 151 141 129 125 127 116 615 496 496
Fashion 298 302 247 401 277 276 230 392 1,249 1,175 1,191
Other 152 151 124 105 102 123 101 100 531 426 426
Operating Total 50 50 10 59 70 76 62 91 169 299 340
profit Industrial materials 19 26 17 22 33 38 36 38 84 144 153
Chemicals 21 22 23 25 29 29 30 30 91 119 128
Films/EM 5 2 -6 -9 1 -2 1 -1 -7 -1 4
Fashion 15 18 -5 35 13 15 1 30 63 59 64
Other -11 -19 -18 -15 -6 -4 -6 -7 -62 -22 -9
OP margin Total 3.8 3.7 0.8 4.1 5.8 6.2 5.4 6.9 3.2 6.1 6.8
Industrial materials 4.6 6.1 4.2 5.1 7.7 8.4 8.4 8.7 5.0 8.3 8.5
Chemicals 7.4 7.0 7.0 7.2 10.6 11.2 11.5 11.3 7.1 11.1 11.5
Films/EM 3.2 1.3 -3.9 -6.0 0.4 -1.8 0.6 -0.5 -1.2 -0.3 0.9
Fashion 5.0 6.0 -2.1 8.7 4.8 5.6 0.4 7.6 5.0 5.1 5.4
Other -6.9 -12.4 -14.6 -13.9 -5.4 -2.9 -5.8 -6.7 -11.6 -5.1 -2.1
Pretax profit 50 32 1 19 -299 69 46 77 103 -108 302
Net profit 34 21 -18 6 -243 31 34 61 42 -117 239
Source: KDB Daewoo Securities Research
Kolon Industries
9
December 2, 2015
KDB Daewoo Securities Research
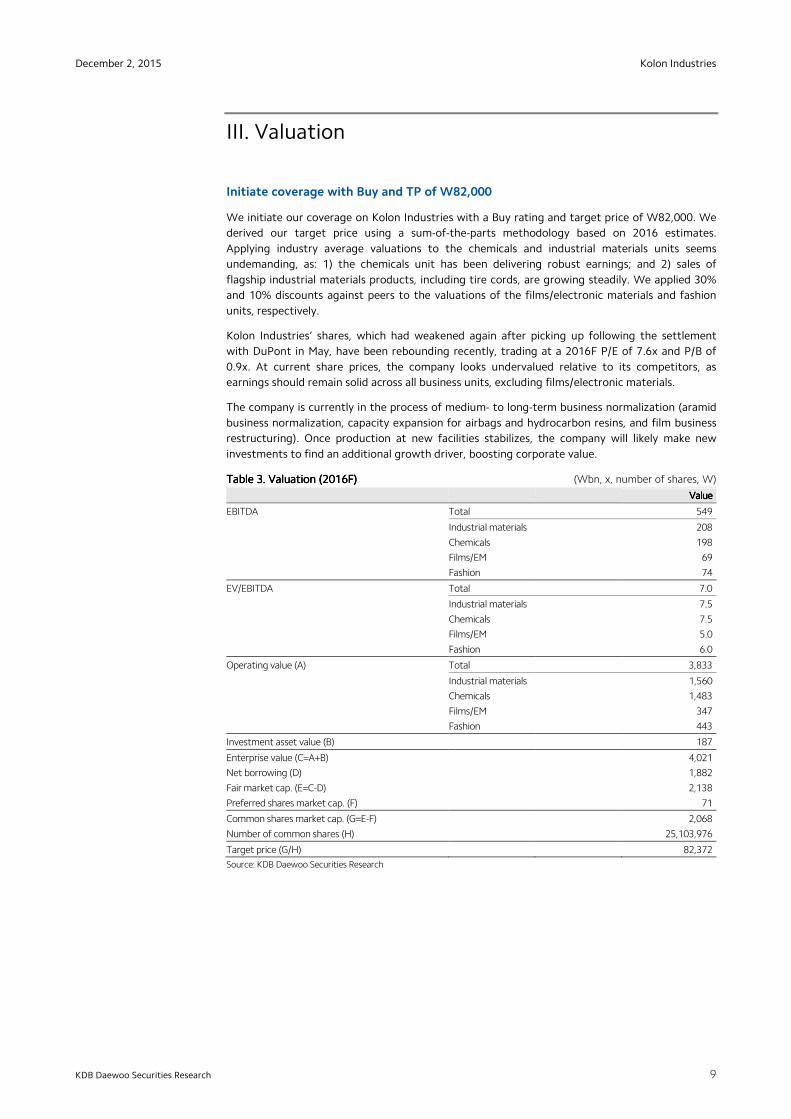
III. Valuation
Initiate coverage with Buy and TP of W82,000
We initiate our coverage on Kolon Industries with a Buy rating and target price of W82,000. We
derived our target price using a sum-of-the-parts methodology based on 2016 estimates.
Applying industry average valuations to the chemicals and industrial materials units seems
undemanding, as: 1) the chemicals unit has been delivering robust earnings; and 2) sales of
flagship industrial materials products, including tire cords, are growing steadily. We applied 30%
and 10% discounts against peers to the valuations of the films/electronic materials and fashion
units, respectively.
Kolon Industries’ shares, which had weakened again after picking up following the settlement
with DuPont in May, have been rebounding recently, trading at a 2016F P/E of 7.6x and P/B of
0.9x. At current share prices, the company looks undervalued relative to its competitors, as
earnings should remain solid across all business units, excluding films/electronic materials.
The company is currently in the process of medium- to long-term business normalization (aramid
business normalization, capacity expansion for airbags and hydrocarbon resins, and film business
restructuring). Once production at new facilities stabilizes, the company will likely make new
investments to find an additional growth driver, boosting corporate value.
TableTableTableTable 3333. . . . Valuation (2016F)Valuation (2016F)Valuation (2016F)Valuation (2016F) (Wbn, x, number of shares, W)
ValueValueValueValue
EBITDA Total
549
Industrial materials
208
Chemicals
198
Films/EM
69
Fashion
74
EV/EBITDA Total
7.0
Industrial materials
7.5
Chemicals
7.5
Films/EM
5.0
Fashion
6.0
Operating value (A) Total
3,833
Industrial materials
1,560
Chemicals
1,483
Films/EM
347
Fashion
443
Investment asset value (B)
187
Enterprise value (C=A+B)
4,021
Net borrowing (D)
1,882
Fair market cap. (E=C-D)
2,138
Preferred shares market cap. (F)
71
Common shares market cap. (G=E-F)
2,068
Number of common shares (H)
25,103,976
Target price (G/H)
82,372
Source: KDB Daewoo Securities Research
Kolon Industries
10
December 2, 2015
KDB Daewoo Securities Research
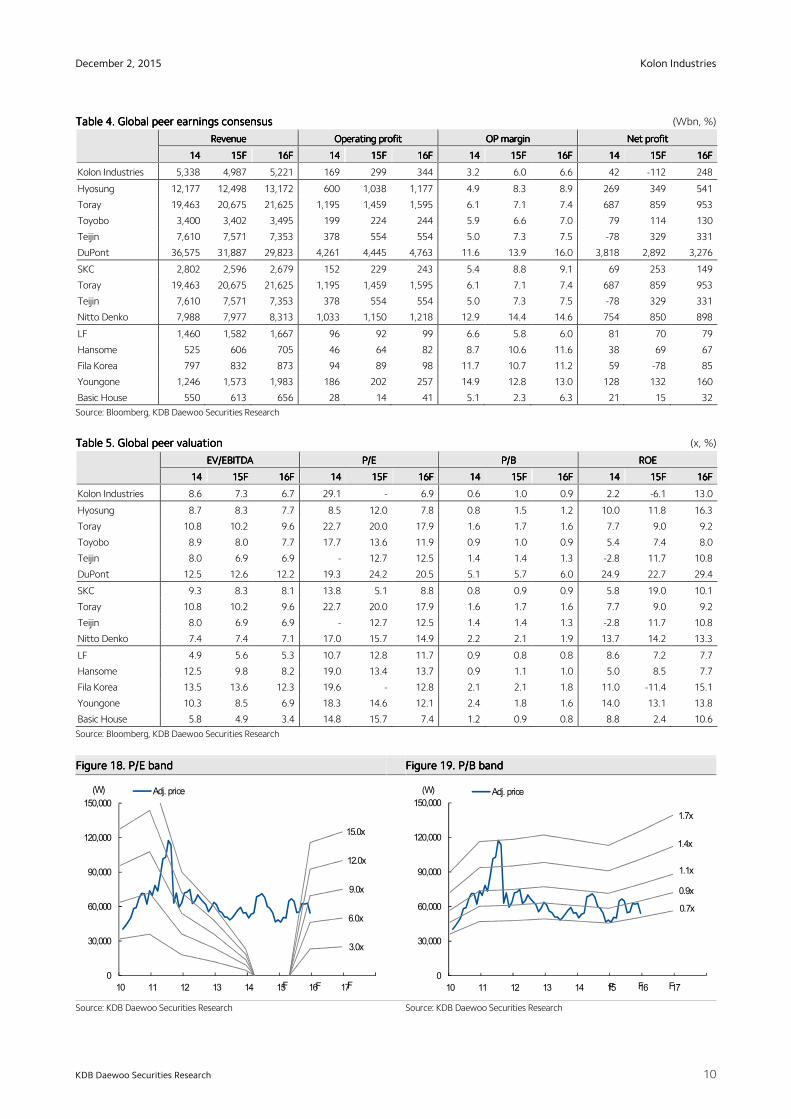
TableTableTableTable 4444. . . . Global peer earnings consensusGlobal peer earnings consensusGlobal peer earnings consensusGlobal peer earnings consensus (Wbn, %)
RevenueRevenueRevenueRevenue Operating profitOperating profitOperating profitOperating profit OP marginOP marginOP marginOP margin Net profitNet profitNet profitNet profit
14141414 15F15F15F15F 16F16F16F16F 14141414 15F15F15F15F 16F16F16F16F 14141414 15F15F15F15F 16F16F16F16F 14141414 15F15F15F15F 16F16F16F16F
Kolon Industries 5,338 4,987 5,221 169 299 344 3.2 6.0 6.6 42 -112 248
Hyosung 12,177 12,498 13,172 600 1,038 1,177 4.9 8.3 8.9 269 349 541
Toray 19,463 20,675 21,625 1,195 1,459 1,595 6.1 7.1 7.4 687 859 953
Toyobo 3,400 3,402 3,495 199 224 244 5.9 6.6 7.0 79 114 130
Teijin 7,610 7,571 7,353 378 554 554 5.0 7.3 7.5 -78 329 331
DuPont 36,575 31,887 29,823 4,261 4,445 4,763 11.6 13.9 16.0 3,818 2,892 3,276
SKC 2,802 2,596 2,679 152 229 243 5.4 8.8 9.1 69 253 149
Toray 19,463 20,675 21,625 1,195 1,459 1,595 6.1 7.1 7.4 687 859 953
Teijin 7,610 7,571 7,353 378 554 554 5.0 7.3 7.5 -78 329 331
Nitto Denko 7,988 7,977 8,313 1,033 1,150 1,218 12.9 14.4 14.6 754 850 898
LF 1,460 1,582 1,667 96 92 99 6.6 5.8 6.0 81 70 79
Hansome 525 606 705 46 64 82 8.7 10.6 11.6 38 69 67
Fila Korea 797 832 873 94 89 98 11.7 10.7 11.2 59 -78 85
Youngone 1,246 1,573 1,983 186 202 257 14.9 12.8 13.0 128 132 160
Basic House 550 613 656 28 14 41 5.1 2.3 6.3 21 15 32
Source: Bloomberg, KDB Daewoo Securities Research
TableTableTableTable 5555. . . . Global peer valuationGlobal peer valuationGlobal peer valuationGlobal peer valuation (x, %)
EV/EBITDAEV/EBITDAEV/EBITDAEV/EBITDA P/EP/EP/EP/E P/BP/BP/BP/B ROEROEROEROE
14141414 15F15F15F15F 16F16F16F16F 14141414 15F15F15F15F 16F16F16F16F 14141414 15F15F15F15F 16F16F16F16F 14141414 15F15F15F15F 16F16F16F16F
Kolon Industries 8.6 7.3 6.7 29.1 - 6.9 0.6 1.0 0.9 2.2 -6.1 13.0
Hyosung 8.7 8.3 7.7 8.5 12.0 7.8 0.8 1.5 1.2 10.0 11.8 16.3
Toray 10.8 10.2 9.6 22.7 20.0 17.9 1.6 1.7 1.6 7.7 9.0 9.2
Toyobo 8.9 8.0 7.7 17.7 13.6 11.9 0.9 1.0 0.9 5.4 7.4 8.0
Teijin 8.0 6.9 6.9 - 12.7 12.5 1.4 1.4 1.3 -2.8 11.7 10.8
DuPont 12.5 12.6 12.2 19.3 24.2 20.5 5.1 5.7 6.0 24.9 22.7 29.4
SKC 9.3 8.3 8.1 13.8 5.1 8.8 0.8 0.9 0.9 5.8 19.0 10.1
Toray 10.8 10.2 9.6 22.7 20.0 17.9 1.6 1.7 1.6 7.7 9.0 9.2
Teijin 8.0 6.9 6.9 - 12.7 12.5 1.4 1.4 1.3 -2.8 11.7 10.8
Nitto Denko 7.4 7.4 7.1 17.0 15.7 14.9 2.2 2.1 1.9 13.7 14.2 13.3
LF 4.9 5.6 5.3 10.7 12.8 11.7 0.9 0.8 0.8 8.6 7.2 7.7
Hansome 12.5 9.8 8.2 19.0 13.4 13.7 0.9 1.1 1.0 5.0 8.5 7.7
Fila Korea 13.5 13.6 12.3 19.6 - 12.8 2.1 2.1 1.8 11.0 -11.4 15.1
Youngone 10.3 8.5 6.9 18.3 14.6 12.1 2.4 1.8 1.6 14.0 13.1 13.8
Basic House 5.8 4.9 3.4 14.8 15.7 7.4 1.2 0.9 0.8 8.8 2.4 10.6
Source: Bloomberg, KDB Daewoo Securities Research
Figure Figure Figure Figure 18181818. . . . P/E bandP/E bandP/E bandP/E band Figure Figure Figure Figure 19191919. . . . P/B bandP/B bandP/B bandP/B band
Source: KDB Daewoo Securities Research Source: KDB Daewoo Securities Research
0
30,000
60,000
90,000
120,000
150,000
10 11 12 13 14 15 16 17
(W) Adj. price
3.0x
6.0x
15.0x
12.0x
9.0x
F FF0
30,000
60,000
90,000
120,000
150,000
10 11 12 13 14 15 16 17
(W) Adj. price
1.7x
1.4x
1.1x
0.9x
0.7x
FFF
Kolon Industries
11
December 2, 2015
KDB Daewoo Securities Research
IV. Risks
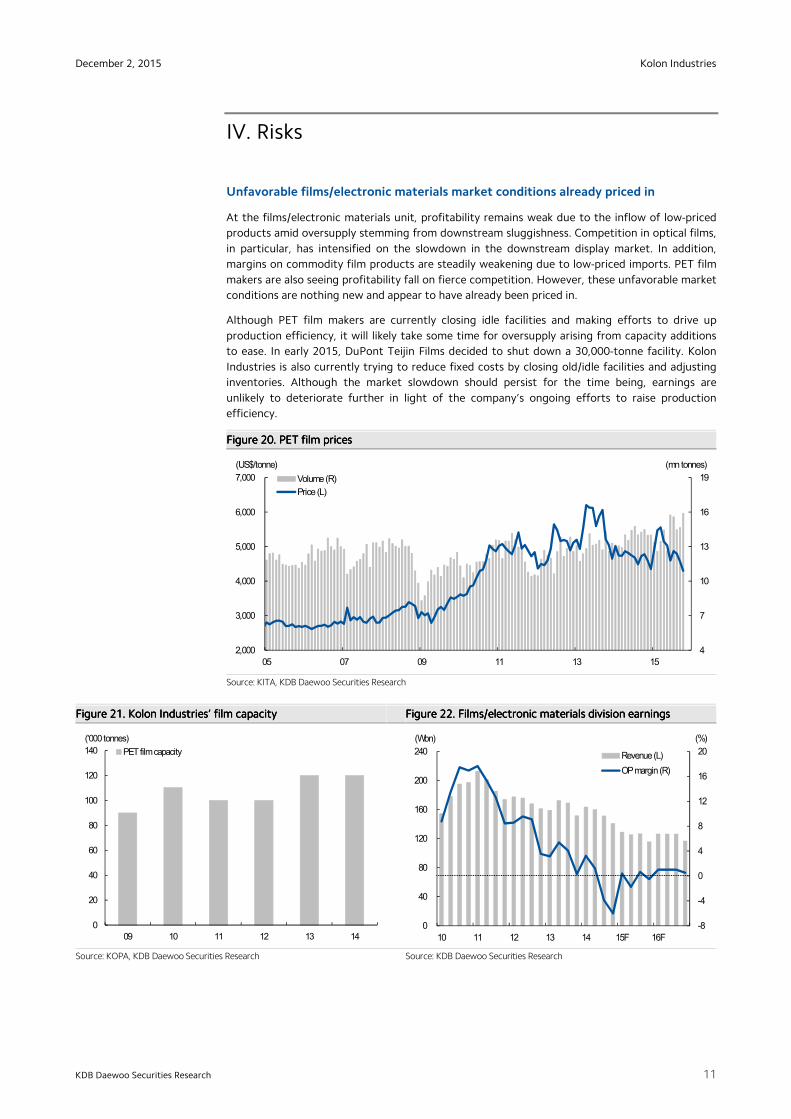
Unfavorable films/electronic materials market conditions already priced in
At the films/electronic materials unit, profitability remains weak due to the inflow of low-priced
products amid oversupply stemming from downstream sluggishness. Competition in optical films,
in particular, has intensified on the slowdown in the downstream display market. In addition,
margins on commodity film products are steadily weakening due to low-priced imports. PET film
makers are also seeing profitability fall on fierce competition. However, these unfavorable market
conditions are nothing new and appear to have already been priced in.
Although PET film makers are currently closing idle facilities and making efforts to drive up
production efficiency, it will likely take some time for oversupply arising from capacity additions
to ease. In early 2015, DuPont Teijin Films decided to shut down a 30,000-tonne facility. Kolon
Industries is also currently trying to reduce fixed costs by closing old/idle facilities and adjusting
inventories. Although the market slowdown should persist for the time being, earnings are
unlikely to deteriorate further in light of the company’s ongoing efforts to raise production
efficiency.
Figure Figure Figure Figure 20202020. . . . PET film pricesPET film pricesPET film pricesPET film prices
Source: KITA, KDB Daewoo Securities Research
Figure Figure Figure Figure 21212121. . . . Kolon Kolon Kolon Kolon IndustriesIndustriesIndustriesIndustries’’’’ film capacityfilm capacityfilm capacityfilm capacity Figure Figure Figure Figure 22222222. . . . FilmFilmFilmFilmssss////electronic materials division electronic materials division electronic materials division electronic materials division earningsearningsearningsearnings
Source: KOPA, KDB Daewoo Securities Research Source: KDB Daewoo Securities Research
4
7
10
13
16
19
2,000
3,000
4,000
5,000
6,000
7,000
05 07 09 11 13 15
Volume (R)
Price (L)
(US$/tonne) (mn tonnes)
0
20
40
60
80
100
120
140
09 10 11 12 13 14
PET film capacity
('000 tonnes)
-8
-4
0
4
8
12
16
20
0
40
80
120
160
200
240
10 11 12 13 14 15F 16F
Revenue (L)
OP margin (R)
(Wbn) (%)
Kolon Industries
12
December 2, 2015
KDB Daewoo Securities Research
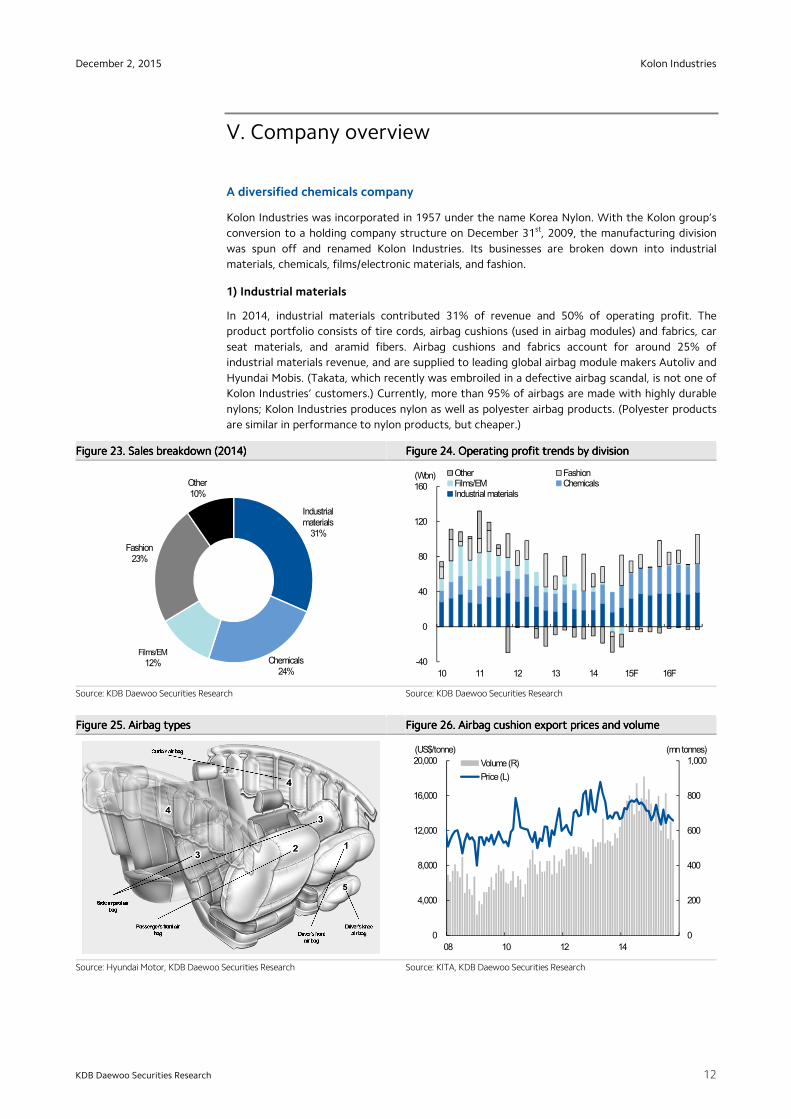
V. Company overview
A diversified chemicals company
Kolon Industries was incorporated in 1957 under the name Korea Nylon. With the Kolon group’s
conversion to a holding company structure on December 31st, 2009, the manufacturing division
was spun off and renamed Kolon Industries. Its businesses are broken down into industrial
materials, chemicals, films/electronic materials, and fashion.
1) Industrial materials
In 2014, industrial materials contributed 31% of revenue and 50% of operating profit. The
product portfolio consists of tire cords, airbag cushions (used in airbag modules) and fabrics, car
seat materials, and aramid fibers. Airbag cushions and fabrics account for around 25% of
industrial materials revenue, and are supplied to leading global airbag module makers Autoliv and
Hyundai Mobis. (Takata, which recently was embroiled in a defective airbag scandal, is not one of
Kolon Industries’ customers.) Currently, more than 95% of airbags are made with highly durable
nylons; Kolon Industries produces nylon as well as polyester airbag products. (Polyester products
are similar in performance to nylon products, but cheaper.)
Figure Figure Figure Figure 23232323. . . . Sales breakdown (2014)Sales breakdown (2014)Sales breakdown (2014)Sales breakdown (2014) Figure Figure Figure Figure 24242424. . . . Operating profit trends by divisionOperating profit trends by divisionOperating profit trends by divisionOperating profit trends by division
Source: KDB Daewoo Securities Research Source: KDB Daewoo Securities Research
Figure Figure Figure Figure 25252525. . . . Airbag typeAirbag typeAirbag typeAirbag typessss Figure Figure Figure Figure 26262626. . . . Airbag cushion export prices and volumeAirbag cushion export prices and volumeAirbag cushion export prices and volumeAirbag cushion export prices and volume
Source: Hyundai Motor, KDB Daewoo Securities Research Source: KITA, KDB Daewoo Securities Research
Industrial materials
31%
Chemicals24%
Films/EM
12%
Fashion23%
Other10%
-40
0
40
80
120
160
10 11 12 13 14 15F 16F
Other FashionFilms/EM ChemicalsIndustrial materials
(Wbn)
0
200
400
600
800
1,000
0
4,000
8,000
12,000
16,000
20,000
08 10 12 14
Volume (R)
Price (L)
(US$/tonne) (mn tonnes)
Kolon Industries
13
December 2, 2015
KDB Daewoo Securities Research
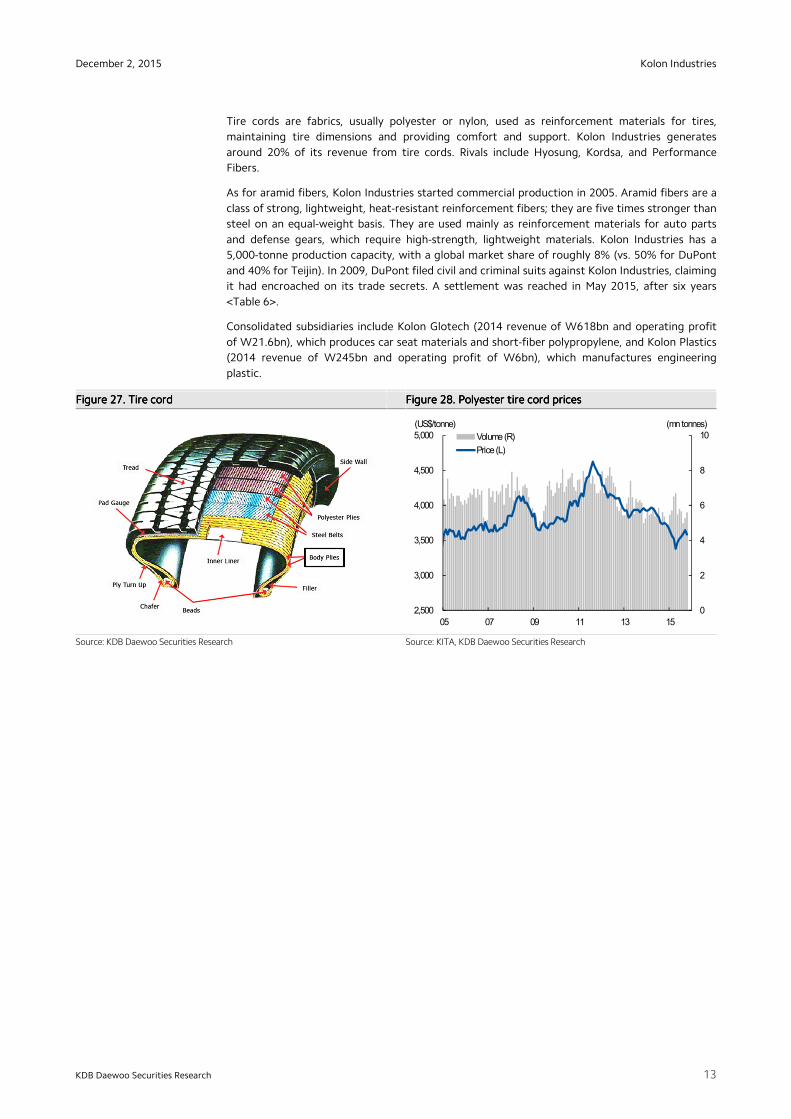
Tire cords are fabrics, usually polyester or nylon, used as reinforcement materials for tires,
maintaining tire dimensions and providing comfort and support. Kolon Industries generates
around 20% of its revenue from tire cords. Rivals include Hyosung, Kordsa, and Performance
Fibers.
As for aramid fibers, Kolon Industries started commercial production in 2005. Aramid fibers are a
class of strong, lightweight, heat-resistant reinforcement fibers; they are five times stronger than
steel on an equal-weight basis. They are used mainly as reinforcement materials for auto parts
and defense gears, which require high-strength, lightweight materials. Kolon Industries has a
5,000-tonne production capacity, with a global market share of roughly 8% (vs. 50% for DuPont
and 40% for Teijin). In 2009, DuPont filed civil and criminal suits against Kolon Industries, claiming
it had encroached on its trade secrets. A settlement was reached in May 2015, after six years
<Table 6>.
Consolidated subsidiaries include Kolon Glotech (2014 revenue of W618bn and operating profit
of W21.6bn), which produces car seat materials and short-fiber polypropylene, and Kolon Plastics
(2014 revenue of W245bn and operating profit of W6bn), which manufactures engineering
plastic.
Figure Figure Figure Figure 27272727. . . . Tire cordTire cordTire cordTire cord Figure Figure Figure Figure 28282828. . . . Polyester tirePolyester tirePolyester tirePolyester tire cord pricescord pricescord pricescord prices
Source: KDB Daewoo Securities Research Source: KITA, KDB Daewoo Securities Research
0
2
4
6
8
10
2,500
3,000
3,500
4,000
4,500
5,000
05 07 09 11 13 15
Volume (R)
Price (L)
(US$/tonne) (mn tonnes)
Kolon Industries
14
December 2, 2015
KDB Daewoo Securities Research
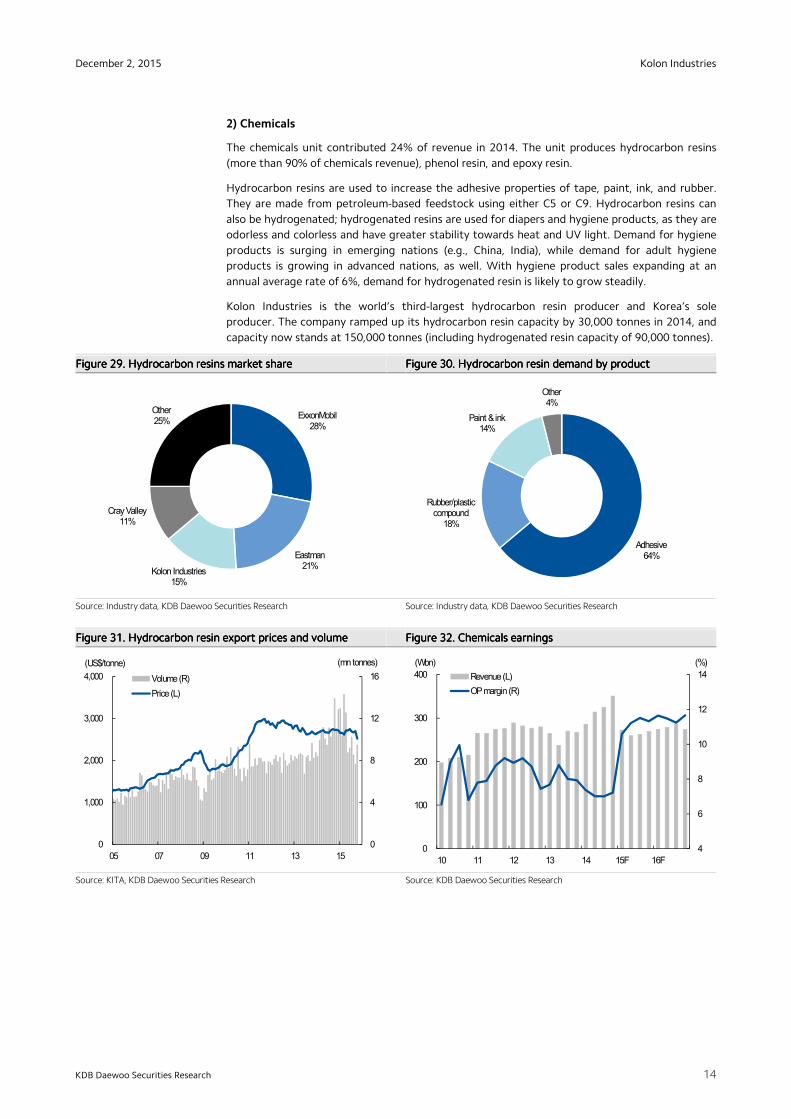
2) Chemicals
The chemicals unit contributed 24% of revenue in 2014. The unit produces hydrocarbon resins
(more than 90% of chemicals revenue), phenol resin, and epoxy resin.
Hydrocarbon resins are used to increase the adhesive properties of tape, paint, ink, and rubber.
They are made from petroleum-based feedstock using either C5 or C9. Hydrocarbon resins can
also be hydrogenated; hydrogenated resins are used for diapers and hygiene products, as they are
odorless and colorless and have greater stability towards heat and UV light. Demand for hygiene
products is surging in emerging nations (e.g., China, India), while demand for adult hygiene
products is growing in advanced nations, as well. With hygiene product sales expanding at an
annual average rate of 6%, demand for hydrogenated resin is likely to grow steadily.
Kolon Industries is the world’s third-largest hydrocarbon resin producer and Korea’s sole
producer. The company ramped up its hydrocarbon resin capacity by 30,000 tonnes in 2014, and
capacity now stands at 150,000 tonnes (including hydrogenated resin capacity of 90,000 tonnes).
Figure Figure Figure Figure 29292929. . . . Hydrocarbon resins market shareHydrocarbon resins market shareHydrocarbon resins market shareHydrocarbon resins market share Figure Figure Figure Figure 30303030. . . . Hydrocarbon resin demand by productHydrocarbon resin demand by productHydrocarbon resin demand by productHydrocarbon resin demand by product
Source: Industry data, KDB Daewoo Securities Research Source: Industry data, KDB Daewoo Securities Research
Figure Figure Figure Figure 31313131. . . . Hydrocarbon Hydrocarbon Hydrocarbon Hydrocarbon resin export prices and volumeresin export prices and volumeresin export prices and volumeresin export prices and volume Figure Figure Figure Figure 32323232. . . . Chemicals Chemicals Chemicals Chemicals earningsearningsearningsearnings
Source: KITA, KDB Daewoo Securities Research Source: KDB Daewoo Securities Research
ExxonMobil28%
Eastman21%
Kolon Industries15%
Cray Valley11%
Other25%
Adhesive64%
Rubber/plastic compound
18%
Paint & ink14%
Other4%
4
6
8
10
12
14
0
100
200
300
400
10 11 12 13 14 15F 16F
Revenue (L)
OP margin (R)
(Wbn) (%)
0
4
8
12
16
0
1,000
2,000
3,000
4,000
05 07 09 11 13 15
Volume (R)
Price (L)
(US$/tonne) (mn tonnes)
Kolon Industries
15
December 2, 2015
KDB Daewoo Securities Research
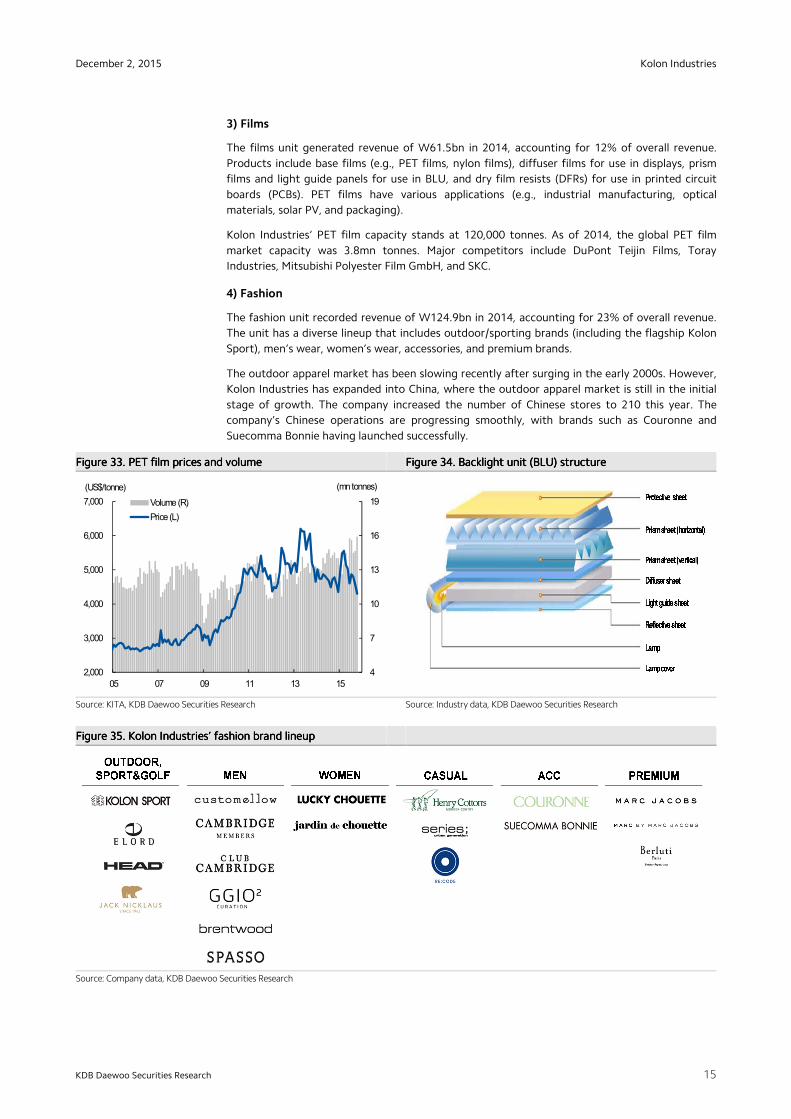
3) Films
The films unit generated revenue of W61.5bn in 2014, accounting for 12% of overall revenue.
Products include base films (e.g., PET films, nylon films), diffuser films for use in displays, prism
films and light guide panels for use in BLU, and dry film resists (DFRs) for use in printed circuit
boards (PCBs). PET films have various applications (e.g., industrial manufacturing, optical
materials, solar PV, and packaging).
Kolon Industries’ PET film capacity stands at 120,000 tonnes. As of 2014, the global PET film
market capacity was 3.8mn tonnes. Major competitors include DuPont Teijin Films, Toray
Industries, Mitsubishi Polyester Film GmbH, and SKC.
4) Fashion
The fashion unit recorded revenue of W124.9bn in 2014, accounting for 23% of overall revenue.
The unit has a diverse lineup that includes outdoor/sporting brands (including the flagship Kolon
Sport), men’s wear, women’s wear, accessories, and premium brands.
The outdoor apparel market has been slowing recently after surging in the early 2000s. However,
Kolon Industries has expanded into China, where the outdoor apparel market is still in the initial
stage of growth. The company increased the number of Chinese stores to 210 this year. The
company’s Chinese operations are progressing smoothly, with brands such as Couronne and
Suecomma Bonnie having launched successfully.
Figure Figure Figure Figure 33333333. . . . PET film prices and volumePET film prices and volumePET film prices and volumePET film prices and volume Figure Figure Figure Figure 34343434. . . . Backlight unit (BLU) structureBacklight unit (BLU) structureBacklight unit (BLU) structureBacklight unit (BLU) structure
Source: KITA, KDB Daewoo Securities Research Source: Industry data, KDB Daewoo Securities Research
Figure Figure Figure Figure 35353535. . . . Kolon IndustriesKolon IndustriesKolon IndustriesKolon Industries’’’’ ffffashion brand lineupashion brand lineupashion brand lineupashion brand lineup
Source: Company data, KDB Daewoo Securities Research
4
7
10
13
16
19
2,000
3,000
4,000
5,000
6,000
7,000
05 07 09 11 13 15
Volume (R)
Price (L)
(US$/tonne) (mn tonnes)
Kolon Industries
16
December 2, 2015
KDB Daewoo Securities Research
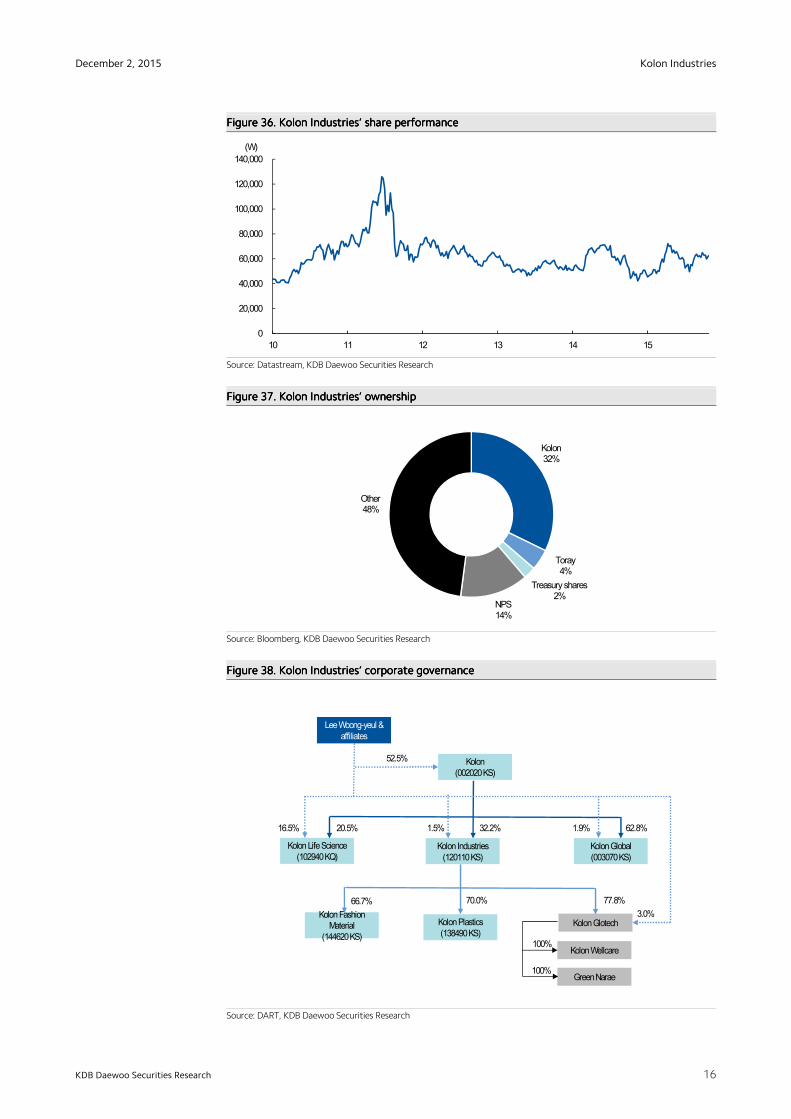
Figure Figure Figure Figure 36363636. . . . Kolon IndustriesKolon IndustriesKolon IndustriesKolon Industries’’’’ share performanceshare performanceshare performanceshare performance
Source: Datastream, KDB Daewoo Securities Research
Figure Figure Figure Figure 37373737. . . . Kolon IndustriesKolon IndustriesKolon IndustriesKolon Industries’’’’ ownershipownershipownershipownership
Source: Bloomberg, KDB Daewoo Securities Research
Figure Figure Figure Figure 38383838. . . . KolonKolonKolonKolon Industries’Industries’Industries’Industries’ corporate governancecorporate governancecorporate governancecorporate governance
Source: DART, KDB Daewoo Securities Research
0
20,000
40,000
60,000
80,000
100,000
120,000
140,000
10 11 12 13 14 15
(W)
Kolon32%
Toray4%
Treasury shares2%
NPS14%
Other48%
KolonPlastics(138490 KS)
Kolon Fashion Material
(144620 KS)
Lee Woong-yeul & affiliates
KolonGlotech
Green Narae
KolonWellcare
Kolon(002020 KS)
KolonGlobal(003070 KS)
Kolon Life Science(102940 KQ)
52.5%
1.5% 1.9%
3.0%
16.5% 32.2% 62.8% 20.5%
77.8% 70.0% 66.7%
100%
100%
Kolon Industries(120110 KS)
Kolon Industries
17
December 2, 2015
KDB Daewoo Securities Research
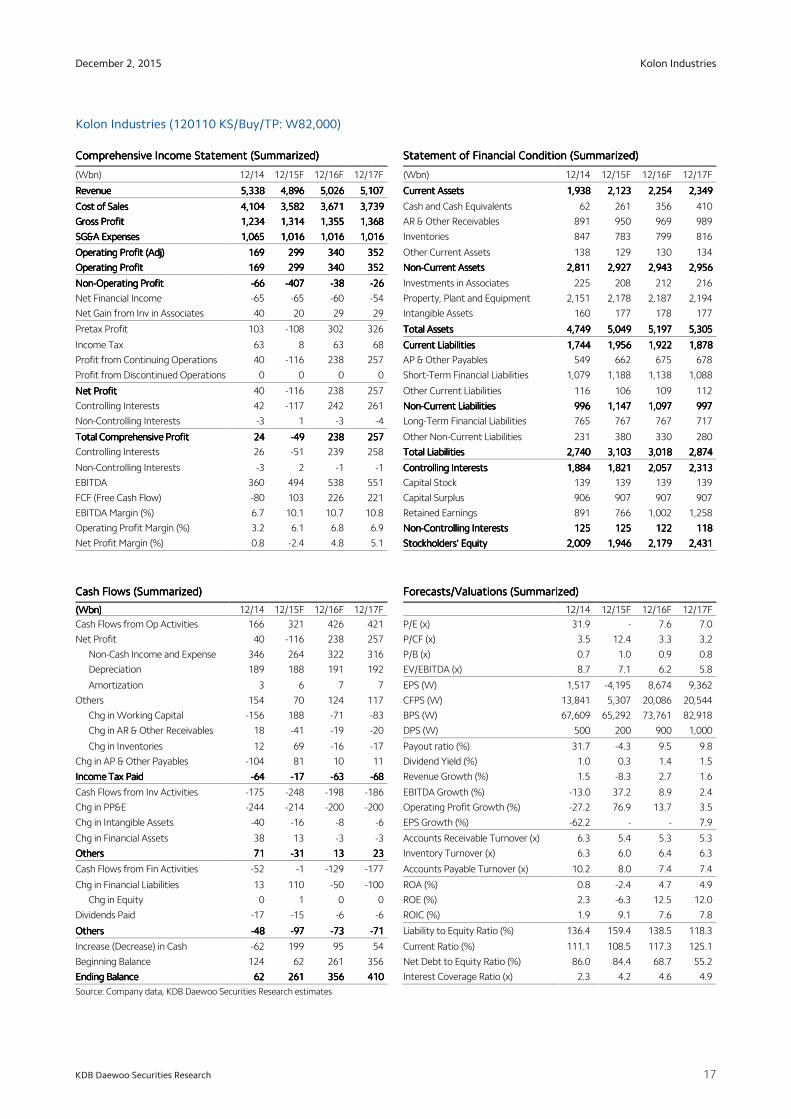
Kolon Industries (120110 KS/Buy/TP: W82,000)
Comprehensive Income Statement (Summarized)Comprehensive Income Statement (Summarized)Comprehensive Income Statement (Summarized)Comprehensive Income Statement (Summarized) Statement of Financial Condition (Summarized)Statement of Financial Condition (Summarized)Statement of Financial Condition (Summarized)Statement of Financial Condition (Summarized)
(Wbn) 12/14 12/15F 12/16F 12/17F (Wbn) 12/14 12/15F 12/16F 12/17F
RevenueRevenueRevenueRevenue 5,3385,3385,3385,338 4,8964,8964,8964,896 5,0265,0265,0265,026 5,1075,1075,1075,107 Current AssetsCurrent AssetsCurrent AssetsCurrent Assets 1,9381,9381,9381,938 2,1232,1232,1232,123 2,2542,2542,2542,254 2,3492,3492,3492,349
Cost of SalesCost of SalesCost of SalesCost of Sales 4,1044,1044,1044,104 3,5823,5823,5823,582 3,6713,6713,6713,671 3,7393,7393,7393,739 Cash and Cash Equivalents 62 261 356 410
Gross ProfitGross ProfitGross ProfitGross Profit 1,2341,2341,2341,234 1,3141,3141,3141,314 1,3551,3551,3551,355 1,3681,3681,3681,368 AR & Other Receivables 891 950 969 989
SG&A ExpensesSG&A ExpensesSG&A ExpensesSG&A Expenses 1,0651,0651,0651,065 1,0161,0161,0161,016 1,0161,0161,0161,016 1,0161,0161,0161,016 Inventories 847 783 799 816
Operating Profit (Adj)Operating Profit (Adj)Operating Profit (Adj)Operating Profit (Adj) 169169169169 299299299299 340340340340 352352352352 Other Current Assets 138 129 130 134
Operating ProfitOperating ProfitOperating ProfitOperating Profit 169169169169 299299299299 340340340340 352352352352 NonNonNonNon----Current AssetsCurrent AssetsCurrent AssetsCurrent Assets 2,8112,8112,8112,811 2,9272,9272,9272,927 2,9432,9432,9432,943 2,9562,9562,9562,956
NonNonNonNon----Operating ProfitOperating ProfitOperating ProfitOperating Profit ----66666666 ----407407407407 ----38383838 ----26262626 Investments in Associates 225 208 212 216
Net Financial Income -65 -65 -60 -54 Property, Plant and Equipment 2,151 2,178 2,187 2,194
Net Gain from Inv in Associates 40 20 29 29 Intangible Assets 160 177 178 177
Pretax Profit 103 -108 302 326 Total AssetsTotal AssetsTotal AssetsTotal Assets 4,7494,7494,7494,749 5,0495,0495,0495,049 5,1975,1975,1975,197 5,3055,3055,3055,305
Income Tax 63 8 63 68 Current LiabilitiesCurrent LiabilitiesCurrent LiabilitiesCurrent Liabilities 1,7441,7441,7441,744 1,9561,9561,9561,956 1,9221,9221,9221,922 1,8781,8781,8781,878
Profit from Continuing Operations 40 -116 238 257 AP & Other Payables 549 662 675 678
Profit from Discontinued Operations 0 0 0 0 Short-Term Financial Liabilities 1,079 1,188 1,138 1,088
Net ProfitNet ProfitNet ProfitNet Profit 40 -116 238 257 Other Current Liabilities 116 106 109 112
Controlling Interests 42 -117 242 261 NonNonNonNon----Current LiabilitiesCurrent LiabilitiesCurrent LiabilitiesCurrent Liabilities 996996996996 1,1471,1471,1471,147 1,0971,0971,0971,097 997997997997
Non-Controlling Interests -3 1 -3 -4 Long-Term Financial Liabilities 765 767 767 717
Total Comprehensive ProfitTotal Comprehensive ProfitTotal Comprehensive ProfitTotal Comprehensive Profit 24242424 ----49494949 238238238238 257257257257 Other Non-Current Liabilities 231 380 330 280
Controlling Interests 26 -51 239 258 Total LiabilitiesTotal LiabilitiesTotal LiabilitiesTotal Liabilities 2,7402,7402,7402,740 3,1033,1033,1033,103 3,0183,0183,0183,018 2,8742,8742,8742,874
Non-Controlling Interests -3 2 -1 -1 Controlling InterestsControlling InterestsControlling InterestsControlling Interests 1,8841,8841,8841,884 1,8211,8211,8211,821 2,0572,0572,0572,057 2,3132,3132,3132,313
EBITDA 360 494 538 551 Capital Stock 139 139 139 139
FCF (Free Cash Flow) -80 103 226 221 Capital Surplus 906 907 907 907
EBITDA Margin (%) 6.7 10.1 10.7 10.8 Retained Earnings 891 766 1,002 1,258
Operating Profit Margin (%) 3.2 6.1 6.8 6.9 NonNonNonNon----Controlling InterestsControlling InterestsControlling InterestsControlling Interests 125125125125 125125125125 122122122122 118118118118
Net Profit Margin (%) 0.8 -2.4 4.8 5.1 Stockholders' EquityStockholders' EquityStockholders' EquityStockholders' Equity 2,0092,0092,0092,009 1,9461,9461,9461,946 2,1792,1792,1792,179 2,4312,4312,4312,431
Cash Flows (Summarized)Cash Flows (Summarized)Cash Flows (Summarized)Cash Flows (Summarized) Forecasts/Valuations (Summarized)Forecasts/Valuations (Summarized)Forecasts/Valuations (Summarized)Forecasts/Valuations (Summarized)
(Wbn)(Wbn)(Wbn)(Wbn) 12/14 12/15F 12/16F 12/17F 12/14 12/15F 12/16F 12/17F
Cash Flows from Op Activities 166 321 426 421 P/E (x) 31.9 - 7.6 7.0
Net Profit 40 -116 238 257 P/CF (x) 3.5 12.4 3.3 3.2
Non-Cash Income and Expense 346 264 322 316 P/B (x) 0.7 1.0 0.9 0.8
Depreciation 189 188 191 192 EV/EBITDA (x) 8.7 7.1 6.2 5.8
Amortization 3 6 7 7 EPS (W) 1,517 -4,195 8,674 9,362
Others 154 70 124 117 CFPS (W) 13,841 5,307 20,086 20,544
Chg in Working Capital -156 188 -71 -83 BPS (W) 67,609 65,292 73,761 82,918
Chg in AR & Other Receivables 18 -41 -19 -20 DPS (W) 500 200 900 1,000
Chg in Inventories 12 69 -16 -17 Payout ratio (%) 31.7 -4.3 9.5 9.8
Chg in AP & Other Payables -104 81 10 11 Dividend Yield (%) 1.0 0.3 1.4 1.5
Income Tax PaidIncome Tax PaidIncome Tax PaidIncome Tax Paid ----64646464 ----17171717 ----63636363 ----68686868 Revenue Growth (%) 1.5 -8.3 2.7 1.6
Cash Flows from Inv Activities -175 -248 -198 -186 EBITDA Growth (%) -13.0 37.2 8.9 2.4
Chg in PP&E -244 -214 -200 -200 Operating Profit Growth (%) -27.2 76.9 13.7 3.5
Chg in Intangible Assets -40 -16 -8 -6 EPS Growth (%) -62.2 - - 7.9
Chg in Financial Assets 38 13 -3 -3 Accounts Receivable Turnover (x) 6.3 5.4 5.3 5.3
OthersOthersOthersOthers 71717171 ----31313131 13131313 23232323 Inventory Turnover (x) 6.3 6.0 6.4 6.3
Cash Flows from Fin Activities -52 -1 -129 -177 Accounts Payable Turnover (x) 10.2 8.0 7.4 7.4
Chg in Financial Liabilities 13 110 -50 -100 ROA (%) 0.8 -2.4 4.7 4.9
Chg in Equity 0 1 0 0 ROE (%) 2.3 -6.3 12.5 12.0
Dividends Paid -17 -15 -6 -6 ROIC (%) 1.9 9.1 7.6 7.8
OthersOthersOthersOthers ----48484848 ----97979797 ----73737373 ----71717171 Liability to Equity Ratio (%) 136.4 159.4 138.5 118.3
Increase (Decrease) in Cash -62 199 95 54 Current Ratio (%) 111.1 108.5 117.3 125.1
Beginning Balance 124 62 261 356 Net Debt to Equity Ratio (%) 86.0 84.4 68.7 55.2
Ending BalanceEnding BalanceEnding BalanceEnding Balance 62626262 261261261261 356356356356 410410410410 Interest Coverage Ratio (x) 2.3 4.2 4.6 4.9
Source: Company data, KDB Daewoo Securities Research estimates
Kolon Industries
18
December 2, 2015
KDB Daewoo Securities Research
APPENDIX 1
Important Disclosures & Disclaimers
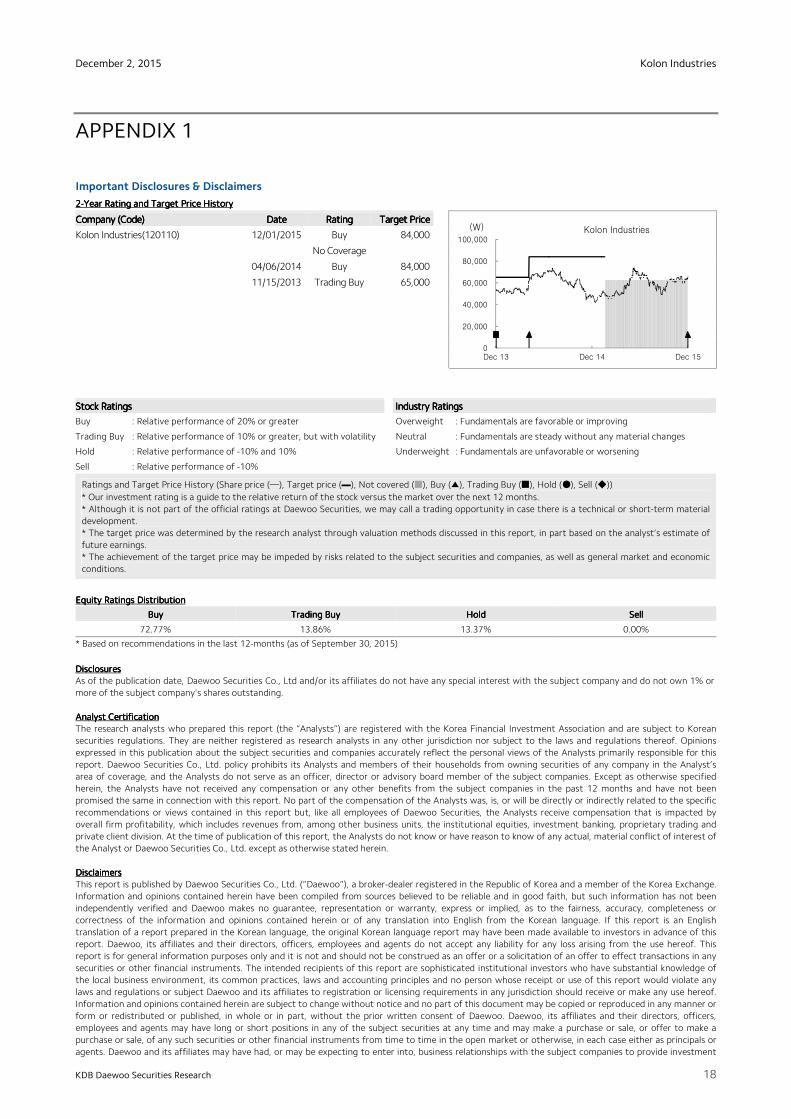
2222----Year Rating and Target Price HistoryYear Rating and Target Price HistoryYear Rating and Target Price HistoryYear Rating and Target Price History
Company (Code)Company (Code)Company (Code)Company (Code) DateDateDateDate RatingRatingRatingRating Target PriceTarget PriceTarget PriceTarget Price
Kolon Industries(120110) 12/01/2015 Buy 84,000
No Coverage
04/06/2014 Buy 84,000
11/15/2013 Trading Buy 65,000
Equity Ratings DistributionEquity Ratings DistributionEquity Ratings DistributionEquity Ratings Distribution
BuyBuyBuyBuy Trading BuyTrading BuyTrading BuyTrading Buy HoldHoldHoldHold SellSellSellSell
72.77% 13.86% 13.37% 0.00%
* Based on recommendations in the last 12-months (as of September 30, 2015)
DisclosuresDisclosuresDisclosuresDisclosures As of the publication date, Daewoo Securities Co., Ltd and/or its affiliates do not have any special interest with the subject company and do not own 1% or more of the subject company's shares outstanding. Analyst Analyst Analyst Analyst CertificationCertificationCertificationCertification The research analysts who prepared this report (the “Analysts”) are registered with the Korea Financial Investment Association and are subject to Korean securities regulations. They are neither registered as research analysts in any other jurisdiction nor subject to the laws and regulations thereof. Opinions expressed in this publication about the subject securities and companies accurately reflect the personal views of the Analysts primarily responsible for this report. Daewoo Securities Co., Ltd. policy prohibits its Analysts and members of their households from owning securities of any company in the Analyst’s area of coverage, and the Analysts do not serve as an officer, director or advisory board member of the subject companies. Except as otherwise specified herein, the Analysts have not received any compensation or any other benefits from the subject companies in the past 12 months and have not been promised the same in connection with this report. No part of the compensation of the Analysts was, is, or will be directly or indirectly related to the specific recommendations or views contained in this report but, like all employees of Daewoo Securities, the Analysts receive compensation that is impacted by overall firm profitability, which includes revenues from, among other business units, the institutional equities, investment banking, proprietary trading and private client division. At the time of publication of this report, the Analysts do not know or have reason to know of any actual, material conflict of interest of the Analyst or Daewoo Securities Co., Ltd. except as otherwise stated herein. DisclaimersDisclaimersDisclaimersDisclaimers This report is published by Daewoo Securities Co., Ltd. (“Daewoo”), a broker-dealer registered in the Republic of Korea and a member of the Korea Exchange. Information and opinions contained herein have been compiled from sources believed to be reliable and in good faith, but such information has not been independently verified and Daewoo makes no guarantee, representation or warranty, express or implied, as to the fairness, accuracy, completeness or correctness of the information and opinions contained herein or of any translation into English from the Korean language. If this report is an English translation of a report prepared in the Korean language, the original Korean language report may have been made available to investors in advance of this report. Daewoo, its affiliates and their directors, officers, employees and agents do not accept any liability for any loss arising from the use hereof. This report is for general information purposes only and it is not and should not be construed as an offer or a solicitation of an offer to effect transactions in any securities or other financial instruments. The intended recipients of this report are sophisticated institutional investors who have substantial knowledge of the local business environment, its common practices, laws and accounting principles and no person whose receipt or use of this report would violate any laws and regulations or subject Daewoo and its affiliates to registration or licensing requirements in any jurisdiction should receive or make any use hereof. Information and opinions contained herein are subject to change without notice and no part of this document may be copied or reproduced in any manner or form or redistributed or published, in whole or in part, without the prior written consent of Daewoo. Daewoo, its affiliates and their directors, officers, employees and agents may have long or short positions in any of the subject securities at any time and may make a purchase or sale, or offer to make a purchase or sale, of any such securities or other financial instruments from time to time in the open market or otherwise, in each case either as principals or agents. Daewoo and its affiliates may have had, or may be expecting to enter into, business relationships with the subject companies to provide investment
Stock RatingsStock RatingsStock RatingsStock Ratings Industry RatingsIndustry RatingsIndustry RatingsIndustry Ratings
Buy : Relative performance of 20% or greater Overweight : Fundamentals are favorable or improving
Trading Buy : Relative performance of 10% or greater, but with volatility Neutral : Fundamentals are steady without any material changes
Hold : Relative performance of -10% and 10% Underweight : Fundamentals are unfavorable or worsening
Sell : Relative performance of -10%
Ratings and Target Price History (Share price (─), Target price (▬), Not covered (■), Buy (▲), Trading Buy (■), Hold (●), Sell (◆))
* Our investment rating is a guide to the relative return of the stock versus the market over the next 12 months. * Although it is not part of the official ratings at Daewoo Securities, we may call a trading opportunity in case there is a technical or short-term material development. * The target price was determined by the research analyst through valuation methods discussed in this report, in part based on the analyst’s estimate of future earnings. * The achievement of the target price may be impeded by risks related to the subject securities and companies, as well as general market and economic conditions.
0
20,000
40,000
60,000
80,000
100,000
Dec 13 Dec 14 Dec 15
(W) Kolon Industries
Kolon Industries
19
December 2, 2015
KDB Daewoo Securities Research
banking, market-making or other financial services as are permitted under applicable laws and regulations. The price and value of the investments referred to in this report and the income from them may go down as well as up, and investors may realize losses on any investments. Past performance is not a guide to future performance. Future returns are not guaranteed, and a loss of original capital may occur. DistributionDistributionDistributionDistribution United Kingdom: This report is being distributed by Daewoo Securities (Europe) Ltd. in the United Kingdom only to (i) investment professionals falling within Article 19(5) of the Financial Services and Markets Act 2000 (Financial Promotion) Order 2005 (the “Order”), and (ii) high net worth companies and other persons to whom it may lawfully be communicated, falling within Article 49(2)(A) to (E) of the Order (all such persons together being referred to as “Relevant Persons”). This report is directed only at Relevant Persons. Any person who is not a Relevant Person should not act or rely on this report or any of its contents. United States: This report is distributed in the U.S. by Daewoo Securities (America) Inc., a member of FINRA/SIPC, and is only intended for major institutional investors as defined in Rule 15a-6(b)(4) under the U.S. Securities Exchange Act of 1934. All U.S. persons that receive this document by their acceptance thereof represent and warrant that they are a major institutional investor and have not received this report under any express or implied understanding that they will direct commission income to Daewoo or its affiliates. Any U.S. recipient of this document wishing to effect a transaction in any securities discussed herein should contact and place orders with Daewoo Securities (America) Inc., which accepts responsibility for the contents of this report in the U.S. The securities described in this report may not have been registered under the U.S. Securities Act of 1933, as amended, and, in such case, may not be offered or sold in the U.S. or to U.S. persons absent registration or an applicable exemption from the registration requirements. Hong Kong: This document has been approved for distribution in Hong Kong by Daewoo Securities (Hong Kong) Ltd., which is regulated by the Hong Kong Securities and Futures Commission. The contents of this report have not been reviewed by any regulatory authority in Hong Kong. This report is for distribution only to professional investors within the meaning of Part I of Schedule 1 to the Securities and Futures Ordinance of Hong Kong (Cap. 571, Laws of Hong Kong) and any rules made thereunder and may not be redistributed in whole or in part in Hong Kong to any person. All Other Jurisdictions: Customers in all other countries who wish to effect a transaction in any securities referenced in this report should contact Daewoo or its affiliates only if distribution to or use by such customer of this report would not violate applicable laws and regulations and not subject Daewoo and its affiliates to any registration or licensing requirement within such jurisdiction.
KDB Daewoo Securities International Network
Daewoo Securities Co. Ltd. (Seoul)Daewoo Securities Co. Ltd. (Seoul)Daewoo Securities Co. Ltd. (Seoul)Daewoo Securities Co. Ltd. (Seoul) Daewoo Securities (Hong Kong) Ltd. Daewoo Securities (Hong Kong) Ltd. Daewoo Securities (Hong Kong) Ltd. Daewoo Securities (Hong Kong) Ltd. Daewoo Securities (America) Inc. Daewoo Securities (America) Inc. Daewoo Securities (America) Inc. Daewoo Securities (America) Inc. Head Office 34-3 Yeouido-dong, Yeongdeungpo-gu Seoul 150-716 Korea
Two International Finance Centre Suites 2005-2012 8 Finance Street, Central Hong Kong, China
320 Park Avenue 31st Floor New York, NY 10022 United States
Tel: 82-2-768-3026 Tel: 85-2-2845-6332 Tel: 1-212-407-1000
Daewoo Securities (Europe) Ltd. Daewoo Securities (Europe) Ltd. Daewoo Securities (Europe) Ltd. Daewoo Securities (Europe) Ltd. Daewoo Securities (Singapore) Pte. Ltd. Daewoo Securities (Singapore) Pte. Ltd. Daewoo Securities (Singapore) Pte. Ltd. Daewoo Securities (Singapore) Pte. Ltd. Tokyo BranchTokyo BranchTokyo BranchTokyo Branch 41st Floor, Tower 42 25 Old Broad St. London EC2N 1HQ United Kingdom
Six Battery Road #11-01 Singapore, 049909
7th Floor, Yusen Building 2-3-2 Marunouchi, Chiyoda-ku Tokyo 100-0005 Japan
Tel: 44-20-7982-8000 Tel: 65-6671-9845 Tel: 81-3- 3211-5511
Beijing Representative OfficeBeijing Representative OfficeBeijing Representative OfficeBeijing Representative Office Shanghai Shanghai Shanghai Shanghai Representative OfficeRepresentative OfficeRepresentative OfficeRepresentative Office Ho Chi Minh Representative Office Ho Chi Minh Representative Office Ho Chi Minh Representative Office Ho Chi Minh Representative Office 2401A, 24th Floor, East Tower, Twin Towers B-12 Jianguomenwai Avenue Chaoyang District, Beijing 100022 China
Room 38T31, 38F SWFC 100 Century Avenue Pudong New Area, Shanghai 200120 China
Suite 2103, Saigon Trade Center 37 Ton Duc Thang St, Dist. 1, Ho Chi Minh City, Vietnam
Tel: 86-10-6567-9299 Tel: 86-21-5013-6392 Tel: 84-8-3910-6000
Daewoo Investment Advisory (Beijing) Co., Ltd.Daewoo Investment Advisory (Beijing) Co., Ltd.Daewoo Investment Advisory (Beijing) Co., Ltd.Daewoo Investment Advisory (Beijing) Co., Ltd. Daewoo Securities (Mongolia) LLCDaewoo Securities (Mongolia) LLCDaewoo Securities (Mongolia) LLCDaewoo Securities (Mongolia) LLC PT. Daewoo PT. Daewoo PT. Daewoo PT. Daewoo Securities IndonesiaSecurities IndonesiaSecurities IndonesiaSecurities Indonesia
2401B, 24th Floor, East Tower, Twin Towers B-12 Jianguomenwai Avenue, Chaoyang District, Beijing 100022 China
#406, Blue Sky Tower, Peace Avenue 17 1 Khoroo, Sukhbaatar District Ulaanbaatar 14240 Mongolia
Equity Tower Building Lt.50 Sudirman Central Business District Jl. Jendral Sudirman Kav. 52-53, Jakarta Selatan Indonesia 12190
Tel: 86-10-6567-9699 Tel: 976-7011-0807 Tel: 62-21-515-1140


![KOLON BROCHURE V1.4 ENG · Position[rnm] KOLON Membrane Process KOLON membrane products compose of reinforced hallow fiber membrane made with PVDF (Polyvinylidene Fluoride) that has](https://img.pdfslide.us/doc/110x75/601db1adaad2eb184a2efc4d/kolon-brochure-v14-eng-positionrnm-kolon-membrane-process-kolon-membrane-products.jpg)