Embed Size (px)
Citation preview

Knoxville Community Update (BBBHC) September 24th, 2015
Community Report
Community-Based Readmission Rates
Community readmission rates differ from traditional hospital-based readmission rates. A readmission event is attributed to the residence of the beneficiary, not the hospital. These events are compiled at the ZIP-code level.
Rates are expressed using the geographic boundaries established by the Dartmouth Atlas Project—the Health Referral Region (HRR) and its smaller subunit, the Hospital Service Area (HSA)—as the units of analysis. The HRR rate is expressed as readmission events per 1,000 Medicare beneficiaries.
In comparison to the more familiar risk-standardized readmission rate used by the Centers for Medicare & Medicaid Services (CMS) and reported publicly via the Hospital Compare website, the community-based readmission rates count how many times (not if) the individual was readmitted within 30-day windows.
Knoxville Community Zip Code Area
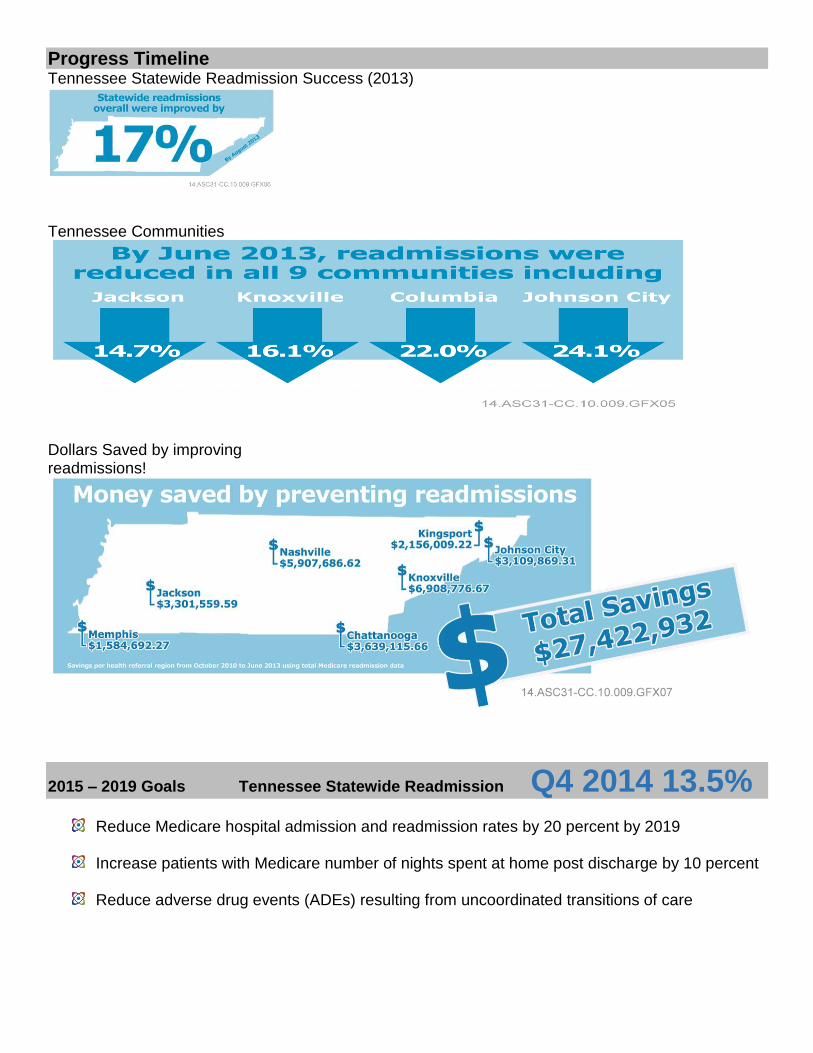
Progress Timeline Tennessee Statewide Readmission Success (2013)
Tennessee Communities
Dollars Saved by improving readmissions!
2015 – 2019 Goals Tennessee Statewide Readmission Q4 2014 13.5%
Reduce Medicare hospital admission and readmission rates by 20 percent by 2019
Increase patients with Medicare number of nights spent at home post discharge by 10 percent
Reduce adverse drug events (ADEs) resulting from uncoordinated transitions of care


Because the methodology used to calculate the community rate of readmission is highly sensitive to individuals with high personal rates of readmissions, successful outreach to a relatively smaller number of high utilizing patients can result in a significant decrease in the rate of readmission.
2010 Knoxville HRR Readmissions Expenditures

Strategies
Spatial Analysis (SA)
Using Spatial Analysis to explore the relationship between the rate of community-based readmissions and
the proportion of readmissions that can be attributed to HRUs (High Readmission Utilizers) has important
implications for developing interventions.
The graduated dot symbol represents the proportion of all readmissions that are attributed to HRUs
(4+readmissions).
Rogersville, Middlesboro, Pineville, and Jellico HSAs have both high readmission rates and large proportions
of readmissions due to HRUs.
Readmission rates may be dramatically reduced by allocating resources to a target population likely to
readmit multiple times.
Also of importance is looking at areas like Sevierville that have a low overall readmission rate and a low
proportion of readmissions by HRUs to identify potential factors that can be attributed to positive patterns
of inpatient utilization.

Social Network Analysis (SNA)
SNA characterizes relationships among actors in a network. SNA enables the user to visualize the network as a diagram of interconnected nodes. SNA can inform intervention strategies by identifying the sender-receiver relationships that account for a large proportion of the community’s transitions.
TN_08May2012_06
All providers (CY 2011). Arrows indicate one or more transitions shared.

Providers connected by a minimum of 30 transitions (CY 2011)
Key Provider Zip Code
Hospital 1 Tennova Healthcare 37917
SNF 24 Tennova Healthcare - TCU 37917
HHA 51 Tennova Home Health 37920
Hospital 2 Parkwest Medical Center 37923
SNF 22 NHC Healthcare, Farragut 37922

Spatial Analysis
Asks ‘where are the high utilizers?’ Focus readmissions work on the ‘few’ that make a BIG difference Allows targeted interventions
Social Network Analysis
Asks ‘who are providers/settings in the transition of care?’ ‘Where are the patients going and coming from?’
Focus readmissions work on key players in the game Allows relationship building and collaboration

SWOT Analysis Strengths Weaknesses Opportunities Threats