Embed Size (px)
Citation preview
Knowledge, Practices, and Coverage Survey
2000+
FIELD GUIDE August 2001
Developed by Donna Espeut, The Child Survival Technical Support Project
August 2001
In July 2001, the KPC Revision Task Force of the CORE Monitoring and Evaluation Working Group met to review the April 2001 draft of the KPC2000+ Field Guide. The current version of the guide (August 2001) incorporates recommendations from the Task Force. In its present form, the KPC2000+ Field Guide familiarizes the reader with important issues and concepts related to KPC surveys. The next version of the guide will also include detailed sections on KPC data analysis and an appendix of useful training materials. CORE and CSTS encourage you to provide additional input in further developing this guide. Please submit your comments, questions, or suggestions to CSTS. The contact information is provided below.
The Child Survival Technical Support Project
(ATTN: Donna Espeut) 11785 Beltsville Drive
Calverton, Maryland 20705 U.S.A.
TEL: (301) 572-0200 FAX: (301) 572-0983
E-MAIL: [email protected] Special thanks to Counterpart International, Inc., and consultants Tom Davis and Julie Mobley, for field-testing preliminary components of the field guide in January 2001. The Knowledge, Practices, and Coverage Survey 2000+ Field Guide 2001 is a product of the Child Survival Technical Support Project (CSTS). The Child Survival Technical Support (CSTS) Project is funded by the Office of Private and Voluntary Cooperation, Bureau for Democracy, Conflict and Humanitarian Assistance (PVC/DCHA), of the United States Agency for International Development (USAID), under contract number FAO-C-00-98-00079-00, and is managed by ORC Macro. For further information on the Child Survival Technical Support Project, please contact: ORC Macro, 11785 Beltsville Drive, Calverton, Maryland 20705; Attn: CSTS Project; (301) 572-0200; fax: (301) 572-0982; e-mail [email protected]; Internet: http://www.childsurvival.com
August 2001
TABLE OF CONTENTS
PAGE NUMBERS
List of Acronyms v
Introduction to Guide vii
BACKGROUND
Purpose and Role of a KPC Survey 1–9
KPC2000+ Tools 13–16
Phases of a KPC Survey 19–21
PHASE I: PRE-IMPLEMENTATION
Pre-implementation Phase Checklist 25–26
1. Make the Process Participatory 29–31
2. Develop a Logistics Plan 35–39
3. Determine Needs and Information Gaps 43–47
4. Adapt and Translate the KPC Questionnaire 51–55
5. Design a Sampling Strategy 59–101
6. Recruit and Train Supervisors and Interviewers 105–110
PHASE II: SURVEY IMPLEMENTATION
7. Collect the Data 113–117
PHASE III: POST-IMPLEMENTATION
8. Tabulate Survey Questionnaires 121–125
9. Analyze the Data 129–134
10. Write the Survey Report 137–153
KPC2000+ Field Guide (DRAFT) August 2001
iii

KPC2000+ Field Guide (DRAFT) August 2001
iv

LIST OF ACRONYMS ARI acute respiratory infection BCC behavior change communication BHR/PVC Bureau of Humanitarian Response and Private and Voluntary
Cooperation CATCH Core Assessment Tool on Child Health CS child survival CSSP Child Survival Support Program CSTS Child Survival Technical Support Project DE design effect DIP Detailed Implementation Plan HIS Health Information System HIV/AIDS Human Immunodeficiency Virus/Acquired Immune Deficiency
Syndrome IMCI Integrated Management of Childhood Illnesses KPC Knowledge, Practices, and Coverage survey LQAS Lot Quality Assurance Sampling M&E monitoring and evaluation MEWG CORE Monitoring and Evaluation Working Group MOH Ministry of Health NGO nongovernmental organization ORS oral rehydration salts ORT oral rehydration therapy PPS probability proportional to size PVO private voluntary organization SRS simple random sampling USAID United States Agency for International Development
KPC2000+ Field Guide (DRAFT) August 2001
v

KPC2000+ Field Guide (DRAFT) August 2001
vi
INTRODUCTION TO GUIDE Why Was This Guide Written? The PVO Child Survival Support Project (CSSP) of The Johns Hopkins University initially developed a document known as the Survey Trainer’s Guide for PVO Child Survival Project Rapid Knowledge, Practice, and Coverage (KPC) Surveys. The guide aimed to help standardize field implementation of KPC surveys. Its target audience was individuals who attended one of the many Training of Survey Trainers (TOST) Workshops organized by PVO CSSP. The present guide, the KPC2000+ Field Guide, is an updated version of the Survey Trainer’s Guide. The new guide corresponds to the October 2000 version of the KPC, which is now called the KPC2000+. The KPC2000+ is a revision of the original questionnaire developed by PVO CSSP, and is a product of the Child Survival Technical Support Project (CSTS) and the CORE Monitoring and Evaluation Working Group (MEWG). Like the original KPC manual, the KPC2000+ Field Guide aims to assist projects in planning, conducting, and analyzing a KPC survey. The present guide contains expanded sections on sampling options for KPC surveys, KPC data analysis, and the use of KPC data for health decisionmaking. It also stresses the importance of incorporating qualitative research, partnership-building, and capacity development into the KPC process. For Whom Was This Guide Written? The KPC2000+ Field Guide is written for persons who will be conducting KPC surveys but have not yet had the opportunity to attend a KPC training workshop. An effort has been made to present concepts in a simple and easy-to-understand manner. However, this guide is not intended to take the place of formal instruction in survey research. Individuals who do not have a basic understanding of survey research and program monitoring and evaluation are encouraged to refer to other resources (such as the ones listed at the end of each section) and/or seek the assistance of individuals with such experience. What Does This Guide Contain? As mentioned above, the guide is not designed to be a stand-alone resource when conducting a KPC survey. It does, however, provide a comprehensive overview of the KPC process. More specifically, it covers the following: • Purpose of a KPC survey and its role in project monitoring and evaluation • KPC2000+ tools • Phases of the KPC process • Useful research materials produced by other agencies and organizations
KPC2000+ Field Guide (DRAFT) August 2001
vii

PURPOSE AND ROLE OF A KPC SURVEY History of the Rapid KPC Survey Private Voluntary Organizations (PVOs) have played a major role in improving the outcomes of women and children worldwide. However, a shortage of staff with M&E training has made it difficult to document progress. In response to the need for a rapid, easy-to-use way of assessing progress, the United States Agency for International Development (USAID) asked the PVO Child Survival Support Program (CSSP) to develop an assessment tool. The PVO CSSP, the original technical assistance project for the PVO child survival (CS) community, consulted with PVO staff and designed the Rapid Knowledge, Practices, and Coverage (KPC) Survey. The KPC is a management tool that yields a concise and manageable set of indicators to monitor and estimate the results of PVO CS activities. In addition, survey implementation is intended to promote local participation in identifying health priorities and in monitoring community health status. CS projects generally aim to improve the health and nutrition outcomes of children under the age of five years. However, the KPC survey usually targets mothers of children under the age of two years. Reasons why the KPC has focused on children under age two are listed below. • Among children under age five, under twos experience the highest health risks. • Budget and human resource constraints warrant limiting the age range of children
who are surveyed to those under age two. • Projects are given a short period of time to establish interventions and assess
impact. As a result, some PVOs choose to monitor and estimate program effects based upon beneficiaries who are under two. If children under age five are included in assessments, the effects of a program may be diluted by the experiences of older kids who were not program beneficiaries.
In the past, it was common practice to only include mothers of children under age two in a KPC survey. As a result, children with non-maternal caregivers (for example, grandmothers or older siblings) were excluded from the survey. Children whose mothers are absent from the home, leaving the child in the care of other individuals, might have greater chances of getting ill or dying compared with children who are cared for by the biological mother. The HIV/AIDS epidemic is changing the social and economic realities in many countries, and PVOs are starting to re-consider who should be included in a KPC survey. As a result, more KPC surveys are including children under age two and their primary caregivers, regardless of whether the caregiver is the biological mother or someone else. This more accurately reflects the population of target beneficiaries. Traditionally, mothers have been selected for the survey using a 30-cluster sampling methodology. This method is an efficient way of obtaining coverage estimates for an entire program area.
KPC2000+ Field Guide (DRAFT) August 2001
1
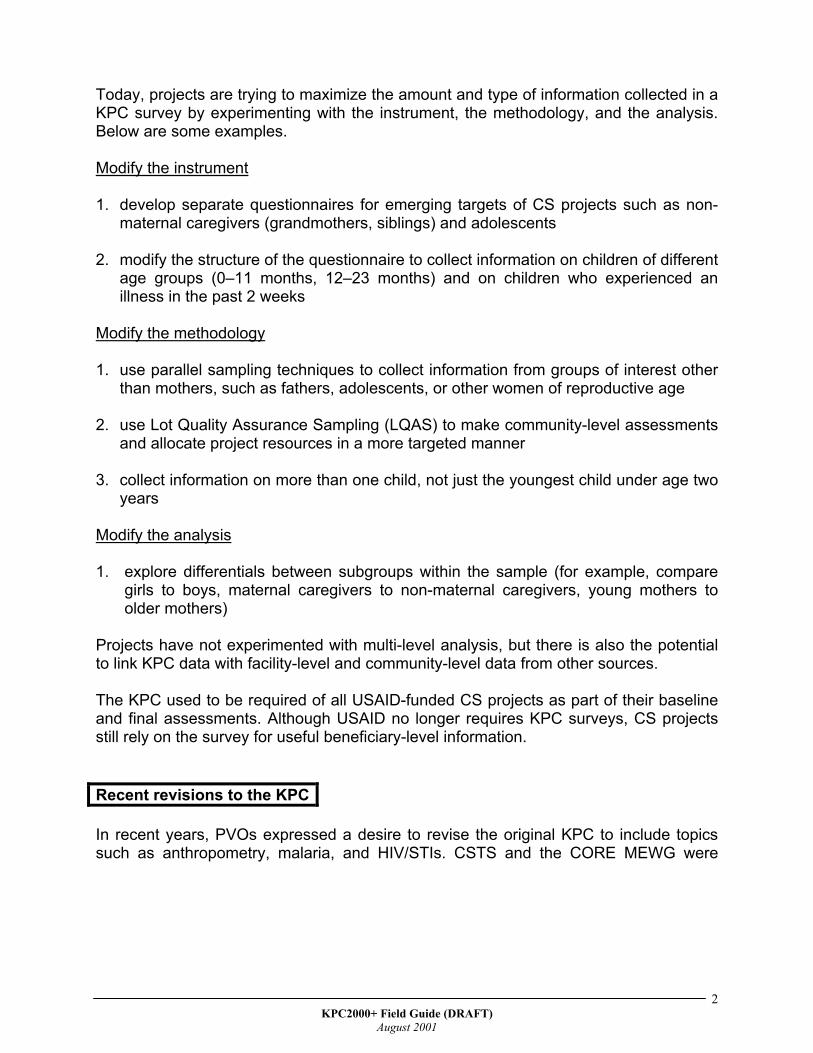
Today, projects are trying to maximize the amount and type of information collected in a KPC survey by experimenting with the instrument, the methodology, and the analysis. Below are some examples. Modify the instrument 1. develop separate questionnaires for emerging targets of CS projects such as non-
maternal caregivers (grandmothers, siblings) and adolescents 2. modify the structure of the questionnaire to collect information on children of different
age groups (0–11 months, 12–23 months) and on children who experienced an illness in the past 2 weeks
Modify the methodology 1. use parallel sampling techniques to collect information from groups of interest other
than mothers, such as fathers, adolescents, or other women of reproductive age 2. use Lot Quality Assurance Sampling (LQAS) to make community-level assessments
and allocate project resources in a more targeted manner 3. collect information on more than one child, not just the youngest child under age two
years Modify the analysis 1. explore differentials between subgroups within the sample (for example, compare
girls to boys, maternal caregivers to non-maternal caregivers, young mothers to older mothers)
Projects have not experimented with multi-level analysis, but there is also the potential to link KPC data with facility-level and community-level data from other sources. The KPC used to be required of all USAID-funded CS projects as part of their baseline and final assessments. Although USAID no longer requires KPC surveys, CS projects still rely on the survey for useful beneficiary-level information. Recent revisions to the KPC In recent years, PVOs expressed a desire to revise the original KPC to include topics such as anthropometry, malaria, and HIV/STIs. CSTS and the CORE MEWG were
KPC2000+ Field Guide (DRAFT)
August 2001
2
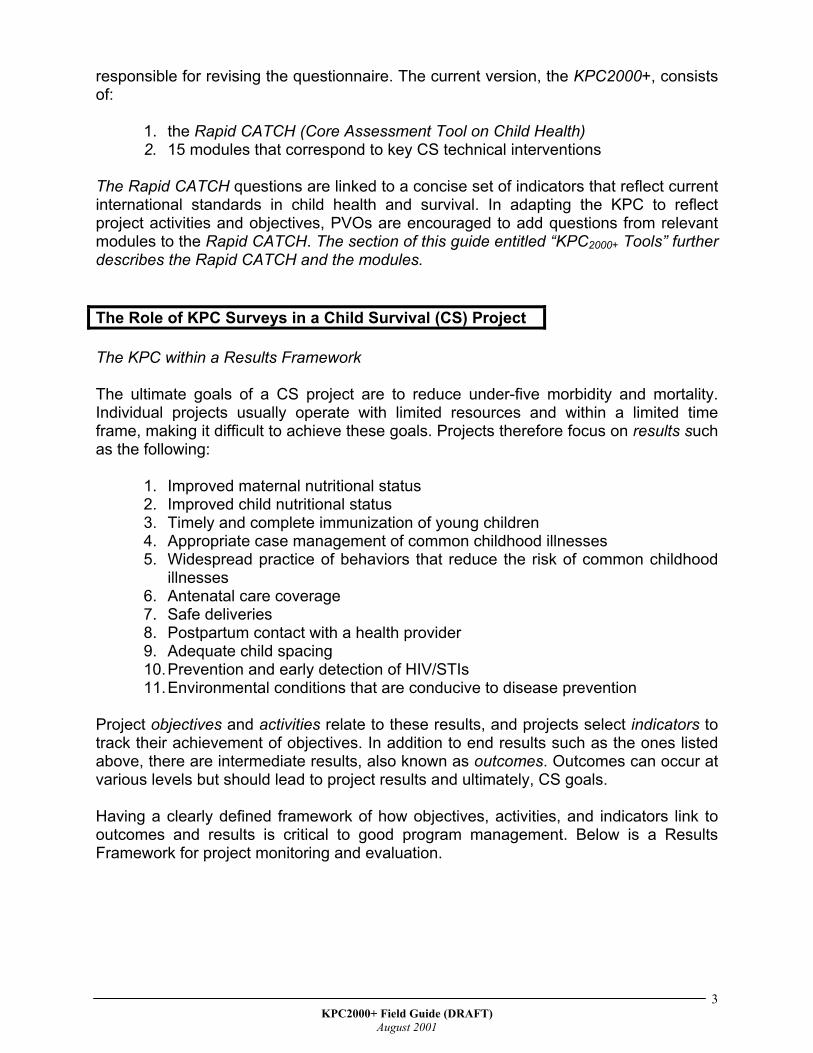
responsible for revising the questionnaire. The current version, the KPC2000+, consists of:
1. the Rapid CATCH (Core Assessment Tool on Child Health) 2. 15 modules that correspond to key CS technical interventions
The Rapid CATCH questions are linked to a concise set of indicators that reflect current international standards in child health and survival. In adapting the KPC to reflect project activities and objectives, PVOs are encouraged to add questions from relevant modules to the Rapid CATCH. The section of this guide entitled “KPC2000+ Tools” further describes the Rapid CATCH and the modules. The Role of KPC Surveys in a Child Survival (CS) Project The KPC within a Results Framework The ultimate goals of a CS project are to reduce under-five morbidity and mortality. Individual projects usually operate with limited resources and within a limited time frame, making it difficult to achieve these goals. Projects therefore focus on results such as the following:
1. Improved maternal nutritional status 2. Improved child nutritional status 3. Timely and complete immunization of young children 4. Appropriate case management of common childhood illnesses 5. Widespread practice of behaviors that reduce the risk of common childhood
illnesses 6. Antenatal care coverage 7. Safe deliveries 8. Postpartum contact with a health provider 9. Adequate child spacing 10. Prevention and early detection of HIV/STIs 11. Environmental conditions that are conducive to disease prevention
Project objectives and activities relate to these results, and projects select indicators to track their achievement of objectives. In addition to end results such as the ones listed above, there are intermediate results, also known as outcomes. Outcomes can occur at various levels but should lead to project results and ultimately, CS goals. Having a clearly defined framework of how objectives, activities, and indicators link to outcomes and results is critical to good program management. Below is a Results Framework for project monitoring and evaluation.
KPC2000+ Field Guide (DRAFT)
August 2001
3
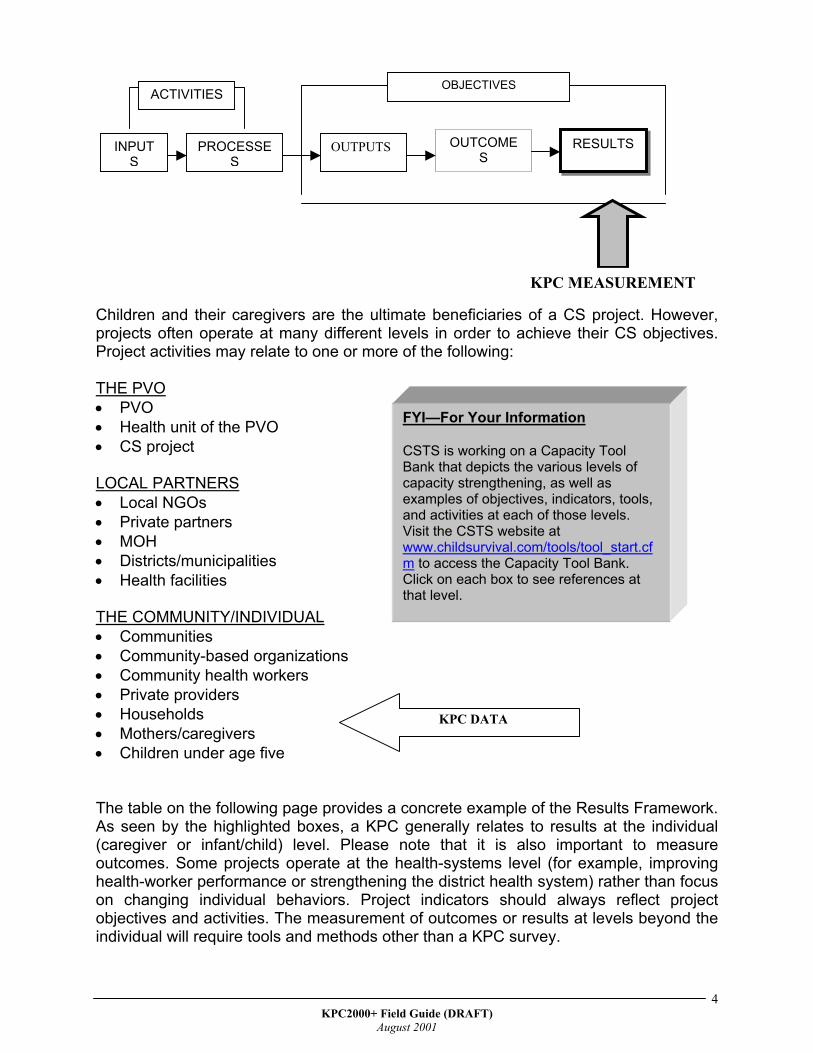
INPUTS
PROCESSES
OUTPUTS OUTCOMES
RESULTS
OBJECTIVES
KPC MEASUREMENT
ACTIVITIES
Children and their caregivers are the ultimate beneficiaries of a CS project. However, projects often operate at many different levels in order to achieve their CS objectives. Project activities may relate to one or more of the following: THE PVO
FYI—For Your Information CSTS is working on a Capacity Tool Bank that depicts the various levels of capacity strengthening, as well as examples of objectives, indicators, tools, and activities at each of those levels. Visit the CSTS website at www.childsurvival.com/tools/tool_start.cfm to access the Capacity Tool Bank. Click on each box to see references at that level.
PVO • • •
Health unit of the PVO CS project
LOCAL PARTNERS
Local NGOs • • • • •
Private partners MOH Districts/municipalities Health facilities
THE COMMUNITY/INDIVIDUAL
Communities • • • • • • •
Community-based organizations Community health workers Private providers
KPC DATA Households Mothers/caregivers Children under age five
The table on the following page provides a concrete example of the Results Framework. As seen by the highlighted boxes, a KPC generally relates to results at the individual (caregiver or infant/child) level. Please note that it is also important to measure outcomes. Some projects operate at the health-systems level (for example, improving health-worker performance or strengthening the district health system) rather than focus on changing individual behaviors. Project indicators should always reflect project objectives and activities. The measurement of outcomes or results at levels beyond the individual will require tools and methods other than a KPC survey.
KPC2000+ Field Guide (DRAFT)
August 2001
4
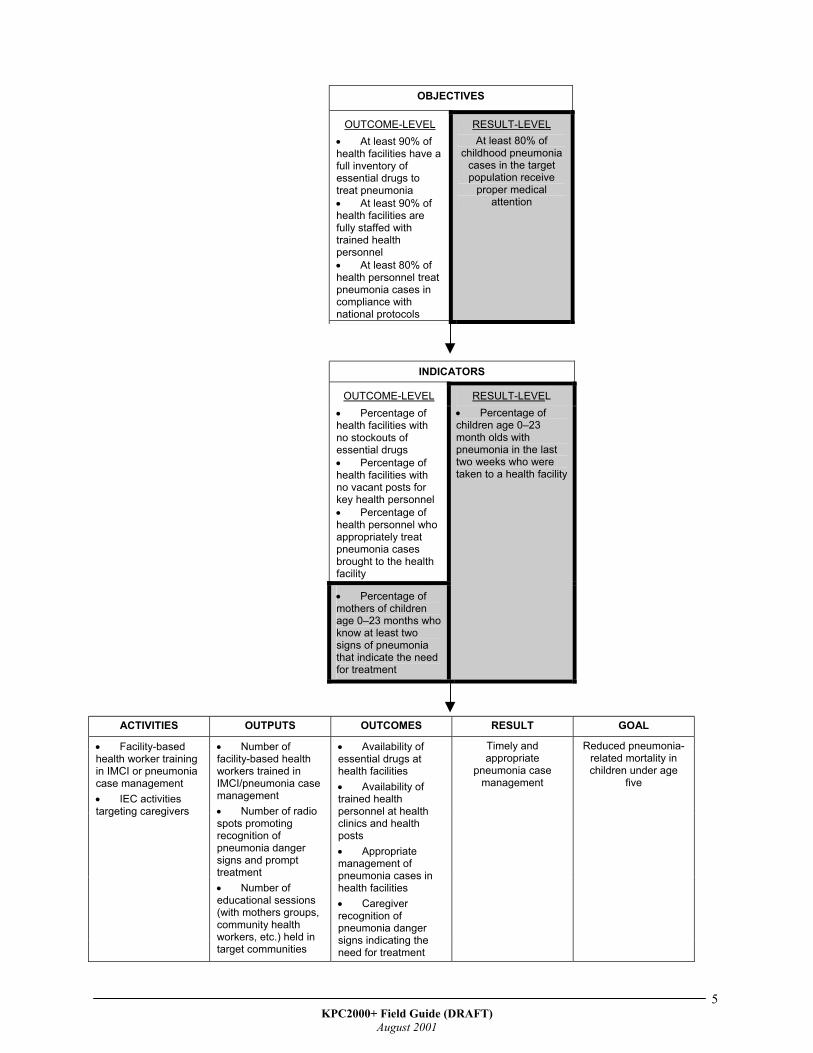
OBJECTIVES
OUTCOME-LEVEL • At least 90% of health facilities have a full inventory of essential drugs to treat pneumonia • At least 90% of health facilities are fully staffed with trained health personnel • At least 80% of health personnel treat pneumonia cases in compliance with national protocols
RESULT-LEVEL At least 80% of
childhood pneumonia cases in the target population receive
proper medical attention
INDICATORS
OUTCOME-LEVEL • Percentage of health facilities with no stockouts of essential drugs • Percentage of health facilities with no vacant posts for key health personnel • Percentage of health personnel who appropriately treat pneumonia cases brought to the health facility
• Percentage of mothers of children age 0–23 months who know at least two signs of pneumonia that indicate the need for treatment
RESULT-LEVEL • Percentage of children age 0–23 month olds with pneumonia in the last two weeks who were taken to a health facility
ACTIVITIES OUTPUTS OUTCOMES RESULT GOAL
• Facility-based health worker training in IMCI or pneumonia case management • IEC activities targeting caregivers
• Number of facility-based health workers trained in IMCI/pneumonia case management • Number of radio spots promoting recognition of pneumonia danger signs and prompt treatment • Number of educational sessions (with mothers groups, community health workers, etc.) held in target communities
• Availability of essential drugs at health facilities • Availability of trained health personnel at health clinics and health posts • Appropriate management of pneumonia cases in health facilities • Caregiver recognition of pneumonia danger signs indicating the need for treatment
Timely and appropriate
pneumonia case management
Reduced pneumonia-related mortality in children under age
five
KPC2000+ Field Guide (DRAFT)
August 2001
5
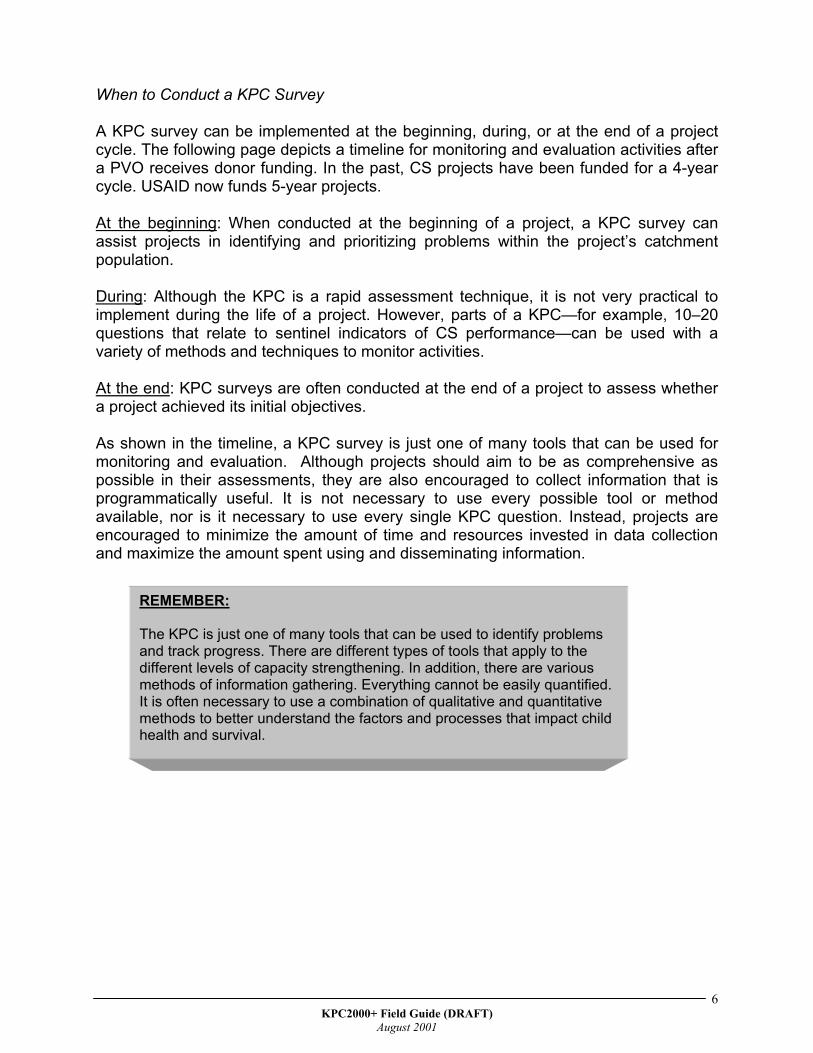
When to Conduct a KPC Survey A KPC survey can be implemented at the beginning, during, or at the end of a project cycle. The following page depicts a timeline for monitoring and evaluation activities after a PVO receives donor funding. In the past, CS projects have been funded for a 4-year cycle. USAID now funds 5-year projects. At the beginning: When conducted at the beginning of a project, a KPC survey can assist projects in identifying and prioritizing problems within the project’s catchment population. During: Although the KPC is a rapid assessment technique, it is not very practical to implement during the life of a project. However, parts of a KPC—for example, 10–20 questions that relate to sentinel indicators of CS performance—can be used with a variety of methods and techniques to monitor activities. At the end: KPC surveys are often conducted at the end of a project to assess whether a project achieved its initial objectives. As shown in the timeline, a KPC survey is just one of many tools that can be used for monitoring and evaluation. Although projects should aim to be as comprehensive as possible in their assessments, they are also encouraged to collect information that is programmatically useful. It is not necessary to use every possible tool or method available, nor is it necessary to use every single KPC question. Instead, projects are encouraged to minimize the amount of time and resources invested in data collection and maximize the amount spent using and disseminating information. REMEMBER:
The KPC is just one of many tools that can be used to identify problems and track progress. There are different types of tools that apply to the different levels of capacity strengthening. In addition, there are various methods of information gathering. Everything cannot be easily quantified. It is often necessary to use a combination of qualitative and quantitative methods to better understand the factors and processes that impact child health and survival.
KPC2000+ Field Guide (DRAFT)
August 2001
6
GENERAL TIMELINE FOR CS MO
Project Begins
B A S E L I N E
A S S E S S M E N T
Annual Report Submit
DIP
6 months Year 1
U• • • • • • • •
Year 2 AnnuReport for 5-y
CS projects
4-year project cycle • project monitoring activities • 3 Annual Reports • 1 Midterm Evaluation (Year 2) • 1 Final Evaluation (Year 4) 5-year project cycle • project monitoring activities • 4 Annual Reports • 1 Midterm Evaluation (Year 3) • 1 Final Evaluation (Year 5)
PROJECT MONITORING ACTgroups, service-level monitoring
KPC200
NITORING AND EVALUATION ACTIVITIES
MIDTERM EVALUATION
FINAL
EVALUATION
TIME
Annual Report
Year 2 or 3 (for 5-yr. Year 3 or 4 (for 5-yr.
SEFUL TOOLS/METHODS KPC survey health facility assessment Participatory Rural Appraisal Appreciative Inquiry key informant interviews focus group discussions consult existing data verbal/social autopsies
al r.
IVITES (LQAS monitoring, community registers, care data, focus groups, etc.)
ProjectEnds
0+ Field Guide (DRAFT) August 2001
7
KPC2000+ Field Guide (DRAFT)
August 2001
8
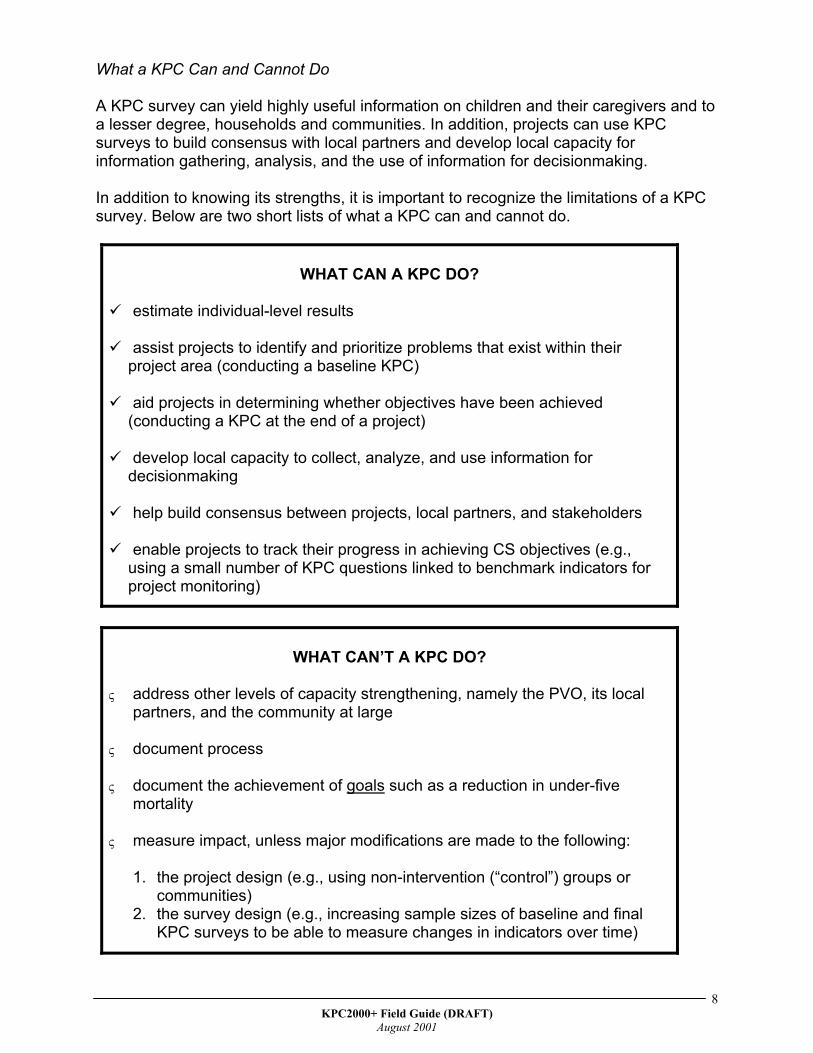
What a KPC Can and Cannot Do A KPC survey can yield highly useful information on children and their caregivers and to a lesser degree, households and communities. In addition, projects can use KPC surveys to build consensus with local partners and develop local capacity for information gathering, analysis, and the use of information for decisionmaking.
In addition to knowing its strengths, it is important to recognize the limitations of a KPC survey. Below are two short lists of what a KPC can and cannot do.
WHAT CAN A KPC DO?
estimate individual-level results
assist projects to identify and prioritize problems that exist within their project area (conducting a baseline KPC)
aid projects in determining whether objectives have been achieved (conducting a KPC at the end of a project)
develop local capacity to collect, analyze, and use information for decisionmaking
help build consensus between projects, local partners, and stakeholders
enable projects to track their progress in achieving CS objectives (e.g., using a small number of KPC questions linked to benchmark indicators for project monitoring)
WHAT CAN’T A KPC DO? ς
ς
ς
address other levels of capacity strengthening, namely the PVO, its local partners, and the community at large
document process
document the achievement of goals such as a reduction in under-five mortality
ς measure impact, unless major modifications are made to the following:
1. the project design (e.g., using non-intervention (“control”) groups or communities)
2. the survey design (e.g., increasing sample sizes of baseline and final KPC surveys to be able to measure changes in indicators over time)

KPC2000+ Field Guide (DRAFT)
August 2001
9
The remainder of this manual will guide you through each of the steps in designing, conducting, and analyzing a KPC survey.

KPC2000+ Field Guide (DRAFT)
August 2001
10

KPC2000+ Field Guide (DRAFT)
August 2001
11

KPC2000+ Field Guide (DRAFT)
August 2001
12
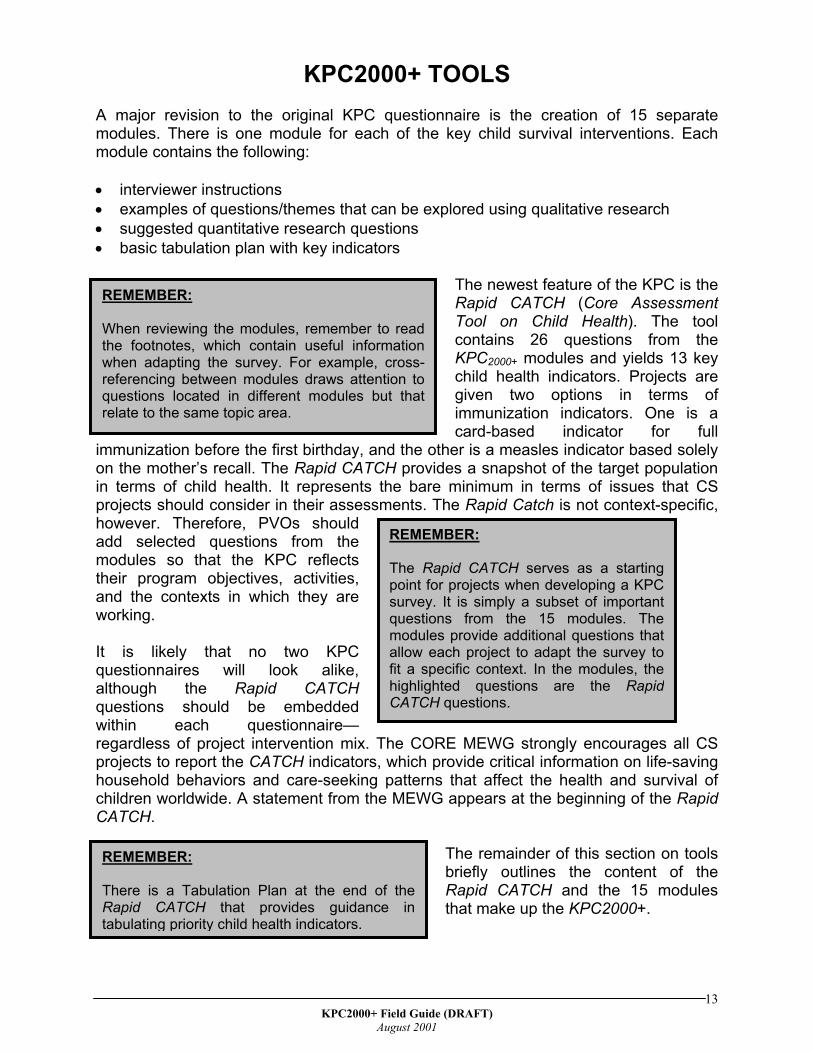
KPC2000+ TOOLS
A major revision to the original KPC questionnaire is the creation of 15 separate modules. There is one module for each of the key child survival interventions. Each module contains the following:
interviewer instructions • • • •
examples of questions/themes that can be explored using qualitative research suggested quantitative research questions basic tabulation plan with key indicators
The newest feature of the KPC is the Rapid CATCH (Core Assessment Tool on Child Health). The tool contains 26 questions from the KPC2000+ modules and yields 13 key child health indicators. Projects are given two options in terms of immunization indicators. One is a card-based indicator for full
immunization before the first birthday, and the other is a measles indicator based solely on the mother’s recall. The Rapid CATCH provides a snapshot of the target population in terms of child health. It represents the bare minimum in terms of issues that CS projects should consider in their assessments. The Rapid Catch is not context-specific, however. Therefore, PVOs should add selected questions from the modules so that the KPC reflects their program objectives, activities, and the contexts in which they are working.
REMEMBER: When reviewing the modules, remember to readthe footnotes, which contain useful informationwhen adapting the survey. For example, cross-referencing between modules draws attention toquestions located in different modules but thatrelate to the same topic area.
It is likely that no two KPC questionnaires will look alike, although the Rapid CATCH questions should be embedded within each questionnaire—regardless of project intervention mix. The CORE MEWG strongly encourages all CS projects to report the CATCH indicators, which provide critical information on life-saving household behaviors and care-seeking patterns that affect the health and survival of children worldwide. A statement from the MEWG appears at the beginning of the Rapid CATCH.
REMEMBER: The Rapid CATCH serves as a startingpoint for projects when developing a KPCsurvey. It is simply a subset of importantquestions from the 15 modules. Themodules provide additional questions thatallow each project to adapt the survey tofit a specific context. In the modules, thehighlighted questions are the RapidCATCH questions.
The remainder of this section on tools briefly outlines the content of the Rapid CATCH and the 15 modules that make up the KPC2000+.
REMEMBER: There is a Tabulation Plan at the end of theRapid CATCH that provides guidance intabulating priority child health indicators.
KPC2000+ Field Guide (DRAFT)
August 2001
13
KPC2000+ Field Guide (DRAFT)
August 2001
14
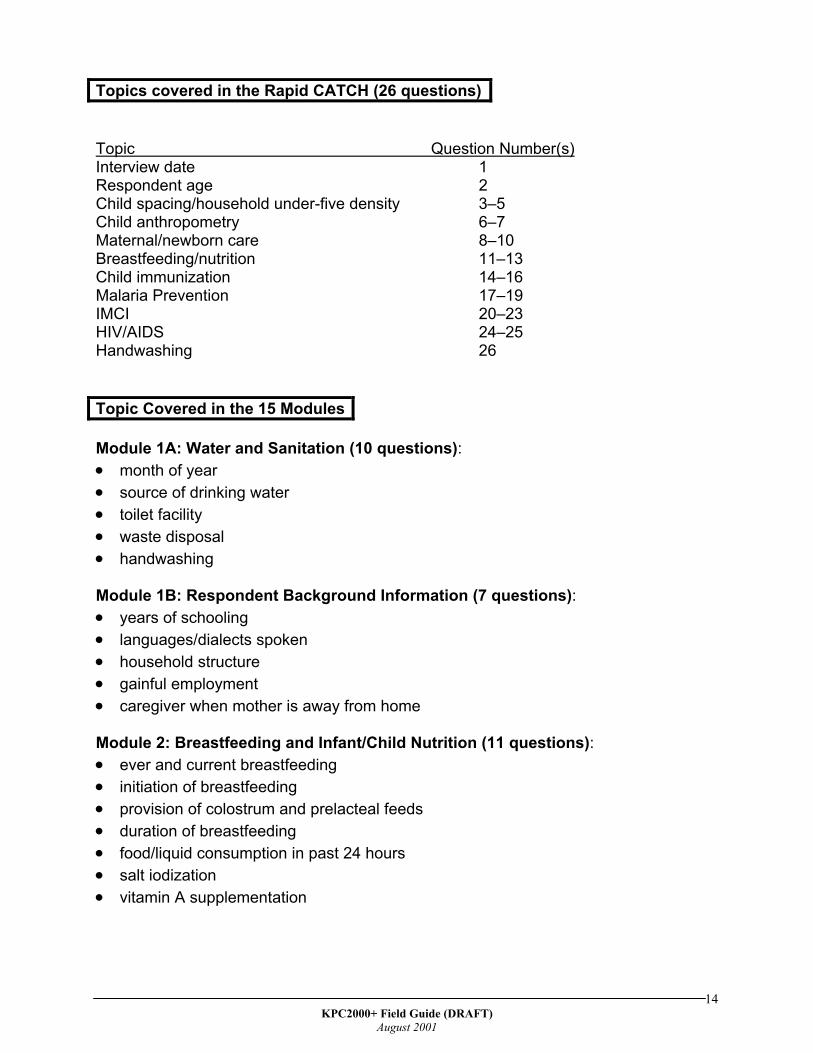
Topics covered in the Rapid CATCH (26 questions) Topic Question Number(s) Interview date 1 Respondent age 2 Child spacing/household under-five density 3–5 Child anthropometry 6–7 Maternal/newborn care 8–10 Breastfeeding/nutrition 11–13 Child immunization 14–16 Malaria Prevention 17–19 IMCI 20–23 HIV/AIDS 24–25 Handwashing 26
Topic Covered in the 15 Modules Module 1A: Water and Sanitation (10 questions): • • • • •
• • • • •
• • • • • • •
month of year source of drinking water toilet facility waste disposal handwashing
Module 1B: Respondent Background Information (7 questions):
years of schooling languages/dialects spoken household structure gainful employment caregiver when mother is away from home
Module 2: Breastfeeding and Infant/Child Nutrition (11 questions):
ever and current breastfeeding initiation of breastfeeding provision of colostrum and prelacteal feeds duration of breastfeeding food/liquid consumption in past 24 hours salt iodization vitamin A supplementation
KPC2000+ Field Guide (DRAFT)
August 2001
15
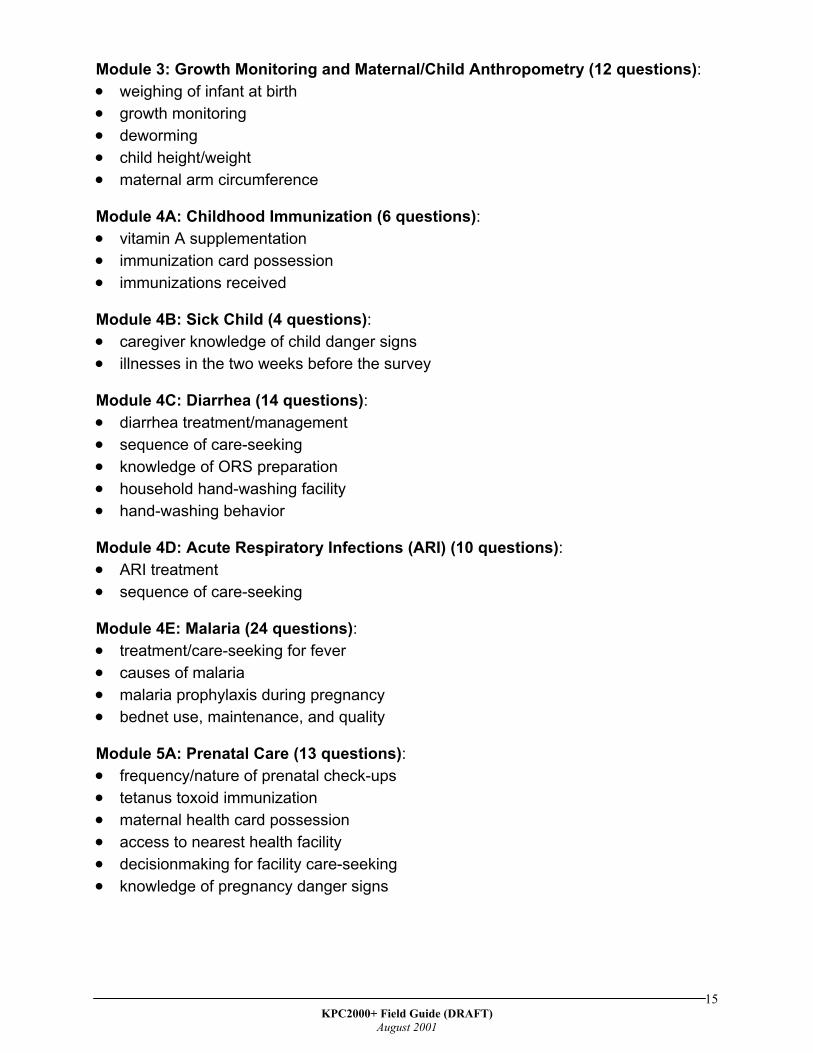
Module 3: Growth Monitoring and Maternal/Child Anthropometry (12 questions): • • • • •
• • •
• •
• • • • •
• •
• • • •
• • • • • •
weighing of infant at birth growth monitoring deworming child height/weight maternal arm circumference
Module 4A: Childhood Immunization (6 questions):
vitamin A supplementation immunization card possession immunizations received
Module 4B: Sick Child (4 questions):
caregiver knowledge of child danger signs illnesses in the two weeks before the survey
Module 4C: Diarrhea (14 questions):
diarrhea treatment/management sequence of care-seeking knowledge of ORS preparation household hand-washing facility hand-washing behavior
Module 4D: Acute Respiratory Infections (ARI) (10 questions):
ARI treatment sequence of care-seeking
Module 4E: Malaria (24 questions):
treatment/care-seeking for fever causes of malaria malaria prophylaxis during pregnancy bednet use, maintenance, and quality
Module 5A: Prenatal Care (13 questions):
frequency/nature of prenatal check-ups tetanus toxoid immunization maternal health card possession access to nearest health facility decisionmaking for facility care-seeking knowledge of pregnancy danger signs
KPC2000+ Field Guide (DRAFT)
August 2001
16
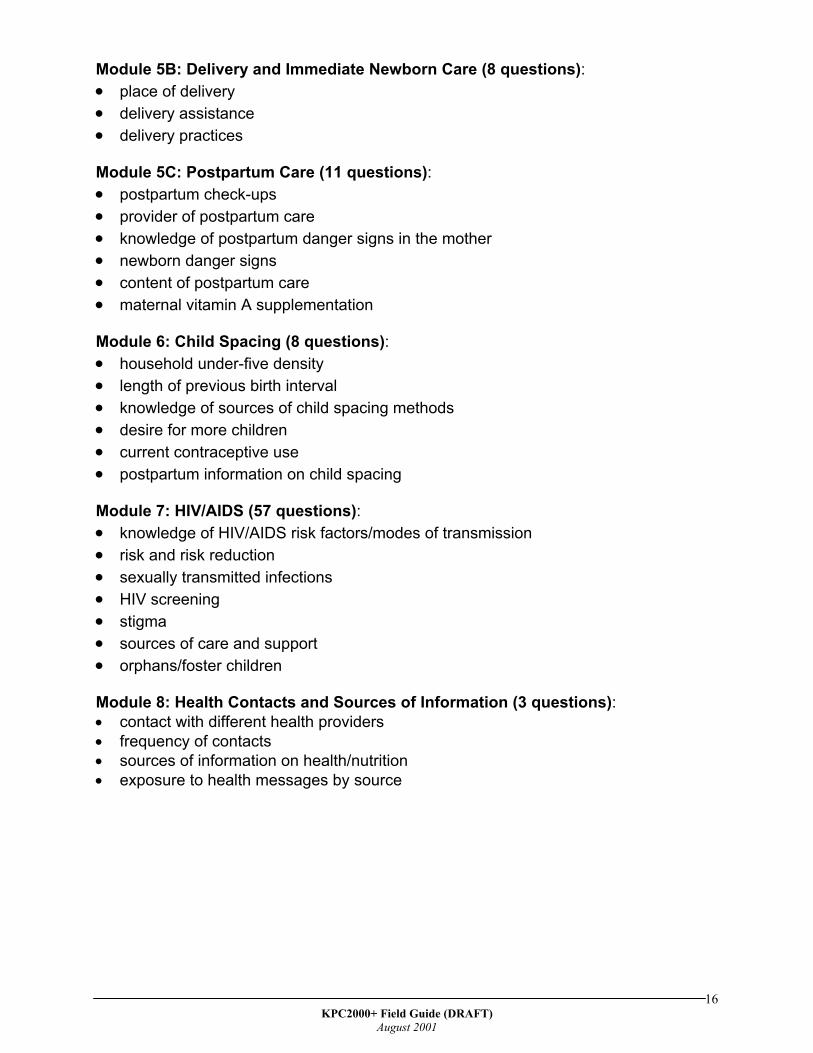
Module 5B: Delivery and Immediate Newborn Care (8 questions): • • •
• • • • • •
• • • • • •
• • • • • • •
• • • •
place of delivery delivery assistance delivery practices
Module 5C: Postpartum Care (11 questions):
postpartum check-ups provider of postpartum care knowledge of postpartum danger signs in the mother newborn danger signs content of postpartum care maternal vitamin A supplementation
Module 6: Child Spacing (8 questions):
household under-five density length of previous birth interval knowledge of sources of child spacing methods desire for more children current contraceptive use postpartum information on child spacing
Module 7: HIV/AIDS (57 questions):
knowledge of HIV/AIDS risk factors/modes of transmission risk and risk reduction sexually transmitted infections HIV screening stigma sources of care and support orphans/foster children
Module 8: Health Contacts and Sources of Information (3 questions):
contact with different health providers frequency of contacts sources of information on health/nutrition exposure to health messages by source

KPC2000+ Field Guide (DRAFT)
August 2001
17

KPC2000+ Field Guide (DRAFT)
August 2001
18

KPC2000+ Field Guide (DRAFT)
August 2001
19
PHASES OF A KPC SURVEY In this guide, the KPC process has been divided into three phases:
1. The Pre-implementation Phase, which involves activities such as meeting with project stakeholders and local experts, assessing data needs, developing a questionnaire, designing a sampling strategy, and training supervisors and interviewers
2. The Field implementation Phase, which involves the actual collection of data in
selected communities 3. The Post-implementation Phase, which involves tabulating and analyzing the data,
disseminating findings, and using the data for health decisionmaking

KPC2000+ Field Guide (DRAFT)
August 2001
20
KPC SURVEY TIMELINE (Estimated total duration=28 days)
PRE-IMPLEMENTATION PHASE (18 Days) Assess Information Needs and Incorporate Stakeholders and Local Experts • • • •
• •
•
• • • •
• • • •
Review existing project documents (e.g., proposal, DIP, annual reports) Consult existing data sources Meet/collaborate with community members and other project stakeholders Invite MOH statisticians and/or individuals from local universities/institutions who have expertise in survey research
Make Administrative and Logistical Preparations • Form KPC Coordinating Team comprised of project stakeholders and local experts • Determine survey dates/timeline • Develop logistics plan for all phases of survey Determine What/From Whom/How Information Will Be Collected
Identify survey indicators and develop analysis plan Conduct formative research to identify local information needs, terms/concepts to be included in survey Identify survey targets (e.g., mothers, non-maternal caregivers, men of reproductive age, adolescents) Design sampling strategy Select sample areas (clusters, lots, etc.) Adapt/translate/back-translate questionnaire(s) Pretest questionnaires; revise as necessary based on pretest
Maximize Quality of Data Collected
Develop/adapt training materials for supervisors/interviewers Develop procedures for quality control during data collection/data entry Recruit and train field personnel (supervisors, interviewers, etc.) Field-test questionnaires with interviewers/supervisors; make final revisions, then photocopy final version of questionnaires
Data Management • Develop data entry, error-checking, and data analysis programs • Create hand tabulation tables • Plan tabulation, analysis, and feedback sessions (post-data collection) SURVEY IMPLEMENTATION PHASE (4 Days) • • • • •
Conduct interviews “Clean” questionnaires in the field before tabulation and analysis Enter data electronically as questionnaires are reviewed and submitted by field supervisors Refine analysis programs (for computer analysis only) and hand tabulation tables Finalize logistics for tabulation/analysis workshop(s)
POST-IMPLEMENTATION PHASE (6 Days) • • • • • • • •
Complete data entry/data cleaning Tabulate/analyze survey data Identify and prioritize problems Draft survey report Hold community feedback session(s) Share preliminary findings with mission, MOH, and other interested parties Develop action plans addressing problems identified by survey Conduct follow-up qualitative research or special surveys, if necessary

KPC2000+ Field Guide (DRAFT)
August 2001
21
• Design ways of displaying KPC findings
KPC2000+ Field Guide (DRAFT)
August 2001
22
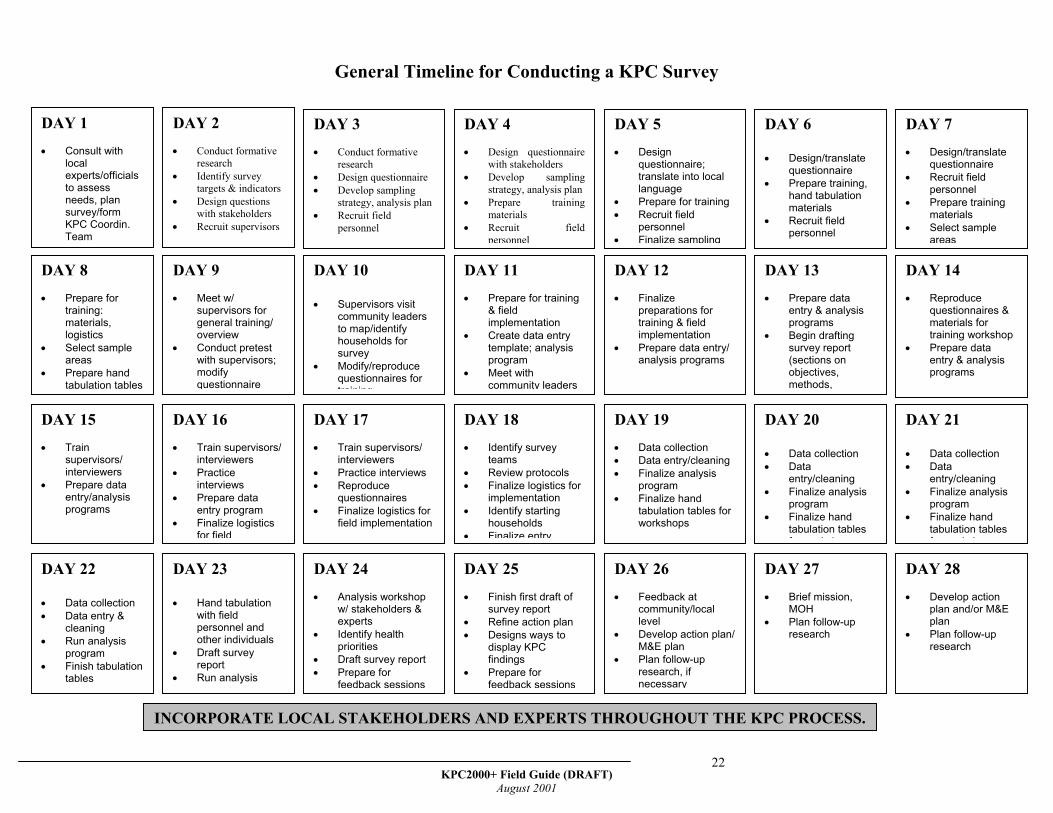
General Timeline for Conducting a KPC Survey
DAY 28 • Develop action
plan and/or M&E plan
• Plan follow-up research
DAY 27 • Brief mission,
MOH • Plan follow-up
research
DAY 21 • Data collection • Data
entry/cleaning • Finalize analysis
program • Finalize hand
tabulation tables f k h
DAY 20 • Data collection • Data
entry/cleaning • Finalize analysis
program • Finalize hand
tabulation tables f k h
DAY 14 • Reproduce
questionnaires & materials for training workshop
• Prepare data entry & analysis programs
DAY 13 • Prepare data
entry & analysis programs
• Begin drafting survey report (sections on objectives, methods,
DAY 7 • Design/translate
questionnaire • Recruit field
personnel • Prepare training
materials • Select sample
areas
DAY 6 • Design/translate
questionnaire • Prepare training,
hand tabulation materials
• Recruit field personnel
DAY 26 • Feedback at
community/local level
• Develop action plan/ M&E plan
• Plan follow-up research, if necessary
DAY 25 • Finish first draft of
survey report • Refine action plan • Designs ways to
display KPC findings
• Prepare for feedback sessions
DAY 24 • Analysis workshop
w/ stakeholders & experts
• Identify health priorities
• Draft survey report • Prepare for
feedback sessions
DAY 23 • Hand tabulation
with field personnel and other individuals
• Draft survey report
• Run analysis program
DAY 22 • Data collection • Data entry &
cleaning • Run analysis
program • Finish tabulation
tables
DAY 19 • Data collection • Data entry/cleaning• Finalize analysis
program • Finalize hand
tabulation tables for workshops
DAY 18 • Identify survey
teams • Review protocols • Finalize logistics for
implementation • Identify starting
households • Finalize entry
DAY 17 • Train supervisors/
interviewers • Practice interviews • Reproduce
questionnaires • Finalize logistics for
field implementation
DAY 16 • Train supervisors/
interviewers • Practice
interviews • Prepare data
entry program • Finalize logistics
for field
DAY 15 • Train
supervisors/ interviewers
• Prepare data entry/analysis programs
INCORPORATE LOCAL STAKEHOLDERS AND EXPERTS THROUGHOUT THE KPC PROCESS.
DAY 12 • Finalize
preparations for training & field implementation
• Prepare data entry/ analysis programs
DAY 11 • Prepare for training
& field implementation
• Create data entry template; analysis program
• Meet with community leaders
DAY 10 • Supervisors visit
community leaders to map/identify households for survey
• Modify/reproduce questionnaires for training
DAY 9 • Meet w/
supervisors for general training/ overview
• Conduct pretest with supervisors; modify questionnaire
DAY 8 • Prepare for
training: materials, logistics
• Select sample areas
• Prepare hand tabulation tables
DAY 5 • Design
questionnaire; translate into local language
• Prepare for training • Recruit field
personnel • Finalize sampling
DAY 4 • Design questionnaire
with stakeholders • Develop sampling
strategy, analysis plan• Prepare training
materials • Recruit field
personnel
DAY 3 • Conduct formative
research • Design questionnaire • Develop sampling
strategy, analysis plan• Recruit field
personnel
DAY 2 • Conduct formative
research • Identify survey
targets & indicators • Design questions
with stakeholders • Recruit supervisors
DAY 1 • Consult with
local experts/officials to assess needs, plan survey/form KPC Coordin. Team

KPC2000+ Field Guide (DRAFT)
August 2001
23

KPC2000+ Field Guide (DRAFT)
August 2001
24

KPC2000+ Field Guide (DRAFT)
August 2001
25
KPC2000+ Field Guide (DRAFT)
August 2001
26
PRE-IMPLEMENTATION PHASE
Although the KPC is designed to be a rapid assessment, there are many steps in preparing for a KPC survey. Projects will probably spend 2–3 weeks engaged in pre-implementation activities. During the Pre-implementation Phase, a project will prepare the following written documents:
1. KPC questionnaire that reflects the local context 2. Supervisor/interviewer training curriculum 3. Data management guidelines 4. Tabulation and analysis plan 5. Sampling frame and maps for the study
By the end of this phase, interviewers and supervisors should be trained and recruited, and the project should have all official clearances to conduct the survey. Although dissemination activities will not take place until after the data have been collected and analyzed, it is not too soon to start planning dissemination activities with local partners and stakeholders. The checklist on the following page outlines key tasks that should be accomplished before the beginning of data collection.
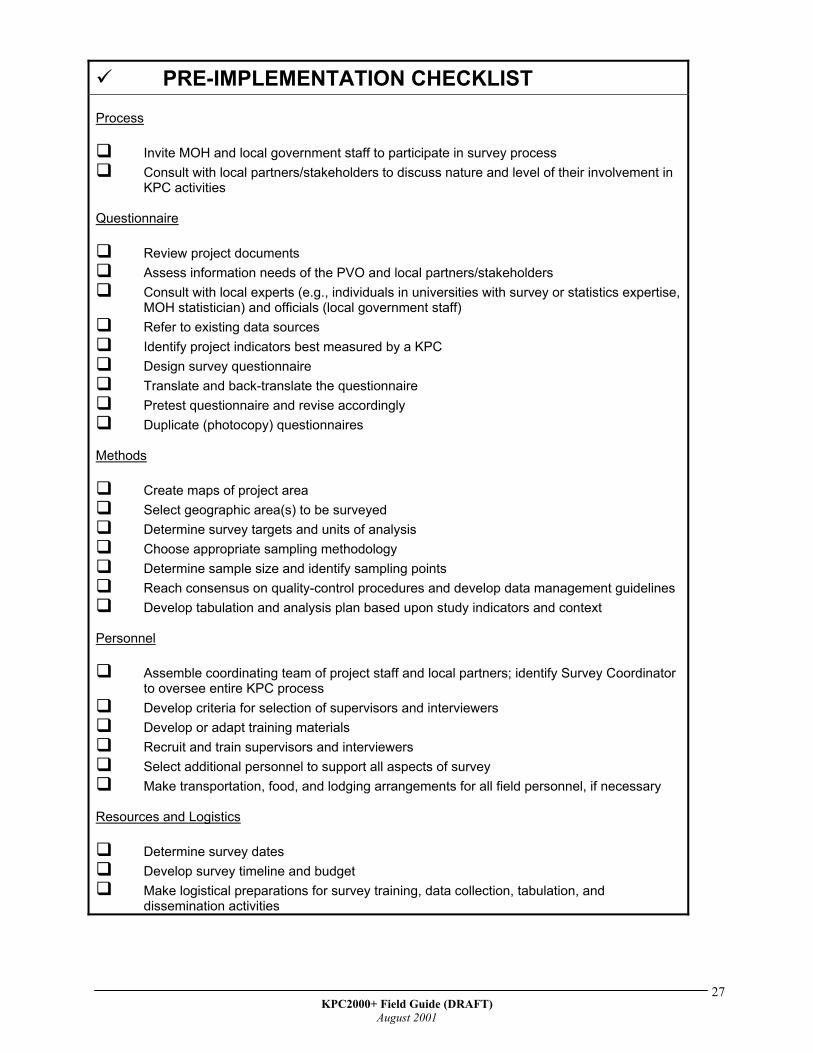
PRE-IMPLEMENTATION CHECKLIST
Process Invite MOH and local government staff to participate in survey process Consult with local partners/stakeholders to discuss nature and level of their involvement in
KPC activities Questionnaire Review project documents Assess information needs of the PVO and local partners/stakeholders Consult with local experts (e.g., individuals in universities with survey or statistics expertise,
MOH statistician) and officials (local government staff) Refer to existing data sources Identify project indicators best measured by a KPC Design survey questionnaire Translate and back-translate the questionnaire Pretest questionnaire and revise accordingly Duplicate (photocopy) questionnaires
Methods Create maps of project area Select geographic area(s) to be surveyed Determine survey targets and units of analysis Choose appropriate sampling methodology Determine sample size and identify sampling points Reach consensus on quality-control procedures and develop data management guidelines Develop tabulation and analysis plan based upon study indicators and context
Personnel Assemble coordinating team of project staff and local partners; identify Survey Coordinator
to oversee entire KPC process Develop criteria for selection of supervisors and interviewers Develop or adapt training materials Recruit and train supervisors and interviewers Select additional personnel to support all aspects of survey Make transportation, food, and lodging arrangements for all field personnel, if necessary
Resources and Logistics Determine survey dates Develop survey timeline and budget Make logistical preparations for survey training, data collection, tabulation, and
dissemination activities
KPC2000+ Field Guide (DRAFT)
August 2001
27


1. MAKE THE PROCESS PARTICIPATORY
The KPC was designed to be participatory. It can help build consensus between CS projects and their local partners. It can also be used to develop local capacity to gather, analyze, and use information for decisionmaking. PVOs should view the KPC as an opportunity to strengthen capacity both within and outside of the project. Collaboration with local agencies and organizations
is useful at all stages of the project cycle. It is particularly important for PVOs who are new to a geographical region and want to use a KPC to obtain baseline information. Engaging individuals from established and respected local organizations can help diffuse community suspicions about a new project. Religious or community leaders can play an integral role in the process. It is also a good idea to invite local government staff, ministry of health statisticians, and/or individuals from local universities or institutes who have expertise in survey research to participate in the survey. As a first step, review the project’s proposal. Identify the goals, objectives, and indicators. It is helpful to publicly display this information, which might help project staff and stakeholders connect with what the project is striving to achieve. As the project collects KPC and other data, it can explore ways of visually displaying this information so that everyone can track the achievement of objectives. In addition to the above example, there are many other ways to foster ownership in a project. Below are some ways to make the KPC survey more participatory: Ways to identify the needs and concerns of local partners/stakeholders:
• Key informant interviews with community leaders •
•
Attendance at community meetings to learn about the perceived needs of stakeholders Meetings with staff from local agencies and organizations (governmental and nongovernmental)
Roles that local partners/stakeholders can play in a KPC survey:
• Survey coordination—invite one or two individuals from partner organizations to join the KPC Coordinating Team
identify important issues the survey should address and b) identify local terminology/concepts that make the questionnaire more context-specific
• • •
•
•
Designing the sampling strategy Data collection—recruit local partners to be interviewers or supervisors Data tabulation and analysis—invite local partners/stakeholders to a hand tabulation workshop, where they can use information from the completed questionnaires to calculate key indicators; train local partners and/or project staff to use EPI-Info for data entry and data analysis; work with project stakeholders to identify and prioritize health problems identified in the KPC survey Data dissemination—work with local partners to hold community feedback sessions Data utilization—engage local partners in project design or in the development of action plans. For example, invite them to the Detailed Implementation Plan (DIP)-writing workshop.
REMEMBER: A major part of partnership building is listening to the concerns and priorities of local partners and stakeholders.
THE KPC COORDINATING TEAM One of the first steps in the KPC process is to form a coordinating team. Members of the coordinating team should have the ability to train others, as well as the ability to organize and supervise complex activities. It is also important that persons who make up the coordinating team be available during the entire survey process. In an effort to build consensus with local partners, one or two individuals from partner agencies or organizations can be invited to serve as members of the coordinating team. Projects will need to identify a person who can serve as the Survey Coordinator. Ideally, this will be someone local. However, there are instances when a project cannot identify a local person with KPC training or experience. In that situation, the project may choose to hire an outside consultant as Survey Coordinator. Even when a consultant is hired to help plan and oversee the study, it is helpful to identify staff members who can work closely with him or her and develop the necessary skills to plan, carry out, and analyze similar surveys in the future.

resources are listed below. Participatory Program Evaluation Manual: Involving Program Stakeholders in the Evaluation Process (Aubel, 1999). Available on CSTS website (www.childsurvival.com). Participatory community planning for child health: Implementation guidelines. Arlington: BASICS (Bhattacharyya & Murray, 1999). Available on BASICS website (www.basics.org). Qualitative Research for Improved Health Programs: A Guide to Manuals for Qualitative and Participatory Research on Child Health, Nutrition, and Reproductive Health (Winch et al., 2000). Available on CSTS website (www.childsurvival.com).


PRE-IMPLEMENTATION PHASE (DRAFT)

PRE-IMPLEMENTATION PHASE (DRAFT)
PRE-IMPLEMENTATION PHASE (DRAFT)
37
D
2. DEVELOP A LOGISTICS PLAN
Choosing Survey Dates—Some Things to Consider • •
•
•
Are there holidays during the scheduled dates of the survey? What are weather conditions like at the scheduled time of the survey? If possible, avoid conducting the survey during monsoon season or at other times of the year when there are long periods of bad weather. What is the potential availability of respondents? For example, it might be very hard to conduct interviews with people during harvest season, when they are likely to be away from home for long periods of time. Will there be other project activities taking place at the same time that will create a major scheduling conflict for key persons involved in the survey?
Keep in mind that the time of year when you conduct the survey affects how representative survey findings will be of conditions in general. Disease prevalences, as well as food security and dietary practices, usually vary throughout the year.
REMEMBER The KPC is a rapid assessment, but your project should plan tospend approximately 4 weeks engaged in KPC-related activities.Not all of this time will be full-time work. Many projects try tocomplete the survey in a much shorter period of time. Althougha participatory approach takes a little more time, the extra timeand effort spent to incorporate local partners/stakeholders, buildlocal capacity, and properly train interviewers will result in high-quality information that is “owned” and used by all stakeholders.The benefits of this “buy-in” at the local level will extend farbeyond the KPC survey.
Develop a budget In developing a budget for the survey, it is recommended that you consider all resource requirements. • Review requirements for the following:
KPC2000+ Field Guide (DRAFT) August 2001

PRE-IMPLEMENTATION PHASE (DRAFT)
1. personnel for conducting training sessions, interviews, tabulation, analysis, and dissemination. This includes anticipated expenses in providing food and/or lodging for supervisors, interviewers, and other field personnel.
2. supplies for copying questionnaires and hand-tabulation tables, training of supervisors and interviewers, conducting the survey, collecting anthropometric data (purchase/borrow scales and measuring boards), tabulation, analysis, and presentation of results
3. transportation for field-based practice, data collection, and feedback sessions (local and national)
• Develop a budget for survey costs (salaries, per diems, equipment, supplies, and room and board for project personnel and interviewers, rental of equipment and facilities, etc.)
For a permanent record of expenses that can be used when budgeting for future surveys, include the actual cost breakdown as an appendix in the KPC survey report. Select personnel to support all phases of the survey • The number of interviewers, supervisors, and days required to complete the survey
will vary according to factors such as resources, weather conditions, and number of interviews. It might be useful to train extra staff in case of illness or some other emergency. Considerations include the availability of personnel and transport as well as travel factors. It is also important to consider the trade-offs between the number of interviewers, the length of data collection, and the quality of data. Having a small number of interviewers (and therefore, fewer survey teams) would increase the amount of time needed to complete all of the interviewers. However, it might increase the internal consistency of the information collected. On the other hand, increasing the number of people involved in data collection can promote greater ownership of the KPC process, results, and the project as a whole. Although a larger number of interviewers might also reduce the amount of time spent in the field, there is a possibility that there will be greater variation (less consistency) in the quality of interviews conducted.
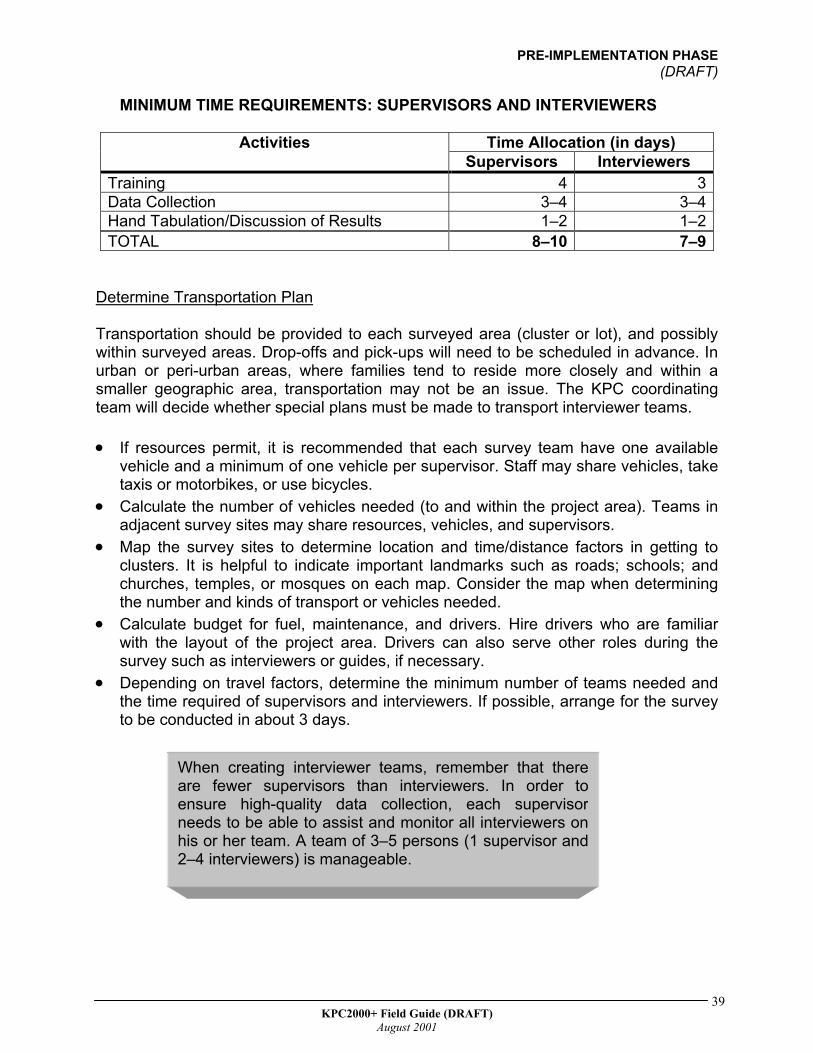
The following table gives an indication of the minimum time requirements for supervisors and interviewers.
38 KPC2000+ Field Guide (DRAFT)
August 2001
PRE-IMPLEMENTATION PHASE (DRAFT)
MINIMUM TIME REQUIREMENTS: SUPERVISORS AND INTERVIEWERS
Time Allocation (in days) Activities Supervisors Interviewers
Training 4 3Data Collection 3–4 3–4Hand Tabulation/Discussion of Results 1–2 1–2TOTAL 8–10 7–9
Determine Transportation Plan Transportation should be provided to each surveyed area (cluster or lot), and possibly within surveyed areas. Drop-offs and pick-ups will need to be scheduled in advance. In urban or peri-urban areas, where families tend to reside more closely and within a smaller geographic area, transportation may not be an issue. The KPC coordinating team will decide whether special plans must be made to transport interviewer teams. •
•
•
•
•
If resources permit, it is recommended that each survey team have one available vehicle and a minimum of one vehicle per supervisor. Staff may share vehicles, take taxis or motorbikes, or use bicycles. Calculate the number of vehicles needed (to and within the project area). Teams in adjacent survey sites may share resources, vehicles, and supervisors. Map the survey sites to determine location and time/distance factors in getting to clusters. It is helpful to indicate important landmarks such as roads; schools; and churches, temples, or mosques on each map. Consider the map when determining the number and kinds of transport or vehicles needed. Calculate budget for fuel, maintenance, and drivers. Hire drivers who are familiar with the layout of the project area. Drivers can also serve other roles during the survey such as interviewers or guides, if necessary. Depending on travel factors, determine the minimum number of teams needed and the time required of supervisors and interviewers. If possible, arrange for the survey to be conducted in about 3 days.
When creating interviewer teams, remember that thereare fewer supervisors than interviewers. In order toensure high-quality data collection, each supervisorneeds to be able to assist and monitor all interviewers onhis or her team. A team of 3–5 persons (1 supervisor and2–4 interviewers) is manageable.
39 KPC2000+ Field Guide (DRAFT)
August 2001
PRE-IMPLEMENTATION PHASE (DRAFT)
Develop Plan for Editing, Printing, and Copying/Reproducing •
•
•
Plan to reproduce the following: 1. survey questionnaires (to be used during training and actual field implementation of
the survey) 2. other training materials 3. additional field documents such as maps of survey sites, or a quick reference sheet
summarizing household and respondent selection protocols for interviewers 4. tabulation tables 5. charts/graphs for presentations 6. the survey report 7. other materials that will be developed to disseminate results to the community and
relevant agencies/individuals.
Determine available resources for editing, printing, and reproducing the survey questionnaire and other materials. This includes available power sources, computer hardware, software, qualified personnel, reproducing machines, and stores of paper, etc.
Have a plan for developing and copying these necessary documents, including:
1. WHO will develop and copy the documents 2. WHERE documents can be developed and copied 3. WHEN documents can be developed and copied Develop Plan for Tabulation/Analysis •
• • •
Decide how KPC questionnaires will be tabulated (manually and/or by computer), and plan personnel schedule and training accordingly Identify all relevant parties that can be involved in hand tabulating the data Assess the project’s capacity for computerized data tabulation Determine resources—computers, printers, software, power sources, and availability of trained computer personnel
Develop Plan for Dissemination and Data Utilization • When? • Where? • With whom? • How? Other Administrative and Logistical Issues In some countries, projects have to receive special permission from the government to conduct the survey. Therefore, communicate with the proper officials very early in the planning process to avoid future delays in the survey activities and/or negative responses to survey findings.
40 KPC2000+ Field Guide (DRAFT)
August 2001

PRE-IMPLEMENTATION PHASE (DRAFT)
• •
•
Identify, reserve, and confirm facilities for training, tabulation, and feedback sessions Contact agencies/organizations with child survival, maternal health, or other relevant projects, and invite them to participate Schedule a briefing with the USAID mission and all other interested agencies (e.g., MOH) before the initial training activity
•
•
•
Schedule a debriefing (feedback session) and a review of findings with all interested parties as soon as possible after the survey Obtain permission from appropriate administrative officials to conduct household interviews during the field test and the actual survey Purchase or borrow necessary supplies and equipment to facilitate training, conduct of the survey, tabulation, analysis, and presentation of findings
41 KPC2000+ Field Guide (DRAFT)
August 2001


PRE-IMPLEMENTATION PHASE (DRAFT)
44 KPC2000+ Field Guide (DRAFT)
August 2001

PRE-IMPLEMENTATION PHASE (DRAFT)
3. DETERMINE NEEDS AND INFORMATION GAPS
One of the most important steps in preparing for a KPC survey is determining the information needs of the local context. Because of limited time and resources, projects are encouraged to use the KPC to gather information that: 1. cannot be found in existing data sources (or exists but is of poor quality)
--AND-- 2. can be used for either a) project planning and management or b) to estimate the
effectiveness of project activities in achieving desired outcomes CONSULT EXISTING PROJECT DOCUMENTS Refer to existing documents such as the project’s proposal or DIP to determine the following: • • • • •
Beneficiary population and related demographics Project goals and objectives Project indicators (in particular, those that can be measured in a survey) Which interventions to address in the survey Other relevant information on the target beneficiary population
CONSULT WITH LOCAL PARTNERS AND STAKEHOLDERS This activity was discussed in the previous section of the field guide. It is listed here to remind projects to engage local partners and stakeholders in the earliest stages of the KPC process. CONSULT OTHER SOURCES OF DATA In addition to determining the needs of the project and stakeholders, it is useful to identify what types of information already exist. Useful information may be found in the following: •
• •
Demographic and Health Surveys (DHS) or other national surveys (e.g., Multiple Indicator Cluster Surveys (MICS) Health service statistics Other studies (e.g., in-depth surveys, qualitative research, data from other PVOs/NGOs operating in the same geographical area)
It is not uncommon for a PVO to discover that there are a number of studies conducted within a country or a particular region of a country, but little or no data on the specific
45 KPC2000+ Field Guide (DRAFT)
August 2001
PRE-IMPLEMENTATION PHASE (DRAFT)
project area. However, it still helps to refer to existing tools, methods, and results from other studies when designing your KPC survey. In addition, once the KPC survey is completed, your project can compare findings from the KPC survey with existing estimates for the country or region as a whole. Demographic and Health Surveys Demographic and Health Surveys (DHS) are nationally representative household surveys with very large sample sizes. Many of the topics covered in DHS are also covered in the KPC2000+, which was modeled after the MEASURE DHS+ standard questionnaire. Some DHS surveys have used sampling designs that yield estimates for regions (or other sub-divisions) within the country in addition to national-level estimates. PVOs are encouraged to consult DHS or other national surveys, which will be helpful when choosing what to include in a KPC survey. Once the data have been collected and analyzed, a project can also compare KPC findings with findings from DHS or other data to see how the project area relates to the entire nation (or a region, when such data are available) in terms of child health and survival. FYI—For Your Information Visit the MEASURE DHS+ website at www.measuredhs.com. The site includes a complete and up-to-date list of all DHS surveys. In addition, you can access DHS data immediately using the DHS STATcompiler. STATcompiler is an online database tool that allows users to select many countries and hundreds of indicators to create customized tables that serve their specific data needs. The STATcompiler accesses nearly all of the population and health indicators that are published in DHS final reports with just the click of the mouse.
46 KPC2000+ Field Guide (DRAFT)
August 2001
PRE-IMPLEMENTATION PHASE (DRAFT)
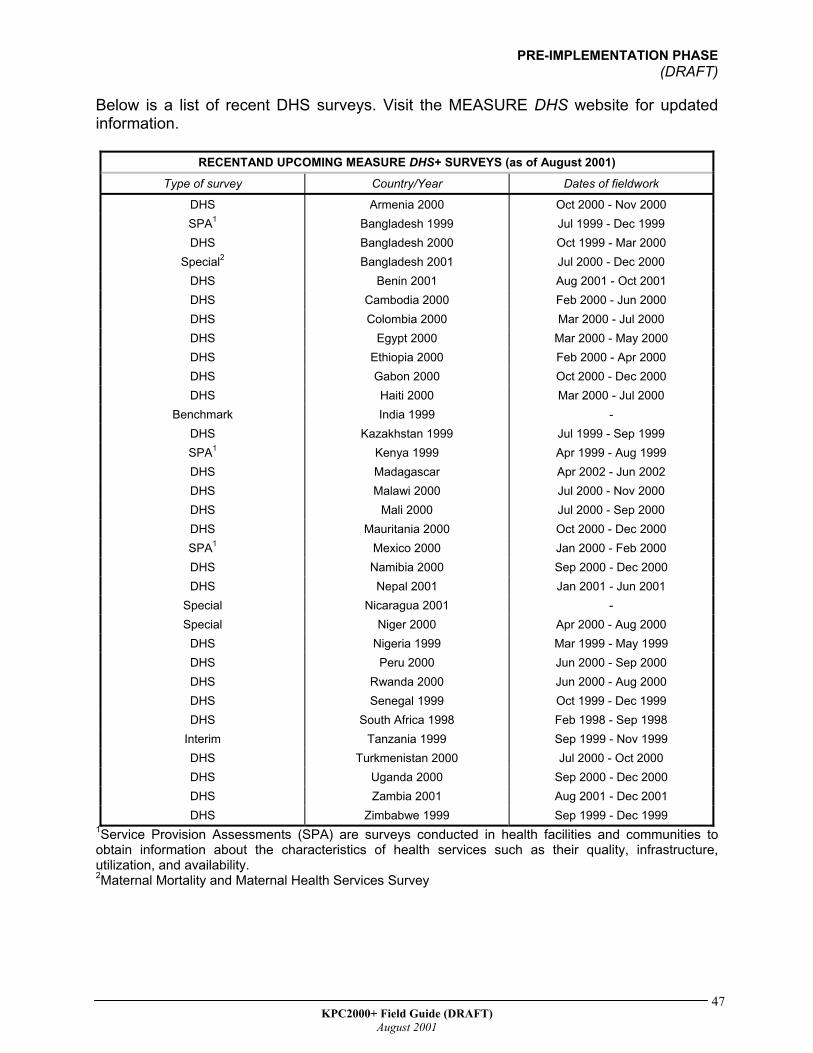
Below is a list of recent DHS surveys. Visit the MEASURE DHS website for updated information.
RECENTAND UPCOMING MEASURE DHS+ SURVEYS (as of August 2001) Type of survey Country/Year Dates of fieldwork
DHS Armenia 2000 Oct 2000 - Nov 2000 SPA1 Bangladesh 1999 Jul 1999 - Dec 1999 DHS Bangladesh 2000 Oct 1999 - Mar 2000
Special2 Bangladesh 2001 Jul 2000 - Dec 2000 DHS Benin 2001 Aug 2001 - Oct 2001 DHS Cambodia 2000 Feb 2000 - Jun 2000 DHS Colombia 2000 Mar 2000 - Jul 2000 DHS Egypt 2000 Mar 2000 - May 2000 DHS Ethiopia 2000 Feb 2000 - Apr 2000 DHS Gabon 2000 Oct 2000 - Dec 2000 DHS Haiti 2000 Mar 2000 - Jul 2000
Benchmark India 1999 - DHS Kazakhstan 1999 Jul 1999 - Sep 1999 SPA1 Kenya 1999 Apr 1999 - Aug 1999 DHS Madagascar Apr 2002 - Jun 2002 DHS Malawi 2000 Jul 2000 - Nov 2000 DHS Mali 2000 Jul 2000 - Sep 2000 DHS Mauritania 2000 Oct 2000 - Dec 2000 SPA1 Mexico 2000 Jan 2000 - Feb 2000 DHS Namibia 2000 Sep 2000 - Dec 2000 DHS Nepal 2001 Jan 2001 - Jun 2001
Special Nicaragua 2001 - Special Niger 2000 Apr 2000 - Aug 2000
DHS Nigeria 1999 Mar 1999 - May 1999 DHS Peru 2000 Jun 2000 - Sep 2000 DHS Rwanda 2000 Jun 2000 - Aug 2000 DHS Senegal 1999 Oct 1999 - Dec 1999 DHS South Africa 1998 Feb 1998 - Sep 1998
Interim Tanzania 1999 Sep 1999 - Nov 1999 DHS Turkmenistan 2000 Jul 2000 - Oct 2000 DHS Uganda 2000 Sep 2000 - Dec 2000 DHS Zambia 2001 Aug 2001 - Dec 2001 DHS Zimbabwe 1999 Sep 1999 - Dec 1999
1Service Provision Assessments (SPA) are surveys conducted in health facilities and communities to obtain information about the characteristics of health services such as their quality, infrastructure, utilization, and availability. 2Maternal Mortality and Maternal Health Services Survey
47 KPC2000+ Field Guide (DRAFT)
August 2001
PRE-IMPLEMENTATION PHASE (DRAFT)
Multiple Indicator Cluster Surveys Since 1998, Multiple Indicator Cluster Surveys (MICS) have been conducted by UNICEF, in collaboration with a number of agencies and organizations, to assist countries in assessing their progress toward World Summit for Children goals. MICS assessments have been carried out in 100 less-developed countries (60 countries conducted stand-alone MICS studies and 40 countries incorporated some of the MICS modules into other studies). The MICS have provided valuable country-level data on global indicators related to child health and well-being. FYI—For Your Information You can access information on Multiple Indicator Cluster Surveys (MICS) by visiting www.childinfo.org. The website provides access to background information on the MICS, as well as the standard questionnaires, manuals, and a listing of countries where MICS studies have been conducted. Indicator data (by region and country) are also available on the website. Health Service Statistics Hospital or health center records, Community Health Worker registers, and other sources of health statistics often include information on topics such as the following:
Immunization coverage • • • • • •
Children’s nutritional status The prevalence of childhood illnesses Prenatal, delivery, and postpartum care Child spacing Service utilization rates
Projects should keep in mind that in areas where health service utilization is low, health service statistics may not reflect reality. In addition, health statistics do not provide information on processes or reasons why certain patterns exist. Nevertheless, such data offer a useful perspective when identifying problems. It is possible that findings from a KPC survey, which is a community-based assessment, paint a different picture than health service data. In an effort to avoid major conflicts with the MOH, it is helpful to invite district/MOH staff to participate in the conduct and analysis of the survey. Projects are encouraged to be transparent in terms of how the data are collected and analyzed. Other Studies Before doing a KPC, explore what studies have already been conducted in the area or neighboring areas. For example, another PVO might have conducted a KPC survey in a neighboring district, or maybe a graduate student conducted a qualitative investigation
48 KPC2000+ Field Guide (DRAFT)
August 2001
PRE-IMPLEMENTATION PHASE (DRAFT)
into local breastfeeding practices or delivery norms in select communities within the project area. Because funding is often vertical, there is an inclination to only search for health studies. However, there may be studies in other sectors (e.g., education, water and sanitation, food security) that are of relevance to your CS project. As a reminder, always consider the specific information needs of your project. Even when there is some existing information for your project area, it might not relate specifically to the proposed activities of your project. Be creative in terms of modifying the generic KPC tools or using a sampling design that reflects the population groups targeted by your project. For example, it might be necessary to include grandmothers, males, and/or adolescents in your survey. Your tools and sampling strategy should reflect this. Consult with local experts (MOH statisticians, researchers from local universities or institutions) for assistance in designing a KPC questionnaire (or set of questionnaires, if there are different survey targets) and a methodology that best meets the needs of your project. Also consider the limitations of a KPC survey. Local experts can be helpful in identifying and designing ways to supplement your KPC data with information obtained from other methods (e.g., qualitative research techniques).
49 KPC2000+ Field Guide (DRAFT)
August 2001


POST-IMPLEMENTATION PHASE (DRAFT)
52 KPC2000+ Field Guide (DRAFT)
August 2001
POST-IMPLEMENTATION PHASE
KPC2000+ Field Guide (DRAFT)
August 2001
53
4. ADAPT AND TRANSLATE THE KPC QUESTIONNAIRE
Designing a survey tool that reflects the local context is critical to the success of a KPC survey. This section outlines the steps in developing an appropriate questionnaire. CONDUCT FORMATIVE RESEARCH Formative research is very useful in designing a KPC survey. It allows a project to examine the social context of issues and can increase the validity and reliability of its surveys. Formative research can also identify local words and terms that are used to describe certain health phenomena (for example, “AIDS”, “diarrhea”, “colostrum”). Questions that contain context-specific information are more likely to be understood by respondents.
ualitative studies use a wide range of methodological approaches. The specific
Focus group discussions
ews ehaviors
IMPORTANT ISSUES TO CONSIDER You can use formative research to find out about the decisionmaking processeswithin households. Who makes decisions about maternal and child health andnutrition? Who determines treatment and/or care-seeking when a young child isill? Formative research can also be used to identify the individual(s) responsible forthe care and well-being of young children. For example, in most cases, who isprimary caregiver of young children? What are the employment patterns in thetarget population, and what are the implications for child care (e.g., mothersmight leave their young children with older siblings while they are away at work) Answers to questions such as the ones listed above not only shed light on whatto include in the survey, but also who to include.
Qtechniques used in a particular study are chosen on the basis of the research question and setting but could include the following:
In-depth interviews Key informant intervi Observation of events or b Ethnography
POST-IMPLEMENTATION PHASE
KPC2000+ Field Guide (DRAFT)
August 2001
54
Content analysis tory completion
ile sorting, free listing, triadic comparisons,
Projects are encouraged to consider information-gathering activities such as
lso, consider using qualitative research after completing the survey. It can shed light
Role playing and s Systematic data collection (e.g., p
ranking)
Participatory Rural Appraisal or Rapid Assessment Procedures before conducting a KPC survey. Aon issues raised in survey but could be adequately explored in a structured interview.
POST-IMPLEMENTATION PHASE
KPC2000+ Field Guide (DRAFT)
August 2001
55
ADAPT, TRANSLATE, AND BACK-TRANSLATE THE QUESTIONNAIRE
What should we include in our KPC survey? The design and content of the questionnaire will depend on the needs of the project and stakeholders. This includes the types of respondents for the survey. For example, has the KPC coordinating team decided to interview mothers only, or is it also important to collect information on non-maternal caregivers? What about husbands/men of reproductive age? Other women of reproductive age? Adolescents?
A project can make minor changes to its sampling strategy (for example, by using parallel sampling) in order to collect information on different types of respondents Sampling options will be described later in this guide. Keep in mind that interviewing different types of individuals requires a different set of questionnaires for each population sub-group.
REMEMBER: The decision on who to include in the survey will need to be made beforedeciding on what to include.
Keep the following issues in mind when designing your survey: •
•
Clarify project interventions, objectives, indicators, and health messages.
Are they current? Do they reflect national and international health education messages and
standards? Use the Rapid CATCH questions as the basis for the questionnaire then add questions from the modules.
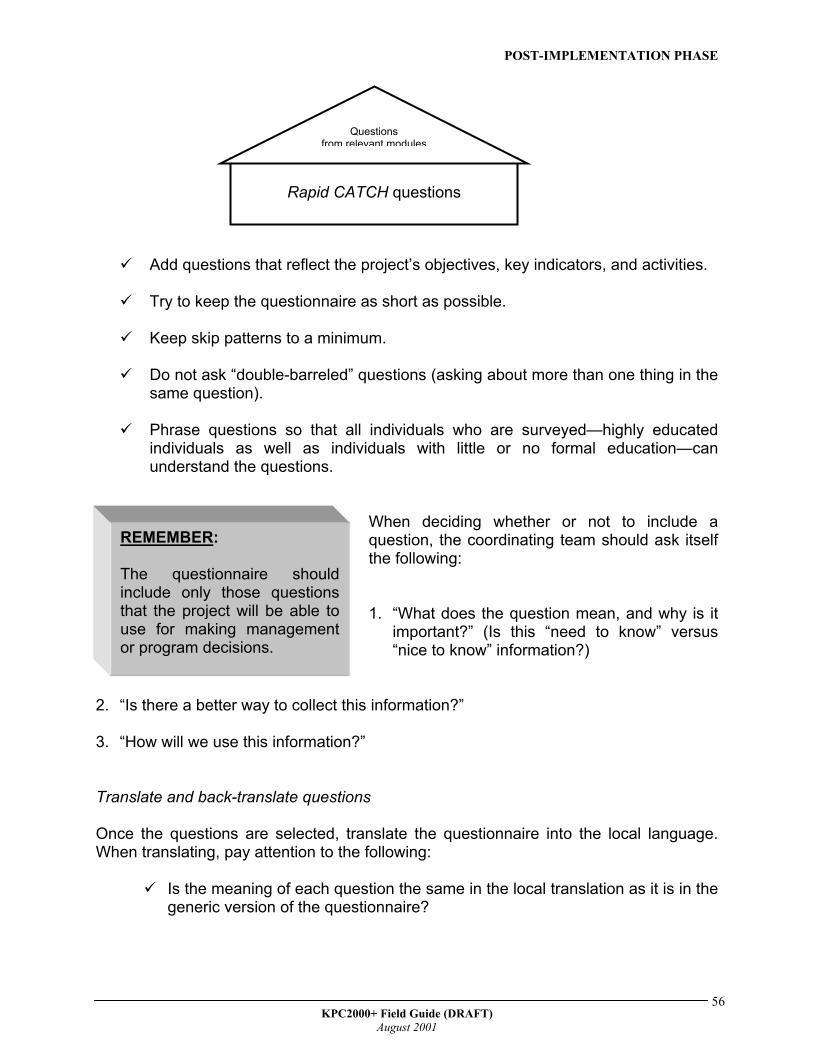
It is likely that some interventions covered by the Rapid CATCH questions are not addressed by a particular project. Consider the CATCH questions as the foundation of a house. CATCH questions reflect critical aspects of child health and survival that every project should consider. Use selected questions from the modules to distinguish your “house” from other houses in the CS community.
POST-IMPLEMENTATION PHASE
KPC2000+ Field Guide (DRAFT)
August 2001
56
Rapid CATCH questions
Questions from relevant modules
Add questions that reflect the project’s objectives, key indicators, and activities.
Try to keep the questionnaire as short as possible.
Keep skip patterns to a minimum.
Do not ask “double-barreled” questions (asking about more than one thing in the
same question). Phrase questions so that all individuals who are surveyed—highly educated
individuals as well as individuals with little or no formal education—can understand the questions.
When deciding whether or not to include a question, the coordinating team should ask itself the following: 1. “What does the question mean, and why is it
important?” (Is this “need to know” versus “nice to know” information?)
REMEMBER: The questionnaire shouldinclude only those questionsthat the project will be able touse for making managementor program decisions.
2. “Is there a better way to collect this information?” 3. “How will we use this information?” Translate and back-translate questions Once the questions are selected, translate the questionnaire into the local language. When translating, pay attention to the following:
Is the meaning of each question the same in the local translation as it is in the generic version of the questionnaire?

POST-IMPLEMENTATION PHASE
KPC2000+ Field Guide (DRAFT)
August 2001
57
Does the questionnaire reflect both the local language/dialect and the local context?
For instance, generic questions about foods should be translated to reflect locally available foods for relevant categories. As an example, if papaya is not a fruit that is locally available, it does not make sense to ask about it in the survey. It is helpful to have one person or a group of people develop a “local lexicon”, which lists local terms and phrases that can be used during interviews. It is particularly useful to list standard ways that questions can be re-phrased in the local language whenever a respondent does not understand the question that the interviewer is asking.
Once someone has translated the questionnaire into the local language, a
different person who is not familiar with the questionnaire should translate the questions back into the original language of the questionnaire (English, Spanish, French).
For example, if the local language is Quechua, then the questionnaire was probably created in Spanish then later translated into Quechua. Someone should translate the Quechua version back into Spanish to confirm that the translation was accurate.
Field-test (Pretest) Questions
Before training interviewers, pretest the translated questionnaire by interviewing a small number of respondents (for example, 10 mothers). Field-testing can be done with the KPC field supervisors as part of their training and general orientation. This exercise not only familiarizes the supervisors with the questionnaire, but it provides an opportunity to further refine the questionnaire before it is duplicated and distributed to the interviewers. It also builds their capacity in critical thinking and questionnaire development.
Assemble respondents and discuss their reactions to the survey. Find out:
1. What questions they did not understand 2. What questions seemed awkward or foolish 3. What their suggestions are to improve the wording of questions
Modify the questionnaire based upon the field-testing experience. Keep in
mind that additional changes might also arise during the interviewer training. Therefore, projects should have a clear plan in terms of how final revisions will be incorporated and how the final version of the questionnaire will be reproduced.

PRE-IMPLEMENTATION PHASE(DRAFT)
KPC2000+ Field Guide (DRAFT)August 2001
59
Your PVO has recently been awarded a BHR/PVC grant to implement a CS project inDistrict X of a particular country. In order to identify problems, set objectives, and planactivities, staff members of the new project want to collect some baseline information onthe target population. The Project Manager knows about cluster surveys but has justlearned about other options at a recent workshop for health program managers. Whatfactors should the KPC Coordinating Team consider when designing its samplingstrategy? This section of the field guide reviews key sampling terms and concepts. Italso presents guiding principles and decision trees to assist projects in designing astrategy that reflects the local context and the interests of project stakeholders.
The following guiding principles will be highlighted in this section of the field guide:
1. Make random the standard2. Strive to be precise3. Include what you can use4. Use what you know5. The sky is not the limit
Organization of this Section of the Field Guide
I. Where Do We Start?II. Simple Random SamplingIII. Alternatives to Simple Random Sampling
• Cluster Sampling--Shortcomings of Cluster Sampling
• Improving on the Traditional 30-Cluster Design--Parallel Sampling
• Stratified Sampling--LQAS—A Special Form of Stratified Sampling
IV. Summary of Simple Random, Cluster, and Stratified SamplingV. Decision Trees for Designing a Sampling Strategy
• Is Simple Random Sampling Appropriate for Your Project?• Selecting the First Household in a Sample Area• Choosing Respondents Based on the Type of Dwelling• Conducting the Remaining Interviews in a Sample Area
VI. References
5. DESIGN A SAMPLINGSTRATEGY

PRE-IMPLEMENTATION PHASE(DRAFT)
KPC2000+ Field Guide (DRAFT)August 2001
60
I. WHERE DO WE START?
When designing a survey, it is important to take aspects of the local context intoaccount. If your PVO is new to the project area, you are probably unfamiliar with thelocal population. Local partners and stakeholders can help to identify information thatshould be considered when designing the sampling strategy as well as thequestionnaire. The following are examples of characteristics to consider:
• geographical distribution of the population• religious, language, and/or ethnic groups• castes/tribes• different household structures (for example, polygamous, female-headed, or child-
headed households)• socioeconomic groups
Child health and well-being might vary according to certain social, cultural, andeconomic characteristics, so it is important to consider whether some of thosedifferences should be explored in the survey. Why is this important? Your project mightwant to document differences at baseline. Then, it can use that information to betterallocate resources and set different program targets for different segments of thepopulation.
In addition to discussing aspects of the local context with stakeholders, look at existingdata sources (such as censuses or community registers) to get a more complete pictureof the target population.
It also helps to get a visual image of the program area. Find out if there are maps of thelocal area. If not, consider preparing one. Map where communities are located and, ifpossible, note major subdivisions (such as wards or health facility catchment areas). Italso helps to include major landmarks (roads, rivers, health facilities, places of worship,schools, and markets) on the map.
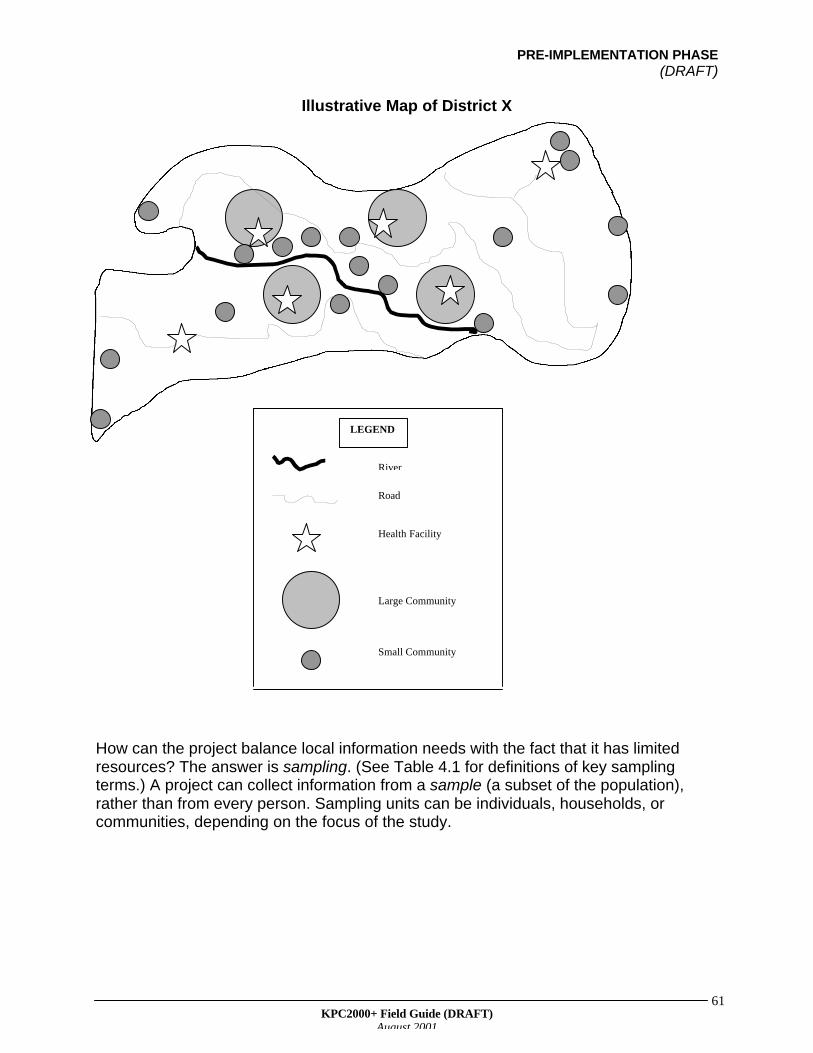
The following page shows a map of a fictitious district (District X). To keep theillustration simple, the map does not include landmarks other than roads. However, byexamining the map, one can get a visual sense of how the population is distributedthroughout the district.
As seen on the map, most of the communities are located close to the river. The districthas four large communities, as well as some remote villages at the edges in the district.At a KPC planning meeting, local stakeholders express a desire to collect informationon remote villages. In addition, someone mentions that the HIV/AIDS epidemic hastaken a toll on the community, which now has many children being raised by personswho are not their biological parents. Should the project hire enumerators to visit everyhousehold so that information is collected on important segments of the population?This would be very costly and time consuming, and the project has a limited amount oftime and resources to collect its baseline data.
PRE-IMPLEMENTATION PHASE(DRAFT)
KPC2000+ Field Guide (DRAFT)August 2001
61
Illustrative Map of District X
How can the project balance local information needs with the fact that it has limitedresources? The answer is sampling. (See Table 4.1 for definitions of key samplingterms.) A project can collect information from a sample (a subset of the population),rather than from every person. Sampling units can be individuals, households, orcommunities, depending on the focus of the study.
River
Health Facility
Large Community
Small Community
Road
LEGEND
PRE-IMPLEMENTATION PHASE(DRAFT)
KPC2000+ Field Guide (DRAFT)August 2001
62
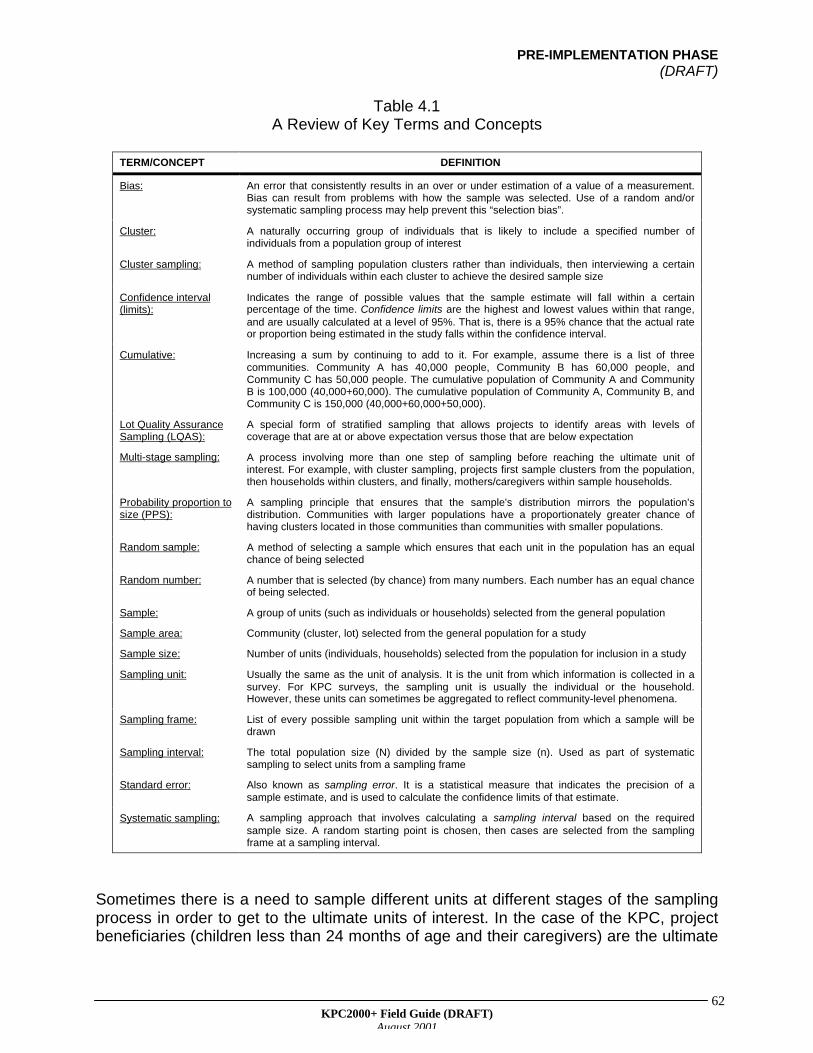
Table 4.1A Review of Key Terms and Concepts
TERM/CONCEPT DEFINITION
Bias: An error that consistently results in an over or under estimation of a value of a measurement.Bias can result from problems with how the sample was selected. Use of a random and/orsystematic sampling process may help prevent this “selection bias”.
Cluster: A naturally occurring group of individuals that is likely to include a specified number ofindividuals from a population group of interest
Cluster sampling: A method of sampling population clusters rather than individuals, then interviewing a certainnumber of individuals within each cluster to achieve the desired sample size
Confidence interval(limits):
Indicates the range of possible values that the sample estimate will fall within a certainpercentage of the time. Confidence limits are the highest and lowest values within that range,and are usually calculated at a level of 95%. That is, there is a 95% chance that the actual rateor proportion being estimated in the study falls within the confidence interval.
Cumulative: Increasing a sum by continuing to add to it. For example, assume there is a list of threecommunities. Community A has 40,000 people, Community B has 60,000 people, andCommunity C has 50,000 people. The cumulative population of Community A and CommunityB is 100,000 (40,000+60,000). The cumulative population of Community A, Community B, andCommunity C is 150,000 (40,000+60,000+50,000).
Lot Quality AssuranceSampling (LQAS):
A special form of stratified sampling that allows projects to identify areas with levels ofcoverage that are at or above expectation versus those that are below expectation
Multi-stage sampling: A process involving more than one step of sampling before reaching the ultimate unit ofinterest. For example, with cluster sampling, projects first sample clusters from the population,then households within clusters, and finally, mothers/caregivers within sample households.
Probability proportion tosize (PPS):
A sampling principle that ensures that the sample's distribution mirrors the population'sdistribution. Communities with larger populations have a proportionately greater chance ofhaving clusters located in those communities than communities with smaller populations.
Random sample: A method of selecting a sample which ensures that each unit in the population has an equalchance of being selected
Random number: A number that is selected (by chance) from many numbers. Each number has an equal chanceof being selected.
Sample: A group of units (such as individuals or households) selected from the general population
Sample area: Community (cluster, lot) selected from the general population for a study
Sample size: Number of units (individuals, households) selected from the population for inclusion in a study
Sampling unit: Usually the same as the unit of analysis. It is the unit from which information is collected in asurvey. For KPC surveys, the sampling unit is usually the individual or the household.However, these units can sometimes be aggregated to reflect community-level phenomena.
Sampling frame: List of every possible sampling unit within the target population from which a sample will bedrawn
Sampling interval: The total population size (N) divided by the sample size (n). Used as part of systematicsampling to select units from a sampling frame
Standard error: Also known as sampling error. It is a statistical measure that indicates the precision of asample estimate, and is used to calculate the confidence limits of that estimate.
Systematic sampling: A sampling approach that involves calculating a sampling interval based on the requiredsample size. A random starting point is chosen, then cases are selected from the samplingframe at a sampling interval.
Sometimes there is a need to sample different units at different stages of the samplingprocess in order to get to the ultimate units of interest. In the case of the KPC, projectbeneficiaries (children less than 24 months of age and their caregivers) are the ultimate
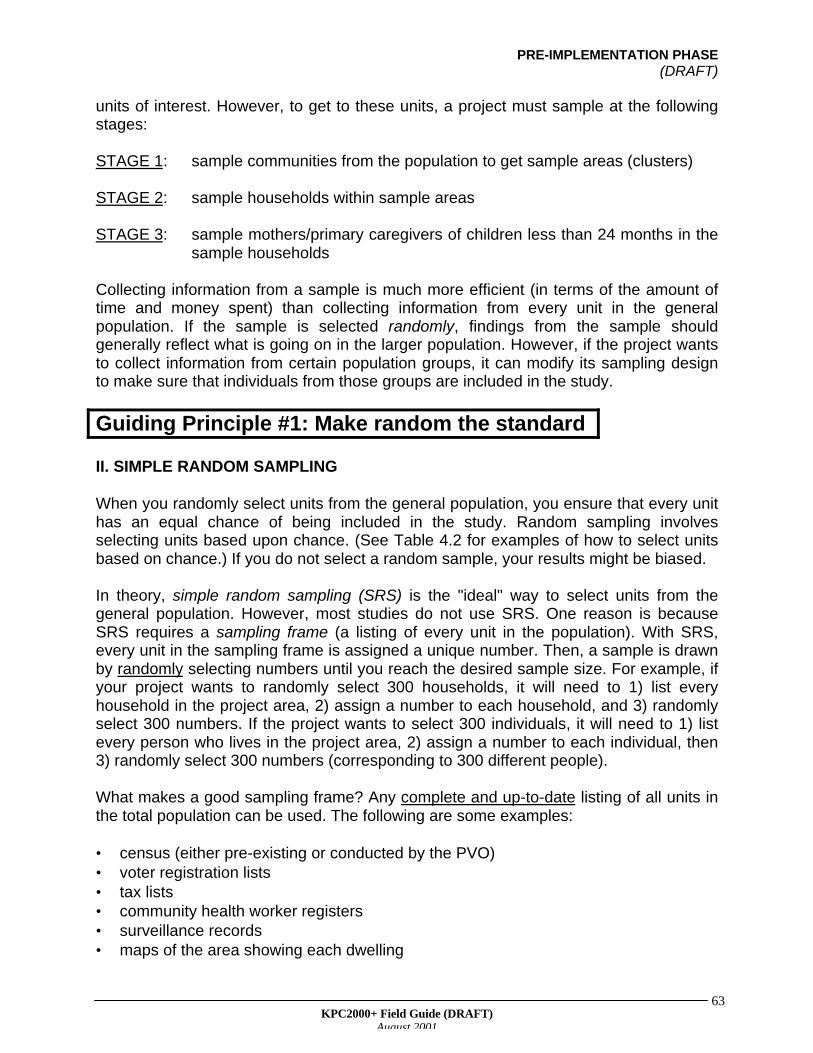
PRE-IMPLEMENTATION PHASE(DRAFT)
KPC2000+ Field Guide (DRAFT)August 2001
63
units of interest. However, to get to these units, a project must sample at the followingstages:
STAGE 1: sample communities from the population to get sample areas (clusters)
STAGE 2: sample households within sample areas
STAGE 3: sample mothers/primary caregivers of children less than 24 months in thesample households
Collecting information from a sample is much more efficient (in terms of the amount oftime and money spent) than collecting information from every unit in the generalpopulation. If the sample is selected randomly, findings from the sample shouldgenerally reflect what is going on in the larger population. However, if the project wantsto collect information from certain population groups, it can modify its sampling designto make sure that individuals from those groups are included in the study.
Guiding Principle #1: Make random the standard
II. SIMPLE RANDOM SAMPLING
When you randomly select units from the general population, you ensure that every unithas an equal chance of being included in the study. Random sampling involvesselecting units based upon chance. (See Table 4.2 for examples of how to select unitsbased on chance.) If you do not select a random sample, your results might be biased.
In theory, simple random sampling (SRS) is the "ideal" way to select units from thegeneral population. However, most studies do not use SRS. One reason is becauseSRS requires a sampling frame (a listing of every unit in the population). With SRS,every unit in the sampling frame is assigned a unique number. Then, a sample is drawnby randomly selecting numbers until you reach the desired sample size. For example, ifyour project wants to randomly select 300 households, it will need to 1) list everyhousehold in the project area, 2) assign a number to each household, and 3) randomlyselect 300 numbers. If the project wants to select 300 individuals, it will need to 1) listevery person who lives in the project area, 2) assign a number to each individual, then3) randomly select 300 numbers (corresponding to 300 different people).
What makes a good sampling frame? Any complete and up-to-date listing of all units inthe total population can be used. The following are some examples:
• census (either pre-existing or conducted by the PVO)• voter registration lists• tax lists• community health worker registers• surveillance records• maps of the area showing each dwelling
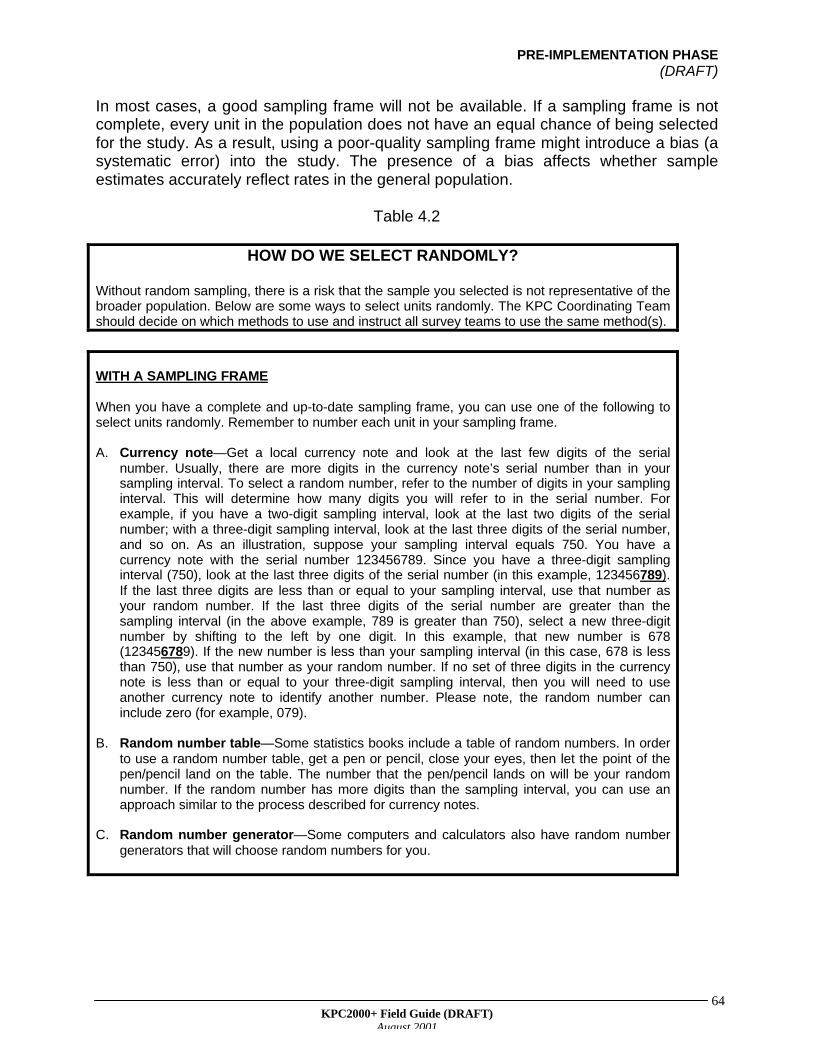
PRE-IMPLEMENTATION PHASE(DRAFT)
KPC2000+ Field Guide (DRAFT)August 2001
64
In most cases, a good sampling frame will not be available. If a sampling frame is notcomplete, every unit in the population does not have an equal chance of being selectedfor the study. As a result, using a poor-quality sampling frame might introduce a bias (asystematic error) into the study. The presence of a bias affects whether sampleestimates accurately reflect rates in the general population.
Table 4.2
HOW DO WE SELECT RANDOMLY?
Without random sampling, there is a risk that the sample you selected is not representative of thebroader population. Below are some ways to select units randomly. The KPC Coordinating Teamshould decide on which methods to use and instruct all survey teams to use the same method(s).
WITH A SAMPLING FRAME
When you have a complete and up-to-date sampling frame, you can use one of the following toselect units randomly. Remember to number each unit in your sampling frame.
A. Currency note—Get a local currency note and look at the last few digits of the serialnumber. Usually, there are more digits in the currency note’s serial number than in yoursampling interval. To select a random number, refer to the number of digits in your samplinginterval. This will determine how many digits you will refer to in the serial number. Forexample, if you have a two-digit sampling interval, look at the last two digits of the serialnumber; with a three-digit sampling interval, look at the last three digits of the serial number,and so on. As an illustration, suppose your sampling interval equals 750. You have acurrency note with the serial number 123456789. Since you have a three-digit samplinginterval (750), look at the last three digits of the serial number (in this example, 123456789).If the last three digits are less than or equal to your sampling interval, use that number asyour random number. If the last three digits of the serial number are greater than thesampling interval (in the above example, 789 is greater than 750), select a new three-digitnumber by shifting to the left by one digit. In this example, that new number is 678(123456789). If the new number is less than your sampling interval (in this case, 678 is lessthan 750), use that number as your random number. If no set of three digits in the currencynote is less than or equal to your three-digit sampling interval, then you will need to useanother currency note to identify another number. Please note, the random number caninclude zero (for example, 079).
B. Random number table—Some statistics books include a table of random numbers. In orderto use a random number table, get a pen or pencil, close your eyes, then let the point of thepen/pencil land on the table. The number that the pen/pencil lands on will be your randomnumber. If the random number has more digits than the sampling interval, you can use anapproach similar to the process described for currency notes.
C. Random number generator—Some computers and calculators also have random numbergenerators that will choose random numbers for you.

PRE-IMPLEMENTATION PHASE(DRAFT)
KPC2000+ Field Guide (DRAFT)August 2001
65
Table 4.2 (continued)
HOW DO WE SELECT RANDOMLY?
WITHOUT A SAMPLING FRAMEWhen you do not have a sampling frame, you can use one of the following options:
A. Flip a coinB. Select using slips of paperC. Spin the bottleD. Divide the area into smaller and smaller sub-areas
Options A and B are helpful when you have a small number of choices, whereas options C and Dare appropriate when you have a large number of choices. Options C and D are particularlyuseful when selecting a starting household within a sample area (that is, a cluster or lot).
A. Flip a coin—When a decision only involves two choices (such as “Go left or go right?” or“Visit house A or house B?”), you can flip a coin to make sure that the selection processremains random. Be sure to decide which side represents which option before flipping thecoin.
B. Use slips of paper—When there are only a few options, you can write those choices onsmall slips of paper, then randomly select one slip of paper. For example, if you are trying todecide which of 10 houses to use as your starting point, number the houses from 1–10 andwrite each number on a small slip of paper. Place all of the slips in an envelope, sack, orother container, then remove one of the slips. The house that corresponds to the number thatyou selected will be your starting point.
C. “Spin the bottle”—The “spin the bottle” technique has been used widely in KPC surveys toidentify the starting point within a sample area. Spinning a bottle (or a ballpoint pen) at thecenter of the community helps the survey team randomly choose a direction to follow. Inorder to select by spinning a bottle, do the following:
1. Go to the population center of the sample area (the point in the community where thepopulation is about equally distributed on all sides).
2. Select a smooth, level spot where you can place the bottle.3. Spin the bottle.4. When the bottle stops spinning, determine which direction the mouth of the bottle is
pointing. The survey team should go in the direction that the bottle is pointing.
*NOTE: If two survey teams are conducting interviews in the same area, they should go inopposite directions. In other words, one team goes in the direction selected by the spinning bottle,and the other team goes in the opposite direction.
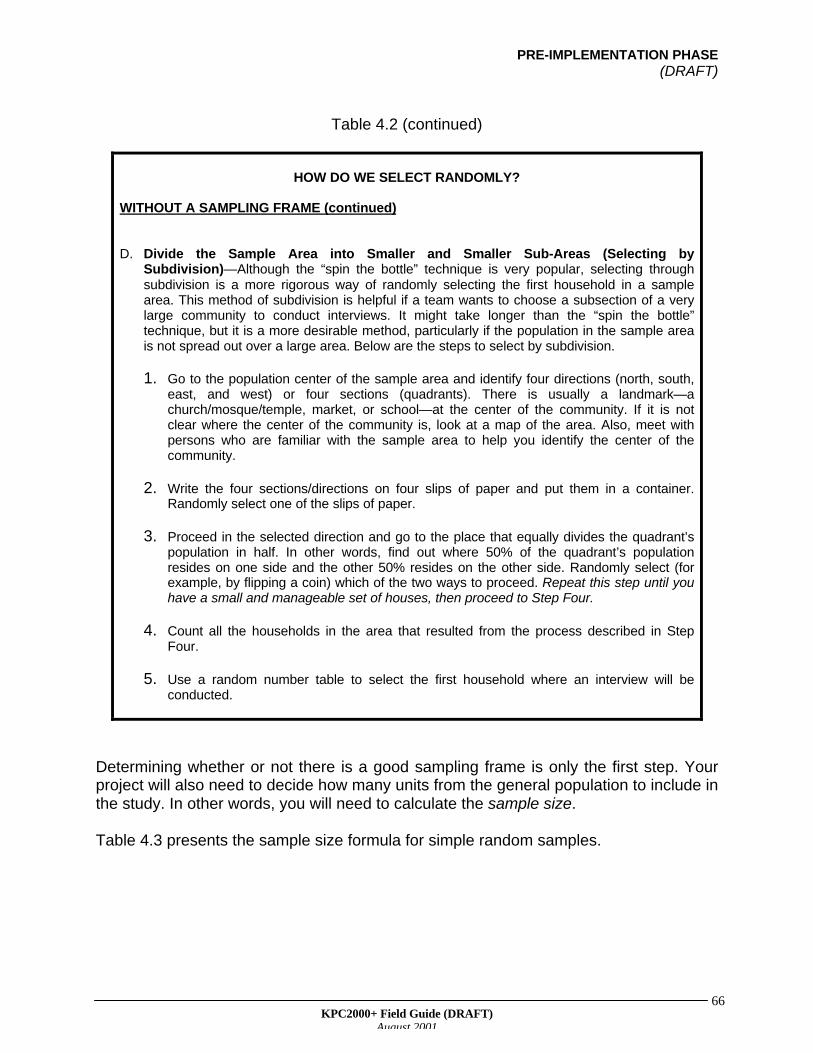
PRE-IMPLEMENTATION PHASE(DRAFT)
KPC2000+ Field Guide (DRAFT)August 2001
66
Table 4.2 (continued)
HOW DO WE SELECT RANDOMLY?
WITHOUT A SAMPLING FRAME (continued)
D. Divide the Sample Area into Smaller and Smaller Sub-Areas (Selecting bySubdivision)—Although the “spin the bottle” technique is very popular, selecting throughsubdivision is a more rigorous way of randomly selecting the first household in a samplearea. This method of subdivision is helpful if a team wants to choose a subsection of a verylarge community to conduct interviews. It might take longer than the “spin the bottle”technique, but it is a more desirable method, particularly if the population in the sample areais not spread out over a large area. Below are the steps to select by subdivision.
1. Go to the population center of the sample area and identify four directions (north, south,east, and west) or four sections (quadrants). There is usually a landmark—achurch/mosque/temple, market, or school—at the center of the community. If it is notclear where the center of the community is, look at a map of the area. Also, meet withpersons who are familiar with the sample area to help you identify the center of thecommunity.
2. Write the four sections/directions on four slips of paper and put them in a container.Randomly select one of the slips of paper.
3. Proceed in the selected direction and go to the place that equally divides the quadrant’spopulation in half. In other words, find out where 50% of the quadrant’s populationresides on one side and the other 50% resides on the other side. Randomly select (forexample, by flipping a coin) which of the two ways to proceed. Repeat this step until youhave a small and manageable set of houses, then proceed to Step Four.
4. Count all the households in the area that resulted from the process described in StepFour.
5. Use a random number table to select the first household where an interview will beconducted.
Determining whether or not there is a good sampling frame is only the first step. Yourproject will also need to decide how many units from the general population to include inthe study. In other words, you will need to calculate the sample size.
Table 4.3 presents the sample size formula for simple random samples.
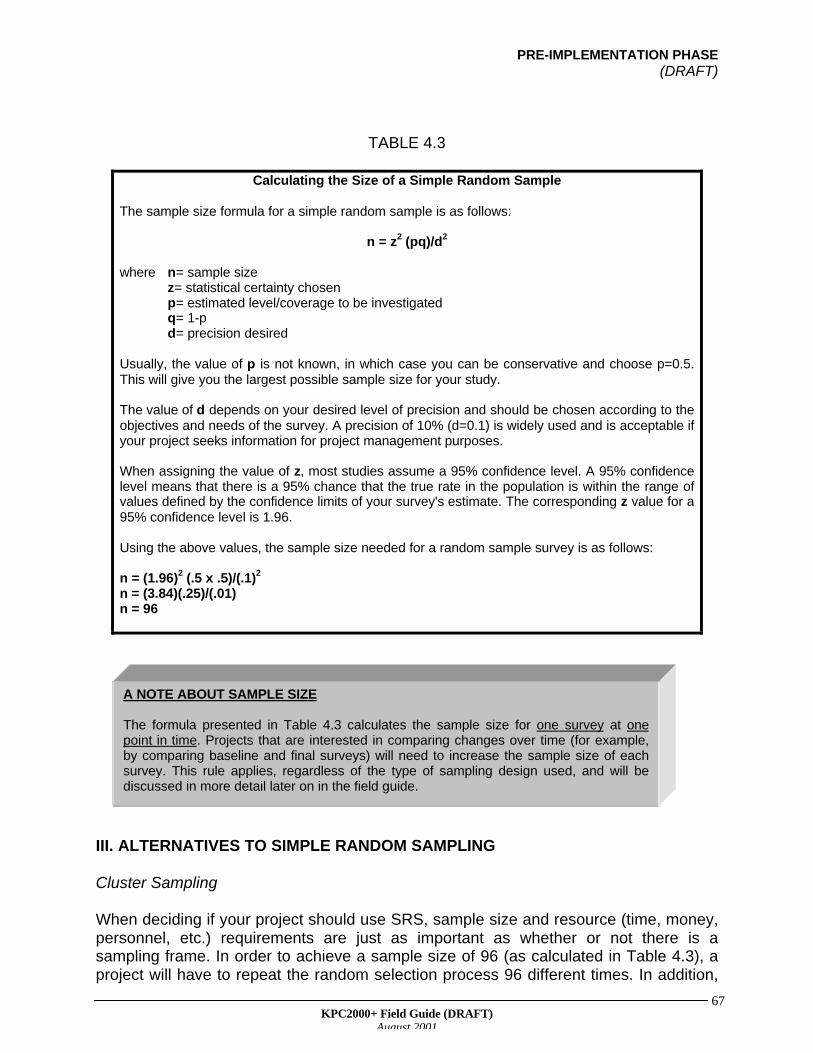
PRE-IMPLEMENTATION PHASE(DRAFT)
KPC2000+ Field Guide (DRAFT)August 2001
67
TABLE 4.3
Calculating the Size of a Simple Random Sample
The sample size formula for a simple random sample is as follows:
n = z2 (pq)/d2
where n= sample sizez= statistical certainty chosenp= estimated level/coverage to be investigatedq= 1-pd= precision desired
Usually, the value of p is not known, in which case you can be conservative and choose p=0.5.This will give you the largest possible sample size for your study.
The value of d depends on your desired level of precision and should be chosen according to theobjectives and needs of the survey. A precision of 10% (d=0.1) is widely used and is acceptable ifyour project seeks information for project management purposes.
When assigning the value of z, most studies assume a 95% confidence level. A 95% confidencelevel means that there is a 95% chance that the true rate in the population is within the range ofvalues defined by the confidence limits of your survey's estimate. The corresponding z value for a95% confidence level is 1.96.
Using the above values, the sample size needed for a random sample survey is as follows:
n = (1.96)2 (.5 x .5)/(.1)2
n = (3.84)(.25)/(.01)n = 96
III. ALTERNATIVES TO SIMPLE RANDOM SAMPLING
Cluster Sampling
When deciding if your project should use SRS, sample size and resource (time, money,personnel, etc.) requirements are just as important as whether or not there is asampling frame. In order to achieve a sample size of 96 (as calculated in Table 4.3), aproject will have to repeat the random selection process 96 different times. In addition,
A NOTE ABOUT SAMPLE SIZE
The formula presented in Table 4.3 calculates the sample size for one survey at onepoint in time. Projects that are interested in comparing changes over time (for example,by comparing baseline and final surveys) will need to increase the sample size of eachsurvey. This rule applies, regardless of the type of sampling design used, and will bediscussed in more detail later on in the field guide.
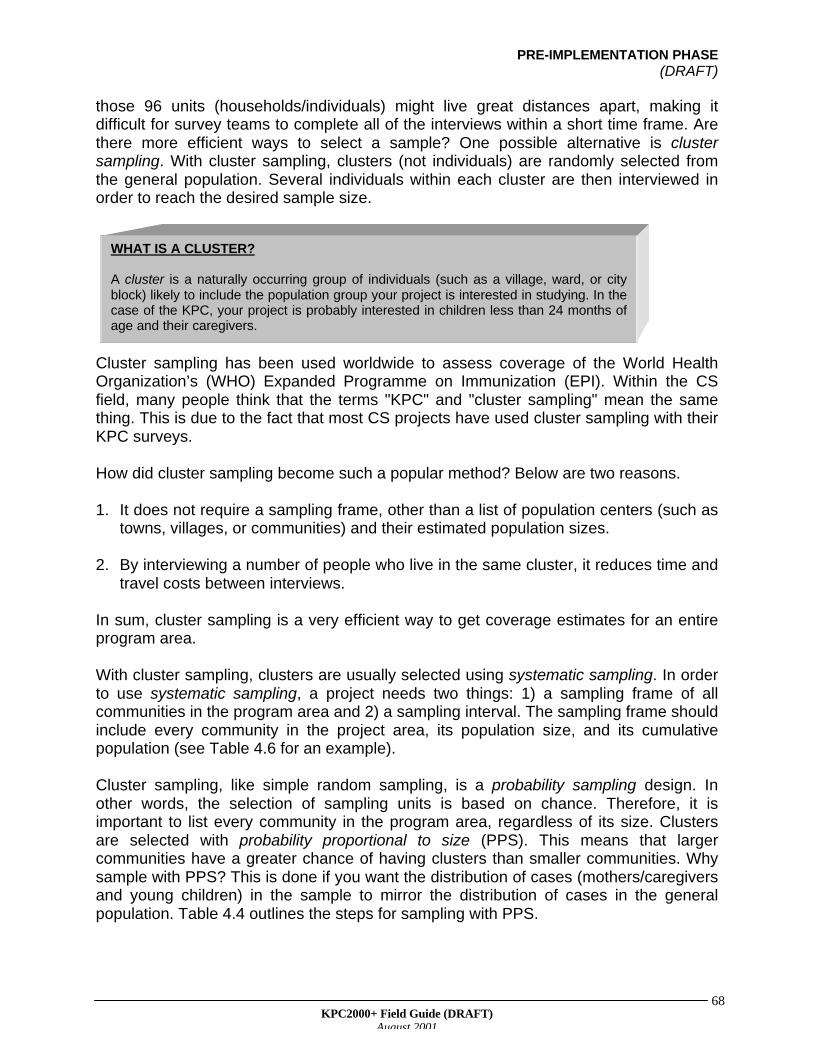
PRE-IMPLEMENTATION PHASE(DRAFT)
KPC2000+ Field Guide (DRAFT)August 2001
68
those 96 units (households/individuals) might live great distances apart, making itdifficult for survey teams to complete all of the interviews within a short time frame. Arethere more efficient ways to select a sample? One possible alternative is clustersampling. With cluster sampling, clusters (not individuals) are randomly selected fromthe general population. Several individuals within each cluster are then interviewed inorder to reach the desired sample size.
Cluster sampling has been used worldwide to assess coverage of the World HealthOrganization’s (WHO) Expanded Programme on Immunization (EPI). Within the CSfield, many people think that the terms "KPC" and "cluster sampling" mean the samething. This is due to the fact that most CS projects have used cluster sampling with theirKPC surveys.
How did cluster sampling become such a popular method? Below are two reasons.
1. It does not require a sampling frame, other than a list of population centers (such astowns, villages, or communities) and their estimated population sizes.
2. By interviewing a number of people who live in the same cluster, it reduces time andtravel costs between interviews.
In sum, cluster sampling is a very efficient way to get coverage estimates for an entireprogram area.
With cluster sampling, clusters are usually selected using systematic sampling. In orderto use systematic sampling, a project needs two things: 1) a sampling frame of allcommunities in the program area and 2) a sampling interval. The sampling frame shouldinclude every community in the project area, its population size, and its cumulativepopulation (see Table 4.6 for an example).
Cluster sampling, like simple random sampling, is a probability sampling design. Inother words, the selection of sampling units is based on chance. Therefore, it isimportant to list every community in the program area, regardless of its size. Clustersare selected with probability proportional to size (PPS). This means that largercommunities have a greater chance of having clusters than smaller communities. Whysample with PPS? This is done if you want the distribution of cases (mothers/caregiversand young children) in the sample to mirror the distribution of cases in the generalpopulation. Table 4.4 outlines the steps for sampling with PPS.
WHAT IS A CLUSTER?
A cluster is a naturally occurring group of individuals (such as a village, ward, or cityblock) likely to include the population group your project is interested in studying. In thecase of the KPC, your project is probably interested in children less than 24 months ofage and their caregivers.

PRE-IMPLEMENTATION PHASE(DRAFT)
KPC2000+ Field Guide (DRAFT)August 2001
69
Table 4.4
STEPS FOR SAMPLING CLUSTERS WITH PROBABILITY PROPORTIONAL TO SIZE (PPS)
1. Calculate the sample size based on the desired level of precision and confidence. Most KPCsurveys use a sample size equal to 300.
2. Determine the number of interviews per cluster. It is suggested that your project aim toconduct 10 interviews in each cluster.
3. Divide the sample size by the number of interviews in each cluster. This will give you thenumber of clusters. If you plan for a sample size of 300 and a cluster size of 10 interviews ineach cluster, you will have 30 clusters in your survey.
4. Refer to existing population data to get the size (number of residents) of eachvillage/town/ward in the program area.
5. Calculate the cumulative population of each village/town/ward by summing the totalpopulation of the village with the combined total population of all the preceding villages on thelist (see Table 4.6). NOTE: the cumulative population of the last community listed in thesampling frame should equal the total population of the entire program area. If this is not thecase, re-check your calculations.
6. Determine the sampling interval by dividing the total population of the entire program area bythe total number of clusters.
7. Choose a random number. This number will be used to identify the starting point on the list tobegin selecting clusters. The random number must be less than or equal to the samplinginterval. As an example, if the sampling interval is 10,039 (see example in Table 4.5), youwould select a random number between 1 and 10,039. As an example, assume that you usedone of the techniques presented in Table 4.2 for selecting a random number, and chose9,679 as the random number.
8. Look at the column where you have listed the cumulative population of each community anddetermine which community contains (that is, the cumulative population equals or exceeds)the random number. This is Cluster #1. In Table 4.6, Utaral (the first community listed in thesampling frame) has a cumulative population that equals or exceeds the random numberchosen in STEP 7.
9. To identify the second community where a cluster is located, add the sampling interval(10,039) to the random number selected in STEP 7 (9,679). The community whosecumulative population equals or exceeds that number is the location of Cluster #2. Using thedata in Tables 4.5 and 4.6, Cluster #2 is located in Talum because 10,039+9,679=19,718,and the cumulative population in Talum includes that number.
10. To identify the remaining clusters, add the sampling interval to the number that identified thelocation of the previous cluster.
*NOTE: A community can contain more than one cluster.
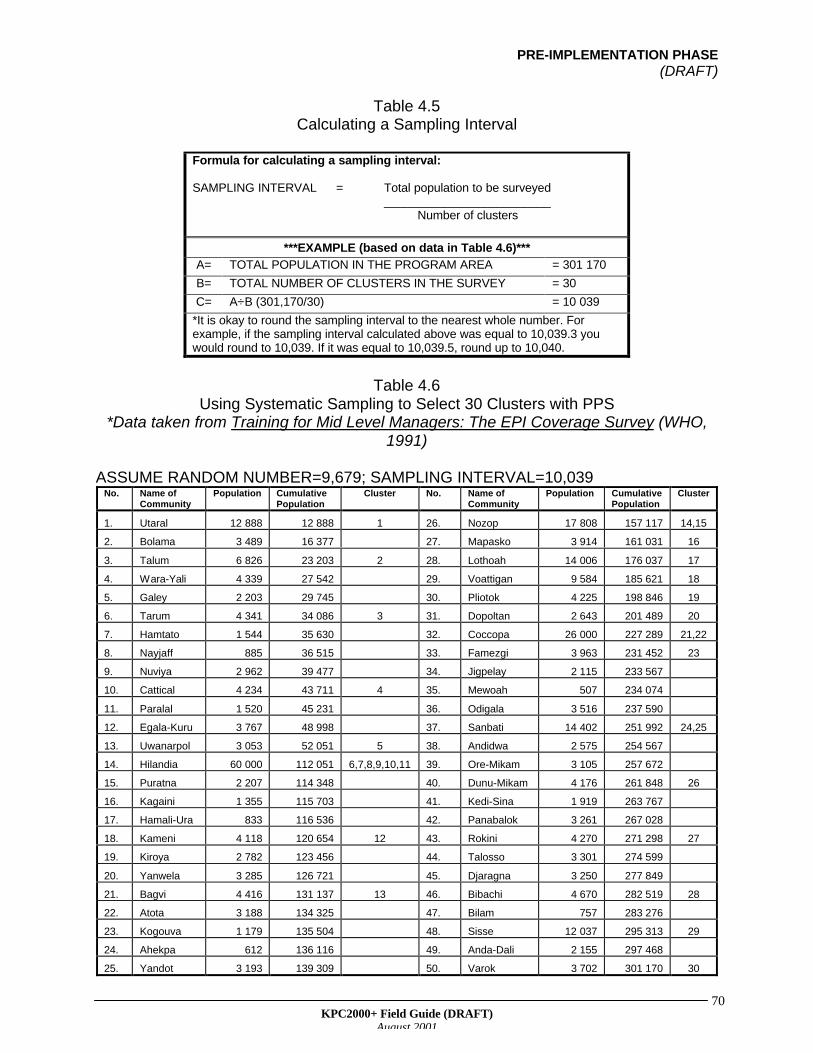
PRE-IMPLEMENTATION PHASE(DRAFT)
KPC2000+ Field Guide (DRAFT)August 2001
70
Table 4.5Calculating a Sampling Interval
Formula for calculating a sampling interval:
SAMPLING INTERVAL = Total population to be surveyed_________________________ Number of clusters
***EXAMPLE (based on data in Table 4.6)***
A= TOTAL POPULATION IN THE PROGRAM AREA = 301 170
B= TOTAL NUMBER OF CLUSTERS IN THE SURVEY = 30
C= A÷B (301,170/30) = 10 039
*It is okay to round the sampling interval to the nearest whole number. Forexample, if the sampling interval calculated above was equal to 10,039.3 youwould round to 10,039. If it was equal to 10,039.5, round up to 10,040.
Table 4.6Using Systematic Sampling to Select 30 Clusters with PPS
*Data taken from Training for Mid Level Managers: The EPI Coverage Survey (WHO,1991)
ASSUME RANDOM NUMBER=9,679; SAMPLING INTERVAL=10,039No. Name of
CommunityPopulation Cumulative
PopulationCluster No. Name of
CommunityPopulation Cumulative
PopulationCluster
1. Utaral 12 888 12 888 1 26. Nozop 17 808 157 117 14,15
2. Bolama 3 489 16 377 27. Mapasko 3 914 161 031 16
3. Talum 6 826 23 203 2 28. Lothoah 14 006 176 037 17
4. Wara-Yali 4 339 27 542 29. Voattigan 9 584 185 621 18
5. Galey 2 203 29 745 30. Pliotok 4 225 198 846 19
6. Tarum 4 341 34 086 3 31. Dopoltan 2 643 201 489 20
7. Hamtato 1 544 35 630 32. Coccopa 26 000 227 289 21,22
8. Nayjaff 885 36 515 33. Famezgi 3 963 231 452 23
9. Nuviya 2 962 39 477 34. Jigpelay 2 115 233 567
10. Cattical 4 234 43 711 4 35. Mewoah 507 234 074
11. Paralal 1 520 45 231 36. Odigala 3 516 237 590
12. Egala-Kuru 3 767 48 998 37. Sanbati 14 402 251 992 24,25
13. Uwanarpol 3 053 52 051 5 38. Andidwa 2 575 254 567
14. Hilandia 60 000 112 051 6,7,8,9,10,11 39. Ore-Mikam 3 105 257 672
15. Puratna 2 207 114 348 40. Dunu-Mikam 4 176 261 848 26
16. Kagaini 1 355 115 703 41. Kedi-Sina 1 919 263 767
17. Hamali-Ura 833 116 536 42. Panabalok 3 261 267 028
18. Kameni 4 118 120 654 12 43. Rokini 4 270 271 298 27
19. Kiroya 2 782 123 456 44. Talosso 3 301 274 599
20. Yanwela 3 285 126 721 45. Djaragna 3 250 277 849
21. Bagvi 4 416 131 137 13 46. Bibachi 4 670 282 519 28
22. Atota 3 188 134 325 47. Bilam 757 283 276
23. Kogouva 1 179 135 504 48. Sisse 12 037 295 313 29
24. Ahekpa 612 136 116 49. Anda-Dali 2 155 297 468
25. Yandot 3 193 139 309 50. Varok 3 702 301 170 30
PRE-IMPLEMENTATION PHASE(DRAFT)
KPC2000+ Field Guide (DRAFT)August 2001
71
Going back to the illustrative map at the beginning of this chapter, there are four largevillages in District X. Suppose that 60% of the population in District X lives in those fourcommunities. If we sample with probability proportional to size, we will select themajority of clusters from those four villages, which will result in a sample distribution thatis similar to the population distribution in the district. If there is a particular interest incollecting information from small, remote villages (for example, if stakeholders claim thatchildren in those villages are more at risk for poor health outcomes), then the projectcan modify its sampling strategy (for example, by dividing the project area into twogroups: small communities and large communities, then selecting a certain proportion ofyour respondents from small communities) to make sure that there are enough casesfrom remote villages.
In addition to issues related to cluster selection, other sampling issues will arise whenselecting households. The process of establishing the correct starting point in eachcluster is critical because a cluster is formed from the first household selected.Therefore, any bias resulting from how that household was selected might invalidate theentire cluster. It is important to avoid selecting a starting household because of factorslike convenience or the identity of the owner. Remember: random selection is thestandard.
How can your project stay true to the random selection process? Randomly samplingfrom a large area can be both expensive and difficult. However, if it is possible tosubdivide a large area into areas of smaller size (geographically and/or in terms of thenumber of residents) it becomes more practical to select a random sample. Refer backto Table 4.2 for information on how to select by subdivision.
IMPORTANT ACTIVITIES AFTER CLUSTERS ARE SELECTED
Once your project selects clusters for the survey, it is important to visit those sampleareas before data collection begins. Members of the KPC Coordinating Team shouldhave already met with community leaders at the beginning of the pre-implementationphase in order to assess their needs and concerns and get community support for thesurvey. As a courtesy, field supervisors could visit the community leader in each samplearea and let him/her know that the project and its local partners will be conductinginterviews in their communities.
Community leaders can also provide useful information in terms of the layout ofhouseholds within the sample area. It helps to draw maps of each sample area with thelocations of each household. Survey teams can use this to at least select the startinghousehold. If it is possible to identify all households with children less than 24 months,then the village leader can work with the survey team to randomly select 10 householdsto visit. Ask the village leader to encourage the participation of selected households inthe survey. Your local partners, who might already have a rapport with the targetcommunities, can be very helpful in communicating with the target areas, particularly ifyour project is new to the geographic area.
PRE-IMPLEMENTATION PHASE(DRAFT)
KPC2000+ Field Guide (DRAFT)August 2001
72
Consider natural subunits within the cluster such as kindreds, paras, wards, or othersubdivision units. There might not be a sampling frame for the project area as a whole,but in most instances there is some way of keeping track of households in smallerdivisions within the project area. Within a particular community, the village or tribe headprobably has a way of keeping track of members of the village/tribe. The supervisor canmeet with the village head to find out if a list exists, or they can map out the generallocation of all households. To encourage ownership and consensus, the supervisorcould ask the village leader to randomly select households with children under age twoby drawing slips of paper from a bag. The leader could also assist the survey team inarranging the interviews. Remember to keep the process of selecting householdsrandom. Interviewers should not visit a particular household just because a communityleader says they should.
After identifying the starting household in a cluster, most projects use the "nearest door"rule when selecting the remaining nine households in that cluster. In other words, aftercompleting an interview, interviewers visit the household whose front door is closest tothe door of the household they just visited.
The decision trees at the end of this chapter will guide your project in developingprotocols for selecting multiple clusters (sample areas) within the same community, aswell as in selecting households and respondents within each sample area.
Shortcomings of Cluster Sampling
Despite its advantages, there are a few things to remember when deciding whether touse cluster sampling:
SUGGESTION:
The selection of the first household is a critical and sometimes time-consuming step in theKPC process. Consider having survey teams visit each sample area a day before startinginterviews to correctly identify the starting household within each sample area.
WHAT IS A HOUSEHOLD?
A household is a group of people sharing the same kitchen, cooking area, or cooking pot.
There can be many nuclear units (each consisting of a man, his wife, and their children)within the same household, but if these units share the same cooking area, it is likely thatthey also share the same knowledge and behavior. If information is collected on more thanone child in the same household, you will probably overrepresent practices and behaviors(for example, infant feeding practices, care-seeking practices) of that particular household inyour sample. As a result, interviewers should collect information on only one child withineach selected household.
PRE-IMPLEMENTATION PHASE(DRAFT)
KPC2000+ Field Guide (DRAFT)August 2001
73
1. Its inability to provide information on subdivisions within the program area2. The design effect
A cluster survey provides a project with coverage estimates for the entire program area.If your project wants coverage estimates for different management units (for example,supervision areas or health-facility catchment areas) in the program area, it will need toexplore other sampling strategies.
Another important point to consider is that people of the same religion, socioeconomicstatus, or language/ethnic group tend to live closely together. Individuals who sharethese background traits are also likely to share similar behaviors and practices. This“sameness” (homogeneity) leads to a bias called the design effect. The design effectexists because individuals selected from neighboring households within a given clusterare more likely to share the same knowledge and practices than individuals who areselected randomly from the general population. To compensate for this bias, the sizeof a cluster sample should be approximately double the size of a simple randomsample.
The sample size formula in Table 4.3 resulted in a sample size of 96. Multiplying 96 by2 equals 192. For EPI 30-cluster surveys, the sample size is increased to 210 becauseit can be easily divided between 30 clusters (7 interviews in each cluster). For KPCsurveys, the sample size is further increased to 300 (10 interviews in each cluster)because KPC surveys are used to estimate coverage for many different technicalinterventions, not just for immunization. A sample size of at least 300 is usuallyadequate for looking at sub-samples (such as children age 0–5 months to assessexclusive breastfeeding), because the objective is to use KPC information to makemanagement and programming decisions.
Improving on the Traditional 30-Cluster Design
As mentioned before, the traditional 30-cluster sampling design is widely accepted andis an efficient way to collect program-wide data. However, if your project wants togenerate more precise and/or programmatically meaningful data, it can make changesto the cluster design, or choose another methodology altogether.
Guiding Principle #2: Strive to be precise
Surveys give us estimates of actual rates or proportions that exist within the generalpopulation. Because a project is estimating rates based on a sample, it should neverregard an estimate from the KPC as an absolute number. Each sample estimate fallswithin a range of possible values. This range is defined by the confidence limits.Confidence limits indicate the margin of error associated with a sample estimate. Whenwe estimate a rate or proportion in a study, we expect the confidence interval to includethe actual rate most of the time. How often is most of the time? Phrases like “95%confidence” give us an idea. When you calculate 95% confidence limits, you assumethat there is a 95% chance that the actual rate being estimated by the survey falls withinthe confidence interval. The terms “confidence limits” and “confidence interval” are often
PRE-IMPLEMENTATION PHASE(DRAFT)
KPC2000+ Field Guide (DRAFT)August 2001
74
used interchangeably. A confidence interval is the range of possible values, whereasthe confidence limits are the lowest and highest values within that range.
The following formula can be used to calculate the confidence limits of each estimate:
P = p + za %%(pq)/n
where: P = the actual rate/proportion in the general population
p = the survey estimate
q = 1-p
za = the confidence level (with a 95% confidence level, this value equals1.96)
n = sample size
The value for (za %%(pq)/n) is the margin of error. As an example, assume that your KPCsurvey gave a point estimate of 40% for the percentage of children with diarrhea whoreceived ORT, and that the margin of error for that estimate was + 9 %. This means thatalthough 40% is our best estimate, the actual rate of ORT use may be as low as 31%(40- 9) or as high as 49% (40+9).
Although projects should expect some variation in survey estimates, they should aim tobe as precise as possible. Confidence limits are determined by a statistical measureknown as the standard error (also known as sampling error). A precise estimate is onethat has a small standard error (and therefore a narrow confidence interval). A less-precise estimate has a larger standard error and a wider confidence interval. These areimportant concepts to understand because if precision is high, there is a greater chancethat estimates from the sample reflect what is really going on in the population as awhole.
Precision generally increases as the sample size increases. However, it is alsoimportant to remember that precision can vary by indicator. This is because some KPCindicators are limited to a smaller number of cases (sub-samples), whereas others arebased on a larger number of cases.
The KPC was not originally designed to measure improvements in the target populationover time, but rather to do the following:
a) Identify local problems at baseline so that the project can set program objectives
b) Assess whether program objectives have been met (usually done at the end ofproject).

PRE-IMPLEMENTATION PHASE(DRAFT)
KPC2000+ Field Guide (DRAFT)August 2001
75
A sample size calculation of 300 takes into account the lack of precision of one estimatein time. Some projects might want to increase the precision of KPC estimates in order tomeasure changes over time. If a project will need to compare baseline results with finalresults, it will have to consider the lack of precision in estimates from two different pointsin time. When comparing two sets of estimates, you do not want their confidenceintervals to overlap. If the intervals overlap, your project cannot be certain that asignificant improvement took place over time. Therefore, in order to measure changesover time, your project would need to either increase the sample size of each KPCsurvey or bring about large changes in coverage through very focused interventions.
As mentioned before, precision increases with increasing sampling size. You canincrease the sample size of a cluster survey in one of two ways:
ü increase the number of clustersV increase the number of interviews conducted in each cluster
Increasing the number of clusters is much more desirable than increasing thenumber of interviews in each cluster. This is due to one factor: the design effect. Asmentioned before, individuals living in the same cluster are likely to share the samebehaviors, practices, and other traits. As you increase the number of interviews in eachcluster, you are likely to include more people who are alike in terms of the knowledgeand practices your project is interested in. Therefore, increasing the number ofinterviews in each cluster increases the design effect. This results in survey estimatesthat are less precise and accurate.
By reducing the homogeneity within each cluster, a project can increase the precision ofits survey estimates. One way to do this is to change the protocol for samplinghouseholds. For example, instead of instructing interviewers to visit the nearesthousehold, your project could instruct interviewers to visit the third closest or fifthclosest household (see illustration below). If you sample households farther apart, they
SAMPLE SIZE CONSIDERATIONS WHEN MEASURING IMPACT
To demonstrate impact, it is important to rule out factors that are not related to the project, butcould have an effect on population outcomes. In an effort to determine the impact of theiractivities, some projects collect data on control or comparison groups (communities that arenot beneficiaries of the project activities but who are otherwise similar to the communities thatare being targeted by the project).
There are many types of control groups. Regardless of the type of control used, a project willhave to compare two sets of estimates: one from communities exposed to the program’sinterventions and the other from communities who were not exposed. The same issues thatarise when comparing estimates from two points in time should also be taken intoconsideration when a project wants to use control group evaluation designs.
*For more information on evaluation designs, refer to the article by Habicht et al (1999) listedunder References.
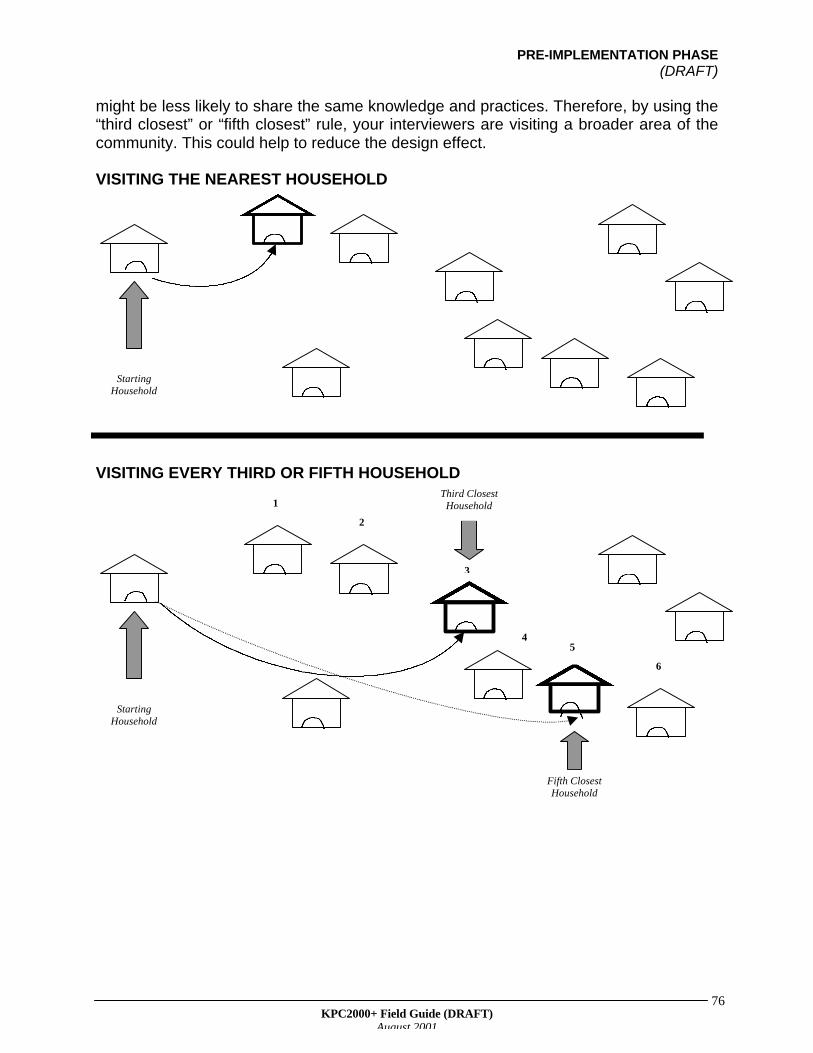
PRE-IMPLEMENTATION PHASE(DRAFT)
KPC2000+ Field Guide (DRAFT)August 2001
76
might be less likely to share the same knowledge and practices. Therefore, by using the“third closest” or “fifth closest” rule, your interviewers are visiting a broader area of thecommunity. This could help to reduce the design effect.
VISITING THE NEAREST HOUSEHOLD
VISITING EVERY THIRD OR FIFTH HOUSEHOLD
StartingHousehold
StartingHousehold
1
2
3
45
6
Fifth ClosestHousehold
Third ClosestHousehold
PRE-IMPLEMENTATION PHASE(DRAFT)
KPC2000+ Field Guide (DRAFT)August 2001
77
There is another way to reduce bias that may result from the selection of householdswithin a cluster. If each survey team is able to meet with the village or tribal leader andcreate a sampling frame (if one does not already exist), then interviewers can randomlyselect 10 households from that sampling frame.
Even though it is better to increase the number of clusters, this will also increase surveycosts. Unless there is a reason to select more than 30 clusters, it is probably not worththe effort. Why would a project go through the extra trouble of collecting data fromadditional clusters? One major reason is to be able to make comparisons betweendifferent parts of the target population. For example:
• To compare rural and urban/peri-urban communities• To compare different districts within the same program area• For projects that are expanding the reach of program activities to additional
communities: to compare newly added communities with communities that arealready being target by the project
In the scenario presented at the beginning of this chapter, local stakeholders of thefictitious project in District X expressed a desire to include remote villages in thebaseline assessment. The project could respond to this request by conducting a certainproportion of KPC interviews in remote areas, then compare this data with data fromcases in more centralized communities.
In instances such as the ones listed above, it makes sense to have an equal number ofclusters in each stratum (group). Can a project choose to maintain the 30-clusterdesign, selecting 15 clusters from one group and 15 clusters from the other? Although150 cases (10 interviews x 15 clusters) in each groups seems like a fairly large number,it is important to remember that many KPC measures are based on sub-samples. Forexample, in a sample of 150 children age 0–23 months, there might only be between 30and 40 children age 0–5 months. Because you do not want to compromise theprecision of certain estimates, it is best to increase the total sample size of the surveybeyond 300 cases.
It is not always necessary to select 30 clusters from each group that you are interestedin comparing. Your project will need to decide on the minimum difference that it wouldlike to discover between groups, then calculate the sample size in each group using thefollowing formula:
REDUCING HOMOGENEITY AT WHAT COST?
Reducing homogeneity within each cluster might improve the precision of your survey’sestimates. However, your project should keep in mind that it might also take interviewers longerto complete the 10 interviews required in each cluster. This is especially true if populations arevery dispersed (households are located far apart from each other). Once again, you will have todecide whether small improvements in precision are worth the extra time and resources.
PRE-IMPLEMENTATION PHASE(DRAFT)
KPC2000+ Field Guide (DRAFT)August 2001
78
n = z2 (p1q1 + p2q2)/d2
where: n = the sample size in each groupz = statistical certainty (for a 95% confidence level, z=1.96)p1 = the estimated proportion in group oneq1 = 1- p1
p2 = the estimated proportion in group twoq2 = 1- p2
d = the desired precision in detecting a difference
Your project will need to make some assumptions in terms of the estimated proportionsin each group. Refer to existing data (MOH data, data from other PVOs or NGOsworking in the same region, DHS studies) to come up with reasonable estimates.
Guiding Principle #3: Include what you can use
Parallel Sampling
More projects are targeting different population groups—not just young children andtheir mothers—in their interventions. For example, husbands or mothers-in-law might bethe targets of special BCC (Behavior Change Communication) messages. Adolescentsmight be the focus of an HIV/AIDS campaign. Nonpregnant women of reproductive age(ages 15–49) might be important targets of activities promoting child spacing, HIV/AIDS,or women’s nutrition awareness.
It is important to collect baseline information on all of your population targets.Sometimes, it is possible to do this through a KPC study, using a technique calledparallel sampling. Parallel sampling is an easy and efficient way to collect informationon different target groups within the same study. With parallel sampling, one randomlyselected household serves as the basis for more than one interview with different typesof respondents. Parallel sampling can be used with different sampling methods, not justcluster sampling.
THE TAKE-HOME MESSAGE: WHEN IS A SAMPLE BIG ENOUGH?
It is important to balance the desire for precision with the amount of effort that has to beinvested to conduct more interviews. Each project that is interested in increasing itssample size should ask: “How much would we gain from the extra effort to collectadditional data?” Unless your project is interested in making comparisons—either acrosstime, between control and intervention communities, or between different segments ofthe target population—a sample size of 300 is probably adequate. Remember: The mainpurpose of the KPC is to provide descriptive data for decisionmaking. It is not intendedfor hypothesis testing or other forms of analytic research.

PRE-IMPLEMENTATION PHASE(DRAFT)
KPC2000+ Field Guide (DRAFT)August 2001
79
By including different types of respondents in a study, your project can maximize theusefulness of the KPC as a planning tool. In addition, parallel sampling can save timeand money that would otherwise be needed to conduct separate studies with eachpopulation group of interest.
Below are some reasons to use parallel sampling.
• To collect special information from certain population groups, for example:
Ø women of reproductive age (child spacing; HIV/AIDS; health contacts/sourcesof information)
Ø husbands (knowledge of maternal, newborn, and child danger signs;treatment of childhood illnesses; child spacing; HIV/AIDS)
Ø mothers-in-law (knowledge of maternal, newborn, and child danger signs;treatment of childhood illnesses; health contacts/sources of information)
Ø non-maternal caregivers (knowledge of maternal, newborn, and child dangersigns; treatment of childhood illnesses; health contacts/sources ofinformation; infant/child feeding; hand washing)
Ø adolescents (HIV/AIDS and other STIs)
• To improve the precision and accuracy of certain types of data
As mentioned before, many KPC indicators refer to sub-samples. Because precision isrelated to sample size, one can expect that an indicator based on a sub-sample will beless precise than an indicator based on the entire sample.
A project can use parallel sampling to make sure that there are adequate numbers ofcases in each sub-sample. For example, the project might decide to divide mothers intotwo groups: mothers of children age 0–11 months and mothers of children age 12–23months. In each cluster, interviewers could conduct 10 interviews for each group ofmothers. This would provide your project with a greater number of cases for sub-samples based on age.
**VERY IMPORTANT: There are usually questions that are asked of all mothers,regardless of the child’s age (for example, treatment and care-seeking practices for sickchildren; hand-washing behavior; child spacing). If this is the case, you do not want tooverrepresent the practices and behaviors of a particular household in your studyby interviewing more than one mother in the same household. Interviewing twomothers who live in the same household increases the design effect because thosemothers probably share similar behaviors and practices. This would result in a biasedassessment.
PRE-IMPLEMENTATION PHASE(DRAFT)
KPC2000+ Field Guide (DRAFT)August 2001
80
There is another benefit to dividing mothers into two groups based on the current age ofthe child. A person is less likely to accurately recall details of events that occurredfurther back in time. This is known as recall bias. Due to this potential bias, someprojects limit questions about pregnancy, delivery, the postpartum period, andimmediate newborn care to mothers of children age 0–11 months only. Because thosemothers were pregnant in the recent past (within the last year), there is a better chanceof them remembering information about the pregnancy.
• To reduce the length of interviews
Because interviewers will direct some questions to certain types of respondents andomit them for others, the time spent interviewing each respondent can be drasticallyreduced.
The following page presents a scenario on using parallel sampling.
AN IMPORTANT RECOMMENDATION WHEN USING PARALLEL SAMPLING
To avoid confusion, your project should create different questionnaires for each target group.For any given target group, the questionnaire should only include questions that you will askof respondents in that group. For example, you would not include questions on breastfeedingpractices or care-seeking practices for sick children in a questionnaire for adolescent males.
Clearly label which questionnaire is for each target group in large letters on the first page ofeach questionnaire. This will make it easier for interviewers to quickly distinguish between thedifferent forms when they are in the field.

PRE-IMPLEMENTATION PHASE(DRAFT)
KPC2000+ Field Guide (DRAFT)August 2001
81
AN EXAMPLE OF PARALLEL SAMPLING
Your project is interested in the following population groups:
1. nonpregnant women age 15–49 years2. mothers of children age 0–11 months3. mothers of children age 12–23 months4. men age 15–49 years
The KPC Coordinating Team has decided to use parallel sampling. In each cluster, it wants to conduct 10interviews for each group, and it has designed a separate questionnaire for each. The two questionnairestargeting men and women of reproductive age only contain questions on knowledge of child spacingmethods, HIV/AIDS, and sexually transmitted diseases.
One of your interviewers visits a household where there are two sisters and their sister-in-law living in thesame household. Each woman has a husband who is between the ages of 15 and 49 and also lives in thehousehold. One of the women is 19 years old and has no children. Her sister is 21 years old and has a childwho is 18 months old. Their sister-in-law has a baby who is 3 weeks old. None of the women are currentlypregnant. What should the interviewer do?
The interviewer can administer three questionnaires in that household:
1. one questionnaire for women age 15–49 years2. one maternal questionnaire (EITHER the one for mothers of children age 0–11 months OR the one for
mothers of children age 12–23 months)3. one questionnaire for men age 15–49 years
Any of the women can answer the questionnaire designed for women age 15–49 years. However, theinterviewer will need to randomly select (see Table 4.2) one of the two mothers in the household, thenadminister the correct questionnaire based on the age of her child. Can the same woman answer questionsfrom both the 15–49 questionnaire and the maternal questionnaire? Yes, if the two questionnaires do notcontain the same questions, or the project will not be aggregating the data from nonpregnant women andmothers of young children. In those instances, it would be okay to administer the two questionnaires to thesame woman. In terms of the men’s questionnaire, the interviewer can randomly select one of the husbandsfor the interview.
Once the interviews are completed, the interviewer can go to the next household. The interviewer andhis/her team members should continue visiting households in that sample area until they have 10 interviewsin each of the four groups. Once the survey team has completed the required number of interviews for aparticular group, it can focus on getting the required number of interviews in the remaining groups. Forexample, assume that the survey team has completed 10 interviews with women age 15–49, 10 interviewswith mothers of children age 0–11 months, 7 interviews with mothers of children age 12–23 months, and 4interviews with men of reproductive age. For the remaining households in that area, the team should onlysample mothers of children age 12–23 months and men age 15–49. Once the team has completed 10interviews in each of those groups, it should move on to the next sample area.
PRE-IMPLEMENTATION PHASE(DRAFT)
KPC2000+ Field Guide (DRAFT)August 2001
82
Guiding Principle #4: Use what you know
Stratified Sampling
For program-wide estimates, cluster sampling is a good option if your project knowsvery little about the target population, and it wants to invest modestly in the datacollection process. However, if your project has information on populationcharacteristics that might influence maternal and child health outcomes, you shouldconsider using that information when designing a KPC. This can be achieved throughstratified sampling. The concept of stratified sampling was introduced earlier, when wediscussed ways to make sure that the KPC sample in the make-believe District Xincluded respondents from remote communities.
There is always a chance that a sample is not fully representative of the generalpopulation. This is especially true if the general population contains only a small numberof people from a particular group (for example, a certain religious or ethnic group). Ifthere is only a small chance that people from a small group will be sampled, there is apossibility that a simple random or cluster sample might not include any (or very few)respondents who are members of that particular group. If your sample does not includekey population groups, or if the proportion of certain groups in your sample differs fromtheir proportion in the larger population, there is a chance that your survey’s estimateswill be inaccurate. In other words, the estimates based on the sample differ from theactual values that exist in the general population.
With both simple random sampling and cluster sampling, there is a chance that certaingroups are not included in the survey. What can a project do to make sure that thesample is representative in terms of a certain characteristic (e.g., urban-rural residence,ethnic group, etc.)? It can use stratified sampling. Through stratified sampling you canmake sure that important population groups are represented in the sample. In addition,by sampling adequate numbers of people in each group, a project can exploredifferences between groups. With stratified sampling, you first subdivide (stratify) thepopulation into more homogeneous strata, according to a characteristic of interest.Then, collect random samples within each subdivision (stratum).
The following are common ways to stratify a sample:
• program management units such as health facility catchment areas or supervisionareas
• by place of residence• by language/ethnic group• by religious group• by socioeconomic status (There may not be existing socioeconomic data for your
program area, but use what you know—for example, information on type of dwelling,access to electricity, ownership of certain durable goods such as bicycles,televisions, etc.)
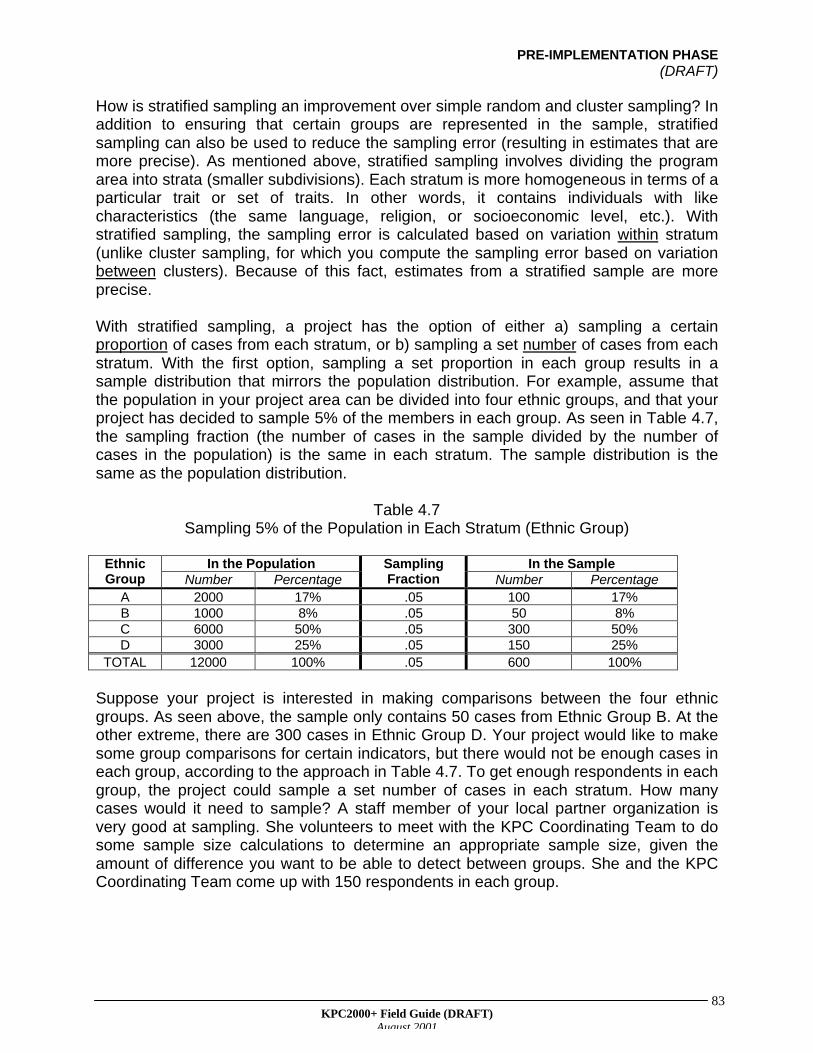
PRE-IMPLEMENTATION PHASE(DRAFT)
KPC2000+ Field Guide (DRAFT)August 2001
83
How is stratified sampling an improvement over simple random and cluster sampling? Inaddition to ensuring that certain groups are represented in the sample, stratifiedsampling can also be used to reduce the sampling error (resulting in estimates that aremore precise). As mentioned above, stratified sampling involves dividing the programarea into strata (smaller subdivisions). Each stratum is more homogeneous in terms of aparticular trait or set of traits. In other words, it contains individuals with likecharacteristics (the same language, religion, or socioeconomic level, etc.). Withstratified sampling, the sampling error is calculated based on variation within stratum(unlike cluster sampling, for which you compute the sampling error based on variationbetween clusters). Because of this fact, estimates from a stratified sample are moreprecise.
With stratified sampling, a project has the option of either a) sampling a certainproportion of cases from each stratum, or b) sampling a set number of cases from eachstratum. With the first option, sampling a set proportion in each group results in asample distribution that mirrors the population distribution. For example, assume thatthe population in your project area can be divided into four ethnic groups, and that yourproject has decided to sample 5% of the members in each group. As seen in Table 4.7,the sampling fraction (the number of cases in the sample divided by the number ofcases in the population) is the same in each stratum. The sample distribution is thesame as the population distribution.
Table 4.7Sampling 5% of the Population in Each Stratum (Ethnic Group)
In the Population In the SampleEthnicGroup Number Percentage
SamplingFraction Number Percentage
A 2000 17% .05 100 17%B 1000 8% .05 50 8%C 6000 50% .05 300 50%D 3000 25% .05 150 25%
TOTAL 12000 100% .05 600 100%
Suppose your project is interested in making comparisons between the four ethnicgroups. As seen above, the sample only contains 50 cases from Ethnic Group B. At theother extreme, there are 300 cases in Ethnic Group D. Your project would like to makesome group comparisons for certain indicators, but there would not be enough cases ineach group, according to the approach in Table 4.7. To get enough respondents in eachgroup, the project could sample a set number of cases in each stratum. How manycases would it need to sample? A staff member of your local partner organization isvery good at sampling. She volunteers to meet with the KPC Coordinating Team to dosome sample size calculations to determine an appropriate sample size, given theamount of difference you want to be able to detect between groups. She and the KPCCoordinating Team come up with 150 respondents in each group.

PRE-IMPLEMENTATION PHASE(DRAFT)
KPC2000+ Field Guide (DRAFT)August 2001
84
Table 4.8Sampling 150 Individuals in Each Stratum (Ethnic Group)
In the Population In the SampleEthnicGroup Number Percentage
SamplingFraction Number Percentage
A 2000 17% .075 150 25%B 1000 8% .150 150 25%C 6000 50% .025 150 25%D 3000 25% .050 150 25%
TOTAL 12000 100% .050 600 100%
As seen in Table 4.8, the sampling fraction varies across groups. For example, only2.5% of people in Ethnic Group C were sampled, whereas as 15% of people in EthnicGroup B were sampled. However, you now have an equal number of cases in eachgroup (notice that each group contributes 25% to the total sample size), which will allowyou to make some preliminary comparisons between groups for select indicators.
There is one problem: Your sample distribution no longer mirrors your populationdistribution. There is a way to aggregate (combine) data across all strata in order to getestimates that apply to the program area as a whole. This is done by weighting the datafrom each stratum based on the population distribution.
To illustrate how to weight data from a stratified sample whose distribution is differentfrom the distribution in the general population, let’s use the following Rapid CATCHindicator:
Percentage of mothers of children age 0–23 months who know at least two signs ofchildhood illness indicating the need for treatment
Assume that 10% of mothers of Ethnicity A, 20% of mothers of Ethnicity B, 33% ofmothers of Ethnicity C, and 40% of mothers of Ethnicity D know at least two signs. Yourproject wants to calculate an overall estimate for the entire program area. In Table 4.9,the overall estimate is calculated based on a sample in which the same proportion ofcases was sampled from each group. In Table 4.10, the overall estimate is based on asample in which the same number of cases was sampled from each group. The samedata from Table 4.10 are presented in Table 4.11, but this time the data are weighted bythe proportion of individuals in each ethnic group in the general population. As you willsee on the next page, the overall estimates from Tables 4.9 and 4.11 are the same(30%). Note, however, that the unweighted estimate in Table 4.10 is not that different(26%).
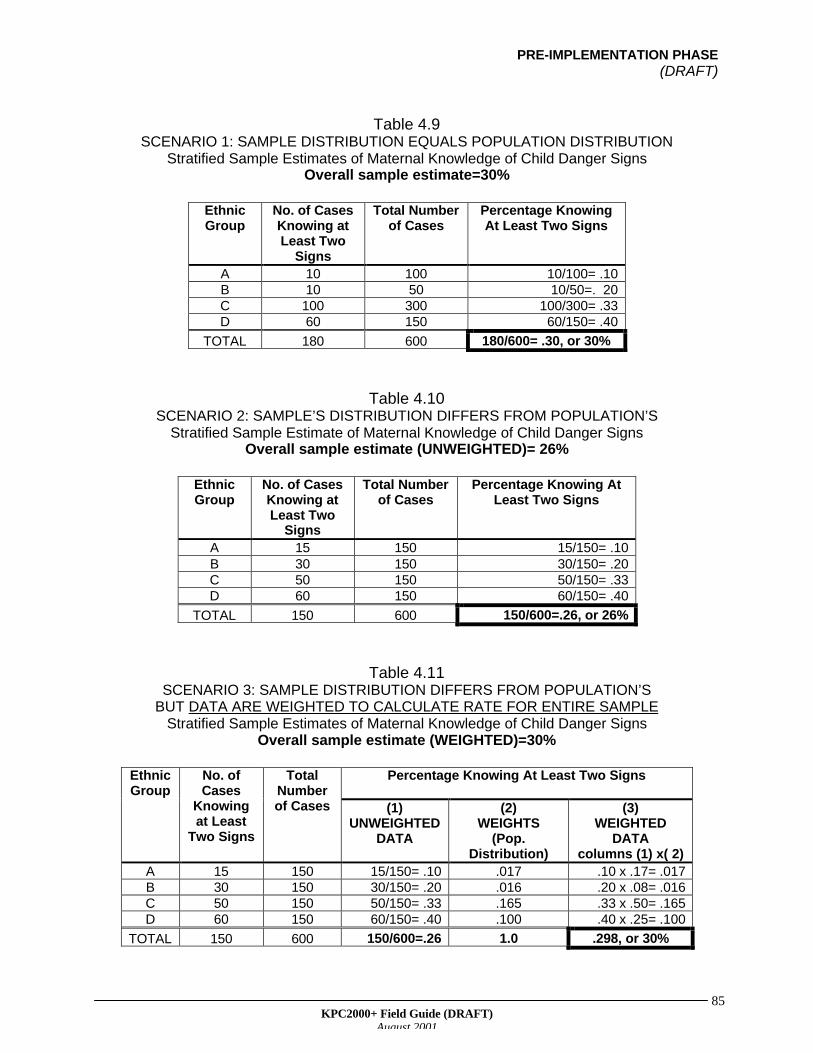
PRE-IMPLEMENTATION PHASE(DRAFT)
KPC2000+ Field Guide (DRAFT)August 2001
85
Table 4.9SCENARIO 1: SAMPLE DISTRIBUTION EQUALS POPULATION DISTRIBUTION
Stratified Sample Estimates of Maternal Knowledge of Child Danger SignsOverall sample estimate=30%
EthnicGroup
No. of CasesKnowing atLeast Two
Signs
Total Numberof Cases
Percentage KnowingAt Least Two Signs
A 10 100 10/100= .10B 10 50 10/50=. 20C 100 300 100/300= .33D 60 150 60/150= .40
TOTAL 180 600 180/600= .30, or 30%
Table 4.10SCENARIO 2: SAMPLE’S DISTRIBUTION DIFFERS FROM POPULATION’S
Stratified Sample Estimate of Maternal Knowledge of Child Danger SignsOverall sample estimate (UNWEIGHTED)= 26%
EthnicGroup
No. of CasesKnowing atLeast Two
Signs
Total Numberof Cases
Percentage Knowing AtLeast Two Signs
A 15 150 15/150= .10B 30 150 30/150= .20C 50 150 50/150= .33D 60 150 60/150= .40
TOTAL 150 600 150/600=.26, or 26%
Table 4.11SCENARIO 3: SAMPLE DISTRIBUTION DIFFERS FROM POPULATION’S
BUT DATA ARE WEIGHTED TO CALCULATE RATE FOR ENTIRE SAMPLEStratified Sample Estimates of Maternal Knowledge of Child Danger Signs
Overall sample estimate (WEIGHTED)=30%
Percentage Knowing At Least Two SignsEthnicGroup
No. ofCases
Knowingat Least
Two Signs
TotalNumberof Cases (1)
UNWEIGHTEDDATA
(2)WEIGHTS
(Pop.Distribution)
(3)WEIGHTED
DATAcolumns (1) x( 2)
A 15 150 15/150= .10 .017 .10 x .17= .017B 30 150 30/150= .20 .016 .20 x .08= .016C 50 150 50/150= .33 .165 .33 x .50= .165D 60 150 60/150= .40 .100 .40 x .25= .100
TOTAL 150 600 150/600=.26 1.0 .298, or 30%

PRE-IMPLEMENTATION PHASE(DRAFT)
KPC2000+ Field Guide (DRAFT)August 2001
86
What are the next steps if you discover that there are differences between strata? Ithelps to investigate the problem further. During the KPC Analysis Workshop (held afterdata collection is completed), explore reasons why those differences might exist. Also,explore whether your project should have different objectives (set different targets) foreach stratum, or whether the project needs to alter the types of activities or the amountof resources, depending on the stratum.
LQAS—A Special Form of Stratified Sampling
Recently, CS projects have become very interested in a special form of stratifiedsampling called Lot Quality Assurance Sampling (LQAS). There are two key differencesbetween LQAS and regular stratified sampling:
1. When a project divides the target population into socioeconomic characteristics suchas ethnicity, religion, or socioeconomic status, it is acknowledging that there mightbe certain confounders (external factors) that affect maternal and child healthoutcomes. However, those factors are not very responsive to short-term intervention.More specifically, it is very hard to change long-standing and deeply rooted culturalor religious practices within a five-year period—the time frame now allotted to CSproject to implement activities and demonstrate program effectiveness. Instead,projects focus on factors that they can more likely change, such as health workerperformance. The concepts of “lots” and “production units” (see Table 4.12 fordefinitions) are very important in LQAS. With LQAS, you divide the population intoservice delivery areas or program management units. These subdivisions serve aslots (strata) in LQAS. Common strata or lots for LQAS are health facility catchmentareas or project or MOH supervision areas. The production unit is usually a healthworker or a team of health workers, and possibly their clients.
2. Stratified sampling techniques such as LQAS allow projects to draw comparisonsbetween subdivisions of a population. However, the main objective of LQAS is not toobtain individual estimates from those subdivisions, but rather to base programmanagement decisions using a binomial principle. Binomial means that there areonly two possible answers or outcomes (for example, yes or no; high or low). Inother words, with LQAS, you are not determining the level of coverage in eachsubdivision. Instead, you are determining whether coverage in each subdivision isone of two things: a) at or above expectation, or b) below expectation.
REMEMBER TO DRAW RANDOM SAMPLES WITHIN STRATA
There are many benefits of stratified sampling over simple random or clustersampling. However, the division of the population into homogeneous strata is onlythe first step. The advantages of stratified sampling are dependent on whether youadhere to the “Make random the standard” principle. Therefore, remember to selectsamples randomly within each stratum.
This is particularly important when you are sampling a very small proportion ofcases from a group (such as Ethnic Group B in Table 4.8).

PRE-IMPLEMENTATION PHASE(DRAFT)
KPC2000+ Field Guide (DRAFT)August 2001
87
When deciding on lots, it helps to stratify the population in a way that is not onlymeaningful to the project but also to the MOH and other stakeholders. Projects areencouraged to build assessments using LQAS into an on-going system of monitoringand supportive supervision. Staff from the MOH and local NGOs are more likely toadopt and maintain this information-gathering strategy if it produces data that arerelevant to their activities and needs.
Table 4.12Common LQAS Concepts
• Lot: In health applications of LQAS, lots tend to be supervision areas or catchment areas ofhealth facilities. Each lot usually consists of several villages or communities
• Production unit: From a health perspective, the production unit is usually a health worker or ateam of health workers within each lot. In other words, it is an implementation unit in yourproject
• Decision rule: The basis for judging whether a lot has coverage that is at or above expectation,versus below expectation. The decision rule is a predetermined number out of a set ofobservations, and it is based on lower and upper thresholds.
• Lower threshold: The cut-point below which a lot is classified as “below expectation”
• Upper Threshold: The minimum standard that must be met in order for a lot to be classified as“acceptable” (at or above expectation) in terms of coverage
A few words about sample sizeThe number of observations (sample size) within each lot and the decision rule are based uponwhat is statistically acceptable for the health manager or supervisor. Ideally, the sample size shouldbe large enough that the manager has a high probability of identifying lots that are at or above theupper threshold and a high probability of identifying lots that are at or below the lower threshold.Project managers should identify the smallest possible sample size to keep the risk ofmisclassification below 10 percent for all indicators of interest. Samples of size 10–19 generallysatisfy this criterion. However, a sample size of 19 is often used because this sample sizegives managers the flexibility to change upper thresholds after data have already beencollected, without running the risk of having an insufficient amount of data to test thosethresholds.
This field guide does not present step-by-step instructions on how to implementa KPC survey using LQAS. Instead, it provides a general overview of thesampling strategy and presents key issues to consider. The documents listed atthe end by Valadez (1991) and Valadez et al (2000) provide more detailedinformation on how to use LQAS.
LQAS, which in simple terms is just random sampling within service delivery areas(lots), is often compared and contrasted with the 30-cluster methodology.
Table 4.13 compares the two sampling methods.
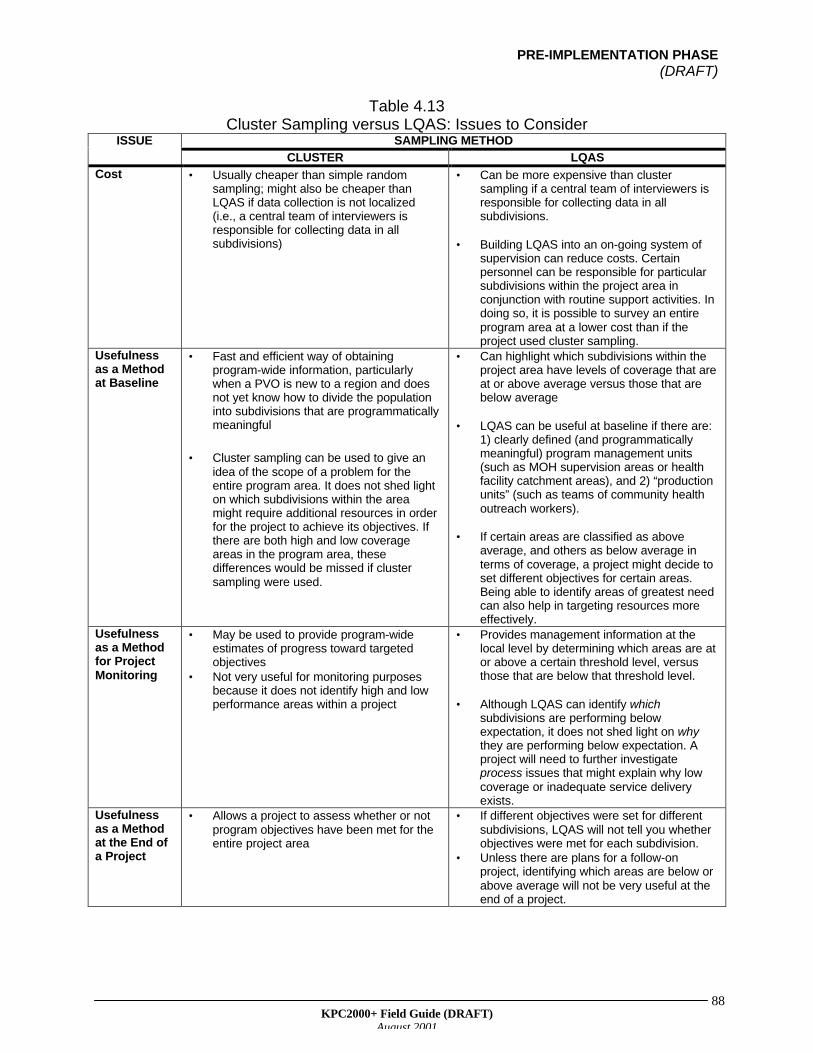
PRE-IMPLEMENTATION PHASE(DRAFT)
KPC2000+ Field Guide (DRAFT)August 2001
88
Table 4.13Cluster Sampling versus LQAS: Issues to Consider
SAMPLING METHODISSUE
CLUSTER LQASCost • Usually cheaper than simple random
sampling; might also be cheaper thanLQAS if data collection is not localized(i.e., a central team of interviewers isresponsible for collecting data in allsubdivisions)
• Can be more expensive than clustersampling if a central team of interviewers isresponsible for collecting data in allsubdivisions.
• Building LQAS into an on-going system ofsupervision can reduce costs. Certainpersonnel can be responsible for particularsubdivisions within the project area inconjunction with routine support activities. Indoing so, it is possible to survey an entireprogram area at a lower cost than if theproject used cluster sampling.
Usefulnessas a Methodat Baseline
• Fast and efficient way of obtainingprogram-wide information, particularlywhen a PVO is new to a region and doesnot yet know how to divide the populationinto subdivisions that are programmaticallymeaningful
• Cluster sampling can be used to give anidea of the scope of a problem for theentire program area. It does not shed lighton which subdivisions within the areamight require additional resources in orderfor the project to achieve its objectives. Ifthere are both high and low coverageareas in the program area, thesedifferences would be missed if clustersampling were used.
• Can highlight which subdivisions within theproject area have levels of coverage that areat or above average versus those that arebelow average
• LQAS can be useful at baseline if there are:1) clearly defined (and programmaticallymeaningful) program management units(such as MOH supervision areas or healthfacility catchment areas), and 2) “productionunits” (such as teams of community healthoutreach workers).
• If certain areas are classified as aboveaverage, and others as below average interms of coverage, a project might decide toset different objectives for certain areas.Being able to identify areas of greatest needcan also help in targeting resources moreeffectively.
Usefulnessas a Methodfor ProjectMonitoring
• May be used to provide program-wideestimates of progress toward targetedobjectives
• Not very useful for monitoring purposesbecause it does not identify high and lowperformance areas within a project
• Provides management information at thelocal level by determining which areas are ator above a certain threshold level, versusthose that are below that threshold level.
• Although LQAS can identify whichsubdivisions are performing belowexpectation, it does not shed light on whythey are performing below expectation. Aproject will need to further investigateprocess issues that might explain why lowcoverage or inadequate service deliveryexists.
Usefulnessas a Methodat the End ofa Project
• Allows a project to assess whether or notprogram objectives have been met for theentire project area
• If different objectives were set for differentsubdivisions, LQAS will not tell you whetherobjectives were met for each subdivision.
• Unless there are plans for a follow-onproject, identifying which areas are below orabove average will not be very useful at theend of a project.
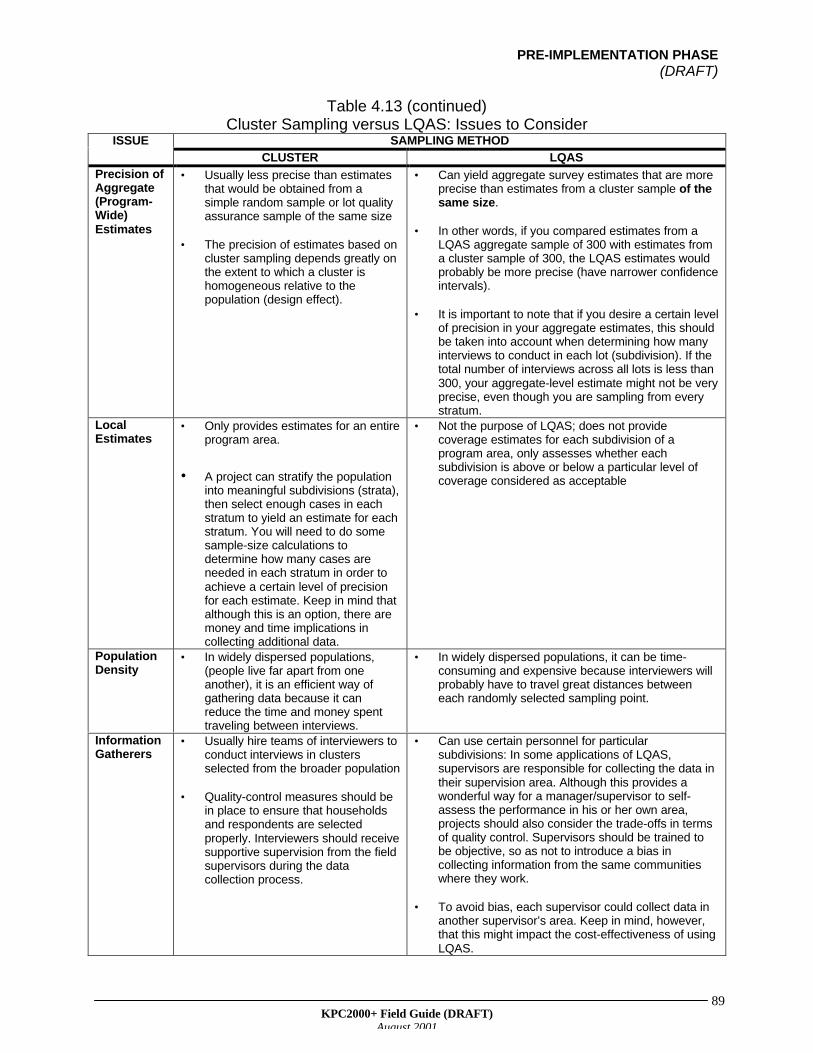
PRE-IMPLEMENTATION PHASE(DRAFT)
KPC2000+ Field Guide (DRAFT)August 2001
89
Table 4.13 (continued)Cluster Sampling versus LQAS: Issues to Consider
SAMPLING METHODISSUE
CLUSTER LQASPrecision ofAggregate(Program-Wide)Estimates
• Usually less precise than estimatesthat would be obtained from asimple random sample or lot qualityassurance sample of the same size
• The precision of estimates based oncluster sampling depends greatly onthe extent to which a cluster ishomogeneous relative to thepopulation (design effect).
• Can yield aggregate survey estimates that are moreprecise than estimates from a cluster sample of thesame size.
• In other words, if you compared estimates from aLQAS aggregate sample of 300 with estimates froma cluster sample of 300, the LQAS estimates wouldprobably be more precise (have narrower confidenceintervals).
• It is important to note that if you desire a certain levelof precision in your aggregate estimates, this shouldbe taken into account when determining how manyinterviews to conduct in each lot (subdivision). If thetotal number of interviews across all lots is less than300, your aggregate-level estimate might not be veryprecise, even though you are sampling from everystratum.
LocalEstimates
• Only provides estimates for an entireprogram area.
• A project can stratify the populationinto meaningful subdivisions (strata),then select enough cases in eachstratum to yield an estimate for eachstratum. You will need to do somesample-size calculations todetermine how many cases areneeded in each stratum in order toachieve a certain level of precisionfor each estimate. Keep in mind thatalthough this is an option, there aremoney and time implications incollecting additional data.
• Not the purpose of LQAS; does not providecoverage estimates for each subdivision of aprogram area, only assesses whether eachsubdivision is above or below a particular level ofcoverage considered as acceptable
PopulationDensity
• In widely dispersed populations,(people live far apart from oneanother), it is an efficient way ofgathering data because it canreduce the time and money spenttraveling between interviews.
• In widely dispersed populations, it can be time-consuming and expensive because interviewers willprobably have to travel great distances betweeneach randomly selected sampling point.
InformationGatherers
• Usually hire teams of interviewers toconduct interviews in clustersselected from the broader population
• Quality-control measures should bein place to ensure that householdsand respondents are selectedproperly. Interviewers should receivesupportive supervision from the fieldsupervisors during the datacollection process.
• Can use certain personnel for particularsubdivisions: In some applications of LQAS,supervisors are responsible for collecting the data intheir supervision area. Although this provides awonderful way for a manager/supervisor to self-assess the performance in his or her own area,projects should also consider the trade-offs in termsof quality control. Supervisors should be trained tobe objective, so as not to introduce a bias incollecting information from the same communitieswhere they work.
• To avoid bias, each supervisor could collect data inanother supervisor’s area. Keep in mind, however,that this might impact the cost-effectiveness of usingLQAS.
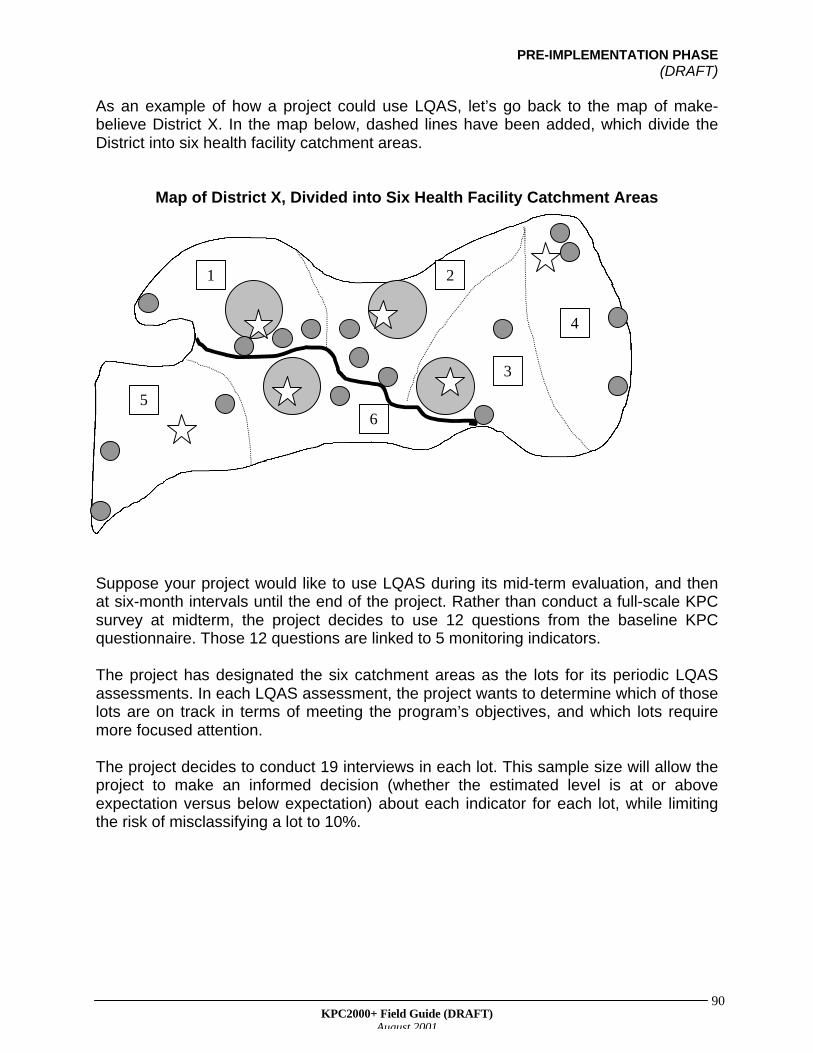
PRE-IMPLEMENTATION PHASE(DRAFT)
KPC2000+ Field Guide (DRAFT)August 2001
90
As an example of how a project could use LQAS, let’s go back to the map of make-believe District X. In the map below, dashed lines have been added, which divide theDistrict into six health facility catchment areas.
Map of District X, Divided into Six Health Facility Catchment Areas
Suppose your project would like to use LQAS during its mid-term evaluation, and thenat six-month intervals until the end of the project. Rather than conduct a full-scale KPCsurvey at midterm, the project decides to use 12 questions from the baseline KPCquestionnaire. Those 12 questions are linked to 5 monitoring indicators.
The project has designated the six catchment areas as the lots for its periodic LQASassessments. In each LQAS assessment, the project wants to determine which of thoselots are on track in terms of meeting the program’s objectives, and which lots requiremore focused attention.
The project decides to conduct 19 interviews in each lot. This sample size will allow theproject to make an informed decision (whether the estimated level is at or aboveexpectation versus below expectation) about each indicator for each lot, while limitingthe risk of misclassifying a lot to 10%.
1 2
65
3
4

PRE-IMPLEMENTATION PHASE(DRAFT)
KPC2000+ Field Guide (DRAFT)August 2001
91
*A SPECIAL NOTE ABOUT SUB-SAMPLES*
Some projects that used LQAS in the past have mentioned that they encounteredproblems with sub-samples, particularly when assessing treatment and care-seekingpractices for sick children. Some projects conduct 19 interviews in each lot, then findthat they do not have enough sick children in the sample to assess care-seekingpractices. For example, there might be only a small number of children who hadpneumonia in the two weeks before the survey. Within that group, an even smallernumber of children might have received treatment for the illness. How can a projectmake decisions when there is little or no data? There are two solutions:
1. The project can decide to just aggregate data across lots and calculate a program-wide estimate, rather than make assessments for each lot.
2. If the project is interested in making assessments regarding sick children in each lot,it will need to randomly sample additional sick children. With LQAS, there are 19randomly selected sampling points in a given lot. This might not necessarilycorrespond to the number of interviews conducted in each lot. For example, if yourproject uses parallel sampling to collect information on mothers of children age 0–11months, mothers of children age 12–23 months, and nonpregnant women ofreproductive age, it will need to conduct 19 interviews for each group. If your projectis concerned about having too few sick children in the sample, it should plan torandomly select additional sampling points in each lot (that is, beyond the 19sampling points that it would normally select) until it finds “enough” sick children inthe lot. Your project will need to decide on that number. If an interviewer visits onerandomly selected household and finds a sick child, he or she should not visitneighboring households to find additional sick children. If that is done, he or she isbasically selecting a cluster sample of sick children! Instead, the interviewer shouldkeep randomly selecting different sampling points (households) until he or she findsthe desired number of sick children.
REMINDER
When using LQAS, the project’s main objective is to classify lots into one of two groups:
1. coverage at or above expectation2. coverage below expectation
The objective behind LQAS is not to get coverage estimates for each lot. This is onemajor difference between LQAS and other forms of stratified sampling. With LQAS, youcollect information on only a small number of cases in each lot. (It is common to conduct19 interviews in each lot.) Estimates based on such a small number of cases will haveextremely wide confidence intervals, and therefore are not very meaningful. As a result,only combine data across lots to get estimates for the entire program area. Theseprogram-wide estimates are analogous to what you get with a cluster survey. With goodquality control of data collection, estimates based on an LQAS sample can be moreprecise than estimates based on a cluster sample of the same size.

PRE-IMPLEMENTATION PHASE(DRAFT)
KPC2000+ Field Guide (DRAFT)August 2001
92
Remember, do not take the easy way out and sample more than one sick child withinthe same household. Nor should you go to a neighboring household. You have to keeprandomly selecting a new household to avoid introducing a bias into the study.
Guiding Principle #5: The sky is not the limit
A project should try to maximize the usefulness of its KPC survey, and it should aim toincorporate any information that will help to plan and manage the project. However, it isimportant to realize that the KPC cannot provide answers to all of your questions.Certain topics are beyond the scope of a KPC survey. Also, other tools and information-gathering methods might be more appropriate to explore certain phenomena. Whenchoosing whether to include certain types of questions or respondents in the survey, it isimportant to consider two questions:
A. “Can we be confident in the quality of the information that we are collecting?”
B. “Is there a better way (tool, methodology) to collect this information?”
Information that does not relate directly to program management, or that requires adifferent methodology in order to be accurate and reliable, should not be collected inyour KPC survey.
SUMMARY OF SIMPLE RANDOM, CLUSTER, AND STRATIFIED SAMPLING
Figure 4.1 and Table 4.14 summarize the main sampling methods discussed in thissection of the guide.
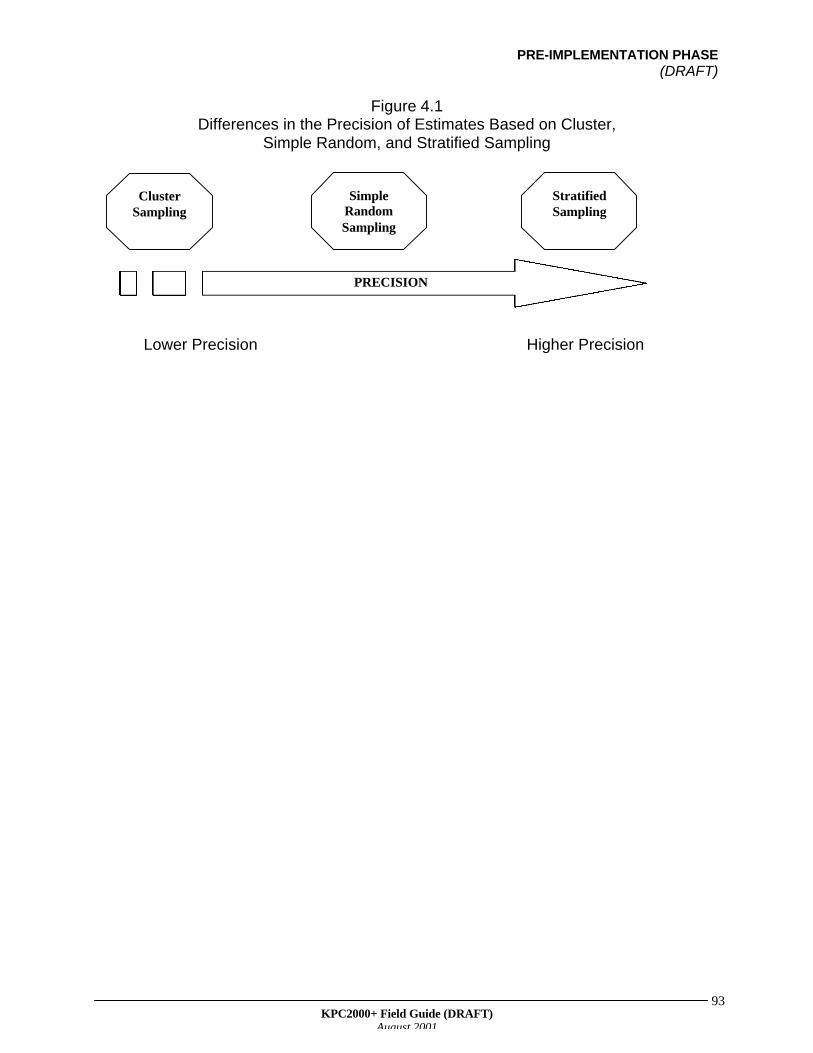
PRE-IMPLEMENTATION PHASE(DRAFT)
KPC2000+ Field Guide (DRAFT)August 2001
93
Figure 4.1Differences in the Precision of Estimates Based on Cluster,
Simple Random, and Stratified Sampling
Lower Precision Higher Precision
ClusterSampling
SimpleRandomSampling
StratifiedSampling
PRECISION
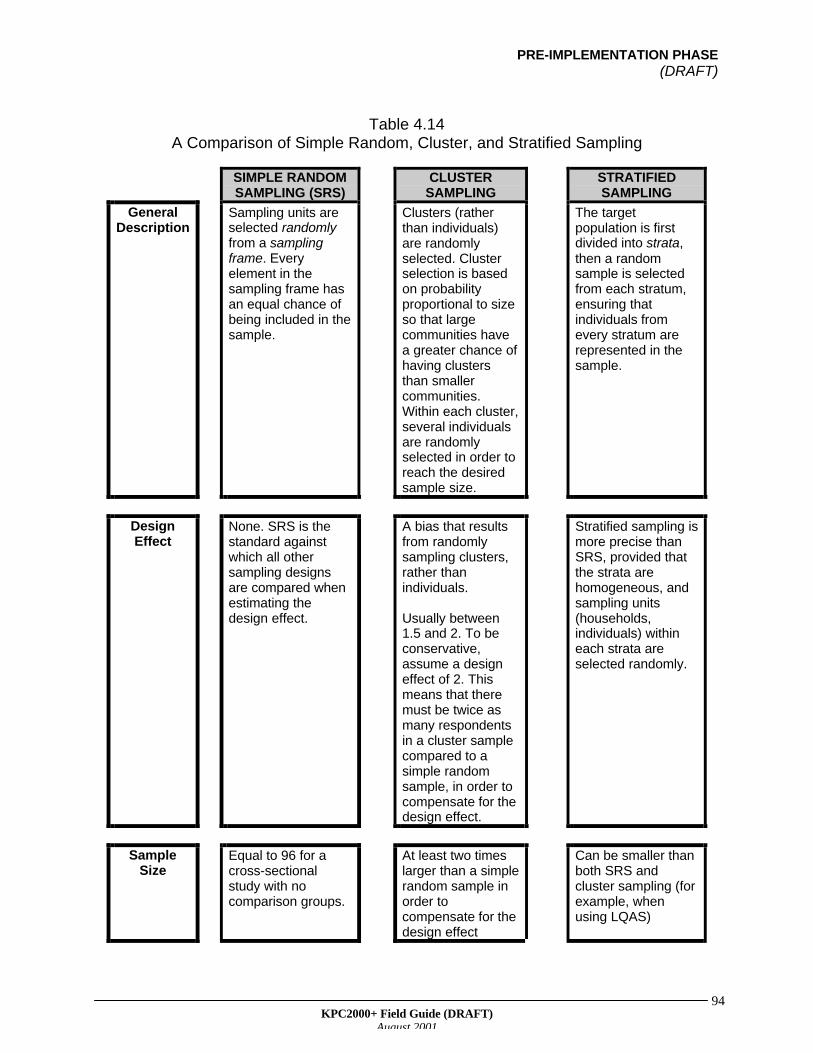
PRE-IMPLEMENTATION PHASE(DRAFT)
KPC2000+ Field Guide (DRAFT)August 2001
94
Table 4.14A Comparison of Simple Random, Cluster, and Stratified Sampling
SIMPLE RANDOMSAMPLING (SRS)
CLUSTERSAMPLING
STRATIFIEDSAMPLING
GeneralDescription
Sampling units areselected randomlyfrom a samplingframe. Everyelement in thesampling frame hasan equal chance ofbeing included in thesample.
Clusters (ratherthan individuals)are randomlyselected. Clusterselection is basedon probabilityproportional to sizeso that largecommunities havea greater chance ofhaving clustersthan smallercommunities.Within each cluster,several individualsare randomlyselected in order toreach the desiredsample size.
The targetpopulation is firstdivided into strata,then a randomsample is selectedfrom each stratum,ensuring thatindividuals fromevery stratum arerepresented in thesample.
DesignEffect
None. SRS is thestandard againstwhich all othersampling designsare compared whenestimating thedesign effect.
A bias that resultsfrom randomlysampling clusters,rather thanindividuals.
Usually between1.5 and 2. To beconservative,assume a designeffect of 2. Thismeans that theremust be twice asmany respondentsin a cluster samplecompared to asimple randomsample, in order tocompensate for thedesign effect.
Stratified sampling ismore precise thanSRS, provided thatthe strata arehomogeneous, andsampling units(households,individuals) withineach strata areselected randomly.
SampleSize
Equal to 96 for across-sectionalstudy with nocomparison groups.
At least two timeslarger than a simplerandom sample inorder tocompensate for thedesign effect
Can be smaller thanboth SRS andcluster sampling (forexample, whenusing LQAS)
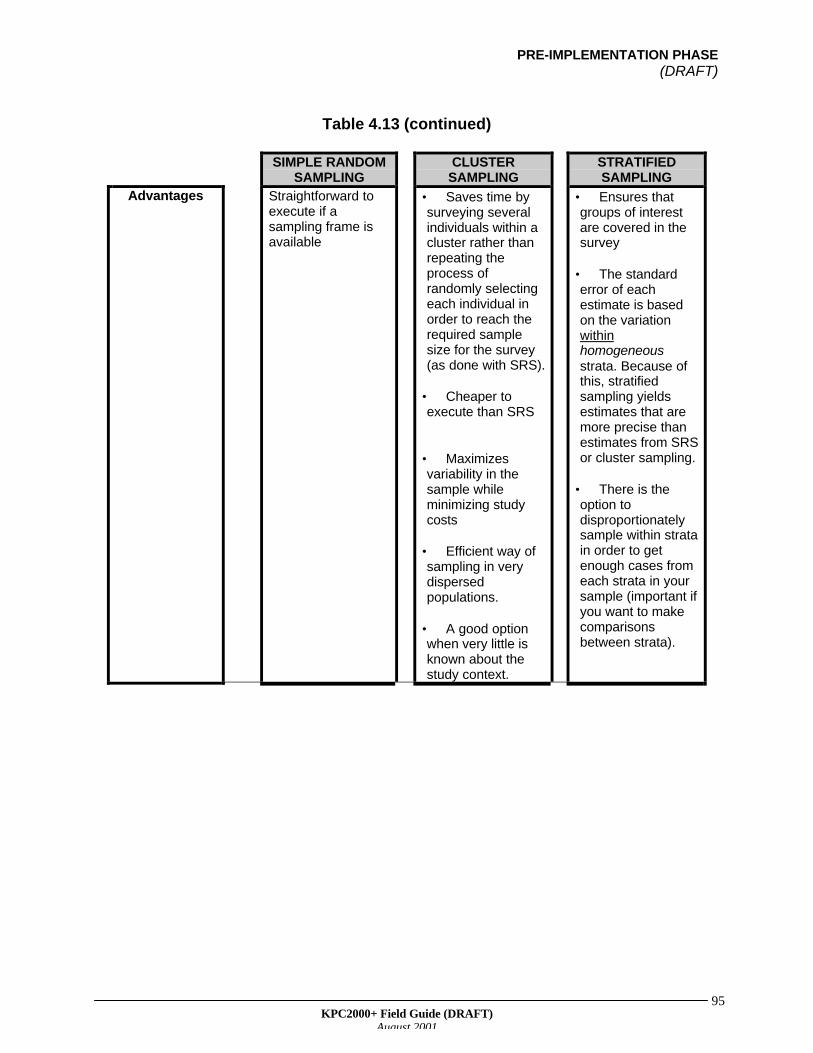
PRE-IMPLEMENTATION PHASE(DRAFT)
KPC2000+ Field Guide (DRAFT)August 2001
95
Table 4.13 (continued)
SIMPLE RANDOMSAMPLING
CLUSTERSAMPLING
STRATIFIEDSAMPLING
Advantages Straightforward toexecute if asampling frame isavailable
• Saves time bysurveying severalindividuals within acluster rather thanrepeating theprocess ofrandomly selectingeach individual inorder to reach therequired samplesize for the survey(as done with SRS).
• Cheaper toexecute than SRS
• Maximizesvariability in thesample whileminimizing studycosts
• Efficient way ofsampling in verydispersedpopulations.
• A good optionwhen very little isknown about thestudy context.
• Ensures thatgroups of interestare covered in thesurvey
• The standarderror of eachestimate is basedon the variationwithinhomogeneousstrata. Because ofthis, stratifiedsampling yieldsestimates that aremore precise thanestimates from SRSor cluster sampling.
• There is theoption todisproportionatelysample within stratain order to getenough cases fromeach strata in yoursample (important ifyou want to makecomparisonsbetween strata).
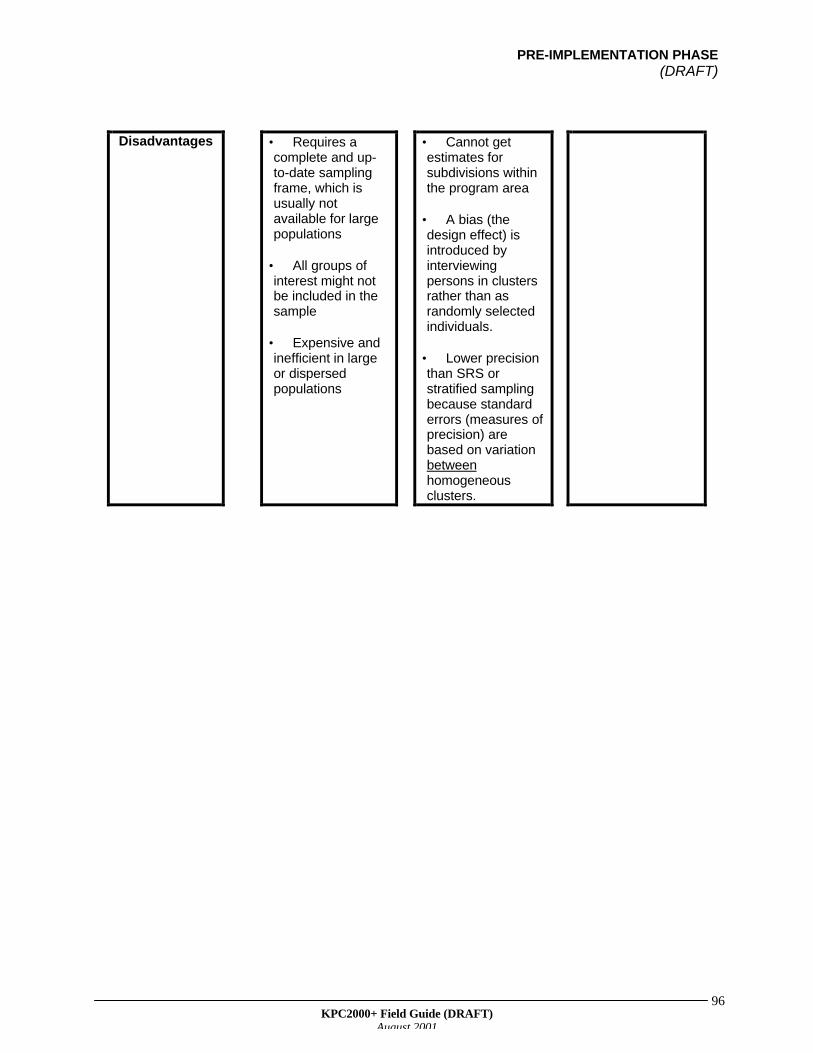
PRE-IMPLEMENTATION PHASE(DRAFT)
KPC2000+ Field Guide (DRAFT)August 2001
96
Disadvantages • Requires acomplete and up-to-date samplingframe, which isusually notavailable for largepopulations
• All groups ofinterest might notbe included in thesample
• Expensive andinefficient in largeor dispersedpopulations
• Cannot getestimates forsubdivisions withinthe program area
• A bias (thedesign effect) isintroduced byinterviewingpersons in clustersrather than asrandomly selectedindividuals.
• Lower precisionthan SRS orstratified samplingbecause standarderrors (measures ofprecision) arebased on variationbetweenhomogeneousclusters.
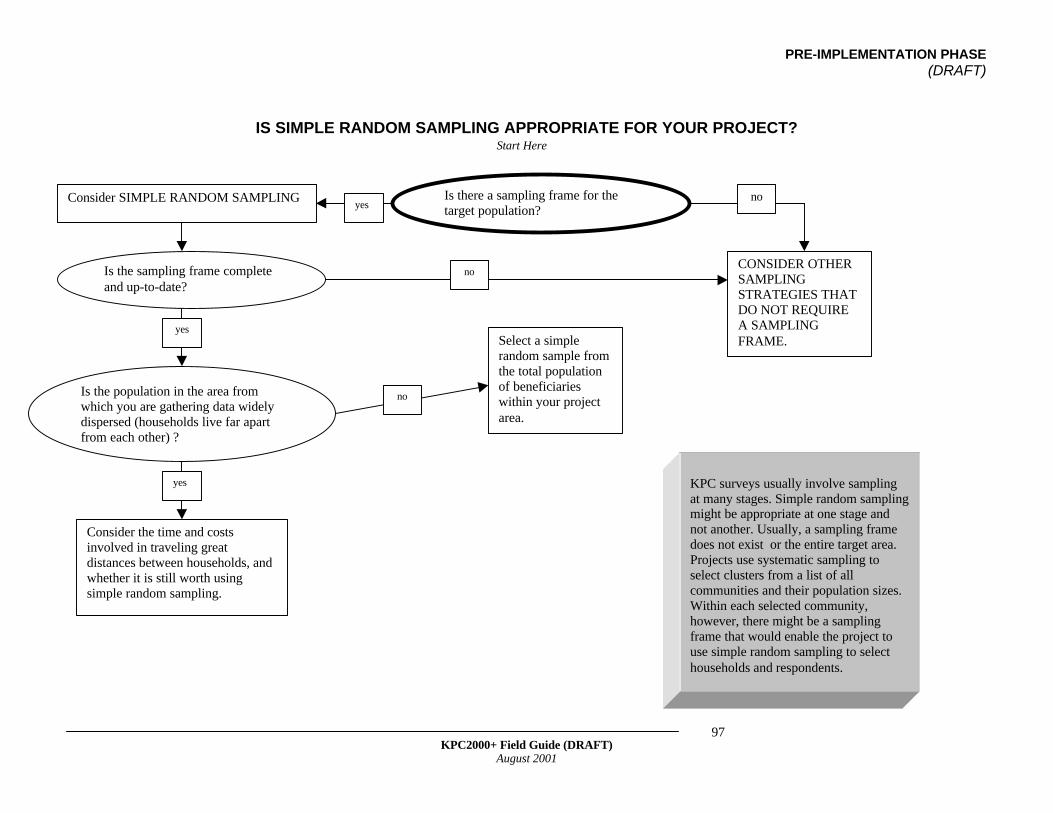
PRE-IMPLEMENTATION PHASE(DRAFT)
KPC2000+ Field Guide (DRAFT)August 2001
97
IS SIMPLE RANDOM SAMPLING APPROPRIATE FOR YOUR PROJECT?
Is there a sampling frame for thetarget population?yes
noConsider SIMPLE RANDOM SAMPLING
Is the population in the area fromwhich you are gathering data widelydispersed (households live far apartfrom each other) ?
Select a simplerandom sample fromthe total populationof beneficiarieswithin your projectarea.
no
yes
Consider the time and costsinvolved in traveling greatdistances between households, andwhether it is still worth usingsimple random sampling.
Is the sampling frame completeand up-to-date?
CONSIDER OTHERSAMPLINGSTRATEGIES THATDO NOT REQUIREA SAMPLINGFRAME.
Start Here
no
yes
KPC surveys usually involve samplingat many stages. Simple random samplingmight be appropriate at one stage andnot another. Usually, a sampling framedoes not exist or the entire target area.Projects use systematic sampling toselect clusters from a list of allcommunities and their population sizes.Within each selected community,however, there might be a samplingframe that would enable the project touse simple random sampling to selecthouseholds and respondents.
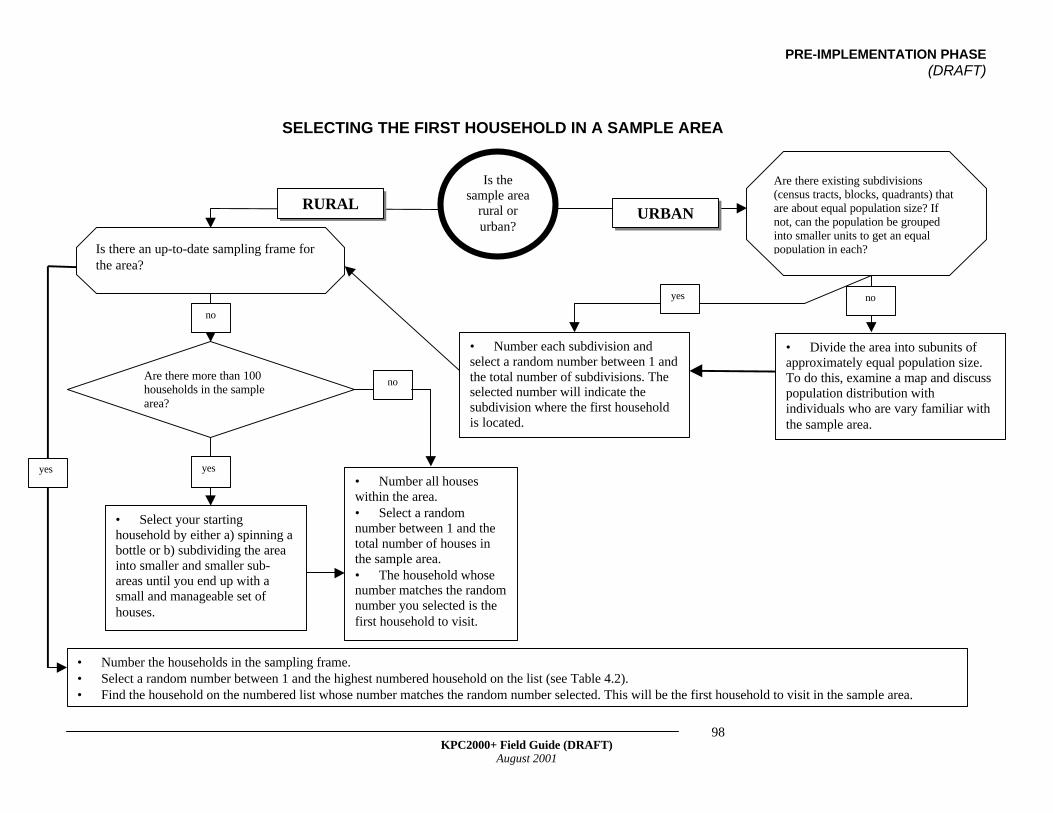
PRE-IMPLEMENTATION PHASE(DRAFT)
KPC2000+ Field Guide (DRAFT)August 2001
98
Is there an up-to-date sampling frame forthe area?
• Number the households in the sampling frame.• Select a random number between 1 and the highest numbered household on the list (see Table 4.2).• Find the household on the numbered list whose number matches the random number selected. This will be the first household to visit in the sample area.
• Select your startinghousehold by either a) spinning abottle or b) subdividing the areainto smaller and smaller sub-areas until you end up with asmall and manageable set ofhouses.
• Number each subdivision andselect a random number between 1 andthe total number of subdivisions. Theselected number will indicate thesubdivision where the first householdis located.
Is thesample area
rural orurban?
Are there more than 100households in the samplearea?
RURALURBAN
SELECTING THE FIRST HOUSEHOLD IN A SAMPLE AREA
yes
no
Are there existing subdivisions(census tracts, blocks, quadrants) thatare about equal population size? Ifnot, can the population be groupedinto smaller units to get an equalpopulation in each?
• Number all houseswithin the area.• Select a randomnumber between 1 and thetotal number of houses inthe sample area.• The household whosenumber matches the randomnumber you selected is thefirst household to visit.
• Divide the area into subunits ofapproximately equal population size.To do this, examine a map and discusspopulation distribution withindividuals who are vary familiar withthe sample area.
yes
no
yes no
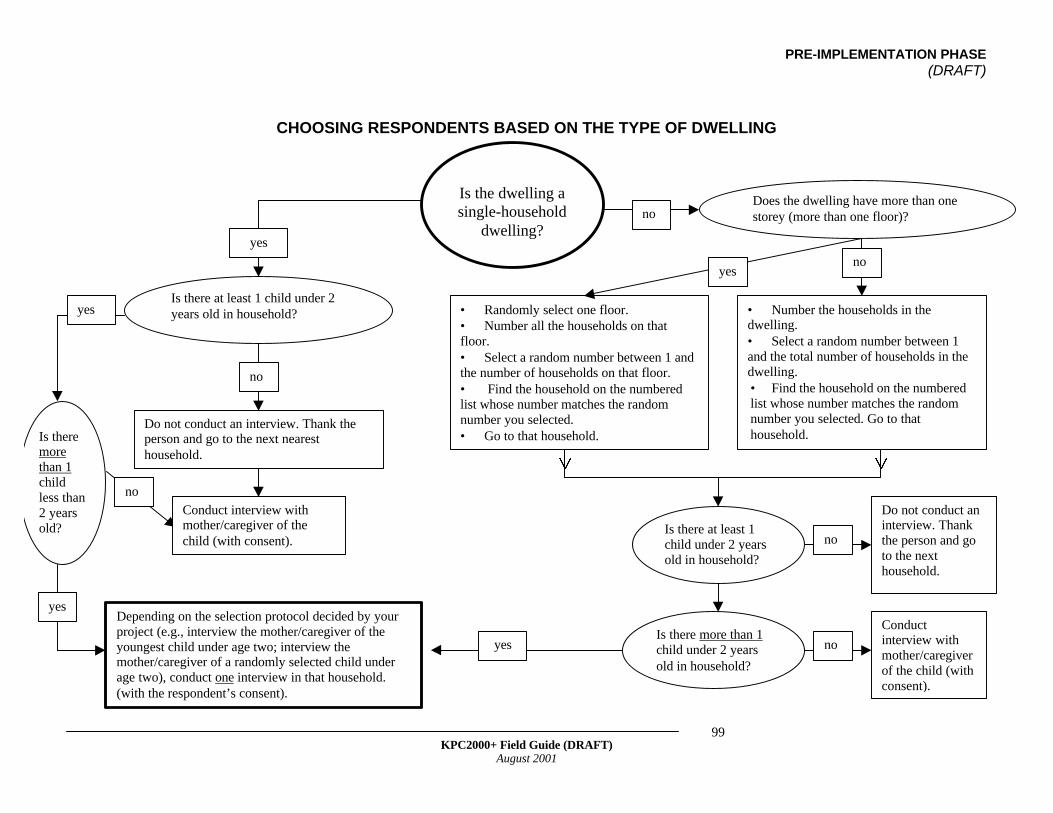
PRE-IMPLEMENTATION PHASE(DRAFT)
KPC2000+ Field Guide (DRAFT)August 2001
99
CHOOSING RESPONDENTS BASED ON THE TYPE OF DWELLING
• Randomly select one floor.• Number all the households on thatfloor.• Select a random number between 1 andthe number of households on that floor.• Find the household on the numberedlist whose number matches the randomnumber you selected.• Go to that household.
Is the dwelling asingle-household
dwelling?yes
no
Is there at least 1 child under 2years old in household?yes
Does the dwelling have more than onestorey (more than one floor)?
Do not conduct an interview. Thank theperson and go to the next nearesthousehold.
no
• Number the households in thedwelling.• Select a random number between 1and the total number of households in thedwelling.• Find the household on the numberedlist whose number matches the randomnumber you selected. Go to thathousehold.
Is there more than 1child under 2 yearsold in household?
Conductinterview withmother/caregiverof the child (withconsent).
noyes
Depending on the selection protocol decided by yourproject (e.g., interview the mother/caregiver of theyoungest child under age two; interview themother/caregiver of a randomly selected child underage two), conduct one interview in that household.(with the respondent’s consent).
no
Is theremorethan 1childless than2 yearsold?
Conduct interview withmother/caregiver of thechild (with consent).
no
yes
yes
Is there at least 1child under 2 yearsold in household?
Do not conduct aninterview. Thankthe person and goto the nexthousehold.
no
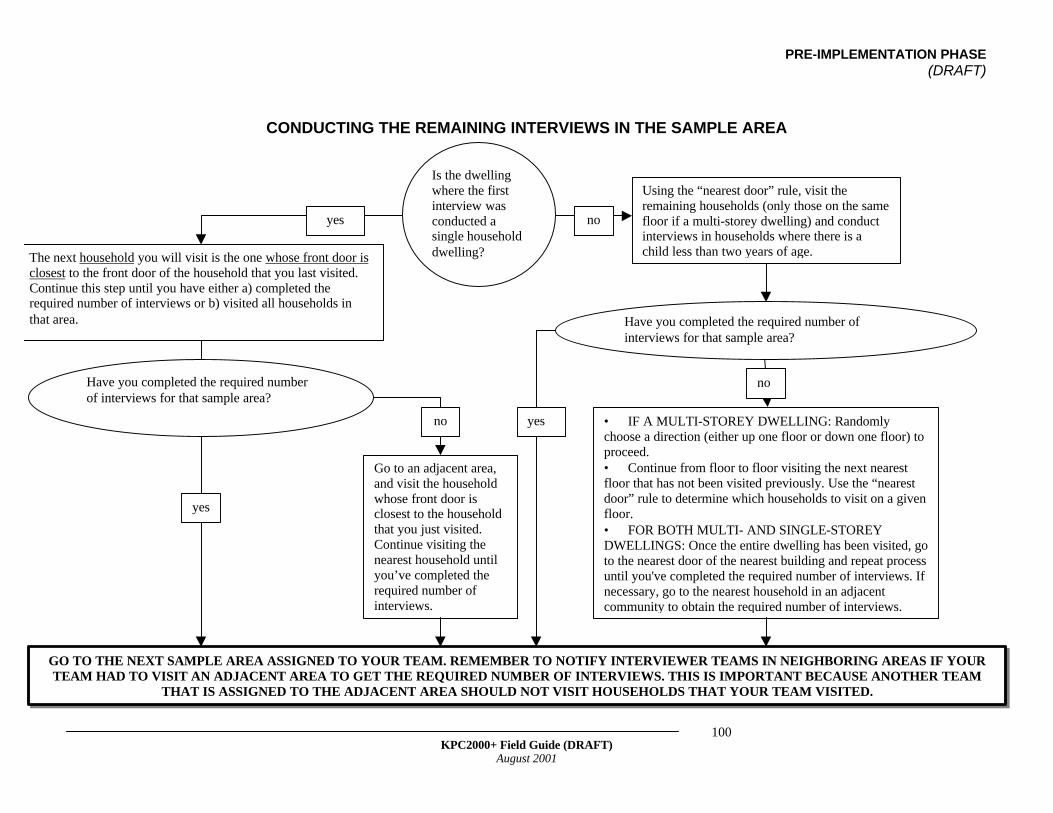
PRE-IMPLEMENTATION PHASE(DRAFT)
KPC2000+ Field Guide (DRAFT)August 2001
100
CONDUCTING THE REMAINING INTERVIEWS IN THE SAMPLE AREA
The next household you will visit is the one whose front door isclosest to the front door of the household that you last visited.Continue this step until you have either a) completed therequired number of interviews or b) visited all households inthat area.
Using the “nearest door” rule, visit theremaining households (only those on the samefloor if a multi-storey dwelling) and conductinterviews in households where there is achild less than two years of age.
GO TO THE NEXT SAMPLE AREA ASSIGNED TO YOUR TEAM. REMEMBER TO NOTIFY INTERVIEWER TEAMS IN NEIGHBORING AREAS IF YOURTEAM HAD TO VISIT AN ADJACENT AREA TO GET THE REQUIRED NUMBER OF INTERVIEWS. THIS IS IMPORTANT BECAUSE ANOTHER TEAM
THAT IS ASSIGNED TO THE ADJACENT AREA SHOULD NOT VISIT HOUSEHOLDS THAT YOUR TEAM VISITED.
no
Is the dwellingwhere the firstinterview wasconducted asingle householddwelling?
yes no
noHave you completed the required numberof interviews for that sample area?
Have you completed the required number ofinterviews for that sample area?
yes
Go to an adjacent area,and visit the householdwhose front door isclosest to the householdthat you just visited.Continue visiting thenearest household untilyou’ve completed therequired number ofinterviews.
yes • IF A MULTI-STOREY DWELLING: Randomlychoose a direction (either up one floor or down one floor) toproceed.• Continue from floor to floor visiting the next nearestfloor that has not been visited previously. Use the “nearestdoor” rule to determine which households to visit on a givenfloor.• FOR BOTH MULTI- AND SINGLE-STOREYDWELLINGS: Once the entire dwelling has been visited, goto the nearest door of the nearest building and repeat processuntil you've completed the required number of interviews. Ifnecessary, go to the nearest household in an adjacentcommunity to obtain the required number of interviews.
PRE-IMPLEMENTATION PHASE(DRAFT)
KPC2000+ Field Guide (DRAFT)August 2001
101
USEFUL RESOURCES
Aday L. 1996. Designing and Conducting Health Surveys: A Comprehensive Guide.San Francisco:Jossey-Bass Publishers.
Centers for Disease Control (CDC). Epi Info Software and Documentation. Availableon CDS website (www.cdc.gov/epiinfo).
Habicht JP, Victora CG, and JP Vaughan. 1999. Evaluation designs for adequacy,plausibility and probability of public health programme performance and impact.International Journal of Epidemiology 28:10-18.
Henderson R and T Sundaresan. 1982. Cluster sampling to assess immunizationcoverage: a review of experience with a simplified sampling method. Bulletin of theWorld Health Organization 60(2):253-260.
Sarriot E, Winch P, Weiss W, and J Wagman. 1999. Methodological and SamplingIssues for KPC Surveys. Available at CSTS website (www.childsurvival.com) under"KPC2000+)
Valadez J, Weiss W, Seims L, Davis R, and C Leburg. 2000. (DRAFT) Using LQAS forAssessing Field Programs in Community Health in Developing Countries. A Trainer'sGuide for Baseline Surveys and Regular Monitoring. Available from NGO Networksfor Health
Valadez J. 1991. Assessing Child Survival Programs in Developing Countries: TestingLot Quality Assurance Sampling. Boston: Harvard University Press.
World Health Organization. 1991. Training for Mid Level Managers: The EPI ClusterSurvey. WHO/EPI/MLM/91.10.


PRE-IMPLEMENTATION PHASE(DRAFT)
KPC2000+ Field Guide (DRAFT)August 2001
106
Recruit Field Personnel
Selecting Supervisors
It is helpful to develop a list of desired qualifications before selecting supervisors. Forexample:
1. Must be literate—can read and write2. Should have some field or health experience3. Must speak the major local language(s)4. Must be available for the full survey and related activities5. Must be organized sufficiently to supervise interviewers and maintain data integrity6. Must be a dependable worker7. Should know the general area8. Must be physically fit9. Must be able to accurately audit completed questionnaires10. Should have supervisory experience
The following types of individuals are potential candidates:
1. Project and partner staff2. Midwives3. Nurses4. Students from health and sanitation schools5. University students6. Medical Auxiliary students7. Staff from partner PVOs/NGOs8. MOH staff9. Allied health sector personnel - hospital or clinic staff, etc.10. Community based workers and/or volunteers11. Other individuals with previous interviewing experience in the project area
Selecting Interviewers
A similar list of qualifications can be developed to assist in the selection of interviewers.For example:
6. RECRUIT AND TRAINSUPERVISORS AND
INTERVIEWERS
PRE-IMPLEMENTATION PHASE(DRAFT)
KPC2000+ Field Guide (DRAFT)August 2001
107
1. Must be literate—can read and write well2. Must write legibly3. Have some field or health experience4. Must speak the household local language fluently5. Must be able to establish rapport easily6. Must work well as part of a team7. Must be available full-time for training, data collection, and tabulation activities8. Must be able to organize work and interview forms sufficiently to accurately record
answers9. Must be dependable10. Must know the general survey area11. Must be physically fit
The ability to communicate in the local language or dialect is absolutely necessary forinterviewers. An interesting exercise when recruiting interviewers is to ask groups ofthem to role-play scenes of local life in the local language or dialect. Ask the interviewercandidates who are observing the role-plays to either write or verbally translate whatthey observed in the project language.
Training Field Personnel
Who Conducts the Training?
The training facilitator does not have to be the Survey Coordinator. In fact, projects areencouraged to select more than one person from the KPC Coordinating Team tofacilitate at different times during the training. Different individuals have differentstrengths, and those who do not already have the capacity to train can be given theopportunity to develop such skills during the training process. Remember, it is importantto build local capacity to conduct KPC surveys, as well as develop the skills required tobe good facilitators.
REMEMBER
When selecting interviewers, consider the impact of gender dynamics onthe quality of an interview and therefore, the quality of survey data. Inmany societies, it is not acceptable for a woman to have contact with amale other than her husband or relatives. Even when such restrictionsdo not exist, some females might feel more comfortable talking toanother woman than to a man. Therefore, consider using only femaleinterviewers. Keep in mind, however, that if other groups are targeted inthe survey—for example, husbands or adolescent males—maleinterviewers may be more appropriate for those population groups.

PRE-IMPLEMENTATION PHASE(DRAFT)
KPC2000+ Field Guide (DRAFT)August 2001
108
How Long Should the Training Last?
Ideally, interviewer training should take place over 3–4 days, allowing for sufficient timeto review all aspects of field implementation and the opportunity to get hands-on fieldexperience conducting interviews. It is recommended that you hold a special one-dayoverview training with the field supervisors before conducting the interviewer training.During the overview session, the facilitator and supervisors can do the following:
• Review the purpose of the survey• Discuss and agree upon roles of the supervisor and interviewer• Review the questionnaire (item by item, paying attention to skip patterns and special
instructions)• Review proper interviewing and supervision techniques• Practice an interview, receive feedback• Review quality-control procedures in the field• Discuss the role that supervisors can play during interviewer training
In addition to the one-day overview, supervisors should attend the interviewer trainingsession in its entirety.
What Should the Training Cover and How Should It Be Structured?
Although the nature of the training is left to the discretion of each project, a KPC trainingshould review at least the following:
1. Survey purpose2. Content and format of the adapted questionnaire3. Proper interviewing techniques4. Field procedures, including protocols for household and respondent selection5. Role plays6. Practice interviews and final field-testing of the questionnaire before beginning data
collection
There may be other topics that need to be discussed, given the local context. In additionto instructional training, there should also be an opportunity for interviewers to conductpractice interviews through role playing as well as in the field. Supervisors and trainingfacilitators can assess and give feedback on each person’s performance at that time. Itis helpful for interviewers to practice the field procedure in its entirety—from going to asurveyed area, to randomly selecting the first household, identifying an eligiblerespondent within that household, conducting an interview, then selecting the nexthousehold. Supervisors should practice observing interviews, reviewing completedquestionnaires for errors, and filling out quality-control checklists (see next chapter).
It is not necessary to discuss the sampling design or sample size calculations in greatdepth during the training sessions. However, if some interviewers or supervisorsexpress an interest in learning more about those topics, then trainers can hold specialsessions with individuals who want additional information on sampling.

PRE-IMPLEMENTATION PHASE(DRAFT)
KPC2000+ Field Guide (DRAFT)August 2001
109
During their one-day training, supervisors can help to refine the KPC questionnaire byconducting 1–2 practice interviews. Get their feedback on the questionnaire (format,length of the interview, skip patterns, wording of questions). Based on their input, furtherchanges can be made to improve the questionnaire before reproducing it for theinterviewer training. Field-testing can also be built into the interviewer training wheninterviewers are conducting practice interviews in the field. Interviewers might identifyadditional changes that should be made to the questionnaire before sending it off forfinal duplication.
Regardless of the types of activities that make up the interviewer training, facilitatorsshould strive to create a trusting atmosphere that is conducive to team building andsupportive supervision. The training is as much an opportunity for consensus buildingas it is for capacity building. Although there are certain topics that have to be covered ina KPC training workshop, the structure should be as flexible and participatory aspossible. As part of team building and consensus building, it is helpful for the group tocome up with certain principles or traits that they are committed to. For example, thegroup can come with two lists of traits that make a good supervisor and a goodinterviewer.
EXAMPLES OF PROPER INTERVIEWING TECHNIQUES THAT SHOULD BEDISCUSSED DURING SUPERVISOR/INTERVIEWER TRAINING:
• Always be courteous, polite, respectful, and non-judgmental• Before interviewing a respondent, introduce yourself and state the name of the
organization you are working with and the general purpose of the survey.• Maintain the confidentiality of the survey. If there are people around the respondent,
ask them politely to leave. Be sure to do this in a way that is culturally appropriate.Explain to the respondent that he/she does not have to take part in the survey, thathealth services will not be withheld if he/she does not participate and that anyinformation that he/she shares during the information will not be linked to his/herdirectly when examining the results from the survey. Gain the person’s consent to beinterviewed before asking questions.
• To begin with, ask each question exactly as it is written. When questions have to berepeated, use the phrases and minor wording changes that were agreed uponduring the training.
• Ask questions in a respectful manner, do not imply that some answers are betterthan others.
• When an answer is unclear, ask the question again or ask it in a slightly differentway, but be careful not to change the meaning or “lead” the respondent into aparticular response. For example, suppose a caregiver mentions that the child wasgiven “a special drink” while he or she had diarrhea. Do not ask a leading follow-upquestion such as “Do you mean that you used ORS?” Instead ask an open questionlike “What kind of special drink?” or “What was in the drink?”
• If an answer seems inconsistent with previous information given by the respondent,or if there is some reason to disbelieve an answer, try to discover the truth by askinghim/her another question or asking a question in a slightly different way. However,do not be overly persistent. A person may change his/her answer just because
PRE-IMPLEMENTATION PHASE(DRAFT)
KPC2000+ Field Guide (DRAFT)August 2001
110
persistent questioning suggests that the interviewer is dissatisfied with the initialanswer.
• Ensure that translations of questions are not leading as some translations canprompt a particular answer.
PRACTICE, PRACTICE, PRACTICE
It is very important to allocate a substantial amount of time for field practiceand role-playing. This will allow interviewers the opportunity to masterinterviewing techniques, get comfortable with the layout of the questionnaire,and identify areas where they need additional practice before beginning theactual data collection. Field practice will also allow supervisors to practiceobserving interviews and assessing their quality as part of supportivesupervision. At the end of each day of training, interviewers and supervisorsshould be instructed to practice conducting interviews in the evening witheach other or with friends or family members. Make sure that practiceinterviews are not conducted in communities where interviews will beconducted.
By the end of interviewer training, the coordinating team should do the following:
1. Determine the team structure for each survey team.2. Determine site assignments for each survey team.3. Complete administrative and logistical preparations necessary to begin the conduct
of the survey.4. Assign transportation units, duplicate sufficient copies of the questionnaires, and
distribute all supplies and materials needed to interviewers and supervisors.
REMEMBER
• Some individuals will need more attention and training than others. Trainingfacilitators should assess the performance of each supervisor and interviewerdaily and work to ensure that every person has mastered the necessary skillsbefore data collection begins. In the spirit of team building, pair individualswho still need to develop certain skills with individuals who are strong inthose areas. This process of identifying individuals whose skills complementone another also applies when survey team assignments are being made.
• Sometimes interviewers and supervisors have special insight into localcustoms and taboos. Facilitators and the coordinating team should be flexiblein terms of further adapting the questions, methodology, or interviewingtechniques to make them as appropriate for the local context as possible.

PRE-IMPLEMENTATION PHASE(DRAFT)
KPC2000+ Field Guide (DRAFT)August 2001
111
5. Provide additional guidance to teams assigned to communities where either multiplesurvey sites (clusters, lots) are located or where urban areas were selected.
When choosing final interviewer teams and their assignments, a number of factors willneed to be considered. For example:
1. Observations during the training2. Local language proficiency3. Staff knowledge about individual workers
As stated earlier, try to assign teams whose member’s skills complement each other.The Survey Coordinator and/or members of the coordinating team may opt to travel tothe most difficult survey locations, or to accompany interviewers and supervisors whoperformed least well during the training.

PRE-IMPLEMENTATION PHASE(DRAFT)
KPC2000+ Field Guide (DRAFT)August 2001
112

PRE-IMPLEMENTATION PHASE(DRAFT)
KPC2000+ Field Guide (DRAFT)August 2001
113
SURVEY IMPLEMENTATION(DRAFT)
KPC2000+ Field Guide (DRAFT)August 2001
114
The Survey Implementation Phase involves conducting KPC interviews in selectedcommunities. Quality control is critical to the data collection process. The purposeof quality-control procedures is to maximize the performance of the interviewers and getthe best possible data, given the circumstances of the local context.
Before sending survey teams into communities, the KPC Coordinating Team shouldhave a clear-cut strategy for maintaining quality throughout the data collection process.It helps to create a Field Implementation Checklist, so that each survey team can take adaily inventory of all supplies and equipment before going into the field.
Supervisors should not conduct interviews. Their primary role is to support theinterviewers, serving as the first point of contact when interviewers encounter problemsin the field, and assessing and maintaining the quality of data collection. It isrecommended that supervisors complete a Quality-Control Checklist for every interviewthey observe.
Members of the KPC Coordinating Team should visit the field periodically to assessdata collection activities. However, while interviewers are collecting data, it is also agood time to finalize arrangements for tabulation, analysis, and dissemination.
Before sending interviewers out into the community, it helps to gather allinterviewers and supervisors to do the following:• last-minute troubleshooting• confirm availability of all necessary supplies (see an example of a Field
Implementation Checklist on next page)• confirm assigned locations of each survey team for that day• review community entry protocol (visit local leaders, health workers)• review household selection protocol• review respondent selection protocol
It is recommended that all interviewers meet daily as a group to share experiences andproblems. At minimum, each survey team should meet at the end of each day to submitcompleted questionnaires to the supervisor and discuss any problems or receive follow-up training. It also helps if supervisors meet as a group with the KPC CoordinatingTeam for daily follow-up.
7. COLLECT THE DATA
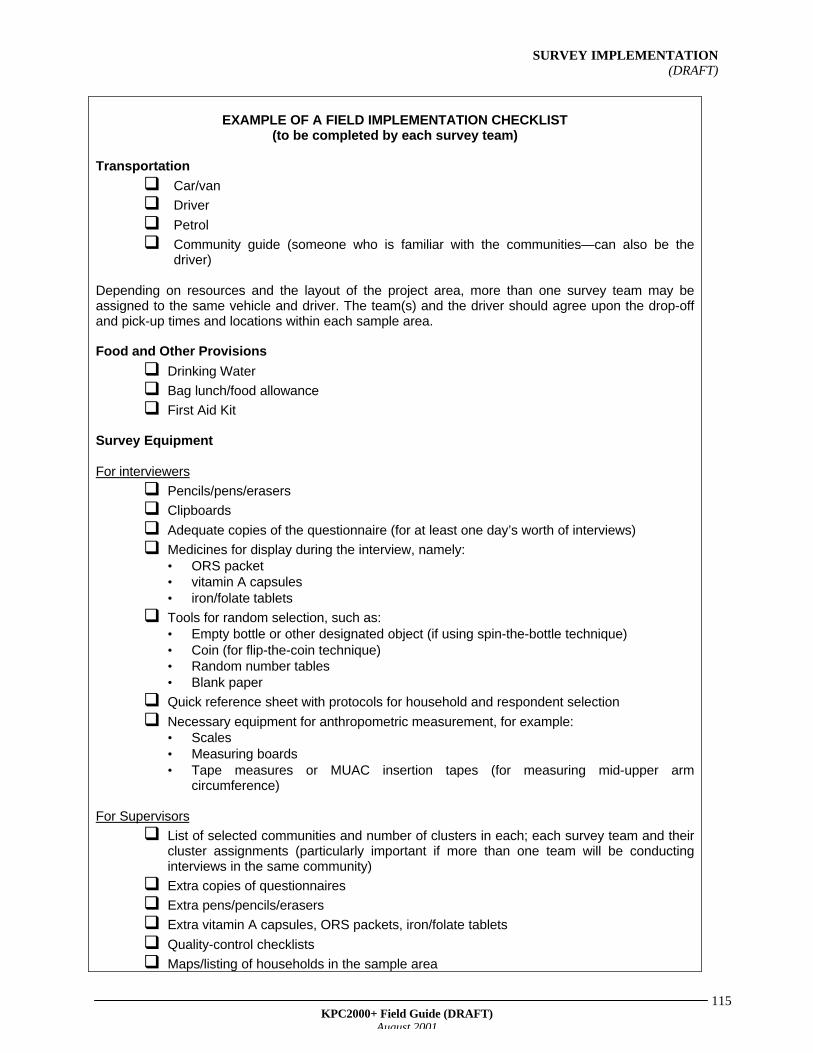
SURVEY IMPLEMENTATION(DRAFT)
KPC2000+ Field Guide (DRAFT)August 2001
115
EXAMPLE OF A FIELD IMPLEMENTATION CHECKLIST(to be completed by each survey team)
Transportation
q Car/van
q Driver
q Petrol
q Community guide (someone who is familiar with the communities—can also be thedriver)
Depending on resources and the layout of the project area, more than one survey team may beassigned to the same vehicle and driver. The team(s) and the driver should agree upon the drop-offand pick-up times and locations within each sample area.
Food and Other Provisions
q Drinking Water
q Bag lunch/food allowance
q First Aid Kit
Survey Equipment
For interviewers
q Pencils/pens/erasers
q Clipboards
q Adequate copies of the questionnaire (for at least one day’s worth of interviews)
q Medicines for display during the interview, namely:• ORS packet• vitamin A capsules• iron/folate tablets
q Tools for random selection, such as:• Empty bottle or other designated object (if using spin-the-bottle technique)• Coin (for flip-the-coin technique)• Random number tables• Blank paper
q Quick reference sheet with protocols for household and respondent selection
q Necessary equipment for anthropometric measurement, for example:• Scales• Measuring boards• Tape measures or MUAC insertion tapes (for measuring mid-upper arm
circumference)
For Supervisors
q List of selected communities and number of clusters in each; each survey team and theircluster assignments (particularly important if more than one team will be conductinginterviews in the same community)
q Extra copies of questionnaires
q Extra pens/pencils/erasers
q Extra vitamin A capsules, ORS packets, iron/folate tablets
q Quality-control checklists
q Maps/listing of households in the sample area
SURVEY IMPLEMENTATION(DRAFT)
KPC2000+ Field Guide (DRAFT)August 2001
116
The following page contains an example of a Quality-Control Checklist that supervisorscan use when observing interviews.
SUPERVISOR INSTRUCTIONS FOR QUALITY CONTROLEvery supervisor should observe at least one interview per interviewer each day.During the observed interview, try not to interrupt the process. Only fill out the checklist.Once the interviewer has finished the interview, go with the interviewer to anotherlocation to discuss any important issues. Remember to highlight his/her strong areas ofperformance, in addition to the areas that might need improvement.
Supervisors will not have the chance to observe every interview conducted byinterviewers on their teams, but they are responsible for reviewing every questionnairefor errors. Do this while in the field, so that any problems can be resolved immediately.The supervisor should indicate any changes or notes on the questionnaire using acolored pen or pencil. Once a supervisor has finished reviewing a completedquestionnaire, he or she should sign or initial the last page to indicate that thequestionnaire has been checked for quality.

SURVEY IMPLEMENTATION(DRAFT)
KPC2000+ Field Guide (DRAFT)August 2001
117
KPC QUALITY-CONTROL CHECKLIST
NAME OF INTERVIEWER: ____________________________________NAME OF SUPERVISOR: ____________________________________CLUSTER LOCATION: ____________________________________DATE: ___/___/___
DD/MM/YY
PERFORMEDCORRECTLY?
DID THE INTERVIEWER. . .
YES NO1. Select the household correctly?2. Select the respondent correctly?3. Introduce him/herself correctly?4. Read the consent statement at the beginning of the
interview?5. Correctly record information on cover page (such as
interview date, name of community, mother’s/child’sname, mother's/child’s age/date of birth, child’s sex)?
6. Speak clearly during the interview?7. Use culturally appropriate body language?8. Have neutral facial expressions/body language (did not
react positively or negatively to the respondent'sanswers)?
9. Ask leading questions that might have influenced therespondent’s answers?
10. Read the questions exactly as they were written?11. Write legibly on the questionnaire?12. Follow the skip patterns correctly?13. Read responses aloud when supposed to?14. Prompt the mother for all answers (say "Anything else?")
for questions that allow multiple responses?15. Weigh/measure the child correctly?On a scale of 1 (needs follow-up training) to 10 (excellent), I rate the interviewer's performanceduring this interview as follows (circle one):
1needs more
training
2 3 4 5 6 7 8 9 10excellent
• APPROXIMATE DURATION OF INTERVIEW: _____________________ minutes
• GENERAL NOTES: ________________________________________________
_________________________________________________________________________
SUPERVISOR'S SIGNATURE: ______________________________

SURVEY IMPLEMENTATION(DRAFT)
KPC2000+ Field Guide (DRAFT)August 2001
118
KEEPING A RECORD OF FIELD PROBLEMS
Your project can also create a daily reporting form for recording field problems. Beloware examples of problems that should be documented as they arise and submitted tothe KPC Coordinating Team daily.
• Problems with household or respondent selection
• Problems with the Questionnaire, for exampleList of questions not understood by mothersIncorrect skip patternsInappropriate terminology or wording
• Non-functioning or lost equipment
• Other problems encountered by interviewers

SURVEY IMPLEMENTATION(DRAFT)
KPC2000+ Field Guide (DRAFT)August 2001
119

SURVEY IMPLEMENTATION(DRAFT)
KPC2000+ Field Guide (DRAFT)August 2001
120

SURVEY IMPLEMENTATION(DRAFT)
KPC2000+ Field Guide (DRAFT)August 2001
121
•
POST-IMPLEMENTATION PHASE(DRAFT)
KPC2000+ Field Guide (DRAFT)August 2001
122
Data Cleaning
Before you begin analyzing data, it is first necessary to fix errors that were made duringdata collection or data entry (if entered into a computer). Data “cleaning” involvesidentifying and correcting those mistakes. It is important that both the coordinating teamand other field project staff be involved in this activity.
If there are good quality-control procedures during data collection, then the error-checking process should not be that difficult. As discussed in the previous section onfield implementation, it helps to have a special form with a checklist for supervisors
8. TABULATE SURVEYQUESTIONNAIRES
REMINDER
It is not necessary to wait until all of the interviews are completed before youbegin cleaning the data. Error checking can take place during fieldimplementation, when it is still possible to correct mistakes. As interviewsare completed, supervisors should review the completed questionnaires tomake sure that interviewers filled them out correctly. Supervisors can thenfollow up with interviewers to correct any mistakes identified, revisitrespondents (if necessary), and make sure that those same mistakes arenot repeated in the remaining interviews.
REQUIREMENTS FOR THIS PART OF THE KPC PROCESS
In order to tabulate questionnaires, you will need the following:
1. Completed KPC questionnaires2. A systematic way of checking for errors (Quality-control checklists for
field supervisors; computerized error-checking program)3. List of KPC indicators4. Tabulation and analysis plan5. Data entry and analysis programs (for analysis by computer)
POST-IMPLEMENTATION PHASE(DRAFT)
KPC2000+ Field Guide (DRAFT)August 2001
123
when reviewing questionnaires in the field. The following are examples of mistakes tolook for:
1. Blank questions2. Wrong codes3. Incorrect skip patterns (going to the wrong question after the respondent
gave a particular answer)4. Entering the correct response in an incorrect location5. Unreadable marks
Once the coordinating team is confident that the data are clean, they can begin totabulate the data. It is recommended that the tabulation workshop take place one dayafter data collection has ended. However, tabulation (by hand or computer) can begin inthe field while data are still being collected. For example, data can be entered as soonas supervisors turn in reviewed questionnaires to the KPC Coordinating Team. If yourproject has opted to do some manual tabulations of the data, this process can alsobegin in the field. For example, hand-tabulation tables can be organized by cluster, sothat survey teams can complete hand-tabulation tables as they complete interviews ineach cluster.
There should be quality control whenever there is the potential to make errors. If theproject decides to conduct the analysis by computer, it is important to have a system ofchecking for errors during the data entry process. Persons responsible for entering datawill need to be closely monitored. It helps to divide data entry personnel into teams oftwo rather than have them work separately. For each completed questionnaire, oneperson can read the respondent’s answers, while the other person enters the correctcodes into the computer. It also helps to have a “double entry” system of entering data.With double entry, the data are first entered by one person, then entered a second timeby a different person. Any discrepancies can therefore be resolved before running thecomputerized analysis program.
Why Do We Need a Tabulation Workshop?
Once the proper files are created and the data are entered, computer analysis can befairly quick and will allow projects great flexibility in terms of the type of analyses thatcan be conducted. However, people often have difficulties understanding howinformation collected from individual respondents translates into numbers andpercentages generated by a computer. For that reason, it is a good idea to have a HandTabulation Workshop with persons who were either involved in the survey or have astake in the survey’s results (and the project in general). This is recommended even ifyour project has decided to analyze the KPC by computer. Manual (hand) tabulationgives a hands-on feeling for what the data mean to a larger number of people. If localpartners and stakeholders opted not to be directly involved in data collection activities,invite them again to participate in the Hand Tabulation Workshop. This is a primeopportunity for all stakeholders to work directly with the data and identify and prioritizeproblems as a group. By being transparent in terms of how the data are collected,analyzed, and interpreted, a project can use the Hand Tabulation Workshop to buildconsensus among stakeholders. Hand tabulation is also a good way to validate theresults generated by a computer.
POST-IMPLEMENTATION PHASE(DRAFT)
KPC2000+ Field Guide (DRAFT)August 2001
124
At the workshop, encourage participants to think aloud in terms of their reactions to, andpossible explanations for, the findings.
Who Should Attend the Tabulation Workshop?
All KPC Coordinating Team members should be present at the KPC TabulationWorkshop and can facilitate the hand tabulation process. However, other individualsshould have the opportunity to work directly with the data. As a courtesy, invite otherindividuals who either have a stake in the project or are affiliated with agencies andinstitutions that work in the same geographic area. Persons who were involved in thesurvey, namely supervisors and interviewers, can be invited as tabulators. You do nothave to limit participants to individuals who work in the health field only. For example,local communication specialists, water and sanitation experts, or qualitative researchersmay also be invited.
In planning the Hand Tabulation Workshop, keep in mind that a group that is too largewill be hard to facilitate. Aim to have a group that is manageable—given time, space,and other constraints—yet includes people who represent different perspectives onchild health and survival. With a diverse group of workshop participants, your projectmight gain insight into why certain problems exist and how those problems can beaddressed.
What Should Be Covered in the Tabulation Workshop?
It is not necessary to tabulate every single question from the survey. In addition, if thecoordinating team has decided to conduct the analysis by computer, it is not necessaryto hand tabulate all of the KPC indicators during the workshop. The objective of theHand Tabulation Workshop is to ensure that other individuals understand the data, seevalue in it, and ultimately use it to prioritize problems and develop solutions.
REMINDER
In the informed consent statement read at the beginning of each interview,the interviewer assured the respondent that the information she providedwould be kept confidential. It is highly important that steps be taken duringthe KPC Tabulation Workshop to maintain the confidentiality of allrespondents and their children. Personal identifiers should not be disclosedto workshop participants who were not involved directly involved in thesurvey.
It is suggested that at the beginning of the workshop, the facilitators remindparticipants that they must respect the each respondent’s right to privacy,and that they should not discuss information regarding any particularrespondent with others outside of the workshop.

POST-IMPLEMENTATION PHASE(DRAFT)
KPC2000+ Field Guide (DRAFT)August 2001
125
Things to Consider:
• If time permits, choose at least one indicator for each of the project’s technicalinterventions.
• To identify indicators, refer to your KPC analysis plan, which should have beendeveloped during the pre-implementation stages of the survey.
• Prepare hand tabulation tables for each of the key indicators, in case workshopparticipants express an interest in tabulating particular indicators.
• After the group has hand tabulated a few indicators, it is helpful to explore subgroupdifferences. For example, are certain indicators different for boys than for girls? Forchildren of young women than those of older women? For children whose birth wasinadequately spaced versus those whose birth was adequately spaced? These andother extended analyses will be discussed in the next section of the field guide(“Analyze the Data”).
Reminders When Planning a Hand Tabulation Workshop:
q Identify which indicators will be hand tabulated at the workshop.q Reach a consensus on how those indicators are defined before the workshop.q Determine which survey questions pertain to each indicator.q Create and photocopy tabulation tables for workshop participants.q Devise clear-cut instructions for workshop participants on how to tabulate indicators
by hand.q Give invitees ample notice in terms of where and when the workshop will be held.q Reserve an adequate facility where the workshop can be held (one that has a
reliable power source [if one is needed]; enough table space to organize and reviewsurvey forms and record responses on a tabulation table).
q Obtain all necessary materials such as markers/chalk, pens, large sheets of whitepaper/chalkboard.
q Have all completed questionnaires present at the workshop.q Identify at least one person on the coordinating team who will be responsible for
documenting the process (e.g., take notes, videotape the workshop).
REMINDER:
Each KPC2000+ module contains at least one example of a handtabulation table.
REMINDER
If your project will be tabulating all indicators by hand, the coordinating teamshould allot a sufficient amount of time, personnel, and other resources inorder to accomplish this accurately and efficiently.

POST-IMPLEMENTATION PHASE(DRAFT)
KPC2000+ Field Guide (DRAFT)August 2001
126
During the workshop, members of the coordinating team should review each team'soutput and provide feedback. After hand tabulating indicators in small groups, everyonecan reconvene as one large group to share results based upon their tabulations. If onlya few indicators were hand tabulated, the coordinating team can explain to the groupthat in the interest of time, only a few indicators will be hand tabulated. At that time, theycan share results for the other key indicators that were generated by computer (ifavailable). Once that process is complete, the group can begin analyzing anddiscussing findings from the survey.
******************************************************************************************* THIS SECTION WILL BE EXPANDED AND HAND TABULATION TABLES
WILL BE AVAILABLE FOR EACH RAPID CATCH INDICATOR IN THE NEXT DRAFT OF THE MANUAL
*******************************************************************************************

POST-IMPLEMENTATION PHASE(DRAFT)
KPC2000+ Field Guide (DRAFT)August 2001
127

POST-IMPLEMENTATION PHASE(DRAFT)
KPC2000+ Field Guide (DRAFT)August 2001
128

POST-IMPLEMENTATION PHASE(DRAFT)
KPC2000+ Field Guide (DRAFT)August 2001
129
POST-IMPLEMENTATION PHASE(DRAFT)
KPC2000+ Field Guide (DRAFT)August 2001
130
The current version of the Analysis section presents advice on how to analyze data thatare aggregated for an entire program area. However, if your project chooses to selectsamples from different program units (e.g., lots), it is important to explore differencesbetween those program units. The next version of the field guide will includediscussions on how to analyze data from KPC surveys that used LQAS or amethodology other than cluster sampling.
The first step in the analysis process is to compute the survey indicators according totheir standard international definitions. If the country where you are working has definedsome of those indicators differently, it is suggested that you do a second set ofcalculations based on those national definitions. The first way ensures that yourindicators comply with international standards. However, the second way is important ifyour project wants to compare its KPC findings with other data in the country.
KPC data are often underutilized by CS projects. Most analyses are limited tofrequencies (counts) of each survey question. Although the KPC is a small-samplesurvey, projects are encouraged to do more in-depth problem analysis using KPC data.For example, simple cross tabulations might highlight differences that exist betweengroups in the target population. These differences might warrant further attention, forexample, through qualitative research.
This section of the field guide suggests ways to analyze the data so that a project candevelop a more targeted response to the issues and problems faced by its targetpopulation. In this section, the Analysis Phase has been divided into the following:
1. Identifying Problems2. Analyzing Problems3. Prioritizing Problems4. Developing Solutions
Before discussing each of these tasks, the following page presents a list of issues toconsider if your project has decided to analyze the data using a computer.
9. ANALYZE THE DATA
REMINDER
It is important to identify errors that occurred in the filed or during data entry beforeyou start analyzing the data.
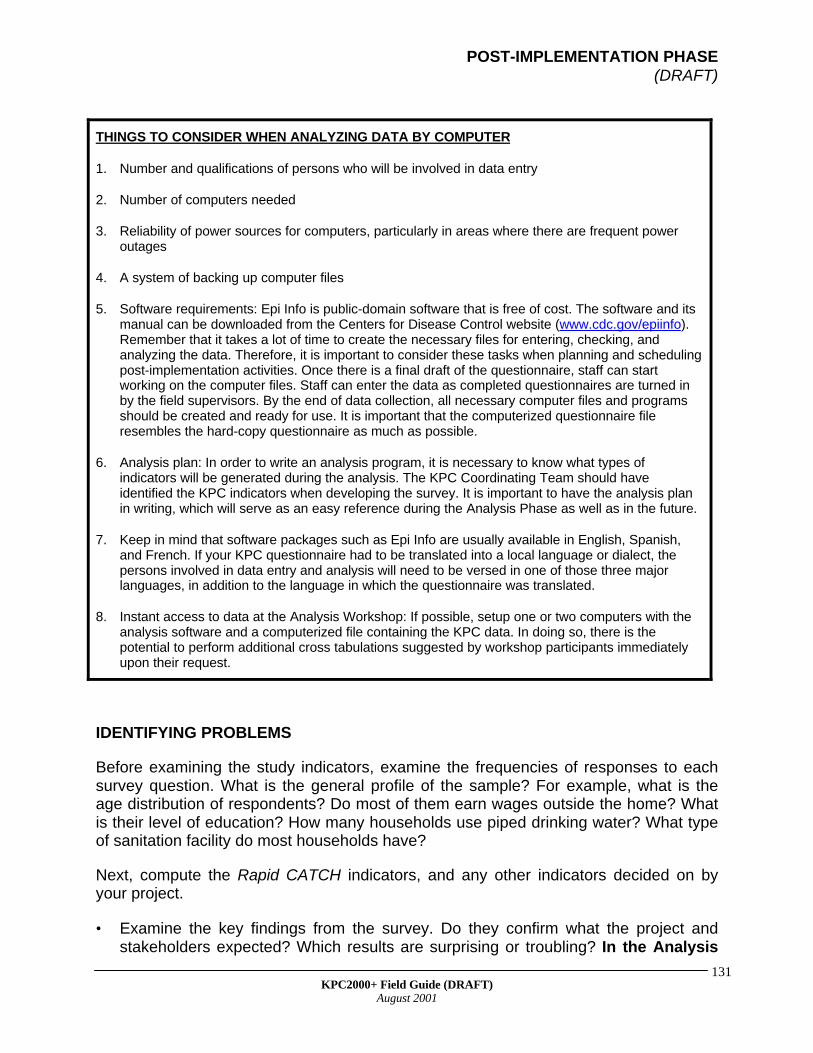
POST-IMPLEMENTATION PHASE(DRAFT)
KPC2000+ Field Guide (DRAFT)August 2001
131
THINGS TO CONSIDER WHEN ANALYZING DATA BY COMPUTER
1. Number and qualifications of persons who will be involved in data entry
2. Number of computers needed
3. Reliability of power sources for computers, particularly in areas where there are frequent poweroutages
4. A system of backing up computer files
5. Software requirements: Epi Info is public-domain software that is free of cost. The software and itsmanual can be downloaded from the Centers for Disease Control website (www.cdc.gov/epiinfo).Remember that it takes a lot of time to create the necessary files for entering, checking, andanalyzing the data. Therefore, it is important to consider these tasks when planning and schedulingpost-implementation activities. Once there is a final draft of the questionnaire, staff can startworking on the computer files. Staff can enter the data as completed questionnaires are turned inby the field supervisors. By the end of data collection, all necessary computer files and programsshould be created and ready for use. It is important that the computerized questionnaire fileresembles the hard-copy questionnaire as much as possible.
6. Analysis plan: In order to write an analysis program, it is necessary to know what types ofindicators will be generated during the analysis. The KPC Coordinating Team should haveidentified the KPC indicators when developing the survey. It is important to have the analysis planin writing, which will serve as an easy reference during the Analysis Phase as well as in the future.
7. Keep in mind that software packages such as Epi Info are usually available in English, Spanish,and French. If your KPC questionnaire had to be translated into a local language or dialect, thepersons involved in data entry and analysis will need to be versed in one of those three majorlanguages, in addition to the language in which the questionnaire was translated.
8. Instant access to data at the Analysis Workshop: If possible, setup one or two computers with theanalysis software and a computerized file containing the KPC data. In doing so, there is thepotential to perform additional cross tabulations suggested by workshop participants immediatelyupon their request.
IDENTIFYING PROBLEMS
Before examining the study indicators, examine the frequencies of responses to eachsurvey question. What is the general profile of the sample? For example, what is theage distribution of respondents? Do most of them earn wages outside the home? Whatis their level of education? How many households use piped drinking water? What typeof sanitation facility do most households have?
Next, compute the Rapid CATCH indicators, and any other indicators decided on byyour project.
• Examine the key findings from the survey. Do they confirm what the project andstakeholders expected? Which results are surprising or troubling? In the Analysis
POST-IMPLEMENTATION PHASE(DRAFT)
KPC2000+ Field Guide (DRAFT)August 2001
132
Workshop, encourage participants to “think aloud” and share theirimpressions with the rest of the group.
• Compare key results with data from available "standards." Standards can come fromproject objectives, national objectives, national or international health messages, orreported data from other sources (national or local). Does the KPC paint the samepicture as data from other sources? If not, what are some possible explanations?Based on the KPC, how does the program area compare with neighboring areas orthe country as a whole?
• Identify gaps between current practices and coverage
ANALYZING PROBLEMS
Exploring whether differentials exist for certain indicators is an important step in problemanalysis. Once the key indicators are computed, workshop participants can begin tocross tabulate the data according to select background variables. Even if your projectconducts the analysis by computer, it helps to draw 2x2 tables on large sheets of paperso that workshop participants can get hands-on experience in data exploration.
For every survey finding, ask workshop participants to consider the following question:"Does this finding apply to the population as a whole, or might there be importantdifferences between certain population groups?" KPC sample sizes are typically small,but results from the cross tabulations might highlight differentials that warrant furtherinvestigation.
The following table presents some background characteristics to consider whenanalyzing the data, as well as examples of ways to categorize mothers and children. Itis not necessary to explore differences by each of the characteristics listed in the table.In addition, there might be other variables not listed in the table that are very relevant toyour project. Do what makes sense for your local context.
As a reminder, if your project is interested in drawing comparisons between certainpopulations groups, this should be reflected in the questionnaire and/or the samplingstrategy.
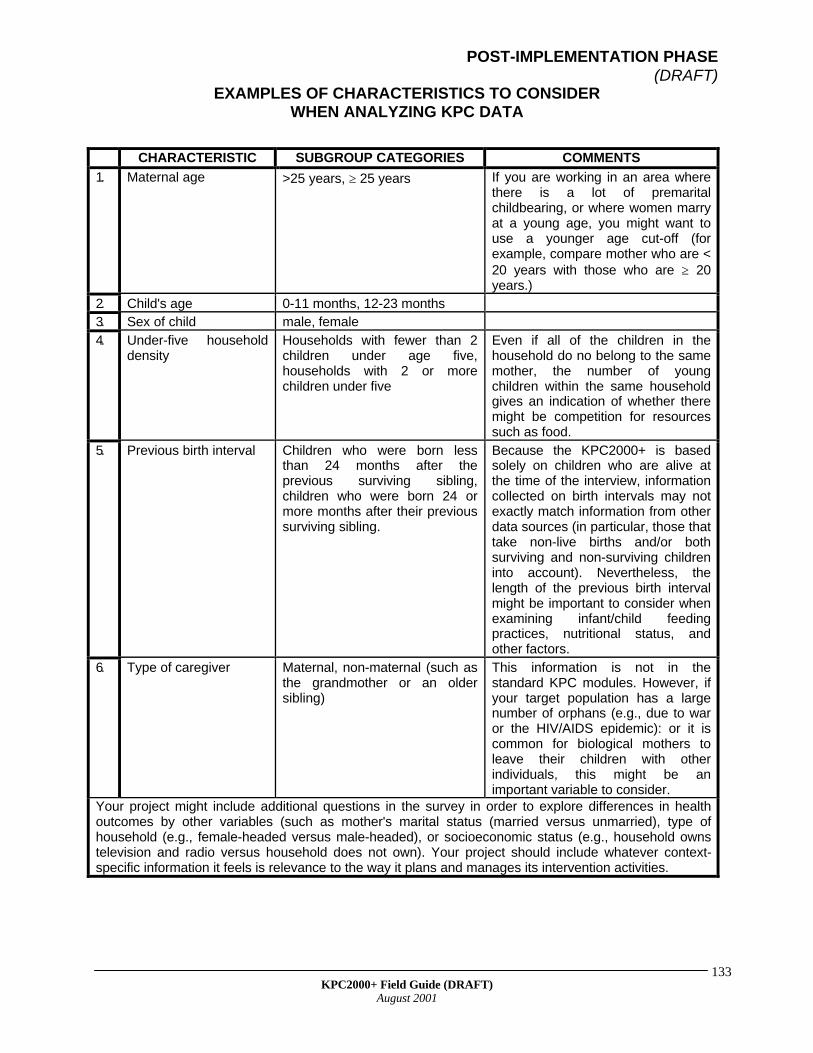
POST-IMPLEMENTATION PHASE(DRAFT)
KPC2000+ Field Guide (DRAFT)August 2001
133
EXAMPLES OF CHARACTERISTICS TO CONSIDERWHEN ANALYZING KPC DATA
CHARACTERISTIC SUBGROUP CATEGORIES COMMENTS
1. Maternal age >25 years, ≥ 25 years If you are working in an area wherethere is a lot of premaritalchildbearing, or where women marryat a young age, you might want touse a younger age cut-off (forexample, compare mother who are <20 years with those who are ≥ 20years.)
2. Child's age 0-11 months, 12-23 months3. Sex of child male, female4. Under-five household
densityHouseholds with fewer than 2children under age five,households with 2 or morechildren under five
Even if all of the children in thehousehold do no belong to the samemother, the number of youngchildren within the same householdgives an indication of whether theremight be competition for resourcessuch as food.
5. Previous birth interval Children who were born lessthan 24 months after theprevious surviving sibling,children who were born 24 ormore months after their previoussurviving sibling.
Because the KPC2000+ is basedsolely on children who are alive atthe time of the interview, informationcollected on birth intervals may notexactly match information from otherdata sources (in particular, those thattake non-live births and/or bothsurviving and non-surviving childreninto account). Nevertheless, thelength of the previous birth intervalmight be important to consider whenexamining infant/child feedingpractices, nutritional status, andother factors.
6. Type of caregiver Maternal, non-maternal (such asthe grandmother or an oldersibling)
This information is not in thestandard KPC modules. However, ifyour target population has a largenumber of orphans (e.g., due to waror the HIV/AIDS epidemic): or it iscommon for biological mothers toleave their children with otherindividuals, this might be animportant variable to consider.
Your project might include additional questions in the survey in order to explore differences in healthoutcomes by other variables (such as mother's marital status (married versus unmarried), type ofhousehold (e.g., female-headed versus male-headed), or socioeconomic status (e.g., household ownstelevision and radio versus household does not own). Your project should include whatever context-specific information it feels is relevance to the way it plans and manages its intervention activities.
POST-IMPLEMENTATION PHASE(DRAFT)
KPC2000+ Field Guide (DRAFT)August 2001
134
In order to make comparisons, you need the appropriate data. This is why it is importantto develop a preliminary analysis plan before developing the KPC questionnaire ordesigning the sampling strategy. If you postpone developing an analysis plan, you mightfind that the information you need was not included in the survey. For example, if youwould like to compare the outcomes of children whose mothers are currently marriedversus unmarried, you would need to do one of the following:
a. include a question on marital status in your questionnaire (Although, there is achance that you might not have enough cases in each group to make meaningfulcomparisons.)
b. make provisions in your sampling strategy to select both married and unmarriedmothers for the study.
A small sample size limits how in-depth the analysis can be. Even if you are looking atindicators that are based on the entire sample, try to avoid comparing more than twocategories. For example, there may not be enough cases to explore differencesbetween women in five-year groups (15-19, 20-24, 25-29, 30-34, etc.). As a result,collapse the five-year age groups into two broad age categories (such as <25 and ≥ 25).
Below is a 2x2 table that illustrates how to divide the cases in your sample according tothe result you are measuring (KPC indicator) and another variable of interest.
Because the number of cases in a KPC survey is generally small, do not rely onresults from statistical tests (p-values, chi-square statistics) to flag differentialsthat warrant further investigation or attention.
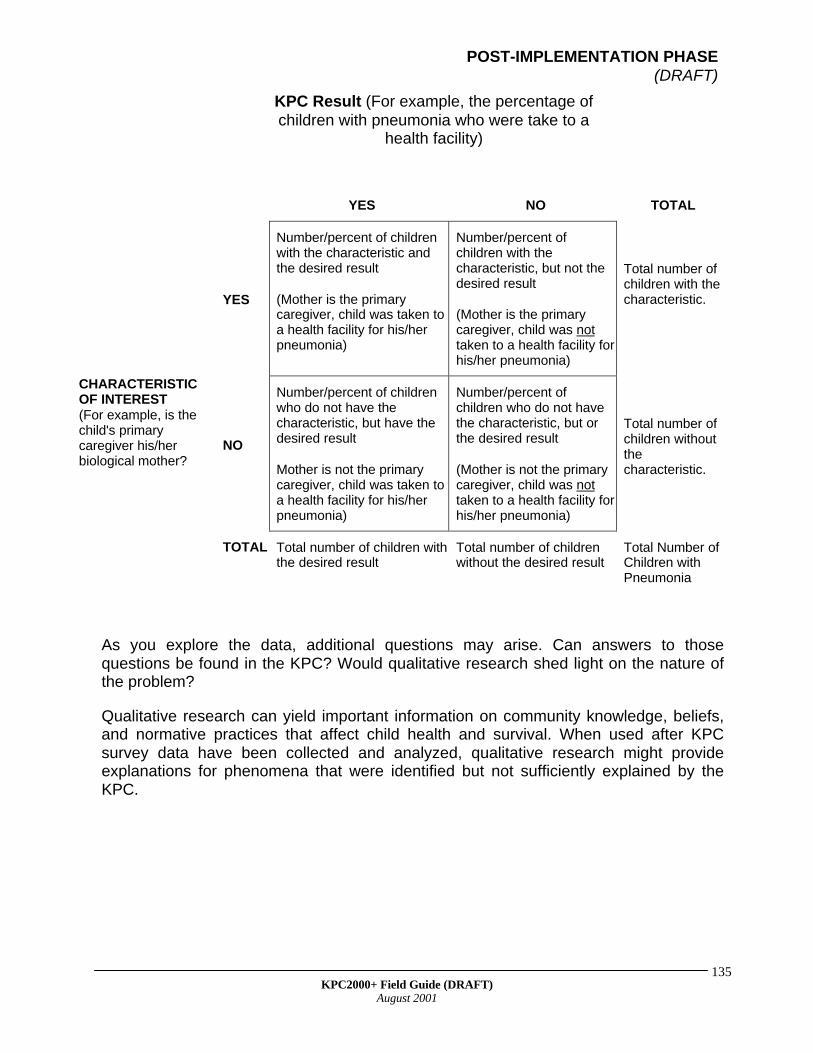
POST-IMPLEMENTATION PHASE(DRAFT)
KPC2000+ Field Guide (DRAFT)August 2001
135
KPC Result (For example, the percentage ofchildren with pneumonia who were take to a
health facility)
YES NO TOTAL
YES
Number/percent of childrenwith the characteristic andthe desired result
(Mother is the primarycaregiver, child was taken toa health facility for his/herpneumonia)
Number/percent ofchildren with thecharacteristic, but not thedesired result
(Mother is the primarycaregiver, child was nottaken to a health facility forhis/her pneumonia)
Total number ofchildren with thecharacteristic.
CHARACTERISTICOF INTEREST(For example, is thechild's primarycaregiver his/herbiological mother?
NO
Number/percent of childrenwho do not have thecharacteristic, but have thedesired result
Mother is not the primarycaregiver, child was taken toa health facility for his/herpneumonia)
Number/percent ofchildren who do not havethe characteristic, but orthe desired result
(Mother is not the primarycaregiver, child was nottaken to a health facility forhis/her pneumonia)
Total number ofchildren withoutthecharacteristic.
TOTAL Total number of children withthe desired result
Total number of childrenwithout the desired result
Total Number ofChildren withPneumonia
As you explore the data, additional questions may arise. Can answers to thosequestions be found in the KPC? Would qualitative research shed light on the nature ofthe problem?
Qualitative research can yield important information on community knowledge, beliefs,and normative practices that affect child health and survival. When used after KPCsurvey data have been collected and analyzed, qualitative research might provideexplanations for phenomena that were identified but not sufficiently explained by theKPC.

POST-IMPLEMENTATION PHASE(DRAFT)
KPC2000+ Field Guide (DRAFT)August 2001
136

POST-IMPLEMENTATION PHASE(DRAFT)
KPC2000+ Field Guide (DRAFT)August 2001
137
POST-IMPLEMENTATION PHASE(DRAFT)
KPC2000+ Field Guide (DRAFT)August 2001
138
This updated version of “Writing the Survey Report” (initially written by the PVO CSSP)provides recommendations on the format and content of the KPC survey report.
Why Do We Need a Survey Report?
The KPC survey report is an important outcome of the KPC process. It should provide adetailed description of the study, present survey findings, and discuss the programimplications of those findings. Individuals who were not involved in the study should beable to read the report and get a good sense of the process and methods, not just themajor findings.
Projects are encouraged to share the report with partner organizations, donor agencies,and other agencies/institutions working in the same geographic area. If the KPC waspart of the project’s baseline assessment, then the survey report can serve asbackground material during the DIP-writing workshop. In addition, project staff can workwith local partners and stakeholders to make the survey report a “living” document. Forexample, they can experiment with ways to publicly display KPC findings, and canexplore innovative ways to track result-level information during the life of the project.This will be discussed in greater detail in the section of the guide entitled “Use KPCData”.
When Should We Prepare the Survey Report?
The coordinating team should aim to have a first draft of the survey report by the end ofthe analysis workshop (i.e., about 2 days after data collection has ended). The team canthen devote a few days to revisions, producing the final report within one week ofcompleting data collection. This is a realistic expectation, especially if your team startsdrafting sections of the report on the process, tools, and methodology during the pre-implementation phase of the survey. Also, if local partners and stakeholders are activelyinvolved in the planning, conduct, and analysis of the survey, then their commentsshould be reflected in the first draft of the report. It will therefore be less likely that theywill have many additional comments that need to be incorporated in the final draft.
10. WRITE THE SURVEYREPORT
POST-IMPLEMENTATION PHASE
KPC2000+ Field Guide (DRAFT)August 2001
139
I. FORMAT
It is useful to present material in the following manner:
1. Cover Page (include title, date, PVO/country, partner organizations, otherparticipating organizations, and author names)
2. Acknowledgments (list all supervisors, interviewers, etc., and their titles)3. Table of Contents4. Executive Summary (written last)5. Background6. Process and Partnership Building7. Methods8. Results9. Discussion10. Bibliography11. Appendices
II. CONTENT
Background
This section of the report should include background information on the context in whichthe PVO is working. Examples of relevant information are as follows:
• project location• characteristics of the target beneficiary population• health, social, and economic conditions within the project area• national standards/policies regarding maternal and child health (e.g., immunization,
breastfeeding, or Safe Motherhood policies)
Much of the above information is probably in your project proposal or DIP. However,you can also include relevant information from other sources identified during the Pre-Implementation Phase (refer to the section entitled “2. Determine Needs andInformation Gaps” in the Pre-Implementation section of this guide:).
REMINDER
In addition to developing local capacity to conduct rapid surveys, it is equallyimportant to develop skills in documenting and disseminating information.If your project has hired a consultant to act as Survey Coordinator, the consultantshould work closely with members of the KPC coordinating team when draftingthe survey report.

POST-IMPLEMENTATION PHASE
KPC2000+ Field Guide (DRAFT)August 2001
140
The authors should also give an overview of the project, namely the following:• goals• objectives• intervention activities• objectives of the KPC survey
Process and Partnership Building
As a reminder, the KPC was designed to be participatory, engaging local partners andstakeholders in information gathering, analysis, and decisionmaking. Participatoryresearch is conducive to partnership and capacity building. In addition, it fosters a senseof local ownership of KPC results and greater utilization of information for localdecisionmaking.
This version of the KPC report-writing guidelines stresses the importance of discussingpartnership and capacity-building activities as they relate to the KPC survey. Adiscussion of the following would be useful:
• Methods of identifying and engaging local partners/stakeholders in the KPC• Specific roles of local partners/stakeholders in the KPC survey• Constraints in making the KPC process more participatory• Innovations in partnership building and participatory research used in the study
Partnership building is a dynamic and sometimes, intensive process. If your projectencountered certain barriers to making the process participatory, or if the project usedan innovative approach to maximize local involvement, it will be interesting to documentthis in the survey report.
Methods
In the Methods section of the survey report, it is important to discuss the following:
• Questionnaire• KPC indicators• Sampling design• Training• Data collection and quality control procedures• Data management/data analysis
Questionnaire:
• Questionnaire development process• Scope of the survey (topic areas covered)• Survey length
POST-IMPLEMENTATION PHASE
KPC2000+ Field Guide (DRAFT)August 2001
141
• Versions of the questionnaire (if more than one type of respondent is sampled)• Specially adapted survey questions• Translation into local languages
Study indicators:
• List of indicators grouped by intervention or topic area• Definition of each indicator
In adapting the questionnaire, remember that the KPC should yield a concise andmanageable set of indicators for reporting results. Projects will probably need to consultadditional data sources and employ other information-gathering techniques to obtain allthe information necessary for developing project activities or strategies. As a reminder,the Rapid CATCH yields indicators that are useful to all CS projects, regardless of theirintervention mix. Reporting on these indicators is strongly encouraged by the COREMonitoring and Evaluation Working Group.
Sampling design:
• Sources of population data (used in the selection of sample areas)• Type of design used (e.g., 30-cluster sampling or Lot Quality Assurance Sampling
designs; parallel sampling techniques)• Sample size calculations• Selection process
As stated earlier in this guide, 30-cluster sampling has been traditionally used with KPCsurveys, but it is not the only method of sampling. The survey report should discussdetails of the sampling process, namely a) the type of design used; b) the process usedto select the sample areas (clusters/lots), households, and respondents; c) the numberof sample areas; and d) the number of interviews conducted within each sample area. Itis also helpful to state any selection protocols employed during the study (e.g., whatinterviewers were instructed to do when there was more than one child less than twowithin the same household).
It is also helpful to include information on the number (and when available, keycharacteristics) of women who refused to be interviewed.
Training:
• Selection of interviewers—process of selection and general profile of supervisorsand interviewers (e.g., female, high-school educated, staff from partnerorganizations)
• Training of supervisors and interviewers (duration of training, person(s) whoconducted the training, content/structure of training sessions)
• Strengthening local capacity to conduct future small-sample surveys
Data Collection:
• Average length of interview
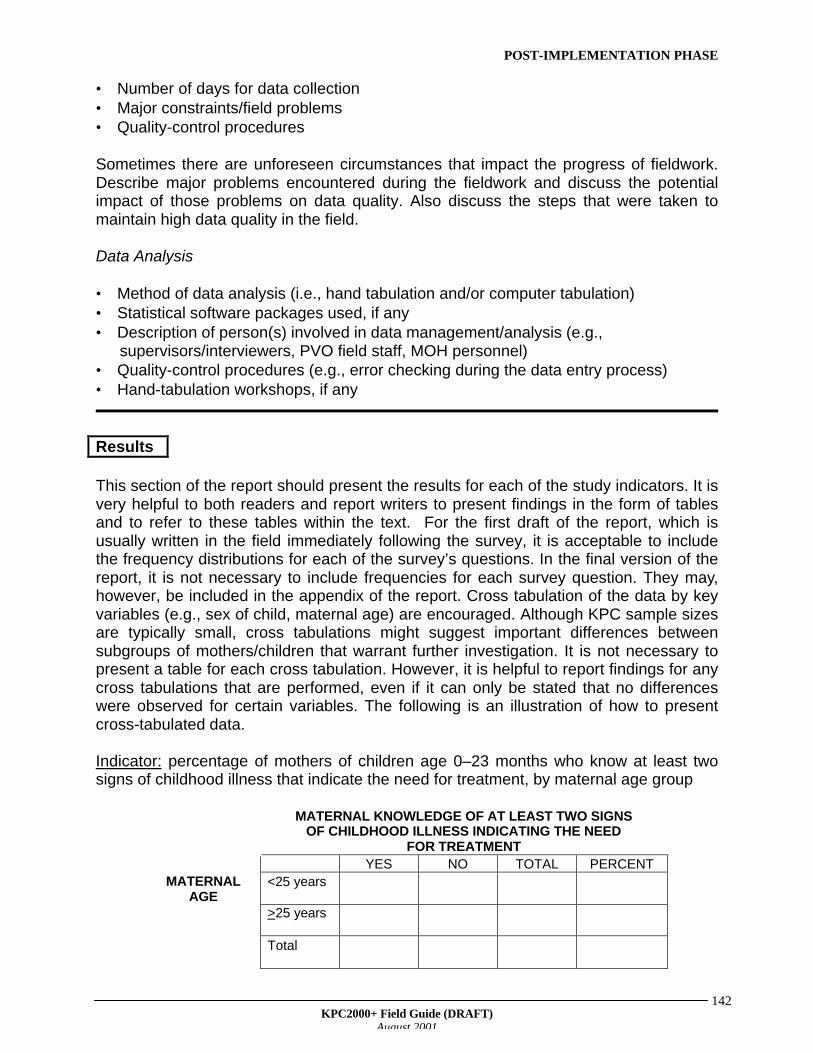
POST-IMPLEMENTATION PHASE
KPC2000+ Field Guide (DRAFT)August 2001
142
• Number of days for data collection• Major constraints/field problems• Quality-control procedures
Sometimes there are unforeseen circumstances that impact the progress of fieldwork.Describe major problems encountered during the fieldwork and discuss the potentialimpact of those problems on data quality. Also discuss the steps that were taken tomaintain high data quality in the field.
Data Analysis
• Method of data analysis (i.e., hand tabulation and/or computer tabulation)• Statistical software packages used, if any• Description of person(s) involved in data management/analysis (e.g.,
supervisors/interviewers, PVO field staff, MOH personnel)• Quality-control procedures (e.g., error checking during the data entry process)• Hand-tabulation workshops, if any
Results
This section of the report should present the results for each of the study indicators. It isvery helpful to both readers and report writers to present findings in the form of tablesand to refer to these tables within the text. For the first draft of the report, which isusually written in the field immediately following the survey, it is acceptable to includethe frequency distributions for each of the survey’s questions. In the final version of thereport, it is not necessary to include frequencies for each survey question. They may,however, be included in the appendix of the report. Cross tabulation of the data by keyvariables (e.g., sex of child, maternal age) are encouraged. Although KPC sample sizesare typically small, cross tabulations might suggest important differences betweensubgroups of mothers/children that warrant further investigation. It is not necessary topresent a table for each cross tabulation. However, it is helpful to report findings for anycross tabulations that are performed, even if it can only be stated that no differenceswere observed for certain variables. The following is an illustration of how to presentcross-tabulated data.
Indicator: percentage of mothers of children age 0–23 months who know at least twosigns of childhood illness that indicate the need for treatment, by maternal age group
MATERNAL KNOWLEDGE OF AT LEAST TWO SIGNSOF CHILDHOOD ILLNESS INDICATING THE NEED
FOR TREATMENTYES NO TOTAL PERCENT
<25 yearsMATERNALAGE
>25 years
Total

POST-IMPLEMENTATION PHASE
KPC2000+ Field Guide (DRAFT)August 2001
143
Readers of the report should clearly understand the numerator and denominator of eachindicator. It is very helpful to have a single table at the very beginning of the Resultssection that lists all indicators, their numerators, denominators, percents, andconfidence limits. The table on the following page is an illustration.
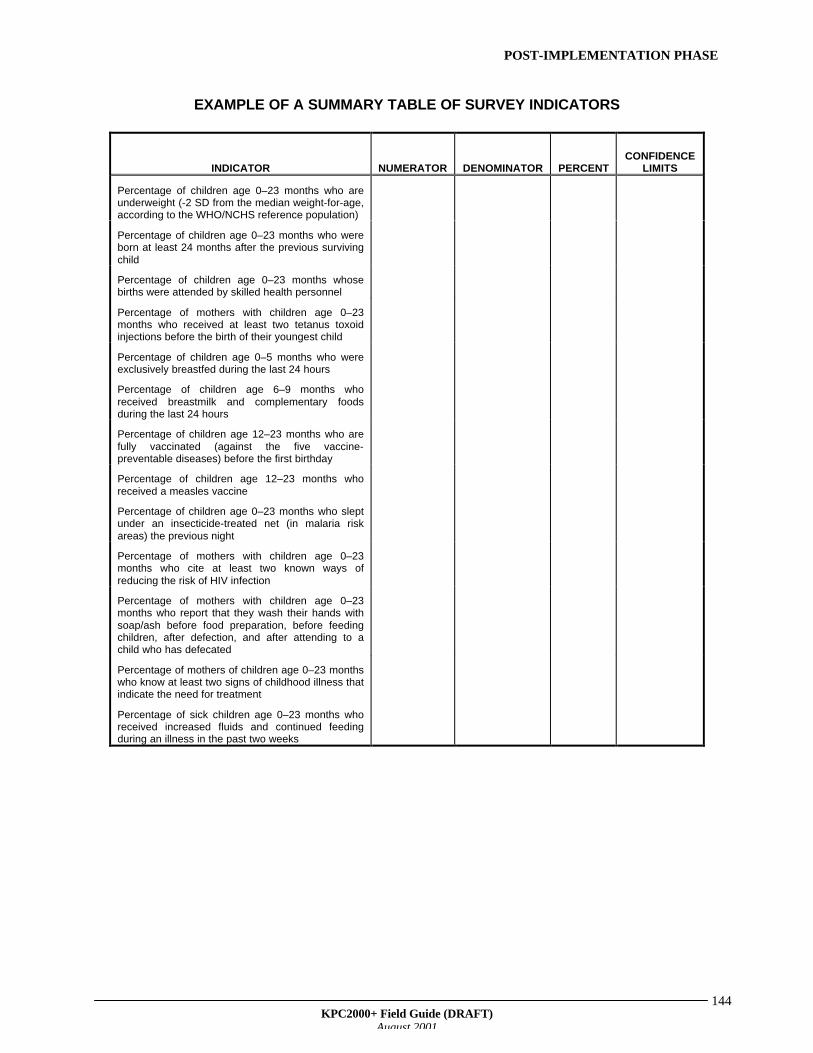
POST-IMPLEMENTATION PHASE
KPC2000+ Field Guide (DRAFT)August 2001
144
EXAMPLE OF A SUMMARY TABLE OF SURVEY INDICATORS
INDICATOR NUMERATOR DENOMINATOR PERCENTCONFIDENCE
LIMITS
Percentage of children age 0–23 months who areunderweight (-2 SD from the median weight-for-age,according to the WHO/NCHS reference population)
Percentage of children age 0–23 months who wereborn at least 24 months after the previous survivingchild
Percentage of children age 0–23 months whosebirths were attended by skilled health personnel
Percentage of mothers with children age 0–23months who received at least two tetanus toxoidinjections before the birth of their youngest child
Percentage of children age 0–5 months who wereexclusively breastfed during the last 24 hours
Percentage of children age 6–9 months whoreceived breastmilk and complementary foodsduring the last 24 hours
Percentage of children age 12–23 months who arefully vaccinated (against the five vaccine-preventable diseases) before the first birthday
Percentage of children age 12–23 months whoreceived a measles vaccine
Percentage of children age 0–23 months who sleptunder an insecticide-treated net (in malaria riskareas) the previous night
Percentage of mothers with children age 0–23months who cite at least two known ways ofreducing the risk of HIV infection
Percentage of mothers with children age 0–23months who report that they wash their hands withsoap/ash before food preparation, before feedingchildren, after defection, and after attending to achild who has defecated
Percentage of mothers of children age 0–23 monthswho know at least two signs of childhood illness thatindicate the need for treatment
Percentage of sick children age 0–23 months whoreceived increased fluids and continued feedingduring an illness in the past two weeks

POST-IMPLEMENTATION PHASE
KPC2000+ Field Guide (DRAFT)August 2001
145
A WORD ABOUT CONFIDENCE LIMITS
The KPC results serve as “best estimates” of key child survival indicators. It is importantto remember that estimates from any survey are associated with a certain level of error.For each indicator, the study estimate is just one value within a range of possiblevalues. When reporting KPC results, it is helpful to state the confidence limits, whichindicate the margin of error for each survey finding. Project staff can use confidencelimits to better compare survey findings with the project’s objectives, reported nationallevels, or findings of other similar surveys. Below are two examples of how to use andinterpret confidence limits.
Using confidence limits—Example #1
• Objective: By the end of the project, 80% of infants will be fully immunized in their firstyear of life.
• Indicator: Percentage of children age 12–23 months who received the required number ofimmunizations (according to national/international protocol) against vaccine preventablediseases before the first birthday
• KPC result: 65% of children age 12–23 months in the survey were fully immunized by age1 year. The confidence limits are calculated as plus or minus 10%.
• Conclusion: We are 95% confident that the true proportion of fully immunized children inthe population is between 55% and 75% (65% +10%). The best estimate of the trueproportion is 65%.
• Discussion: A comparison of the survey finding—including its confidence limits (the marginof error)—with the project objective indicates that the project did not achieve its objective.That is, the evidence suggests that the true proportion of fully immunized children in thepopulation is less than 80% (the probability that 80% is the true proportion in thepopulation, given the survey finding, is less than 5%). The project should study other EPIfindings from the survey to identify the barriers to achieving the objective. The projectshould also consider using qualitative research methods to shed further light on thematter. For example, low coverage of a specific antigen (e.g. measles vaccine) may be theprinciple barrier to full immunization. Or, there may be a high drop out rate between thefirst DPT (or OPV) and the third.
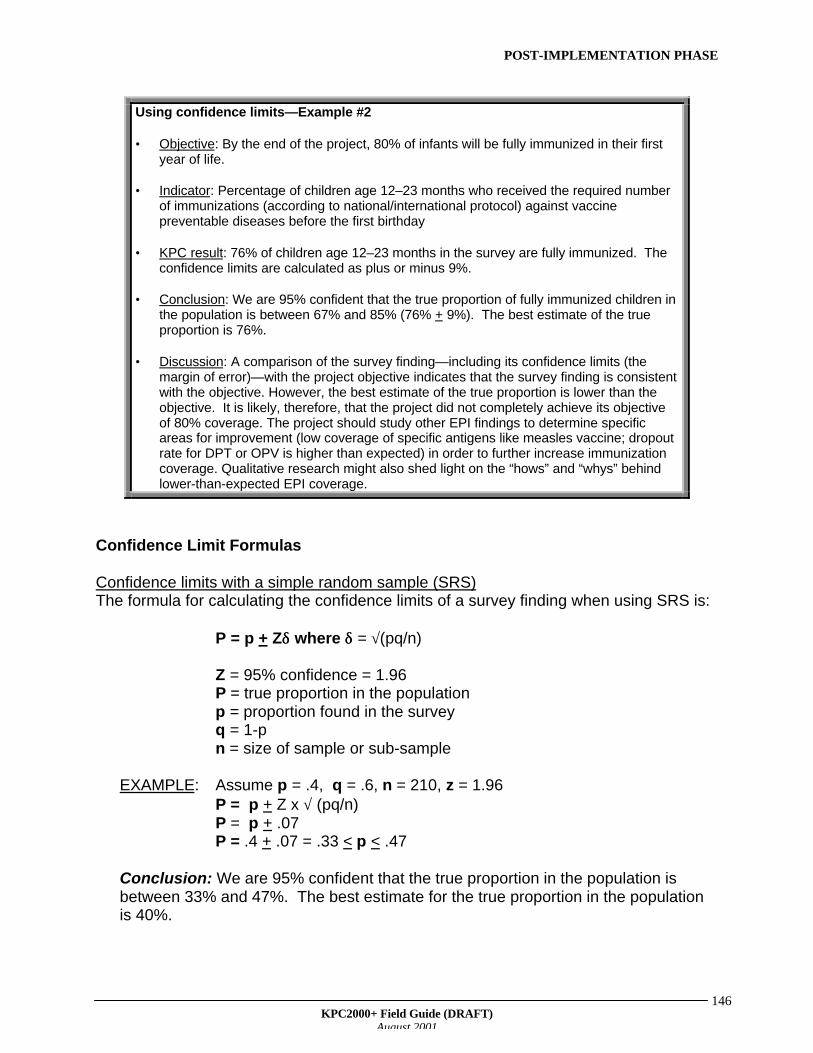
POST-IMPLEMENTATION PHASE
KPC2000+ Field Guide (DRAFT)August 2001
146
Using confidence limits—Example #2
• Objective: By the end of the project, 80% of infants will be fully immunized in their firstyear of life.
• Indicator: Percentage of children age 12–23 months who received the required numberof immunizations (according to national/international protocol) against vaccinepreventable diseases before the first birthday
• KPC result: 76% of children age 12–23 months in the survey are fully immunized. Theconfidence limits are calculated as plus or minus 9%.
• Conclusion: We are 95% confident that the true proportion of fully immunized children inthe population is between 67% and 85% (76% + 9%). The best estimate of the trueproportion is 76%.
• Discussion: A comparison of the survey finding—including its confidence limits (themargin of error)—with the project objective indicates that the survey finding is consistentwith the objective. However, the best estimate of the true proportion is lower than theobjective. It is likely, therefore, that the project did not completely achieve its objectiveof 80% coverage. The project should study other EPI findings to determine specificareas for improvement (low coverage of specific antigens like measles vaccine; dropoutrate for DPT or OPV is higher than expected) in order to further increase immunizationcoverage. Qualitative research might also shed light on the “hows” and “whys” behindlower-than-expected EPI coverage.
Confidence Limit Formulas
Confidence limits with a simple random sample (SRS)The formula for calculating the confidence limits of a survey finding when using SRS is:
P = p + Zδδ where δδ = √(pq/n)
Z = 95% confidence = 1.96P = true proportion in the populationp = proportion found in the surveyq = 1-pn = size of sample or sub-sample
EXAMPLE: Assume p = .4, q = .6, n = 210, z = 1.96P = p + Z x √ (pq/n)P = p + .07P = .4 + .07 = .33 < p < .47
Conclusion: We are 95% confident that the true proportion in the population isbetween 33% and 47%. The best estimate for the true proportion in the populationis 40%.
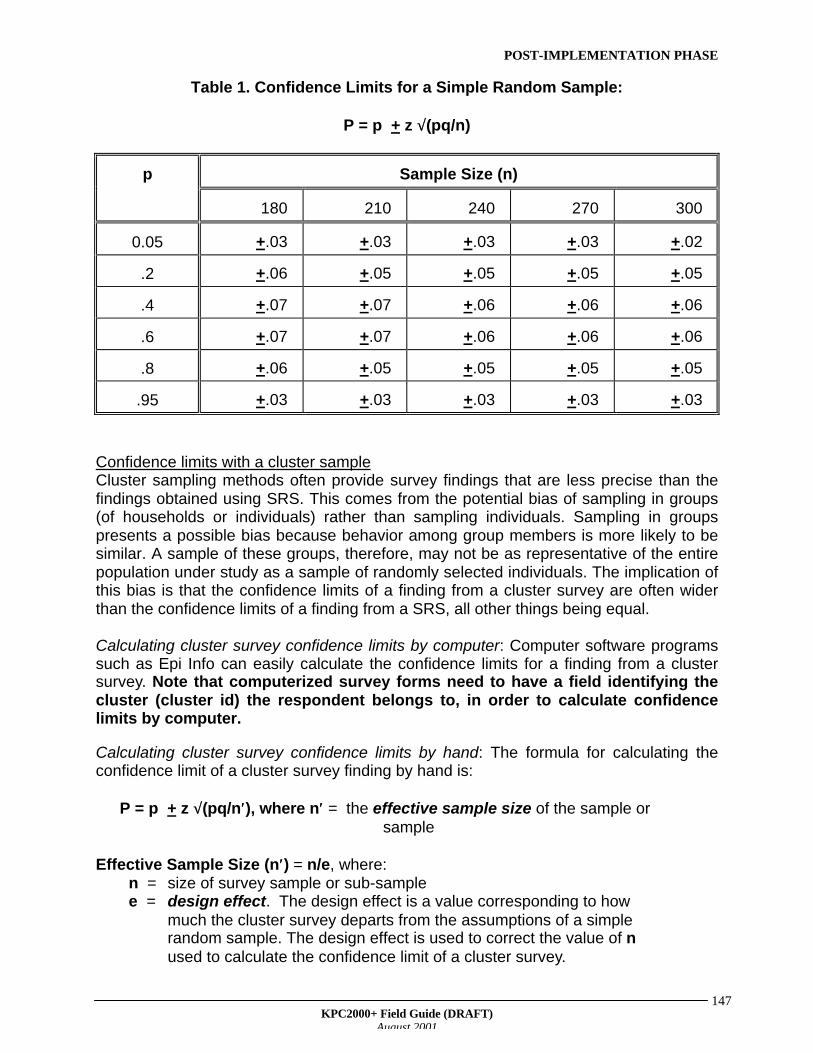
POST-IMPLEMENTATION PHASE
KPC2000+ Field Guide (DRAFT)August 2001
147
Table 1. Confidence Limits for a Simple Random Sample:
P = p + z √√(pq/n)
Sample Size (n)p
180 210 240 270 300
0.05 +.03 +.03 +.03 +.03 +.02
.2 +.06 +.05 +.05 +.05 +.05
.4 +.07 +.07 +.06 +.06 +.06
.6 +.07 +.07 +.06 +.06 +.06
.8 +.06 +.05 +.05 +.05 +.05
.95 +.03 +.03 +.03 +.03 +.03
Confidence limits with a cluster sampleCluster sampling methods often provide survey findings that are less precise than thefindings obtained using SRS. This comes from the potential bias of sampling in groups(of households or individuals) rather than sampling individuals. Sampling in groupspresents a possible bias because behavior among group members is more likely to besimilar. A sample of these groups, therefore, may not be as representative of the entirepopulation under study as a sample of randomly selected individuals. The implication ofthis bias is that the confidence limits of a finding from a cluster survey are often widerthan the confidence limits of a finding from a SRS, all other things being equal.
Calculating cluster survey confidence limits by computer: Computer software programssuch as Epi Info can easily calculate the confidence limits for a finding from a clustersurvey. Note that computerized survey forms need to have a field identifying thecluster (cluster id) the respondent belongs to, in order to calculate confidencelimits by computer.
Calculating cluster survey confidence limits by hand: The formula for calculating theconfidence limit of a cluster survey finding by hand is:
P = p + z √√(pq/n′′), where n′′ = the effective sample size of the sample orsample
Effective Sample Size (n′′) = n/e, where: n = size of survey sample or sub-sample e = design effect. The design effect is a value corresponding to how
much the cluster survey departs from the assumptions of a simplerandom sample. The design effect is used to correct the value of nused to calculate the confidence limit of a cluster survey.
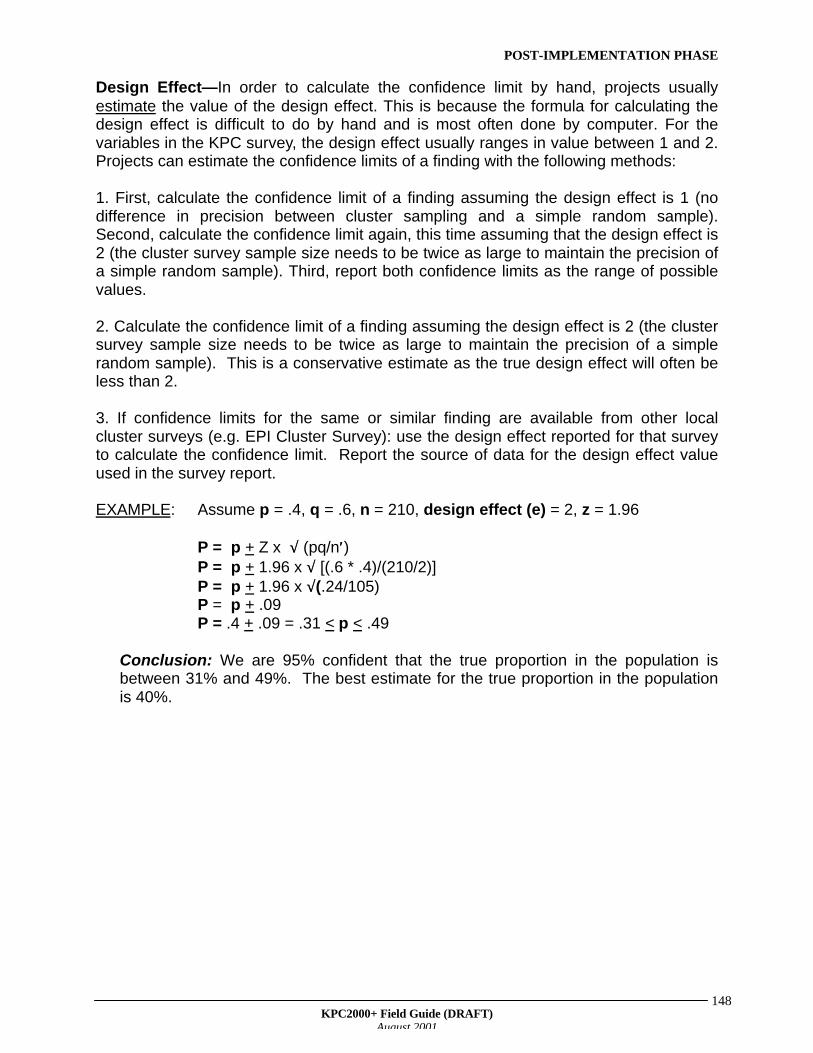
POST-IMPLEMENTATION PHASE
KPC2000+ Field Guide (DRAFT)August 2001
148
Design Effect—In order to calculate the confidence limit by hand, projects usuallyestimate the value of the design effect. This is because the formula for calculating thedesign effect is difficult to do by hand and is most often done by computer. For thevariables in the KPC survey, the design effect usually ranges in value between 1 and 2.Projects can estimate the confidence limits of a finding with the following methods:
1. First, calculate the confidence limit of a finding assuming the design effect is 1 (nodifference in precision between cluster sampling and a simple random sample).Second, calculate the confidence limit again, this time assuming that the design effect is2 (the cluster survey sample size needs to be twice as large to maintain the precision ofa simple random sample). Third, report both confidence limits as the range of possiblevalues.
2. Calculate the confidence limit of a finding assuming the design effect is 2 (the clustersurvey sample size needs to be twice as large to maintain the precision of a simplerandom sample). This is a conservative estimate as the true design effect will often beless than 2.
3. If confidence limits for the same or similar finding are available from other localcluster surveys (e.g. EPI Cluster Survey): use the design effect reported for that surveyto calculate the confidence limit. Report the source of data for the design effect valueused in the survey report.
EXAMPLE: Assume p = .4, q = .6, n = 210, design effect (e) = 2, z = 1.96
P = p + Z x √√ (pq/n′′)P = p + 1.96 x √√ [(.6 * .4)/(210/2)]P = p + 1.96 x √√(.24/105)P = p + .09P = .4 + .09 = .31 < p < .49
Conclusion: We are 95% confident that the true proportion in the population isbetween 31% and 49%. The best estimate for the true proportion in the populationis 40%.
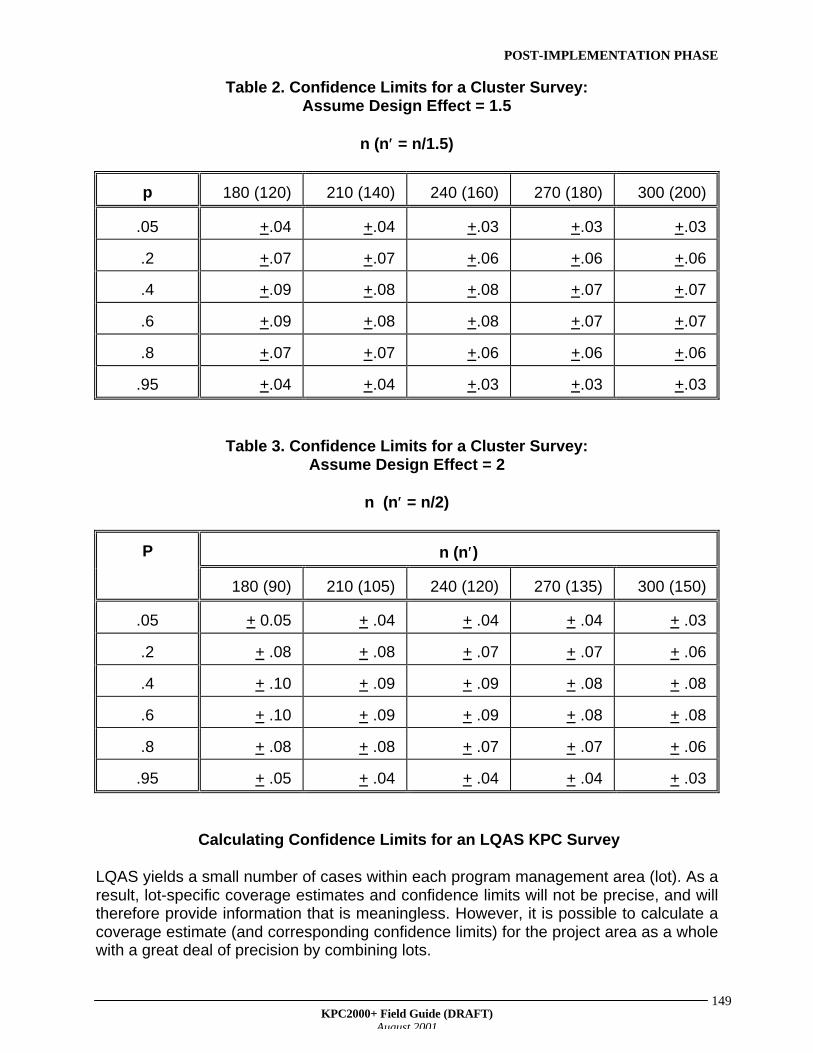
POST-IMPLEMENTATION PHASE
KPC2000+ Field Guide (DRAFT)August 2001
149
Table 2. Confidence Limits for a Cluster Survey:Assume Design Effect = 1.5
n (n′′ = n/1.5)
p 180 (120) 210 (140) 240 (160) 270 (180) 300 (200)
.05 +.04 +.04 +.03 +.03 +.03
.2 +.07 +.07 +.06 +.06 +.06
.4 +.09 +.08 +.08 +.07 +.07
.6 +.09 +.08 +.08 +.07 +.07
.8 +.07 +.07 +.06 +.06 +.06
.95 +.04 +.04 +.03 +.03 +.03
Table 3. Confidence Limits for a Cluster Survey:Assume Design Effect = 2
n (n′′ = n/2)
n (n′′)P
180 (90) 210 (105) 240 (120) 270 (135) 300 (150)
.05 + 0.05 + .04 + .04 + .04 + .03
.2 + .08 + .08 + .07 + .07 + .06
.4 + .10 + .09 + .09 + .08 + .08
.6 + .10 + .09 + .09 + .08 + .08
.8 + .08 + .08 + .07 + .07 + .06
.95 + .05 + .04 + .04 + .04 + .03
Calculating Confidence Limits for an LQAS KPC Survey
LQAS yields a small number of cases within each program management area (lot). As aresult, lot-specific coverage estimates and confidence limits will not be precise, and willtherefore provide information that is meaningless. However, it is possible to calculate acoverage estimate (and corresponding confidence limits) for the project area as a wholewith a great deal of precision by combining lots.
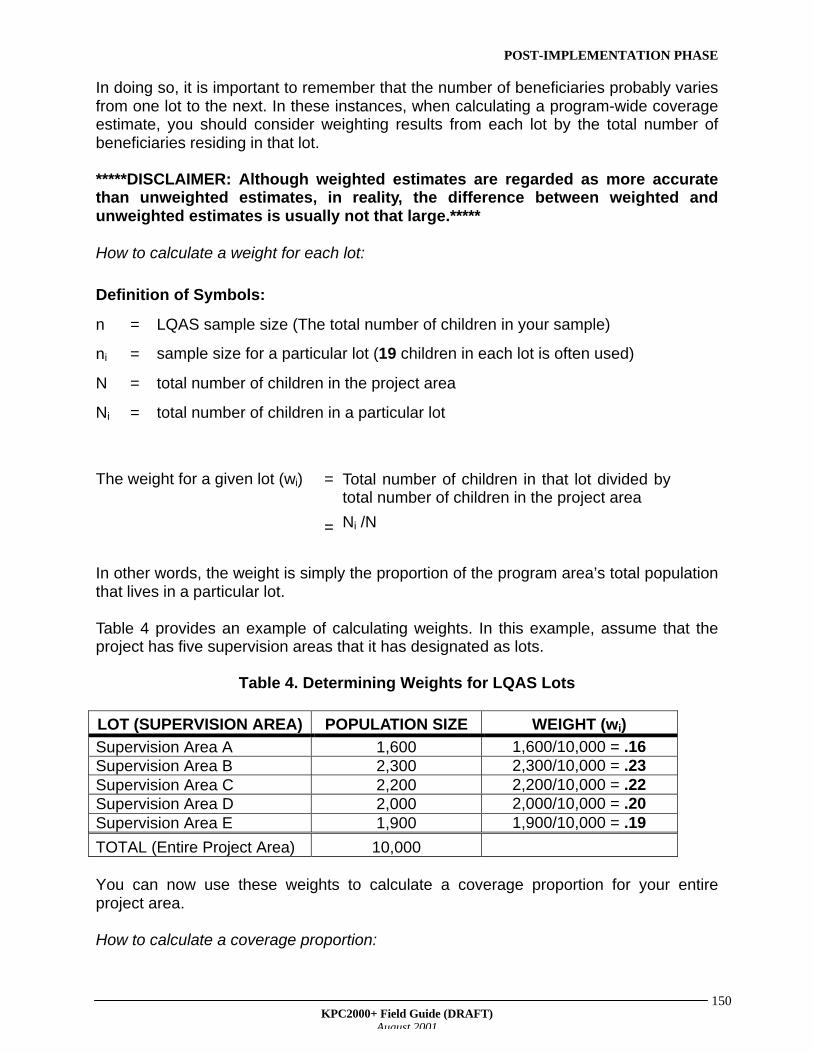
POST-IMPLEMENTATION PHASE
KPC2000+ Field Guide (DRAFT)August 2001
150
In doing so, it is important to remember that the number of beneficiaries probably variesfrom one lot to the next. In these instances, when calculating a program-wide coverageestimate, you should consider weighting results from each lot by the total number ofbeneficiaries residing in that lot.
*****DISCLAIMER: Although weighted estimates are regarded as more accuratethan unweighted estimates, in reality, the difference between weighted andunweighted estimates is usually not that large.*****
How to calculate a weight for each lot:
Definition of Symbols:
n = LQAS sample size (The total number of children in your sample)
ni = sample size for a particular lot (19 children in each lot is often used)
N = total number of children in the project area
Ni = total number of children in a particular lot
The weight for a given lot (wi) = Total number of children in that lot divided bytotal number of children in the project area
= Ni /N
In other words, the weight is simply the proportion of the program area’s total populationthat lives in a particular lot.
Table 4 provides an example of calculating weights. In this example, assume that theproject has five supervision areas that it has designated as lots.
Table 4. Determining Weights for LQAS Lots
LOT (SUPERVISION AREA) POPULATION SIZE WEIGHT (wi)
Supervision Area A 1,600 1,600/10,000 = .16Supervision Area B 2,300 2,300/10,000 = .23Supervision Area C 2,200 2,200/10,000 = .22Supervision Area D 2,000 2,000/10,000 = .20Supervision Area E 1,900 1,900/10,000 = .19
TOTAL (Entire Project Area) 10,000
You can now use these weights to calculate a coverage proportion for your entireproject area.
How to calculate a coverage proportion:
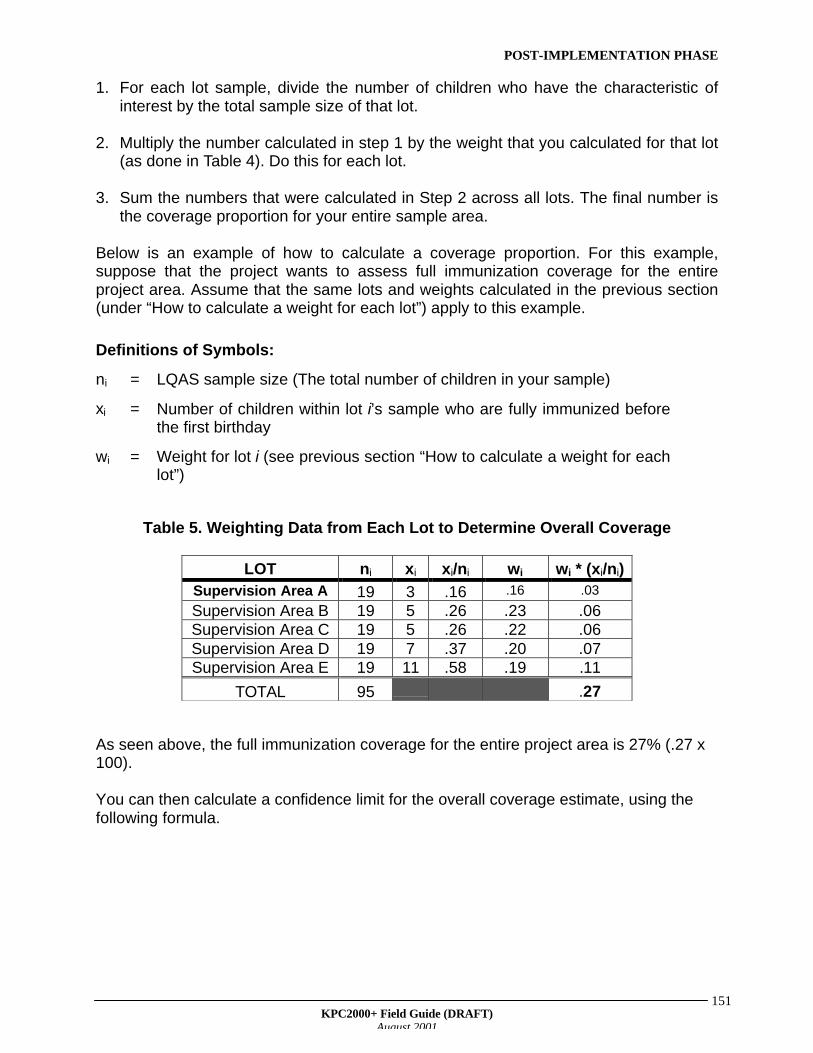
POST-IMPLEMENTATION PHASE
KPC2000+ Field Guide (DRAFT)August 2001
151
1. For each lot sample, divide the number of children who have the characteristic ofinterest by the total sample size of that lot.
2. Multiply the number calculated in step 1 by the weight that you calculated for that lot(as done in Table 4). Do this for each lot.
3. Sum the numbers that were calculated in Step 2 across all lots. The final number isthe coverage proportion for your entire sample area.
Below is an example of how to calculate a coverage proportion. For this example,suppose that the project wants to assess full immunization coverage for the entireproject area. Assume that the same lots and weights calculated in the previous section(under “How to calculate a weight for each lot”) apply to this example.
Definitions of Symbols:
ni = LQAS sample size (The total number of children in your sample)
xi = Number of children within lot i’s sample who are fully immunized beforethe first birthday
wi = Weight for lot i (see previous section “How to calculate a weight for eachlot”)
Table 5. Weighting Data from Each Lot to Determine Overall Coverage
LOT ni xi xi/ni wi wi * (xi/ni)Supervision Area A 19 3 .16 .16 .03
Supervision Area B 19 5 .26 .23 .06Supervision Area C 19 5 .26 .22 .06Supervision Area D 19 7 .37 .20 .07Supervision Area E 19 11 .58 .19 .11
TOTAL 95 .27
As seen above, the full immunization coverage for the entire project area is 27% (.27 x100).
You can then calculate a confidence limit for the overall coverage estimate, using thefollowing formula.
POST-IMPLEMENTATION PHASE
KPC2000+ Field Guide (DRAFT)August 2001
152
Z = 95% confidence = 1.96P = true proportion in the populationp = coverage proportion for entire program area (see Table 5)pi = coverage proportion for a particular lot (= xi/ni in Table 5)qi = 1-pi
ni = size of sample in a particular lot
P = p+ Z x √√ wi2 x (piqi)j ni
Discussion
In the Discussion, authors are encouraged to do the following:
1. relate key findings from the KPC survey to data from other sources2. discuss the programmatic implications of the survey findings3. identify next steps in information gathering4. present an action plan for community feedback and dissemination of findings
1. External comparisons
Examples of useful data sources to compare with the KPC are:
• Demographic and Health Survey data for the country in which you are working• Other local surveys• Ministry of Health (MOH) statistics• MOH objectives or standards• PVO's own project objectives• Reported national data• WHO/UNICEF objectives or standards
2. Programmatic Implications
After presenting results and comparing survey data to other comparable data, discussthe implications for the project. Recommendations can be included.
3. Additional Information Gathering
After the KPC data have been analyzed, it might be necessary to conduct qualitativeresearch to better understand some of the issues raised by the KPC survey. To illustratethe importance of conducting a qualitative follow up, suppose your KPC surveyindicates that measles vaccination coverage is very low. Through qualitative research,you might find out that there is a cultural/religious belief that diseases that arecontracted only once during a person’s lifetime are of spiritual significance, andattempts should not be made to prevent those diseases. This information would beinvaluable when considering ways to improve the level of measles vaccine coverage inthe target population.
Design Effect=1.5
N 30 60 90 120 150(if N=30, N'=20) (if N=60, N'=40) (if N=90, N'=60) (if N=120, N'=80) (if N=150, N'=100)
N' 20 40 60 80 1000.05 0.10 0.07 0.06 0.05 0.040.2 0.18 0.12 0.10 0.09 0.08
P 0.4 0.21 0.15 0.12 0.11 0.100.6 0.21 0.15 0.12 0.11 0.100.8 0.18 0.12 0.10 0.09 0.08
0.95 0.10 0.07 0.06 0.05 0.04
Design Effect=2.0
N 30 60 90 120 150(if N=30, N'=15) (if N=60, N'=30) (if N=90, N'=45) (if N=120, N'=60) (if N=150, N'=75)
N' 15 30 45 60 750.05 0.11 0.08 0.06 0.06 0.050.2 0.20 0.14 0.12 0.10 0.09
P 0.4 0.25 0.18 0.14 0.12 0.110.6 0.25 0.18 0.14 0.12 0.110.8 0.20 0.14 0.12 0.10 0.09
0.95 0.11 0.08 0.06 0.06 0.05
CONFIDENCE LIMITS FOR SMALL SAMPLE SIZES, ASSUMING A DESIGN EFFECT OF 1.5 OR 2.0
N'=N/1.5
N'=N/2.0
KPC2000+ Field Guide (DRAFT)August 2001 153


![INDEX [] · 2015-05-11 · Saab 1999 - 2008 (Limited Coverage for 9.3 and 9.5) New Features System Coverage New Features System Coverage Smart 1998 - 2013 ... • Ford Ranger 2000](https://img.pdfslide.us/doc/110x75/5e972efec1375a1f3c142cb6/index-2015-05-11-saab-1999-2008-limited-coverage-for-93-and-95-new-features.jpg)