Embed Size (px)
Citation preview

K P M G C o n s u l t i n g
Knowledge ManagementResearch Report 2000

ForewordThis is the second research report that KPMG Consulting has publishedon knowledge management. When we published the KnowledgeManagement Research Report 1998, we said that we intended to make ita biennial exercise. At the time, the term ‘knowledge management’ wasjust beginning to enter the business language. It was still sufficientlynovel for a major finding of our research to be that knowledgemanagement was not a fad but was here to stay.
The progress made by knowledge management since then has beenmuch greater than the intervening two years might suggest. It is now atthe top of the business agenda. Companies across all sectors and publicbodies of all descriptions recognise the critical role that effectiveknowledge management will play in their future success.
All of us operate as members of the information society. What matters iswhat we know and how we deploy that knowledge. The emergence ofthe ‘dot.com’ economy demonstrates the importance of know-how overthe traditional sources of economic power, such as capital, plant andlabour. The organisations that prosper in the future will be those thatcapture, expand and exploit their know-how – in all its guises.
These survey findings demonstrate that this first lesson – the importanceof knowledge management – has been grasped. But the survey findingsalso show that few organisations have tackled implementation aseffectively as they could or should.
There remains, therefore, a great deal of work to be done - and manymistakes that the less well-informed run the risk of making.
David Parlby, Partner, KPMG Consulting
Contents page
1 Executive Summary 1
2 Introduction and methodology 5
3 Current state of KM 7
4 Experience to date of KM 11
5 Achieving the benefits 13
6 KM and the role of technology 16
7 The organisational implications 20
8 The knowledge journey 22
9 The future 24

1
KP
MG
Con
sulti
ng
Knowledge management is an accepted part of the business agenda
We asked 423 organisations in the UK, mainland Europe and the USwhether they had a knowledge management (KM) programme. Over four-fifths (81%) said they had, or were considering, a KM programme. 38% hada KM programme in place, 30% were currently setting one up and 13%were examining the need. The great majority of leading organisations arenow actively pursuing knowledge management.
The benefits of knowledge management are being realised
Respondents understood the potential role that knowledge managementcould play. Companies were looking to KM to play an “extremelysignificant” or a “significant” role in improving competitive advantage(79%), in marketing (75%), in improving customer focus (72%), employeedevelopment (57%), product innovation (64%) and revenue growth andprofit (both 63%).
Respondents’ experience was that KM does provide real benefits. Forexample, almost three-quarters (71%) of those with a KM programme inplace said they had achieved better decision making, 68% said they hadachieved faster response to key business issues and 64% said they haddelivered better customer service.
Organisations with a KM programme are better off than those without
Companies with a KM programme are better placed than those without. Forinstance, under half with a KM programme complained about reinventingthe wheel (45%), compared to nearly two-thirds (63%) of those without aKM programme; 61% could access data profiling the buying habits of aparticular customer within half a day as opposed to 38% without; and 72%could access an agreed methodology for a business process within half aday as opposed to 55% without.
Executive summary
11.1
1.2
1.3

2
KP
MG
Con
sulti
ng
There are even greater benefits to be gained
Organisations may be missing fundamental opportunities. Three-quarters ofrespondents whose organisations had a KM programme in place expected itto lead to new ways of working, increased market share or additionalbusiness opportunities.
They may also be missing the longer-term financial benefits. Three times asmany respondents expected their KM programme to lead to increased profits(76%) and reduced costs (73%) as expected it to lead to an increase in theircompany’s share price (28%). They see the immediate, internal cost gains butfail to equate these to any external, longer term benefit, such as intellectualcapital growth. Although it is useful to concentrate on profits and costs ofother internal factors, companies should also understand they can benefit inother ways such as share price growth.
Organisations are failing to tackle KM’s real challenges
This may be because organisations do not understand – and are notsupporting – the full implications of KM implementation.
The 36% of respondents who said that the benefits had failed to meetexpectations were asked why. The most often cited reasons included:
■ lack of user uptake owing to insufficient communication (20%);
■ failure to integrate KM into everyday working practices (19%);
■ lack of time to learn how to use the system or a sense that the systemwas too complicated (18%);
■ a lack of training (15%); and
■ a sense that there was little personal benefit in it for the user (13%).
In short, KM brings its own challenges, which organisations are failing toaddress. Even those companies with KM programmes complained aboutproblems such as:
■ the lack of time to share knowledge (62%);
■ failure to use knowledge effectively (57%); and
■ the difficulty of capturing tacit knowledge (50%).
1.4
1.5
Executive summary (continued)
1.6
3
KP
MG
Con
sulti
ng
Organisations are blind to the employee considerations
These problems reflect organisations’ failure to grasp the culturalimplications of KM. A knowledge management programme should removethe frustrations that employees face in gathering and accessing knowledge.Yet only a third (33%) of all respondents had knowledge policies –stipulating which knowledge elements to store, update and cull – and fewer(31%) rewarded knowledge working. Fewer than one in five of allrespondents had created a knowledge map (18%) – a catalogue or guideshowing employees what information is available.
This might explain why nearly two-thirds (65%) of organisations with a KMprogramme complained of information overload – the creation of aknowledge glut or an overwhelming collection of information forinformation’s sake that can be difficult and laborious to use.
This lack of organisational commitment was evidenced by the finding thatonly 16% of respondents whose organisations had or were considering aKM programme measured intellectual capital – that part of an organisation’svalue that is based on intangible assets such as knowledge, innovation andrelationships. This mirrors organisations’ failure to see KM in terms ofcreating shareholder value (see 1.4 above).
Organisations that grasp the cultural implications can achieve what wedefine as the High Performance Employee – an individual that uses KMprocedures and technologies to fulfil their own potential and deliver realbusiness benefits to the organisation, its customers and its stakeholders.
In terms of staff attraction and retention, the effective implementation ofKM should make an organisation more attractive to staff by making theirjobs easier. Yet under half (45%) of respondents whose companies had KMprogrammes saw KM as a means to attract and retain staff and only 30%had actually achieved it.
Companies still see knowledge management as a purely
technological solution
Organisations have adopted a number of relevant technologies for KMpurposes. 93% of respondents used the Internet to access externalknowledge, 78% used an intranet, 63% used data warehousing or miningtechnologies, 61% document management systems, 49% decision support,43% groupware and 38% extranets.
However, while organisations were most advanced in the use of technologyto achieve KM, they were failing to exploit its full power. Only 16% ofrespondents whose companies had implemented relevant technologies saidthat they had a system specifically configured for KM.
1.7

4
KP
MG
Con
sulti
ng
Companies have a long way to go on the knowledge journey
Most organisations do not have a fully integrated KM system. Half (53%) ofrespondents whose companies have a KM programme in place consideredKM to be an integral part of organisational and individual processes. Thisequates to being at stages 4 and 5 of KPMG Consulting’s KnowledgeJourney and represents a high level of achievement in KM implementation(see section 8). However, when we measured their detailed responsesagainst our Knowledge Journey benchmark, we concluded that the largestpercentage were only at the first two stages of the Knowledge Journey.Only 10% of the sample were at stages 4 and 5 and just 1% were at stage5, (the highest level).
This indicates that even those organisations that have KM programmeshave a long way to go. The issues have less to do with implementing thenecessary technology than with running a complete KM programme.
There are few sector and geographical differences
Although the research was carried out amongst organisations in the UK,mainland Europe and the US and across a number of sectors there were nosignificant differences between respondents’ views on a sector orgeographic basis.
This seems surprising given the differences in cultures and workingenvironments of the countries surveyed. It is also surprising given theperception of the US being more technologically advanced than Europe.
1.9
Executive summary (continued)
1.8

22
5
KP
MG
Con
sulti
ng
Aims
This research report is a sequel to KPMG Consulting’s KnowledgeManagement Research Report 1998. That report probed the extent to whichorganisations were aware of KM, took it seriously and were pursuinginitiatives to implement it. This report investigates further organisations’claims that they are implementing KM effectively.
Methodology
The research was conducted by Harris Research, part of Taylor NelsonSofres, in July and August 1999 among chief executives, finance directors,marketing directors and those with specific responsibility for KM at 423organisations with turnover exceeding £200 million (US$347 million) a year.This sample was chosen because organisations of this size have thegreatest need to implement KM initiatives, have possibly the greatestcapability and resources to do so, and potentially can reap the greatestbenefits. The subject focus was the collective knowledge of theirorganisations’ employees and their own use of information.
Introduction and methodology
2.1
2.2
Financial services 22%
Industrial products 20%
Chemicals, pharmaceuticals and energy 14%
Information, communication and entertainment 2%
Government 2%
Services 13%
Transport 5%
Others 2%
Consumer markets 20%
Industry sector
0% 10% 20% 30% 40% 50%
base: all respondents (423)

6
KP
MG
Con
sulti
ng
Definitions
For the purposes of this survey, respondents were asked to apply thefollowing definitions:
Knowledge:The knowledge in the business about customers, products, processes,competitors, etc. that can be locked away in people’s minds or electronic form
Knowledge Management:The systematic and organised attempt to use knowledge within anorganisation to improve performance
2.3
Distribution by country
Actual %
USA 101 24
UK 100 24
Germany 83 20
France 77 18
Netherlands 15 3
Scandinavia 15 3
Elsewhere (Italy, Spain) 32 8
Total 423 100
3
7
KP
MG
Con
sulti
ng
Current state of KM
3.1
3.2
KM strategy in place
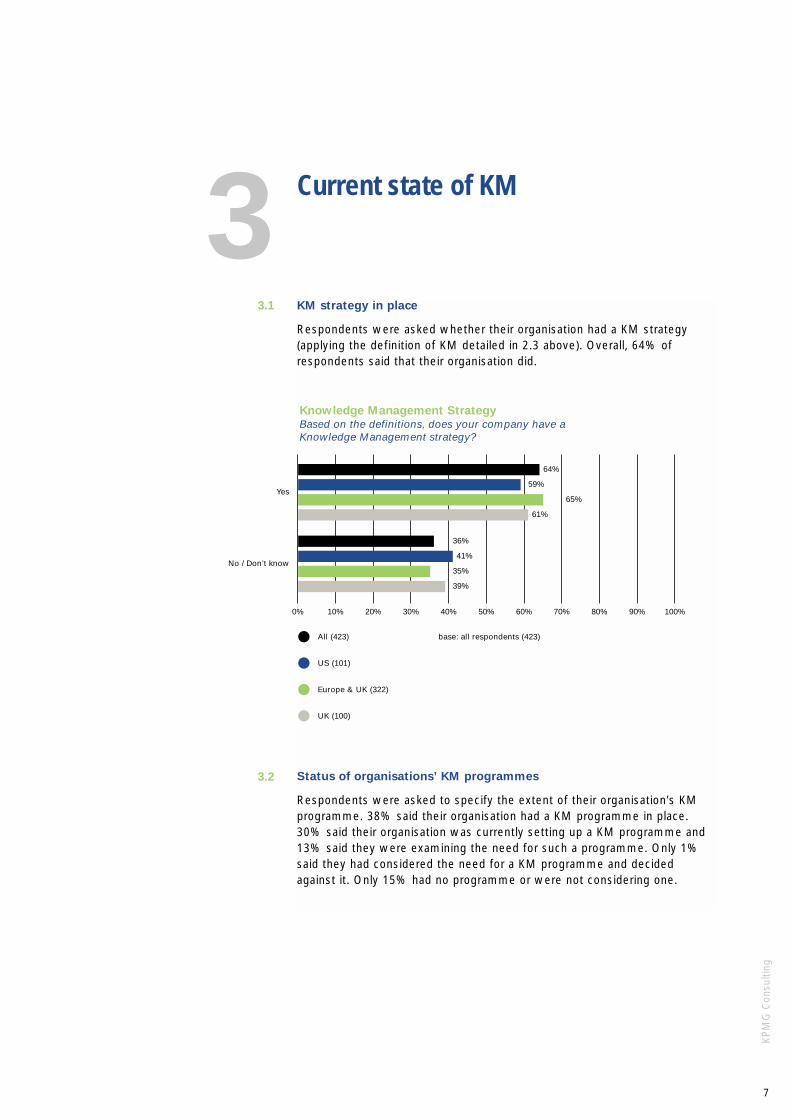
Respondents were asked whether their organisation had a KM strategy(applying the definition of KM detailed in 2.3 above). Overall, 64% ofrespondents said that their organisation did.
Status of organisations’ KM programmes
Respondents were asked to specify the extent of their organisation’s KMprogramme. 38% said their organisation had a KM programme in place.30% said their organisation was currently setting up a KM programme and13% said they were examining the need for such a programme. Only 1%said they had considered the need for a KM programme and decidedagainst it. Only 15% had no programme or were not considering one.
Yes
64%
59%
65%
61%
No / Don’t know
36%
41%
35%
39%
Knowledge Management StrategyBased on the definitions, does your company have aKnowledge Management strategy?
0% 10% 20% 30% 40% 50% 60% 70% 80% 90% 100%
base: all respondents (423)All (423)
US (101)
Europe & UK (322)
UK (100)
8
KP
MG
Con
sulti
ng
3.3
3.4
Current state of KM (continued)
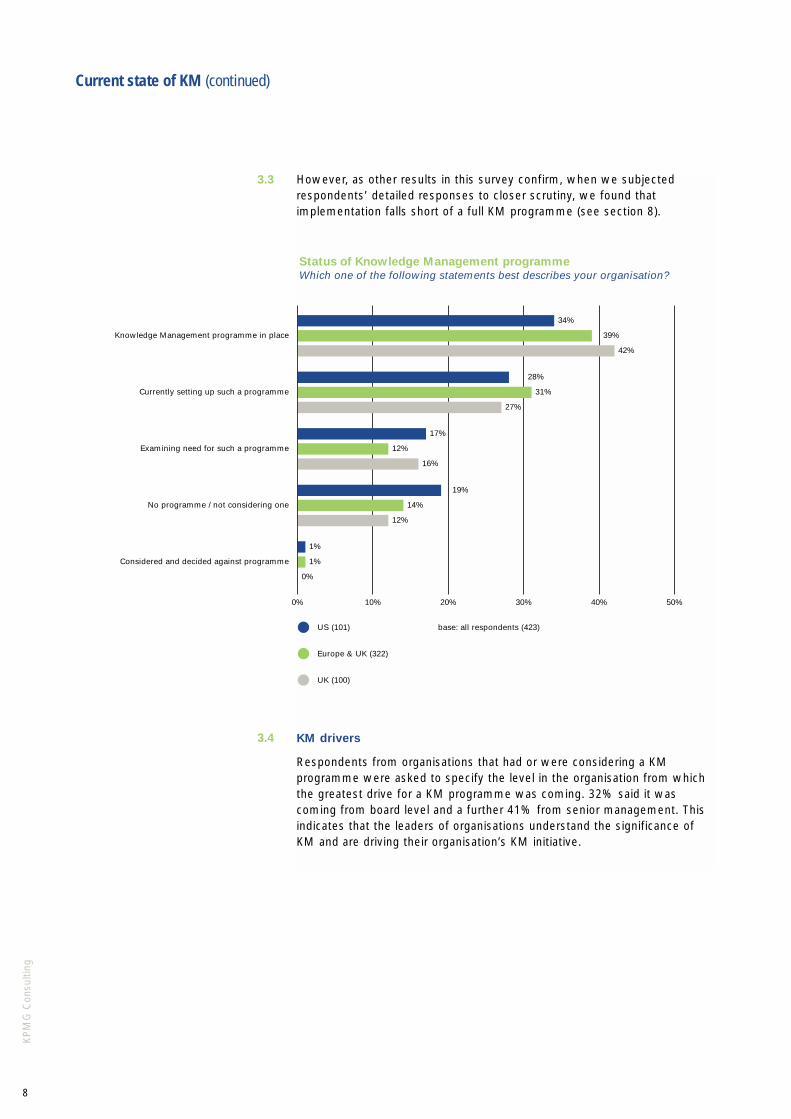
However, as other results in this survey confirm, when we subjectedrespondents’ detailed responses to closer scrutiny, we found thatimplementation falls short of a full KM programme (see section 8).
KM drivers
Respondents from organisations that had or were considering a KMprogramme were asked to specify the level in the organisation from whichthe greatest drive for a KM programme was coming. 32% said it wascoming from board level and a further 41% from senior management. Thisindicates that the leaders of organisations understand the significance ofKM and are driving their organisation’s KM initiative.
Knowledge Management programme in place
34%
39%
42%
28%
31%
27%
17%
12%
16%
19%
14%
12%
1%
1%
0%
Currently setting up such a programme
No programme / not considering one
Considered and decided against programme
Examining need for such a programme
Status of Knowledge Management programmeWhich one of the following statements best describes your organisation?
0% 10% 20% 30% 40% 50%
base: all respondents (423)US (101)
Europe & UK (322)
UK (100)

Board level
32%
30%
33%
41%
35%
42%
11%
19%
9%
2%
3%
2%
12%
10%
13%
Senior management
Grass roots / employees
Across the spectrum
Middle management
Who is pushing hardestWhat level in the organisation pushed / is pushing hardest to have a Knowledge Management programme?
0% 10% 20% 30% 40% 50%
base: all with / setting up / considering KM programme (345)All (345)
US (79)
Europe & UK (266)
9
KP
MG
Con
sulti
ng
Respondents from organisations that had or were considering a KMprogramme were asked which departmental or functional budget wascontributing most to KM costs. 27% – the highest single figure – said it wasspread across all departments while 22% said it was being met by the ITfunction. This indicates that organisations are beginning to understand thatKM is not simply an IT initiative, but also highlights the leading role that ITplays in the practical implementation of KM.

10
KP
MG
Con
sulti
ng
IT 22%
Marketing 16%
Human Resources 5%
Operations 4%
Finance 3%
R&D 3%
Training, learning & development 1%
Others 9%
Spread over all departments 27%
Customer Service Sales 6%
Greatest contribution to costs of KMWhat departmental or functional budget contributes most to Knowledge Management costs?
0% 10% 20% 30% 40% 50%
base: all with / setting up / considering KM programme (345)
Current state of KM (continued)

11
KP
MG
Con
sulti
ng
Experience to date of KM
4
Information overload65%
69%
No time to share knowledge62%
72%
Reinventing the wheel45%
63%
Difficulty capturing tacit knowledge50%
63%
Not using technology to share knowledge effectively57%
65%
Current knowledge problems
0% 10% 20% 30% 40% 50% 60% 70% 80% 90% 100%
base: all respondents who could classify KM status (413)With a KM programme (161)
Without KM (252)
Current KM problems
Respondents were also asked to specify the knowledge problems from whichthey suffered. Again, those whose organisations had a KM programme inplace were less hampered than those without. Under half with a KMprogramme complained of “reinventing the wheel”, against two-thirds ofrespondents without. Half complained of the difficulty of capturing tacitknowledge, against two-thirds without a KM programme. But a significantnumber of those with a KM programme complained about informationoverload and the lack of time to share knowledge. This indicates – confirmedby findings elsewhere in this report – that while organisations with a KMprogramme are better off than those without, there is still much to be done toprogress in the knowledge journey, as the following sections indicate.
4.1

12
KP
MG
Con
sulti
ng
Speed of access to information
Respondents were asked how long it would take them to access certain typesof information. Those whose organisations had a KM programme in place wereable to demonstrate appreciably faster response times. For example, 61%could access data profiling the buying habits of a particular customer withinhalf a day as opposed to 38% without a KM programme. 72% could accessan agreed methodology for a business process within half a day as opposedto 55% without. In addition, 78% of organisations with a KM programmewere able to identify who had last spoken to a particular customer and 64%could find out why their organisation had won a new account.
Current share price93%
92%
Last week’s sales volume82%
74%
Who last spoke to customer X78%
68%
Response to business enquiry72%
65%
Agreed methodology for a business process72%
55%
Last week’s media coverage67%
64%
Why won new account64%
55%
Response to customer complaint63%
57%
Profile buying habits of a particular customer61%
38%
Whether research has been carried out by BU / competitor
60%
43%
Collect data for monthly report
Composition of shareholder list81%
68%
Leadtime on informationHow long will it take you to get answers on the following issues?% proportion taking up to half a day
0% 10% 20% 30% 40% 50% 60% 70% 80% 90% 100%
base: all respondents who could classify KM status (413)With a KM programme (161)
Without KM (252)
41%
47%
4.2

13
KP
MG
Con
sulti
ng
The potential role of KM
Respondents were asked for their views of the potential role that KM canplay in achieving specific organisational objectives. 79% believed KM canplay an “extremely significant” or a “significant” role in improvingcompetitive advantage, 75% in respect of marketing, 72% in the case ofimproving customer focus, 57% in respect of employee development, 64%in respect of product innovation, 63% in respect of revenue growth and63% in respect of profit growth. These figures indicate that respondentsview KM as having a key role to play in achieving many of theirorganisations’ objectives, and how closely KM is aligned to issues such ascustomer management.
Achieving the benefits
5.1
Improving competitive advantage 7.7
Marketing 7.5
Profit growth 7
Product innovation 7
Revenue growth 6.8
Reducing costs 6.7
Employee development 6.7
Investment 6.5
Achieving mergers 5.4
Improving customer focus 7.3
Potential role of Knowledge ManagementHow significant is the role that effective Knowledge Management can play inachieving best results with respect to . . . ?
1 2 3 4 5 6 7 8 9 10
base: all respondents (423)Mean scores: 1=not at all significant,
10=extremely significant
5
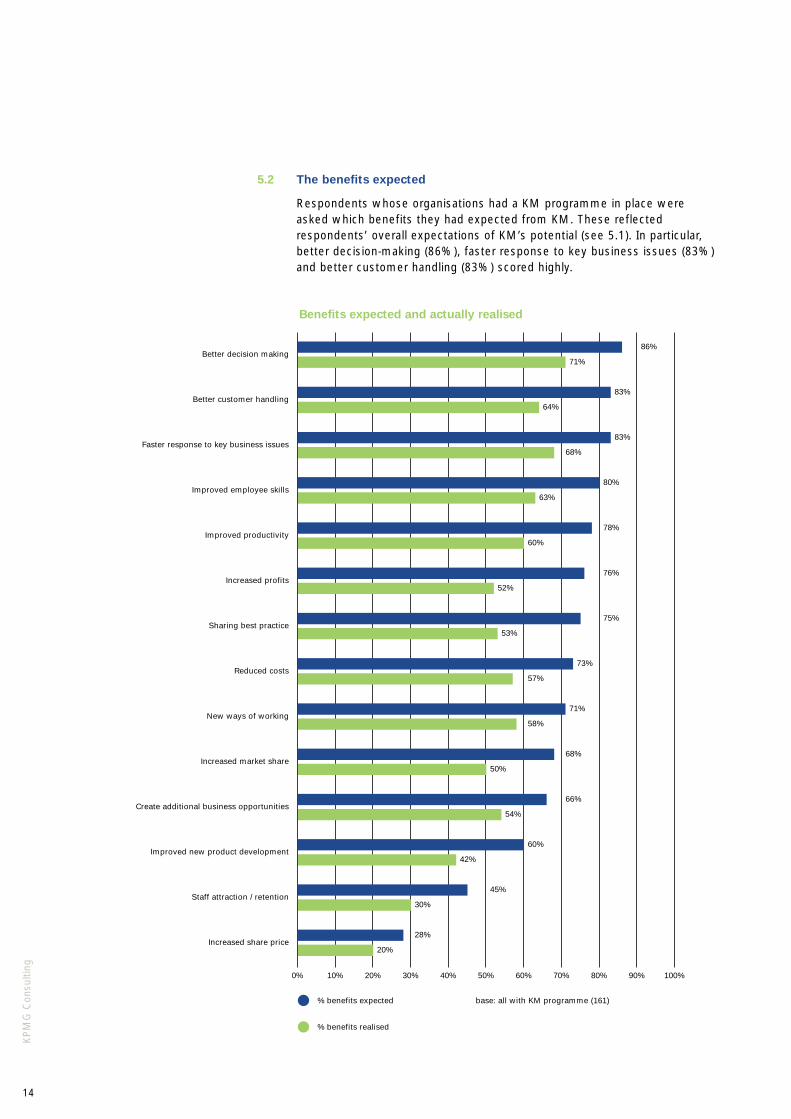
The benefits expected
Respondents whose organisations had a KM programme in place wereasked which benefits they had expected from KM. These reflectedrespondents’ overall expectations of KM’s potential (see 5.1). In particular,better decision-making (86%), faster response to key business issues (83%)and better customer handling (83%) scored highly.
14
KP
MG
Con
sulti
ng
5.2
Better decision making86%
71%
64%
68%
63%
60%
52%
53%
57%
58%
50%
54%
42%
30%
20%
Better customer handling83%
Improved employee skills80%
Improved productivity78%
Increased profits76%
Sharing best practice75%
Reduced costs73%
New ways of working71%
Increased market share68%
Create additional business opportunities66%
Improved new product development60%
Staff attraction / retention45%
Increased share price28%
Faster response to key business issues83%
Benefits expected and actually realised
0% 10% 20% 30% 40% 50% 60% 70% 80% 90% 100%
base: all with KM programme (161)% benefits expected
% benefits realised

The benefits achieved
Respondents whose organisations had a KM programme in place wereasked to identify the benefits they had realised from KM. The mostsignificant benefits realised included better decision making (71%), fasterresponse to key business issues (68%) and better customer handling (64%).But organisations were failing to achieve some of the more culturalbenefits, such as new ways of working, sharing best practice and retainingand attracting staff. They appear to lack a holistic approach to KM, reflectedin the fact that few (20%) were seeing their KM initiative reflected in theorganisation’s share price.
The findings here indicate that while there is no significant gap between thebenefits expected and those realised, there is a gap of as much as 20% insome cases between the two. We believe this reflects a failure on the partof organisations to understand and grasp the wider, organisationalimplications of KM. Too often they are fixated with the technologicalaspects. However, it should not be overlooked that those with a KMinitiative in place are better off than those without, as findings elsewhere inthe survey demonstrate.
15
KP
MG
Con
sulti
ng
5.3
16
KP
MG
Con
sulti
ng
6Use of technology to implement KM
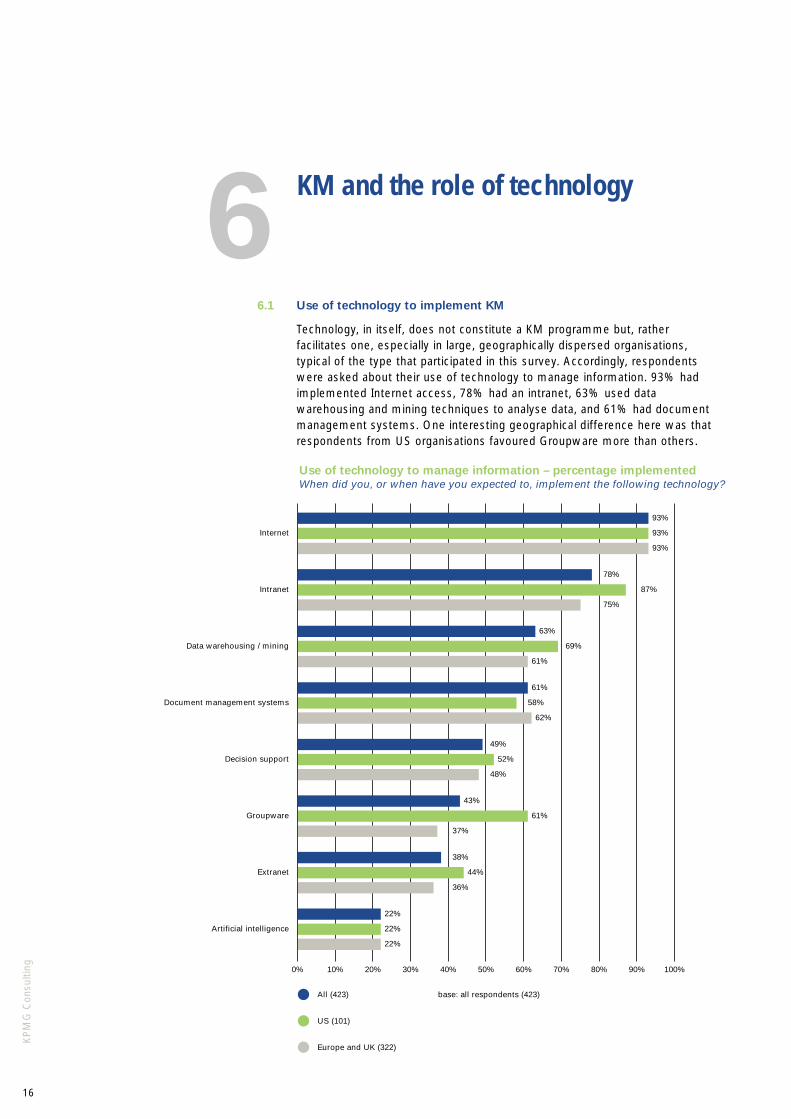
Technology, in itself, does not constitute a KM programme but, ratherfacilitates one, especially in large, geographically dispersed organisations,typical of the type that participated in this survey. Accordingly, respondentswere asked about their use of technology to manage information. 93% hadimplemented Internet access, 78% had an intranet, 63% used datawarehousing and mining techniques to analyse data, and 61% had documentmanagement systems. One interesting geographical difference here was thatrespondents from US organisations favoured Groupware more than others.
KM and the role of technology
6.1
Internet
93%
93%
93%
78%
87%
75%
63%
69%
61%
61%
58%
62%
49%
52%
48%
Intranet
Document management systems
Decision support
43%
61%
37%
Groupware
38%
44%
36%
Extranet
22%
22%
22%
Artificial intelligence
Data warehousing / mining
Use of technology to manage information – percentage implementedWhen did you, or when have you expected to, implement the following technology?
0% 10% 20% 30% 40% 50% 60% 70% 80% 90% 100%
base: all respondents (423)All (423)
US (101)
Europe and UK (322)

17
KP
MG
Con
sulti
ng
Respondents found intranets (accessing internal information) the mosteffective technology in helping them manage information and the Internet(accessing external information) the least effective. This suggests thatorganisations have only been able to get to grips with internal information sofar but they need to improve with respect to external information. This mayexplain why data warehousing and data mining tools were regarded as thesecond most effective technology in helping them manage information.
Intranet18%
7%
Data warehousing / mining10%
5%
Groupware8%
3%
Document management systems7%
4%
Knowledge management software6%
4%
Decision support3%
3%
Artificial intelligence1%
3%
Extranet1%
3%
Internet9%
18%
Most / least effective technologiesWhich technologies have been most / least effective in helping you manage information?
0% 5% 10% 15% 20% 25%
base: all who have implemented technologies (419)Most effective
Least effective

18
KP
MG
Con
sulti
ng
something which has just grown up over time
69%
72%
68%
53%
a bit of both
16%
20%
15%
16%
a specially designed KM system
13%
7%
15%
30%
Nature of technology implementationThinking about the technology your organisation has in place for managinginformation, would you describe it as . . . ?
0% 10% 20% 30% 40% 50% 60% 70% 80% 90% 100%
base: all who have implemented technologies (419)All (419)
US (100)
Europe & UK (319)
UK (100)
Nature of technology implementation
Respondents whose organisations had implemented technologies to manageinformation were asked how those technologies had developed within theorganisation. Only 16% said they had a specially designed KM system; 69%said the technology used for KM had grown up over time and 13% said it hadbeen a bit of both. This may indicate that the approach taken to KM has notbeen a thoroughly strategic one in most cases.
6.2

19
KP
MG
Con
sulti
ng
6.3 Reasons for failing to realise benefits
Respondents whose organisations had implemented technologies were askedwhether their expectations had been realised. In the case of each technology,only a small minority – ranging from 8% to 13% – said their expectations hadnot been realised. When probed further, respondents gave unpromptedreasons that illuminate common implementation issues. 20% said there waslack of user uptake owing to insufficient communication, 19% that every dayuse did not integrate into normal working practice, 18% complained that therewas a lack of time to learn how to use the system or it was too complicated,15% complained of a lack of training and 13% said that users could not seethe personal benefits. In short, the people and process issues had not beenas well addressed as the IT ones.
These responses confirm the fundamental flaw in viewing KM as atechnology issue: it is not the technology that is holding organisations backbut a lack of strategy and a failure to build KM into the organisation’s day-to-day operations and its culture in order to encourage end-user buy-in.
Lack of user uptake due to insufficient communication 20%
Every day use did not integrate into normal working practice 19%
Lack of training 15%
Users could not see personal benefits 13%
Senior management was not behind it 7%
Unsuccessful due to technical problems 7%
Lack time to learn / system too complicated 18%
Why benefits failed to meet expectationsWhy do you think the benefits failed to materialise?
0% 10% 20% 30% 40% 50%
base: all where benefits failed to meet expectations (137)

15
18
18
13
16
20
KP
MG
Con
sulti
ng
Failure to undertake key KM requirements
Respondents were asked when their organisation intended to undertakecertain aspects of KM implementation. Implementing enterprise resourceplanning systems, creating a KM strategy and benchmarking the currentsituation scored more highly than establishing knowledge policies, incentivisingknowledge working, creating a knowledge map and measuring intellectualcapital (the latter of which may explain why organisations neither expected norexperienced any impact on their share price through their KM programme orstrategy). This confirms that less attention had been paid to the non-IT aspects.
7The organisational implications
7.1
10
14
11
17
14
14
1151
Benchmark / audit current situation
ERP systems 7
1244
843
Sharing best practice 1342
KM training / awareness 1242
Knowledge policies 1633
Establish formal KM networks 1433
Incentivise / reward knowledge working 1031 6
Create KM strategy
Knowledge Management implementationWhen, if at all, do you intend to do any of the following, or has your organisationdone them already?
6
12
7
14
27
Appoint knowledge officers / knowledge centres
Build and develop “communities of practice”
1127
1125
New systems for “communities of practice” 1224
Design other KM processes 21
Create knowledge map 1218
Measure intellectual capital 1116
Knowledge systems audit / assessment
0% 10% 20% 30% 40% 50% 60% 70% 80% 90% 100%
base: all respondents (423)Done
Next 6 months
Later

21
KP
MG
Con
sulti
ng
KM action taken to date
Respondents whose organisations had a KM programme were asked whatthe KM implementors in their organisation had done. Again, those aspectsthat go to the heart of an organisation’s operations and culture – such asrewarding knowledge working, creating a knowledge map and measuringintellectual capital – had still to be undertaken by the majority.
7.2
Create a strategy 76%
KM training / awareness 64%
Sharing best practice 58%
Knowledge policies 57%
Benchmark / audit current status 57%
Establish formal KM networks 50%
Reward knowledge working 49%
Develop “communities of practice” 46%
Appoint knowledge officers / centres 42%
New systems for “communities of practice” 40%
Knowledge systems audit 40%
Design other key processes 32%
Create a knowledge map 30%
Measure intellectual capital 23%
ERP systems 62%
What KM implementors have done
0% 10% 20% 30% 40% 50% 60% 70% 80% 90% 100%
base: all with KM programme (161)
22
KP
MG
Con
sulti
ng
The knowledge journey
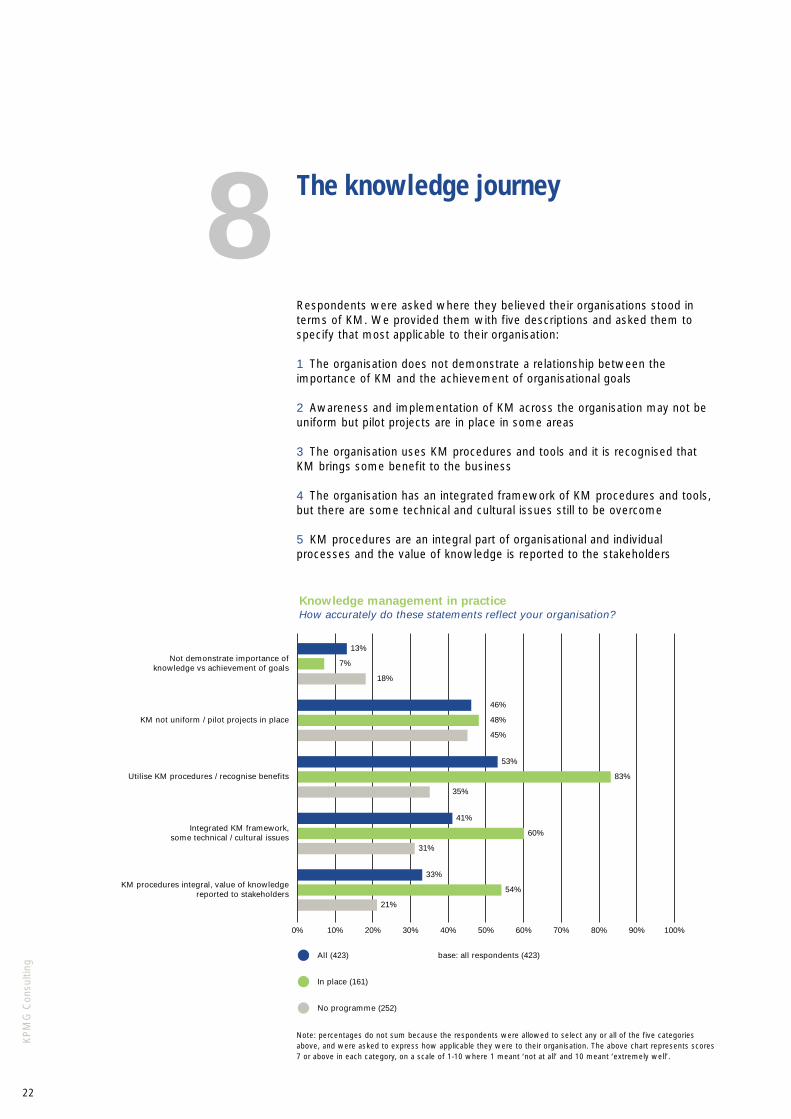
Respondents were asked where they believed their organisations stood interms of KM. We provided them with five descriptions and asked them tospecify that most applicable to their organisation:
1 The organisation does not demonstrate a relationship between theimportance of KM and the achievement of organisational goals
2 Awareness and implementation of KM across the organisation may not beuniform but pilot projects are in place in some areas
3 The organisation uses KM procedures and tools and it is recognised thatKM brings some benefit to the business
4 The organisation has an integrated framework of KM procedures and tools,but there are some technical and cultural issues still to be overcome
5 KM procedures are an integral part of organisational and individualprocesses and the value of knowledge is reported to the stakeholders
Not demonstrate importance of knowledge vs achievement of goals
13%
7%
18%
46%
48%
45%
53%
83%
35%
41%
60%
31%
33%
54%
21%
KM not uniform / pilot projects in place
Integrated KM framework, some technical / cultural issues
KM procedures integral, value of knowledge reported to stakeholders
Utilise KM procedures / recognise benefits
Knowledge management in practiceHow accurately do these statements reflect your organisation?
0% 10% 20% 30% 40% 50% 60% 70% 80% 90% 100%
base: all respondents (423)All (423)
In place (161)
No programme (252)
Note: percentages do not sum because the respondents were allowed to select any or all of the five categoriesabove, and were asked to express how applicable they were to their organisation. The above chart represents scores7 or above in each category, on a scale of 1-10 where 1 meant ‘not at all’ and 10 meant ‘extremely well’.
8

23
KP
MG
Con
sulti
ng
Respondents were optimistic in terms of where they saw their organisation’sKM development. Most saw their organisations falling into stages 3 or 4. Butintegral to the realisation of the greatest benefits is recognition that there isstill some way to go. We mapped their responses against our KnowledgeJourney benchmark and devised an alternative view of where organisationsstand today in their knowledge journey:
The KPMG Consulting Knowledge Journey Benchmark
Key to a KM programme are:
People
■ implementing KM training/awareness (e.g. workshops or roadshows)
■ appointing knowledge officers and creating knowledge centres
■ incentivising and rewarding knowledge working
■ building and developing “communities of practice”
■ establishing formal KM networks (e.g. dedicated workers in discretegroups, or communities of KM practice)
Process
■ benchmarking or auditing the current situation
■ creating a KM strategy
■ implementing new systems for “communities of practice”
■ designing other KM processes
Content
■ creating a knowledge map
■ implementing knowledge policies
■ measuring intellectual capital
Technology
■ carrying out a knowledge system audit or assessment
■ implementing ways to share best practice
■ use of KM software (either dedicated or Intranet or Groupware software)
Where is your organisation on the KPMG Consulting Knowledge Journey?
Stage 1 – Knowledge Chaotic: 3 or fewer of the above
Stage 2 – Knowledge Aware: 4 or more, drawn from at least 2 sections
Stage 3 – Knowledge Focused: 6 or more, drawn from at least 3 sections
Stage 4 – Knowledge Managed: More than 2 from each section
Stage 5 – Knowledge Centric: All
Our findings indicate that 43% were at Stage 1 – Knowledge Chaotic. Only athird (32%) could be said to be at Stages 2 or 3 – Knowledge Aware andKnowledge Focused. Only 10% were at Stages 4 or 5 (only 1% were at thelatter stage). This may be due to the imbalance of their KM strategy intechnology or human resources. There is a need to address all areas in orderto become knowledge centric.

24
KP
MG
Con
sulti
ng
The future
The findings of this report confirm that knowledge management is anaccepted part of the business agenda: the benefits of knowledgemanagement are acknowledged; and organisations with a KM programme aredemonstrably better off than those without. However, the full benefits of KMare being missed and organisations are failing to tackle KM’s real challenges.
In particular, they are blind to the employee considerations and many stillsee knowledge management in purely technological terms. As a result,employees complain of information overload and of policies that fail toreward them for driving KM initiatives – for instance by sharing andmaintaining knowledge. Organisations are failing to grasp the fundamentalchanges to their day-to-day operations and culture that successful KMimplementation requires. They are also failing to raise their sights andrecognise the impact on profit, share price and employee retention anddevelopment that KM can deliver.
However, a number of developments will address these issues.
Technological improvements will help knowledge workers, not least incombating information overload: the emergence of KM tools in areas suchas content management, user needs profiling and intelligent Internetsearching will make their jobs easier. Knowledge workers will be able towork remotely through the development of universal mobile telephonesystems (UMTS) that will enable broadband communication (TV, intranet,videoconferencing, multimedia, as well as voice and data) on a newgeneration of hand-held mobile devices.
Increasing awareness in the business community of the ‘dot.com’revolution will focus attention on companies’ KM assets and how they aremanaged. Those companies that have grasped KM and implementedpolicies to encourage it will be rewarded with enhanced market ratings.
This, in turn, will drive a more sophisticated understanding of the HR andinternal communications aspects as organisations take a more holistic viewof knowledge and its value. The result will be a virtuous circle asorganisations take KM more seriously, make the necessary internalchanges to encourage knowledge working and see the benefits in terms ofenhanced shareholder value.
9

25
KP
MG
Con
sulti
ng
For further details, contact:
David [email protected]
KPMG Consulting8 Salisbury SquareLondonEC4Y 8BBhttp://www.kpmg.co.uk
Telephone: 020 7311 1000Facsimile: 020 7311 3311
KPMG International HeadquartersBurgemeester Rijnderslaan 201185 MC AmstelveenThe NetherlandsTel: +31 (20) 656 6700Fax: +31 (20) 656 6777Web: www.kpmg.com
AustriaSchwarzenbergplatz 16A-1010 Vienna, AustriaTel: +43 (1) 506 32Fax: +43 (1) 506 32/60 00Web: www.at.kpmg.net
France21 rue Dumont d’UrvilleF-75116 Paris, FranceTel: +33 (1) 56 89 60 00Fax: +33 (1) 56 89 60 10Web: www.kpmgconsulting.fr
Germany National Office10117 Berlin, GermanyTel: +49 (30) 2068 0Fax: +49 (30) 2068 2000Web: www.kpmg.de
HungaryXIII Váci út 99H-1139 Budapest, H\ungaryTel: +36 (1) 270 71 00Fax: +36 (1) 270 71 01Web: www.hu.kpmg.net
IrelandRussell Court, Stoke’s PlaceSt Stephen’s GreenDublin 2, Ireland (Republic)Tel: +353 (1) 410 18 00Fax: +353 (1) 412 18 88Web: www.kpmg.ie
ItalyVia Vittor Pisani 2520124 Milano, ItalyTel: +39 (02) 67 64 31Fax: +39 (02) 67 64 36 03Web: www.kpmg.it
NetherlandsRijnzathe 103454 PV De Meern, The NetherlandsTel: +31 (20) 658 1658Fax: +31 (20) 658 3658Web: www.kpmg.nl
NorwayBrynsveien 120667 Oslo, NorwayTel: +47 22 07 22 07Fax: +47 22 72 42 82Web: www.no.kpmg.net
RussiaGogolevsky Bulvard 11121019 Moscow, RussiaTel: +7 (095) 937 44 77 (Int)Fax: +7 (095) 937 44 00/99 (Int)Web: www.ru.kpmg.net
SpainEdificio Torre EuropaPaseo de la Castellana 95Madrid 28046, SpainTel: +34 (91) 456 34 00Fax: +34 (91) 555 01 32Web: www.es.kpmg.net
SwitzerlandBadenerstrasse 172Ch-8004 Zurich, SwitzerlandTel: +41 (1) 249 31 31Fax: +41 (1) 249 23 19Web: www.kpmg.ch
For further information please contact KPMG Consulting at the following offices:
United Kingdom8 Salisbury SquareLondon EC4Y 8BB, United KingdomTel: +44 (20) 7311 1000Fax: +44 (20) 7311 3311Web: www.kpmg.co.uk
AfricaSouth AfricaKPMG Crescent85 Empire Road2122 Parktown, South AfricaTel: +27 (11) 647 71 11Fax: +27 (11) 647 80 00Web: www.kpmg.co.za
Middle EastBahrainChamber of Commerce and Industry Building5th FloorManama, BahrainTel: +973 22 48 07Fax: +973 22 74 43
In the USA:
Steve CranfordKPMG Consulting77 West Street, Ste. 300Annapolis, MD 21401USA
Telephone: 410 295 9725Facsimile: 410 295 [email protected]
www.kpmg/consulting.com
In the Netherlands:
René TissenKPMGGebouwBurgemeester Rijnderslaan 201185 MC AmstelveenHolland
Telephone: 00 31 20 656 81 92Facsimile: 00 31 20 656 85 [email protected]
www.kpmg.nl

8 5 1 9 De
sig
ne
d b
y I
DP
De
sig
n C
on
sult
an
ts 0
20
86
58
88
58
The purpose of this publication is to give a general overview and not to provide specific advice relevant to any circumstances. It is recommended that professional adviceis sought before any action is taken. This publication is correct to the best of our knowledge and belief at the time of going to press.
© November 1999, KPMG, the UK member firm of KPMG International