Embed Size (px)
Citation preview
1
Knowledge Economy Assessment
of Tunisia
Identifying and addressing capability and innovation gaps in the Southern
and Eastern Mediterranean region (SEMED)
2
Knowledge Economy Assessment
of Tunisia
Identifying and addressing capability and innovation gaps in the Southern
and Eastern Mediterranean region (SEMED)
This assessment was funded by the Southern and Eastern Mediterranean Multi-Donor
Account (MDA). The MDA is supported by Australia, Finland, France, Germany, Italy,
Netherlands, Norway, Sweden and UK. The contents of this publication are the sole
responsibility of Whiteshield Partners Limited and do not necessarily reflect the views of
the EBRD.
Supported by:
3
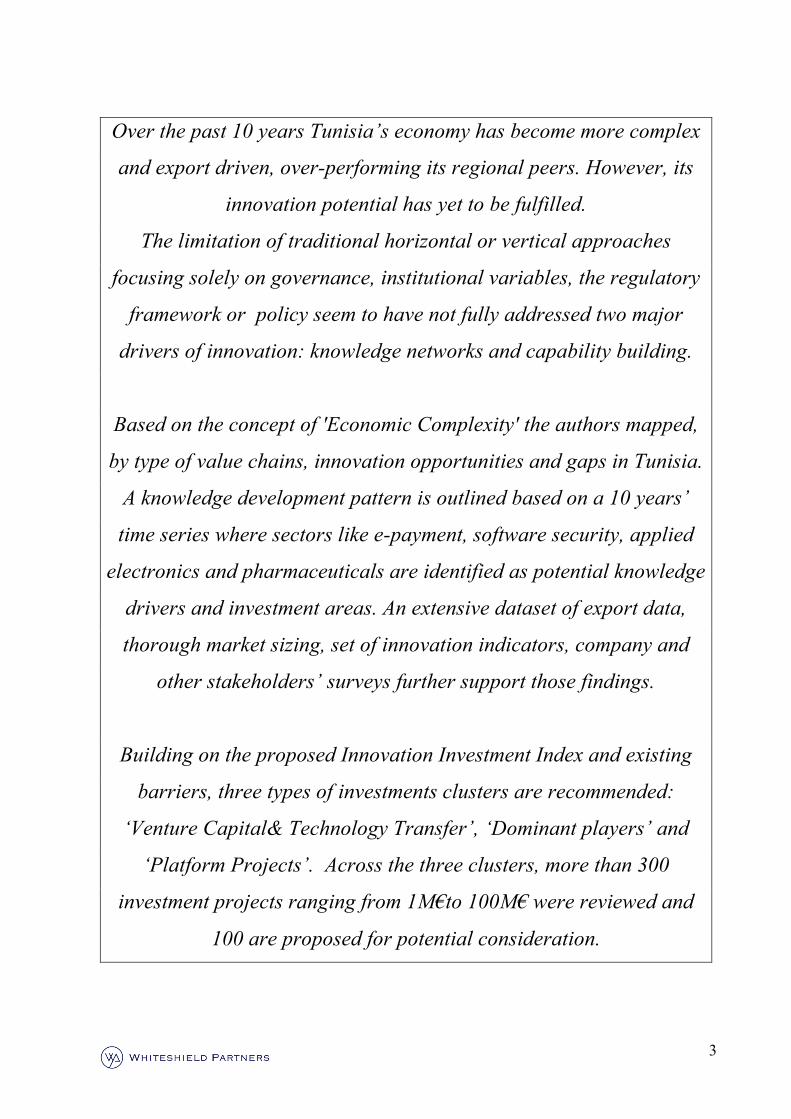
Over the past 10 years Tunisia’s economy has become more complex
and export driven, over-performing its regional peers. However, its
innovation potential has yet to be fulfilled.
The limitation of traditional horizontal or vertical approaches
focusing solely on governance, institutional variables, the regulatory
framework or policy seem to have not fully addressed two major
drivers of innovation: knowledge networks and capability building.
Based on the concept of 'Economic Complexity' the authors mapped,
by type of value chains, innovation opportunities and gaps in Tunisia.
A knowledge development pattern is outlined based on a 10 years’
time series where sectors like e-payment, software security, applied
electronics and pharmaceuticals are identified as potential knowledge
drivers and investment areas. An extensive dataset of export data,
thorough market sizing, set of innovation indicators, company and
other stakeholders’ surveys further support those findings.
Building on the proposed Innovation Investment Index and existing
barriers, three types of investments clusters are recommended:
‘Venture Capital& Technology Transfer’, ‘Dominant players’ and
‘Platform Projects’. Across the three clusters, more than 300
investment projects ranging from 1M€to 100M€ were reviewed and
100 are proposed for potential consideration.
4
Table of contents
Introduction 5
Methodology and framework of analysis 12
Chapter One-Knowledge Economy Review: High potential to develop a knowledge-based
economy 19
1.1. Policies: Comprehensive policies, yet inconsistent implementation 20
1.2. Market demand: Growth in ICT, Electronics and pharmaceuticals sectors 37
1.3. Human capital development: Strong basis to innovate yet skills gaps 53
1.4. Innovation Eco-system: Essentials in place but need for more adapted framework and
further acoordination 59
Chapter 2-Gaps & Opportunities: Software services, Electronics and Pharmaceutical
sectors driving innovation 70
2.1 Economic Complexity: Capabilities identified in ICT, Electric and Electronic Industry and
Pharmaceuticals 71
2.2. Value chain networks: opportunities in e-payment, software, telecom, electronics,
medical devices and healthcare 85
2.3.Innovation Investment Index: prioritizing potential target areas 94
Appendix 1: Interview and company summaries Appendix 2: Investment and capacity building profiles Appendix 3: List of all publications reviewed Appendix 4. Methodology of economic complexity approach
5
Introduction
A diversified and export orientated economy
Tunisia is an upper-middle-income country with a Gross Domestic Product (GDP) growing by
3.5% annually in the pre-revolution period of 2008-20101, a GDP per capita of EUR 3,310 2 in
2011, a fairly sound macroeconomic environment, and a relatively well-diversified and export
oriented economy supported by Foreign Direct Investment (FDI). In 2011, exports accounted for
51%3 of the country’s GDP. Seven sectors accounted for 80% of goods and service trade: Textile
manufacturing, Electronic, Electrical and Mechanical manufacturing, Chemical manufacturing,
Agriculture, Tourism and Information and Communication Technologies (ICT)4. The service
sector accounted in 2011 for more than 45% of GDP5, highly represented by ICT6. This sector
alone represents 10% of the country's GDP7 and shows high potential in Tunisia, with an
estimated market of 4.8 B€ and a Compounded Annual Growth Rate (CAGR) of 6% in the
period from 2007 to 20128. The industrial sectors are also well represented in the economy, with
an increased weight of Electronics and Electrical Industries (EEI), amounting to an estimated
market of over 2.2 B€ in 2012 growing by 16% in the period of 2005-20109.
Traditionally strong human capital base
The relative strengths of the country’s education inputs and outputs are key drivers of the
economy. In 2011, the United Nations human development indicators for Tunisia were above the
regional average (0.70 for Tunisia versus 0.64 for other countries of the Middle-East and North
Africa10), however still lower than 0.87 for the Organization for Economic Cooperation and
Development (OECD)11. In the same year, the level of literacy was at 78% of the population vs.
98% in the OECD12. Beyond the fundamentals, the secondary schools enrolment ratio is also
high, standing at 90%13in 2009. In terms of education outputs, as measured by the OECD
1 Source: Data World Bank, http://data.worldbank.org/indicator/NY.GDP.MKTP.KD.ZG; Note: GDP in PPP, growth defined as year on year growth from 2007-2012 2 Source: Data Bank of the World Bank, http://data.worldbank.org/indicator/NY.GDP.PCAP.CD, 2011 3 Source :Data World Bank, http://databank.worldbank.org/ddp/home.do 4 Source: Agency for Promotion of Industry and Innovation (APII) http://www.tunisianindustry.nat.tn/en/home.asp 5 Source: Institute National of Statistics Tunisia : Note: GDP in PPP in 2012 6 Source: OECD Information Technology Outlook 2010 7 Source: Foreign Investment Promotion Agency (FIPA), http://www.investintunisia.tn/site/en/article.php?id_article=779: Note: GDP in PPP 8 Source: IDC CEMA Black Book 2011 9 Source : Foreign Investment Promotion Agency http://www.investintunisia.tn/site/en/article.php?id_article=774 10 Note: List of MENA countries: Algeria, Bahrain, Djibouti, Egypt, Iraq, Jordan, Kuwait, Lebanon, Libya, Morocco, Palestine, Oman, Qatar, Saudi Arabia, Sudan, Syria, Tunisia, United Arab Emirates, Yemen 11 Source : United Nations Development Programhttp://hdrstats.undp.org/en/countries/profiles/TUN.html 12 Source: UNICEF http://www.unicef.org/infobycountry/Tunisia_statistics.html 13 Source: Data World Bank, http://data.worldbank.org/indicator/SE.SEC.ENRR
6
Program for International Student Assessment (PISA) 14 Tunisia has been improving its
performance (on the Science scale 401 in 2009 versus 386 in 2006), however still falling behind
the OECD average (501 in 2009)15.
Policies to support innovation in place, yet not coordinated and implemented fully
Policy makers developed several programs to support innovation and develop the Knowledge
Economy. The innovation system of the country is based on the ‘triple helix’ model, i.e. the
collaboration between universities, research institutes and start-ups. Innovation is concentrated in
the specific cities like Tunis and Sfax. The level of Research & Development (R&D) is relatively
high compared to the regional peers, spending on R&D standing at 1.1% of GDP in 2010 (versus
0.21% in Egypt, 0.42 in Jordan, 0.08 in Saudi Arabia)16. Scientific collaboration resulted in the
publication of 17,068 articles between 2006 and 2010 with collaboration and co-authorship in
the areas of neuroscience (58%), physics & astronomy (64%), materials science (53%) and
immunology (55%)17. However, a number of policy challenges still limit the knowledge
economy performance of the country, including a strong role of the State, lack of coordination
between government agencies, heavy bureaucracy, decreasing capital inflows and insufficient
access to private sector finance and capital, especially post company set-up. The lack of
coordination between government agencies and time required to complete funding applications –
up to six months to obtain a response according to private sector survey - are leading innovative
companies surveyed to gradually reduce formal applications and to turn to the private sector. The
number of Venture Capital firms remains limited and existing Capital risk investment companies
(SICAR) and bank loans relatively not adapted to seed financing. In terms of capital inflows,
FDI in the area of the knowledge economy is lower than in Morocco or MENA countries with
FDI inflows decreasing by 9% from 2007 to 201018.
The challenge ahead: Unlocking the potential of Tunisia through knowledge centric policies
and approaches
Since the January 2011 revolution, the country has been experiencing economic challenges
inherent in the transition phase. Major policy barriers still need to be addressed, including the
rigidity of the labor market, the inequitable taxation system, lack of adequate competition 14 Note: PISA(Program for International Student Assessment) is an international study that was launched by the OECD in 1997. It aims to evaluate education systems worldwide every three years by assessing 15-year-olds' competencies in the key subjects: reading, mathematics and science. 15OECD, PISA 2006, 2009 http://www.oecd.org/pisa/46643496.pdf ,http://www.oecd.org/pisa/46660259.pdf 16Source: World Bank, http://data.worldbank.org/indicator/GB.XPD.RSDV.GD.ZS 17 Source: SCImago. (2007).SJR - SCImago Journal & Country Rank. 18 Source: World Bank Data, http://data.worldbank.org/indicator/BX.KLT.DINV.CD.WD
7
policies and skills gaps - major issues contributing to high unemployment. More specifically, a
number of challenges remain to be addressed to develop a comprehensive knowledge centric
strategy, including identifying and targeting capability and innovation gaps and highlighting
relevant investment targets. The primary question is to define an appropriate framework to both
analyze and address those gaps starting with the definition of Knowledge Economy, which is still
unclear in the literature. In addition, the limitation of current traditional horizontal or vertical
approaches focusing solely on governance, institutional variables, the regulatory framework or
policy seem to have failed to fully address the major driver behind economic growth: knowledge.
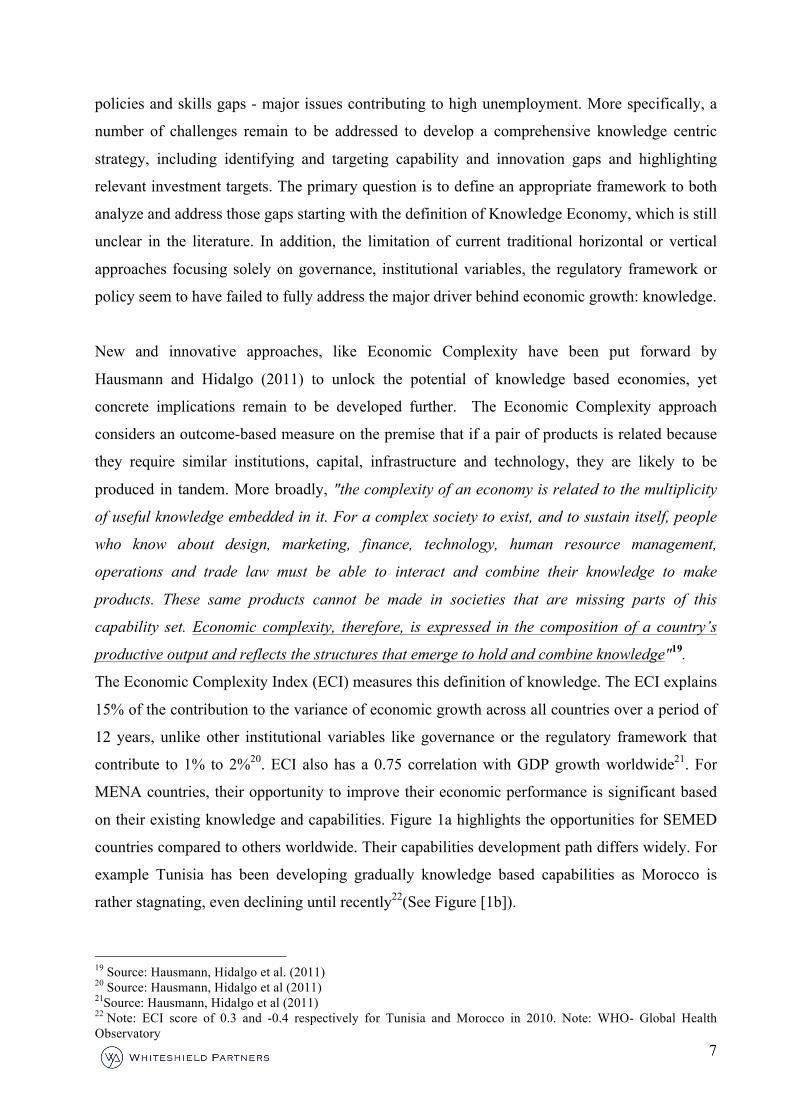
New and innovative approaches, like Economic Complexity have been put forward by
Hausmann and Hidalgo (2011) to unlock the potential of knowledge based economies, yet
concrete implications remain to be developed further. The Economic Complexity approach
considers an outcome-based measure on the premise that if a pair of products is related because
they require similar institutions, capital, infrastructure and technology, they are likely to be
produced in tandem. More broadly, "the complexity of an economy is related to the multiplicity
of useful knowledge embedded in it. For a complex society to exist, and to sustain itself, people
who know about design, marketing, finance, technology, human resource management,
operations and trade law must be able to interact and combine their knowledge to make
products. These same products cannot be made in societies that are missing parts of this
capability set. Economic complexity, therefore, is expressed in the composition of a country’s
productive output and reflects the structures that emerge to hold and combine knowledge"19.
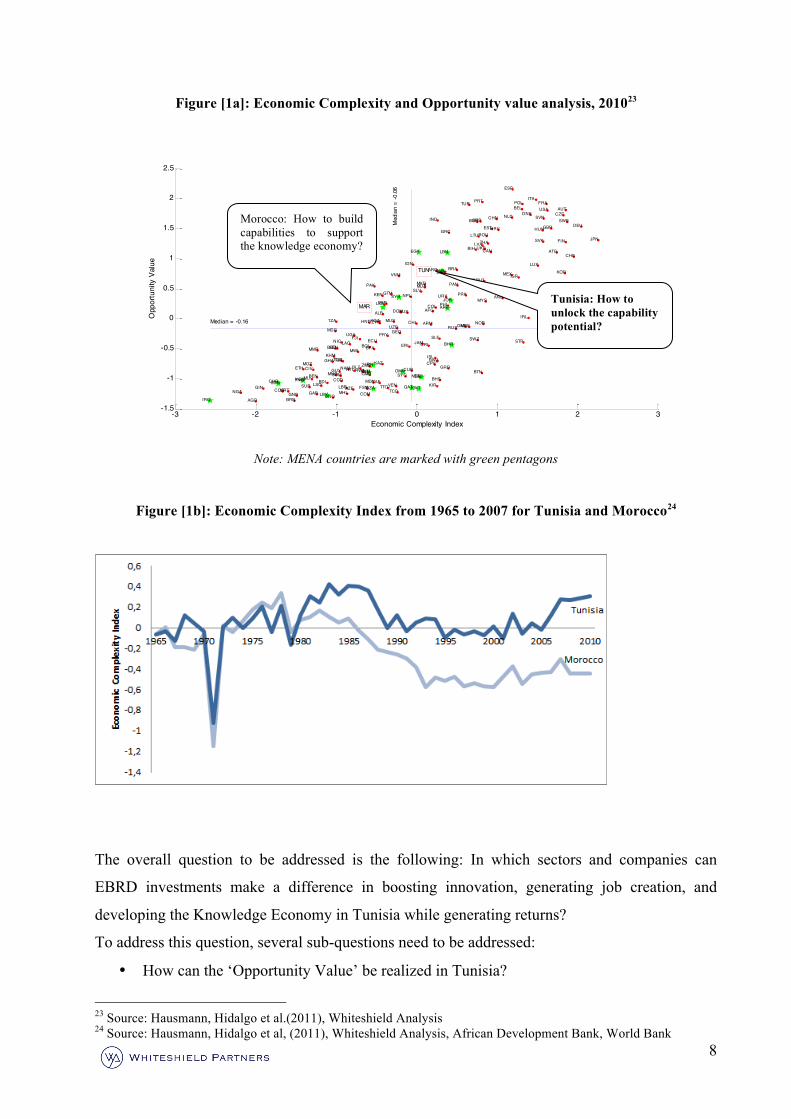
The Economic Complexity Index (ECI) measures this definition of knowledge. The ECI explains
15% of the contribution to the variance of economic growth across all countries over a period of
12 years, unlike other institutional variables like governance or the regulatory framework that
contribute to 1% to 2%20. ECI also has a 0.75 correlation with GDP growth worldwide21. For
MENA countries, their opportunity to improve their economic performance is significant based
on their existing knowledge and capabilities. Figure 1a highlights the opportunities for SEMED
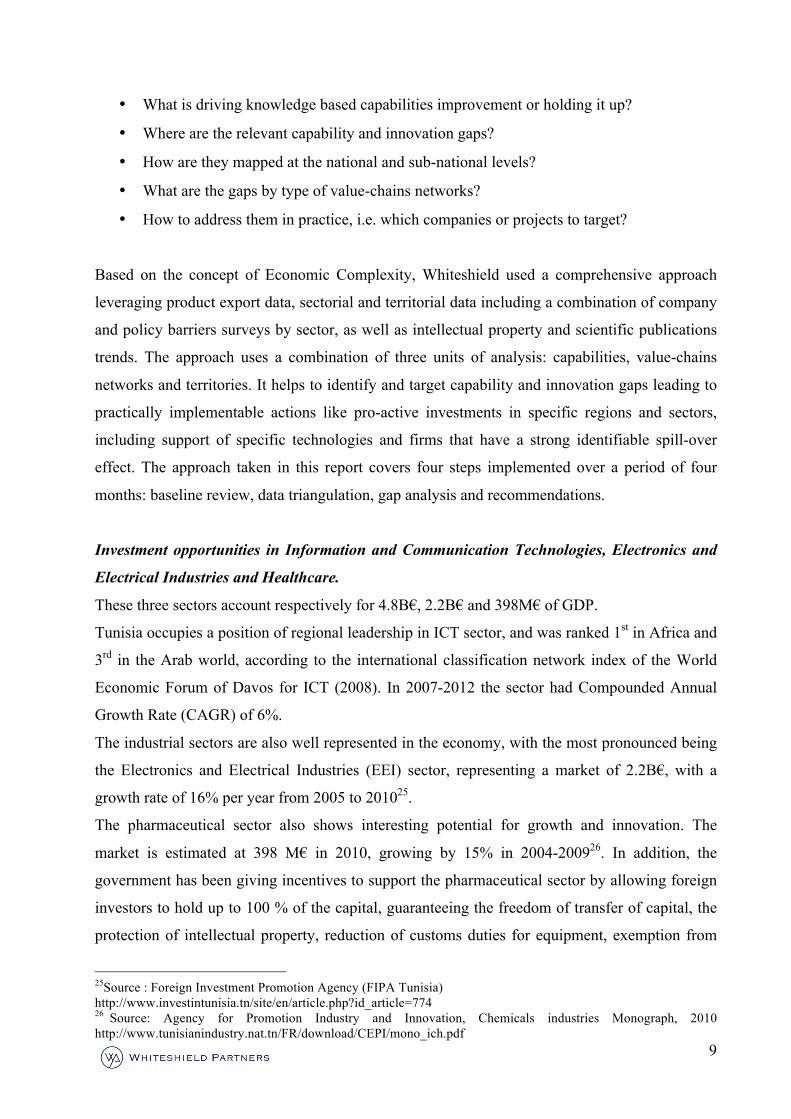
countries compared to others worldwide. Their capabilities development path differs widely. For
example Tunisia has been developing gradually knowledge based capabilities as Morocco is
rather stagnating, even declining until recently22(See Figure [1b]).
19 Source: Hausmann, Hidalgo et al. (2011) 20 Source: Hausmann, Hidalgo et al (2011) 21Source: Hausmann, Hidalgo et al (2011) 22 Note: ECI score of 0.3 and -0.4 respectively for Tunisia and Morocco in 2010. Note: WHO- Global Health Observatory
8
Figure [1a]: Economic Complexity and Opportunity value analysis, 201023
Note: MENA countries are marked with green pentagons
Figure [1b]: Economic Complexity Index from 1965 to 2007 for Tunisia and Morocco24
The overall question to be addressed is the following: In which sectors and companies can
EBRD investments make a difference in boosting innovation, generating job creation, and
developing the Knowledge Economy in Tunisia while generating returns?
To address this question, several sub-questions need to be addressed:
• How can the ‘Opportunity Value’ be realized in Tunisia?
23 Source: Hausmann, Hidalgo et al.(2011), Whiteshield Analysis 24 Source: Hausmann, Hidalgo et al, (2011), Whiteshield Analysis, African Development Bank, World Bank
-3 -2 -1 0 1 2 3-1.5
-1
-0.5
0
0.5
1
1.5
2
2.5
AFGALB
DZA
AND
AGO
ATG
ARG
ARM
AUS
AUT
AZE
BHS
BHRBGD
BRB
BLR
BEL
BLZ
BENBTN
BOL
BIH
BWA
BRA
BRN
BGR
BFA
BDI
KHM
CMR
CAN
CPV
CAF
TCD
CHL
CHN
COL
COMCOG
COD
CRI
CIV
HRV
CUB
CYP
CZEDNK
DJI
DMA
DOM
ECU
EGY
SLV
GNQ
ERI
EST
ETH
FJI
FIN
FRA
GAB
GMB
GEO
DEU
GHA
GRC
GRD
GTM
GINGNB
GUY HTI
HND
HUN
ISL
IND
IDN
IRN
IRQ
IRL
ISR
ITA
JAM
JPN
JOR
KAZ
KEN
KIR
PRK
KOR
KWT
KGZ
LAO
LVALBN
LSO LBRLBY
LTU
LUX
MKD
MDG
MWI
MYS
MDVMLI
MHLMRT
MUS
MEX
FSM
MDA
MNG
MNE
MOZ
MMR
NAM
NPL
NLD
NZL
NIC
NER
NGA
NOR
OMN
PAK PAN
PNG
PRY
PER PHL
POLPRT
QAT
ROU
RUS
RWA
STP
SAU
SEN
SRB
SYC
SLE
SGP
SVK
SVN
SOM
ZAF
ESP
LKA
SDNSUR
SWZ
SWE
CHE
SYR
TJK
TZA
THA
TGO
TTO
TUR
TKM
UGA
UKR
ARE
GBR
USA
URY
UZB
VEN
VNM
YEM
ZMB
ZWE
MAR
TUN
Economic Complexity Index
Opp
ortu
nity
Val
ue
Median = -0.16
Med
ian
= -0
.06
Morocco: How to build capabilities to support the knowledge economy?
Tunisia: How to unlock the capability potential?
9
• What is driving knowledge based capabilities improvement or holding it up?
• Where are the relevant capability and innovation gaps?
• How are they mapped at the national and sub-national levels?
• What are the gaps by type of value-chains networks?
• How to address them in practice, i.e. which companies or projects to target?
Based on the concept of Economic Complexity, Whiteshield used a comprehensive approach
leveraging product export data, sectorial and territorial data including a combination of company
and policy barriers surveys by sector, as well as intellectual property and scientific publications
trends. The approach uses a combination of three units of analysis: capabilities, value-chains
networks and territories. It helps to identify and target capability and innovation gaps leading to
practically implementable actions like pro-active investments in specific regions and sectors,
including support of specific technologies and firms that have a strong identifiable spill-over
effect. The approach taken in this report covers four steps implemented over a period of four
months: baseline review, data triangulation, gap analysis and recommendations.
Investment opportunities in Information and Communication Technologies, Electronics and
Electrical Industries and Healthcare.
These three sectors account respectively for 4.8B€, 2.2B€ and 398M€ of GDP.
Tunisia occupies a position of regional leadership in ICT sector, and was ranked 1st in Africa and
3rd in the Arab world, according to the international classification network index of the World
Economic Forum of Davos for ICT (2008). In 2007-2012 the sector had Compounded Annual
Growth Rate (CAGR) of 6%.
The industrial sectors are also well represented in the economy, with the most pronounced being
the Electronics and Electrical Industries (EEI) sector, representing a market of 2.2B€, with a
growth rate of 16% per year from 2005 to 201025.
The pharmaceutical sector also shows interesting potential for growth and innovation. The
market is estimated at 398 M€ in 2010, growing by 15% in 2004-200926. In addition, the
government has been giving incentives to support the pharmaceutical sector by allowing foreign
investors to hold up to 100 % of the capital, guaranteeing the freedom of transfer of capital, the
protection of intellectual property, reduction of customs duties for equipment, exemption from
25Source : Foreign Investment Promotion Agency (FIPA Tunisia) http://www.investintunisia.tn/site/en/article.php?id_article=774 26 Source: Agency for Promotion Industry and Innovation, Chemicals industries Monograph, 2010 http://www.tunisianindustry.nat.tn/FR/download/CEPI/mono_ich.pdf
10
custom duties for raw materials and articles for packaging, and a preferred rate for VAT of 6%.27
Public health coverage creates additional incentives to pharmaceutical sector development28. The
objective is to transform the country into a regional center for medical services by 2016.
Supporting this objective, total health expenditures annually accounted for 6.2-6.4% of GDP in
2004-2010, 54% being provided by the government29. In 2005-2010 domestic consumption of
pharmaceuticals had been increasing by 16.7% annually and reached 538M€ in 2010. The
coverage of market needs in medicines through the local production had increased from 14% in
1990 to 45% in 201030.
EBRD in Tunisia: Potential diversified approach to investment and advisory services support
Combining capability, value chain gaps and employment potential data, an Innovation
Investment Index was developed (The ‘Index’). Based on the outlined Index, key knowledge
economy sectors were identified for further consideration including Electric and electronic
equipment for auto and aircraft manufacturers, Enterprise application software, E-payment and
software security, Medical electronic devices and Medicines. The list was extended with several
Agribusiness and Textile companies that could potentially upgrade the traditional sectors of
Tunisian economy, and several financial and educational firms that could address some of
existing barriers to innovation in the country. Within those sectors, more than 300 companies
were identified and 100 selected for further consideration by the EBRD including a high-level
review of the companies. Those companies are clustered around three types of investments (all
quoted investment figures are high level assessments supported by company feedback):
• Venture Capital& Technology Transfer: Typically companies and projects that require 1
to 5M€ investment or less and could consolidated into Venture Capital fund(s) of 30-
50M€ with co-financing from the EBRD. Public incubators have been excluded from this
scope based on the survey performed, favoring VC funding with active coaching.
• Dominant Player: Typically companies that require 5-50M€ investment, holding 20%
market share or more in their segment, this is the case for example of IT service
integrators, telecom companies and healthcare players.
27The Foreign Investment Promotion Agency, FIPA Tunisia, http://www.investintunisia.tn/site/en/article.php?id_article=789 28 Note: Some segments of the population benefit either from free health care and hospitalization in public facilities or from reduced fees. This is stipulated in the Health Organization Law and detailed in decrees, orders and specific circulars. Source: World Health Organisation “Tunisia: the role of contractual arrangements in improving health sector performance” 29 World Health Organization http://apps.who.int/nha/database/StandardReport.aspx?ID=REP_WEB_MINI_TEMPLATE_WEB_VERSION&COUNTRYKEY=84669 30 Source: UNIDO, AU-UNIDO conference on economic diversification and manufacturing in Africa, 2012
11
• Platform Projects: Typically growth platforms for existing companies that require
additional investments – in the range or 50-100M€- or collaboration between players e.g.
integrators or acquirers in the e-payment or payment processing sectors implying
collaboration between a number of local banks and accreditations from e.g. Visa.
Policy makers should also address short-term priority actions including (a) the set-up of a
one window for all innovation activities, especially for grant, zero interest loans, techno-park
location and other applications that are not currently fully coordinated; (b) set-up of
transparent selection criteria for the accreditation of ‘Innovative investments’ that give tax
breaks, access public finance, eventually leveraging international independent expertise to
assess projects, and reduction of time to process to 2-3 weeks; (c) adapting other type of
access to finance like SICAR and bank loans credit assessments criteria to innovation and
service requirements and (d) encourage much further private sector Venture Capital
formation.
12
Methodology and framework of analysis
Data identification and selection approach
A top down approach was first used leveraging macro-economic and market research data to
quantify market sizes and trends (Secondary research). This approach was validated by
triangulation with data collected from interviews, questionnaires and focus groups in a bottom up
approach (Primary research).
Primary Research: assessing demand in the field through direct interviews and a written survey
Primary research was conducted through a survey covering 23 questions split into three main
areas: (1) assessment of the country’s knowledge and capability competitive advantages, (2)
assessment of key policy and business barriers faced by the private sector, and (3) perspective on
innovation and development of the knowledge economy (see annex 1 for a list of questions and
participants). The sample covered in Tunisia included 51 participants, comprising of 75% of
private companies and 25% of universities, policy makers, research institute and other public
bodies. The survey was conducted from October 15th, 2012 to December 5th, 2012.
Secondary research: Review of existing literature and leverage of recent market research studies
A number of studies were carried out by private consulting firms and international organizations
over the past four years in Tunisia. These include: African Development Bank – African
Economic Outlook 2012, OECD - Investment Policy Review 2010;Ernst & Young – Baromed
Survey 2008;World Bank – Interim Strategy Note 2012; World Economic Forum - Global
Competitiveness Report 2011-2012, World Bank International Finance Corporation - Ease of
doing business 2012; World Intellectual Property Organisation - The Global Innovation Index
2012; The International Bank for Reconstruction and Development / The World Bank - Tunisia:
From Revolutions to Institutions, 2012; European Training Foundation – Women and Work in
Tunisia, 2010; World Bank - Are Jordan and Tunisia’s Exports Becoming More Technologically
Sophisticated, 2012; Research ICT Africa - Tunisia ICT Sector Performance Review 2009/2010;
World Economic Forum /The World Bank – The Africa Competitiveness Report 2011.
13
All point to three major challenges to address: youth unemployment, the over burdened legal
framework, corruption and transparency. It also highlights three potential sectors of interest:
ICT, EEI and Healthcare sectors. Box [1] provides a brief summary of key insights from selected
publications.
Box 1: Summary of key recent studies on Tunisia
covering sectorial, knowledge and innovation topics fully or partially
African Development Bank – African Economic Outlook - 2012:
Tunisia is facing the same challenge as its neighbour Morocco in terms of youth unemployment. While
general unemployment rose in 2011 to almost 19%, youth unemployment was at 30% for young
university graduates. Several incentives and programmes were implemented such as wage subsidies,
covering 50% of the wages of young university graduates, training programmes to bring young graduates
to an operational level after university and before their first employment. These initiatives have helped
over 85,000 graduates from 2004 to 2010. However more than such public policies or programmes,
Tunisia needs to reduce the mismatch between private sector needs and higher educational offer through
increased collaboration. Despite new measures taken, the unequal tax system has divided the Tunisian
economy into offshore and onshore sectors. In 2011, the ‘advantaged’ offshore sector rose by 19%, while
a heavily taxed onshore sector fell by 5%.
The World Bank - Interim Strategy Note- 2012:
Despite sound socioeconomic improvement in the last few years, the development of the country is still
tarnished by corruption and political interference. While the private sector was disadvantaged by poorly
adapted regulations and government corruption, the offshore sector received important incentives,
including simplified investment procedures and competitive salaries. Many national economic sectors
were closed for export through quotas and tariff barriers. The labour market was affected by employers
recruiting only through short-term flexible contracts, granting limited job security to their employees.
This orientation towards offshoring contributed to the creation of a socioeconomic disparities throughout
the country. While coastal cities account for up to 85% of Tunisia's GDP, inland regions are gradually
getting poorer.
Ernst & Young Baromed Survey - 2008:
Like its Moroccan peer, Tunisia is considered as one of the best destinations for offshoring in the region
and targeting the European Union market. The cost of doing business is relatively low and offshore firms
benefit from a wide range of advantages such as tax exemption, VAT exemption. However, the country is
facing a lack of highly skilled labour.
14
OECD Investment Policy Review – 2012 (October): Starting from the recent turmoil following the 2011
revolution, Tunisia has begun its transition period but is facing serious socioeconomic challenges,
including youth unemployment, social disparities, reduced growth, decreased competitiveness, and thus
reduced investment. Yet many reforms and development plans were implemented to support the policy
framework in place. This effort needs to be pursued in a more coherent and collaborative way between
public and private sectors, and amongst institutions, in order to reassure domestic and foreign investors as
well as to address the issue of youth unemployment. Foreign Direct Investment (FDI) is key for Tunisia
with inflows averaging 1.5 B€ a year from 2005 to 2010. The Euro crisis, however, had a dramatic impact
on FDI directed towards Tunisia, with a 26% drop in 2011. There is a need to diversify FDI partners; to
increase competitiveness in traditional sectors (textile, agriculture) and to attract inflows to higher value
added sectors. Several measures were taken to improve the investment climate in Tunisia, including the
revision of the complex legal framework and the simplification of procedures. Thanks to these measures
Tunisia was ranked 40th in the Global Competitiveness Report 2011-2012 of the World Economic
Forum, and 46th in the 2012 Doing Business report of the World Bank, faring much better than its peers.
However as highlighted by the transition government, the “Private initiative is being hindered and the
profitability of investment projects severely compromised by arbitrary practices, corruption, unequal
treatment of investors and disregard of regulations” (Economic and social Development Strategy 2012-
16)
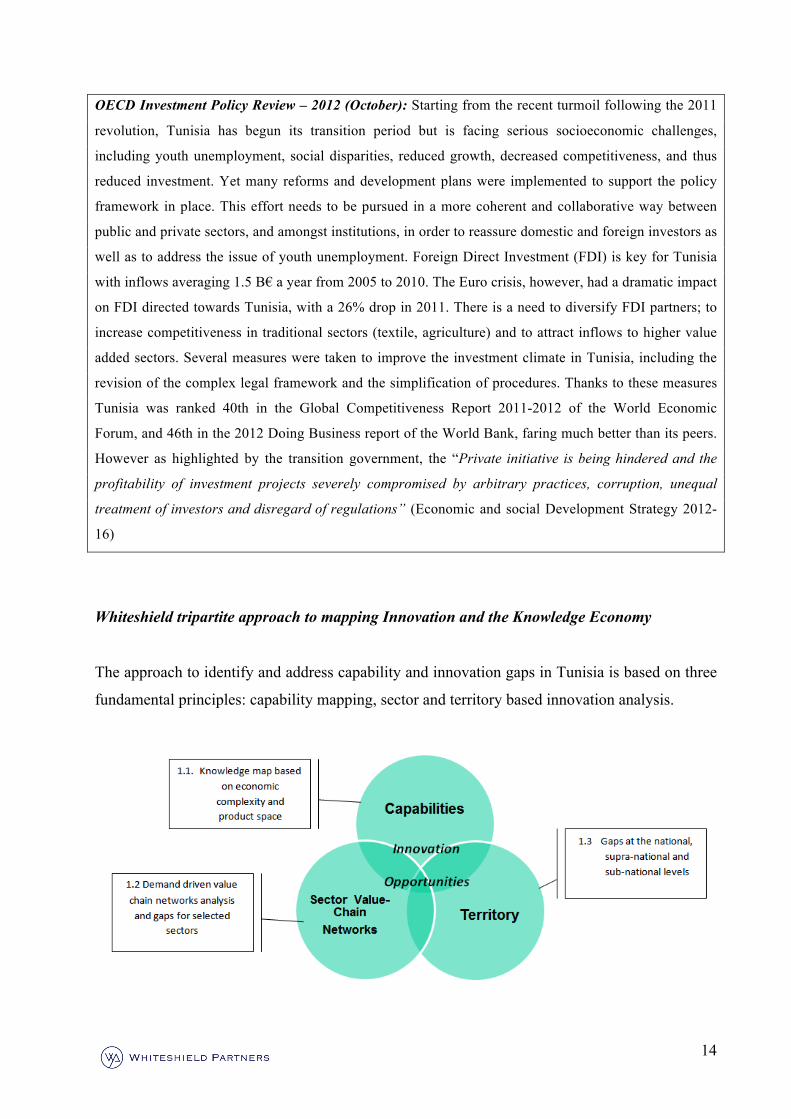
Whiteshield tripartite approach to mapping Innovation and the Knowledge Economy
The approach to identify and address capability and innovation gaps in Tunisia is based on three
fundamental principles: capability mapping, sector and territory based innovation analysis.
15
1. Assessing capability gaps through Economic Complexity Indicators and Product Space
The Economic Complexity approach, applied in this report, considers an outcome-based measure
on the premise that if a pair of products is related because they require similar institutions,
capital, infrastructure and technology, they are likely to be produced in tandem. Thus, economic
complexity approach aims at determining existing capabilities and productive knowledge of the
country. Capabilities are defined here as institutions, knowledge, capital, infrastructure and
technology required to produce, and successfully export certain products. Quantitative indicators
of Economic Complexity approach are given in Definition box 2.
This approach helps to quantify and predict the likelihood of a country to develop advanced
manufacturing capabilities and greater national prosperity. The network node map of a country's
economy is referred to as the Product Space Network Visualisation. In this report, the Product
Space is a visualisation of world trade (services excluded), expressed in terms of global exports,
structured according to the similarity of capabilities required to produce products. Beyond
Manufacturing, the approach was complemented by a service-based analysis using off-shore
data.
2. Identifying innovation gaps through a sectorial approach
The second key unit of analysis is represented by ‘value-chain networks’. A review of key global
and local value-chains and sectors identified as part of the capability and knowledge mapping is
performed to map key gaps. The main principle behind this approach is that innovation
development is mainly driven by sectorial demand and competition, not just by national level
horizontal drivers or policy. The value chain networks analysis focuses essentially on capturing
knowledge spill overs, trends and demand in the sector based on interviews and focus groups,
existing innovation and potential opportunities and gaps at every step of the value chain based on
detailed surveys. Its objective is also to identify how Tunisia could integrate further into Global
Value Chains.
3. Analyzing territory based capabilities and innovation
The third component of the analysis is to map selected territory innovation advantages and gaps.
The mapping is made based on the fact that innovation (a) only happens in specific regions/areas
of a country and (b) is almost always associated with other countries.
16
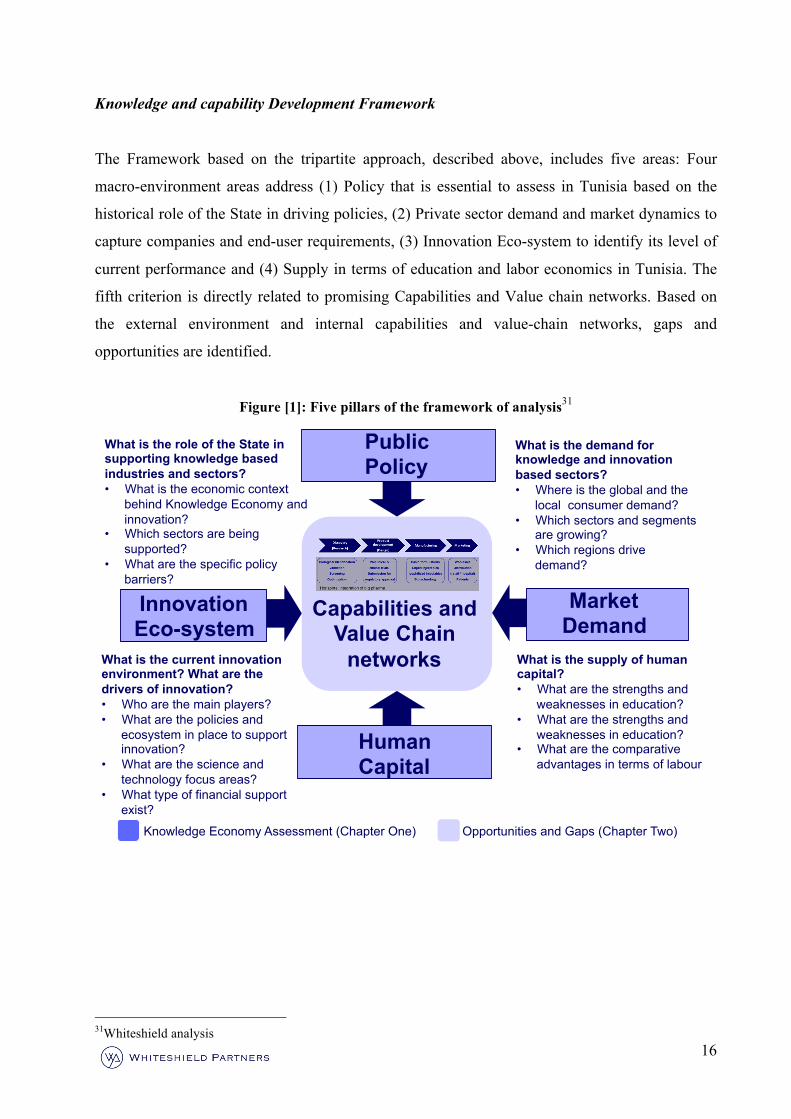
Knowledge and capability Development Framework
The Framework based on the tripartite approach, described above, includes five areas: Four
macro-environment areas address (1) Policy that is essential to assess in Tunisia based on the
historical role of the State in driving policies, (2) Private sector demand and market dynamics to
capture companies and end-user requirements, (3) Innovation Eco-system to identify its level of
current performance and (4) Supply in terms of education and labor economics in Tunisia. The
fifth criterion is directly related to promising Capabilities and Value chain networks. Based on
the external environment and internal capabilities and value-chain networks, gaps and
opportunities are identified.
Figure [1]: Five pillars of the framework of analysis31
31Whiteshield analysis
Public Policy
Innovation Eco-system
Human Capital
Market Demand
Capabilities and Value Chain
networks
What is the role of the State in supporting knowledge based industries and sectors? • What is the economic context
behind Knowledge Economy and innovation?
• Which sectors are being supported?
• What are the specific policy barriers?
What is the demand for knowledge and innovation based sectors? • Where is the global and the
local consumer demand? • Which sectors and segments
are growing? • Which regions drive
demand?
What is the current innovation environment? What are the drivers of innovation? • Who are the main players? • What are the policies and
ecosystem in place to support innovation?
• What are the science and technology focus areas?
• What type of financial support exist?
What is the supply of human capital? • What are the strengths and
weaknesses in education? • What are the strengths and
weaknesses in education? • What are the comparative
advantages in terms of labour
Knowledge Economy Assessment (Chapter One) Opportunities and Gaps (Chapter Two)
17
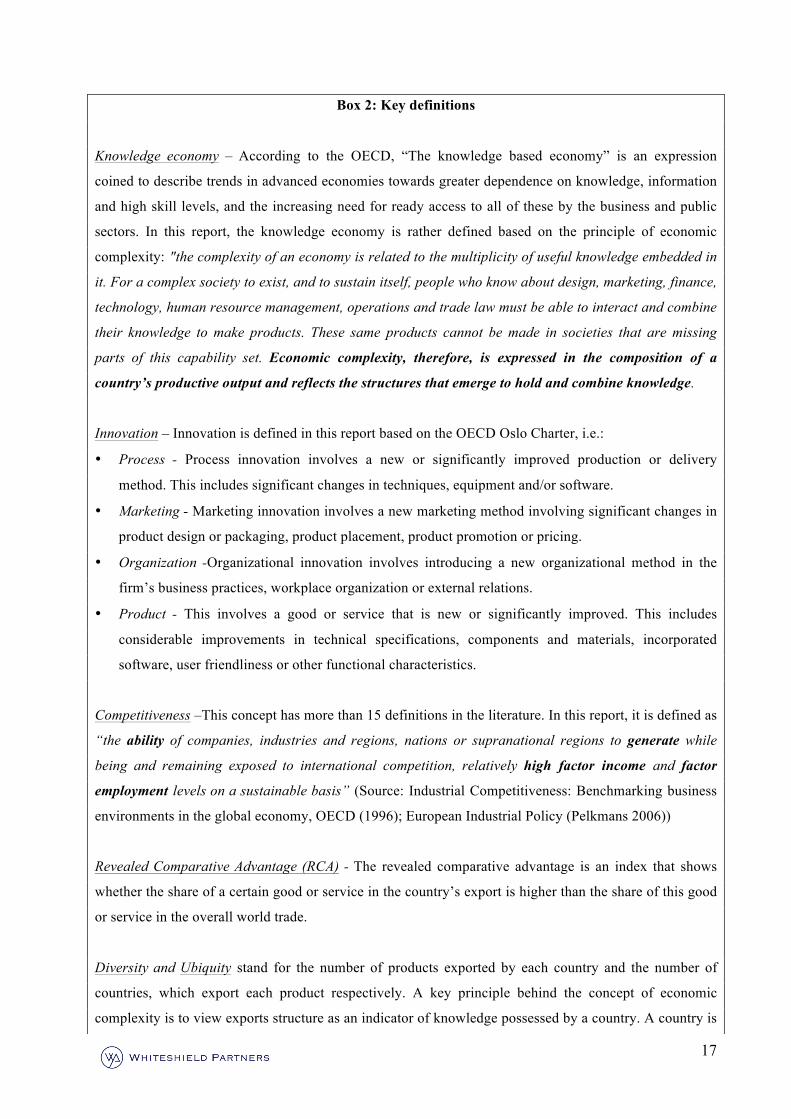
Box 2: Key definitions
Knowledge economy – According to the OECD, “The knowledge based economy” is an expression
coined to describe trends in advanced economies towards greater dependence on knowledge, information
and high skill levels, and the increasing need for ready access to all of these by the business and public
sectors. In this report, the knowledge economy is rather defined based on the principle of economic
complexity: "the complexity of an economy is related to the multiplicity of useful knowledge embedded in
it. For a complex society to exist, and to sustain itself, people who know about design, marketing, finance,
technology, human resource management, operations and trade law must be able to interact and combine
their knowledge to make products. These same products cannot be made in societies that are missing
parts of this capability set. Economic complexity, therefore, is expressed in the composition of a
country’s productive output and reflects the structures that emerge to hold and combine knowledge.
Innovation – Innovation is defined in this report based on the OECD Oslo Charter, i.e.:
• Process - Process innovation involves a new or significantly improved production or delivery
method. This includes significant changes in techniques, equipment and/or software.
• Marketing - Marketing innovation involves a new marketing method involving significant changes in
product design or packaging, product placement, product promotion or pricing.
• Organization -Organizational innovation involves introducing a new organizational method in the
firm’s business practices, workplace organization or external relations.
• Product - This involves a good or service that is new or significantly improved. This includes
considerable improvements in technical specifications, components and materials, incorporated
software, user friendliness or other functional characteristics.
Competitiveness –This concept has more than 15 definitions in the literature. In this report, it is defined as
“the ability of companies, industries and regions, nations or supranational regions to generate while
being and remaining exposed to international competition, relatively high factor income and factor
employment levels on a sustainable basis” (Source: Industrial Competitiveness: Benchmarking business
environments in the global economy, OECD (1996); European Industrial Policy (Pelkmans 2006))
Revealed Comparative Advantage (RCA) - The revealed comparative advantage is an index that shows
whether the share of a certain good or service in the country’s export is higher than the share of this good
or service in the overall world trade.
Diversity and Ubiquity stand for the number of products exported by each country and the number of
countries, which export each product respectively. A key principle behind the concept of economic
complexity is to view exports structure as an indicator of knowledge possessed by a country. A country is
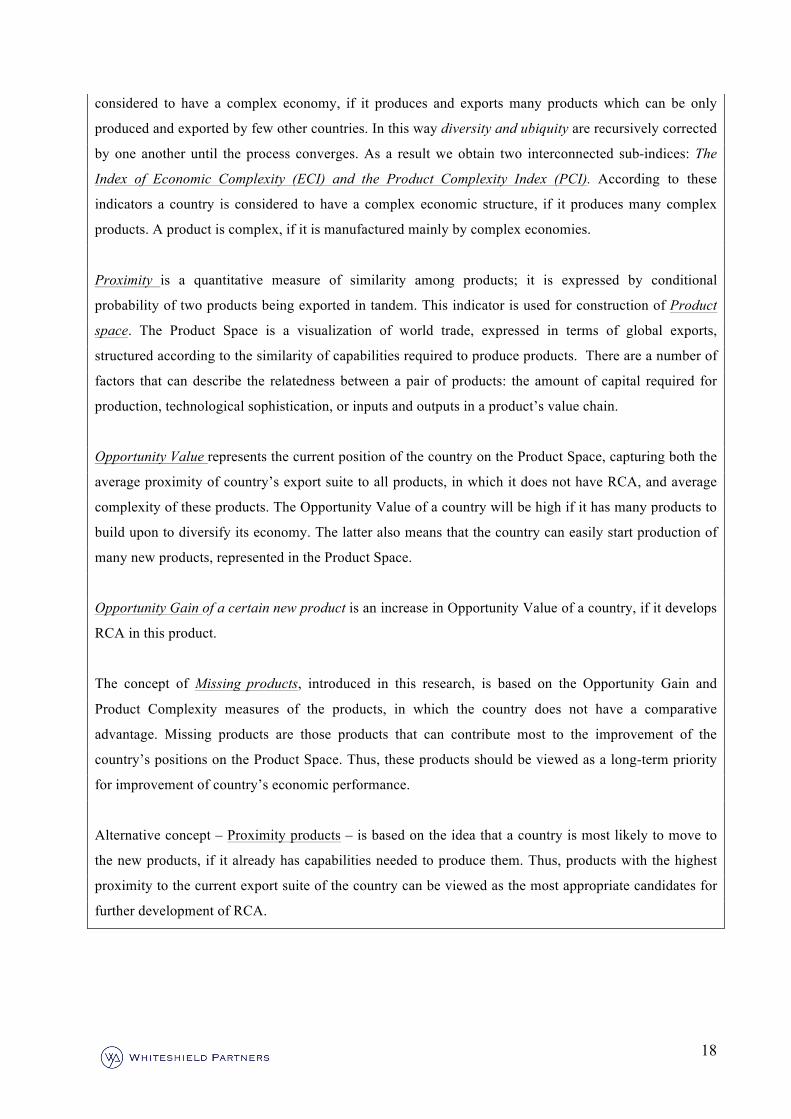
18
considered to have a complex economy, if it produces and exports many products which can be only
produced and exported by few other countries. In this way diversity and ubiquity are recursively corrected
by one another until the process converges. As a result we obtain two interconnected sub-indices: The
Index of Economic Complexity (ECI) and the Product Complexity Index (PCI). According to these
indicators a country is considered to have a complex economic structure, if it produces many complex
products. A product is complex, if it is manufactured mainly by complex economies.
Proximity is a quantitative measure of similarity among products; it is expressed by conditional
probability of two products being exported in tandem. This indicator is used for construction of Product
space. The Product Space is a visualization of world trade, expressed in terms of global exports,
structured according to the similarity of capabilities required to produce products. There are a number of
factors that can describe the relatedness between a pair of products: the amount of capital required for
production, technological sophistication, or inputs and outputs in a product’s value chain.
Opportunity Value represents the current position of the country on the Product Space, capturing both the
average proximity of country’s export suite to all products, in which it does not have RCA, and average
complexity of these products. The Opportunity Value of a country will be high if it has many products to
build upon to diversify its economy. The latter also means that the country can easily start production of
many new products, represented in the Product Space.
Opportunity Gain of a certain new product is an increase in Opportunity Value of a country, if it develops
RCA in this product.
The concept of Missing products, introduced in this research, is based on the Opportunity Gain and
Product Complexity measures of the products, in which the country does not have a comparative
advantage. Missing products are those products that can contribute most to the improvement of the
country’s positions on the Product Space. Thus, these products should be viewed as a long-term priority
for improvement of country’s economic performance.
Alternative concept – Proximity products – is based on the idea that a country is most likely to move to
the new products, if it already has capabilities needed to produce them. Thus, products with the highest
proximity to the current export suite of the country can be viewed as the most appropriate candidates for
further development of RCA.
19
Chapter One
Knowledge Economy Review: High potential to
develop a knowledge-based economy
20
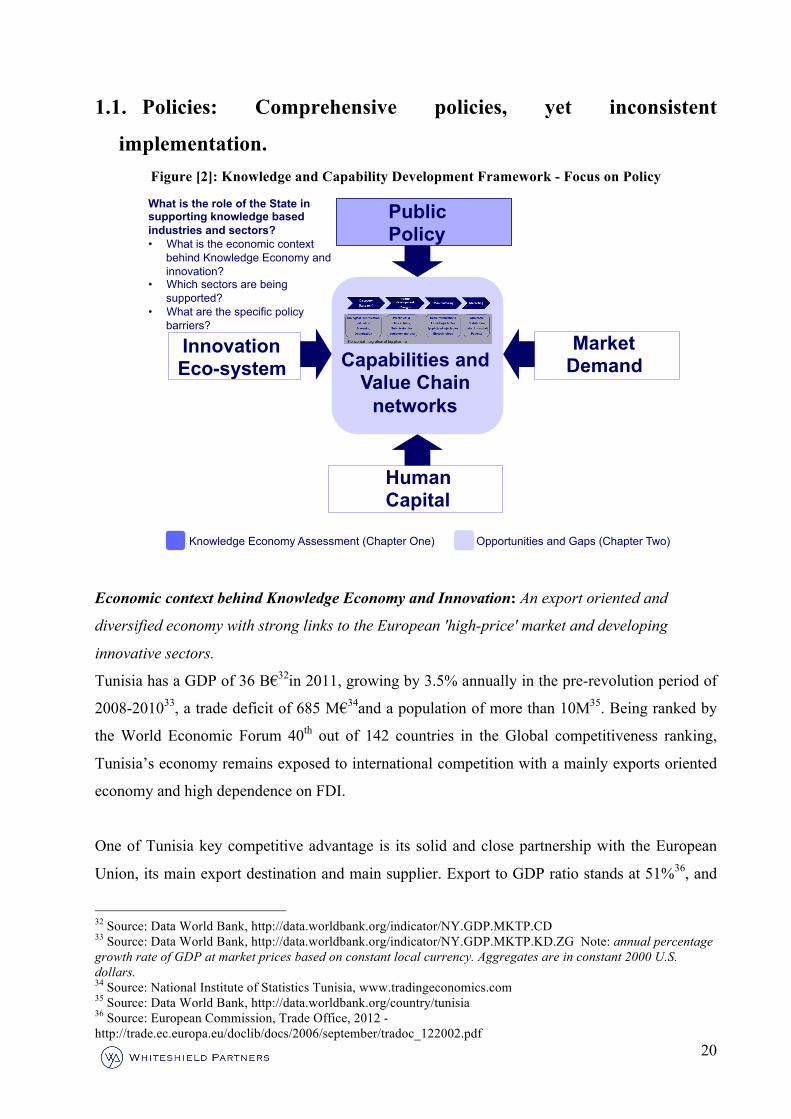
1.1. Policies: Comprehensive policies, yet inconsistent
implementation. Figure [2]: Knowledge and Capability Development Framework - Focus on Policy
Economic context behind Knowledge Economy and Innovation: An export oriented and
diversified economy with strong links to the European 'high-price' market and developing
innovative sectors.
Tunisia has a GDP of 36 B€32in 2011, growing by 3.5% annually in the pre-revolution period of
2008-201033, a trade deficit of 685 M€34and a population of more than 10M35. Being ranked by
the World Economic Forum 40th out of 142 countries in the Global competitiveness ranking,
Tunisia’s economy remains exposed to international competition with a mainly exports oriented
economy and high dependence on FDI.
One of Tunisia key competitive advantage is its solid and close partnership with the European
Union, its main export destination and main supplier. Export to GDP ratio stands at 51%36, and
32 Source: Data World Bank, http://data.worldbank.org/indicator/NY.GDP.MKTP.CD 33 Source: Data World Bank, http://data.worldbank.org/indicator/NY.GDP.MKTP.KD.ZG Note: annual percentage growth rate of GDP at market prices based on constant local currency. Aggregates are in constant 2000 U.S. dollars. 34 Source: National Institute of Statistics Tunisia, www.tradingeconomics.com 35 Source: Data World Bank, http://data.worldbank.org/country/tunisia 36 Source: European Commission, Trade Office, 2012 - http://trade.ec.europa.eu/doclib/docs/2006/september/tradoc_122002.pdf
Innovation Eco-system
Human Capital
Market Demand Capabilities and
Value Chain networks
Knowledge Economy Assessment (Chapter One) Opportunities and Gaps (Chapter Two)
What is the role of the State in supporting knowledge based industries and sectors? • What is the economic context
behind Knowledge Economy and innovation?
• Which sectors are being supported?
• What are the specific policy barriers?
Public Policy
21
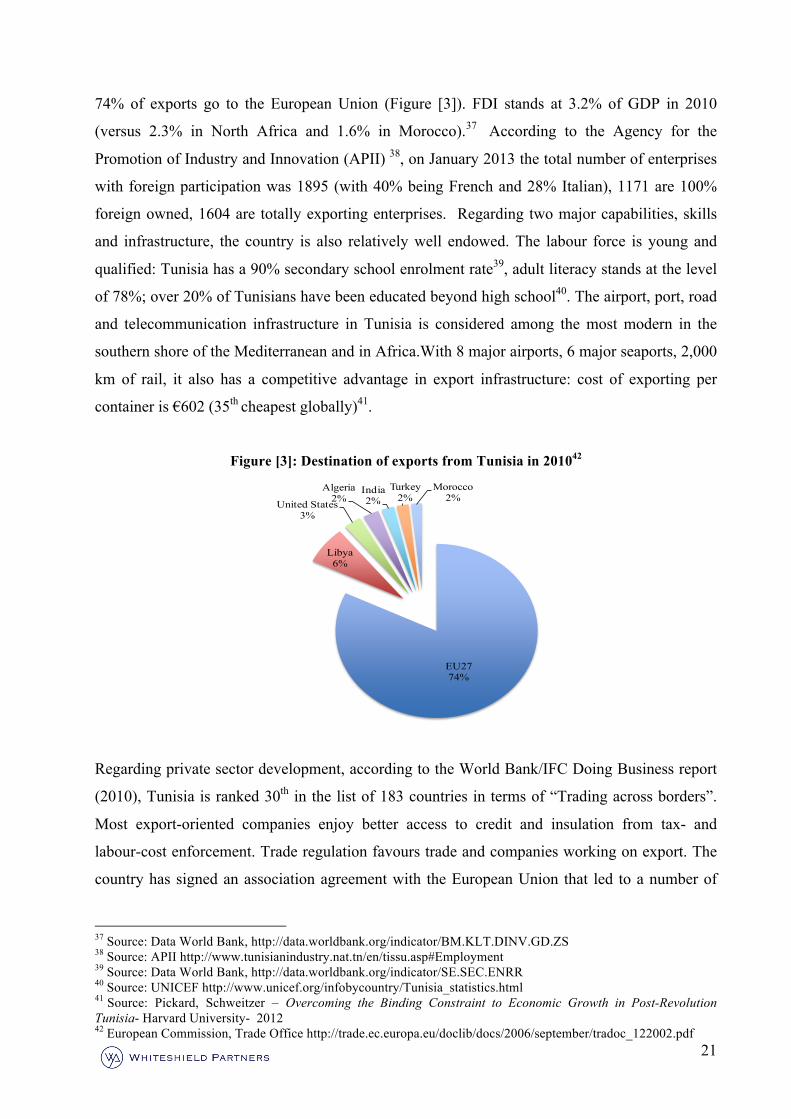
74% of exports go to the European Union (Figure [3]). FDI stands at 3.2% of GDP in 2010
(versus 2.3% in North Africa and 1.6% in Morocco).37 According to the Agency for the
Promotion of Industry and Innovation (APII) 38, on January 2013 the total number of enterprises
with foreign participation was 1895 (with 40% being French and 28% Italian), 1171 are 100%
foreign owned, 1604 are totally exporting enterprises. Regarding two major capabilities, skills
and infrastructure, the country is also relatively well endowed. The labour force is young and
qualified: Tunisia has a 90% secondary school enrolment rate39, adult literacy stands at the level
of 78%; over 20% of Tunisians have been educated beyond high school40. The airport, port, road
and telecommunication infrastructure in Tunisia is considered among the most modern in the
southern shore of the Mediterranean and in Africa.With 8 major airports, 6 major seaports, 2,000
km of rail, it also has a competitive advantage in export infrastructure: cost of exporting per
container is €602 (35th cheapest globally)41.
Figure [3]: Destination of exports from Tunisia in 201042
Regarding private sector development, according to the World Bank/IFC Doing Business report
(2010), Tunisia is ranked 30th in the list of 183 countries in terms of “Trading across borders”.
Most export-oriented companies enjoy better access to credit and insulation from tax- and
labour-cost enforcement. Trade regulation favours trade and companies working on export. The
country has signed an association agreement with the European Union that led to a number of
37 Source: Data World Bank, http://data.worldbank.org/indicator/BM.KLT.DINV.GD.ZS 38 Source: APII http://www.tunisianindustry.nat.tn/en/tissu.asp#Employment 39 Source: Data World Bank, http://data.worldbank.org/indicator/SE.SEC.ENRR 40 Source: UNICEF http://www.unicef.org/infobycountry/Tunisia_statistics.html 41 Source: Pickard, Schweitzer – Overcoming the Binding Constraint to Economic Growth in Post-Revolution Tunisia- Harvard University- 2012 42 European Commission, Trade Office http://trade.ec.europa.eu/doclib/docs/2006/september/tradoc_122002.pdf
EU2774%
Libya6%
United States3%
Algeria2%
India2%
Turkey 2%
Morocco2%
22
initiatives including: free trade area since January 2008, preferential trade agreements with North
African and Middle-East countries, bilateral agreements establishing a free trade zone with
Turkey, Egypt, Morocco, Jordan, Iraq and Libya and the Agadir free trade agreement between
Jordan, Egypt, Morocco and Tunisia43.
Box [3]: Trade agreements well in place44
Geographically part of Africa but culturally more Mediterranean and Middle Eastern, Tunisia has
extremely close ties with Europe. These ties have been reinforced by Tunisia’s Association Agreement
with the European Union (EU), leading to the creation a free trade zone for industrial products in January
2008.
A founding member of the WTO: Tunisia has concluded trade agreements with 60 countries, some of
which provide for preferential trade arrangements, including bilateral Agreement with the EU, bilateral
and multilateral agreements with the members of the Arab League, and an agreement with Turkey.
Greater Arab Free Trade Area (GAFTA): The executive program of the Convention on the Facilitation
and Development of Inter-Arab Trade entered into force in January 1998; it is currently being applied by
17 of the 22 members of the League of Arab States. Consequently, Tunisia has granted duty-free access to
all products originating from these 17 countries.
Arab-Mediterranean Free Trade Agreement (“Agadir Agreement”): On 25 February 2004, Tunisia,
together with Egypt, Jordan and Morocco, signed a free trade agreement known as the Arab-
Mediterranean Free Trade Agreement (or "Agadir Agreement"). Like GAFTA, the Agreement provides
for the elimination of almost all customs duties and charges having an equivalent effect on the bilateral
trade between parties.
Free Trade Agreement with EFTA: In December 2004, Tunisia signed bilateral free trade agreements
on trade in non-agricultural products with the Member States of the European Free Trade Association
(EFTA). Bilateral protocols of agreement with each of these countries on agriculture, fish farming and
agri-food are annexed to these agreements.
Generalized System of Preferences (GSP): Tunisia benefits, on a non-reciprocal basis, from
concessions granted by countries such as Australia, Belarus, Bulgaria, Canada, the Czech and Slovak
43 Source: FIPA Tunisia http://www.investintunisia.tn/site/en/article.php?id_article=784 44 Source: WTO, USA Department of Commerce (Doing Business in Tunisia 2012)
23
Republics, the European Union, Hungary, Japan, New Zealand, Poland, Russia, Switzerland, and the
United States. In these countries, Tunisian exports are granted exemption from customs duties.
Many international donors are today present in Tunisia, with increasing activities in the last two
years i.e. from 2010 to 2012 due to an openness of the government to political reform and
economic liberalization. Main international donors are the World Bank, European Commission,
UNDP, the African Development Bank and bilateral donors.
Box [4]: The Donor community in Tunisia
In 2011, Tunisia received 505 M€ net ODA (Official Development Assistance) 45 vs. 951M€ for Morocco
and 160 M€ for Algeria. ODA is defined as « Flows of official financing administered with the promotion
of the economic development and welfare of the developing countries as the main objective, and which
are concessional in character with a grant element of at least 25 percent (using a fixed 10 percent rate of
discount). By convention, ODA flows comprise contributions of donor government agencies, at all levels,
to developing countries (“bilateral ODA”) and to multilateral institutions. ODA receipts comprise
disbursements by bilateral donors and multilateral institutions ».46However, despite the high amount of
ODA received Tunisia is not considered as aid dependent, with net ODA received accounting for only
1.3% of GNI in 2010 vs. 4.2% in Sub-Saharan Africa region and 13.2% in Central African Republic 47. It
remains higher than MENA countries – 0.5% of GNI 48- but this difference needs to be reduced since
other countries in MENA region, except from Morocco – 1.1% of GNI in 201049 - are not considered as
safe and thus don’t attract foreign donors.
The European Union promotes democracy in the country mainly through the bilateral European
Neighborhood Policy (ENP) action plans. France is the largest bilateral donor in Tunisia with 230 M€ of
gross ODA for 2010-2011 average, followed by EU institutions with 105 M€, Spain with 96 M€, Japan
with 87M€, the AFESD (Arab Fund for Economic and Social Development) with 73 M€50. Leading areas
of interest for the donor community in Tunisia are infrastructure and services (almost 30%), multisector
(26%) and education (20%)51.
The Tunisian government has also joined the Paris Declaration on Aid Effectiveness (2005) aimed at
laying out a “practical action-oriented roadmap to improve the quality of aid and its impact on
development [by putting in place] a series of specific implementation measures and [establishing] a
45 Source : OECD Aid Statistics « Development Aid At A Glance – Statistics by Region »,2012 http://www.oecd.org/dac/aidstatistics/1882353.gif 46 Source : OECD - Glossary of Statistical Terms - ODA 47 Source :http://data.worldbank.org/indicator/DT.ODA.ODAT.GN.ZS, http://datamarket.com/data/set/143q/net-oda-received-of-gni#!display=line&ds=143q!g4w=q.51.56.41&s=apj 48 Source :http://data.worldbank.org/indicator/DT.ODA.ODAT.GN.ZS 49 Source :http://data.worldbank.org/indicator/DT.ODA.ODAT.GN.ZS 50 Source :http://www.oecd.org/dac/aidstatistics/1883155.gif 51 Source :http://www.oecd.org/dac/aidstatistics/1883155.gif
24
monitoring system to assess progress and ensure that donors and recipients hold each other accountable
for their commitments”. 52
Several foreign initiatives promote innovation in Tunisia. One of the most relevant being the Souk At-
tanmia, an innovative pilot partnership between the African Development Bank, the British council, the
United States of America and the public and private sectors and associations53. The main objective is to
foster innovative projects of young entrepreneurs.
The European Investment Bank (EIB) is one of the oldest and largest actors of the donor community in
Tunisia. The Bank works closely with the public sector, which has a strong weight in the Tunisian
economy. EIB invests mainly in large infrastructure and logistics projects (roads, railways, ports,
transport, electricity production, transmission, downstream transmission of water and gas) but also in
knowledge economy infrastructure projects. The Bank participated in recent knowledge economy
projects, such as support in the construction of technoparks (including planning, strategic approach to
construction, financing with lines of credit to Tunisian banks to finance loans to companies active in the
construction of technoparks). EIB also provides funds to banks and leasing companies. The bank also
provides technical assistance for projects that they finance. It is mostly limited to training and coaching,
and is always project-related.
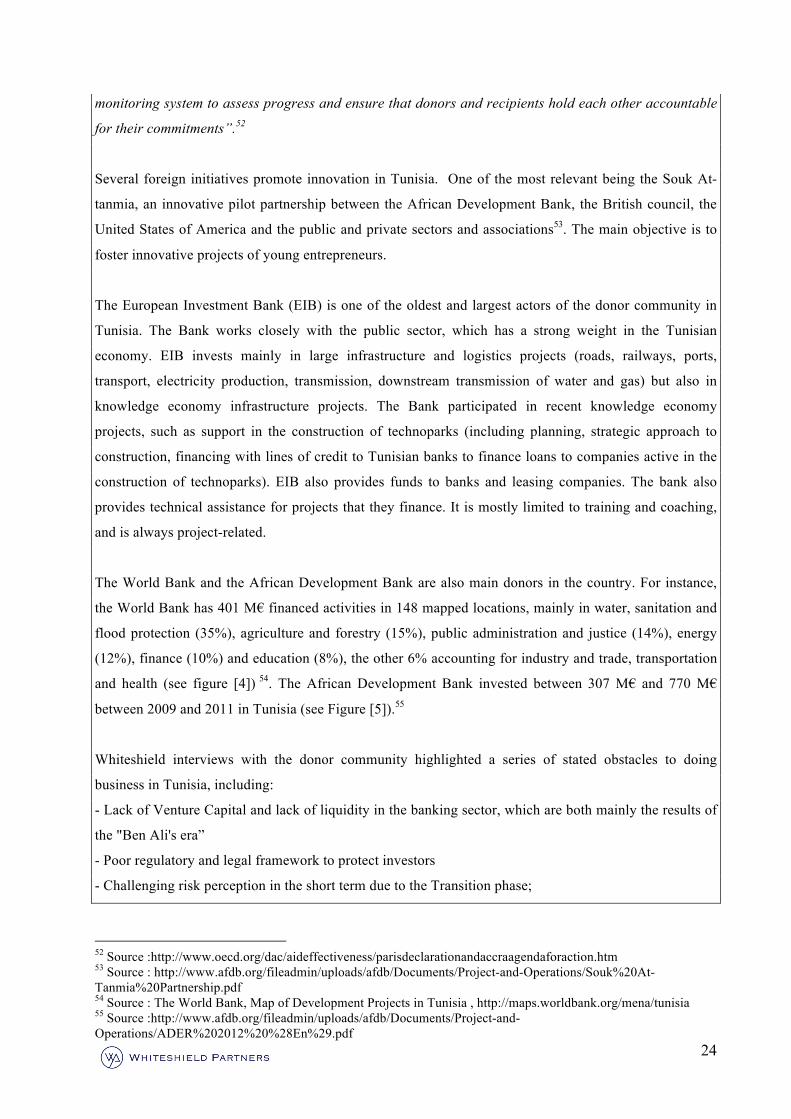
The World Bank and the African Development Bank are also main donors in the country. For instance,
the World Bank has 401 M€ financed activities in 148 mapped locations, mainly in water, sanitation and
flood protection (35%), agriculture and forestry (15%), public administration and justice (14%), energy
(12%), finance (10%) and education (8%), the other 6% accounting for industry and trade, transportation
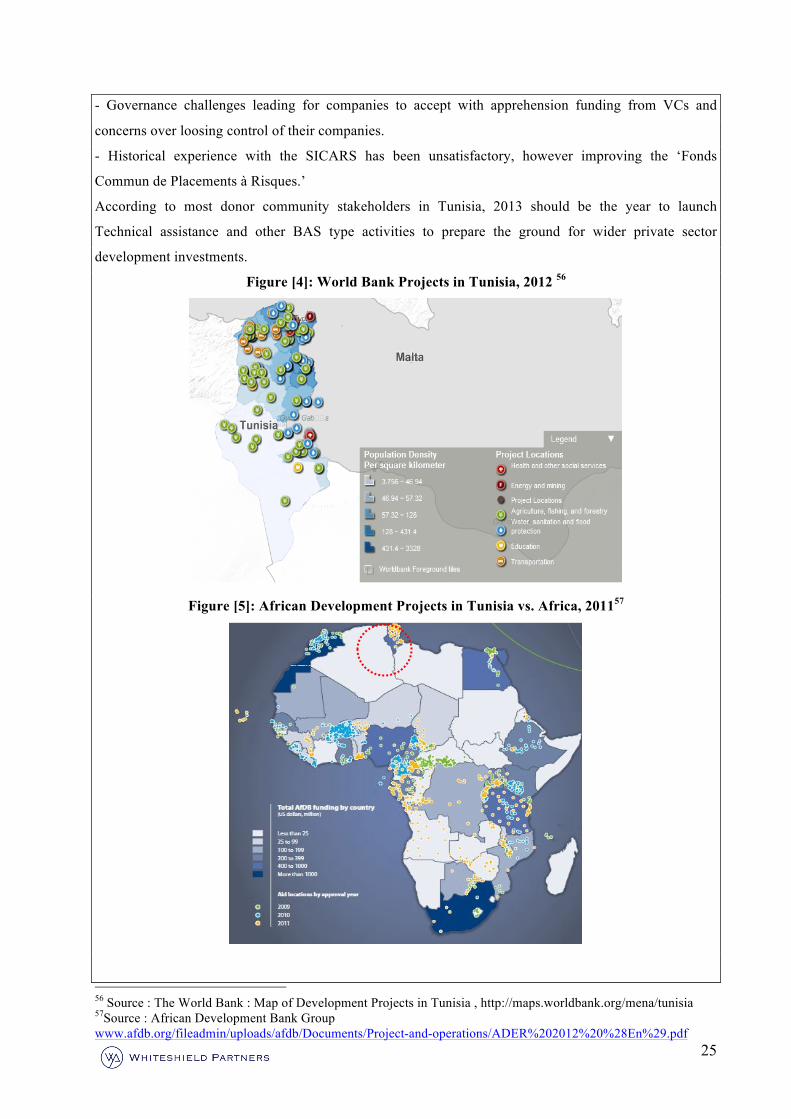
and health (see figure [4]) 54. The African Development Bank invested between 307 M€ and 770 M€
between 2009 and 2011 in Tunisia (see Figure [5]).55
Whiteshield interviews with the donor community highlighted a series of stated obstacles to doing
business in Tunisia, including:
- Lack of Venture Capital and lack of liquidity in the banking sector, which are both mainly the results of
the "Ben Ali's era”
- Poor regulatory and legal framework to protect investors
- Challenging risk perception in the short term due to the Transition phase;
52 Source :http://www.oecd.org/dac/aideffectiveness/parisdeclarationandaccraagendaforaction.htm 53 Source : http://www.afdb.org/fileadmin/uploads/afdb/Documents/Project-and-Operations/Souk%20At-Tanmia%20Partnership.pdf 54 Source : The World Bank, Map of Development Projects in Tunisia , http://maps.worldbank.org/mena/tunisia 55 Source :http://www.afdb.org/fileadmin/uploads/afdb/Documents/Project-and-Operations/ADER%202012%20%28En%29.pdf
25
- Governance challenges leading for companies to accept with apprehension funding from VCs and
concerns over loosing control of their companies.
- Historical experience with the SICARS has been unsatisfactory, however improving the ‘Fonds
Commun de Placements à Risques.’
According to most donor community stakeholders in Tunisia, 2013 should be the year to launch
Technical assistance and other BAS type activities to prepare the ground for wider private sector
development investments.
Figure [4]: World Bank Projects in Tunisia, 2012 56
Figure [5]: African Development Projects in Tunisia vs. Africa, 201157
56 Source : The World Bank : Map of Development Projects in Tunisia , http://maps.worldbank.org/mena/tunisia 57Source : African Development Bank Group www.afdb.org/fileadmin/uploads/afdb/Documents/Project-and-operations/ADER%202012%20%28En%29.pdf
26
The Government has increased its focus on innovation driven sectors: ICT, Electric and
mechanic industry and Chemicals, supporting both on-shoring and off-shoring businesses.
According to the Strategic Social and Economic Development Plan 2012-2016 (Box [5]) the
economic strategy of the country is aimed at upgrading its historical industrial sectors, such as
textiles and agro-business, and promoting the development of new sectors such as electronics,
automotive, aeronautics, pharmaceuticals and ICT.
Box [5]: Strategic Social and Economic Development Plan of Tunisia 2012-2016:
Key areas of focus to support innovation58
According to the above plan, the following areas are a priority for the country to support innovation: “The
reforms will be directed towards development of the national innovation system through the integration of
innovation factor in the production process, which requires intensive use of technology and investment in
human capital and the development of research and development system through the creation of clusters
in promising sectors and the development of partnerships between universities, companies and research
centers. In addition, creating technologic zones to attract investment in high technological value activities
such as biotechnology, ICT, electronics industry, aircraft components and renewable energy.”
Tunisian export-oriented industries, such as Textile or Electric and Electronic Industries (EEI),
are facing strong competition from low labour cost countries such as China, India or Eastern
European countries. To raise the competiveness of national producers and boost innovation the
State has introduced several measures, including the “Horizon 2016 plan” aimed at supporting
the private sector efforts in three areas: R&D development policy, innovation incentives and
creation of new technopoles. In 2010, framework for knowledge economy development was
characterized by:
- Developing R&D infrastructure: 30 research centers, more than 139 laboratories and
more than 638 research units in which almost 16,000 researchers are employed;
Numerous incentives such as the Federated Research Programs or the young researcher
incentive programs.
58Source: Ministry of Finance Tunisia “Social and Economic program”, 2011
27
- Increasing cooperation between private sector and research centers trough incentives to
stimulate innovation: National Program of Research and Innovation; Valorization of
Research Results; National modernization program for industry; PIRD (Premium of
Investment for R&D); PTI (Priority Technological Investment).
- Creating several competitive clusters dedicated to the main traditional sectors
(agriculture cluster in Bizerte, textile cluster in Monastir) and emerging sectors (ICT in
Elgazala Technopark, EEI sector in Sousse).
Beyond horizontal strategies, the following sectors are actively supported by the State through
different policies:
The ICT sector is positioned at the heart of the national development plan. Being ranked 50th in
the Global Information Technology Report 2012 (World Economic Forum) with a 4.12 score
(versus 91th place for Morocco and 118th place for Algeria), Tunisia leads the rankings in North
Africa. The ICT sector development in the country is being led by a strong commitment of the
government to boost the growth of this sector. According to the transition government: “The
development of services sector is a high priority that requires the need to accelerate the sector
rehabilitation, liberalization of service activities and support services in promising areas of ICT
and offshoring activities”.59
In order to develop the sector, a number of reforms were put in place including: modernisation of
the digital infrastructure, support of the private sector, development of human capital through
education reforms and Continuous Education and Training in the area of ICT.
“Infant industries” – Pharmaceutical and Automotive sectors – are relatively protected from
international competition. Passenger cars and pharmaceuticals are the major categories affected
by import restrictions. Importers have to request an allotment from the Government of Tunisia in
order to receive an import license. Although there were announcements in 2011, that the quota
would be abolished, the Tunisian government has not yet done so officially. Tunisia also
continues to protect its domestic pharmaceutical industry. The Pharmacy Centre, a government
entity, controls all pharmaceutical imports and applies the "correlation” system under which,
upon request from a Tunisian pharmaceutical manufacturer, the import of a foreign drug similar
to the one produced locally could be banned. The Government of Tunisia issued a decree
officially dismissing the "correlation" system on December 31st, 2006. However, this decree is
59 Source: Ministry of Finance Tunisia “Social and Economic program”, 2011
28
not retroactive; therefore pharmaceutical products on the correlation list prior to December 31st,
2006 are still banned for imports. In addition, imported goods in Tunisia are also subject to value
added tax (VAT).60
The Tunisian Association of Aerospace and Aviation Industries (GITAS) supports manufacturers
and investors in the Aerospace branch. There were 33 member companies in 2012 (compared to
19 in 2009). GITAS is very active and present at all levels; its objective is three fold: (a) to
promote exchanges and cooperation between companies of the aviation and aerospace sector
located in Tunisia, (b) to develop a logistics network and an enabling environment (c) and
encourage the establishment of new companies in the field61.
In order to develop the Chemical sector, several measures were implemented, such as incentives
and increased collaboration between foreign and domestic laboratories, establishing clusters and
developing infrastructures. Several foreign companies are investing in Tunisia – the Algerian
company KIMIAL, the Saudi company AL Zamel Group, Indian companies GFCL and GSFC.
The government is stimulating Offshoring.62 With the promulgation of the Investment Incentives
Code in 1993, strengthening the offshore regime, firms engaged wholly in export were eligible
for numerous advantages, including:
- Advantageous taxation: no VAT for payments received from abroad, no tax on income,
tax exemption for profits derived from export during the first 10 years, banking secrecy;
- Ease of capital movement with guarantee for transferring dividends in full (no tax on
income is requested from the country of origin under the principle of Double Taxation).
The taxation agreement has been signed with several countries in Europe - France,
Belgium, Germany, Austria, Norway, Italy, Denmark, Sweden, Spain, UK, Poland,
Switzerland, Netherlands and Malta-, with Arab countries – Morocco, Libya, Algeria,
UMA, Egypt, UAE, Jordan, Iraq, Kuwait – and with Canada, Senegal, USA, Korea,
South African, Iran and Mali63;
- Ease of doing business: only one person needed to incorporate a company and
registration in only 72 hours;
60 Note: Tunisia's basic VAT rates are 18%, 12%, and 6%, with the majority of goods covered by the 18% rate. Source: WTO, USA Department of Commerce (Doing Business in Tunisia 2012) 61 Source: FIPA Tunisia: a performing aerospace supply chain http://www.investintunisia.tn/document/573.ang.pdf 62 Source : Foreign Investment Promotion Agency (FIPA) http://www.investintunisia.tn/site/en/article.php?id_article=789 63 Source : International Labour Organization 2011
29
- Minimum requirements for opening business: a minimum capital of only €500 to
incorporate a business.
According to African Development Bank 201264, offshoring represented more than 48% of the
manufacturing sector in 2011. The textile industry is largely dominated by the offshore sector
(84% of textile companies); followed by electronics and electrics industry (65% of electronics
and electrics-related companies). The offshore regime has successfully attracted FDI and
contributed to developing a competitive manufacturing industry; 85% of companies’ foreign
participation are in the offshore regime, and 61% of them are wholly owned by foreigners. Most
FDI inflows are under the offshore regime, while the onshore regime is relatively neglected.
Specific policy barriers need to be addressed much further including an opaque financial
system and tax environment, low access to credit, lack of legal regulation (including property
right, intellectual right, investment regulation), significant mismatch between higher education
offer and private sector needs, inefficient offshoring strategy and State strategy yet to be
developed and implemented further65.
Policy barriers were first identified through primary research then validated with secondary
research. Primary research conducted among Tunisian private and public stakeholders reveals
the following:
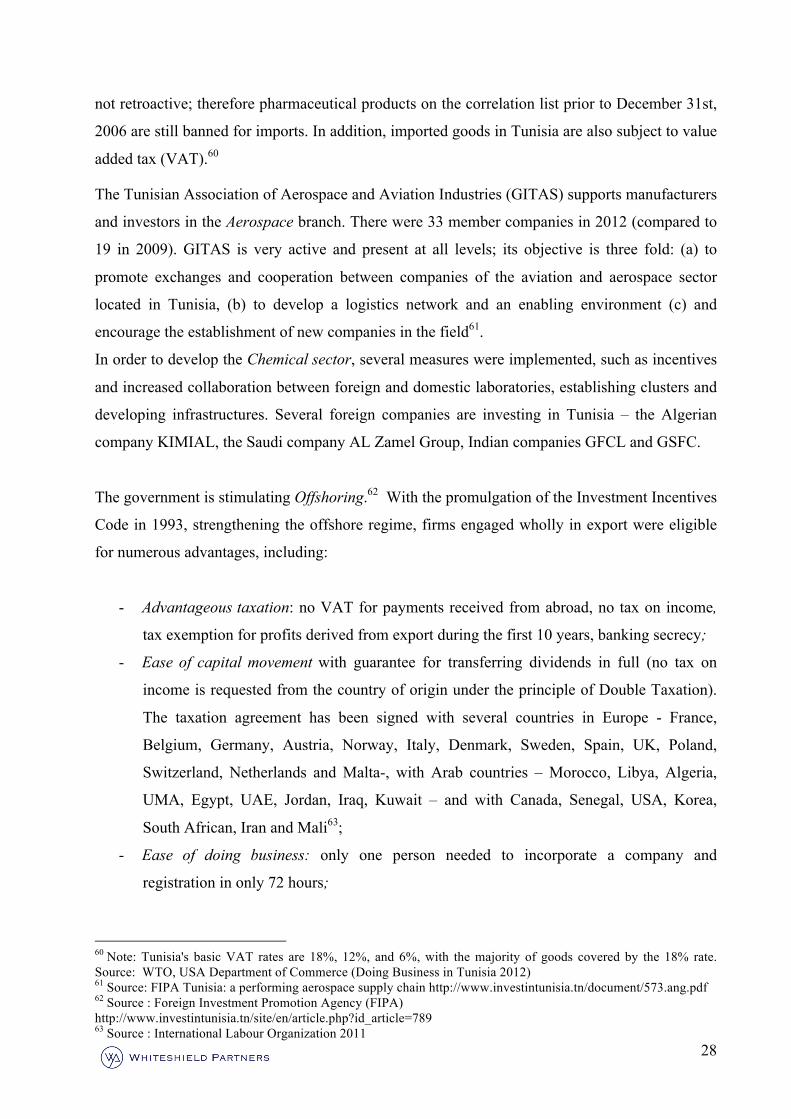
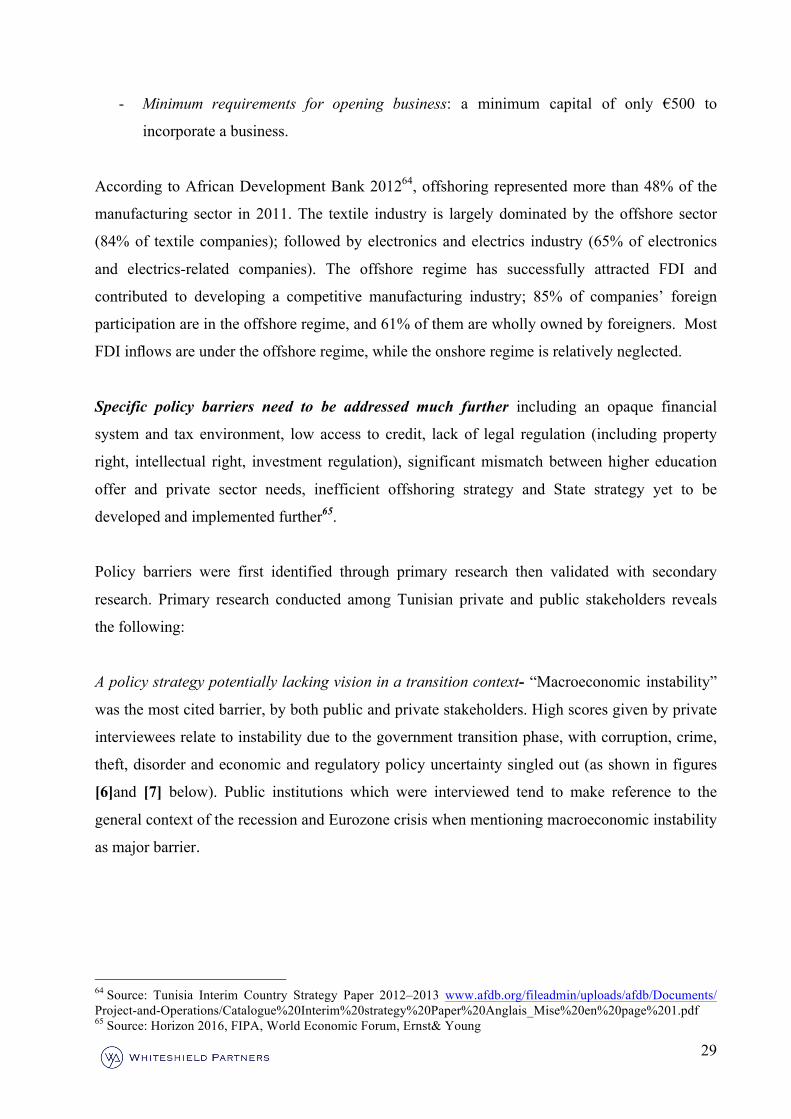
A policy strategy potentially lacking vision in a transition context- “Macroeconomic instability”
was the most cited barrier, by both public and private stakeholders. High scores given by private
interviewees relate to instability due to the government transition phase, with corruption, crime,
theft, disorder and economic and regulatory policy uncertainty singled out (as shown in figures
[6]and [7] below). Public institutions which were interviewed tend to make reference to the
general context of the recession and Eurozone crisis when mentioning macroeconomic instability
as major barrier.
64 Source: Tunisia Interim Country Strategy Paper 2012–2013 www.afdb.org/fileadmin/uploads/afdb/Documents/ Project-and-Operations/Catalogue%20Interim%20strategy%20Paper%20Anglais_Mise%20en%20page%201.pdf 65 Source: Horizon 2016, FIPA, World Economic Forum, Ernst& Young
30
Figure [6]: Capability Survey 2012: Answers to the question related to barriers to the development
of the knowledge economy. Question: What are the Barriers to innovation in Tunisia?66
Figure [7]: Capability survey 2012 : Rating of major political environment barriers related to the
development of the knowledge economy in Tunisia(1: not major barrier, 5: major barrier).67
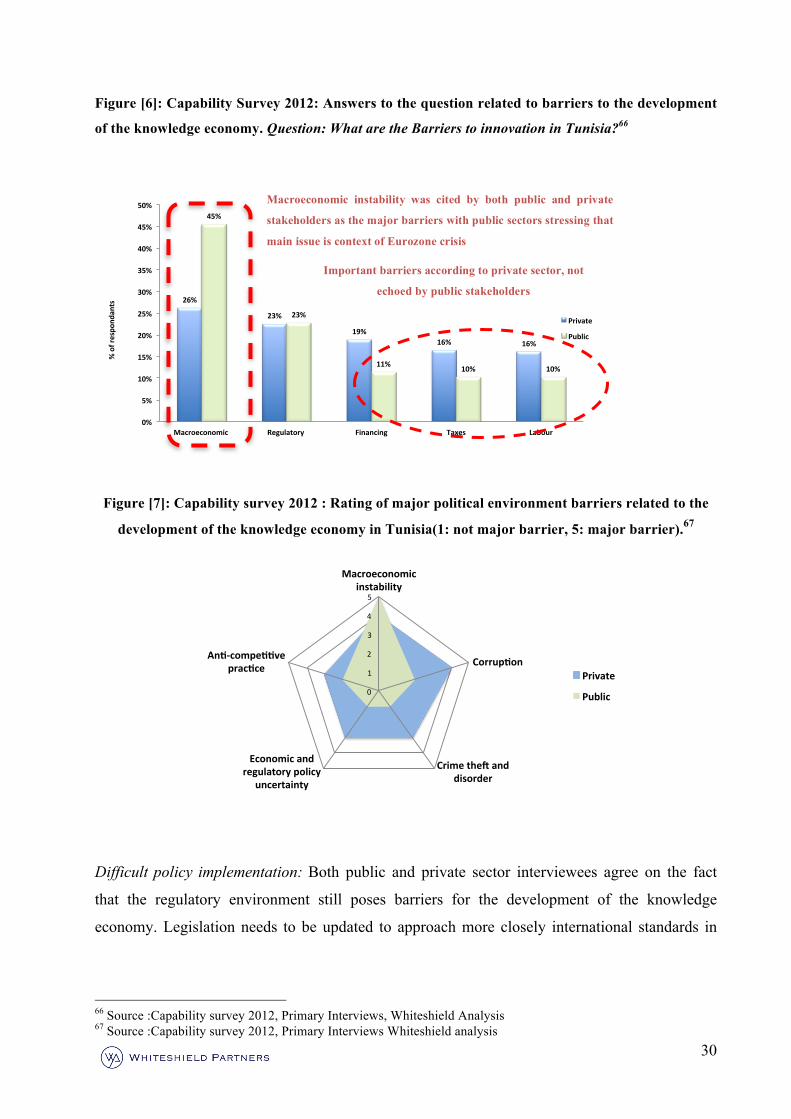
Difficult policy implementation: Both public and private sector interviewees agree on the fact
that the regulatory environment still poses barriers for the development of the knowledge
economy. Legislation needs to be updated to approach more closely international standards in
66 Source :Capability survey 2012, Primary Interviews, Whiteshield Analysis 67 Source :Capability survey 2012, Primary Interviews Whiteshield analysis
26%$
23%$
19%$16%$ 16%$
45%$
23%$
11%$ 10%$ 10%$
0%$
5%$
10%$
15%$
20%$
25%$
30%$
35%$
40%$
45%$
50%$
Macroeconomic$$ Regulatory$$ Financing$ Taxes$ Labour$
%$of$respo
ndan
ts$
Private$
Public$
0"
1"
2"
3"
4"
5"
Macroeconomic*instability*
Corrup3on*
Crime*the5*and*disorder*
Economic*and*regulatory*policy*
uncertainty*
An3:compe33ve*prac3ce*
Private*
Public*
Macroeconomic instability was cited by both public and private
stakeholders as the major barriers with public sectors stressing that
main issue is context of Eurozone crisis
Important barriers according to private sector, not
echoed by public stakeholders
31
terms of trade policy, access to finance for innovative enterprises, intellectual property rights,
and anti-competitive behavior.
Figure [8]: Capability survey 2012: Rating of major business barriers related to the development of
the Knowledge Economy in Tunisia (1: not major barrier, 5: major barrier)68
Access to finance is an important concern for the private sector. Financial barriers refer mainly to
malfunctionning SICAR (Sociétés d’Investissement en Capital Risque). model that is blocking innovation
instead of promoting it The majority of the Tunisian economy relies mainly on credit banking. Its
limited capacity is a challenge, as credit loans are mainly provided to large projects rather than to
entrepreneurship, and even less so to services. More specifically, financing after company
creation seems to be a major challenge quoted by Venture Capital firms and start-ups.
Fiscal system needs to be harmonized and simplified to support innovation further: Tunisia made
significant progress in this area by reducing its VAT and corporate tax rates (onshore corporate
tax is 35% in 2012), nevertheless there is still room for improvement. Interviews and surveys
conducted highlight that private sector interviewees consider the tax system in Tunisia as being a
major barrier to innovation. Fiscal advantages to companies other than those specialized in
68 Source :Capability survey 2012, Primary Interviews Whiteshield analysis,
0"
1"
2"
3"
4"
5"
Access%to%financing%
Cost%of%financing%
Tax%rates%
Tax%administra4on%
Business%licensing%and%opera4ng%
permits%
Legal%system%and%business%disputes%
Private%
Public%
32
offshoring need to be implemented to harmonize fiscal treatment between onshore and offshore,
and lead companies to exit the “informal economy”.
Primary research findings were validated by the secondary research of existing literature, which
reveals numerous barriers including restrictive labour regulation, opaque commercial tax
environment and banking sector inherited from the previous ‘regime’.
Inefficient labour regulation remains a serious and limiting constraint to human capital
development. There is a significant mismatch between the higher educational offer and market
demands in terms of skills. Unemployment among tertiary educated people is more than fourfold
higher than in OECD countries (23% versus 5%)69.
The Global Competitiveness Report 2011-2012 reveals that firms in the country are dissatisfied
with the soundness of banks (solvency and soundness of balance sheets). Tunisia is indeed
ranked 84th out of 142 countries on this dimension. Moreover, high taxes disadvantage small and
domestic oriented firms, while offshore and export oriented companies enjoy reduced taxes70.
The non-convertibility of the local currency can also disadvantage export driven companies.
Large informal economy and anti-competitive behaviour: According to Pickard and Schweitzer,
[2012], the informal economy represents an estimated 38% of Gross National Products (GNP)
and 28% of GDP. The productive sector is largely controlled by the state. The World Economic
Forum ranked Tunisia 105th among 142 countries by Legal rights Index71.
69 Source: Economic research forum, Pickard Schweitzer – Overcoming the Binding Constraint to Economic Growth in Post-Revolution Tunisia , March 2012 – Harvard University, OECD Database, World Bank 70 Source: Pickard, Schweitzer – Overcoming the Binding Constraint to Economic Growth in Post-Revolution Tunisia- Harvard University- 2012 71 Source: World Economic Forum, Global Competitiveness Report, 2011-2012 http://www.weforum.org/
33
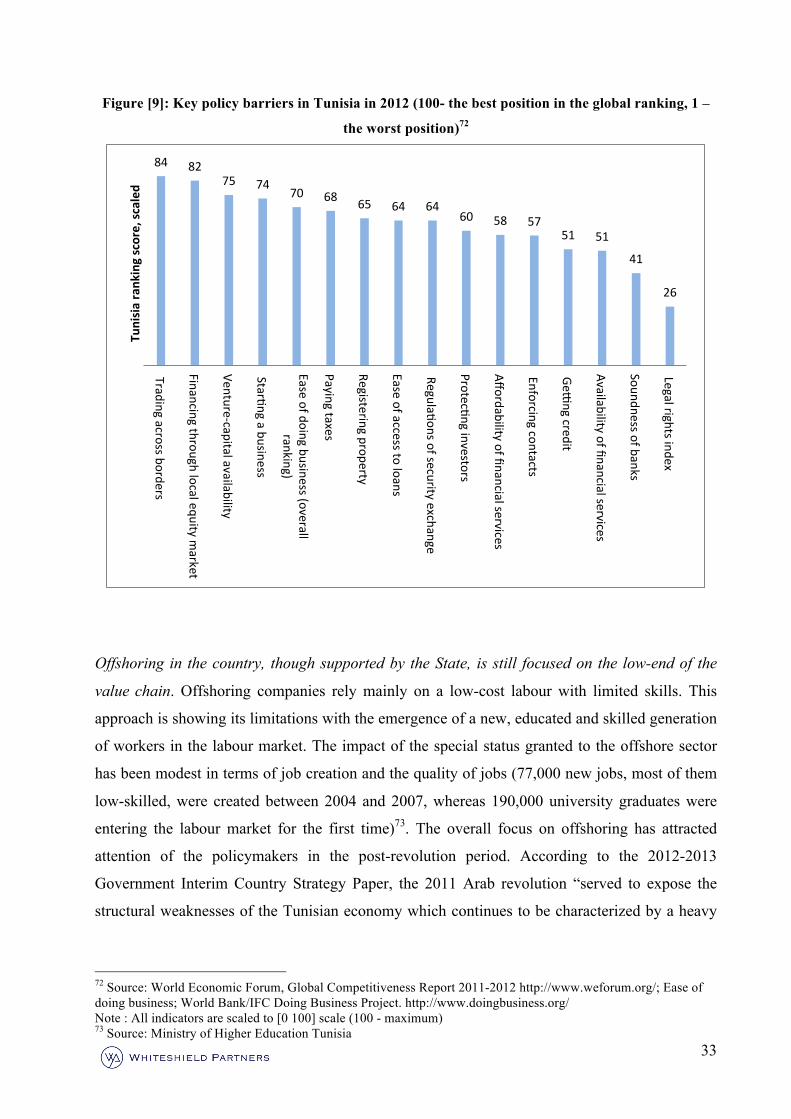
Figure [9]: Key policy barriers in Tunisia in 2012 (100- the best position in the global ranking, 1 –
the worst position)72
Offshoring in the country, though supported by the State, is still focused on the low-end of the
value chain. Offshoring companies rely mainly on a low-cost labour with limited skills. This
approach is showing its limitations with the emergence of a new, educated and skilled generation
of workers in the labour market. The impact of the special status granted to the offshore sector
has been modest in terms of job creation and the quality of jobs (77,000 new jobs, most of them
low-skilled, were created between 2004 and 2007, whereas 190,000 university graduates were
entering the labour market for the first time)73. The overall focus on offshoring has attracted
attention of the policymakers in the post-revolution period. According to the 2012-2013
Government Interim Country Strategy Paper, the 2011 Arab revolution “served to expose the
structural weaknesses of the Tunisian economy which continues to be characterized by a heavy
72 Source: World Economic Forum, Global Competitiveness Report 2011-2012 http://www.weforum.org/; Ease of doing business; World Bank/IFC Doing Business Project. http://www.doingbusiness.org/ Note : All indicators are scaled to [0 100] scale (100 - maximum) 73 Source: Ministry of Higher Education Tunisia
84 82 75 74
70 68 65 64 64 60 58 57
51 51
41
26
Trading across borders
Financing through local equity market
Venture-‐capital availability
StarDng a business
Ease of doing business (overall ranking)
Paying taxes
Registering property
Ease of access to loans
RegulaDons of security exchange
ProtecDng investors
Affordability of financial services
Enforcing contacts
GePng credit
Availability of financial services
Soundness of banks
Legal rights index Tu
nisia rank
ing score, sc
aled
34
dependence on traditional sectors of low added value and a sharp polarization between the
offshore and onshore sectors”74.
Investment policy getting much closer to the world standards: The government is applying to
join the OECD Declaration on International Investments and Multinational Enterprises
highlighting its willingness to engage serious reforms. However, obstacles remain to be
addressed. For example, the first article of the Tunisian investment Code highlights the freedom
to invest both for Tunisians and for foreigners. However, the code remains complex and provides
a lack of transparency for investors. Another example relates to the real estate regime that
presents a number of obstacles, particularly in administrative terms, and imposes restrictions on
foreigners (e.g. access to land ownership for the agricultural sector). There is a need for
increased transparency and regulation to support the knowledge economy.
Box [6]: Financial markets and access to finance: Developing a framework for innovation75
The Tunisian financial market had only 58 enterprises listed by the end of 2012, most of them in the
banking sector, which accounts for 70% of market capitalization. Total market capitalization reached
24% of GDP, with an average daily transaction volume of TND 10.7 million (compared with TND
7.2 million in 2009).
According to IMF 2012 “Tunisia: Financial System Stability Assessment”, as of April 2012, there
were 21 onshore banks, including three large state-owned banks with 37 percent of banking sector
assets; three large private domestic banks with 28 percent of total assets; and six foreign-owned
private banks with a 28 percent share. Of these, four large foreign banks (from France, Jordan, and
Morocco), three are former state-owned banks, only one of which appears to have completed its
restructuring, There are five small development banks, established partially with funds from the Gulf
States, and enjoying universal banking licenses.
The non-bank financial sector accounts for about 20 percent of all financial system assets in 2011.
Tunisia has a small insurance sector, with 19 companies primarily focused on nonlife activities (85
percent of premiums) and annual premiums to GDP of about 2 percent. The equity and fixed-income
74 Source: 2012-2013 Interim Country Strategy Paper, African Development Bank,2011 75 Source: WTO, OECD, Whiteshield interviews and analysis
35
markets are still small, with a market capitalization equal to 24 percent of GDP, lower than in
regional peer countries such as Jordan (112 percent) 76
Foreign investors are allowed to invest in the Tunisian stock exchange: at the end of 2010 they held
more than 20% of the total market capitalization. Tunisia has signed 53 bilateral agreements to
promote and protect investment (33 of which are in force) that guarantee access to international
arbitration for foreign investors. However, little attention has been paid to the mechanisms of
interaction between local SMEs and foreign investors. There is a need for local supplier capacity-
building with the help of the public authorities or the private sector and the publication of a database
of enterprises to facilitate links between local and foreign enterprises.
Investment capital (or private equity) and Venture capital were introduced in Tunisia through
regulations governing "fixed-capital investment companies" (SICAFs). This framework was
reinforced in 1993 with the creation of "risk-capital investment companies" (SICARs). The sector
now has more than 40 SICARs, 20 venture capital funds (fonds communs de placement à risque,
FCPRs), and two start-up funds (fonds d'amorçage).
The Economic and Social Development Strategy 2012-2016 emphasizes the revitalization of the Risk
capital industry in all segments (seed/venture capital, expansion capital, transfer/buyout and
turnaround/mezzanine funds), and proposes an amendment to the investment capital law. That
amendment would broaden and diversify the catalogue of investments, it would lower the tax burden,
and it would prolong the term of investments.
The first Business Angels association was created in June 2011.
Tax system includes a single tax on individual income and on corporate profits. Corporation tax is at
30% as a rule, 10% for companies operating in agriculture, handicrafts and small trades and 35% for
a few limited number of sectors. Value added tax has a key rate of 18%, two reduced rates of 6% for
critical products and 12% for some capital goods and services.
76 IMF 2012 Tunisia: Financial System Stability Assessment http://www.imf.org/external/pubs/ft/scr/2012/cr12241.pdf

36
37
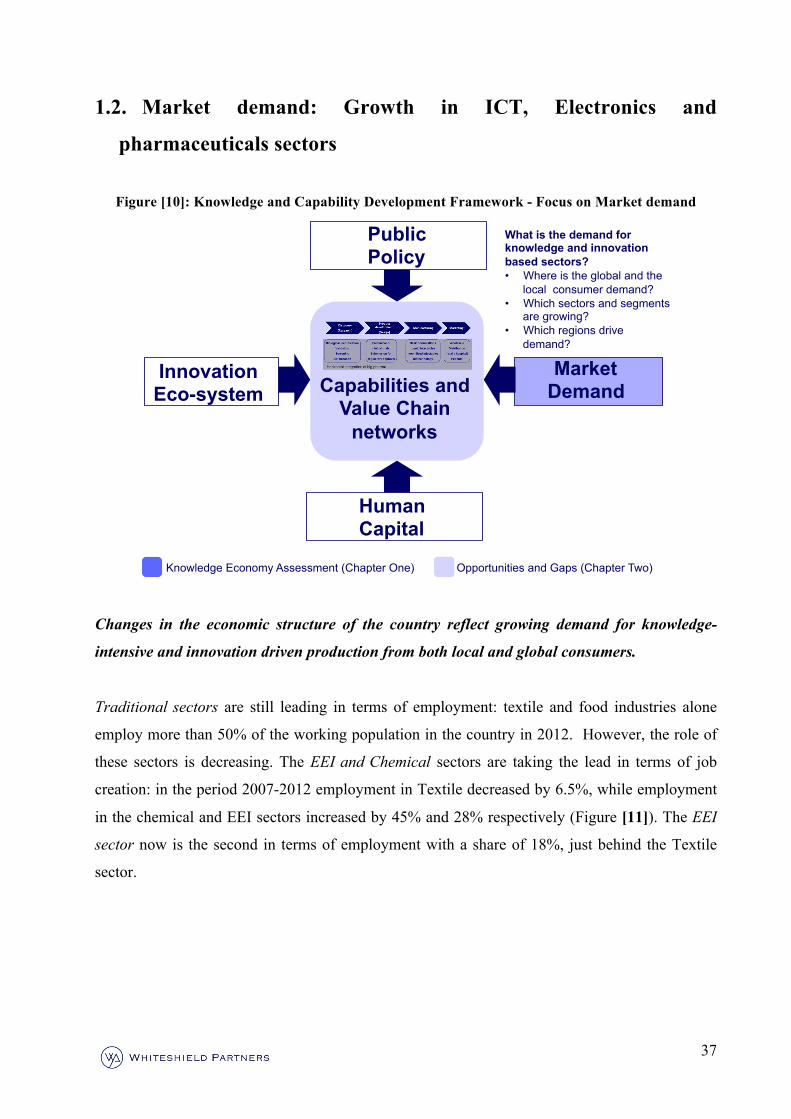
1.2. Market demand: Growth in ICT, Electronics and
pharmaceuticals sectors
Figure [10]: Knowledge and Capability Development Framework - Focus on Market demand
Changes in the economic structure of the country reflect growing demand for knowledge-
intensive and innovation driven production from both local and global consumers.
Traditional sectors are still leading in terms of employment: textile and food industries alone
employ more than 50% of the working population in the country in 2012. However, the role of
these sectors is decreasing. The EEI and Chemical sectors are taking the lead in terms of job
creation: in the period 2007-2012 employment in Textile decreased by 6.5%, while employment
in the chemical and EEI sectors increased by 45% and 28% respectively (Figure [11]). The EEI
sector now is the second in terms of employment with a share of 18%, just behind the Textile
sector.
Innovation Eco-system
Human Capital
Market Demand Capabilities and
Value Chain networks
What is the demand for knowledge and innovation based sectors? • Where is the global and the
local consumer demand? • Which sectors and segments
are growing? • Which regions drive
demand?
Knowledge Economy Assessment (Chapter One) Opportunities and Gaps (Chapter Two)
Public Policy
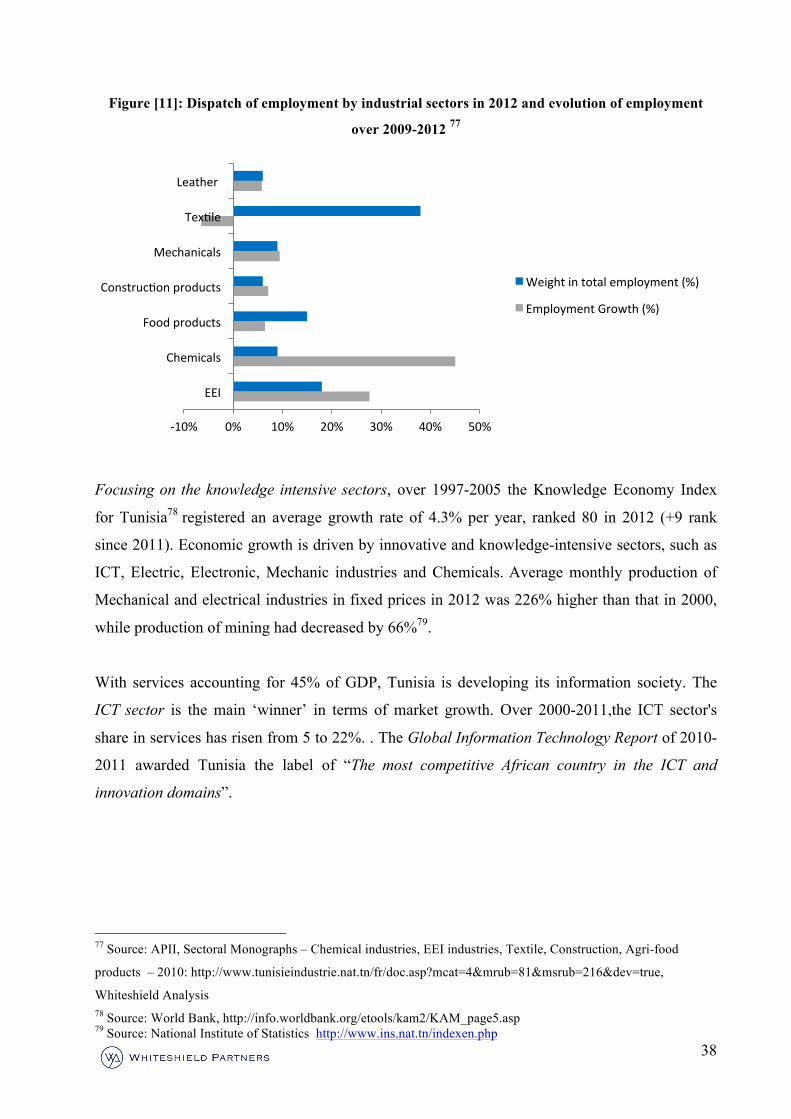
38
Figure [11]: Dispatch of employment by industrial sectors in 2012 and evolution of employment
over 2009-2012 77
Focusing on the knowledge intensive sectors, over 1997-2005 the Knowledge Economy Index
for Tunisia78 registered an average growth rate of 4.3% per year, ranked 80 in 2012 (+9 rank
since 2011). Economic growth is driven by innovative and knowledge-intensive sectors, such as
ICT, Electric, Electronic, Mechanic industries and Chemicals. Average monthly production of
Mechanical and electrical industries in fixed prices in 2012 was 226% higher than that in 2000,
while production of mining had decreased by 66%79.
With services accounting for 45% of GDP, Tunisia is developing its information society. The
ICT sector is the main ‘winner’ in terms of market growth. Over 2000-2011,the ICT sector's
share in services has risen from 5 to 22%. . The Global Information Technology Report of 2010-
2011 awarded Tunisia the label of “The most competitive African country in the ICT and
innovation domains”.
77 Source: APII, Sectoral Monographs – Chemical industries, EEI industries, Textile, Construction, Agri-food
products – 2010: http://www.tunisieindustrie.nat.tn/fr/doc.asp?mcat=4&mrub=81&msrub=216&dev=true,
Whiteshield Analysis 78 Source: World Bank, http://info.worldbank.org/etools/kam2/KAM_page5.asp 79 Source: National Institute of Statistics http://www.ins.nat.tn/indexen.php
-‐10% 0% 10% 20% 30% 40% 50%
EEI
Chemicals
Food products
ConstrucDon products
Mechanicals
TexDle
Leather
Weight in total employment (%)
Employment Growth (%)
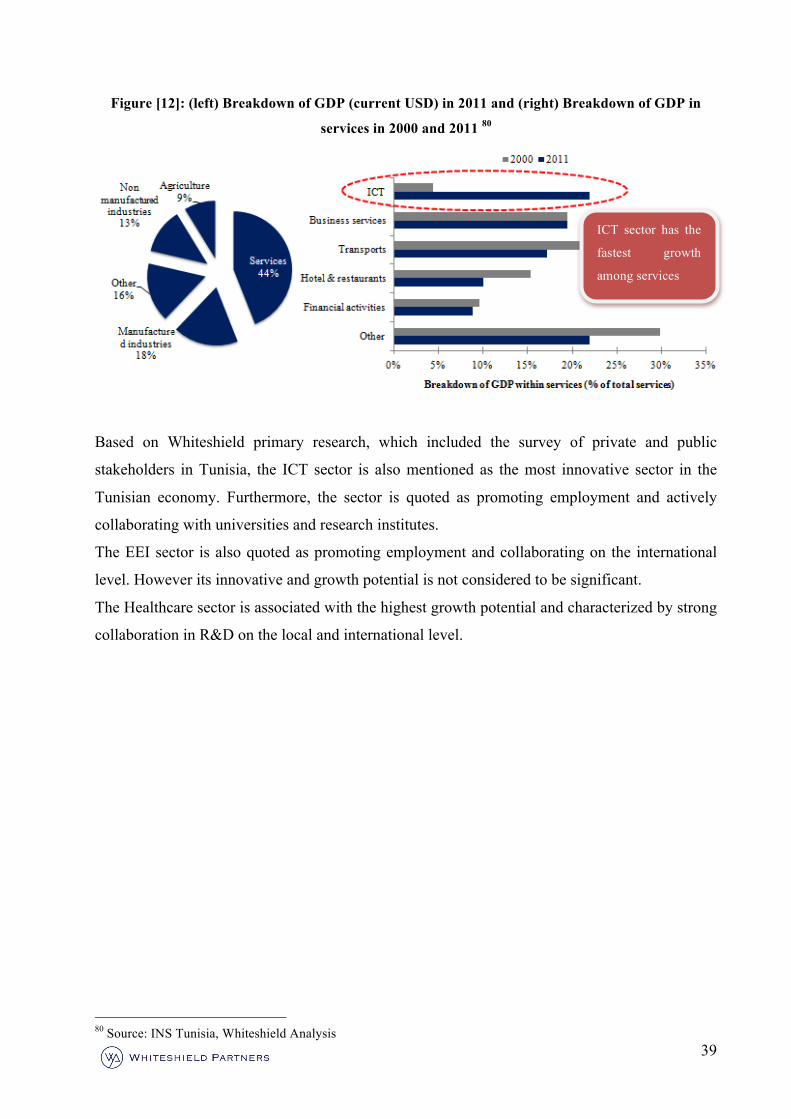
39
Figure [12]: (left) Breakdown of GDP (current USD) in 2011 and (right) Breakdown of GDP in
services in 2000 and 2011 80
Based on Whiteshield primary research, which included the survey of private and public
stakeholders in Tunisia, the ICT sector is also mentioned as the most innovative sector in the
Tunisian economy. Furthermore, the sector is quoted as promoting employment and actively
collaborating with universities and research institutes.
The EEI sector is also quoted as promoting employment and collaborating on the international
level. However its innovative and growth potential is not considered to be significant.
The Healthcare sector is associated with the highest growth potential and characterized by strong
collaboration in R&D on the local and international level.
80 Source: INS Tunisia, Whiteshield Analysis
ICT sector has the
fastest growth
among services
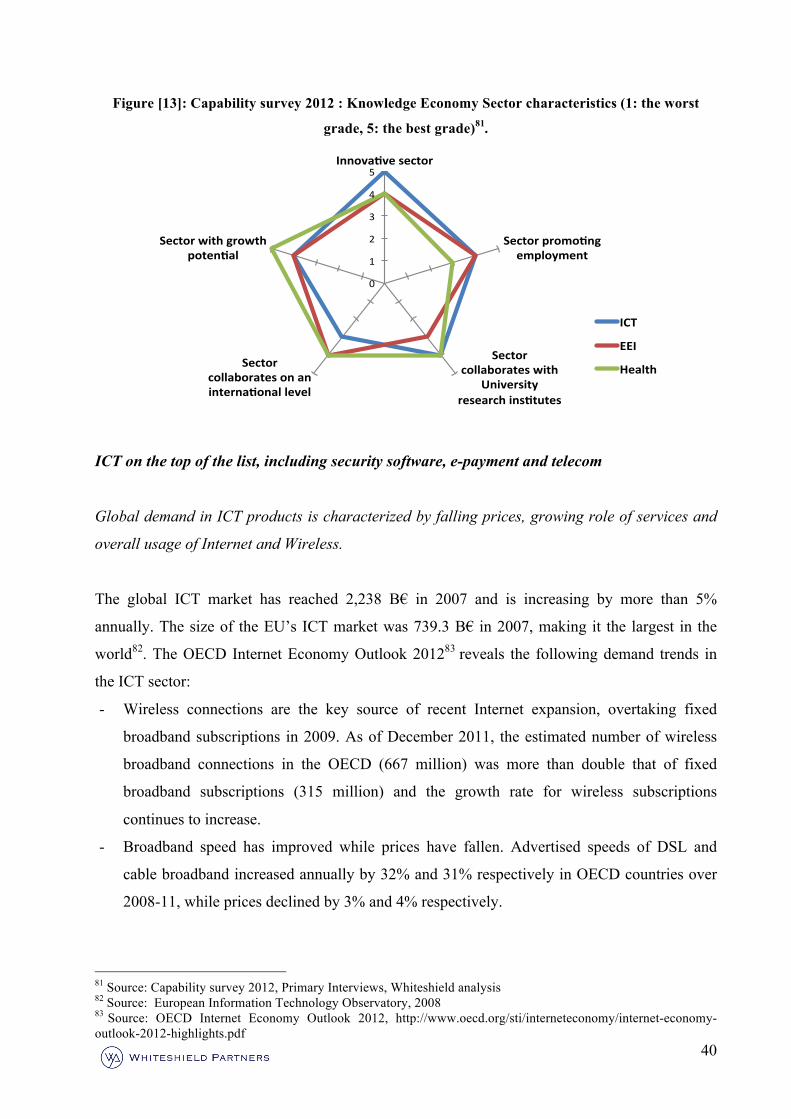
40
Figure [13]: Capability survey 2012 : Knowledge Economy Sector characteristics (1: the worst
grade, 5: the best grade)81.
ICT on the top of the list, including security software, e-payment and telecom
Global demand in ICT products is characterized by falling prices, growing role of services and
overall usage of Internet and Wireless.
The global ICT market has reached 2,238 B€ in 2007 and is increasing by more than 5%
annually. The size of the EU’s ICT market was 739.3 B€ in 2007, making it the largest in the
world82. The OECD Internet Economy Outlook 201283 reveals the following demand trends in
the ICT sector:
- Wireless connections are the key source of recent Internet expansion, overtaking fixed
broadband subscriptions in 2009. As of December 2011, the estimated number of wireless
broadband connections in the OECD (667 million) was more than double that of fixed
broadband subscriptions (315 million) and the growth rate for wireless subscriptions
continues to increase.
- Broadband speed has improved while prices have fallen. Advertised speeds of DSL and
cable broadband increased annually by 32% and 31% respectively in OECD countries over
2008-11, while prices declined by 3% and 4% respectively.
81 Source: Capability survey 2012, Primary Interviews, Whiteshield analysis 82 Source: European Information Technology Observatory, 2008 83 Source: OECD Internet Economy Outlook 2012, http://www.oecd.org/sti/interneteconomy/internet-economy-outlook-2012-highlights.pdf
0"
1"
2"
3"
4"
5"Innova&ve(sector(
Sector(promo&ng(employment(
Sector(collaborates(with(
University(research(ins&tutes((
Sector(collaborates(on(an(interna&onal(level(
Sector(with(growth(poten&al(
ICT(
EEI(
Health(
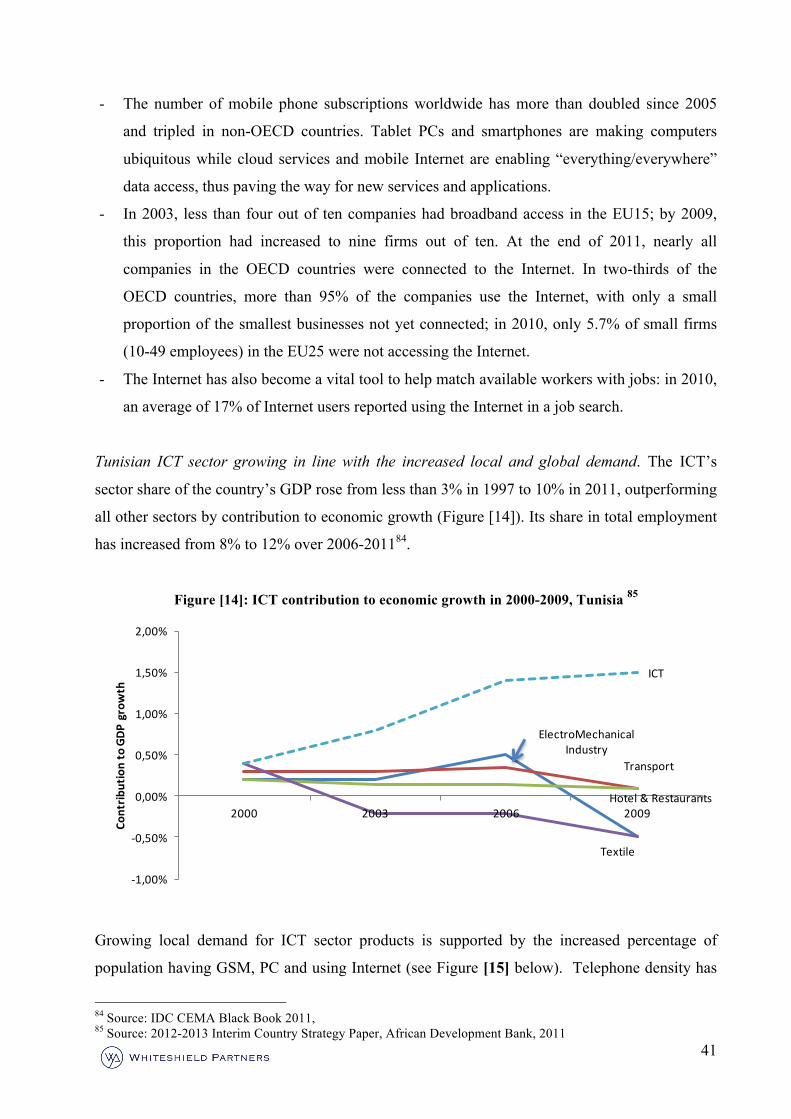
41
- The number of mobile phone subscriptions worldwide has more than doubled since 2005
and tripled in non-OECD countries. Tablet PCs and smartphones are making computers
ubiquitous while cloud services and mobile Internet are enabling “everything/everywhere”
data access, thus paving the way for new services and applications.
- In 2003, less than four out of ten companies had broadband access in the EU15; by 2009,
this proportion had increased to nine firms out of ten. At the end of 2011, nearly all
companies in the OECD countries were connected to the Internet. In two-thirds of the
OECD countries, more than 95% of the companies use the Internet, with only a small
proportion of the smallest businesses not yet connected; in 2010, only 5.7% of small firms
(10-49 employees) in the EU25 were not accessing the Internet.
- The Internet has also become a vital tool to help match available workers with jobs: in 2010,
an average of 17% of Internet users reported using the Internet in a job search.
Tunisian ICT sector growing in line with the increased local and global demand. The ICT’s
sector share of the country’s GDP rose from less than 3% in 1997 to 10% in 2011, outperforming
all other sectors by contribution to economic growth (Figure [14]). Its share in total employment
has increased from 8% to 12% over 2006-201184.
Figure [14]: ICT contribution to economic growth in 2000-2009, Tunisia 85
Growing local demand for ICT sector products is supported by the increased percentage of
population having GSM, PC and using Internet (see Figure [15] below). Telephone density has
84 Source: IDC CEMA Black Book 2011, 85 Source: 2012-2013 Interim Country Strategy Paper, African Development Bank, 2011
ElectroMechanical Industry
Transport
Hotel & Restaurants
Textile
ICT
-‐1,00%
-‐0,50%
0,00%
0,50%
1,00%
1,50%
2,00%
2000 2003 2006 2009
Contrib
ution to GDP
growth
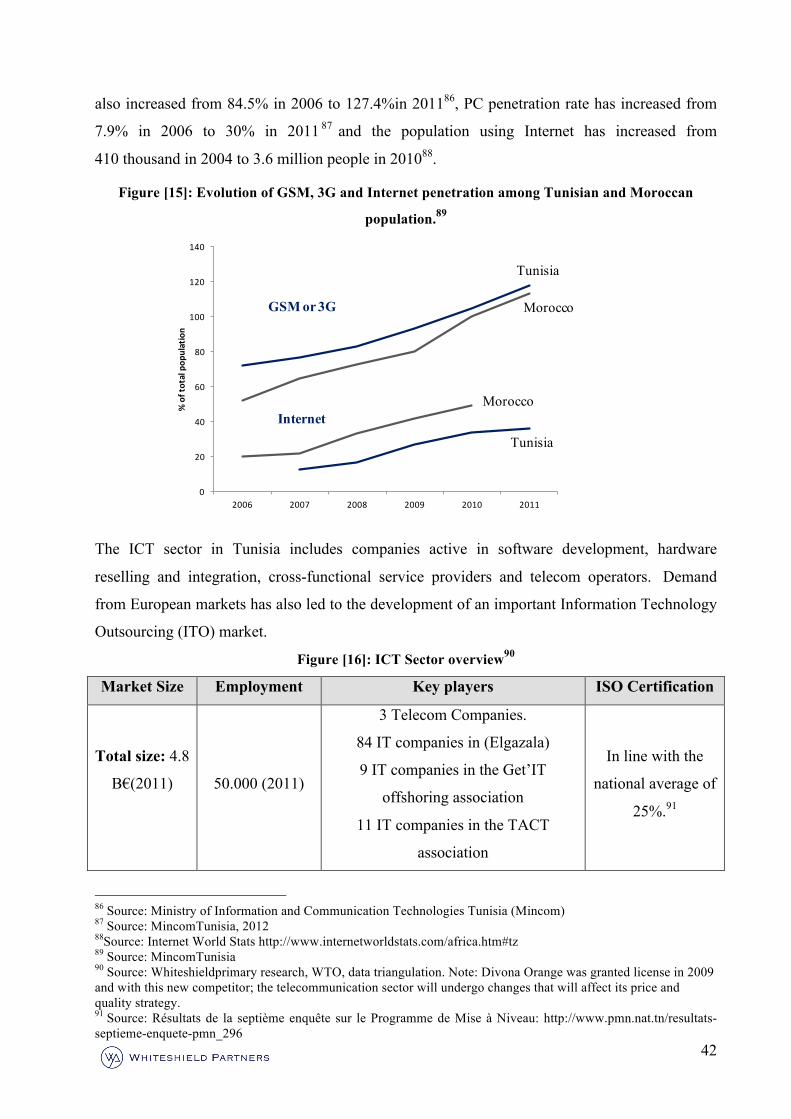
42
also increased from 84.5% in 2006 to 127.4%in 201186, PC penetration rate has increased from
7.9% in 2006 to 30% in 2011 87 and the population using Internet has increased from
410 thousand in 2004 to 3.6 million people in 201088.
Figure [15]: Evolution of GSM, 3G and Internet penetration among Tunisian and Moroccan
population.89
The ICT sector in Tunisia includes companies active in software development, hardware
reselling and integration, cross-functional service providers and telecom operators. Demand
from European markets has also led to the development of an important Information Technology
Outsourcing (ITO) market.
Figure [16]: ICT Sector overview90
Market Size Employment Key players ISO Certification
Total size: 4.8
B€(2011)
50.000 (2011)
3 Telecom Companies.
84 IT companies in (Elgazala)
9 IT companies in the Get’IT
offshoring association
11 IT companies in the TACT
association
In line with the
national average of
25%.91
86 Source: Ministry of Information and Communication Technologies Tunisia (Mincom) 87 Source: MincomTunisia, 2012 88Source: Internet World Stats http://www.internetworldstats.com/africa.htm#tz 89 Source: MincomTunisia 90 Source: Whiteshieldprimary research, WTO, data triangulation. Note: Divona Orange was granted license in 2009 and with this new competitor; the telecommunication sector will undergo changes that will affect its price and quality strategy. 91 Source: Résultats de la septième enquête sur le Programme de Mise à Niveau: http://www.pmn.nat.tn/resultats-septieme-enquete-pmn_296
0
20
40
60
80
100
120
140
2006 2007 2008 2009 2010 2011
% of total pop
ulation
Tunisia
Morocco
Morocco
Tunisia
GSM or 3G
Internet
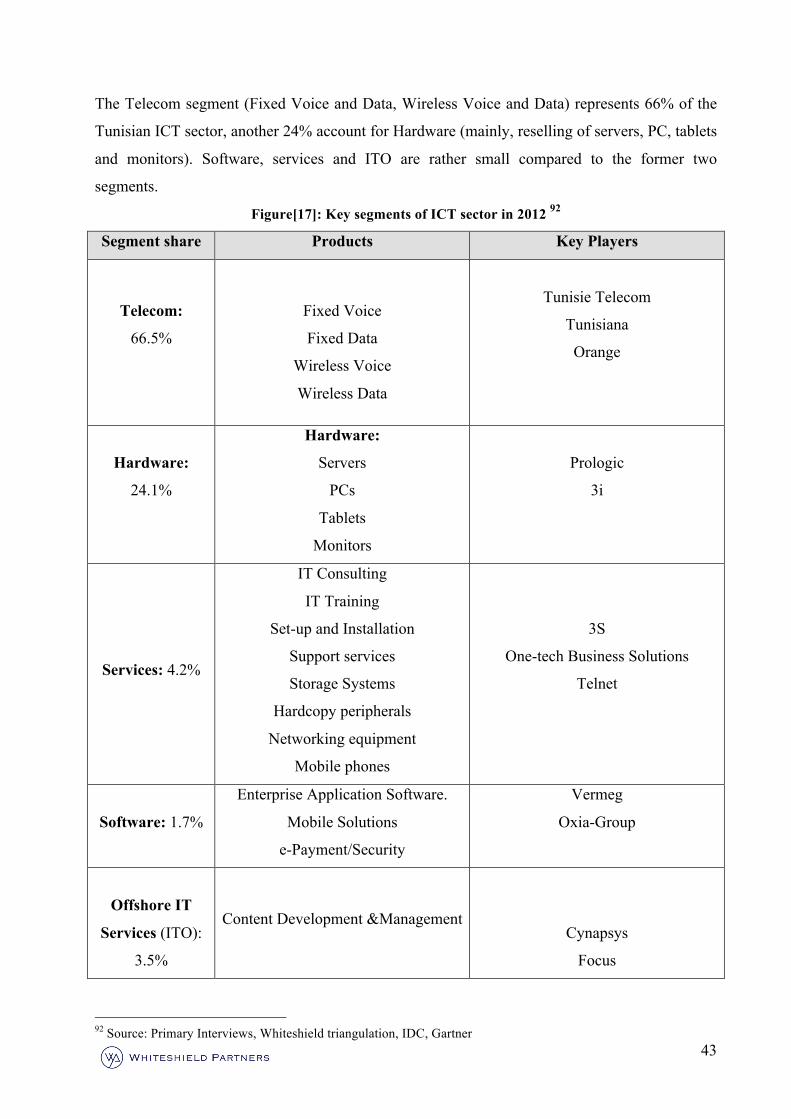
43
The Telecom segment (Fixed Voice and Data, Wireless Voice and Data) represents 66% of the
Tunisian ICT sector, another 24% account for Hardware (mainly, reselling of servers, PC, tablets
and monitors). Software, services and ITO are rather small compared to the former two
segments.
Figure[17]: Key segments of ICT sector in 2012 92
Segment share Products Key Players
Telecom:
66.5%
Fixed Voice
Fixed Data
Wireless Voice
Wireless Data
Tunisie Telecom
Tunisiana
Orange
Hardware:
24.1%
Hardware:
Servers
PCs
Tablets
Monitors
Prologic
3i
Services: 4.2%
IT Consulting
IT Training
Set-up and Installation
Support services
Storage Systems
Hardcopy peripherals
Networking equipment
Mobile phones
3S
One-tech Business Solutions
Telnet
Software: 1.7%
Enterprise Application Software.
Mobile Solutions
e-Payment/Security
Vermeg
Oxia-Group
Offshore IT
Services (ITO):
3.5%
Content Development &Management
Cynapsys
Focus
92 Source: Primary Interviews, Whiteshield triangulation, IDC, Gartner
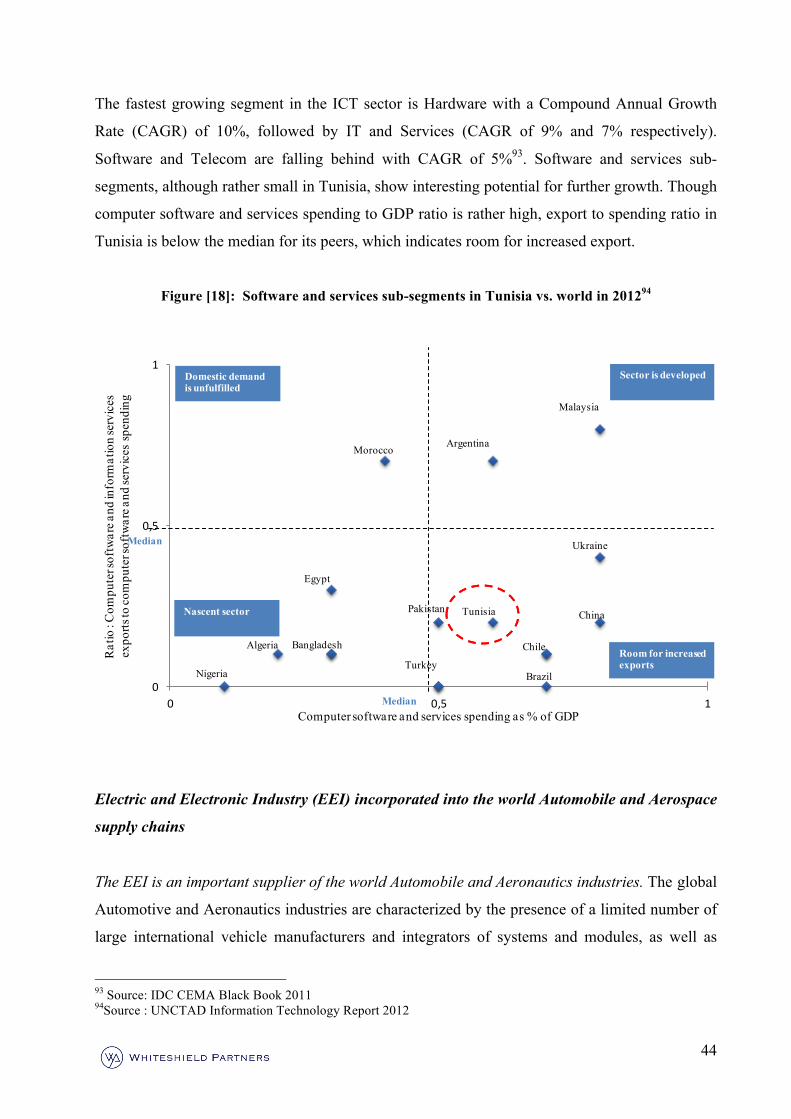
44
The fastest growing segment in the ICT sector is Hardware with a Compound Annual Growth
Rate (CAGR) of 10%, followed by IT and Services (CAGR of 9% and 7% respectively).
Software and Telecom are falling behind with CAGR of 5%93. Software and services sub-
segments, although rather small in Tunisia, show interesting potential for further growth. Though
computer software and services spending to GDP ratio is rather high, export to spending ratio in
Tunisia is below the median for its peers, which indicates room for increased export.
Figure [18]: Software and services sub-segments in Tunisia vs. world in 201294
Electric and Electronic Industry (EEI) incorporated into the world Automobile and Aerospace
supply chains
The EEI is an important supplier of the world Automobile and Aeronautics industries. The global
Automotive and Aeronautics industries are characterized by the presence of a limited number of
large international vehicle manufacturers and integrators of systems and modules, as well as
93 Source: IDC CEMA Black Book 2011 94Source : UNCTAD Information Technology Report 2012
0
0,5
1
0 0,5 1
Rat
io : C
ompu
ter s
oftw
are a
nd in
form
atio
n se
rvic
es
expo
rts to
com
pute
r sof
twar
e and
serv
ices
spe
ndin
g
Computer software and services spending as % of GDP
Median
Median
Morocco Argentina
Malaysia
Egypt
Algeria
Nigeria
Bangladesh
Tunisia
Turkey
Pakistan China
Ukraine
Chile
Brazil
Nascent sector
Room for increased exports
Sector is developedDomestic demand is unfulfilled
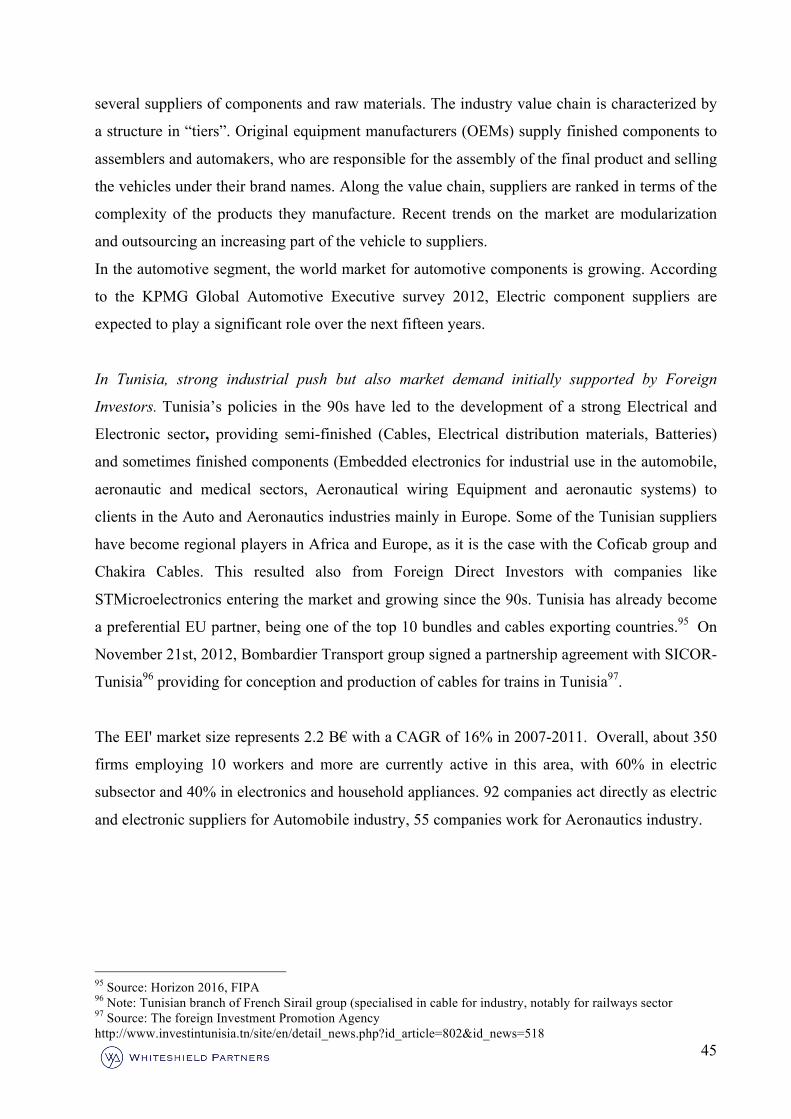
45
several suppliers of components and raw materials. The industry value chain is characterized by
a structure in “tiers”. Original equipment manufacturers (OEMs) supply finished components to
assemblers and automakers, who are responsible for the assembly of the final product and selling
the vehicles under their brand names. Along the value chain, suppliers are ranked in terms of the
complexity of the products they manufacture. Recent trends on the market are modularization
and outsourcing an increasing part of the vehicle to suppliers.
In the automotive segment, the world market for automotive components is growing. According
to the KPMG Global Automotive Executive survey 2012, Electric component suppliers are
expected to play a significant role over the next fifteen years.
In Tunisia, strong industrial push but also market demand initially supported by Foreign
Investors. Tunisia’s policies in the 90s have led to the development of a strong Electrical and
Electronic sector, providing semi-finished (Cables, Electrical distribution materials, Batteries)
and sometimes finished components (Embedded electronics for industrial use in the automobile,
aeronautic and medical sectors, Aeronautical wiring Equipment and aeronautic systems) to
clients in the Auto and Aeronautics industries mainly in Europe. Some of the Tunisian suppliers
have become regional players in Africa and Europe, as it is the case with the Coficab group and
Chakira Cables. This resulted also from Foreign Direct Investors with companies like
STMicroelectronics entering the market and growing since the 90s. Tunisia has already become
a preferential EU partner, being one of the top 10 bundles and cables exporting countries.95 On
November 21st, 2012, Bombardier Transport group signed a partnership agreement with SICOR-
Tunisia96 providing for conception and production of cables for trains in Tunisia97.
The EEI' market size represents 2.2 B€ with a CAGR of 16% in 2007-2011. Overall, about 350
firms employing 10 workers and more are currently active in this area, with 60% in electric
subsector and 40% in electronics and household appliances. 92 companies act directly as electric
and electronic suppliers for Automobile industry, 55 companies work for Aeronautics industry.
95 Source: Horizon 2016, FIPA 96 Note: Tunisian branch of French Sirail group (specialised in cable for industry, notably for railways sector 97 Source: The foreign Investment Promotion Agency http://www.investintunisia.tn/site/en/detail_news.php?id_article=802&id_news=518
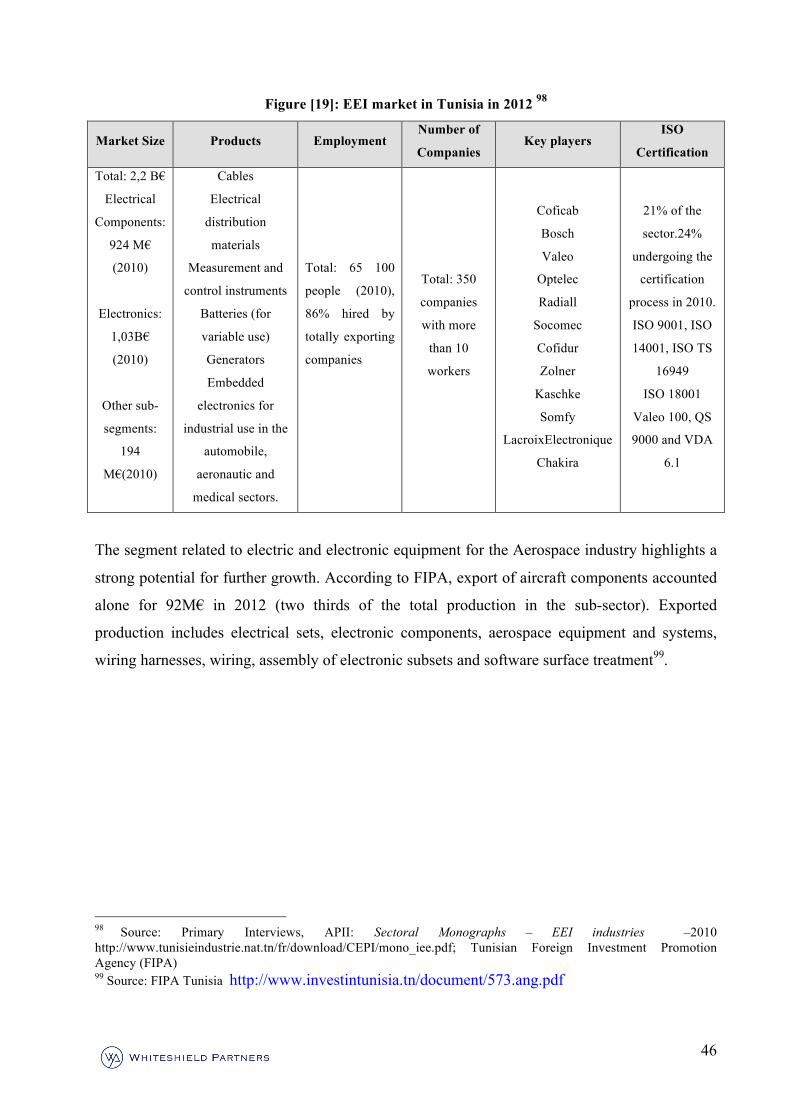
46
Figure [19]: EEI market in Tunisia in 2012 98
Market Size Products Employment Number of
Companies Key players
ISO
Certification
Total: 2,2 B€
Electrical
Components:
924 M€
(2010)
Electronics:
1,03B€
(2010)
Other sub-
segments:
194
M€(2010)
Cables
Electrical
distribution
materials
Measurement and
control instruments
Batteries (for
variable use)
Generators
Embedded
electronics for
industrial use in the
automobile,
aeronautic and
medical sectors.
Total: 65 100
people (2010),
86% hired by
totally exporting
companies
Total: 350
companies
with more
than 10
workers
Coficab
Bosch
Valeo
Optelec
Radiall
Socomec
Cofidur
Zolner
Kaschke
Somfy
LacroixElectronique
Chakira
21% of the
sector.24%
undergoing the
certification
process in 2010.
ISO 9001, ISO
14001, ISO TS
16949
ISO 18001
Valeo 100, QS
9000 and VDA
6.1
The segment related to electric and electronic equipment for the Aerospace industry highlights a
strong potential for further growth. According to FIPA, export of aircraft components accounted
alone for 92M€ in 2012 (two thirds of the total production in the sub-sector). Exported
production includes electrical sets, electronic components, aerospace equipment and systems,
wiring harnesses, wiring, assembly of electronic subsets and software surface treatment99.
98 Source: Primary Interviews, APII: Sectoral Monographs – EEI industries –2010 http://www.tunisieindustrie.nat.tn/fr/download/CEPI/mono_iee.pdf; Tunisian Foreign Investment Promotion Agency (FIPA) 99 Source: FIPA Tunisia http://www.investintunisia.tn/document/573.ang.pdf
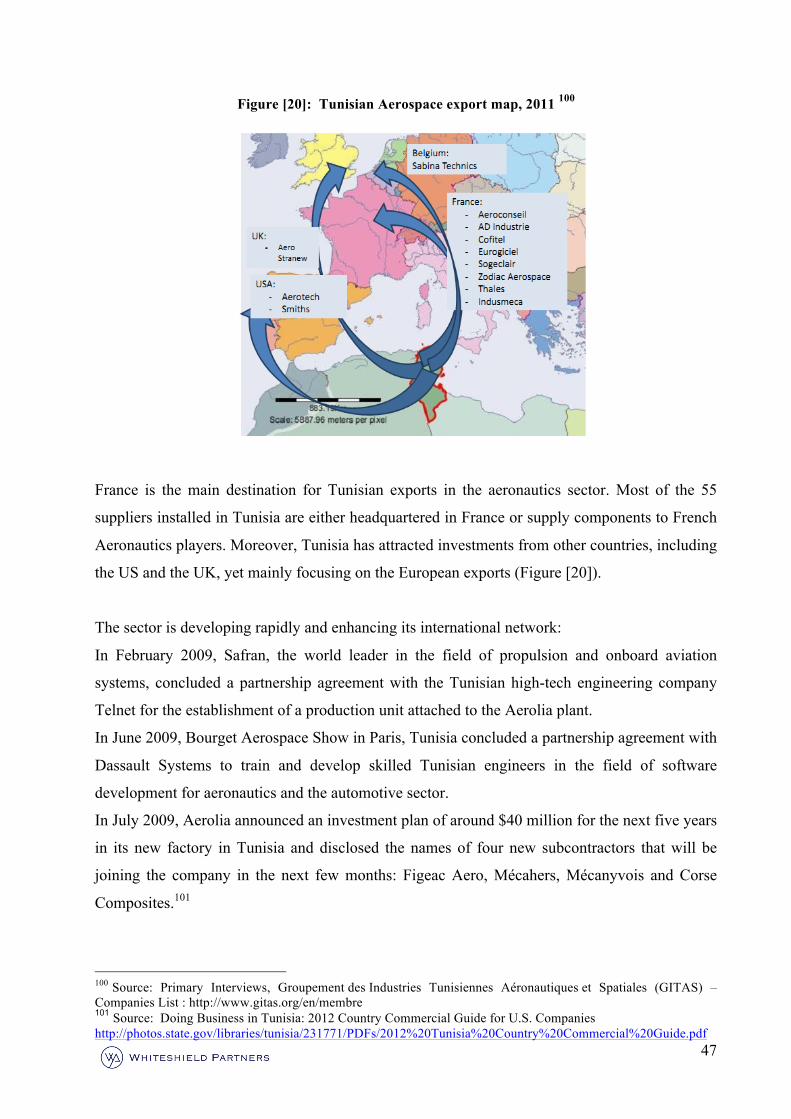
47
Figure [20]: Tunisian Aerospace export map, 2011 100
France is the main destination for Tunisian exports in the aeronautics sector. Most of the 55
suppliers installed in Tunisia are either headquartered in France or supply components to French
Aeronautics players. Moreover, Tunisia has attracted investments from other countries, including
the US and the UK, yet mainly focusing on the European exports (Figure [20]).
The sector is developing rapidly and enhancing its international network:
In February 2009, Safran, the world leader in the field of propulsion and onboard aviation
systems, concluded a partnership agreement with the Tunisian high-tech engineering company
Telnet for the establishment of a production unit attached to the Aerolia plant.
In June 2009, Bourget Aerospace Show in Paris, Tunisia concluded a partnership agreement with
Dassault Systems to train and develop skilled Tunisian engineers in the field of software
development for aeronautics and the automotive sector.
In July 2009, Aerolia announced an investment plan of around $40 million for the next five years
in its new factory in Tunisia and disclosed the names of four new subcontractors that will be
joining the company in the next few months: Figeac Aero, Mécahers, Mécanyvois and Corse
Composites.101
100 Source: Primary Interviews, Groupement des Industries Tunisiennes Aéronautiques et Spatiales (GITAS) – Companies List : http://www.gitas.org/en/membre 101 Source: Doing Business in Tunisia: 2012 Country Commercial Guide for U.S. Companies http://photos.state.gov/libraries/tunisia/231771/PDFs/2012%20Tunisia%20Country%20Commercial%20Guide.pdf
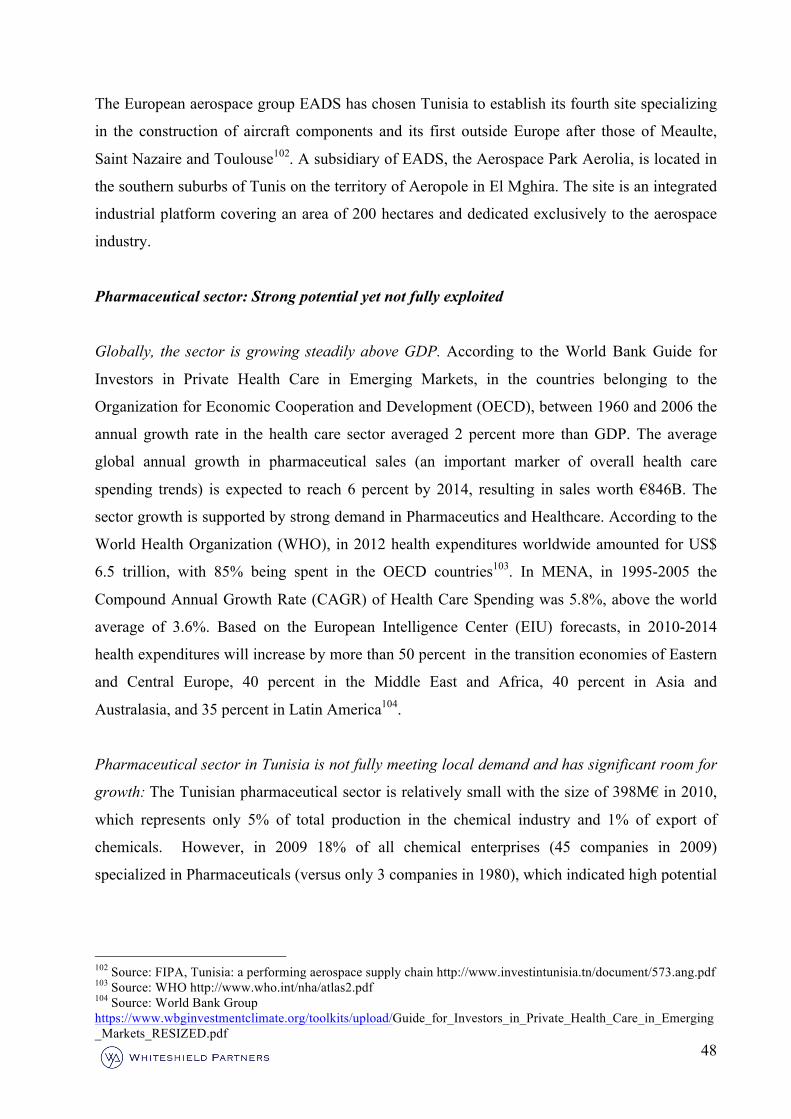
48
The European aerospace group EADS has chosen Tunisia to establish its fourth site specializing
in the construction of aircraft components and its first outside Europe after those of Meaulte,
Saint Nazaire and Toulouse102. A subsidiary of EADS, the Aerospace Park Aerolia, is located in
the southern suburbs of Tunis on the territory of Aeropole in El Mghira. The site is an integrated
industrial platform covering an area of 200 hectares and dedicated exclusively to the aerospace
industry.
Pharmaceutical sector: Strong potential yet not fully exploited
Globally, the sector is growing steadily above GDP. According to the World Bank Guide for
Investors in Private Health Care in Emerging Markets, in the countries belonging to the
Organization for Economic Cooperation and Development (OECD), between 1960 and 2006 the
annual growth rate in the health care sector averaged 2 percent more than GDP. The average
global annual growth in pharmaceutical sales (an important marker of overall health care
spending trends) is expected to reach 6 percent by 2014, resulting in sales worth €846B. The
sector growth is supported by strong demand in Pharmaceutics and Healthcare. According to the
World Health Organization (WHO), in 2012 health expenditures worldwide amounted for US$
6.5 trillion, with 85% being spent in the OECD countries103. In MENA, in 1995-2005 the
Compound Annual Growth Rate (CAGR) of Health Care Spending was 5.8%, above the world
average of 3.6%. Based on the European Intelligence Center (EIU) forecasts, in 2010-2014
health expenditures will increase by more than 50 percent in the transition economies of Eastern
and Central Europe, 40 percent in the Middle East and Africa, 40 percent in Asia and
Australasia, and 35 percent in Latin America104.
Pharmaceutical sector in Tunisia is not fully meeting local demand and has significant room for
growth: The Tunisian pharmaceutical sector is relatively small with the size of 398M€ in 2010,
which represents only 5% of total production in the chemical industry and 1% of export of
chemicals. However, in 2009 18% of all chemical enterprises (45 companies in 2009)
specialized in Pharmaceuticals (versus only 3 companies in 1980), which indicated high potential
102 Source: FIPA, Tunisia: a performing aerospace supply chain http://www.investintunisia.tn/document/573.ang.pdf 103 Source: WHO http://www.who.int/nha/atlas2.pdf 104 Source: World Bank Group https://www.wbginvestmentclimate.org/toolkits/upload/Guide_for_Investors_in_Private_Health_Care_in_Emerging_Markets_RESIZED.pdf
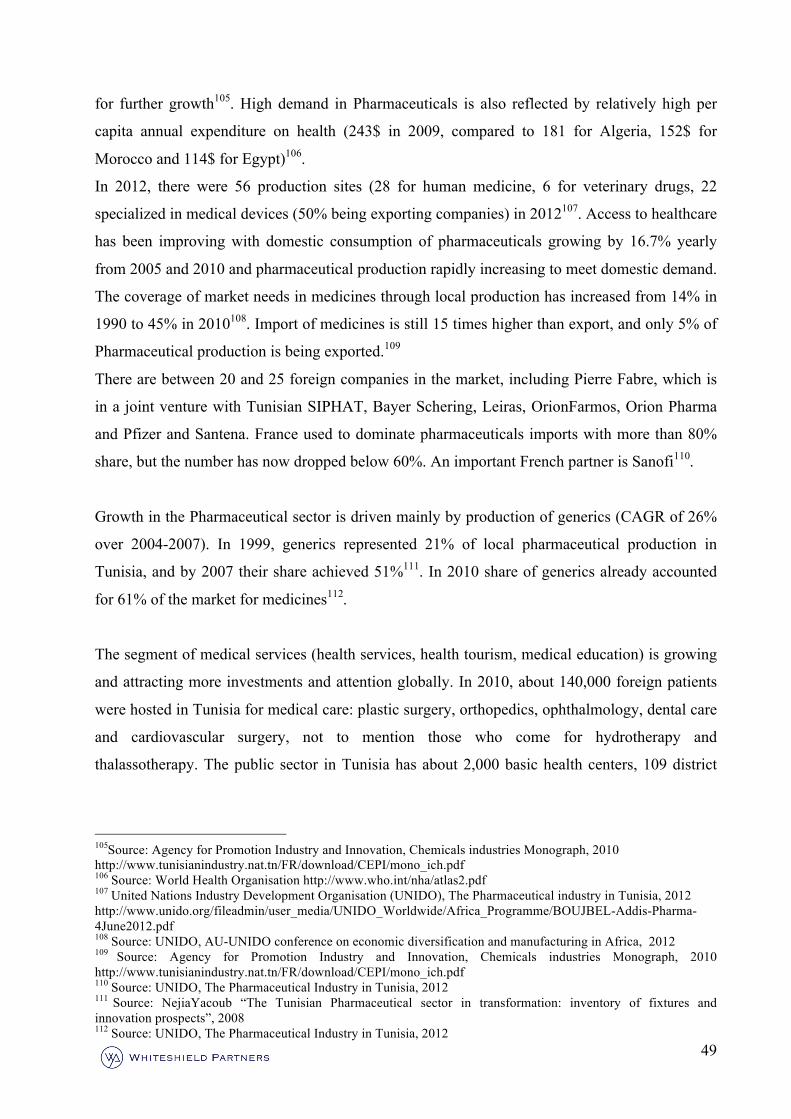
49
for further growth105. High demand in Pharmaceuticals is also reflected by relatively high per
capita annual expenditure on health (243$ in 2009, compared to 181 for Algeria, 152$ for
Morocco and 114$ for Egypt)106.
In 2012, there were 56 production sites (28 for human medicine, 6 for veterinary drugs, 22
specialized in medical devices (50% being exporting companies) in 2012107. Access to healthcare
has been improving with domestic consumption of pharmaceuticals growing by 16.7% yearly
from 2005 and 2010 and pharmaceutical production rapidly increasing to meet domestic demand.
The coverage of market needs in medicines through local production has increased from 14% in
1990 to 45% in 2010108. Import of medicines is still 15 times higher than export, and only 5% of
Pharmaceutical production is being exported.109
There are between 20 and 25 foreign companies in the market, including Pierre Fabre, which is
in a joint venture with Tunisian SIPHAT, Bayer Schering, Leiras, OrionFarmos, Orion Pharma
and Pfizer and Santena. France used to dominate pharmaceuticals imports with more than 80%
share, but the number has now dropped below 60%. An important French partner is Sanofi110.
Growth in the Pharmaceutical sector is driven mainly by production of generics (CAGR of 26%
over 2004-2007). In 1999, generics represented 21% of local pharmaceutical production in
Tunisia, and by 2007 their share achieved 51%111. In 2010 share of generics already accounted
for 61% of the market for medicines112.
The segment of medical services (health services, health tourism, medical education) is growing
and attracting more investments and attention globally. In 2010, about 140,000 foreign patients
were hosted in Tunisia for medical care: plastic surgery, orthopedics, ophthalmology, dental care
and cardiovascular surgery, not to mention those who come for hydrotherapy and
thalassotherapy. The public sector in Tunisia has about 2,000 basic health centers, 109 district
105Source: Agency for Promotion Industry and Innovation, Chemicals industries Monograph, 2010 http://www.tunisianindustry.nat.tn/FR/download/CEPI/mono_ich.pdf 106 Source: World Health Organisation http://www.who.int/nha/atlas2.pdf 107 United Nations Industry Development Organisation (UNIDO), The Pharmaceutical industry in Tunisia, 2012 http://www.unido.org/fileadmin/user_media/UNIDO_Worldwide/Africa_Programme/BOUJBEL-Addis-Pharma-4June2012.pdf 108 Source: UNIDO, AU-UNIDO conference on economic diversification and manufacturing in Africa, 2012 109 Source: Agency for Promotion Industry and Innovation, Chemicals industries Monograph, 2010 http://www.tunisianindustry.nat.tn/FR/download/CEPI/mono_ich.pdf 110 Source: UNIDO, The Pharmaceutical Industry in Tunisia, 2012 111 Source: NejiaYacoub “The Tunisian Pharmaceutical sector in transformation: inventory of fixtures and innovation prospects”, 2008 112 Source: UNIDO, The Pharmaceutical Industry in Tunisia, 2012
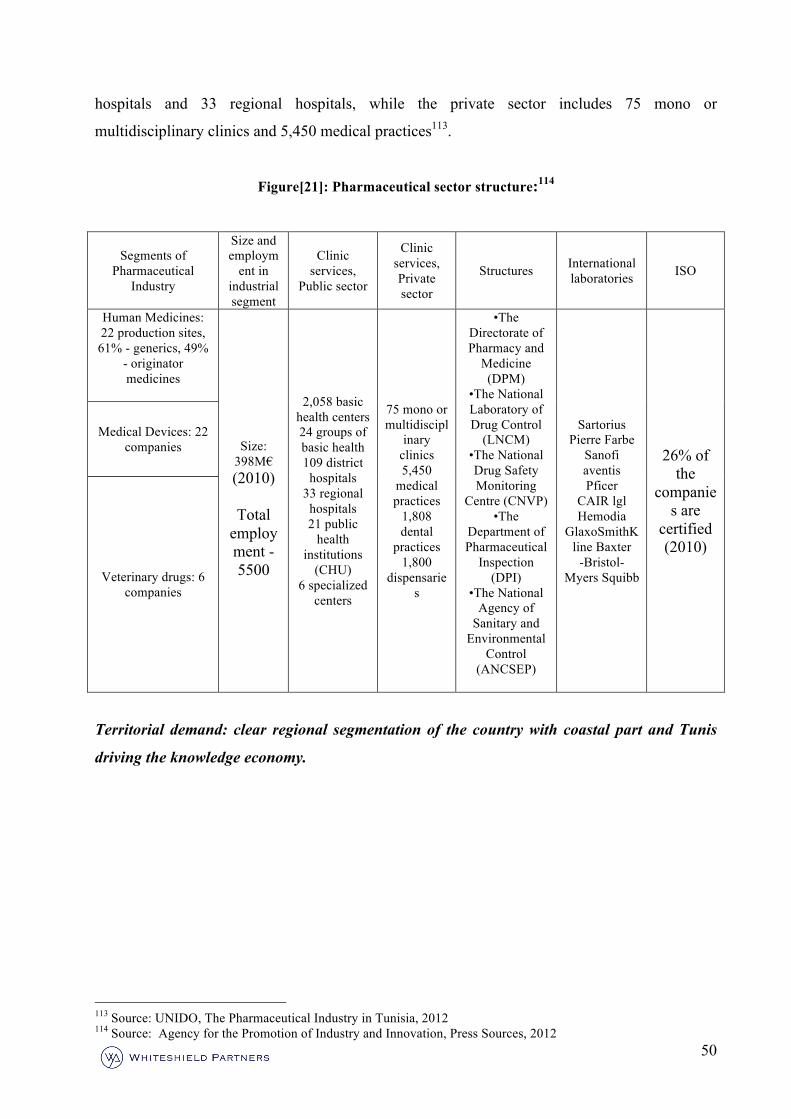
50
hospitals and 33 regional hospitals, while the private sector includes 75 mono or
multidisciplinary clinics and 5,450 medical practices113.
Figure[21]: Pharmaceutical sector structure:114
Segments of Pharmaceutical
Industry
Size and employm
ent in industrial segment
Clinic services,
Public sector
Clinic services, Private sector
Structures International laboratories ISO
Human Medicines: 22 production sites, 61% - generics, 49%
- originator medicines
Size:
398M€ (2010)
Total
employment - 5500
2,058 basic health centers 24 groups of basic health 109 district hospitals
33 regional hospitals 21 public
health institutions
(CHU) 6 specialized
centers
75 mono or multidiscipl
inary clinics 5,450
medical practices
1,808 dental
practices 1,800
dispensaries
•The Directorate of Pharmacy and
Medicine (DPM)
•The National Laboratory of Drug Control
(LNCM) •The National Drug Safety Monitoring
Centre (CNVP) •The
Department of Pharmaceutical
Inspection (DPI)
•The National Agency of
Sanitary and Environmental
Control (ANCSEP)
Sartorius
Pierre Farbe Sanofi aventis Pficer
CAIR lgl Hemodia
GlaxoSmithKline Baxter
-Bristol-Myers Squibb
26% of the
companies are
certified (2010)
Medical Devices: 22 companies
Veterinary drugs: 6 companies
Territorial demand: clear regional segmentation of the country with coastal part and Tunis
driving the knowledge economy.
113 Source: UNIDO, The Pharmaceutical Industry in Tunisia, 2012 114 Source: Agency for the Promotion of Industry and Innovation, Press Sources, 2012
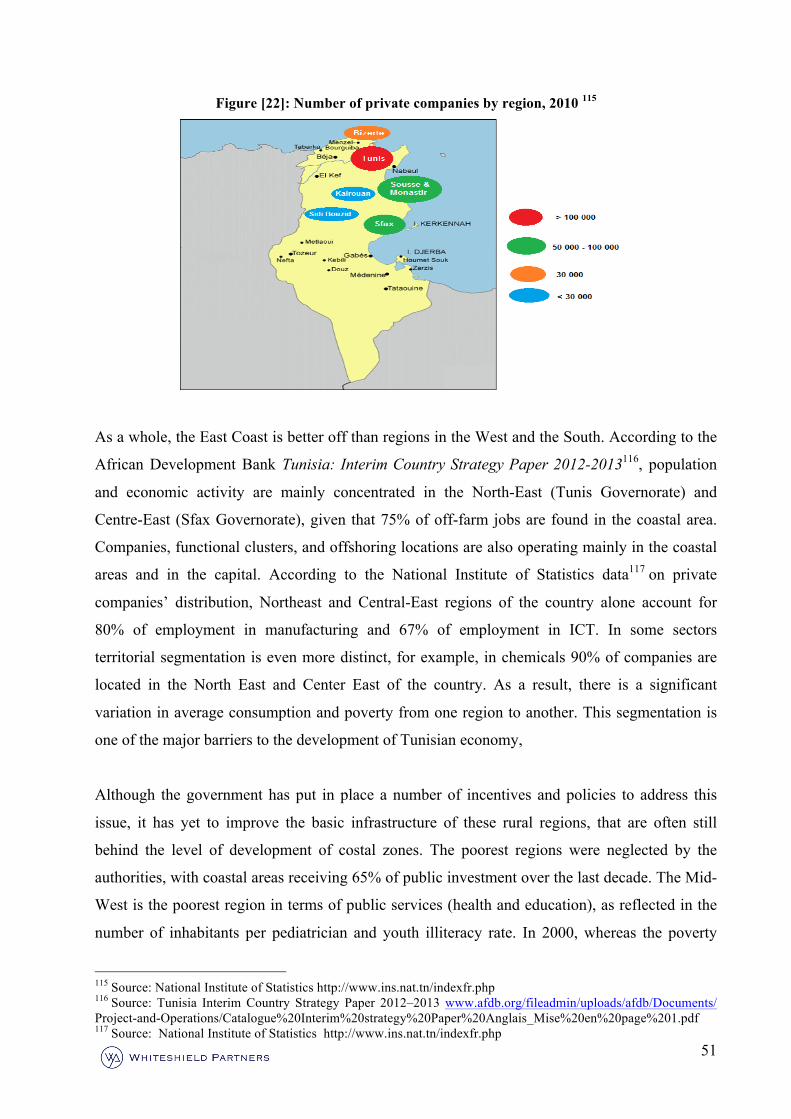
51
Figure [22]: Number of private companies by region, 2010 115
As a whole, the East Coast is better off than regions in the West and the South. According to the
African Development Bank Tunisia: Interim Country Strategy Paper 2012-2013116, population
and economic activity are mainly concentrated in the North-East (Tunis Governorate) and
Centre-East (Sfax Governorate), given that 75% of off-farm jobs are found in the coastal area.
Companies, functional clusters, and offshoring locations are also operating mainly in the coastal
areas and in the capital. According to the National Institute of Statistics data117 on private
companies’ distribution, Northeast and Central-East regions of the country alone account for
80% of employment in manufacturing and 67% of employment in ICT. In some sectors
territorial segmentation is even more distinct, for example, in chemicals 90% of companies are
located in the North East and Center East of the country. As a result, there is a significant
variation in average consumption and poverty from one region to another. This segmentation is
one of the major barriers to the development of Tunisian economy,
Although the government has put in place a number of incentives and policies to address this
issue, it has yet to improve the basic infrastructure of these rural regions, that are often still
behind the level of development of costal zones. The poorest regions were neglected by the
authorities, with coastal areas receiving 65% of public investment over the last decade. The Mid-
West is the poorest region in terms of public services (health and education), as reflected in the
number of inhabitants per pediatrician and youth illiteracy rate. In 2000, whereas the poverty
115 Source: National Institute of Statistics http://www.ins.nat.tn/indexfr.php 116 Source: Tunisia Interim Country Strategy Paper 2012–2013 www.afdb.org/fileadmin/uploads/afdb/Documents/ Project-and-Operations/Catalogue%20Interim%20strategy%20Paper%20Anglais_Mise%20en%20page%201.pdf 117 Source: National Institute of Statistics http://www.ins.nat.tn/indexfr.php
52
index (national average) stood at 18.4%, it actually varied from 6.9% in the Tunis district to
30.8% in the Mid-West. Similarly, unemployment is particularly acute in the hinterland. On
average, since 2004, the unemployment rate is above 22.6% in the Jendouba, Le Kef, Kasserine
and Gafsa regions118.
118 Source: Tunisia Interim Country Strategy Paper 2012–2013 www.afdb.org/fileadmin/uploads/afdb/Documents/ Project-and-Operations/Catalogue%20Interim%20strategy%20Paper%20Anglais_Mise%20en%20page%201.pdf
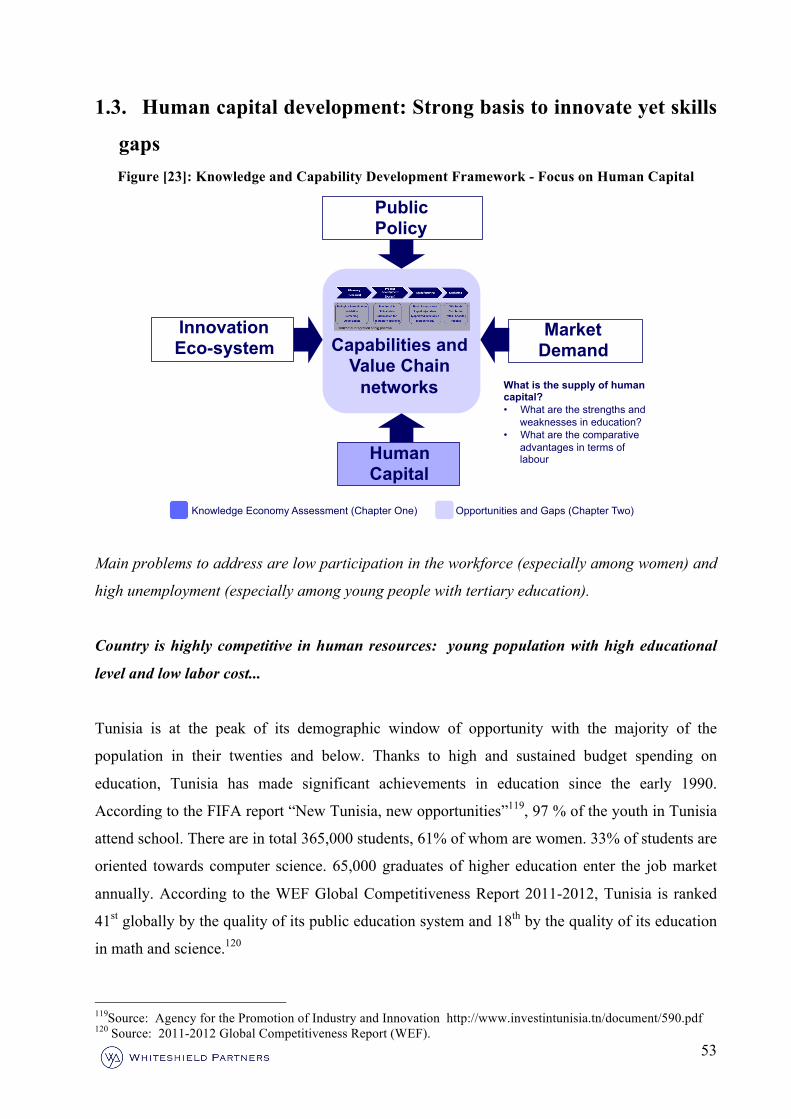
53
1.3. Human capital development: Strong basis to innovate yet skills
gaps Figure [23]: Knowledge and Capability Development Framework - Focus on Human Capital
Main problems to address are low participation in the workforce (especially among women) and
high unemployment (especially among young people with tertiary education).
Country is highly competitive in human resources: young population with high educational
level and low labor cost...
Tunisia is at the peak of its demographic window of opportunity with the majority of the
population in their twenties and below. Thanks to high and sustained budget spending on
education, Tunisia has made significant achievements in education since the early 1990.
According to the FIFA report “New Tunisia, new opportunities”119, 97 % of the youth in Tunisia
attend school. There are in total 365,000 students, 61% of whom are women. 33% of students are
oriented towards computer science. 65,000 graduates of higher education enter the job market
annually. According to the WEF Global Competitiveness Report 2011-2012, Tunisia is ranked
41st globally by the quality of its public education system and 18th by the quality of its education
in math and science.120
119Source: Agency for the Promotion of Industry and Innovation http://www.investintunisia.tn/document/590.pdf 120 Source: 2011-2012 Global Competitiveness Report (WEF).
Innovation Eco-system
Human Capital
Market Demand Capabilities and
Value Chain networks What is the supply of human
capital? • What are the strengths and
weaknesses in education? • What are the comparative
advantages in terms of labour
Knowledge Economy Assessment (Chapter One) Opportunities and Gaps (Chapter Two)
Public Policy
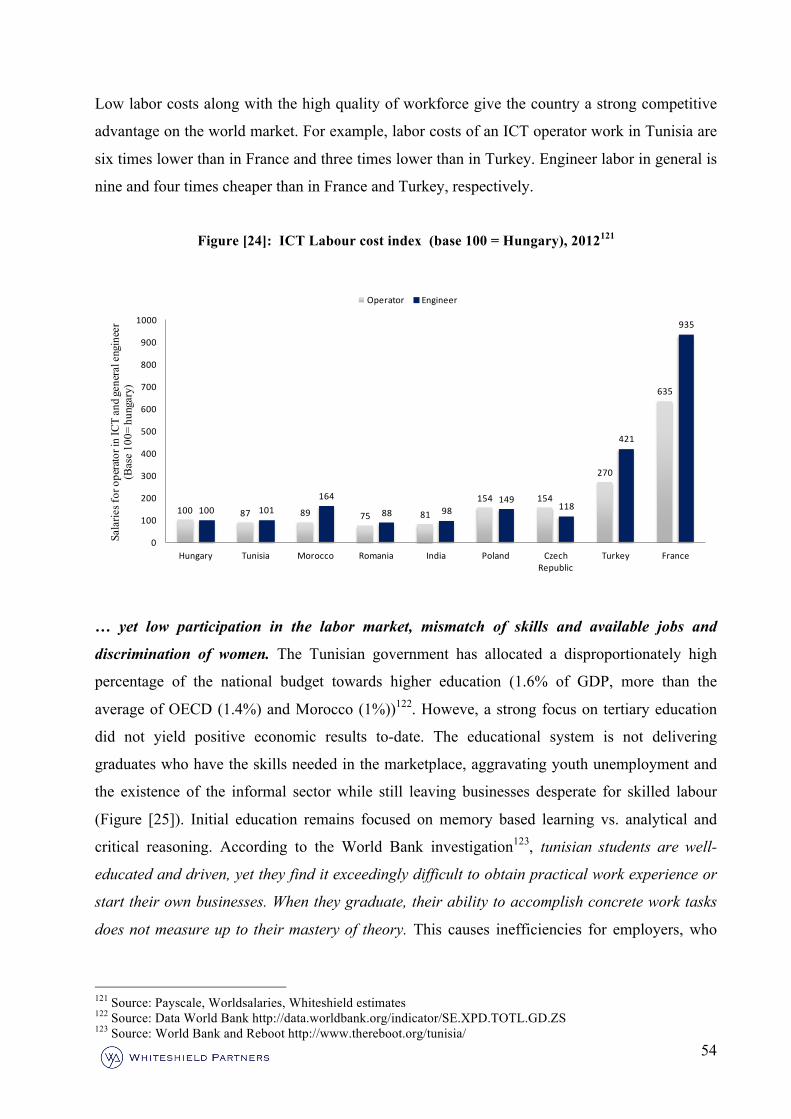
54
Low labor costs along with the high quality of workforce give the country a strong competitive
advantage on the world market. For example, labor costs of an ICT operator work in Tunisia are
six times lower than in France and three times lower than in Turkey. Engineer labor in general is
nine and four times cheaper than in France and Turkey, respectively.
Figure [24]: ICT Labour cost index (base 100 = Hungary), 2012121
… yet low participation in the labor market, mismatch of skills and available jobs and
discrimination of women. The Tunisian government has allocated a disproportionately high
percentage of the national budget towards higher education (1.6% of GDP, more than the
average of OECD (1.4%) and Morocco (1%))122. Howeve, a strong focus on tertiary education
did not yield positive economic results to-date. The educational system is not delivering
graduates who have the skills needed in the marketplace, aggravating youth unemployment and
the existence of the informal sector while still leaving businesses desperate for skilled labour
(Figure [25]). Initial education remains focused on memory based learning vs. analytical and
critical reasoning. According to the World Bank investigation123, tunisian students are well-
educated and driven, yet they find it exceedingly difficult to obtain practical work experience or
start their own businesses. When they graduate, their ability to accomplish concrete work tasks
does not measure up to their mastery of theory. This causes inefficiencies for employers, who
121 Source: Payscale, Worldsalaries, Whiteshield estimates 122 Source: Data World Bank http://data.worldbank.org/indicator/SE.XPD.TOTL.GD.ZS 123 Source: World Bank and Reboot http://www.thereboot.org/tunisia/
100 87 89 75 81
154 154
270
635
100 101164
88 98149
118
421
935
0
100
200
300
400
500
600
700
800
900
1000
Hungary Tunisia Morocco Romania India Poland Czech Republic
Turkey France
Sala
ries f
or o
pera
tor i
n IC
T an
d ge
nera
l eng
inee
r (B
ase
100=
hun
gary
)
Operator Engineer
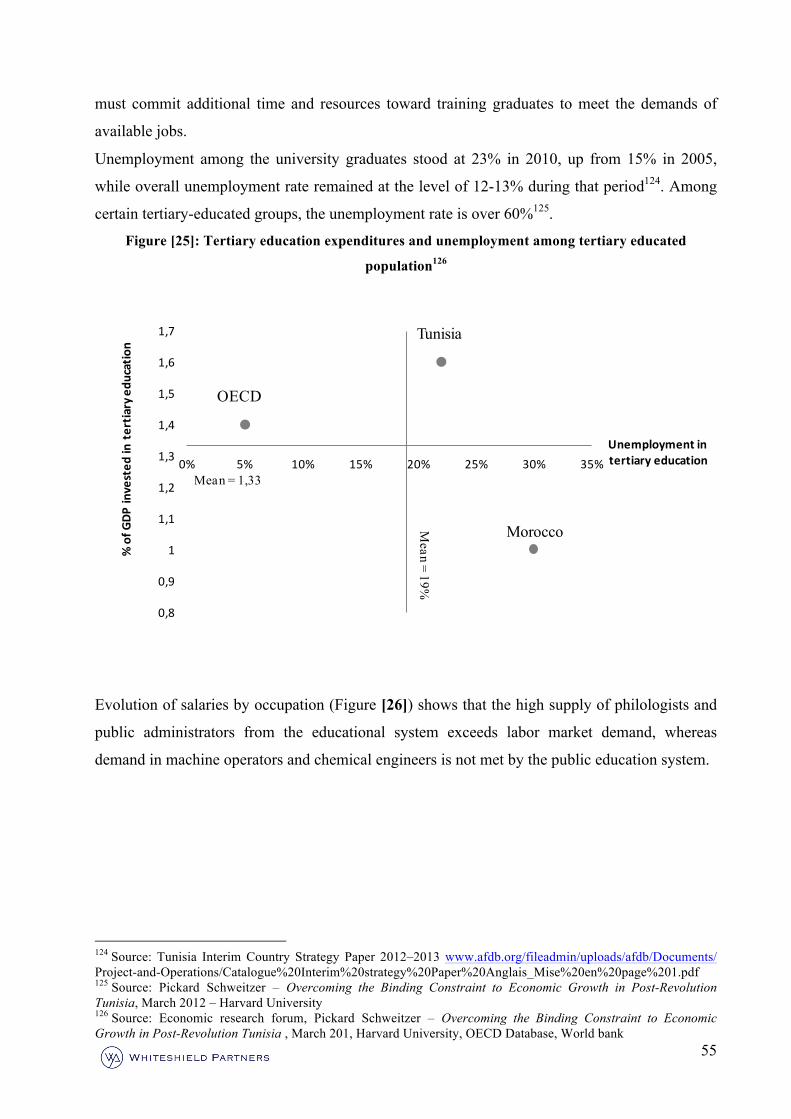
55
must commit additional time and resources toward training graduates to meet the demands of
available jobs.
Unemployment among the university graduates stood at 23% in 2010, up from 15% in 2005,
while overall unemployment rate remained at the level of 12-13% during that period124. Among
certain tertiary-educated groups, the unemployment rate is over 60%125.
Figure [25]: Tertiary education expenditures and unemployment among tertiary educated
population126
Evolution of salaries by occupation (Figure [26]) shows that the high supply of philologists and
public administrators from the educational system exceeds labor market demand, whereas
demand in machine operators and chemical engineers is not met by the public education system.
124 Source: Tunisia Interim Country Strategy Paper 2012–2013 www.afdb.org/fileadmin/uploads/afdb/Documents/ Project-and-Operations/Catalogue%20Interim%20strategy%20Paper%20Anglais_Mise%20en%20page%201.pdf 125 Source: Pickard Schweitzer – Overcoming the Binding Constraint to Economic Growth in Post-Revolution Tunisia, March 2012 – Harvard University 126 Source: Economic research forum, Pickard Schweitzer – Overcoming the Binding Constraint to Economic Growth in Post-Revolution Tunisia , March 201, Harvard University, OECD Database, World bank
Tunisia
Morocco
OECD
0,8
0,9
1
1,1
1,2
1,3
1,4
1,5
1,6
1,7
0% 5% 10% 15% 20% 25% 30% 35%
% of G
DP in
vested
in tertia
ry edu
catio
n
Unemployment intertiary education
Mean =
19%
Mean = 1,33
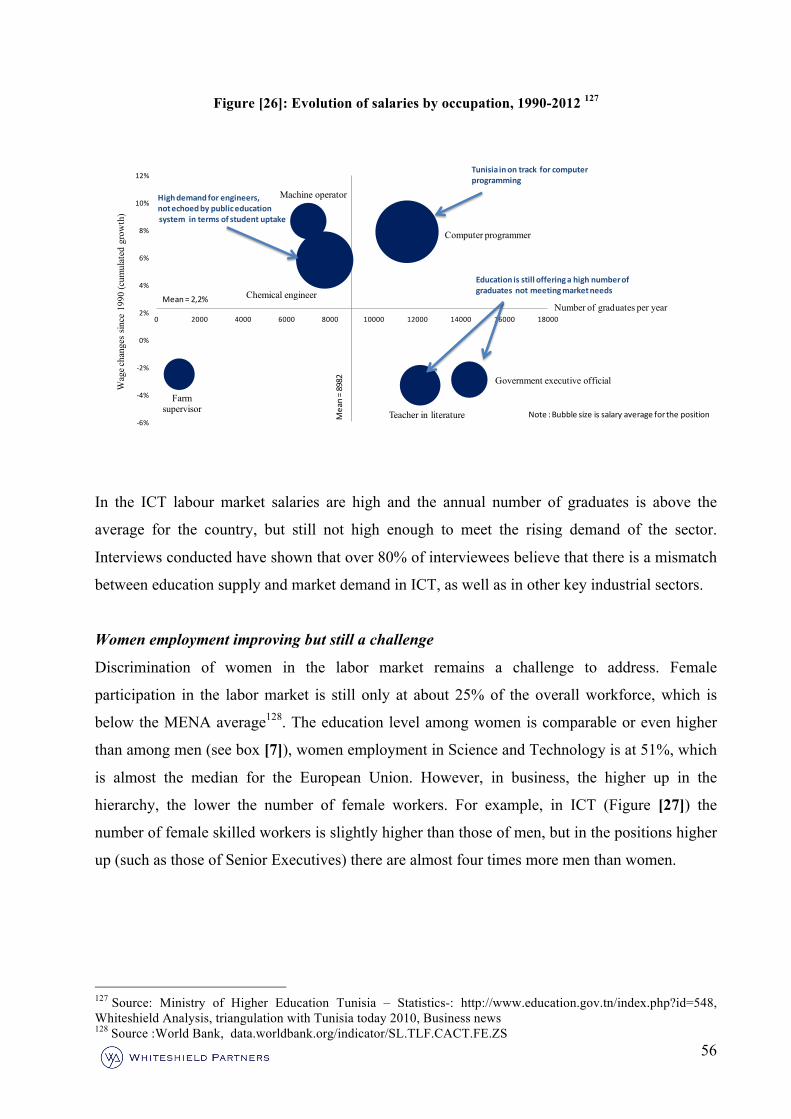
56
Figure [26]: Evolution of salaries by occupation, 1990-2012 127
In the ICT labour market salaries are high and the annual number of graduates is above the
average for the country, but still not high enough to meet the rising demand of the sector.
Interviews conducted have shown that over 80% of interviewees believe that there is a mismatch
between education supply and market demand in ICT, as well as in other key industrial sectors.
Women employment improving but still a challenge
Discrimination of women in the labor market remains a challenge to address. Female
participation in the labor market is still only at about 25% of the overall workforce, which is
below the MENA average128. The education level among women is comparable or even higher
than among men (see box [7]), women employment in Science and Technology is at 51%, which
is almost the median for the European Union. However, in business, the higher up in the
hierarchy, the lower the number of female workers. For example, in ICT (Figure [27]) the
number of female skilled workers is slightly higher than those of men, but in the positions higher
up (such as those of Senior Executives) there are almost four times more men than women.
127 Source: Ministry of Higher Education Tunisia – Statistics-: http://www.education.gov.tn/index.php?id=548, Whiteshield Analysis, triangulation with Tunisia today 2010, Business news 128 Source :World Bank, data.worldbank.org/indicator/SL.TLF.CACT.FE.ZS
Farm supervisor
Machine operator
Computer programmer
Chemical engineer
Teacher in literature
Government executive official
-‐6%
-‐4%
-‐2%
0%
2%
4%
6%
8%
10%
12%
0 2000 4000 6000 8000 10000 12000 14000 16000 18000
High demand for engineers,not echoed by public educationsystem in terms of student uptake
Number of graduates per year
Wag
e cha
nges
sin
ce 1
990
(cum
ulat
ed g
row
th)
Tunisia in on track for computer programming
Education is still offering a high number of graduates not meeting market needs
Note : Bubble size is salary average for the position Mean = 8982
Mean = 2,2%
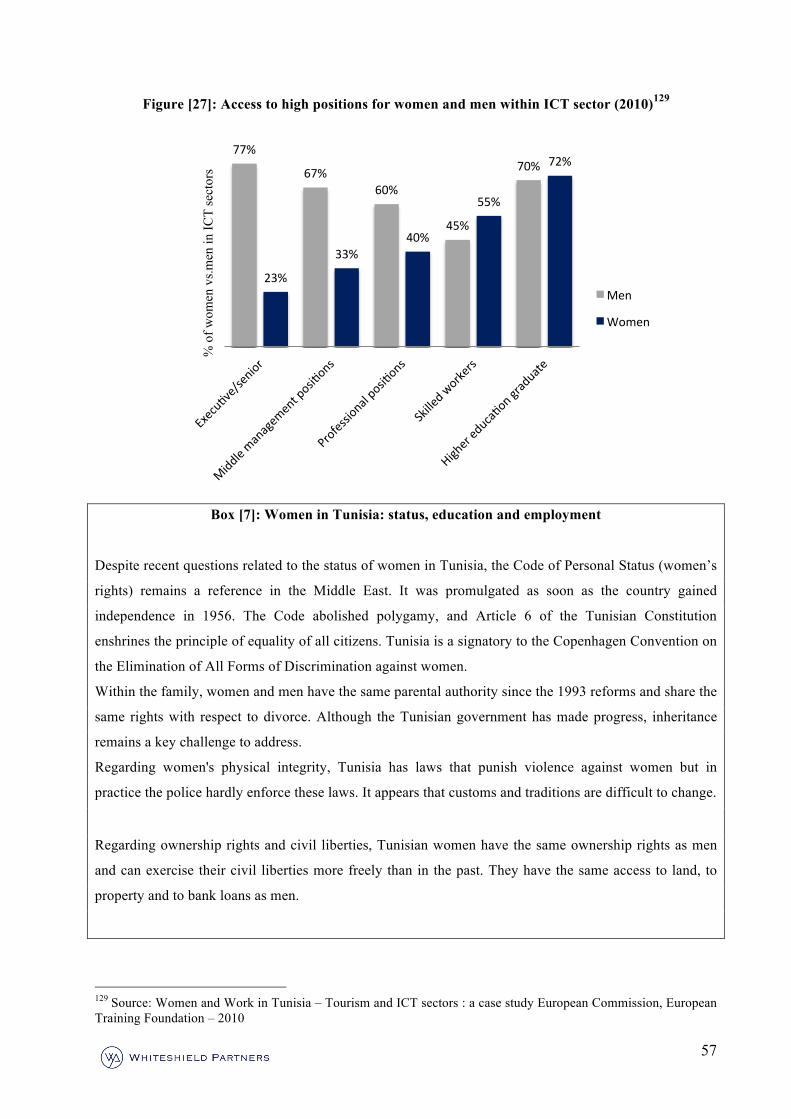
57
Figure [27]: Access to high positions for women and men within ICT sector (2010)129
Box [7]: Women in Tunisia: status, education and employment
Despite recent questions related to the status of women in Tunisia, the Code of Personal Status (women’s
rights) remains a reference in the Middle East. It was promulgated as soon as the country gained
independence in 1956. The Code abolished polygamy, and Article 6 of the Tunisian Constitution
enshrines the principle of equality of all citizens. Tunisia is a signatory to the Copenhagen Convention on
the Elimination of All Forms of Discrimination against women.
Within the family, women and men have the same parental authority since the 1993 reforms and share the
same rights with respect to divorce. Although the Tunisian government has made progress, inheritance
remains a key challenge to address.
Regarding women's physical integrity, Tunisia has laws that punish violence against women but in
practice the police hardly enforce these laws. It appears that customs and traditions are difficult to change.
Regarding ownership rights and civil liberties, Tunisian women have the same ownership rights as men
and can exercise their civil liberties more freely than in the past. They have the same access to land, to
property and to bank loans as men.
129 Source: Women and Work in Tunisia – Tourism and ICT sectors : a case study European Commission, European Training Foundation – 2010
77%
67% 60%
45%
70%
23%
33% 40%
55%
72%
% o
f wom
en v
s.men
in IC
T se
ctor
s
Men
Women
58
Women have had the right to vote since 1957. According to the 2012 World Economic Forum Global
Gender Gap report Tunisia is ranked 108th among 134 countries, still better than its peers (Morocco is
ranked 129th in 2011). 130
In the field of education, the schooling rate is the same for girls and boys. Schooling is free of charge and
compulsory. The obligation to attend school has been strengthened since 1991 by means of a law which
penalizes withdrawal of children from the school curriculum, especially young girls. In terms of
education, women are achieving better results than their male peers with 209,064 girls out of 339,619
students (61.6%) enrolled in higher education in 2011-2012.131 With 10,579 female teachers out of a total
of 22,410 (47.2%)132 in higher education, gender parity has almost been achieved. Tunisia is also ahead
compared to its peers in terms of female enrolment ratio, with a female secondary enrolment ratio of
93.1% vs. 72.9% for MENA133.
However, in terms of employment women only account for 25% 134of the active working population in
2011. Unemployment rate among women is eight points higher than among men (18.9% against 10.9% in
2010135. Thus, there is need to improve these indicators structurally in the medium term.
The mismatch between supply and demand in the labour market and discrimination of women
results in high unemployment and low female participation in the workforce. Consequently,
despite record-high proportions of working-age population (median age for the country is 30
years both for men and women136), their participation in the labor force has remained steady at
around 48%, and has been the lowest in the region since the early 1990s. This issue was expected
to be addressed by the government through the “Horizon 2016 Plan”. Some incentives already
exist today: for example the government pays for 70% of post university training schemes for
young graduates to compensate for the lack of “operational training” before their first
employment.
130 Source: World Economic Forum – Global Gender Gap Report 2012 131 Source: Ministry of Higher Education Tunisia – Statistics-: http://www.education.gov.tn/index.php?id=548 132 Source: Ministry of Higher Education Tunisia– Statistics-: http://www.education.gov.tn/index.php?id=548 133 Source: Data World Bank, http://data.worldbank.org/indicator/SE.SEC.ENRR.FE 134 Source: Enquête nationale sur l’emploi Tunisie 2011 135 Source: Tunisia Interim Country Strategy Paper 2012–2013 Project-and-Operations/Catalogue%20Interim%20strategy%20Paper%20Anglais_Mise%20en%20page%201.pdf 136 Source: Central Intelligence Agency https://www.cia.gov/library/publications/the-world-factbook/
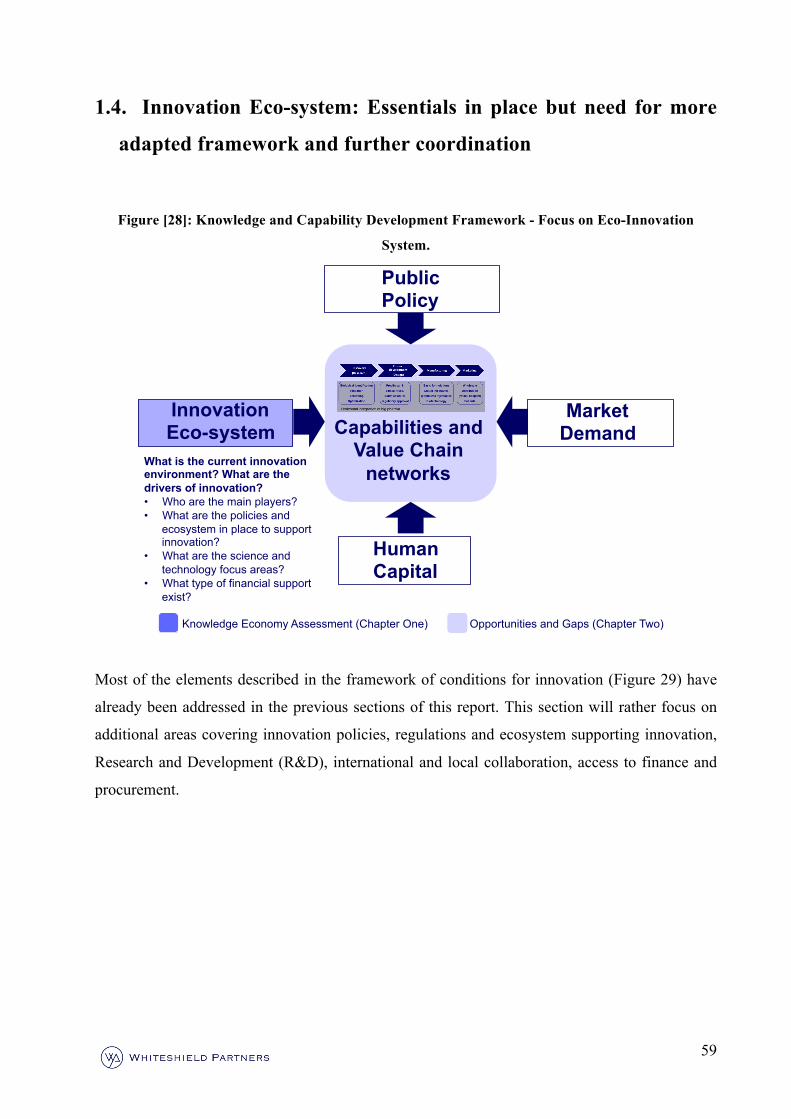
59
1.4. Innovation Eco-system: Essentials in place but need for more
adapted framework and further coordination
Figure [28]: Knowledge and Capability Development Framework - Focus on Eco-Innovation
System.
Most of the elements described in the framework of conditions for innovation (Figure 29) have
already been addressed in the previous sections of this report. This section will rather focus on
additional areas covering innovation policies, regulations and ecosystem supporting innovation,
Research and Development (R&D), international and local collaboration, access to finance and
procurement.
Innovation Eco-system
Human Capital
Market Demand Capabilities and
Value Chain networks
Knowledge Economy Assessment (Chapter One) Opportunities and Gaps (Chapter Two)
What is the current innovation environment? What are the drivers of innovation? • Who are the main players? • What are the policies and
ecosystem in place to support innovation?
• What are the science and technology focus areas?
• What type of financial support exist?
Public Policy
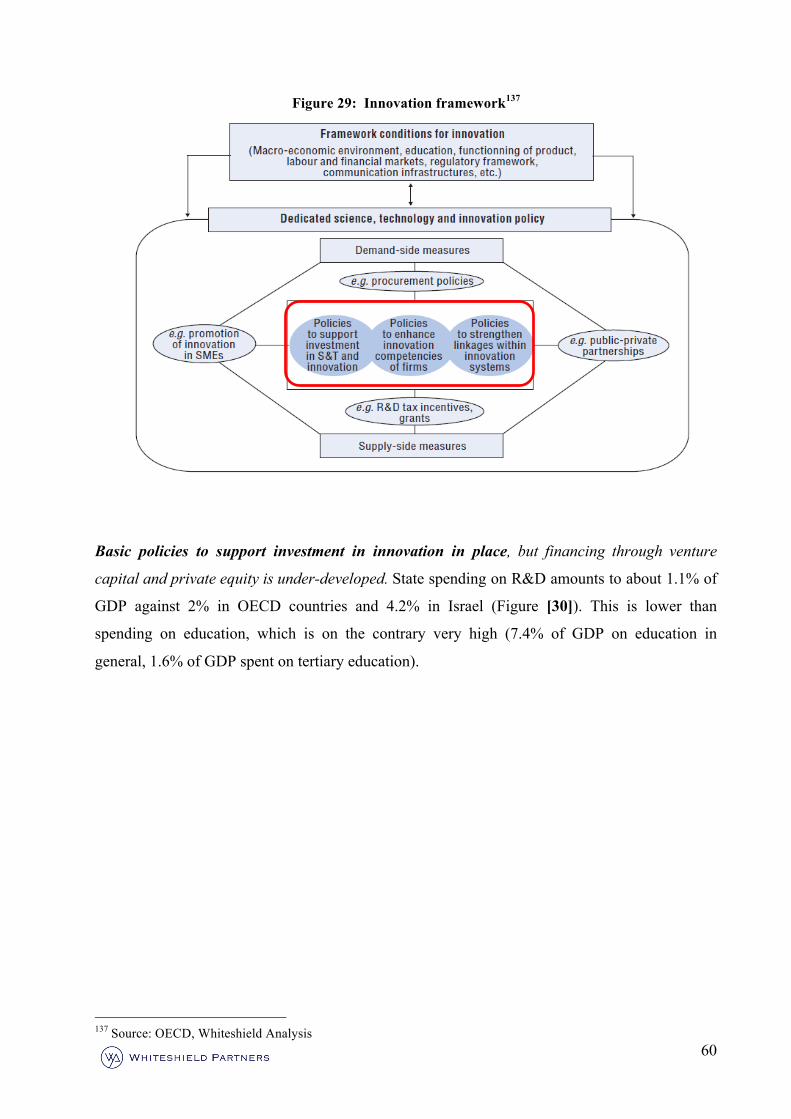
60
Figure 29: Innovation framework137
Basic policies to support investment in innovation in place, but financing through venture
capital and private equity is under-developed. State spending on R&D amounts to about 1.1% of
GDP against 2% in OECD countries and 4.2% in Israel (Figure [30]). This is lower than
spending on education, which is on the contrary very high (7.4% of GDP on education in
general, 1.6% of GDP spent on tertiary education).
137 Source: OECD, Whiteshield Analysis
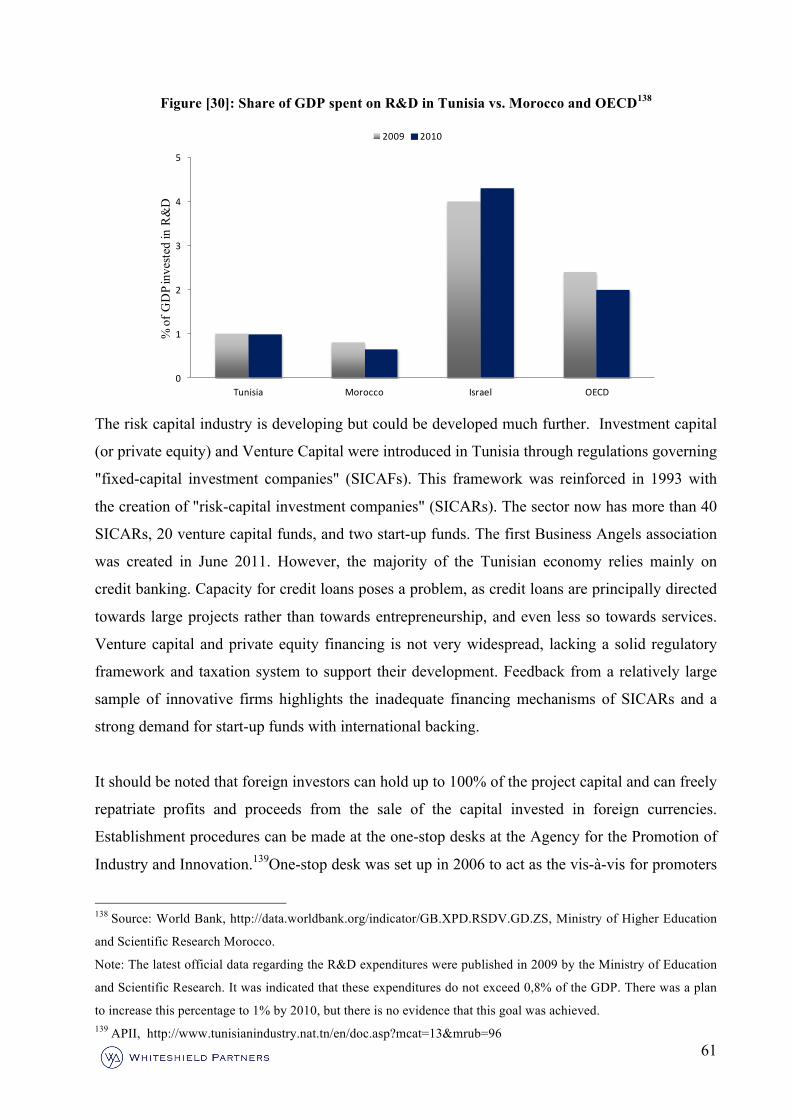
61
Figure [30]: Share of GDP spent on R&D in Tunisia vs. Morocco and OECD138
The risk capital industry is developing but could be developed much further. Investment capital
(or private equity) and Venture Capital were introduced in Tunisia through regulations governing
"fixed-capital investment companies" (SICAFs). This framework was reinforced in 1993 with
the creation of "risk-capital investment companies" (SICARs). The sector now has more than 40
SICARs, 20 venture capital funds, and two start-up funds. The first Business Angels association
was created in June 2011. However, the majority of the Tunisian economy relies mainly on
credit banking. Capacity for credit loans poses a problem, as credit loans are principally directed
towards large projects rather than towards entrepreneurship, and even less so towards services.
Venture capital and private equity financing is not very widespread, lacking a solid regulatory
framework and taxation system to support their development. Feedback from a relatively large
sample of innovative firms highlights the inadequate financing mechanisms of SICARs and a
strong demand for start-up funds with international backing.
It should be noted that foreign investors can hold up to 100% of the project capital and can freely
repatriate profits and proceeds from the sale of the capital invested in foreign currencies.
Establishment procedures can be made at the one-stop desks at the Agency for the Promotion of
Industry and Innovation.139One-stop desk was set up in 2006 to act as the vis-à-vis for promoters
138 Source: World Bank, http://data.worldbank.org/indicator/GB.XPD.RSDV.GD.ZS, Ministry of Higher Education
and Scientific Research Morocco.
Note: The latest official data regarding the R&D expenditures were published in 2009 by the Ministry of Education
and Scientific Research. It was indicated that these expenditures do not exceed 0,8% of the GDP. There was a plan
to increase this percentage to 1% by 2010, but there is no evidence that this goal was achieved. 139 APII, http://www.tunisianindustry.nat.tn/en/doc.asp?mcat=13&mrub=96
0
1
2
3
4
5
Tunisia Morocco Israel OECD
% o
f GD
P in
vest
ed in
R&
D
2009 2010
62
to carry out the formalities required to set up a business. According to FIPA official site, “this
office is in charge of carrying out on their behalf, within 24 hours of the submission of a request
and determination that it is complete, the formalities required to set up a legal entity, be it a
private individual (individual company) or corporate entity (limited company, ‘uni personal’
limited company, limited liability company)”. However, such a one stop shop does not exist for
innovative firms.
Policies to enhancing innovation competencies of firms lack coordination and private sector
involvement
Several national institutions provide active support and assistance to innovation and investors
efficiently: the Foreign Investment Promotion Agency (FIPA-Tunisia), the Agency for the
Promotion of Industry and Innovation (APII), the Center for Export Promotion (CEPEX),
Technical Center for Mechanical and Electronic Industries (CETIME), The Agency for
Agricultural Investment Promotion (APIA), The Tunisian Tourism National Board (ONTT).
However, there is strong demand for private sector support. Few but growing private innovation
initiative comes from e.g. Tunisiana Start Up Factory and WikiStart UP. Tunisiana StartUp
Factory was launched in October, 2012 by the Telecom operator Tunisiana. The incubator is
aiming at creating startups developing mobile apps. Tunisiana has allocated a 1.2 M€ fund for
this incubator; with investments per incubation project ranging from 23,000 to 46,000 €. The
management of this fund was delegated to the financial investment firm UGFS. Beyond the
financing of the projects, Tunisiana offers the incubated startups access to a business
infrastructure, mentorship and business advisory. The initiative is sponsored also by the
following companies/institutions: Microsoft, Google, Alcatel Lucent, Bull, BFPME, SupCom,
l’ENIS, and the GIZ. The initiative has just started; however, it is expected to create 5 startups
by the end of 2013 and 10 startups each year for the following 4 years.
Wikistartup was created in 2011with an initial investment from business angels (including M.
Mondher Khanfir who is the current GM). The incubator offers the following services: Venture
Catalyst services (assistance in planning the project, risk analysis and refinement of the business
plan, assessment of resources requirement); Venture Fundraising services (development of the
financing plan and fundraising strategy, project management and control of the process of raising
capital); Business Development Services (technical assistance in drafting the investment plan,
project management and control of the process of raising capital). As of late 2012, 12 companies
63
were incubated in Wikistartup and 21 scientific spin-off projects are in the pipeline. The projects
required between 0.15M€ and 1.5M€ of investments.
However, much more could be done including defining clear criteria in the law defining young
innovative companies, how they could benefit from tax reliefs, support in public procurement
like in Korea or training support.
Box [8]: Intellectual Property in place but effective global IP rights still expensive 140
The IP rights situation is improving in Tunisia but still efforts are required to reach international
standards. The 2012 International Property Rights report ranked Tunisia 11 of 18 in MENA and 73 of
130 worldwide in Intellectual Property Rights with a rating of 5.4 on a scale of 1 to 10 (1 being the worst)
and with a poor 71 of 130 (2.8) in copyright piracy.
Overall, the legal framework governing intellectual property is close to international standards, but falls
short in its enforcement, especially with respect to piracy, which needs to be improved.
Indeed, Tunisia is a member of the World Intellectual Property Organization (WIPO) and has signed the
Berne Convention for the Protection of Literary and Artistic Works and the Paris Convention for the
Protection of Industrial Property. It has also adhered to the principle international treaties offering
investors the opportunity to register intellectual property rights, the Hague Agreement (industrial designs
and models) and the Patent Cooperation Treaty. Tunisia has, however, withdrawn from the Madrid
Agreement regarding trademarks.
Patent applications are examined by the Patent Office and are published together with the grant of a
patent in the Official Gazette. At the end of 2008 INNORPI (National Institute for Standardization &
Industrial Properties) was managing around 5,550 patents, more than 62,000 trademarks and almost 3,200
industrial designs. The Tunisian Institution for the Protection of Copyright is in charge of applying the
Tunisian Copyright Law of 1994, which determined the Copyright as the right of the owner to have the
exclusive right to copy the work in a material form.
Although national IP rights are in place, effective protection of IP at the global level remains a challenge
due to high cost of registration.
Strengthening linkages within innovation system: policies in place, but innovation eco-system
is only emerging.
140WIPO, IPR 2012, United Nations, INNORPI
64
According to the Tunisian Strategic Social and Economic Development Plan141, “reforms will be
directed towards development of the national innovation system through the creation of clusters
in promising sectors and the development of partnerships between universities, companies and
research centres. In addition, creating technologic zones to attract investment in high
technological value activities”. In 2012, only one ‘technopole’ –EL Ghazala - was fully
operational. Several others, for example, Biotechnology technopark Sidi Thabet, Agriculture
cluster in Bizerte, Textile cluster in Monastir, though partially active, are still under
construction.
According to APII, there were only 11 business incubators in 2005 and 518 promoters versus
more than 1,900 promoters and 30 incubators in 2012142. The existing incubators are relatively
well-distributed across the country and provide an infrastructure that can be improved and
iterated upon. Physical locations are useful for lowering startup costs for entrepreneurs, because
they are housed in technoparks. Incubators often have better access to ICTs than the surrounding
region. However, there is no accurate metrics for judging incubator success. Incubators are
evaluated based on imprecise indicators, such as occupancy rates and number of foreign visitors.
Many stakeholders in the incubator community would prefer to see their performance measured
by total revenue earned, jobs created by resident companies, or other indicators that track more
accurately to the amount of economic value generated by incubator activities143.
Sector specific innovation nascent yet has a high potential
In the ICT sector, two main public initiatives: (1) Construction and equipment of additional
premises covering an area of 100,000 m² within the scope of ElGhazala Pole but also extension
to new areas in the governmental areas of Ariana and La Manouba, and additional premises to be
created with a surface of 100,000 m² distributed between the technological areas in Sousse and
Sfax. (2) A new ICT one-stop service has recently opened. Its mission is to encourage
employment and investment in this field. The one stop service offers the possibility to bring
together in a single place various service providers in import and export of electronic
communication systems and equipment. It also includes a survey and research center devoted to
141 Source: Strategic Social and Economic Development Plan 2012-2016 142 Source: APII, http://www.investintunisia.tn/site/en/article.php?id_article=828, Whiteshield interviews 143 Source: A report by the World Bank & Reboot, “From revolution to Institutions”, 2012 http://www.thereboot.org/tunisia/entrep.html
65
the communication sector: the National Frequencies Agency and the Electronic Certification
National Agency144.
International collaboration between universities and research institutes being promoted. Efforts
are made to increase international collaboration. For example, in the Aeronautics sector the
company Aerolia as a main foreign investor created a research and training centre in Meghira to
train young graduates. The company ST Microelectronics does the same in the EEI sector.In
December 2010 The French organization Réseau Entreprendre launched offices in Tunis and the
coastal city Monastir looking to incubate entrepreneurial talent in Tunisia through mentors that
belong to local networks of experienced entrepreneurs145.
There are also examples of integration of existing research institutes into universities, for
example, in the agriculture field, where IRESA (l’Institution de recherche et d’enseignement
supérieur agricoles) has merged with INRA (Institut National de Recherche Agriconomique).
Box [9]: Geographical distribution of technoparks and business incubators in Tunisia
Tunis, Sfax, Meghira and Sousse, are regions leading knowledge-based development in Tunisia.
The map below shows the distribution of technoparks in Tunisia. So far, only El Ghazala is operating, and
it is aimed at developing ICT in the country with more than 90 firms and 2,000 jobs. Several others are
being constructed in the country.
144 Source: FIPA Tunisia, http://www.investintunisia.tn/site/en/article.php?id_article=828 145Source: Tunisialive, http://www.tunisia-live.net/2012/11/28/hothousing-entrepreneurial-talent-picks-up-in-tunisia/
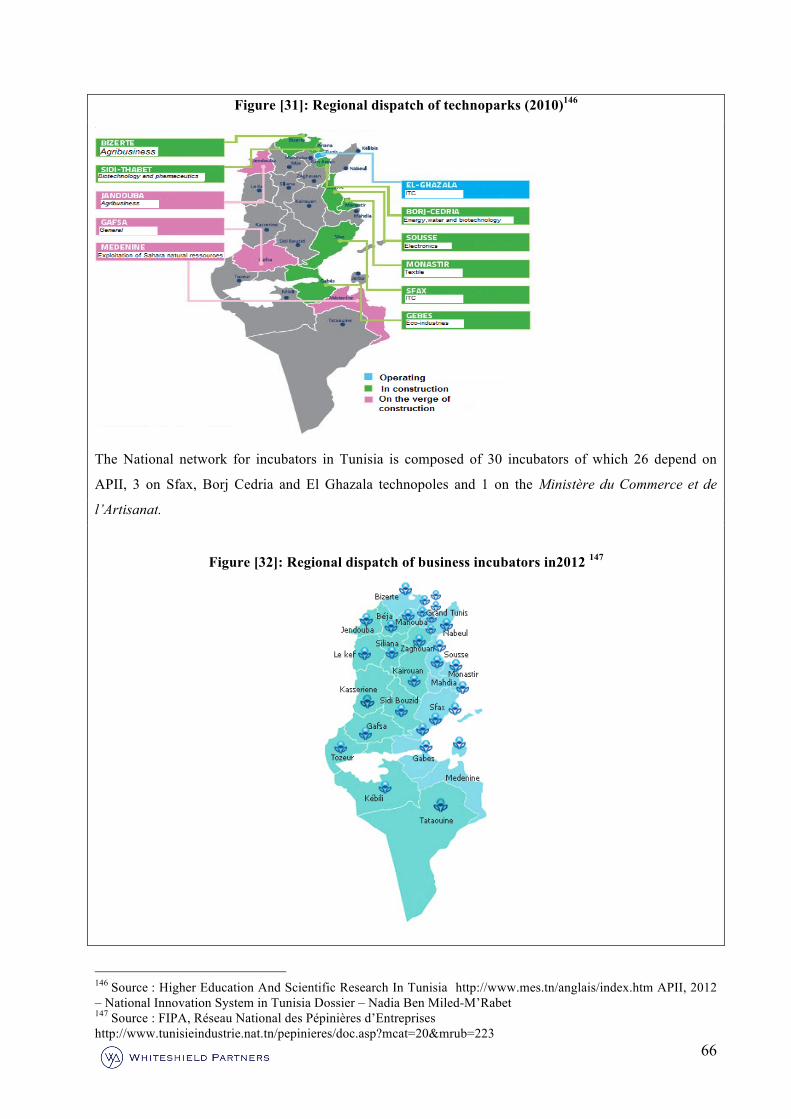
66
Figure [31]: Regional dispatch of technoparks (2010)146
The National network for incubators in Tunisia is composed of 30 incubators of which 26 depend on
APII, 3 on Sfax, Borj Cedria and El Ghazala technopoles and 1 on the Ministère du Commerce et de
l’Artisanat.
Figure [32]: Regional dispatch of business incubators in2012 147
146 Source : Higher Education And Scientific Research In Tunisia http://www.mes.tn/anglais/index.htm APII, 2012 – National Innovation System in Tunisia Dossier – Nadia Ben Miled-M’Rabet 147 Source : FIPA, Réseau National des Pépinières d’Entreprises http://www.tunisieindustrie.nat.tn/pepinieres/doc.asp?mcat=20&mrub=223
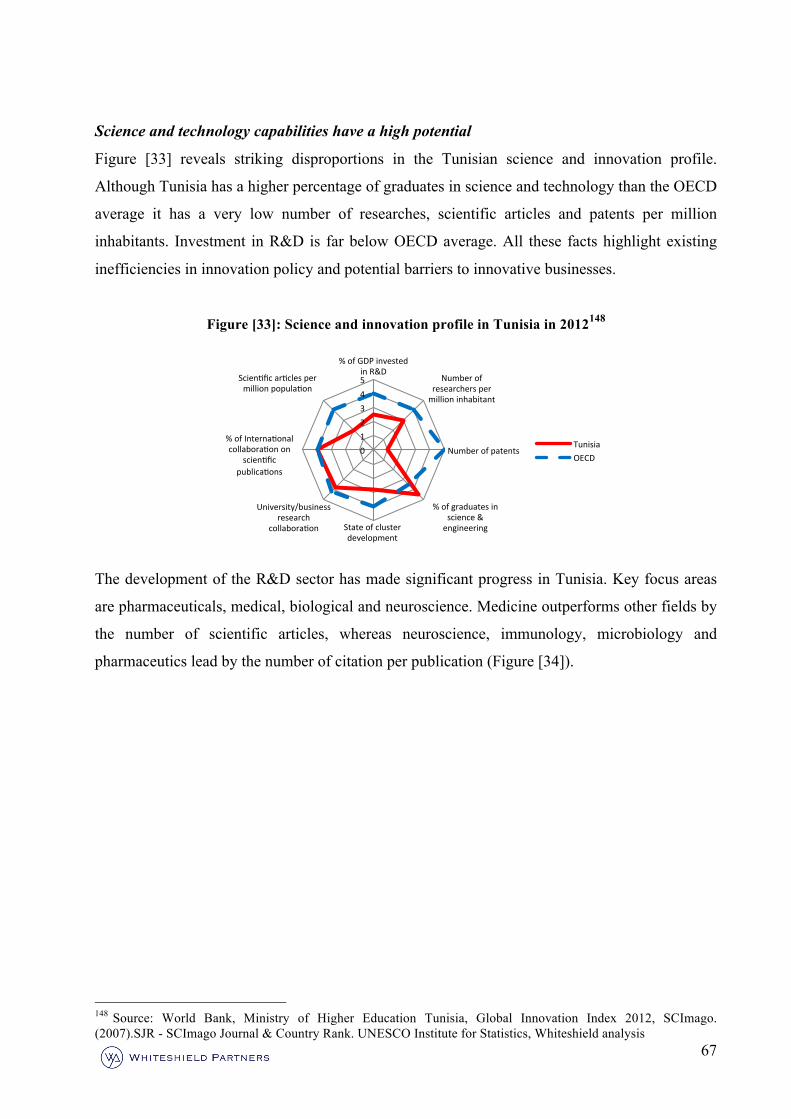
67
Science and technology capabilities have a high potential
Figure [33] reveals striking disproportions in the Tunisian science and innovation profile.
Although Tunisia has a higher percentage of graduates in science and technology than the OECD
average it has a very low number of researches, scientific articles and patents per million
inhabitants. Investment in R&D is far below OECD average. All these facts highlight existing
inefficiencies in innovation policy and potential barriers to innovative businesses.
Figure [33]: Science and innovation profile in Tunisia in 2012148
The development of the R&D sector has made significant progress in Tunisia. Key focus areas
are pharmaceuticals, medical, biological and neuroscience. Medicine outperforms other fields by
the number of scientific articles, whereas neuroscience, immunology, microbiology and
pharmaceutics lead by the number of citation per publication (Figure [34]).
148 Source: World Bank, Ministry of Higher Education Tunisia, Global Innovation Index 2012, SCImago. (2007).SJR - SCImago Journal & Country Rank. UNESCO Institute for Statistics, Whiteshield analysis
% of GDP invested in R&D
Number of researchers per million inhabitant
Number of patents
% of graduates in science & engineering State of cluster
development
University/business research
collaboraDon
% of InternaDonal collaboraDon on
scienDfic publicaDons
ScienDfic arDcles per million populaDon
0 1 2 3 4 5
Tunisia OECD
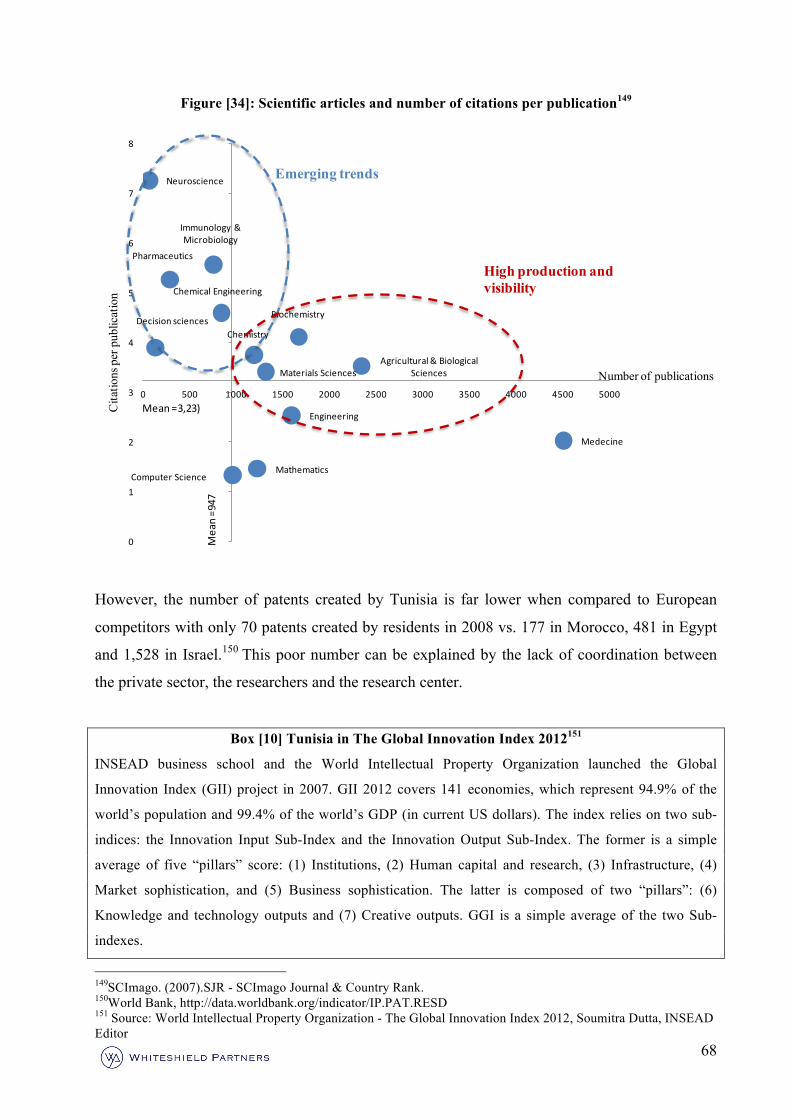
68
Figure [34]: Scientific articles and number of citations per publication149
However, the number of patents created by Tunisia is far lower when compared to European
competitors with only 70 patents created by residents in 2008 vs. 177 in Morocco, 481 in Egypt
and 1,528 in Israel.150 This poor number can be explained by the lack of coordination between
the private sector, the researchers and the research center.
Box [10] Tunisia in The Global Innovation Index 2012151
INSEAD business school and the World Intellectual Property Organization launched the Global
Innovation Index (GII) project in 2007. GII 2012 covers 141 economies, which represent 94.9% of the
world’s population and 99.4% of the world’s GDP (in current US dollars). The index relies on two sub-
indices: the Innovation Input Sub-Index and the Innovation Output Sub-Index. The former is a simple
average of five “pillars” score: (1) Institutions, (2) Human capital and research, (3) Infrastructure, (4)
Market sophistication, and (5) Business sophistication. The latter is composed of two “pillars”: (6)
Knowledge and technology outputs and (7) Creative outputs. GGI is a simple average of the two Sub-
indexes.
149SCImago. (2007).SJR - SCImago Journal & Country Rank. 150World Bank, http://data.worldbank.org/indicator/IP.PAT.RESD 151 Source: World Intellectual Property Organization - The Global Innovation Index 2012, Soumitra Dutta, INSEAD Editor
Medecine
Agricultural & Biological Sciences
Biochemistry
Chemical Engineering
Chemistry
Computer Science
Decision sciences
Engineering
Immunology & Microbiology
Materials Sciences
Mathematics
Neuroscience
Pharmaceutics
0
1
2
3
4
5
6
7
8
0 500 1000 1500 2000 2500 3000 3500 4000 4500 5000
Cita
tions
per
pub
licat
ion
Number of publications
Emerging trends
High production and visibility
Mean =947
Mean =3,23)
69
Tunisia is ranked 1st in Northern Africa, at position 59th (versus 66th position in 2011) just after Thailand
(57th) and Brazil (58th), and does better than Morocco (88th), Egypt (103rd), and Algeria (124th). Tunisia
received high score by Business environment (28th), Current expenditure on education (13th), Creative
intangibles (11th) and Innovation linkages (46th, including 1st position by PCT patent filling with foreign
investors and 20th by R&D financed from abroad). Political environment (72nd, including 108th position by
press freedom), Credit (104th), Trade and Competition (107th) and Knowledge absorption (109th) are
pushing the country down in the ranking.
Overall, the review of the innovation eco-system in Tunisia highlights solid capabilities for ICT,
EEI and Chemical sector development, yet numerous barriers to innovation including
inefficiency in the implementation of policy plans and the lack of efficient public-private
cooperation. This situation is reflected in the Global Innovation Index 2012 (Box [10]):
Knowledge absorption is the key non-political indicator pushing the country down in the
ranking, whereas Business environment, Spending on education, R&D and Innovative linkages
are not the binding constraints. There is a need for a stronger alignment between public R&D
and private sector demand through efficient clusters and technopoles, more solid intellectual
property protection rights and enforcement and a functional financial support system to boost
innovation.
70
Chapter 2
Gaps & Opportunities: Software services,
Electronics and Pharmaceutical sectors driving
innovation
71
2.1. Economic Complexity: Capabilities identified in ICT, Electric
and Electronic Industry and Pharmaceuticals
Chapter one focused on describing the current innovation base-line in Tunisia, however, key
underlying factors driving knowledge and innovation remain to be fully addressed:
• Where are capabilities and capability gaps?
• What are the drivers of innovation?
• Which value chain networks and products have a high potential? Which ones are to be
addressees in priority?
The Economic complexity approach was used to address these questions. As a reminder, the key
indicators of this approach are the:
• Economic Complexity Index (ECI), which shows productive knowledge and capabilities
of a country.
• Opportunity value (OV), showing opportunities for further capability-based development.
• Missing Products, indicating capability gaps in the economy.
These indicators apply only to exported goods152. Services are analysed based on the Revealed
Comparative Advantages in Offshoring sector 153.
A strong capability potential: a historical analysis highlighting a true success story
Starting with the analysis of historical capabilities in Tunisia: In 2001 the country had ECI of -
0.15 and OV of 0.14, which means that it had a low complexity economy with above median
potential to improve.
152 Note: Data on services is not provided by the customs, so there is not enough statistical data for such analysis 153 Note: For more details see definition box 1.
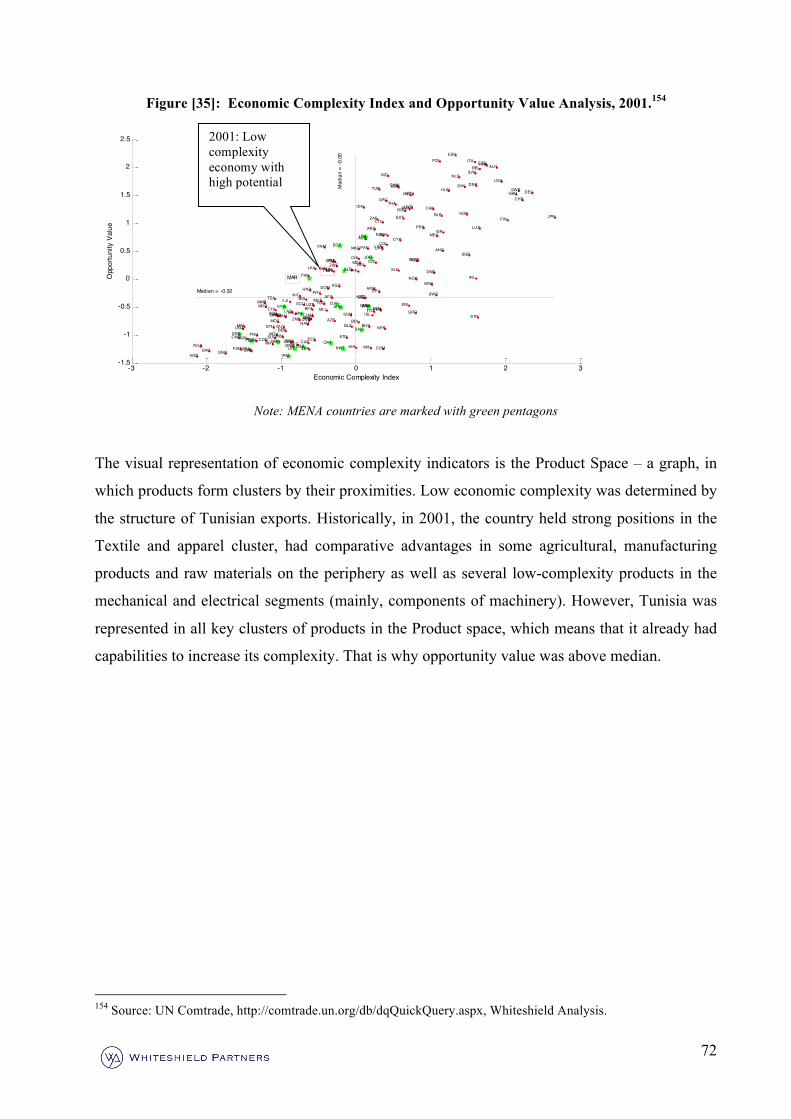
72
Figure [35]: Economic Complexity Index and Opportunity Value Analysis, 2001.154
Note: MENA countries are marked with green pentagons
The visual representation of economic complexity indicators is the Product Space – a graph, in
which products form clusters by their proximities. Low economic complexity was determined by
the structure of Tunisian exports. Historically, in 2001, the country held strong positions in the
Textile and apparel cluster, had comparative advantages in some agricultural, manufacturing
products and raw materials on the periphery as well as several low-complexity products in the
mechanical and electrical segments (mainly, components of machinery). However, Tunisia was
represented in all key clusters of products in the Product space, which means that it already had
capabilities to increase its complexity. That is why opportunity value was above median.
154 Source: UN Comtrade, http://comtrade.un.org/db/dqQuickQuery.aspx, Whiteshield Analysis.
-3 -2 -1 0 1 2 3-1.5
-1
-0.5
0
0.5
1
1.5
2
2.5
AFG
ALB
DZA
AND
AGO
ATG
ARG
ARM
AUS
AUT
AZEBHS
BHR
BGD
BRB
BLR
BEL
BLZBEN
BTN
BOL
BIH
BWA
BRA
BRN
BGR
BFA
BDIKHM
CMR
CAN
CPV
CAFTCD
CHL
CHN
COL
COM
COG COD
CRI
CIV
HRV
CUB
CYP
CZE
DNK
DJI
DMA
DOM
ECU
EGY
SLV
GNQ
ERI
EST
ETH
FJI
FIN
FRA
GAB
GMB
GEO
DEU
GHA
GRC
GRD
GTM
GIN
GNB
GUY
HTI
HND
HUN
ISL
IND
IDN
IRN
IRQ
IRL
ISR
ITA
JAM
JPN
JOR
KAZ
KEN
KIR
PRK
KOR
KWT
KGZ
LAO
LVA
LBN
LSOLBRLBY
LTULUX
MKD
MDG
MWI
MYS
MDV
MLI
MHLMRT
MUS
MEX
FSM
MDA
MNGMOZ
MMR
NAM
NPL
NLD
NZL
NIC
NER
NGA
NOR
OMN
PAK
PAN
PNG
PRY
PER
PHL
POL
PRT
QAT
ROU
RUS
RWA
STP
SAU
SEN
SYC
SLE
SGP
SVK
SVN
SOM
ZAF
ESP
LKA
SDNSUR
SWZ
SWE
CHE
SYR
TJK
TZA
THA
TGO
TTO
TUR
TKM
UGA
UKR
ARE
GBR
USA
URY
UZBVEN
VNM
YEM
ZMB
ZWE
MARTUN
Economic Complexity Index
Opp
ortu
nity
Val
ue
Median = -0.32
Med
ian
= -0
.00
2001: Low complexity economy with high potential
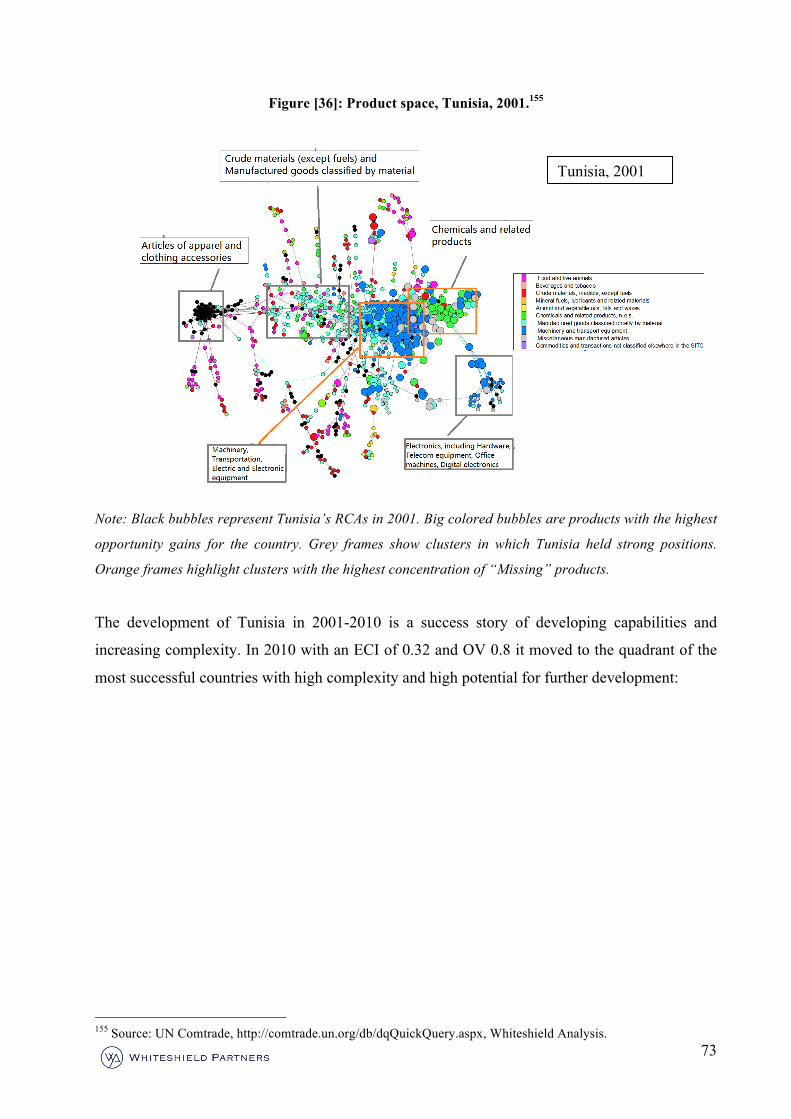
73
Figure [36]: Product space, Tunisia, 2001.155
Note: Black bubbles represent Tunisia’s RCAs in 2001. Big colored bubbles are products with the highest
opportunity gains for the country. Grey frames show clusters in which Tunisia held strong positions.
Orange frames highlight clusters with the highest concentration of “Missing” products.
The development of Tunisia in 2001-2010 is a success story of developing capabilities and
increasing complexity. In 2010 with an ECI of 0.32 and OV 0.8 it moved to the quadrant of the
most successful countries with high complexity and high potential for further development:
155 Source: UN Comtrade, http://comtrade.un.org/db/dqQuickQuery.aspx, Whiteshield Analysis.
Tunisia, 2001
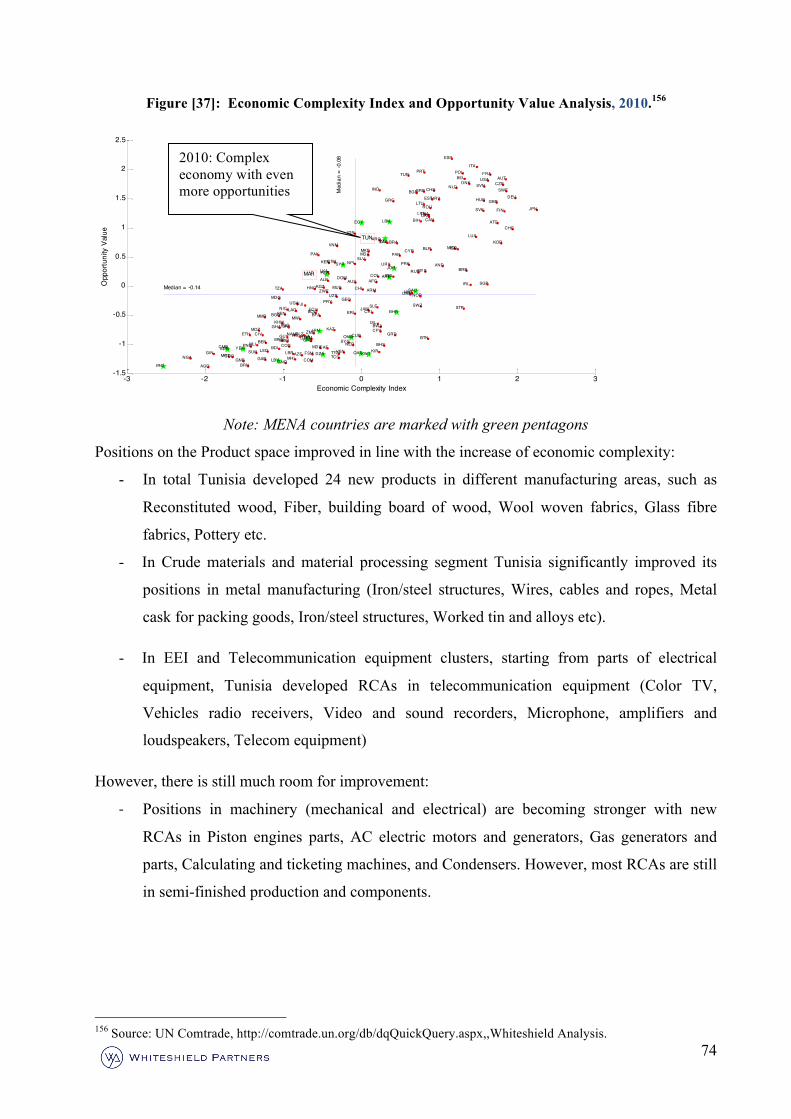
74
Figure [37]: Economic Complexity Index and Opportunity Value Analysis, 2010.156
Note: MENA countries are marked with green pentagons
Positions on the Product space improved in line with the increase of economic complexity:
- In total Tunisia developed 24 new products in different manufacturing areas, such as
Reconstituted wood, Fiber, building board of wood, Wool woven fabrics, Glass fibre
fabrics, Pottery etc.
- In Crude materials and material processing segment Tunisia significantly improved its
positions in metal manufacturing (Iron/steel structures, Wires, cables and ropes, Metal
cask for packing goods, Iron/steel structures, Worked tin and alloys etc).
- In EEI and Telecommunication equipment clusters, starting from parts of electrical
equipment, Tunisia developed RCAs in telecommunication equipment (Color TV,
Vehicles radio receivers, Video and sound recorders, Microphone, amplifiers and
loudspeakers, Telecom equipment)
However, there is still much room for improvement:
-‐ Positions in machinery (mechanical and electrical) are becoming stronger with new
RCAs in Piston engines parts, AC electric motors and generators, Gas generators and
parts, Calculating and ticketing machines, and Condensers. However, most RCAs are still
in semi-finished production and components.
156 Source: UN Comtrade, http://comtrade.un.org/db/dqQuickQuery.aspx,,Whiteshield Analysis.
-3 -2 -1 0 1 2 3-1.5
-1
-0.5
0
0.5
1
1.5
2
2.5
AFGALB
DZA
AND
AGO
ATG
ARG
ARM
AUS
AUT
AZE
BHS
BHRBGD
BRB
BLR
BEL
BLZ
BENBTN
BOL
BIH
BWA
BRA
BRN
BGR
BFA
BDI
KHM
CMR
CAN
CPV
CAF
TCD
CHL
CHN
COL
COMCOG
COD
CRI
CIV
HRV
CUB
CYP
CZEDNK
DJI
DMA
DOM
ECU
EGY
SLV
GNQ
ERI
EST
ETH
FJI
FIN
FRA
GAB
GMB
GEO
DEU
GHA
GRC
GRD
GTM
GINGNB
GUY HTI
HND
HUN
ISL
IND
IDN
IRN
IRQ
IRL
ISR
ITA
JAM
JPN
JOR
KAZ
KEN
KIR
PRK
KOR
KWT
KGZ
LAO
LVA
LBN
LSO LBRLBY
LTU
LUX
MKD
MDG
MWI
MYS
MDVMLI
MHLMRT
MUS
MEX
FSM
MDA
MNG
MNE
MOZ
MMR
NAM
NPL
NLD
NZL
NIC
NER
NGA
NOR
OMN
PAK PAN
PNG
PRY
PER PHL
POLPRT
QAT
ROU
RUS
RWA
STP
SAU
SEN
SRB
SYC
SLE
SGP
SVK
SVN
SOM
ZAF
ESP
LKA
SDNSUR
SWZ
SWE
CHE
SYR
TJK
TZA
THA
TGO
TTO
TUR
TKM
UGA
UKR
ARE
GBR
USA
URY
UZB
VEN
VNM
YEM
ZMB
ZWE
MAR
TUN
Economic Complexity Index
Opp
ortu
nity
Val
ue
Median = -0.14
Med
ian
= -0
.08 2010: Complex
economy with even more opportunities
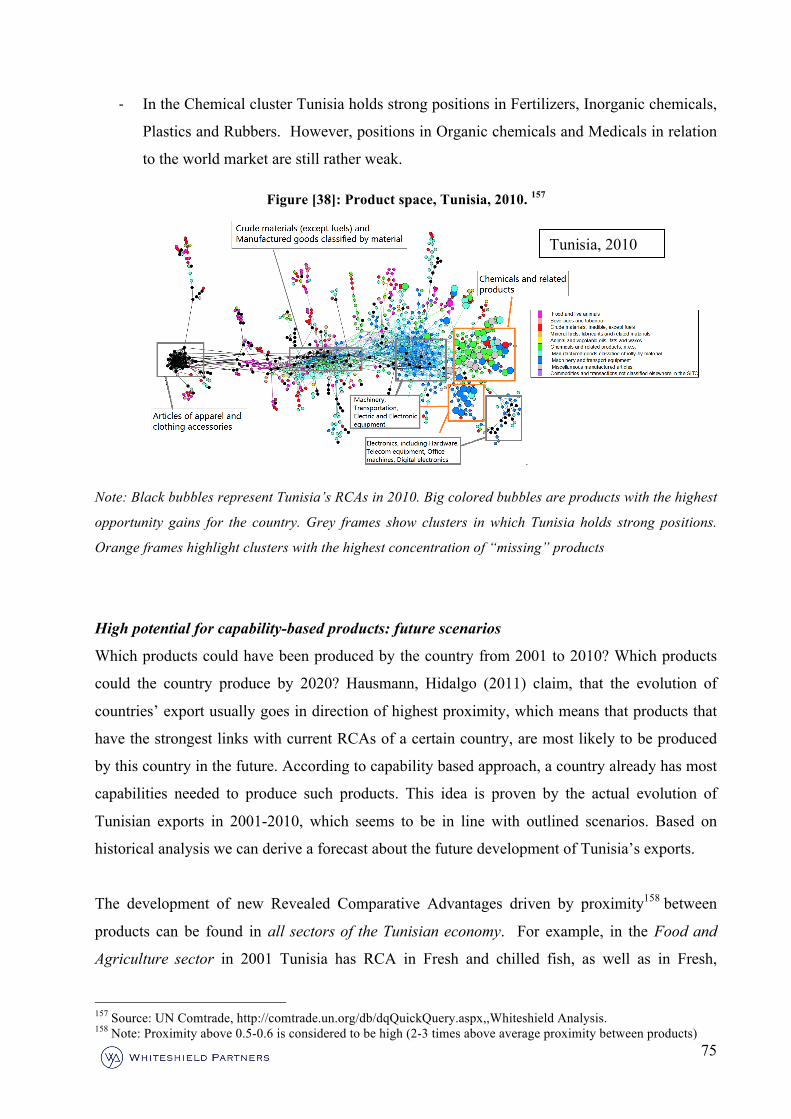
75
-‐ In the Chemical cluster Tunisia holds strong positions in Fertilizers, Inorganic chemicals,
Plastics and Rubbers. However, positions in Organic chemicals and Medicals in relation
to the world market are still rather weak.
Figure [38]: Product space, Tunisia, 2010. 157
Note: Black bubbles represent Tunisia’s RCAs in 2010. Big colored bubbles are products with the highest
opportunity gains for the country. Grey frames show clusters in which Tunisia holds strong positions.
Orange frames highlight clusters with the highest concentration of “missing” products
High potential for capability-based products: future scenarios
Which products could have been produced by the country from 2001 to 2010? Which products
could the country produce by 2020? Hausmann, Hidalgo (2011) claim, that the evolution of
countries’ export usually goes in direction of highest proximity, which means that products that
have the strongest links with current RCAs of a certain country, are most likely to be produced
by this country in the future. According to capability based approach, a country already has most
capabilities needed to produce such products. This idea is proven by the actual evolution of
Tunisian exports in 2001-2010, which seems to be in line with outlined scenarios. Based on
historical analysis we can derive a forecast about the future development of Tunisia’s exports.
The development of new Revealed Comparative Advantages driven by proximity158 between
products can be found in all sectors of the Tunisian economy. For example, in the Food and
Agriculture sector in 2001 Tunisia has RCA in Fresh and chilled fish, as well as in Fresh,
157 Source: UN Comtrade, http://comtrade.un.org/db/dqQuickQuery.aspx,,Whiteshield Analysis. 158 Note: Proximity above 0.5-0.6 is considered to be high (2-3 times above average proximity between products)
Tunisia, 2010
76
chilled, frozen or salted crustaceans and molluscs. Productive knowledge accrued from these
products made it possible to develop RCA in Frozen fish fillets by 2010. In 2001 Tunisia had
RCA in Pasta and in 2010 it moved to Bakery. In the Textile and Leather sectors in 2001 Tunisia
exported Yarn of textile, synthetic and regenerated fibres, moving to Tulle, lace, ribbons and
Bags and sacks for packing by 2010. In the Machinery for particular industries starting from
Wearing and Tanning machinery in 2001, by 2010 Tunisia developed RCA in Sewing
machinery. In Chemicals Tunisia moved from Inorganic acids metallic salts, Inorganic acids
metallic salts and Non-metals inorganic acids to Metallic oxides of zinc, iron, lead, chromium. In
Professional and scientific apparatus Tunisia had RCA in Gas, liquid and electric meters in 2001
and in Gas, liquid and electric control apparatus in 2010.
However, generally the evolution of the Product space of a certain country is determined not by
proximities between distinct products but by the overall knowledge accumulated in its economy.
A special pool of products selected by proximities159 makes it possible to trace back the
evolution of different sectors over 2001-2010 and to forecast feasible paths of their future
development.
In the Industrial Machinery segment the proximity-based analysis shows that the evolution is
likely to go in line with key trends of industrial development in Tunisia. In 2001 Tunisia already
had comparative advantages in machinery for textile industry, the strongest traditional sector in
the country. Becoming the number one African country in ICT and claiming the second position
in production of Automobile components, by 2010 Tunisia developed RCAs in electric and
power generating machinery. A logical path would be to leverage existing capabilities to develop
metal- and mineral-working machinery and in this way raise complexity of mining and
metalworking industries.
159 Note: The pool includes three types of products: Type 2 – products in which Tunisia developed RCA between 2001 and 2010; Type 1 – top 5 RCAs in 2001 with the strongest links to Type 2 products. Type 3 – products with the highest proximity to current RCAs (most likely to be produced in the future)
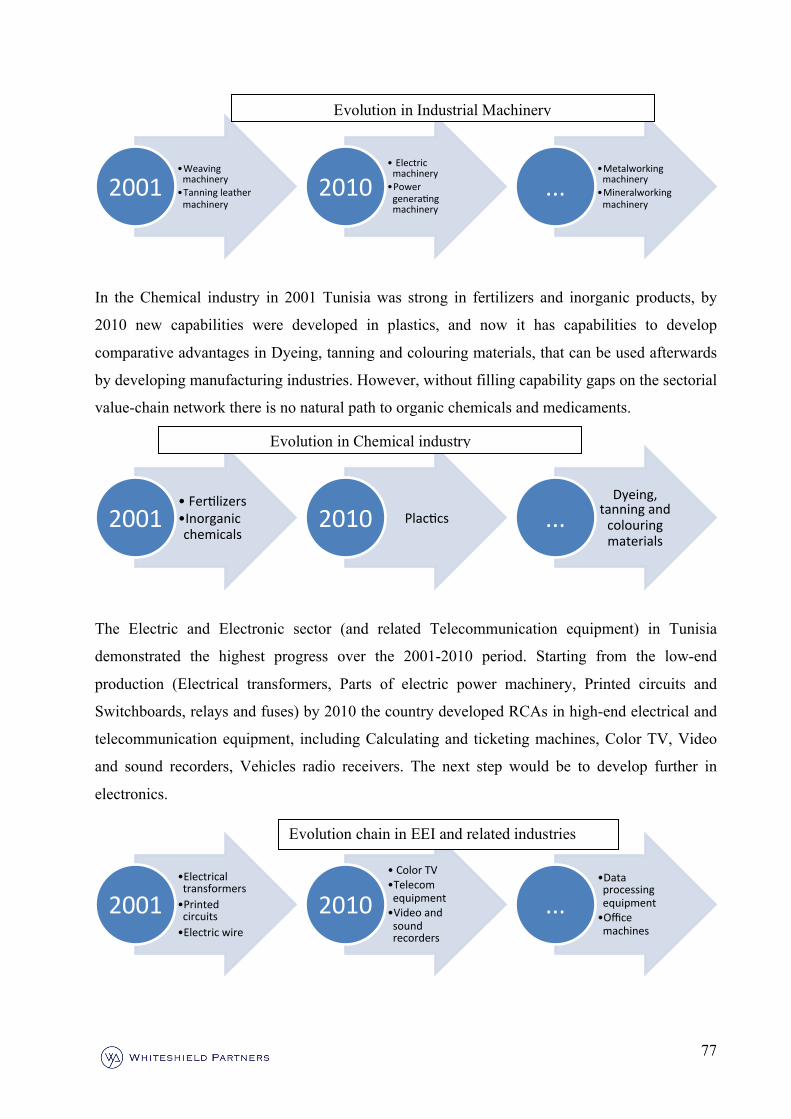
77
In the Chemical industry in 2001 Tunisia was strong in fertilizers and inorganic products, by
2010 new capabilities were developed in plastics, and now it has capabilities to develop
comparative advantages in Dyeing, tanning and colouring materials, that can be used afterwards
by developing manufacturing industries. However, without filling capability gaps on the sectorial
value-chain network there is no natural path to organic chemicals and medicaments.
The Electric and Electronic sector (and related Telecommunication equipment) in Tunisia
demonstrated the highest progress over the 2001-2010 period. Starting from the low-end
production (Electrical transformers, Parts of electric power machinery, Printed circuits and
Switchboards, relays and fuses) by 2010 the country developed RCAs in high-end electrical and
telecommunication equipment, including Calculating and ticketing machines, Color TV, Video
and sound recorders, Vehicles radio receivers. The next step would be to develop further in
electronics.
• Weaving machinery • Tanning leather machinery
2001 • Electric machinery • Power generaDng machinery
2010 • Metalworking machinery • Mineralworking machinery
...
• FerDlizers • Inorganic chemicals
2001 PlacDcs 2010 Dyeing,
tanning and colouring materials
...
• Electrical transformers • Printed circuits • Electric wire
2001 • Color TV • Telecom equipment • Video and sound recorders
2010 • Data processing equipment • Office machines
...
Evolution chain in EEI and related industries
Evolution in Chemical industry
Evolution in Industrial Machinery
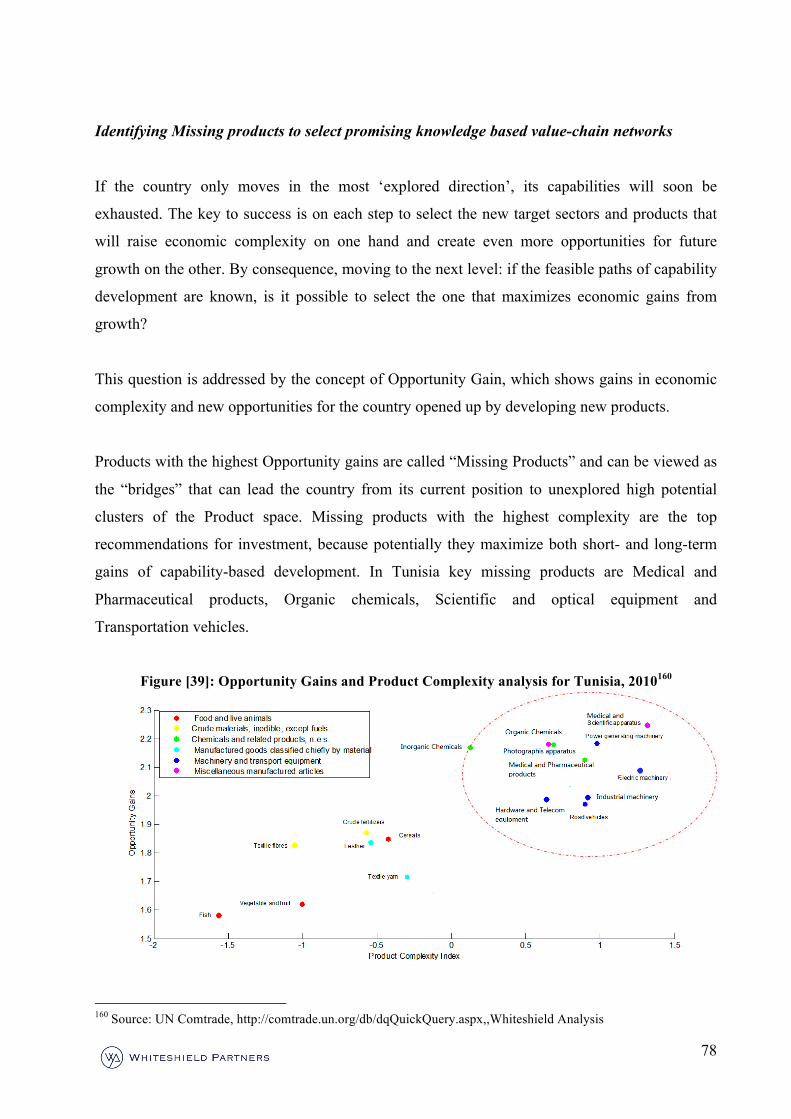
78
Identifying Missing products to select promising knowledge based value-chain networks
If the country only moves in the most ‘explored direction’, its capabilities will soon be
exhausted. The key to success is on each step to select the new target sectors and products that
will raise economic complexity on one hand and create even more opportunities for future
growth on the other. By consequence, moving to the next level: if the feasible paths of capability
development are known, is it possible to select the one that maximizes economic gains from
growth?
This question is addressed by the concept of Opportunity Gain, which shows gains in economic
complexity and new opportunities for the country opened up by developing new products.
Products with the highest Opportunity gains are called “Missing Products” and can be viewed as
the “bridges” that can lead the country from its current position to unexplored high potential
clusters of the Product space. Missing products with the highest complexity are the top
recommendations for investment, because potentially they maximize both short- and long-term
gains of capability-based development. In Tunisia key missing products are Medical and
Pharmaceutical products, Organic chemicals, Scientific and optical equipment and
Transportation vehicles.
Figure [39]: Opportunity Gains and Product Complexity analysis for Tunisia, 2010160
160 Source: UN Comtrade, http://comtrade.un.org/db/dqQuickQuery.aspx,,Whiteshield Analysis
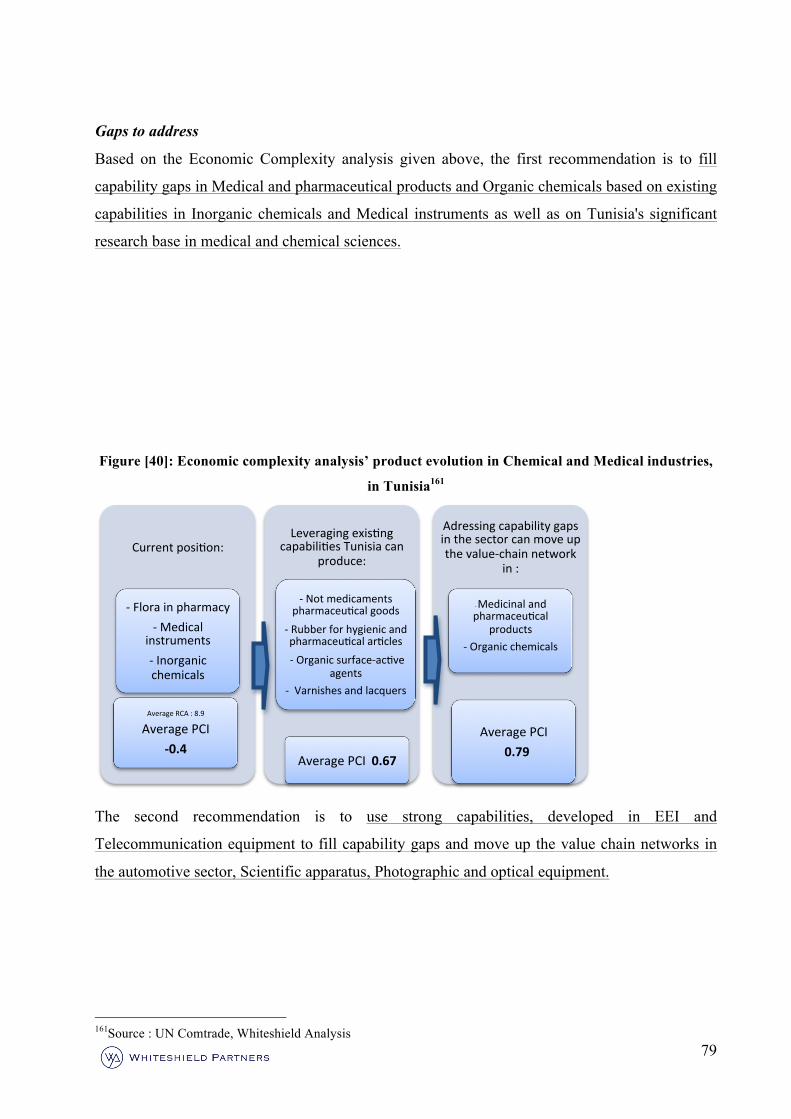
79
Gaps to address
Based on the Economic Complexity analysis given above, the first recommendation is to fill
capability gaps in Medical and pharmaceutical products and Organic chemicals based on existing
capabilities in Inorganic chemicals and Medical instruments as well as on Tunisia's significant
research base in medical and chemical sciences.
Figure [40]: Economic complexity analysis’ product evolution in Chemical and Medical industries,
in Tunisia161
The second recommendation is to use strong capabilities, developed in EEI and
Telecommunication equipment to fill capability gaps and move up the value chain networks in
the automotive sector, Scientific apparatus, Photographic and optical equipment.
161Source : UN Comtrade, Whiteshield Analysis
Current posiDon:
-‐ Flora in pharmacy -‐ Medical
instruments -‐ Inorganic chemicals
Average RCA : 8.9
Average PCI -‐0.4
Leveraging exisDng capabiliDes Tunisia can
produce:
-‐ Not medicaments pharmaceuDcal goods
-‐ Rubber for hygienic and pharmaceuDcal arDcles -‐ Organic surface-‐acDve
agents -‐ Varnishes and lacquers
Average PCI 0.67
Adressing capability gaps in the sector can move up the value-‐chain network
in :
-‐ Medicinal and pharmaceuDcal
products -‐ Organic chemicals
Average PCI 0.79
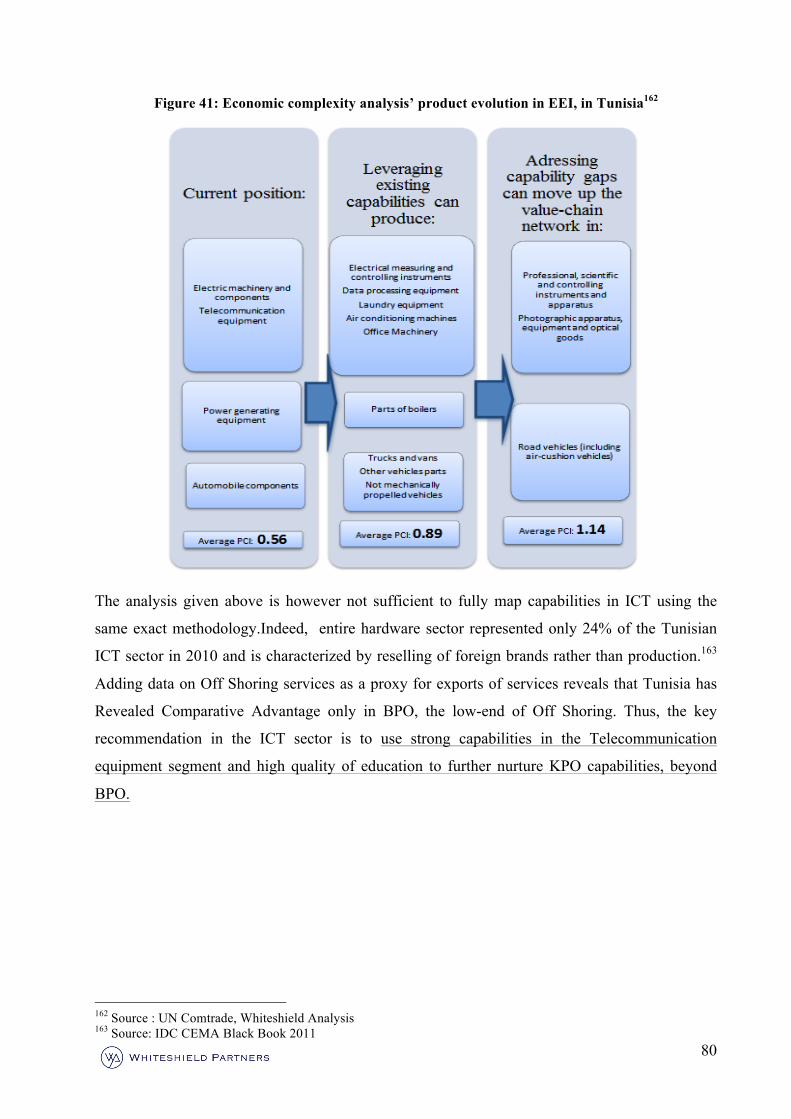
80
Figure 41: Economic complexity analysis’ product evolution in EEI, in Tunisia162
The analysis given above is however not sufficient to fully map capabilities in ICT using the
same exact methodology.Indeed, entire hardware sector represented only 24% of the Tunisian
ICT sector in 2010 and is characterized by reselling of foreign brands rather than production.163
Adding data on Off Shoring services as a proxy for exports of services reveals that Tunisia has
Revealed Comparative Advantage only in BPO, the low-end of Off Shoring. Thus, the key
recommendation in the ICT sector is to use strong capabilities in the Telecommunication
equipment segment and high quality of education to further nurture KPO capabilities, beyond
BPO.
162 Source : UN Comtrade, Whiteshield Analysis 163 Source: IDC CEMA Black Book 2011
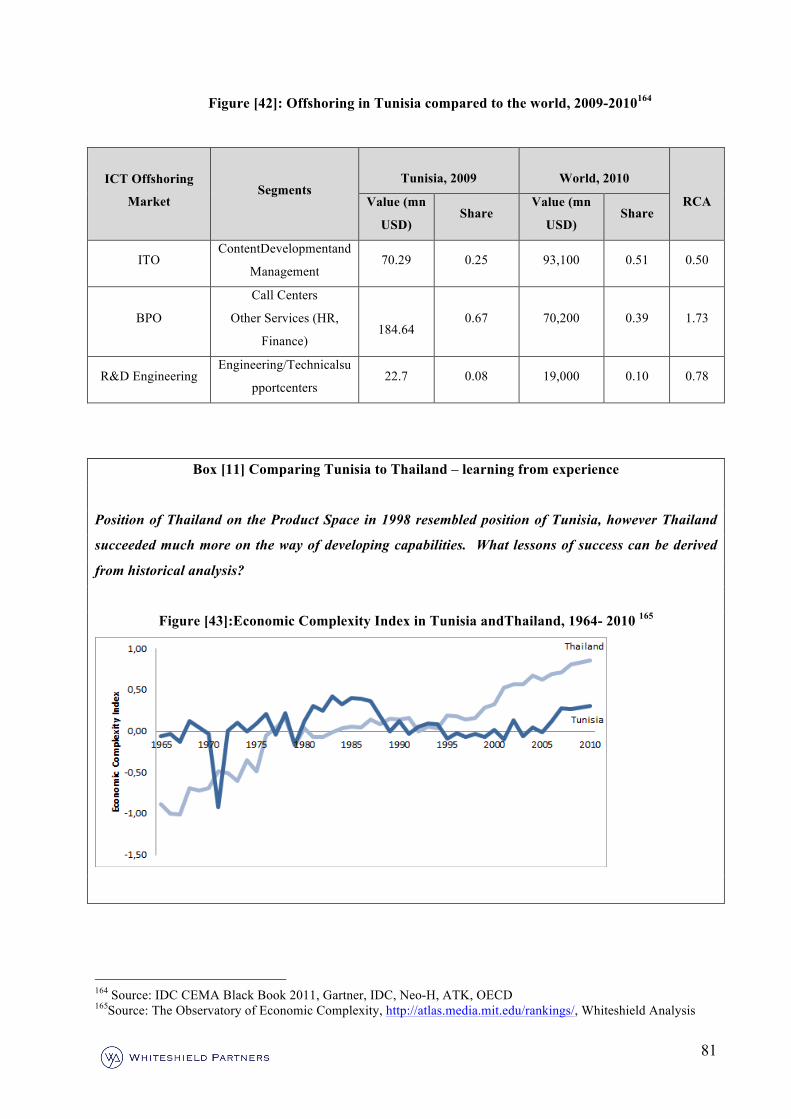
81
Figure [42]: Offshoring in Tunisia compared to the world, 2009-2010164
ICT Offshoring
Market Segments
Tunisia, 2009
World, 2010
RCA Value (mn
USD) Share
Value (mn
USD) Share
ITO ContentDevelopmentand
Management 70.29 0.25 93,100 0.51 0.50
BPO
Call Centers
Other Services (HR,
Finance)
184.64 0.67 70,200 0.39 1.73
R&D Engineering Engineering/Technicalsu
pportcenters 22.7 0.08 19,000 0.10 0.78
Box [11] Comparing Tunisia to Thailand – learning from experience
Position of Thailand on the Product Space in 1998 resembled position of Tunisia, however Thailand
succeeded much more on the way of developing capabilities. What lessons of success can be derived
from historical analysis?
Figure [43]:Economic Complexity Index in Tunisia andThailand, 1964- 2010 165
164 Source: IDC CEMA Black Book 2011, Gartner, IDC, Neo-H, ATK, OECD 165Source: The Observatory of Economic Complexity, http://atlas.media.mit.edu/rankings/, Whiteshield Analysis
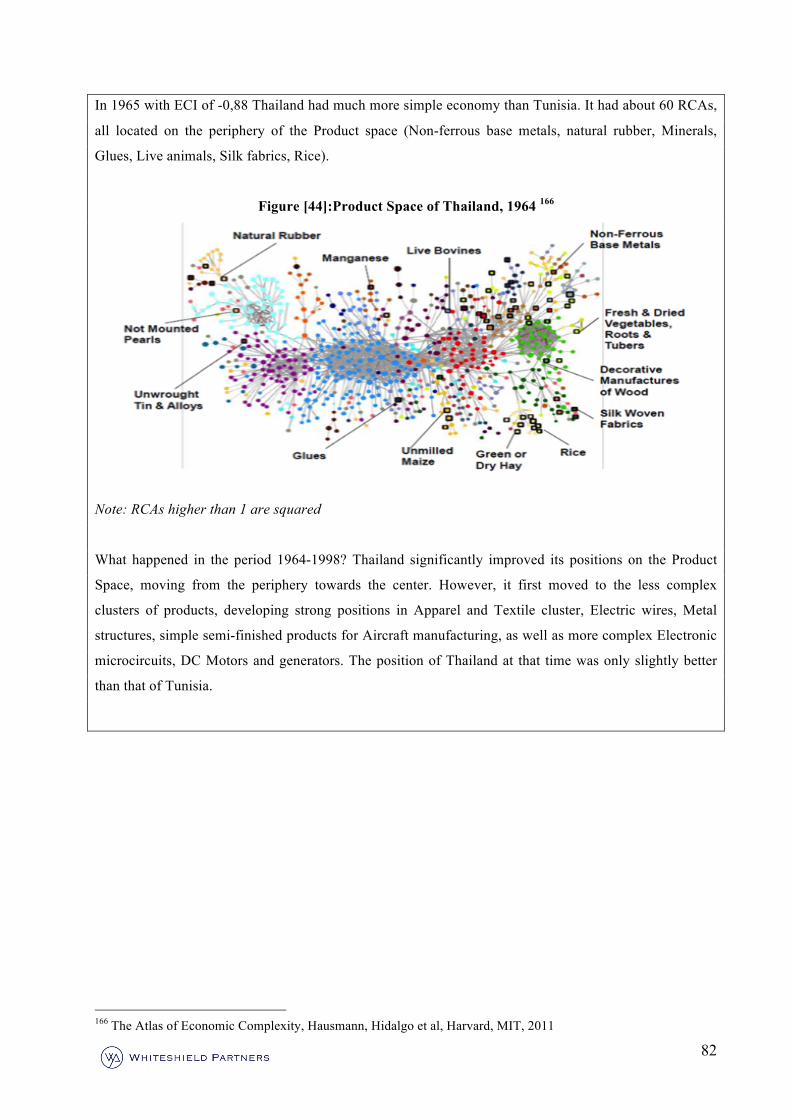
82
In 1965 with ECI of -0,88 Thailand had much more simple economy than Tunisia. It had about 60 RCAs,
all located on the periphery of the Product space (Non-ferrous base metals, natural rubber, Minerals,
Glues, Live animals, Silk fabrics, Rice).
Figure [44]:Product Space of Thailand, 1964 166
Note: RCAs higher than 1 are squared
What happened in the period 1964-1998? Thailand significantly improved its positions on the Product
Space, moving from the periphery towards the center. However, it first moved to the less complex
clusters of products, developing strong positions in Apparel and Textile cluster, Electric wires, Metal
structures, simple semi-finished products for Aircraft manufacturing, as well as more complex Electronic
microcircuits, DC Motors and generators. The position of Thailand at that time was only slightly better
than that of Tunisia.
166 The Atlas of Economic Complexity, Hausmann, Hidalgo et al, Harvard, MIT, 2011
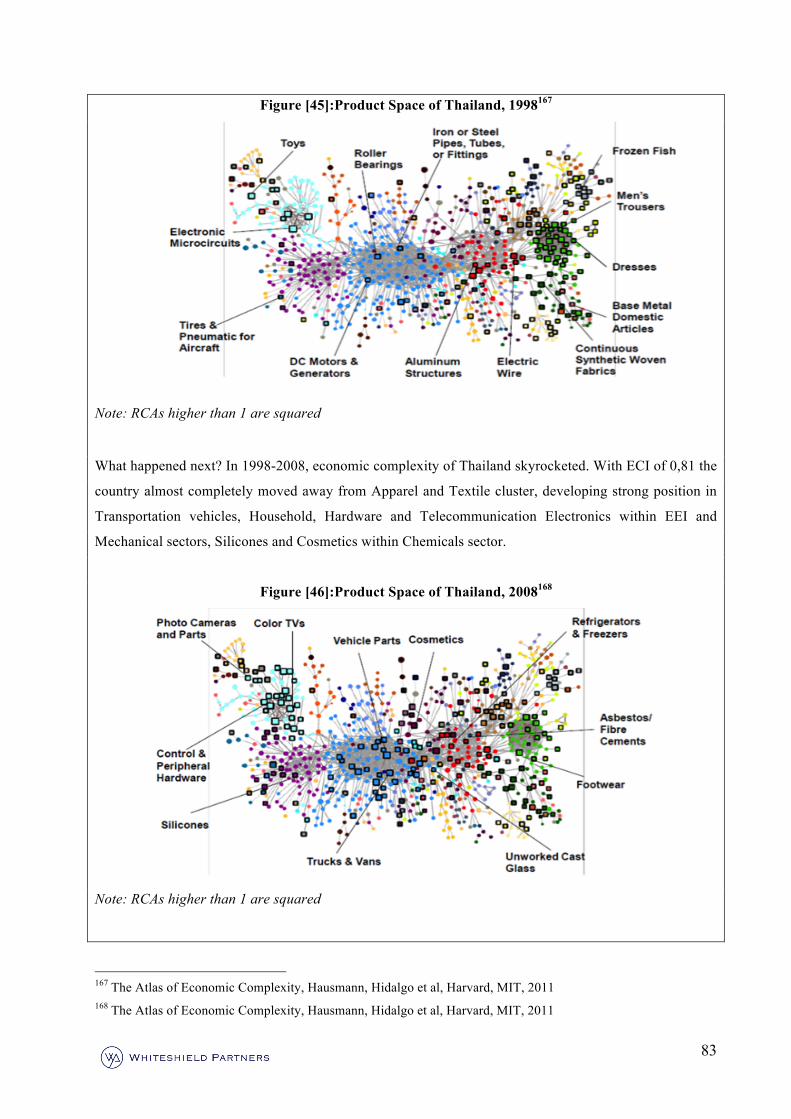
83
Figure [45]:Product Space of Thailand, 1998167
Note: RCAs higher than 1 are squared
What happened next? In 1998-2008, economic complexity of Thailand skyrocketed. With ECI of 0,81 the
country almost completely moved away from Apparel and Textile cluster, developing strong position in
Transportation vehicles, Household, Hardware and Telecommunication Electronics within EEI and
Mechanical sectors, Silicones and Cosmetics within Chemicals sector.
Figure [46]:Product Space of Thailand, 2008168
Note: RCAs higher than 1 are squared
167 The Atlas of Economic Complexity, Hausmann, Hidalgo et al, Harvard, MIT, 2011 168 The Atlas of Economic Complexity, Hausmann, Hidalgo et al, Harvard, MIT, 2011
84
Tunisia is now following the path Thailand took in 1998-2008. However, as reflected by the Opportunity
Value almost three times exceeding Economic Complexity Index, Tunisia still has much room to raise
complexity by addressing its gaps on the Product space. The country has well-diversified economy, the
key now is to concentrate on the high-complexity segments of the Product Space and develop more
capabilities in these segments.
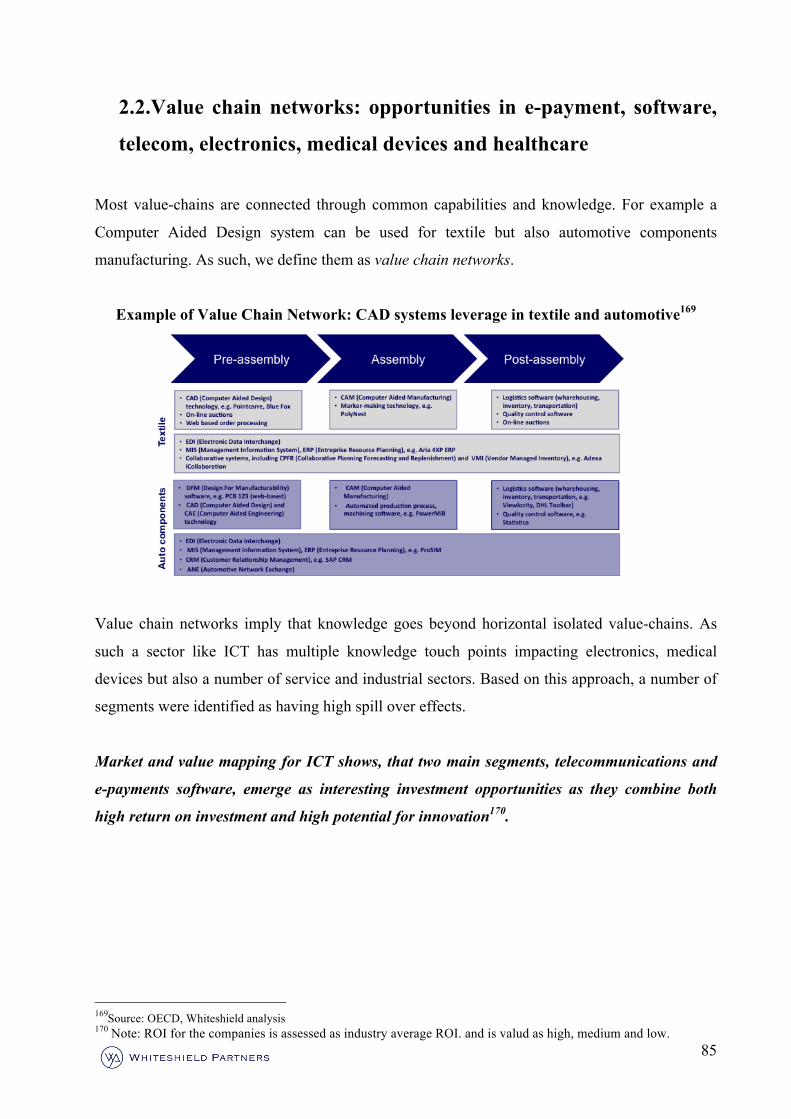
85
2.2.Value chain networks: opportunities in e-payment, software,
telecom, electronics, medical devices and healthcare
Most value-chains are connected through common capabilities and knowledge. For example a
Computer Aided Design system can be used for textile but also automotive components
manufacturing. As such, we define them as value chain networks.
Example of Value Chain Network: CAD systems leverage in textile and automotive169
Value chain networks imply that knowledge goes beyond horizontal isolated value-chains. As
such a sector like ICT has multiple knowledge touch points impacting electronics, medical
devices but also a number of service and industrial sectors. Based on this approach, a number of
segments were identified as having high spill over effects.
Market and value mapping for ICT shows, that two main segments, telecommunications and
e-payments software, emerge as interesting investment opportunities as they combine both
high return on investment and high potential for innovation170.
169Source: OECD, Whiteshield analysis 170 Note: ROI for the companies is assessed as industry average ROI. and is valud as high, medium and low.
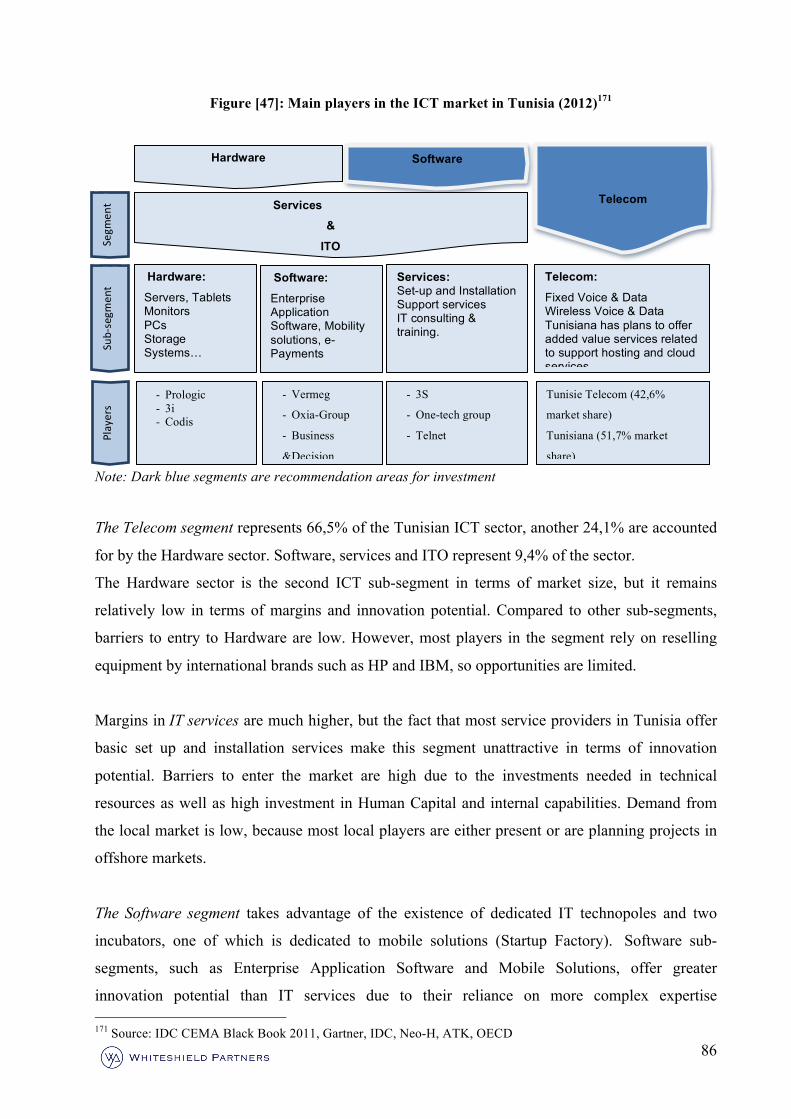
86
Figure [47]: Main players in the ICT market in Tunisia (2012)171
Note: Dark blue segments are recommendation areas for investment
The Telecom segment represents 66,5% of the Tunisian ICT sector, another 24,1% are accounted
for by the Hardware sector. Software, services and ITO represent 9,4% of the sector.
The Hardware sector is the second ICT sub-segment in terms of market size, but it remains
relatively low in terms of margins and innovation potential. Compared to other sub-segments,
barriers to entry to Hardware are low. However, most players in the segment rely on reselling
equipment by international brands such as HP and IBM, so opportunities are limited.
Margins in IT services are much higher, but the fact that most service providers in Tunisia offer
basic set up and installation services make this segment unattractive in terms of innovation
potential. Barriers to enter the market are high due to the investments needed in technical
resources as well as high investment in Human Capital and internal capabilities. Demand from
the local market is low, because most local players are either present or are planning projects in
offshore markets.
The Software segment takes advantage of the existence of dedicated IT technopoles and two
incubators, one of which is dedicated to mobile solutions (Startup Factory). Software sub-
segments, such as Enterprise Application Software and Mobile Solutions, offer greater
innovation potential than IT services due to their reliance on more complex expertise 171 Source: IDC CEMA Black Book 2011, Gartner, IDC, Neo-H, ATK, OECD
Hardware Software
Hardware:
Servers, Tablets Monitors PCs Storage Systems…
Services: Set-up and Installation Support services IT consulting & training.
Telecom:
Fixed Voice & Data Wireless Voice & Data Tunisiana has plans to offer added value services related to support hosting and cloud services.
Tunisie Telecom (42,6%
market share)
Tunisiana (51,7% market
share)
- 3S
- One-tech group
- Telnet
- Prologic - 3i - Codis
Players
Telecom
Software:
Enterprise Application Software, Mobility solutions, e-Payments
Services &
ITO
- Vermeg
- Oxia-Group
- Business
&Decision
Sub-‐segm
ent
Segm
ent
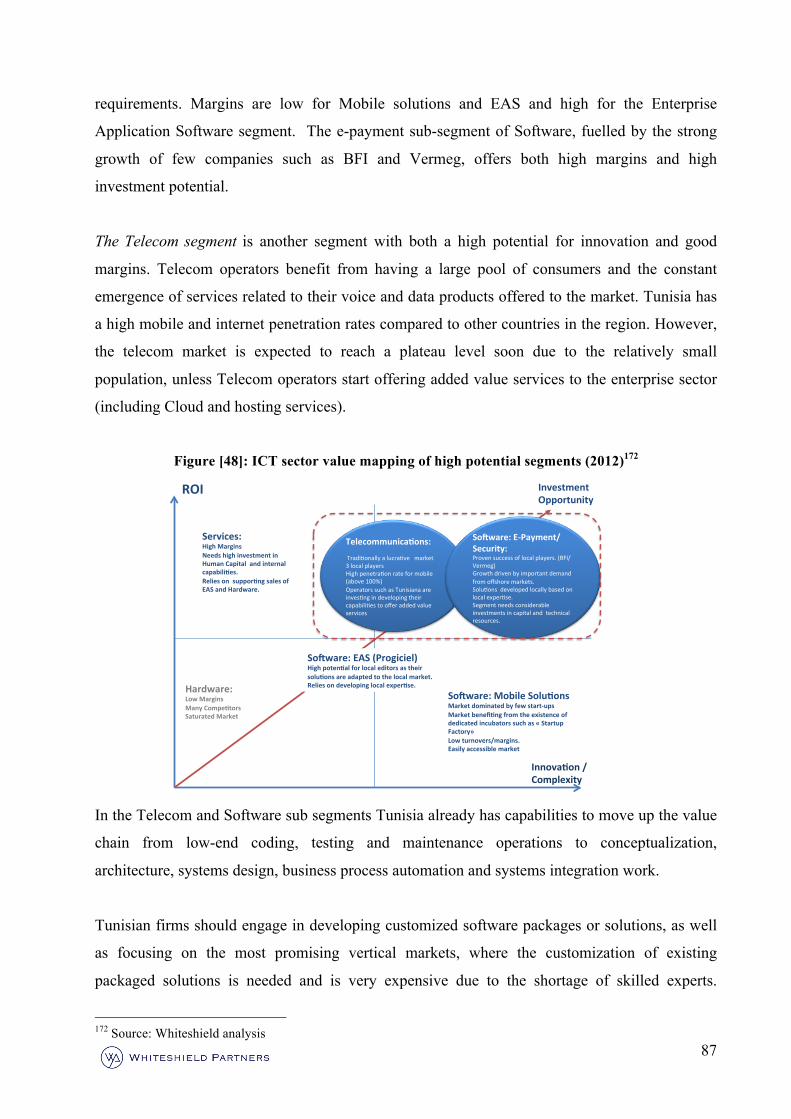
87
requirements. Margins are low for Mobile solutions and EAS and high for the Enterprise
Application Software segment. The e-payment sub-segment of Software, fuelled by the strong
growth of few companies such as BFI and Vermeg, offers both high margins and high
investment potential.
The Telecom segment is another segment with both a high potential for innovation and good
margins. Telecom operators benefit from having a large pool of consumers and the constant
emergence of services related to their voice and data products offered to the market. Tunisia has
a high mobile and internet penetration rates compared to other countries in the region. However,
the telecom market is expected to reach a plateau level soon due to the relatively small
population, unless Telecom operators start offering added value services to the enterprise sector
(including Cloud and hosting services).
Figure [48]: ICT sector value mapping of high potential segments (2012)172
In the Telecom and Software sub segments Tunisia already has capabilities to move up the value
chain from low-end coding, testing and maintenance operations to conceptualization,
architecture, systems design, business process automation and systems integration work.
Tunisian firms should engage in developing customized software packages or solutions, as well
as focusing on the most promising vertical markets, where the customization of existing
packaged solutions is needed and is very expensive due to the shortage of skilled experts.
172 Source: Whiteshield analysis
ROI$
Innova)on$/
Complexity$$
Services:$High$Margins$
Needs$high$investment$in$
Human$Capital$$and$internal$
capabili)es.$
Relies$on$$suppor)ng$sales$of$
EAS$and$Hardware.$
SoFware:$Mobile$Solu)ons$Market$dominated$by$few$startHups$
Market$benefi)ng$from$the$existence$of$
dedicated$incubators$such$as$«$Startup$
Factory»$
Low$turnovers/margins.$$
Easily$accessible$market$
SoFware:$EAS$(Progiciel)$High$poten)al$for$local$editors$as$their$
solu)ons$are$adapted$to$the$local$market.$
Relies$on$developing$local$exper)se.$Hardware:$Low$Margins$
Many$Compe)tors$$
Saturated$Market$
$
Investment$
Opportunity$
Telecommunica)ons:$!!Tradi'onally!a!lucra've!!!market!3!local!players!High!penetra'on!rate!for!mobile!(above!100%)!Operators!such!as!Tunisiana!are!inves'ng!in!developing!their!capabili'es!to!offer!added!value!services!
SoFware:$EHPayment/
Security:$Proven!success!of!local!players.!(BFI/Vermeg)!Growth!driven!by!important!demand!from!offshore!markets.!Solu'ons!!developed!locally!based!on!local!exper'se.!Segment!needs!considerable!investments!in!capital!and!!technical!resources.!
88
Globally, the trend is towards web-based, e-business software systems such as Customer
Relationship Management (CRM), Application Service Provider (ASP), Enterprise Resource
Planning (ERP) solutions for the financial, telecommunications, education and training, retail
and manufacturing industries.
Major development opportunities also exist in systems integration and convergence activities
and software customization and localization. These groups have succeeded mainly in attracting
foreign clients, particularly in Europe and have positioned Tunisia as an important offshoring
destination. Beyond companies working in the e-payment sub-segment, other service providers
such as the Oxia Group offer also added value software development and specific application
development services to European clients.
However, 67% of the offshoring market in Tunisia is still dominated by BPO services. The focus
is now on developing the capacity of Tunisian enterprises to shift the balance towards added
value ITO services, R&D and KPO services, which offer both a high return on investment and
have greater innovation potential.
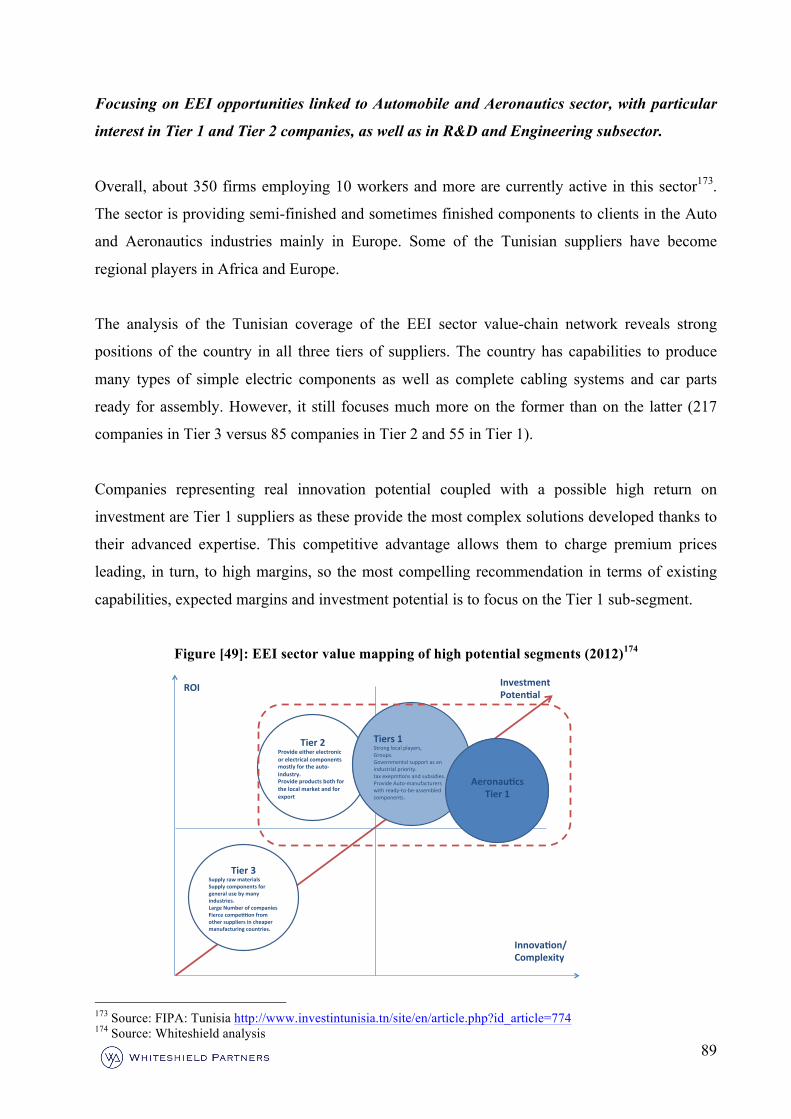
89
Focusing on EEI opportunities linked to Automobile and Aeronautics sector, with particular
interest in Tier 1 and Tier 2 companies, as well as in R&D and Engineering subsector.
Overall, about 350 firms employing 10 workers and more are currently active in this sector173.
The sector is providing semi-finished and sometimes finished components to clients in the Auto
and Aeronautics industries mainly in Europe. Some of the Tunisian suppliers have become
regional players in Africa and Europe.
The analysis of the Tunisian coverage of the EEI sector value-chain network reveals strong
positions of the country in all three tiers of suppliers. The country has capabilities to produce
many types of simple electric components as well as complete cabling systems and car parts
ready for assembly. However, it still focuses much more on the former than on the latter (217
companies in Tier 3 versus 85 companies in Tier 2 and 55 in Tier 1).
Companies representing real innovation potential coupled with a possible high return on
investment are Tier 1 suppliers as these provide the most complex solutions developed thanks to
their advanced expertise. This competitive advantage allows them to charge premium prices
leading, in turn, to high margins, so the most compelling recommendation in terms of existing
capabilities, expected margins and investment potential is to focus on the Tier 1 sub-segment.
Figure [49]: EEI sector value mapping of high potential segments (2012)174
173 Source: FIPA: Tunisia http://www.investintunisia.tn/site/en/article.php?id_article=774 174 Source: Whiteshield analysis
Innova&on/(Complexity(
ROI( Investment(Poten&al(
Tier(3((Supply(raw(materials(Supply(components(for(general(use(by(many(industries.(Large(Number(of(companies(Fierce(compe&&on(from(other(suppliers(in(cheaper(manufacturing(countries.((
Tier(2!Provide(either(electronic(or(electrical(components(mostly(for(the(autoGindustry.(Provide(products(both(for(the(local(market(and(for(export(((
((
Tiers(1((Strong!local!players,!Groups.!Governmental!support!as!an!industrial!priority.!tax!exepm8ons!and!subsidies.!Provide!Auto<manufacturers!with!ready<to<be<assembled!components.!
Aeronau&cs(Tier(1((
!!
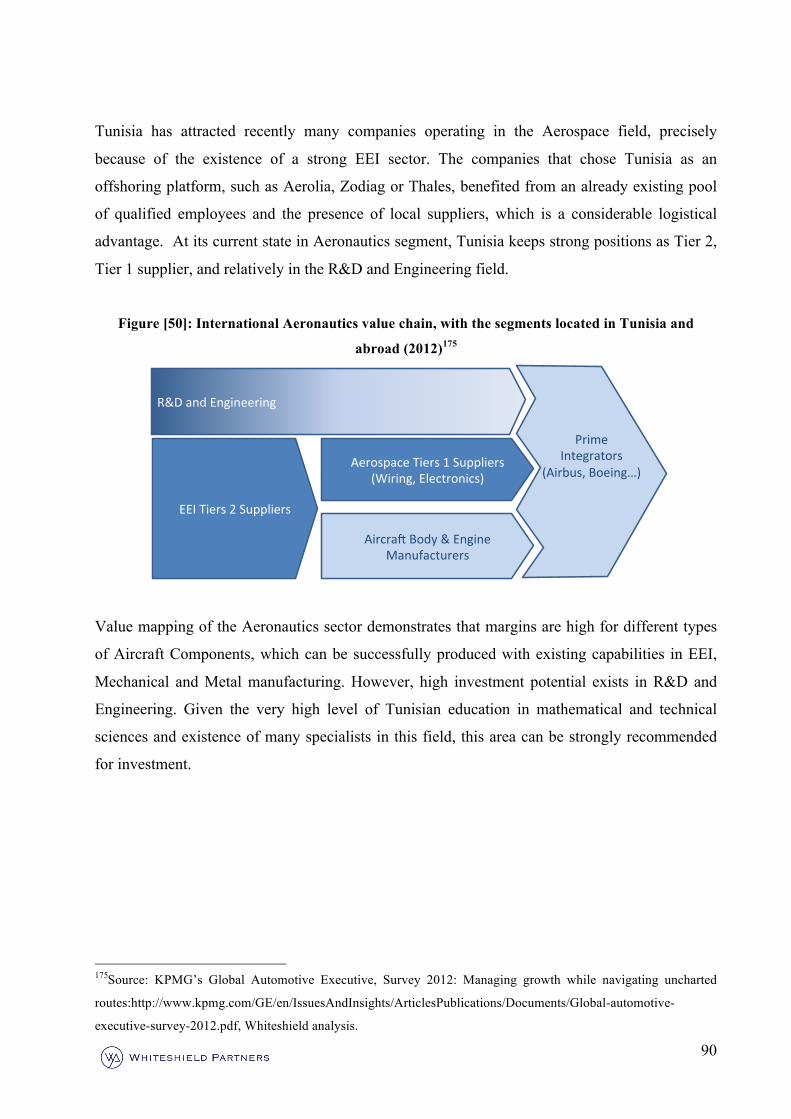
90
Tunisia has attracted recently many companies operating in the Aerospace field, precisely
because of the existence of a strong EEI sector. The companies that chose Tunisia as an
offshoring platform, such as Aerolia, Zodiag or Thales, benefited from an already existing pool
of qualified employees and the presence of local suppliers, which is a considerable logistical
advantage. At its current state in Aeronautics segment, Tunisia keeps strong positions as Tier 2,
Tier 1 supplier, and relatively in the R&D and Engineering field.
Figure [50]: International Aeronautics value chain, with the segments located in Tunisia and
abroad (2012)175
Value mapping of the Aeronautics sector demonstrates that margins are high for different types
of Aircraft Components, which can be successfully produced with existing capabilities in EEI,
Mechanical and Metal manufacturing. However, high investment potential exists in R&D and
Engineering. Given the very high level of Tunisian education in mathematical and technical
sciences and existence of many specialists in this field, this area can be strongly recommended
for investment.
175Source: KPMG’s Global Automotive Executive, Survey 2012: Managing growth while navigating uncharted
routes:http://www.kpmg.com/GE/en/IssuesAndInsights/ArticlesPublications/Documents/Global-automotive-
executive-survey-2012.pdf, Whiteshield analysis.
R&D$and$Engineering$
$EEI$Tiers$2$Suppliers$
$
Aerospace$Tiers$1$Suppliers$$(Wiring,$Electronics)$$$
Aircra>$Body$&$Engine$Manufacturers$$
Prime$$Integrators$
(Airbus,$Boeing…)$$$
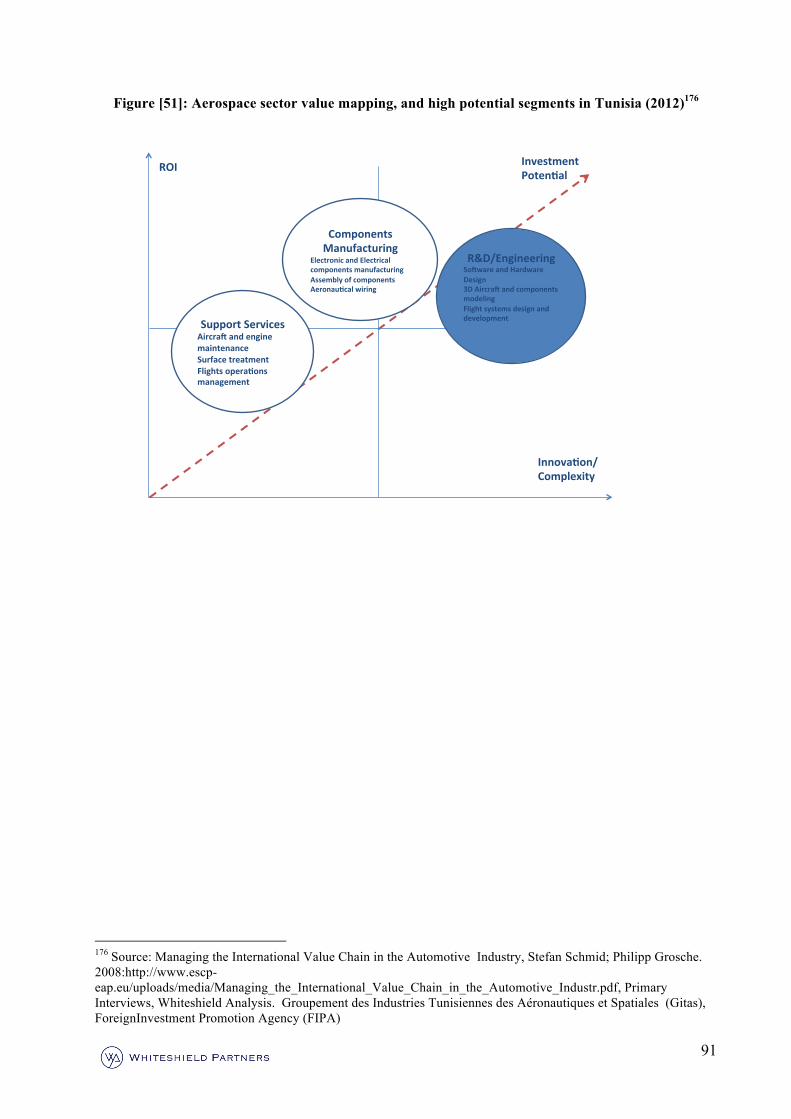
91
Figure [51]: Aerospace sector value mapping, and high potential segments in Tunisia (2012)176
176 Source: Managing the International Value Chain in the Automotive Industry, Stefan Schmid; Philipp Grosche. 2008:http://www.escp-eap.eu/uploads/media/Managing_the_International_Value_Chain_in_the_Automotive_Industr.pdf, Primary Interviews, Whiteshield Analysis. Groupement des Industries Tunisiennes des Aéronautiques et Spatiales (Gitas), ForeignInvestment Promotion Agency (FIPA)
Innova&on/(Complexity(
ROI( Investment(Poten&al(
Support(Services(Aircra;(and(engine(maintenance(Surface(treatment(Flights(opera&ons(management((
Components(Manufacturing(
Electronic(and(Electrical(components(manufacturing(Assembly(of(components((Aeronau&cal(wiring((
R&D/Engineering(So;ware(and(Hardware(Design(3D(Aircra;(and(components(modeling(Flight(systems(design(and(development(((((
(
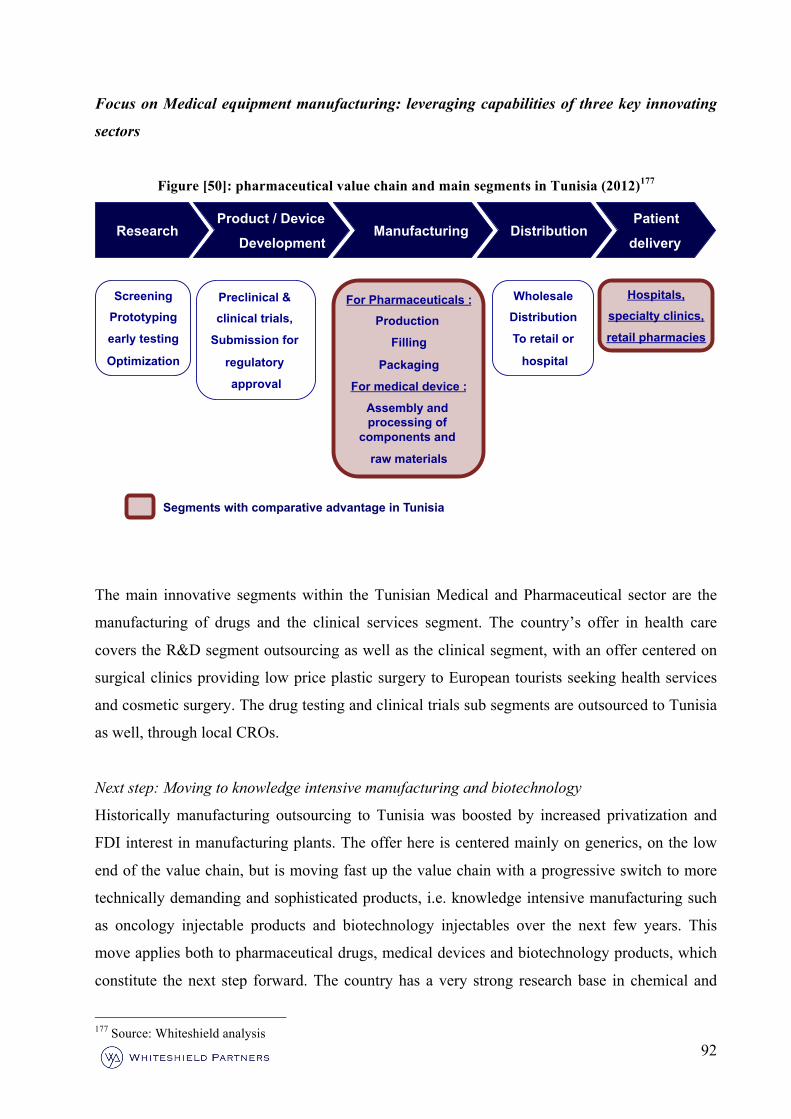
92
Focus on Medical equipment manufacturing: leveraging capabilities of three key innovating
sectors
Figure [50]: pharmaceutical value chain and main segments in Tunisia (2012)177
The main innovative segments within the Tunisian Medical and Pharmaceutical sector are the
manufacturing of drugs and the clinical services segment. The country’s offer in health care
covers the R&D segment outsourcing as well as the clinical segment, with an offer centered on
surgical clinics providing low price plastic surgery to European tourists seeking health services
and cosmetic surgery. The drug testing and clinical trials sub segments are outsourced to Tunisia
as well, through local CROs.
Next step: Moving to knowledge intensive manufacturing and biotechnology
Historically manufacturing outsourcing to Tunisia was boosted by increased privatization and
FDI interest in manufacturing plants. The offer here is centered mainly on generics, on the low
end of the value chain, but is moving fast up the value chain with a progressive switch to more
technically demanding and sophisticated products, i.e. knowledge intensive manufacturing such
as oncology injectable products and biotechnology injectables over the next few years. This
move applies both to pharmaceutical drugs, medical devices and biotechnology products, which
constitute the next step forward. The country has a very strong research base in chemical and
177 Source: Whiteshield analysis
Screening
Prototyping
early testing
Optimization
Preclinical &
clinical trials,
Submission for
regulatory
approval
For Pharmaceuticals :
Production
Filling
Packaging
For medical device :
Assembly and processing of
components and
raw materials
Wholesale
Distribution
To retail or
hospital
Research Manufacturing Product / Device
Development Distribution
Patient
delivery
Hospitals,
specialty clinics,
retail pharmacies
Segments with comparative advantage in Tunisia
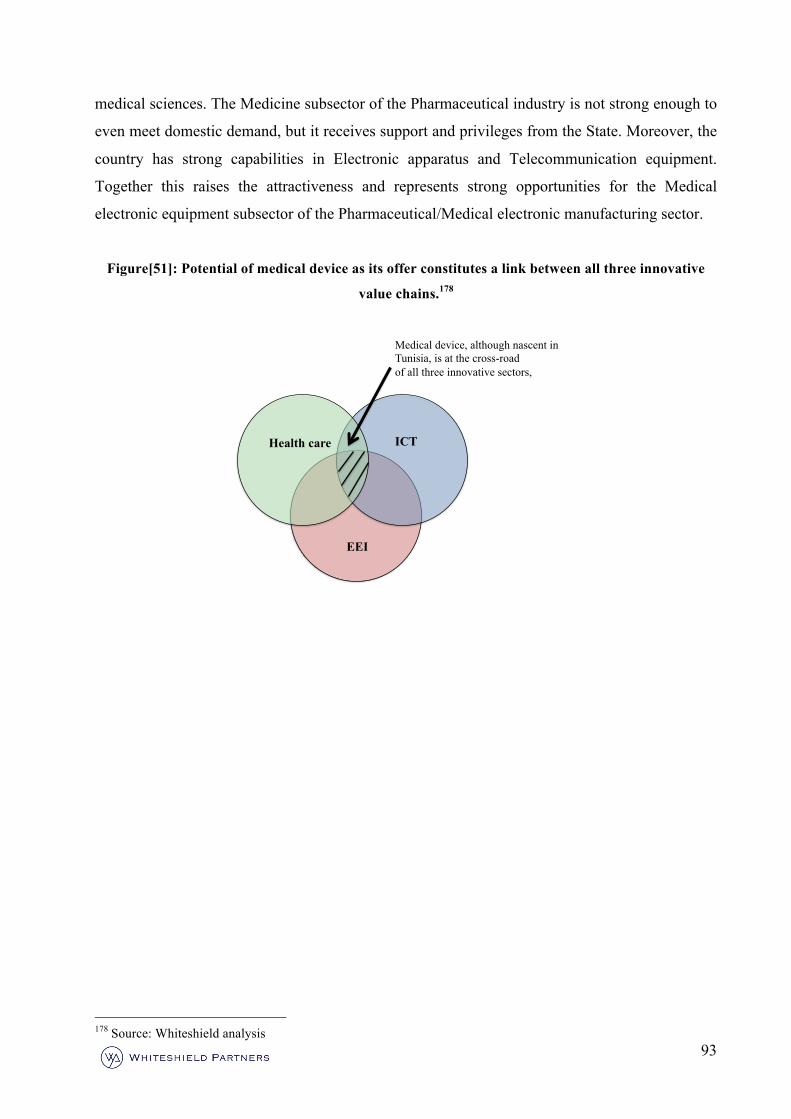
93
medical sciences. The Medicine subsector of the Pharmaceutical industry is not strong enough to
even meet domestic demand, but it receives support and privileges from the State. Moreover, the
country has strong capabilities in Electronic apparatus and Telecommunication equipment.
Together this raises the attractiveness and represents strong opportunities for the Medical
electronic equipment subsector of the Pharmaceutical/Medical electronic manufacturing sector.
Figure[51]: Potential of medical device as its offer constitutes a link between all three innovative
value chains.178
178 Source: Whiteshield analysis
Health care ICT
EEI
Medical device, although nascent in Tunisia, is at the cross-road of all three innovative sectors,
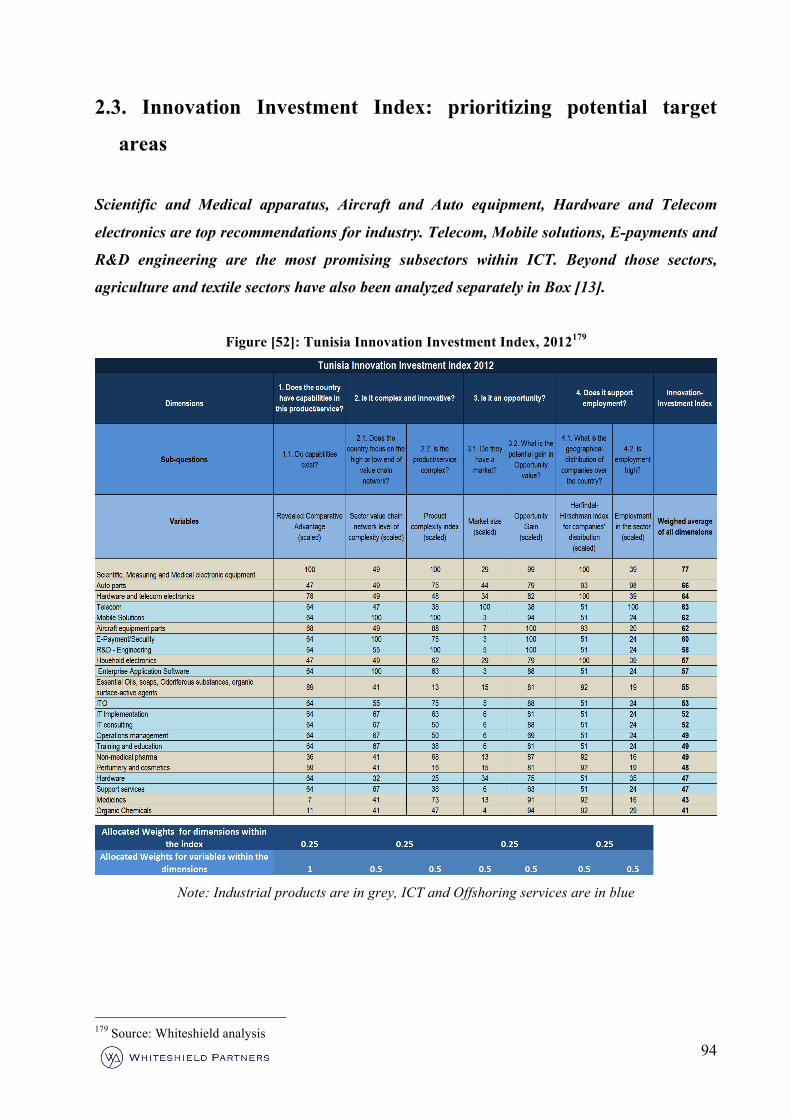
94
2.3. Innovation Investment Index: prioritizing potential target
areas
Scientific and Medical apparatus, Aircraft and Auto equipment, Hardware and Telecom
electronics are top recommendations for industry. Telecom, Mobile solutions, E-payments and
R&D engineering are the most promising subsectors within ICT. Beyond those sectors,
agriculture and textile sectors have also been analyzed separately in Box [13].
Figure [52]: Tunisia Innovation Investment Index, 2012179
Note: Industrial products are in grey, ICT and Offshoring services are in blue
179 Source: Whiteshield analysis
95
The Innovation Investment Index, constructed on basis of the Whiteshield tripartite approach
(economic complexity, value chain network and territory analysis) helps to reveal subsectors
with the highest potential effect of investment.
Sample selection consisted of two stages. On the first stage, segments with the highest
capabilities were identified. These included:
-‐ Traditional sectors: Agrifood, Textile and Basic Fertilizers with RCAs from 5 to 110 in
different categories of products (see Box [13]).
-‐ Knowledge economy sectors: Inorganic Chemicals (RCA of 9.7180), Plastics (RCA of
5.5), Medical instruments (RCA of 1.1), Metal structures (RCA of 2.4), EEI tier 3
suppliers production (wires, cables – RCA of 7.7), EEI tier 2 suppliers (RCA of 4.4), EEI
tier 1 suppliers (RCA of 2.4) and even several types of industrial and consumer
electronics, including Color TVs, Telecommunication equipment and Ticketing machines
(RCA of 1.6).
Traditional sectors are located on the periphery of the Product space, and thus, have low product
complexity and low opportunity gains for Tunisia. Therefore, these sectors were excluded from
the further analysis. On the contrary, knowledge economy sectors have high product complexity
and are associated with high opportunity gains. Now Tunisia concentrates on the low-end
production in these sectors (tier 2 and tier 3 suppliers). Moving up the value chain networks in
these sectors would leverage existing capabilities and improve economic complexity of the
country. To differentiate between these sectors and select the most promising targets for
investment the Investment Innovation Index was constructed.
Based on the first stage analysis, Organic Chemicals, Medicaments, Household chemicals, EEI
tier 1 suppliers, Medical, Telecom and Household electronics were selected as key segments of
interest. ICT segments, not covered by the economic complexity analysis directly, were added to
the list based on the market data. On the second stage, for each product or service in the list,
different indicators of tripartite approach were calculated. These indicators are the Product
Complexity Index, Revealed Comparative Advantage and Opportunity Gains (Economic
complexity indicators), Distribution of companies over different levels of value chain networks
(Value chain network indicators), Employment, Market size and Geographical distribution of
companies around the country (Territory and Market indicators). These indicators were
reorganized into four dimensions according to four key questions of interest:
180 Note: It means, that export share is almost 10 times above world average
96
• Does the country have capabilities to produce this product or service?
• Is this product or service complex and innovative?
• Is it an opportunity?
• Does it support employment?
In the resulting Innovation Investment Index all four dimensions were given equal weight (Box
[12]).
Innovation Investment Index (III) reveals that Scientific and Medical apparatus, Aircraft and
Auto equipment, Hardware and Telecom electronics are top recommendations for industry;
Telecom, Mobile solutions, E-payments and R&D engineering are the most promising subsectors
within ICT.
However, capabilities and opportunities are distributed unevenly around products and services.
Medicines, for example, have one of the highest PCI and are associated with very high
Opportunity Gain. However, low existing capabilities, small market size, low employment and
chemical value chain network hugely biased toward low-end inorganics and fertilizers push
Medicine subsector down in the resulting ranking.
Medical and scientific electronic equipment are on the top of the list (assuming that their
potential market size can be approximated by the size of Tunisian electronic segment). The
country has strong capabilities in electronics and measuring scientific equipment. The
corresponding EEI, though biased towards low-end manufacturing, covers all three tiers of
suppliers on the value chain network, with no capability gaps. High Product Complexity and
Opportunity gains indicate innovative nature and high potential of this sub-sector. Finally, high
employment in electronics and 90% of companies concentrated in North-east and Central-East
regions of the country ensure high effect on employment. Reasoning beyond the III
methodology, this segment bears high opportunities for Tunisia because of big and developing
clinical services segment of Pharmaceutical sector in the country.
In Hardware and Telecom electronic equipment capabilities are also very high, though product
complexity and opportunities are slightly lower. Apparent advantage of this segment is large
Hardware ICT sub-segment, which constitutes potential market for this industry. Hardware ICT
segment itself is located at the bottom of the ranking, because the segment is currently engaged
in reselling of famous brands, and thus is already saturated and is positioned at the low end of the
value chain. High potential lies in linking nascent Hardware and Telecom Equipment production
industry with ICT Hardware services segment.
97
All ICT and Offshoring services are distributed more evenly around the country, and thus their
effect on employment is expected to be lower. However, Telecom outperforms all other sectors
by market size and absolute number of employees. Mobile solutions and E-payments/Security
are very attractive because of high complexity, high-end biased structure of Software value chain
network, high ROI and investment potential (proxy of Opportunity Gains for ICT and
Offshoring). R&D engineering, being a High-end Offshoring segment, also bears high
opportunities for investment, however its position is aggravated by Tunisian Offshoring hugely
biased towards low-end BPO, which accounts for 67% of all Offshoring in the country
Auto equipment suppliers benefit from the large market and many employers. Aircraft
equipment, though still nascent in Tunisia, as reflected by small market size, has higher RCA,
PCI and Opportunity gain. Thus, the aeronautics sector in Tunisia, though being more
challenging, offers interesting opportunities for investment.
Box [12]: Innovation Investment Index Composition 181
Innovation Investment Index is composed of four dimensions, each aimed at answering one particular
question:
1. Does the country have capabilities to produce this product or service? This dimension is
represented by absolute value of Revealed Comparative Advantage (RCA). For most services export
volumes are not reported, and therefore average RCA in ITO and Offshoring of R&D engineering was
taken as a proxy
2. Is this product or service complex and innovative? The question is addressed by two indicators:
Product Complexity Index (PCI) and Value Chain Structure. The former is taken from Economic
Complexity analysis (Chapter 2.1) for industrial products. For services it is approximated by position of
particular service on the value-chain network, 25 being the very low end, 100 – the very high end. Value
Chain Network Structure indicator reflects whether the whole sector (Chemicals, EEI, Software, Telecom
etc.) is dominated by low-end or high-end production.
3. Is it an opportunity? Opportunities are measured by two indicators: relative Market Size of the
corresponding subsector (Electricals for machinery components, Electronics for Household, Medical and
Telecom electronics, Parachemicals for perfumery and cosmetics etc.) and Opportunity Gain (OG).
Opportunity gains are taken from Economic complexity analysis (Chapter 2.1) for industrial products. For
services they are approximated by the combination of ROI and investment potential, assessed in Chapter
2.2.
4. Does it support employment? Effect on employment is assessed by two indicators: Number of
workers in the corresponding subsector and Geographical Distribution of Companies in the corresponding
181 Source: Whiteshield Analysis
98
economic sector (EEI, Chemicals and ICT). To get the latter Herfindal-Hirshmann Index for geographical
concentration of companies was calculated.
All dimensions are included into the final index with the weight of 25%. Within each dimension all
indicator are scaled and averaged.
Box [13] Capabilities identified in traditional sectors in Tunisia
Economic complexity analysis covers all industrial sectors in Tunisia, including Agriculture and Food,
Textile and Apparel, Wood, Mining, Metalworking, Chemicals (Basic chemicals, Pharmaceuticals,
Plastics, Rubbers and Parachemicals), Electrical, Electronic and Mechanical semi-finished and finished
production (General industrial machinery, Machinery for particular industries, Power generating
machinery, Medical and scientific apparatus, Office machinery, Household machinery,
Telecommunication machinery, Transportation vehicles and equipment etc) as well as many types of
Manufactures articles (Porcelain, Jewelry, Musical instruments, Clocks, Books, Office suppliers etc.) In
total, there are 761 products, broken up into 98 categories according to SITC 3rd revision.
Based on the Economic complexity analysis in Tunisia, three main categories of sectors were identified:
(1) Strong traditional sectors (high capabilities and low complexity), (2) Developing innovative industries
(intermediate capabilities and high complexity) and (3) Nascent sectors with the highest innovation
potential (RCA less than 1, high complexity and opportunity gains).
The two latter categories are the knowledge economy sectors, covered in the Chapters 1 and 2 of the
report. The first category includes Agrifood, Textile and Basic Fertilizers sectors. In Agrifood Tunisia has
the most pronounced capabilities in Pasta (export share 16 times above world average), Fresh and dried
fruit and Dried vegetables (export share 7,6 and 5 times above world average respectively). In Textile and
Apparel RCA varies from 3 to 25 (highest RCAs in Men’s clothes, skirts, corsets as well as furnishing
textile articles). In general Fertilizers, Tunisia has RCA of 26, and export share of Phosphate fertilizers
alone is 115 times above the world average. Product complexity of all these sectors is low: -0.9 for
Agrifood, -0.63 for Fertilizers, -0.42 for Textile and Apparel.
High capabilities in the traditional sectors are supported by the presence of numerous companies. These
companies have generally reached a critical size, which allows them to weigh on the national market and
as well to play an important role on the global level. For instance, Granuphos, a company, which
produces and commercializes various types of fertilizers, is leading the market in Tunisia, but it is also an
important actor on different markets in Europe, Asia and Latin America. As far as Agri-food is
concerned, GIPA, which is part of the Poulina Holding, one of the most financially solid Tunisian groups,
commercializes different food products ranging from oils to flavoured ice-cream products. The financial
backing of Poulina has allowed GIPA to comfortably develop a market leadership position across
different food products on the regional level. More examples are given in the company profiles in
Appendix 2.
99
Appendix 1: Interview and company summaries
Appendix 2: Investment and capacity building profiles
Appendix 3: List of all publications reviewed
Appendix 4. Methodology of economic complexity approach