Embed Size (px)
Citation preview
From Science to Solutions
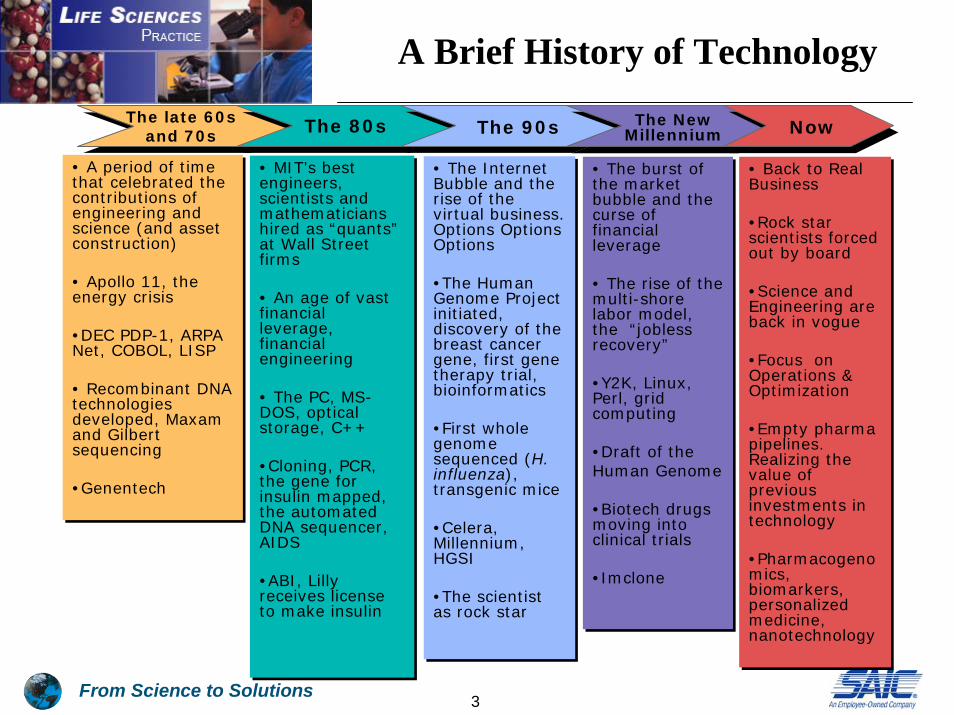
Knowledge Architectures for Pharmaceutical R&D
Jim Golden, Ph.D.Chief Technology Officer
SAIC [email protected]
OLSUG Meeting, 16 May 05

From Science to Solutions2
Overview
A view of technology and our industry Pain points, drivers and spendingGetting to a map of the worldKey enablersSome potential examples
PharmacovigilanceBiomarker discovery and validation
Conclusions
From Science to Solutions3
A Brief History of TechnologyThe late 60s
and 70s The 80s The 90s The New Millennium
• A period of time that celebrated the contributions of engineering and science (and asset construction)
• Apollo 11, the energy crisis
•DEC PDP-1, ARPA Net, COBOL, LISP
• Recombinant DNA technologies developed, Maxamand Gilbert sequencing
•Genentech
• A period of time that celebrated the contributions of engineering and science (and asset construction)
• Apollo 11, the energy crisis
•DEC PDP-1, ARPA Net, COBOL, LISP
• Recombinant DNA technologies developed, Maxamand Gilbert sequencing
•Genentech
• MIT’s best engineers, scientists and mathematicians hired as “quants” at Wall Street firms
• An age of vast financial leverage, financial engineering
• The PC, MS-DOS, optical storage, C++
•Cloning, PCR, the gene for insulin mapped, the automated DNA sequencer, AIDS
•ABI, Lilly receives license to make insulin
• The Internet Bubble and the rise of the virtual business. Options Options Options
•The Human Genome Project initiated, discovery of the breast cancer gene, first gene therapy trial, bioinformatics
•First whole genome sequenced (H. influenza), transgenic mice
•Celera, Millennium, HGSI
•The scientist as rock star
• The burst of the market bubble and the curse of financial leverage
• The rise of the multi-shore labor model, the “jobless recovery”
•Y2K, Linux, Perl, grid computing
•Draft of the Human Genome
•Biotech drugs moving into clinical trials
•Imclone
• The burst of the market bubble and the curse of financial leverage
• The rise of the multi-shore labor model, the “jobless recovery”
•Y2K, Linux, Perl, grid computing
•Draft of the Human Genome
•Biotech drugs moving into clinical trials
•Imclone
Now
• Back to Real Business
•Rock star scientists forced out by board
•Science and Engineering are back in vogue
•Focus on Operations & Optimization
•Empty pharmapipelines. Realizing the value of previous investments in technology
•Pharmacogenomics, biomarkers, personalized medicine, nanotechnology
• Back to Real Business
•Rock star scientists forced out by board
•Science and Engineering are back in vogue
•Focus on Operations & Optimization
•Empty pharmapipelines. Realizing the value of previous investments in technology
•Pharmacogenomics, biomarkers, personalized medicine, nanotechnology

From Science to Solutions4
Industry Overview
Basic Research
Target ID
Drug Discovery
Drug Development
Pre-Clinical,Clinical Trials
ManufacturingQA/QC
Sales Marketing
Distribution
Academic and Government
Biotechnology
Pharmaceutical Companies
~90,000 not-for-profit labs world-wideTotal R&D spend = $76.8 B in 2004, ~$4.5 B on R&D IT
~4300 biotechnology companies world-wideTotal R&D spend = $35.2 B in 2004, ~$5.6 B on R&D IT
Top 50 Pharma world-wideTotal R&D spend = $68.8 B in 2004, ~$9.5 B on R&D IT

From Science to Solutions5
Chief Pain Point: Number of pharma products flat despite increase in R&D spending
R&D spending has increased 5-fold . . .
R&D spending 1986-2003, $ Millions
. . . while IND submissions have increased modestly . . .
Commercial IND submissions 1986-2003
. . . and NCEs are essentially flat NCEs approved per year
1986-2003
0
100
200
300
400
500
600
1986 91 96 20010
10
20
30
40
50
60
1986 91 96 20010
5,000
10,000
15,000
20,000
25,000
30,000
1986 91 96 2001
From Science to Solutions6
Other Evolving Industry Drivers Affecting IT Priorities
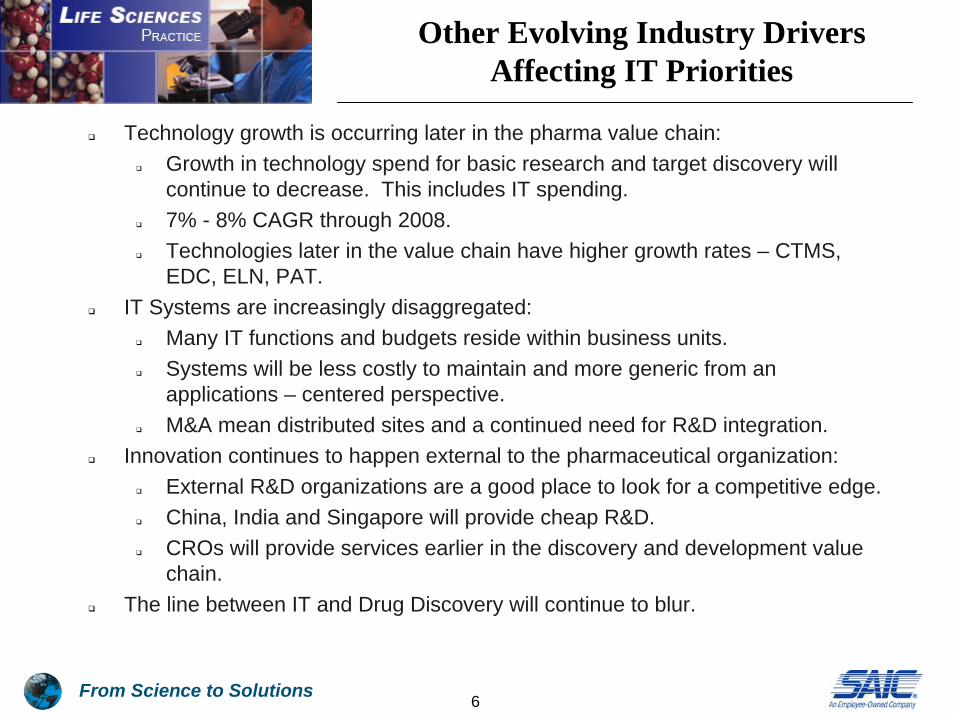
Technology growth is occurring later in the pharma value chain:Growth in technology spend for basic research and target discovery will continue to decrease. This includes IT spending.7% - 8% CAGR through 2008.Technologies later in the value chain have higher growth rates – CTMS, EDC, ELN, PAT.
IT Systems are increasingly disaggregated:Many IT functions and budgets reside within business units.Systems will be less costly to maintain and more generic from anapplications – centered perspective.M&A mean distributed sites and a continued need for R&D integration.
Innovation continues to happen external to the pharmaceutical organization:External R&D organizations are a good place to look for a competitive edge.China, India and Singapore will provide cheap R&D.CROs will provide services earlier in the discovery and development value chain.
The line between IT and Drug Discovery will continue to blur.

From Science to Solutions7
Budget Priorities and Spend Direction
0 5 10 15 20 25 30 35 40 45
IT Outsourcing services
Enterprise apps
Break/fix IT services
Server/storage SW
Project-oriented IT services
Clinical trials SW
Server/storage HW
Network equipment
Content/knowledge mgt
Security HW & SW
Data integration
Database software, data mining
Research/science apps
(% of respondents)
Top 2 2005 IT budget priority2005 spend increase greater than 10%
2005 spend increase 1-10%
• N=186• Source: IDC Life Science Insights• 2005 Leading Indicators Study

From Science to Solutions8
Planned Software Investment Areas for 2005
0% 10% 20% 30% 40% 50%
None
LIMS
'Omics' analysis
Electronic labnotebooks (ELN)
Data integrationapplications
Simulation andmodeling tools
Data mining andvisualization
Data managementand archiving
Source: IDC Life Science Insights• 2005 Leading Indicators Study

From Science to Solutions9
Planned Future Spending (6 months) For Data Integration Projects
0% 10% 20% 30% 40% 50% 60%
Don't know
Accenture
Siebel
SAP
PeopleSoft
SAS
Oracle
Microsoft
Dell
Intel
IBM
HP
Hardware (n=35)Software (n=42)Services (n=34)
Source: IDC Life Science Insights• 2005 Leading Indicators Study

From Science to Solutions10
Pressing Needs Within Pharma R&D
1. A decrease in pharmaceutical R&D productivity and the need to reduce compound attrition in drug discovery and development.
2. The need to realize the value of previous investments in new technologies such as genomics, proteomics and systems biology. This includes the need to make sense of the increasing volume of research data and to access and integrate information across internal silos and “data tombs”.
3. The need to connect and make sense of information across R&D business units such as target biology, compound discovery, and clinical trials.
4. The need to share and protect IP and knowledge across alliances with other pharmaceutical companies, biotechnology companies and academic labs.
5. Internal initiatives in informatics and knowledge management have not yielded an IT architecture that enables hypothesis-driven drug discovery throughout the R&D organization.
By creating a Knowledge [enabling] Architecture for Pharmaceutical R&D we can create a blueprint for a new kind of IT infrastructure that enables process optimization, semantic integration and inference, high-level reasoning, and alliance and knowledge management across all pharmaceutical R&D. So – how do we do that?
From Science to Solutions11
You’re thinking the World looks like this…
From Science to Solutions12
Its probably closer to this…

From Science to Solutions13
Informatic Challenges/Opportunities in Drug Disc. and Development
Biology Chemistry Development
Target ID Target Validation Screening Optimization Pre-
Clinical Clinical
• Data Integration and visualization
• Sequence analysis andSNP detection
• Microarray data capture and QC
• Proteinpathwaymodeling
• Data mining
• Association studies
• Diseasemodeling
• Metabonomics
• Comparativegenomics
• Model systems
• HTS
• HCS
• High-throughputstructural biology
• Virtualproteinmodeling
• Virtualscreening
• Chem-informatics
• Molecule registrationsystems
• Pharmaco-kinetic library assessment
• Predictive ADME/Tox
• Diseasemodeling
• Toxico-genomics
• Virtual patient modeling
• Biomarkers
• Surrogatemarkeranalysis
• EDC andsharing
• Pharmaco-genomics
• Clinical trialautomation
• Clinical trialdata analysis
• Reportingsystems

From Science to Solutions14
R&D IT Taxonomy Examples
Software type Workflow steps applicable to
Example PharmaSpend (2004 US$)
Spending Growth
Vendors
Chemical Informatics (Cheminformatics)
Development, Preclinical Development
Chemical registration systems, compound library management
$70 mm 4% - 6% -MDL (85% market share)-IDBS-Accelrys-Tripos
Computational Chemistry Software(Predictive Modelling, Lead Optimization)
Development, Preclinical Development, Clinical Trials (ADMET analysis)
Structural modelling, docking
$136 m ’02 -$187m ‘07
6.6% - Accelrys (34%) - Spotfire (8%)- Tripos (6%)- CCG (6%)- Schrodinger (4%)- MDL (1%)
Content, DatabasesSequenceExpressionProtein interactionProtein structureCompound propertiesToxicityADME propertiesAdditional categories
including reactions, compound properties, etc.
Target Biology, Development, Preclinical Development, Clinical Trials, Post Marketing Surveillance
Unigene data, OMIM, Beilstein,Scifinder,Derwent
$350 mm in 2004 going to $425 mm in 2008.Medical databases (prescriptions, clinical trials db re: IMS >$1b)
8.4% growth 2004 -2008
- Celera- Incyte- NHGRI- Curagen- MDL- IMS- NIH

From Science to Solutions15
R&D IT Taxonomy Examples
Software type Workflow steps applicable to
Example PharmaSpend (2004 US$)
Spending Growth
Vendors
Content Integration Systems Data Management Systems
All Data management from instruments and labs, lab operations software
$335 million in 2004
- 14% growth 2004-2008
- MDL - Accelrys- Lion Bioscience- Tripos- Genedata
Knowledge Management Systems (including information sharing)
All Information sharing, collaboration management
$82.5 mm 12.4% growth through 2007
- Biowisdom- Cognos- Business Objects-MediaCybernetics- Cadent
Text Mining All Teratext, extracting relationships from journal articles
$10 million 2003$21 m, 2007
16% through 2008 - SAS - Lion - SPSS-Insightful -Statsoft
Distributed Computing Target Biology Research, Development, Preclinical, some Clinical Trials
Cluster and Grid Computing
~$600 million in 2004
- 10.3% growth through 2008
- Sun- Apple- Intel- HP- IBM- Turboworx- Platform Computing

From Science to Solutions16
Software + Content = ROI
Content and Software Solutions Unmet customer needs / Pain points:
Improve productivity and innovation, reduce costs
Improve content integration and knowledge sharing
Improve efficiency and effectiveness of meeting regulatory requirements
Identify drug failures earlier
Process large volumes of data (structured and unstructured)
Need tools to support new approaches to drug development eg. Personalized medicine, Pharmacovigilance
Data and content analysis softwareEnables inference, interpretation, summary through:
Entity and relationship extraction, (e.g. TeraText)Identify and authenticate novel IP (e.g. Ingenuity)Data cleaning, imposition of standard terminologies (e.g. MedDRA, Snomed, GO)
Data and contentContent eg. proprietary, published, licensed, open access Journals, books, databases
Workflow management software & contentEnables productivity through:
Framework technology Workflow tools (e.g. Available Chemicals Directory)Electronic data capture (e.g. Electronic Lab Note Books)Content integrationSearch, text and data mining
Data & content
Workflow mgt software
Data & content analysis software
VALUE

From Science to Solutions17
Example of a R&D Process Map: Key Information Assets in Target Identification and Qualification
Target Identification and Qualification
ExperimentalCharacterizationGenomics
Proteomics
Genetics
FunctionalStudies
DNA/RNA SequencingAnd Expression
ProteinExpression
MolecularLinkage and Genotyping
GeneCharacterization
ProteinStructure
ProteinFunction
ProteinInteractions
Data Input
Data Generated
• Array-basedexpression
• Sample characterization
• Relative geneexpression
• Disease-genecorrelation
• Localization
• Array-based expression
• 2d gel and massspec
• Sample characterization
• Relative gene expression
• Disease-genecorrelation
• Localization
• Linkage/ association studies
• Sample characterization
• Statistical correlationsbetween genes/ regions anddiseases
Qualified Targets
• Published sequences
• Raw sequence• ESTs, SNPs• Ontologies
• Published sequence
• Structural studies
• Ontologies
• Sequencecharacterization
• Homologies• Orthologies• Splice patterns• Localization
• Protein structure
• Annotated homologies
• Gene function• Gene
annotation
• Gene function• Predicted
structure
• Experimental evidence
• Published studies
• Experimental evidence
• Experimental evidence
• Pathway Maps
• Gene function • Interactions between genes in pathways
Output
ChemistryBiology Development

From Science to Solutions18
Example of a R&D Process Map: Key Information Assets in In Silico Chemistry Screening II –
Biological Structure, In Silico Screening and Libraries
Screening
Compound library design, synthesis, characterization and management
Assay Development High throughput screeningwith compound libraries
Chemoinformatics toderive SARsValidated
TargetsBiological structural studies Compound pre-screening
In silicoChemical screening of
focused libraries
• Protein structure data•Overall structure•Binding pocket•Topography•pPolarity
• Lipinski and other rules• Previous HTS and HCS data • ADMET data
• Target protein characteristics• Chemical compound properties and structure
• Definition of pharmacophores• Previous HTS and HCS data• Previous SAR data• ADMET data
Data Input
• Target protein characterization • Target gene characterization
Data Generated • Protein structure data
• Overall structure• Binding site data• Polarity
• Definition of pharmacophores • Identification of hits and non-hits• Potency of hits
Drug leads•In silico lead structures• Defined protein structuresOutput
ChemistryBiology Development
From Science to Solutions19
Key Enablers
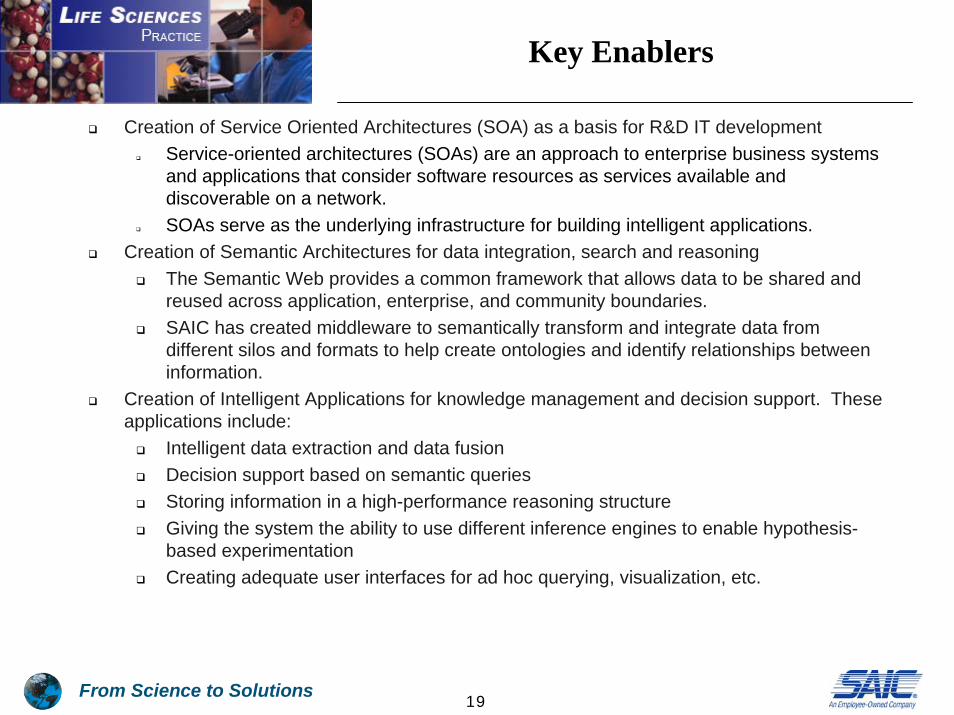
Creation of Service Oriented Architectures (SOA) as a basis for R&D IT developmentService-oriented architectures (SOAs) are an approach to enterprise business systems and applications that consider software resources as services available and discoverable on a network.SOAs serve as the underlying infrastructure for building intelligent applications.
Creation of Semantic Architectures for data integration, search and reasoningThe Semantic Web provides a common framework that allows data to be shared and reused across application, enterprise, and community boundaries.SAIC has created middleware to semantically transform and integrate data from different silos and formats to help create ontologies and identify relationships between information.
Creation of Intelligent Applications for knowledge management and decision support. These applications include:
Intelligent data extraction and data fusionDecision support based on semantic queriesStoring information in a high-performance reasoning structureGiving the system the ability to use different inference engines to enable hypothesis-based experimentationCreating adequate user interfaces for ad hoc querying, visualization, etc.

From Science to Solutions20
Examples
PharmacovigilanceBiomarker discovery and validation

From Science to Solutions21
The Need for New IT Solutions to Enable PV
Problem statement: Pharma needs new methods and new systems for detecting and tracking experimental signals that indicate specific toxicities in defined patient populations (pharmacovigilance). The ramifications associated with COX-2 inhibitor drug scrutiny demands that the pharmaceutical industry must identify and address potential problems earlier in the drug discovery and development process.
Problem detail: R&D generates huge volumes of experimental data that eventually become part of the legacy of a compound’s IND filing. Throughout the R&D process, information is generated and experiments are conducted that might signal potential toxicities for compounds further up the value chain. The quantity and richness of these data are so vast that the traditional analytic tools have failed to identify potential clinical adverse events.
One approach: By using semantic web methodologies for data integration and by creating intelligent applications for signal detection, researchers in preclinical and clinical development can search and view the research history of a compound. As a result, we will enable creation of overarching views and predictions, leading to safer therapeutics in the market place.

From Science to Solutions22
Recent Adverse Event Examples
Drug Manufacturer Disease Indication Deaths Side Effects
Vioxx / Celebrex Merck / Pfizer Inflammation, pain ?? Increased risk of cardiovascular events
Baycol Bayer High cholesterol 31 Muscle cell damage, rhabdomyolysis
Rezulin Parke-Davis/ Warner-Lambert
Diabetes 63 Liver poisoning
Lotronex GSK Iritable bowel syndrome
4 Ischemic colitis
Propulsid Janssen Pharmacetuicals
GERD 80 Cardiac arrhythmias
Risperdal Johnson and Johnson Schizophrenia 16 Stroke

From Science to Solutions23
A Pressing Need Within Pharma R&D
The need to connect and interpret information across all R&D business units from target biology and compound discovery to preclinical development and clinical trials.
The need for safety signal detection systems throughout the entire pharmaceutical value chain.
This is a major trend in pharmaceutical development and in healthcare:
Improves competitive intelligence and surveillance, and relates patient profiles and genomic data to safety.
Enhances risk-benefit assessment to drive preferred treatment plans.
Provides continued education and alerts to reduce avoidable drug reactions.
Internal initiatives in informatics and knowledge management have not created an IT architecture that enables true safety signal detection throughout the entire R&D organization.
Pharmacovigilance is essentially a problem of data standardization, integration, signal detection and reporting.
“A new toolkit for safety is urgently needed” – FDA 2004 Whitepaper.

From Science to Solutions24
A Semantic Architecture
The Semantic Web provides a common framework that allows data to be shared and reused across application, enterprise, and community boundaries. It is a collaborative effort led by the W3C with participation from a large number of researchers and industrial partners. It is based on the Resource Description Framework (RDF), which integrates a variety of applications using XML for syntax and URLs for naming. The semantic web is expressed using the Web Ontology Language (WOL). Data is expressed in a basic format of triples: subject, predicate, object -relations are not embedded in schema but in rules expressed as triples.Ontologies are much more than Taxonomies.Descriptive Logic involves calculating results on ontologies:
This enables us to build “intelligent” applications using reasoning and inference.
Promise of semantic applications:Improves recall and precision when searching and processing data.Provides standards approach to data sharing that doesn’t involve detailed coding of specific schema.Enables reasoning and inference.Offers well-suited solutions to problems in pharmaceutical data integration.

From Science to Solutions25
Semantic Systems DevelopmentOBIWAN for the Department of Defense
SemanticLayer
Federated & Distributed
DataStructured
MIDB TBD
Semi-Structured & Unstructured
Entity/Link ExtractorMETS
External Instance RetrievalCerebra Server
OntologyInference EngineCerebra Server
Graph BasedQuery Service
(XQuery/SPARQL)
SemanticAdaptation
Services
DataServices
Oracle 10GText Query
SemanticQuery
Services
SemanticLayer
Management
Ontology MappingCerebra Server
Ontology AuthoringCerebra Construct
R-Link(SAIC)
Create/Update/Delete
METS OntologyKnowledge Base
ClientApplications
KnowledgeInterchange Service
Oracle 10GRDMS
Analyst Modeling(SAIC Toolkit)
Analyst Notebook(I2)
METS RDF StoreKowari
netVizArcGIS/GeoRoverArcGIS/GeoRover
Federated OntologyKnowledge Base
RDF DatabaseKowari
Graphical Query(Cognaxint,SAIC)
Ontology Authoring(NI Cerebra Construct)
Service OrientedArchitecture (SOA)
Reasoning Engine forEntity Resolution/Derived Relations
Web Services
From Science to Solutions26
The Need for New IT Solutions to Enable Biomarker Discovery and Validation
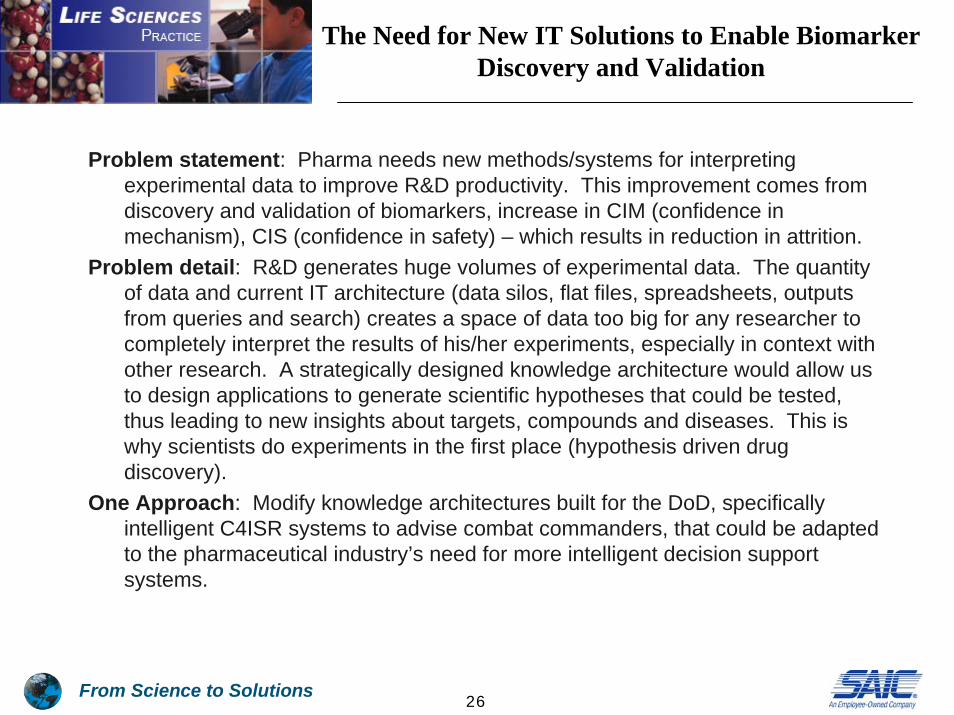
Problem statement: Pharma needs new methods/systems for interpreting experimental data to improve R&D productivity. This improvement comes from discovery and validation of biomarkers, increase in CIM (confidence in mechanism), CIS (confidence in safety) – which results in reduction in attrition.
Problem detail: R&D generates huge volumes of experimental data. The quantity of data and current IT architecture (data silos, flat files, spreadsheets, outputs from queries and search) creates a space of data too big for any researcher to completely interpret the results of his/her experiments, especially in context with other research. A strategically designed knowledge architecture would allow us to design applications to generate scientific hypotheses that could be tested, thus leading to new insights about targets, compounds and diseases. This is why scientists do experiments in the first place (hypothesis driven drug discovery).
One Approach: Modify knowledge architectures built for the DoD, specifically intelligent C4ISR systems to advise combat commanders, that could be adapted to the pharmaceutical industry’s need for more intelligent decision support systems.

From Science to Solutions27
The Biomarker Paradigm
Clinical orOutcomeClinical orOutcomeTargetTarget
TargetTargetCompound
MechanismMechanism
DiseaseModification
DiseaseDiseaseModificationModification
TargetPathway
PDE5Measure plasma
cGMP using commercial ELISA
Blood PressureViral Load, etc
Platelet AggregationELISA or other….

From Science to Solutions28
Building an Inference System for Biomarker Discovery
Create a knowledge base using internal data as well as external data consisting of one or more ontologies describing the objects relevant to the problem domain (genes, proteins, disease, biomarkers), a set of relationships between objects (pathways, word co-occurrence in scientific articles, etc.), a set of semantic models, and additional knowledge in the form of domain-specific inference rules and domain-specific facts (data). Develop a user interface for the knowledge base so researchers can continue to update relationships between genes, proteins and compounds under study as new experiments are conducted. The knowledge base can be visualized as a graph so that researchers can get a complete sense of the biological system under study and continue to annotate and comment on the data. Create a rule base for biomarker discovery using automated data mining tools and manual curation. The knowledge base plus the rules for navigating over the space of the knowledge base compose a “knowledge system”.Modify an existing reasoning engine to allow researchers to generate inferences over the knowledge system when analyzing new experimental data. Test the system using gene or protein expression data. The knowledge system plus the reasoning engine will generate a list of hypothesis describing the biological system under investigation.

From Science to Solutions29
Hypothesis-Driven Biomarker Discovery
TargetTargetCompound
DiseaseModification
DiseaseDiseaseModificationModification
TargetPathway
Molecule Properties
Drug
Trial
Data
Side-EffectsDisease Target
BioMarkers
Protocol
Experiment
exhibits
exhibits targets
Used-in
targets
Treated-by
Tested-in
produces
assessed-byassessed-by
Associated-with
exhibits
Tested-in
producesmeasures

From Science to Solutions30
Example Summary
Data and information within R&D must be joined and searched by indication, drug class, drug name, chemical structure, target biology and pathway, journal articles, adverse events, and other granular variables.Semantic Architectures allow us to extract, integrate, relate and store many kinds of structured and unstructured data and to present that data to researchers in multiple formats – enhancing both search capabilities and communication. The “tyranny of the search box” is eliminated.Intelligent Systems development allows us to put inference and reasoning on top of our semantic architecture. It provides us the tools to build automated, intelligent applications for safety signal detection, discovery, decision support, translational medicine, and enhanced predictability within the entire R&D value chain.
Pharmacovigilance has become a problem of data standardization, integration, signal detection and reporting. Creating novel KM systems to enable safety signal detection is critical for the future of drug discovery and development.Biomarker discovery and validation is a problem of data extraction, assimilation, experimental modeling and inference. Creating novel KM systems to suggest experimental direction for target/compound studies will lead to new IP.

From Science to Solutions31
Conclusions
First principles: How can we better leverage the collective results of the thousands of studies/experiments that are conducted every year within R&D to increase productivity and reduce attrition?Service Oriented Architectures (SAO) provide a model for building efficient, cost effective Pharma IT infrastructures.Layering on Semantic Architectures allows us to extract, integrate, relate and store many kinds of structured and unstructured data and present that data to researchers in multiple formats – enhancing search and communication. The “tyranny of the search box” is removed.Intelligent Systems development allows us to put inference and reasoning on top of our architecture in order to build smart applications that give decision support, suggest experimental direction, model systems under study, and identify like-minded researchers within R&D.
Look at highly successful, well-integrated systems designed for other vertical markets and government agencies. Use these existing systems to design a new kind of IT blueprint for pharmaceutical R&D IT.

From Science to Solutions
Jim Golden, Ph.D.Chief Technology Officer
SAIC [email protected]
508-839-7005