Embed Size (px)
Citation preview

Knowing youmakes us better!
2013 annual report
Company Profile
Metroadonis
MetroMetro plus
adonis
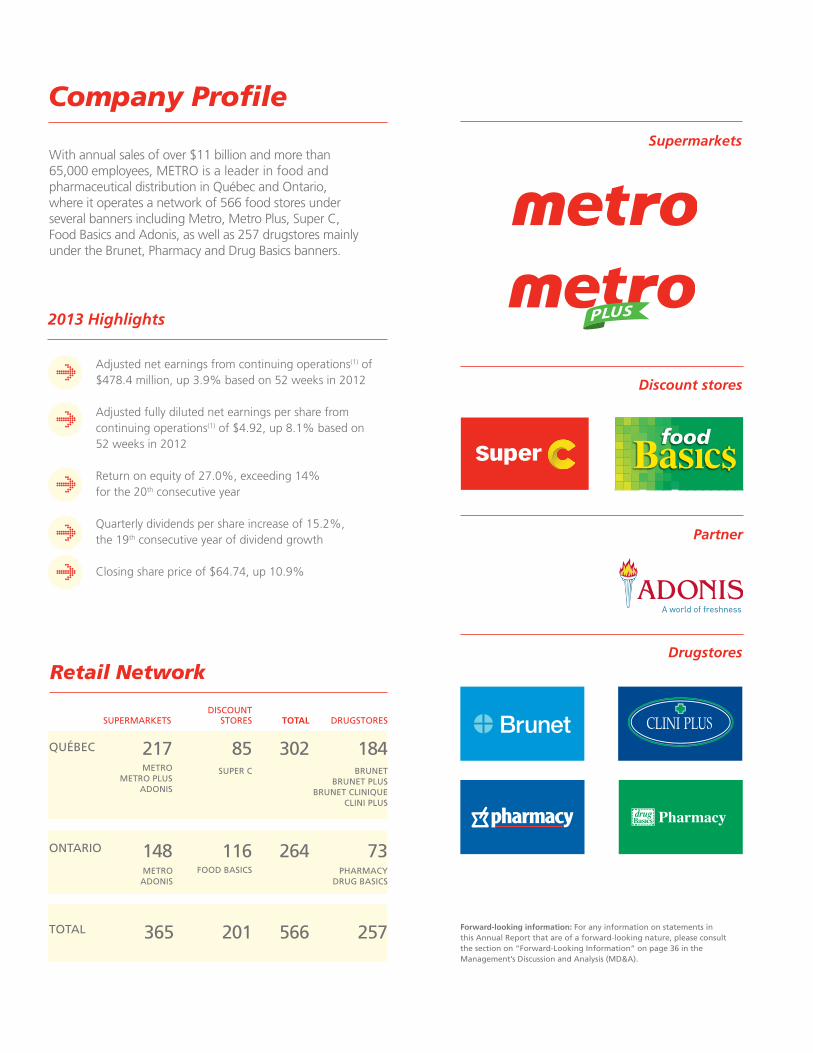
217
148
365
superMarkets
85
116
201
super c
food basics
discount stores
184
73
257
brunetbrunet plus
brunet cliniqueclini plus
pharMacydrug basics
drugstores
302
264
566
TOTAL
total
québec
ontario
Retail Network
Supermarkets
Partner
Drugstores
Discount stores
With annual sales of over $11 billion and more than 65,000 employees, METRO is a leader in food and pharmaceutical distribution in Québec and Ontario, where it operates a network of 566 food stores under several banners including Metro, Metro Plus, Super C, Food Basics and Adonis, as well as 257 drugstores mainly under the Brunet, Pharmacy and Drug Basics banners.
Adjusted net earnings from continuing operations(1) of $478.4 million, up 3.9% based on 52 weeks in 2012
Adjusted fully diluted net earnings per share from continuing operations(1) of $4.92, up 8.1% based on 52 weeks in 2012
Return on equity of 27.0%, exceeding 14% for the 20th consecutive year
Quarterly dividends per share increase of 15.2%, the 19th consecutive year of dividend growth
Closing share price of $64.74, up 10.9%
2013 Highlights
Forward-looking information: for any information on statements in this annual report that are of a forward-looking nature, please consult the section on “forward-looking information” on page 36 in the Management’s discussion and analysis (Md&a).
F inancial HigHligHts | 2013 annual report 1
Financial Highlights
2013 2012 2011 2010 2009 IFRS IFRs IFRs GAAP GAAP 52 weekS 53 weeks 52 weeks 52 weeks 52 weeks
Operating Results (MIllIons oF dollARs)
sales 11,402.8 11,674.9 11,070.0 11,021.1 10,882.8
eBITdA(1)(2) 781.2 822.9 725.8 747.5 704.8
Income from operating activities 601.6 639.0 546.5 549.2 518.0
net earnings 721.6 489.3 392.7 391.8 354.4
Adjusted net earnings from continuing operations(1) 478.4 471.5 408.6 385.1 361.0
Cash flows from operating activities 566.8 546.1 542.4 547.8 520.1
Financial Structure (MIllIons oF dollARs)
Total assets 5,061.5 5,150.9 4,817.4 4,796.9 4,658.1
non-current debt 650.0 973.9 656.2 1,004.3 1,004.3
equity 2,807.4 2,545.1 2,399.3 2,442.8 2,264.1
Per Share (dollARs)
Basic net earnings 7.52 4.87 3.81 3.67 3.21
Fully diluted net earnings 7.46 4.84 3.79 3.65 3.19
Adjusted fully diluted net earnings from continuing operations(1) 4.92 4.66 3.94 3.59 3.25
Book value 30.72 26.19 23.74 23.25 20.85
dividends 0.9650 0.8375 0.7475 0.6475 0.5375
Financial Ratios (%)
eBITdA(1)(2)/sales 6.9 7.0 6.6 6.8 6.5
Income from operating activities/sales 5.3 5.5 4.9 5.0 4.8
Return on equity 27.0 19.8 16.6 16.6 16.4
non-current debt/total capital 18.8 27.7 29.9 29.1 30.7
Share Price (dollARs)
High 75.81 59.68 49.55 47.01 40.00
low 56.52 43.76 42.11 33.02 27.38
Closing price (AT yeAR-end) 64.74 58.40 44.69 45.15 34.73
(1) see section on ‘’IFRs and non-IFRs measurements’’ on page 36 in the Md&A
(2) earnings before financial costs, taxes, depreciation and amortization
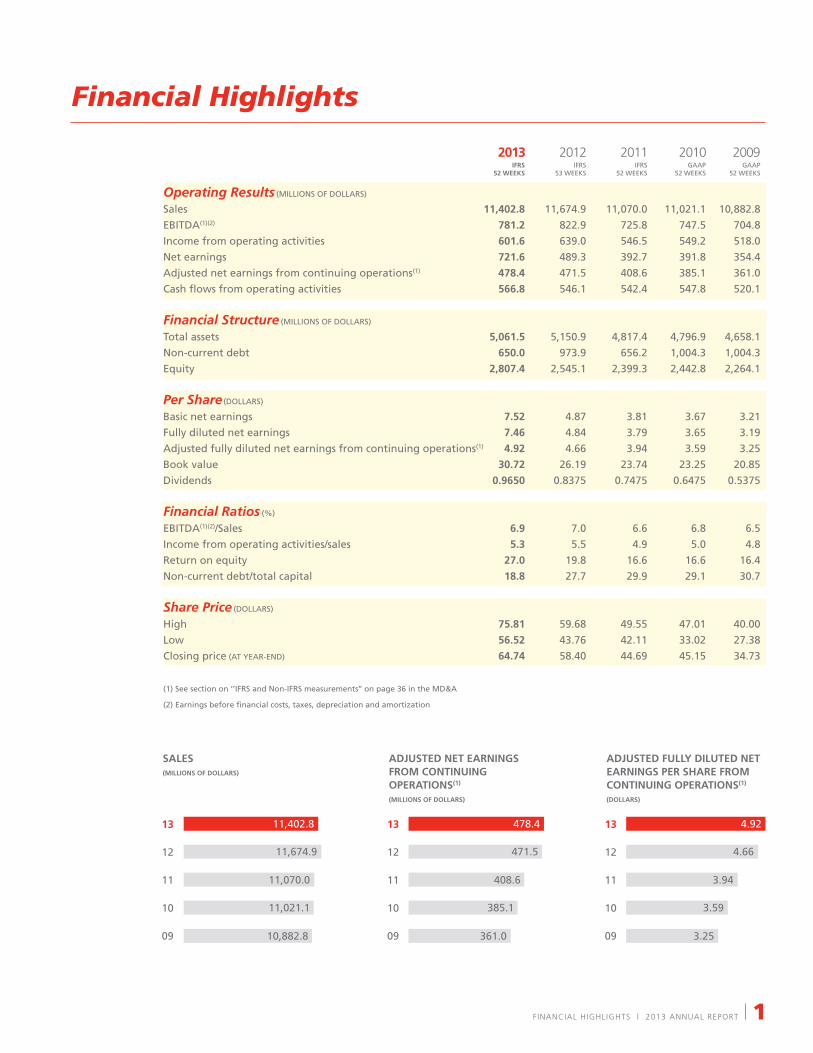
SaleS(MIllIonS oF dollaRS)
13
12
11
10
09
13
12
11
10
09
13
12
11
10
09
adjuSted net eaRnIngS FRoM contInuIng opeRatIonS(1)
(MIllIonS oF dollaRS)
adjuSted Fully dIluted net eaRnIngS peR ShaRe FRoM contInuIng opeRatIonS(1)
(dollaRS)
0 2000 4000 6000 8000 10000 12000 0 100 200 300 400 500 0 1 2 3 4 50 2000 4000 6000 8000 10000 12000 0 100 200 300 400 500 0 1 2 3 4 50 2000 4000 6000 8000 10000 12000 0 100 200 300 400 500 0 1 2 3 4 5
11,402.8 478.4 4.92
11,674.9 471.5 4.66
11,070.0 408.6 3.94
11,021.1 385.1 3.59
10,882.8 361.0 3.25
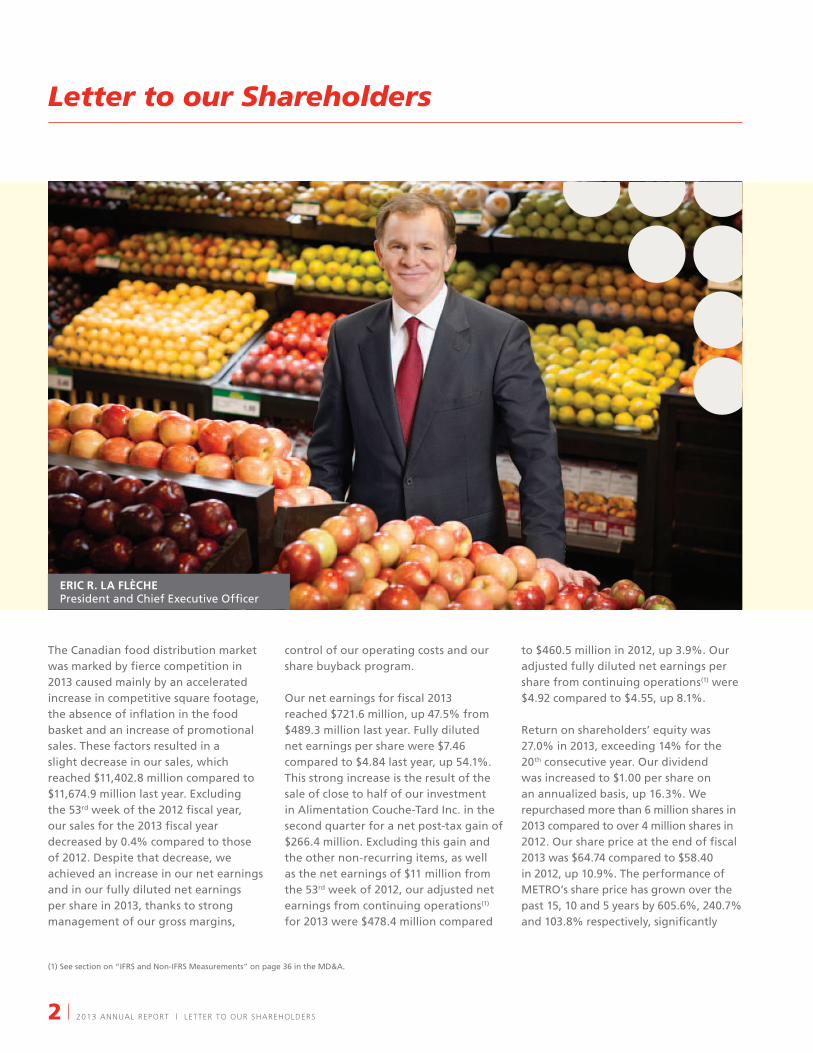
Letter to our Shareholders
2 2013 annual report | letter to our sHareHolders
The Canadian food distribution market was marked by fierce competition in 2013 caused mainly by an accelerated increase in competitive square footage, the absence of inflation in the food basket and an increase of promotional sales. These factors resulted in a slight decrease in our sales, which reached $11,402.8 million compared to $11,674.9 million last year. excluding the 53rd week of the 2012 fiscal year, our sales for the 2013 fiscal year decreased by 0.4% compared to those of 2012. despite that decrease, we achieved an increase in our net earnings and in our fully diluted net earnings per share in 2013, thanks to strong management of our gross margins,
control of our operating costs and our share buyback program.
our net earnings for fiscal 2013 reached $721.6 million, up 47.5% from $489.3 million last year. Fully diluted net earnings per share were $7.46 compared to $4.84 last year, up 54.1%. This strong increase is the result of the sale of close to half of our investment in Alimentation Couche-Tard Inc. in the second quarter for a net post-tax gain of $266.4 million. excluding this gain and the other non-recurring items, as well as the net earnings of $11 million from the 53rd week of 2012, our adjusted net earnings from continuing operations(1) for 2013 were $478.4 million compared
to $460.5 million in 2012, up 3.9%. our adjusted fully diluted net earnings per share from continuing operations(1) were $4.92 compared to $4.55, up 8.1%.
Return on shareholders’ equity was 27.0% in 2013, exceeding 14% for the 20th consecutive year. our dividend was increased to $1.00 per share on an annualized basis, up 16.3%. we repurchased more than 6 million shares in 2013 compared to over 4 million shares in 2012. our share price at the end of fiscal 2013 was $64.74 compared to $58.40 in 2012, up 10.9%. The performance of MeTRo’s share price has grown over the past 15, 10 and 5 years by 605.6%, 240.7% and 103.8% respectively, significantly
(1) see section on “IFRs and non-IFRs Measurements” on page 36 in the Md&A.
eRIc R. la Flèche President and Chief executive officer

letter to our sHareHolders | 2013 annual report 3
higher returns than the s&P/TsX index. our financial situation is very healthy with a total long-term debt to capital ratio of 18.8% at the end of fiscal 2013 and a BBB credit rating.
A major shareholder of Alimentation Couche-Tard Inc. since 1987, we decided, during the second quarter of 2013, because of the significant value of the investment compared to the Corporation’s total value, that it was an appropriate time to realize part of the gain we had accrued over all those years. we remain confident about the value of our investment, which is why we have kept 10.7 million shares, which represents 5.7% of Alimentation
Couche-Tard Inc.’s outstanding shares. we used the $479.0 million disposition proceeds to repay our revolving credit facility of $330.4 million and to increase our share buybacks.
2013 achIeveMentSwe undertook several projects in 2013 that were geared towards our mission of satisfying our customers every day to earn their long-term loyalty.
we invested over $270 million with our retailers in our retail network, for a gross increase of 413,300 square feet and a net increase of 163,200 square feet or 0.8% of our retail network. we opened nine new stores and carried out
expansions and major renovations in nine other stores. we are pleased that among the new stores, we opened the first Adonis store in ontario.
we continued carrying out our Produce Initiative aimed at improving our in-store produce offering. The installation of new produce counters and displays in our stores, which began last year, continued this year. we also opened, in the spring of 2013, a new 241,000 square foot produce and dairy warehouse in laval. This $50 million investment allows us to be more efficient and improve our product assortment.
pIeRRe h. leSSaRd Chairman of the Board
4 2013 annual report | letter to our sHareHolders
we carried out a complete overhaul of our metro.ca website and developed a new iPhone(1) mobile digital device app in order to communicate more easily with our customers and make their grocery shopping experience simpler. These platforms allow us to better customize our offers and help our customers choose products according to the weekly specials and recipe suggestions.
Finally, on the pharmaceutical side, we agreed to a partnership with retailer Target to open 18 pharmacies in 2014 under the Brunet banner in most Target stores in Québec.
objectIveS and buSIneSS planS FoR 2014Competition will remain fierce in 2014. our objectives and our business plans for 2014 will be mainly directed at increasing our sales while continuing to put the customer at the centre of everything we do.
we believe that our size and leadership position in Québec and ontario give us the scale necessary to compete effectively in our markets despite recent announcements of acquisitions made by some of our competitors, which will further consolidate the Canadian food distribution industry.
one of our major priorities is to complete the reorganization of our ontario stores, which began in the fourth quarter of 2013. some Metro supermarkets will be converted into Food Basics discount stores, some collective agreements will be bought out, early exit will be offered to some employees and a few stores will close. To rejuvenate our Food Basics discount stores, we will speed up renovations, improve in-store signage and renew our
merchandising program to increase our share of the growing discount market.
For our Metro supermarkets, our priority is to always provide the best customer experience in the industry. we will concentrate on improving our product offerings, notably where fresh and healthy products are concerned. we will focus on their superior quality, a pleasant and efficient shopping experience, as well as customer service. our loyalty programs will evolve towards greater personalization in order to nurture the engagement of our customers.
Always mindful of new trends, we put together a team devoted to innovation whose goal will be to seek out innovative and distinctive products and to develop, through the use of test stores, new merchandising concepts.
we will continue to be on the lookout for any opportunity to increase our market share in the food and pharmaceutical distribution areas. our financial situation is very healthy and our acquisition decisions will continue to be guided by disciplined financial management in the best long-term interests of the Corporation.
boaRd oF dIRectoRSThe Board of directors carries out its mandate thanks to the various skills and experience of its members. we propose the candidacy of a third woman, line Rivard, a corporate director who spent most of her career as an investment banker in the area of mergers and acquisitions. This candidacy follows the Corporation’s commitment taken at last year’s Annual General Meeting of shareholders to gradually increase the number of women on the Board. Between now and 2016, four directors
will reach the age limit, and the Board is preparing an orderly transition.
acknowledgeMentS we pay tribute to our 65,000 employees for their dedication and professionalism. Achieving our results speaks to the efforts that each of them has made. we would also like to thank the members of the Board of directors for their sound advice, as well as our business partners, suppliers and customers for their loyalty and support. Finally, we would like to thank you, dear shareholders, for the trust that you continue to show in us.
(1) iPhone is a trademark of Apple Inc.
eRIc R. la Flèche President and Chief executive officer
pIeRRe h. leSSaRd, Fcpa, Fca Chairman of the Board
download the app!
Available on the
review oF operations | 2013 annual report 5
our objective is to be the most successful food retailer in Canada, and our mission is satisfying our customers every day to earn their long-term loyalty.
To achieve our objective and carry out our mission, we adopted, in 2008, a strategy based on four pillars: customer-focus, the best execution, the best team and creating value for our shareholders.
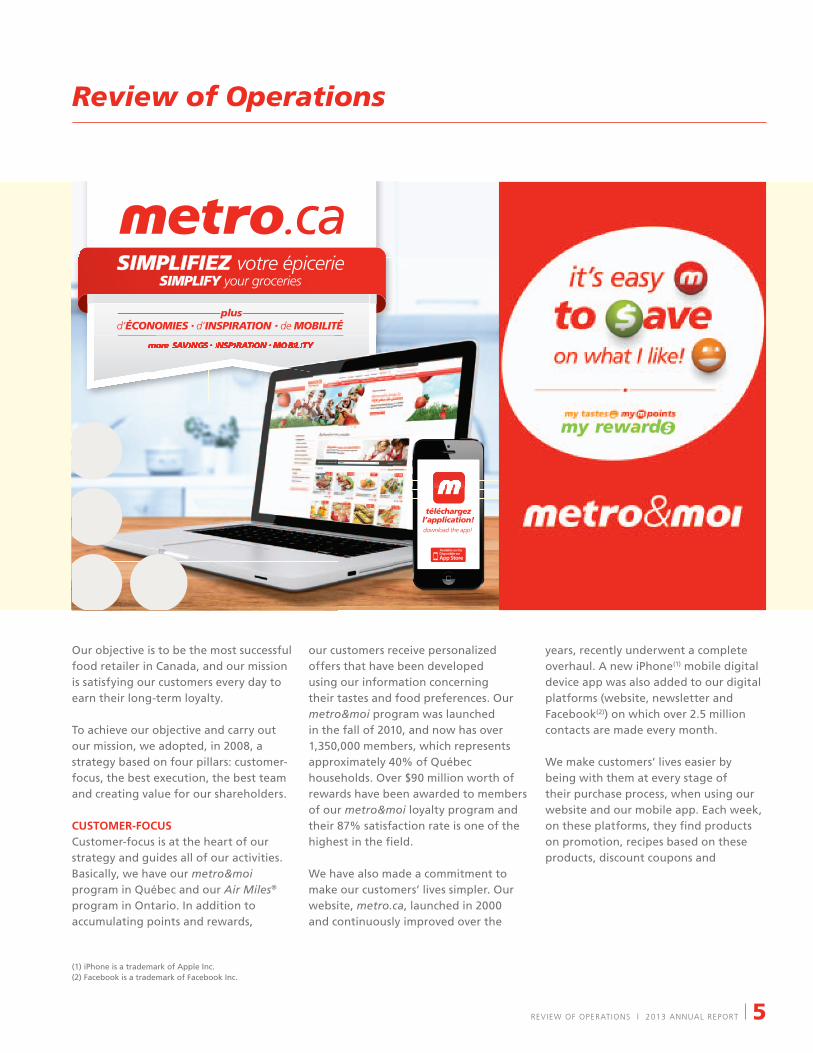
cuStoMeR-FocuSCustomer-focus is at the heart of our strategy and guides all of our activities. Basically, we have our metro&moi program in Québec and our Air Miles® program in ontario. In addition to accumulating points and rewards,
our customers receive personalized offers that have been developed using our information concerning their tastes and food preferences. our metro&moi program was launched in the fall of 2010, and now has over 1,350,000 members, which represents approximately 40% of Québec households. over $90 million worth of rewards have been awarded to members of our metro&moi loyalty program and their 87% satisfaction rate is one of the highest in the field.
we have also made a commitment to make our customers’ lives simpler. our website, metro.ca, launched in 2000 and continuously improved over the
years, recently underwent a complete overhaul. A new iPhone(1) mobile digital device app was also added to our digital platforms (website, newsletter and Facebook(2)) on which over 2.5 million contacts are made every month.
we make customers’ lives easier by being with them at every stage of their purchase process, when using our website and our mobile app. each week, on these platforms, they find products on promotion, recipes based on these products, discount coupons and
Review of Operations
(1) iPhone is a trademark of Apple Inc. (2) Facebook is a trademark of Facebook Inc.
6 2013 annual report | review oF operations
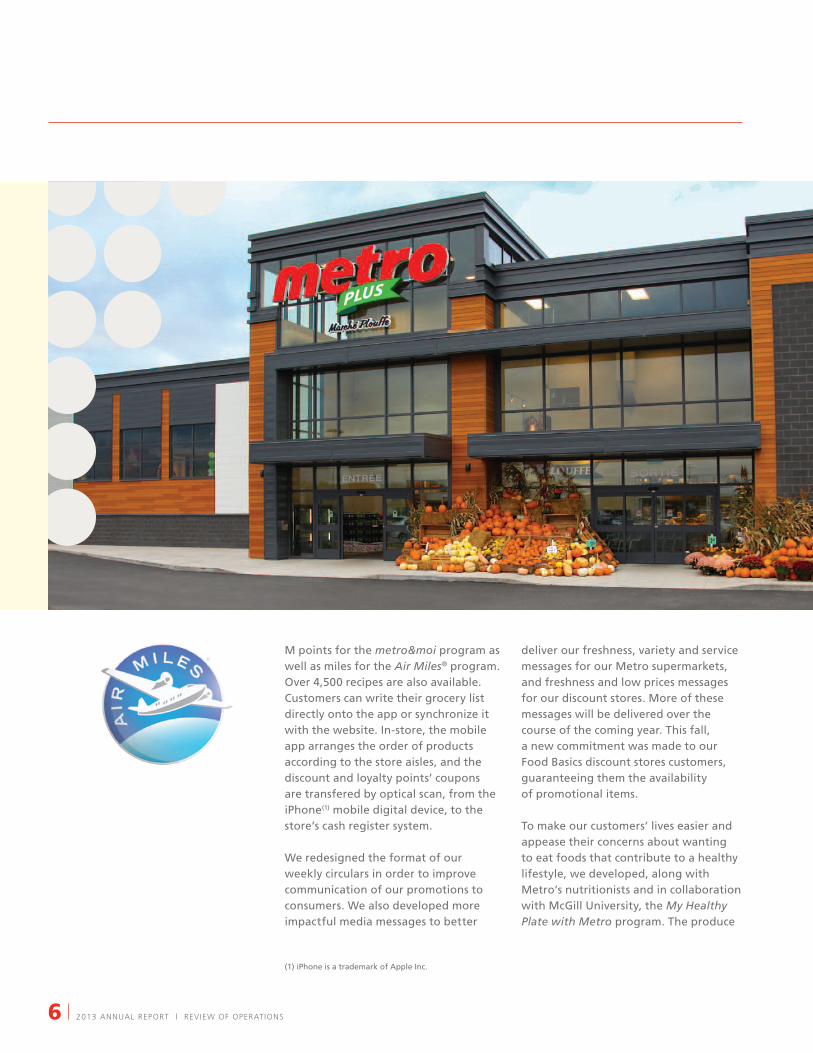
M points for the metro&moi program as well as miles for the Air Miles® program. over 4,500 recipes are also available. Customers can write their grocery list directly onto the app or synchronize it with the website. In-store, the mobile app arranges the order of products according to the store aisles, and the discount and loyalty points’ coupons are transfered by optical scan, from the iPhone(1) mobile digital device, to the store’s cash register system.
we redesigned the format of our weekly circulars in order to improve communication of our promotions to consumers. we also developed more impactful media messages to better
deliver our freshness, variety and service messages for our Metro supermarkets, and freshness and low prices messages for our discount stores. More of these messages will be delivered over the course of the coming year. This fall, a new commitment was made to our Food Basics discount stores customers, guaranteeing them the availability of promotional items.
To make our customers’ lives easier and appease their concerns about wanting to eat foods that contribute to a healthy lifestyle, we developed, along with Metro’s nutritionists and in collaboration with McGill University, the My Healthy Plate with Metro program. The produce
(1) iPhone is a trademark of Apple Inc.

review oF operations | 2013 annual report 7
department is featured prominently at the heart of the health strategy, through a poster campaign, as well as helpful hints and advice in the circular and in-store, in order to showcase them and encourage consumers to cook them in a healthy way. smiley-faces posted in-store enable customers to quickly identify good choices and the best choices in the various grocery categories. our nutritionists’ helpful hints and recipes allow customers to enjoy eating well.
beSt executIonour second pillar is to carry out the best execution in all of our activities. our Produce Initiative, whose objective is to improve our in-store produce offerings,
was launched two years ago and is part of that thinking. we have improved every aspect related to produce, from choosing suppliers to presentation standards as well as the supply chain and our employee training. we are also increasing variety and improving the freshness of our in-store produce by installing new counters and displays. The setting up of these installations in our stores began last year and will be completed next year. The success of our Produce Initiative is reflected by our customers’ satisfaction and our increased produce sales.
8 2013 annual report | review oF operations
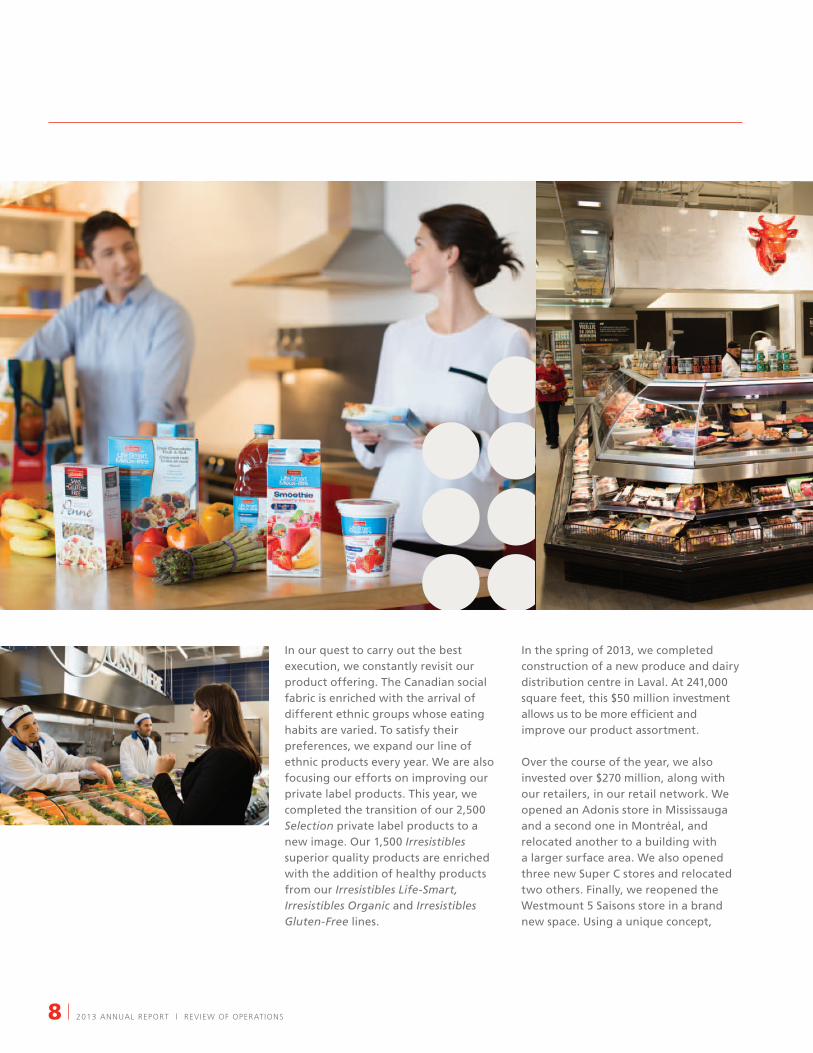
In our quest to carry out the best execution, we constantly revisit our product offering. The Canadian social fabric is enriched with the arrival of different ethnic groups whose eating habits are varied. To satisfy their preferences, we expand our line of ethnic products every year. we are also focusing our efforts on improving our private label products. This year, we completed the transition of our 2,500 Selection private label products to a new image. our 1,500 Irresistibles superior quality products are enriched with the addition of healthy products from our Irresistibles Life-Smart, Irresistibles Organic and Irresistibles Gluten-Free lines.
In the spring of 2013, we completed construction of a new produce and dairy distribution centre in laval. At 241,000 square feet, this $50 million investment allows us to be more efficient and improve our product assortment.
over the course of the year, we also invested over $270 million, along with our retailers, in our retail network. we opened an Adonis store in Mississauga and a second one in Montréal, and relocated another to a building with a larger surface area. we also opened three new super C stores and relocated two others. Finally, we reopened the westmount 5 saisons store in a brand new space. Using a unique concept,
review oF operations | 2013 annual report 9
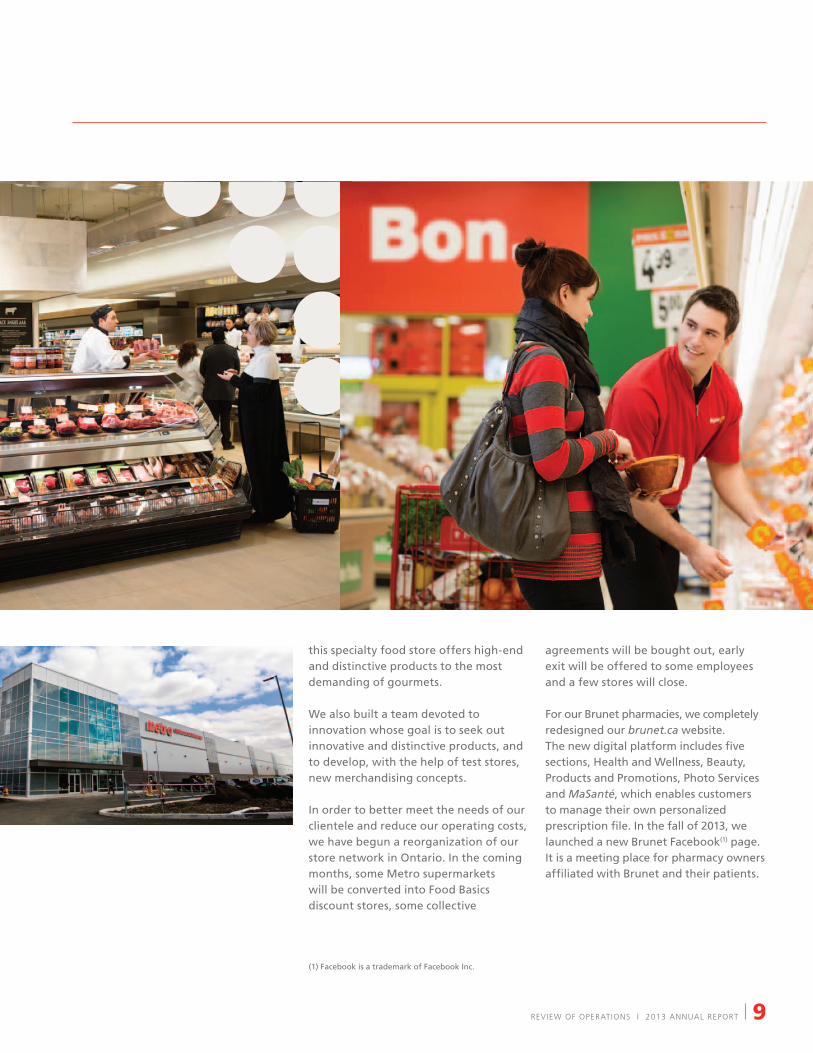
this specialty food store offers high-end and distinctive products to the most demanding of gourmets.
we also built a team devoted to innovation whose goal is to seek out innovative and distinctive products, and to develop, with the help of test stores, new merchandising concepts.
In order to better meet the needs of our clientele and reduce our operating costs, we have begun a reorganization of our store network in ontario. In the coming months, some Metro supermarkets will be converted into Food Basics discount stores, some collective
agreements will be bought out, early exit will be offered to some employees and a few stores will close.
For our Brunet pharmacies, we completely redesigned our brunet.ca website. The new digital platform includes five sections, Health and wellness, Beauty, Products and Promotions, Photo services and MaSanté, which enables customers to manage their own personalized prescription file. In the fall of 2013, we launched a new Brunet Facebook(1) page. It is a meeting place for pharmacy owners affiliated with Brunet and their patients.
(1) Facebook is a trademark of Facebook Inc.

10 2013 annual report | review oF operations
An agreement was reached with Target to open, in 2014, 18 pharmacies under the Brunet banner in most Target stores in Québec.
beSt teaMour third pillar is to be able to rely on the best team of employees. we regularly provide training to our in-store employees with respect to our Five Customer Promises program. The program is a commitment to our clientele to give them greater satisfaction. To measure if we have reached our objectives, we use a survey to gather the opinions of our
customers. over the coming year, we will implement a manpower planning system to optimize the number of in-store employees required to respond to clientele need according to customer traffic.
In order to develop and retain our talented personnel, we are currently developing a mentoring and training program within the framework of a personalized career plan.
winner for the second quarter of 2013 – our Five Customer Promises Recognition Program. danielle Picard, franchised owner of Metro Plus in saint-Constant, Québec, with her managers.
corporate responsibil ity | 2013 annual report 11
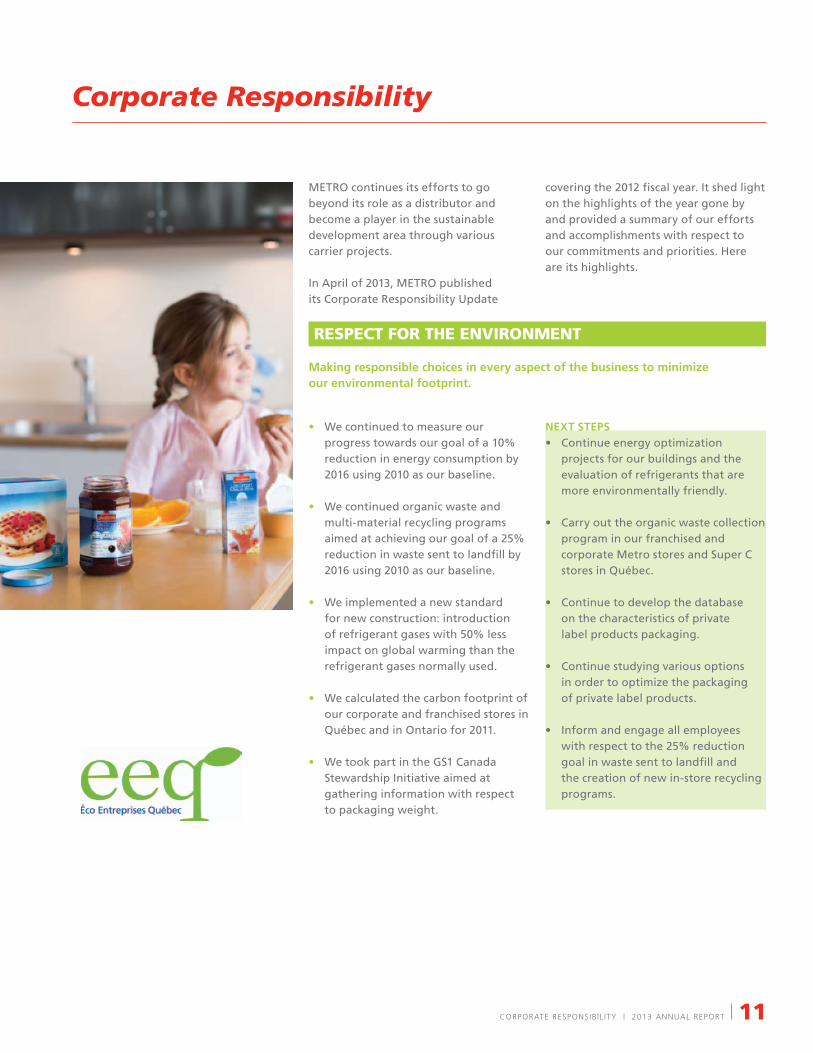
MeTRo continues its efforts to go beyond its role as a distributor and become a player in the sustainable development area through various carrier projects.
In April of 2013, MeTRo published its Corporate Responsibility Update
covering the 2012 fiscal year. It shed light on the highlights of the year gone by and provided a summary of our efforts and accomplishments with respect to our commitments and priorities. Here are its highlights.
Corporate Responsibility
• we continued to measure our progress towards our goal of a 10% reduction in energy consumption by 2016 using 2010 as our baseline.
• we continued organic waste and multi-material recycling programs aimed at achieving our goal of a 25% reduction in waste sent to landfill by 2016 using 2010 as our baseline.
• we implemented a new standard for new construction: introduction of refrigerant gases with 50% less impact on global warming than the refrigerant gases normally used.
• we calculated the carbon footprint of our corporate and franchised stores in Québec and in ontario for 2011.
• we took part in the Gs1 Canada stewardship Initiative aimed at gathering information with respect to packaging weight.
next StepS • Continueenergyoptimization
projects for our buildings and the evaluation of refrigerants that are more environmentally friendly.
• Carryouttheorganicwastecollectionprogram in our franchised and corporate Metro stores and super C stores in Québec.
• Continuetodevelopthedatabase on the characteristics of private label products packaging.
• Continuestudyingvariousoptions in order to optimize the packaging of private label products.
• Informandengageallemployeeswith respect to the 25% reduction goal in waste sent to landfill and the creation of new in-store recycling programs.
RESPECT DE L’ENVIRONNEMENT
Making responsible choices in every aspect of the business to minimize our environmental footprint.
RESPECT fOR ThE ENVIRONMENT
12 2013 annual report | corporate responsibil ity
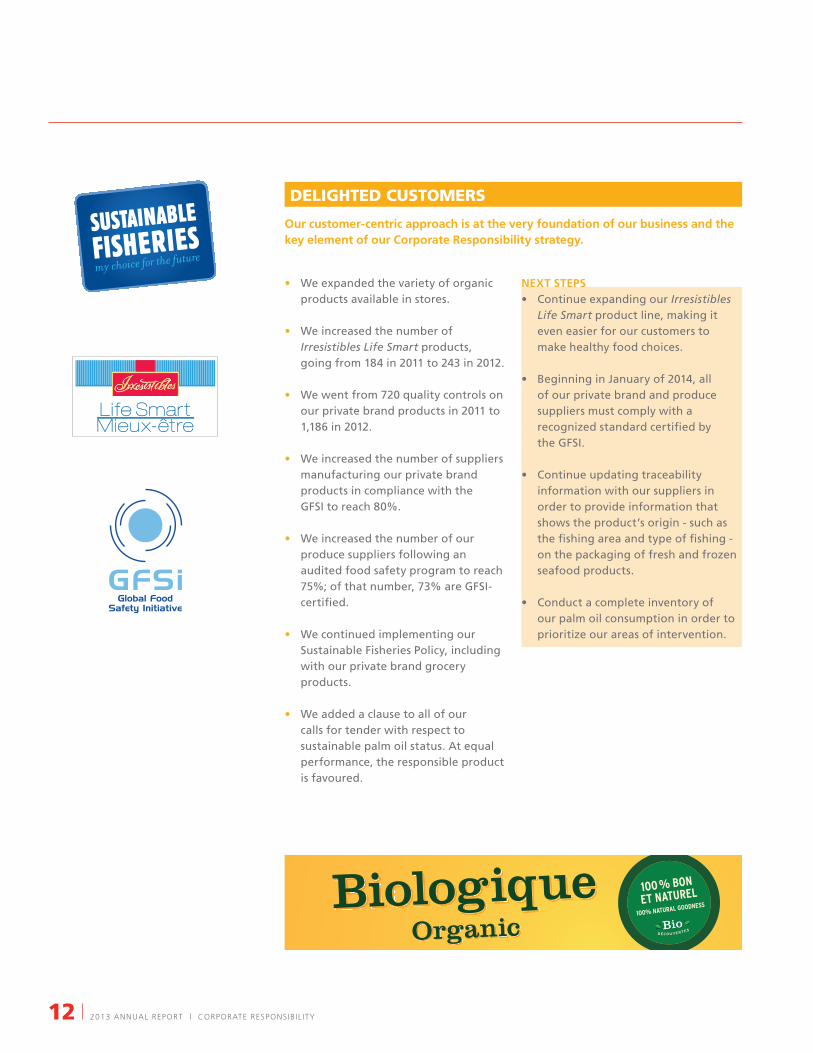
CLIENTèLE COMbLéE
our customer-centric approach is at the very foundation of our business and the key element of our corporate Responsibility strategy.
• we expanded the variety of organic products available in stores.
• we increased the number of Irresistibles Life Smart products, going from 184 in 2011 to 243 in 2012.
• we went from 720 quality controls on our private brand products in 2011 to 1,186 in 2012.
• we increased the number of suppliers manufacturing our private brand products in compliance with the GFsI to reach 80%.
• we increased the number of our produce suppliers following an audited food safety program to reach 75%; of that number, 73% are GFsI-certified.
• we continued implementing our sustainable Fisheries Policy, including with our private brand grocery products.
• we added a clause to all of our calls for tender with respect to sustainable palm oil status. At equal performance, the responsible product is favoured.
next StepS • Continueexpandingour Irresistibles
Life Smart product line, making it even easier for our customers to make healthy food choices.
• BeginninginJanuaryof2014,allof our private brand and produce suppliers must comply with a recognized standard certified by the GFsI.
• Continueupdatingtraceabilityinformation with our suppliers in order to provide information that shows the product’s origin - such as the fishing area and type of fishing - on the packaging of fresh and frozen seafood products.
• Conductacompleteinventoryofour palm oil consumption in order to prioritize our areas of intervention.
DELIghTED CuSTOMERS
100 % BON
ET NATUREL
100% NATURAL GOODNESS

corporate responsibil ity | 2013 annual report 13
COLLECTIVITé VaLORISéE
Making a positive contribution to the communities in which we operate and source our merchandise.
• we made donations in cash and products adding up to $5.4 million in 2012, which is the equivalent of 1.4% of the average net earnings from 2009, 2010 and 2011.
• we created the Metro Green Apple School Program, through which MeTRo awards 1,500 grants of $1,000 each to elementary and high schools in Québec and in ontario for carrying out projects aimed at promoting healthy eating habits for young people.
• we continued our association with Aliments du Québec, including identifying Aliments du Québec and Aliments préparés au Québec products at super C stores using shelf labels bearing the distinctive blue and yellow logo, a first for a discount banner.
• we continued our association with Foodland Ontario, including several Metro stores taking part in the Foodland ontario Retailer Awards.
• we partnered with Équiterre in carrying out a pilot project during which three stores served as drop-off points for baskets of certified organic fresh vegetables prepared by farmers belonging to the Family Farmers’ network.
next StepS • LaunchandimplementMETRO’snew
Community Investment Program, Nourishing for Growth, geared towards food accessibility and promoting healthy eating habits.
• Continueandimproveourassociationwith agri-food industry players from Québec and ontario, through MeTRo’s local Purchasing Policy.
on May 1, 2013, MeTRo announced its local Purchasing Policy, which is intended to maximize the accessibility and promotion of local products. As a result, MeTRo provides direction to structure its actions and those of industry players, and plans to work closely with them. The policy rests on three guiding principles aimed at making MeTRo the following.
• A unique showcase for regional products
• A partner of choice of Aliments du Québec
• The main ally of innovative Québec suppliers
METRO – SCHOOL PROGRAM – TEST – AUGUST 20/2012
CROQUE
PROGRAMME
SANTE
Bien ancrés au Québec, nous sommes fiers de poursuivre
notre engagement envers les produits d’ici.
Notre politique d’achat local vise à optimiser l’accessibilité aux produits d’ici et à les promouvoir
afin de faire de :
chez depuis 65 ans
Une vitrine de choix pour les produits régionaux
Un partenaire privilégié d’Aliments du Québec
Le principal allié des fournisseurs innovants du Québec
Pour plus de détails sur nos politiques d’approvisionnement responsable, visitez
doss
ier :
MEO
-131
06cl
ient
: M
EO-1
3106
date
/mod
if.ré
dact
ion
rele
ctur
eD.
A.ép
reuv
e à
desc
riptio
n : A
nnon
ce jo
urna
lM
ai 223
/05/
13
75%
titre
: « L
e Qu
ébec
on
en m
ange
»sc
/clie
ntin
fogr
aphe
prod
uctio
nco
uleu
r(s)
publ
icat
ion
: La
Pres
se4c
form
at : 1
0,06
25"
x 21
"in
fogr
aphe
: Max
COR
R
3530
, bou
leva
rd S
aint
-Lau
rent
, bur
eau
400,
Mon
tréal
(Qué
bec)
H2X
2V1
t 5
14 8
44-2
624
tc 5
14 8
44-5
041
STRENgThENED COMMuNITIES
14 2013 annual report | corporate responsibil ity
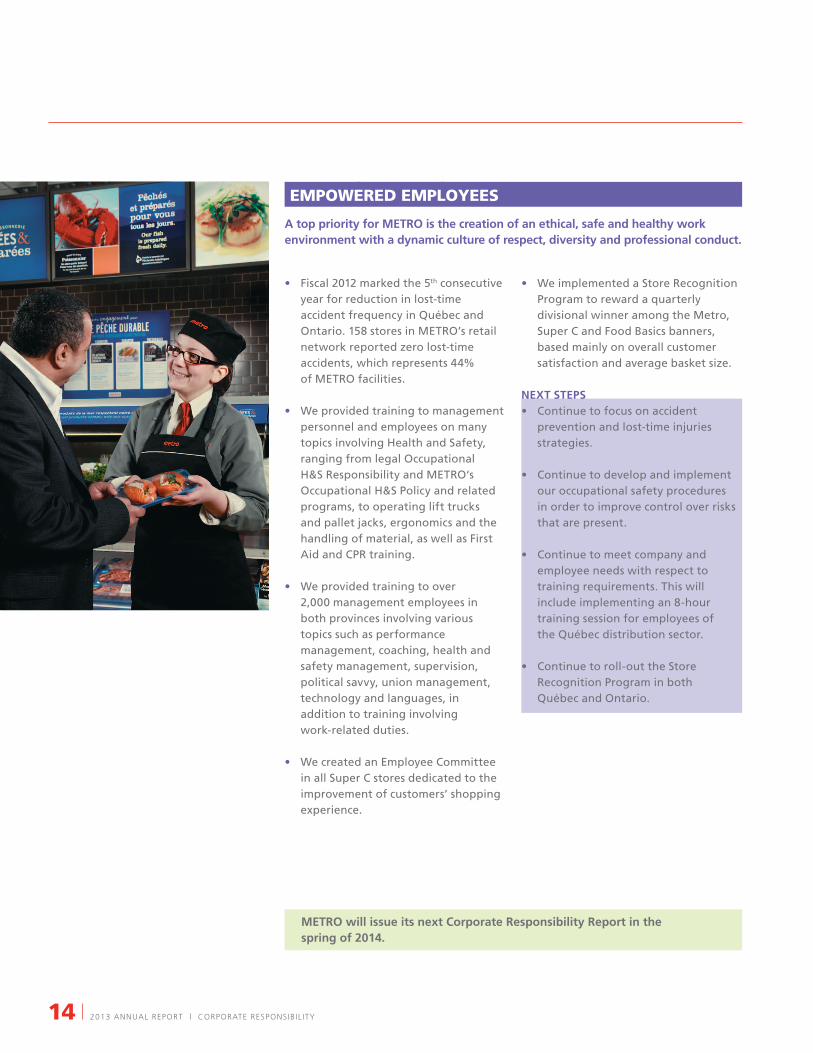
• Fiscal 2012 marked the 5th consecutive year for reduction in lost-time accident frequency in Québec and ontario. 158 stores in MeTRo’s retail network reported zero lost-time accidents, which represents 44% of MeTRo facilities.
• we provided training to management personnel and employees on many topics involving Health and safety, ranging from legal occupational H&s Responsibility and MeTRo‘s occupational H&s Policy and related programs, to operating lift trucks and pallet jacks, ergonomics and the handling of material, as well as First Aid and CPR training.
• we provided training to over 2,000 management employees in both provinces involving various topics such as performance management, coaching, health and safety management, supervision, political savvy, union management, technology and languages, in addition to training involving work-related duties.
• we created an employee Committee in all super C stores dedicated to the improvement of customers’ shopping experience.
• we implemented a store Recognition Program to reward a quarterly divisional winner among the Metro, super C and Food Basics banners, based mainly on overall customer satisfaction and average basket size.
next StepS • Continuetofocusonaccident
prevention and lost-time injuries strategies.
• Continuetodevelopandimplementour occupational safety procedures in order to improve control over risks that are present.
• Continuetomeetcompanyandemployee needs with respect to training requirements. This will include implementing an 8-hour training session for employees of the Québec distribution sector.
• Continuetoroll-outtheStoreRecognition Program in both Québec and ontario.
EMPLOyéS ENgagéS
a top priority for MetRo is the creation of an ethical, safe and healthy work environment with a dynamic culture of respect, diversity and professional conduct.
EMPOwERED EMPLOyEES
MetRo will issue its next corporate Responsibility Report in the spring of 2014.
MD&A and Consolidated Financial StatementsFoR THe yeAR ended sePTeMBeR 28, 2013
- 16 -
TABLE OF CONTENTS
Page
The following Management's Discussion and Analysis sets out the financial position and consolidated results of METRO INC. for the fiscal year ended September 28, 2013, and should be read in conjunction with the annual consolidated financial statements and the accompanying notes as at September 28, 2013. This report is based upon information as at November 29, 2013 unless otherwise indicated. Additional information, including the Annual Information Form and Certification Letters for fiscal 2013, is available on the SEDAR website at www.sedar.com.
Overview ....................................................................................................................................................... 17
Goal, mission and strategies ......................................................................................................................... 17
Key performance indicators ........................................................................................................................... 18
Key achievements in fiscal 2013 ................................................................................................................... 18
Selected annual information .......................................................................................................................... 19
Outlook .......................................................................................................................................................... 20
Operating results ........................................................................................................................................... 21
Quarterly highlights ....................................................................................................................................... 24
Cash position ................................................................................................................................................ 27
Financial position .......................................................................................................................................... 27
Sources of financing ...................................................................................................................................... 30
Contractual obligations .................................................................................................................................. 30
Related party transactions ............................................................................................................................. 30
Fourth quarter ............................................................................................................................................... 31
Derivative financial instruments ..................................................................................................................... 33
New accounting policies ................................................................................................................................ 34
IFRS and Non-IFRS measurements .............................................................................................................. 36
Forward-looking information .......................................................................................................................... 36
Controls and procedures ............................................................................................................................... 36
Significant judgements and estimates ........................................................................................................... 37
Risk management ......................................................................................................................................... 38
Management's responsibility for financial reporting ....................................................................................... 41
Independent auditors' report .......................................................................................................................... 42
Annual consolidated financial statements ...................................................................................................... 43
(1) See section on "IFRS and Non-IFRS Measurements"(2) See section on "Forward-looking Information"
- 17 -
OVERVIEWThe Corporation is a leader in the food and pharmaceutical sectors in Québec and Ontario.
The Corporation, as a retailer and a distributor, operates under different banners in the traditional supermarket and discount segments. For those consumers wanting service, variety, freshness and quality, we operate 358 supermarkets under the Metro and Metro Plus banners. The Adonis banner, which currently has seven stores, is specialized in perishables and Mediterranean and Middle-Eastern products. The 201 discount stores operating under the Super C and Food Basics banners offer products at low prices to consumers who are both cost and quality conscious. The majority of these stores are owned by the Corporation or by special purpose entities and their financial statements are consolidated with those of the Corporation. Independent owners bound to the Corporation by leases or affiliation agreements operate a large number of Metro and Metro Plus stores. Supplying these stores contributes to our sales. The Corporation also acts as a distributor by providing small-surface food stores and convenience stores with banners that reflect their environment and customer base. Their purchases are included in the Corporation sales.
The Corporation also acts as franchisor and distributor for 184 franchised Brunet Plus, Brunet, Brunet Clinique, and Clini Plus drugstores, owned by independent pharmacists. The Corporation also operates 73 drugstores under Pharmacy and Drug Basics banners and their sales are included in the Corporation's. Supplying non-franchised drugstores and various health centres also contributes to our sales.
GOAL, MISSION AND STRATEGIESThe Corporation's goal is to be the best performing food retailer in Canada.
Our mission is to satisfy our customers every day and earn their long-term loyalty.
The four pillars of our business strategy are customer focus, strong execution, best team and shareholder value.
We put the customer at the heart of every decision. In our supermarkets and our discount stores, pricing, promotions, friendly service, and quality products are our priorities.
Strong execution means operating the best stores, a results-driven corporate culture, engaging all employees and monitoring performance so as to react swiftly.
The best team consists of leaders who put the Corporation's interests first. Employee growth and leadership development opportunities and succession planning ensure its continued strength.
The creation of shareholder value includes sustained growth in net earnings per share and significant return on equity. Our investments and acquisitions are relevant and beneficial in the long term.
(1) See section on "IFRS and Non-IFRS Measurements"(2) See section on "Forward-looking Information"
- 18 -
KEY PERFORMANCE INDICATORSWe evaluate the Corporation's overall performance using the following principal indicators:
• sales:Same-store sales growth;dollar value of the average basket (average customer transaction);average weekly sales per square foot;percentage of sales represented by customers who are loyalty program members;market share;customer satisfaction;
• gross margins percentage;• earnings before financial costs, taxes, depreciation and amortization (EBITDA)(1) as a percentage of sales;• net earnings as a percentage of sales;• net earnings per share growth;• return on equity;• retail network investments:
dollar value and nature of store investments;number of stores;average store square footage;network's total square footage.
KEY ACHIEVEMENTS IN FISCAL 2013 Our sales dipped 0.4% in 2013 from those for 2012, excluding the 53rd week. In the last two quarters of 2013, our sales were impacted by fierce competition, especially in Ontario, resulting from an accelerated increase in competitive square footage. Still, we achieved adjusted net earnings from continuing operations(1) and adjusted fully diluted net earnings per share from continuing operations(1) growth of 3.9% and 8.1% respectively compared to 2012, excluding the 53rd week. This growth is due to good margin management, operating cost control, and our share repurchase program. Our teams carried out their business plans and implemented several projects, including the following major ones:
• we invested, along with our retailers, over $270 million in our store network. We opened 9 new stores and carried out major renovations and expansions of 9 stores;
• we began the reorganization of our Ontario store network which includes the conversion of certain Metro supermarkets to Food Basics discount stores, the buyout of some collective agreements, the offer of early exit to some employees, and the closure of a few stores;
• in spring 2013, we opened a new 241,000 square feet produce and dairy distribution centre in Laval. This $50 million investment allows us to be more efficient and improve our product assortment;
• we completely revamped our metro.ca website and developed a new mobile application for iPhone* mobile digital device in order to communicate more easily with our customers and make their grocery shopping experience simpler. These platforms can provide customers help in choosing products based on the week’s promotions and recipe suggestions. The mobile app also allows customers to draw up their grocery list based on the store layout;
• we revised and resized our weekly flyers to better communicate our promotions to consumers. We developed stronger media messages to get the message out on Metro supermarkets’ freshness, variety and service and Super C and Food Basics’ freshness and low prices;
• as part of our Produce Initiative, we continued to install new produce counters and displays, increasing the variety and improving the freshness of our fruits and vegetables;
• working with McGill University and our dietitians, we developed My Healthy Plate with Metro. Smiles on price tags identify the good and great healthy-eating choices, with special emphasis on fruits and vegetables, we offer customers;
• this year, we completed the transition of our 2,500 Selection corporate brand products to a new look. Our 1,500 Irresistibles superior quality products were enriched by healthy products with our Irresistibles LifeSmart, Irresistibles Bio and Irresistibles Gluten-Free;
• we created an innovation team whose objective is to search out distinctive innovative products and develop, through the use of test stores, new merchandising concepts;
(1) See section on "IFRS and Non-IFRS Measurements"(2) See section on "Forward-looking Information"
- 19 -
• we completely revamped our brunet.ca website, and launched, in fall 2013, a new Brunet Facebook** page, creating a meeting place for Brunet-affiliated pharmacist-owners and their patients;
• we entered into a partnership with Target, which will see, in 2014, 18 Brunet banner pharmacies open in the majority of Target stores in Québec;
• to develop and retain our most valuable employees, we have begun developing a mentoring and training program within the framework of a personalized career plan.
* iPhone is a trademark of Apple Inc.** Facebook is a trademark of Facebook Inc.
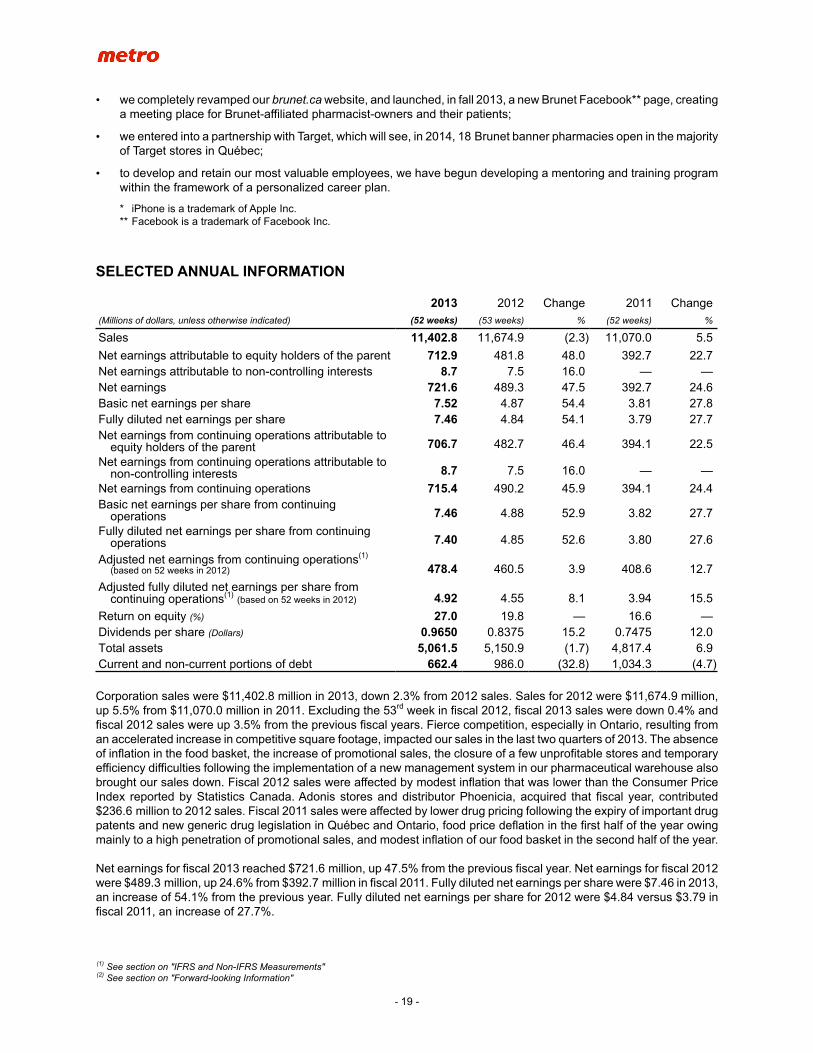
SELECTED ANNUAL INFORMATION
2013 2012 Change 2011 Change(Millions of dollars, unless otherwise indicated) (52 weeks) (53 weeks) % (52 weeks) %
Sales 11,402.8 11,674.9 (2.3) 11,070.0 5.5
Net earnings attributable to equity holders of the parent 712.9 481.8 48.0 392.7 22.7Net earnings attributable to non-controlling interests 8.7 7.5 16.0 — —Net earnings 721.6 489.3 47.5 392.7 24.6Basic net earnings per share 7.52 4.87 54.4 3.81 27.8Fully diluted net earnings per share 7.46 4.84 54.1 3.79 27.7Net earnings from continuing operations attributable to
equity holders of the parent 706.7 482.7 46.4 394.1 22.5
Net earnings from continuing operations attributable tonon-controlling interests 8.7 7.5 16.0 — —
Net earnings from continuing operations 715.4 490.2 45.9 394.1 24.4Basic net earnings per share from continuing
operations 7.46 4.88 52.9 3.82 27.7
Fully diluted net earnings per share from continuingoperations 7.40 4.85 52.6 3.80 27.6
Adjusted net earnings from continuing operations(1) (based on 52 weeks in 2012) 478.4 460.5 3.9 408.6 12.7
Adjusted fully diluted net earnings per share from continuing operations(1) (based on 52 weeks in 2012) 4.92 4.55 8.1 3.94 15.5
Return on equity (%) 27.0 19.8 — 16.6 —Dividends per share (Dollars) 0.9650 0.8375 15.2 0.7475 12.0Total assets 5,061.5 5,150.9 (1.7) 4,817.4 6.9Current and non-current portions of debt 662.4 986.0 (32.8) 1,034.3 (4.7)
Corporation sales were $11,402.8 million in 2013, down 2.3% from 2012 sales. Sales for 2012 were $11,674.9 million, up 5.5% from $11,070.0 million in 2011. Excluding the 53rd week in fiscal 2012, fiscal 2013 sales were down 0.4% and fiscal 2012 sales were up 3.5% from the previous fiscal years. Fierce competition, especially in Ontario, resulting from an accelerated increase in competitive square footage, impacted our sales in the last two quarters of 2013. The absence of inflation in the food basket, the increase of promotional sales, the closure of a few unprofitable stores and temporary efficiency difficulties following the implementation of a new management system in our pharmaceutical warehouse also brought our sales down. Fiscal 2012 sales were affected by modest inflation that was lower than the Consumer Price Index reported by Statistics Canada. Adonis stores and distributor Phoenicia, acquired that fiscal year, contributed $236.6 million to 2012 sales. Fiscal 2011 sales were affected by lower drug pricing following the expiry of important drug patents and new generic drug legislation in Québec and Ontario, food price deflation in the first half of the year owing mainly to a high penetration of promotional sales, and modest inflation of our food basket in the second half of the year.
Net earnings for fiscal 2013 reached $721.6 million, up 47.5% from the previous fiscal year. Net earnings for fiscal 2012 were $489.3 million, up 24.6% from $392.7 million in fiscal 2011. Fully diluted net earnings per share were $7.46 in 2013, an increase of 54.1% from the previous year. Fully diluted net earnings per share for 2012 were $4.84 versus $3.79 in fiscal 2011, an increase of 27.7%.
(1) See section on "IFRS and Non-IFRS Measurements"(2) See section on "Forward-looking Information"
- 20 -
In the first quarter of fiscal 2013, we discontinued our foodservice operation and disposed of the Distagro division which supplied restaurant chains and convenience stores belonging to and operated by gas station chains. In fiscal 2013, we recorded net earnings of $6.2 million due chiefly to the gain on disposal versus net losses of $0.9 million and $1.4 million respectively in fiscal 2012 and fiscal 2011.
Net earnings from continuing operations for fiscal 2013 were $715.4 million, up 45.9% from the previous fiscal year. Net earnings from continuing operations for fiscal 2012 were $490.2 million versus $394.1 million in fiscal 2011, an increase of 24.4%. Fully diluted net earnings per share from continuing operations were $7.40 in fiscal 2013, an increase of 52.6% from the previous year. Fully diluted net earnings per share from continuing operations were $4.85 in fiscal 2012 versus $3.80 in fiscal 2011, an increase of 27.6%.
We recorded non-recurring items for all three fiscal years. In 2013, we sold nearly half of our investment in Alimentation Couche-Tard to three financial institutions for a net post-tax gain of $266.4 million and decided to proceed with a reorganization of our Ontario store network for reorganization costs of $40.0 million before taxes. In 2012, we realized a pre-tax dilution gain of $25.0 million following a share issue by Alimentation Couche-Tard in which we did not participate, and recorded an additional income tax expense of $3.0 million due to the postponement of the tax rate reductions previously announced by the Government of Ontario. Lastly, in 2011, the closure of our meat processing plant in Montréal and a grocery warehouse in Toronto resulted in costs of $20.5 million before taxes.
Excluding these non-recurring items, as well as the 53rd week in fiscal 2012, adjusted net earnings from continuing operations(1) for 2013 were $478.4 million, up 3.9% from the previous fiscal year. Adjusted net earnings from continuing operations(1) for 2012 were $460.5 million compared to $408.6 million in 2011, an increase of 12.7%. Adjusted fully diluted net earnings per share from continuing operations(1) for 2013 were $4.92, up 8.1% from the previous fiscal year. Adjusted fully diluted net earnings per share from continuing operations(1) for 2012 were $4.55, up 15.5% from $3.94 in 2011. We achieved growth in 2013 versus 2012 due to good margin management, operating cost control, and our share repurchase program. The growth from 2011 to 2012 was achieved due to our teams’ excellent execution, effective cost control, and sustained investment in our store network.
Return on equity totalled 27.0% in 2013, 19.8% in 2012 and 16.6% in 2011. Dividends per share were $0.9650 in 2013, $0.8375 in 2012 and $0.7475 in 2011 representing $91.5 million, $82.9 million and $77.1 million respectively, or 18.7%, 21.1% and 19.7% of the previous fiscal years’ net earnings from continuing operations. Total assets were $5,061.5 million in 2013, $5,150.9 million in 2012 and $4,817.4 million in 2011. Non-current debt, including the current portion, was $662.4 million in 2013, $986.0 million in 2012 and $1,034.3 million in 2011.
OUTLOOKWhile we expect competitive activity will remain fierce in 2014, we are confident that our reorganization of our Ontario store network and our investments, along with our retailers, of nearly $250 million in our retail network, coupled with effective merchandising strategies, will allow(2) us to continue to grow in the next fiscal year.
(1) See section on "IFRS and Non-IFRS Measurements"(2) See section on "Forward-looking Information"
- 21 -
OPERATING RESULTSSALES
Sales for fiscal 2013 reached $11,402.8 million versus $11,674.9 million for fiscal 2012. Excluding the 53rd week of fiscal 2012, our 2013 sales were down 0.4% compared to fiscal 2012. Fierce competition, especially in Ontario, impacted sales in our last two quarters due to an accelerated increase in competitive square footage. The absence of food inflation in the food basket, the increase of promotional sales, the closure of underperforming stores, and temporary efficiency difficulties following the implementation of a new management system in our pharmaceutical warehouse caused our sales to dip as well.
EARNINGS BEFORE FINANCIAL COSTS, TAXES, DEPRECIATION AND AMORTIZATION(1)
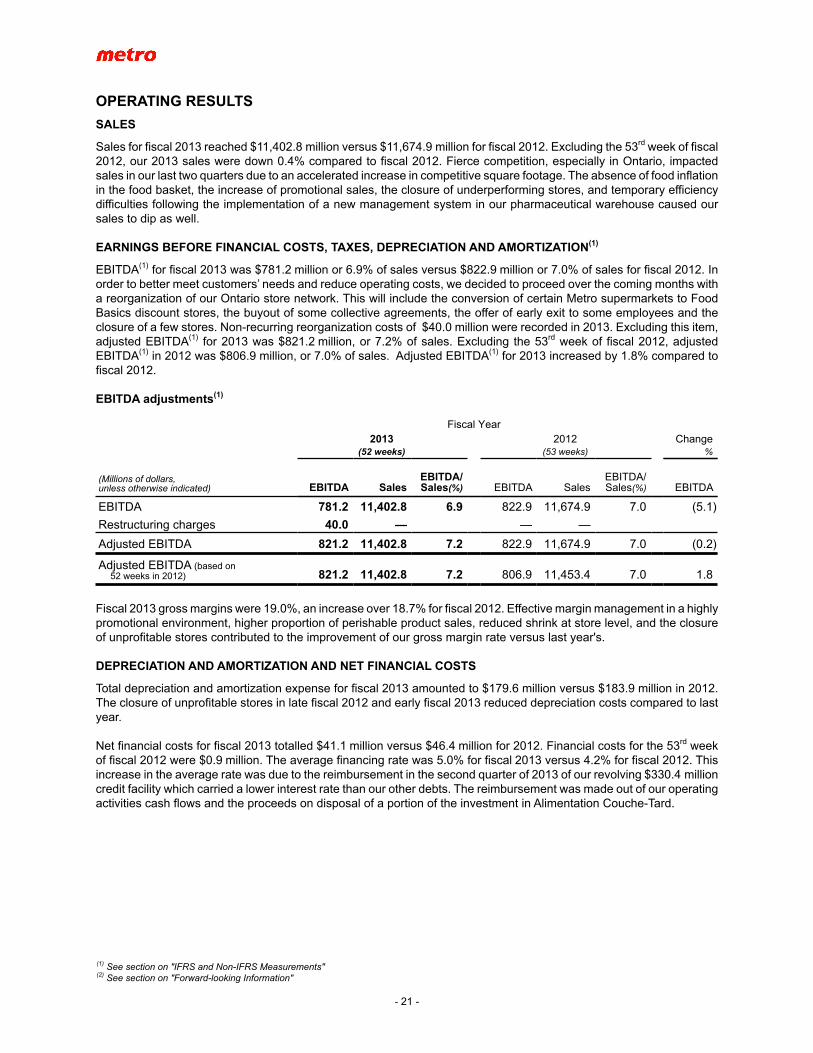
EBITDA(1) for fiscal 2013 was $781.2 million or 6.9% of sales versus $822.9 million or 7.0% of sales for fiscal 2012. In order to better meet customers’ needs and reduce operating costs, we decided to proceed over the coming months with a reorganization of our Ontario store network. This will include the conversion of certain Metro supermarkets to Food Basics discount stores, the buyout of some collective agreements, the offer of early exit to some employees and the closure of a few stores. Non-recurring reorganization costs of $40.0 million were recorded in 2013. Excluding this item, adjusted EBITDA(1) for 2013 was $821.2 million, or 7.2% of sales. Excluding the 53rd week of fiscal 2012, adjusted EBITDA(1) in 2012 was $806.9 million, or 7.0% of sales. Adjusted EBITDA(1) for 2013 increased by 1.8% compared to fiscal 2012.
EBITDA adjustments(1)
Fiscal Year2013 2012 Change
(52 weeks) (53 weeks) %
(Millions of dollars,unless otherwise indicated) EBITDA Sales
EBITDA/Sales(%) EBITDA Sales
EBITDA/Sales(%) EBITDA
EBITDA 781.2 11,402.8 6.9 822.9 11,674.9 7.0 (5.1)
Restructuring charges 40.0 — — —
Adjusted EBITDA 821.2 11,402.8 7.2 822.9 11,674.9 7.0 (0.2)
Adjusted EBITDA (based on 52 weeks in 2012) 821.2 11,402.8 7.2 806.9 11,453.4 7.0 1.8
Fiscal 2013 gross margins were 19.0%, an increase over 18.7% for fiscal 2012. Effective margin management in a highly promotional environment, higher proportion of perishable product sales, reduced shrink at store level, and the closure of unprofitable stores contributed to the improvement of our gross margin rate versus last year's.
DEPRECIATION AND AMORTIZATION AND NET FINANCIAL COSTS
Total depreciation and amortization expense for fiscal 2013 amounted to $179.6 million versus $183.9 million in 2012. The closure of unprofitable stores in late fiscal 2012 and early fiscal 2013 reduced depreciation costs compared to last year.
Net financial costs for fiscal 2013 totalled $41.1 million versus $46.4 million for 2012. Financial costs for the 53rd week of fiscal 2012 were $0.9 million. The average financing rate was 5.0% for fiscal 2013 versus 4.2% for fiscal 2012. This increase in the average rate was due to the reimbursement in the second quarter of 2013 of our revolving $330.4 million credit facility which carried a lower interest rate than our other debts. The reimbursement was made out of our operating activities cash flows and the proceeds on disposal of a portion of the investment in Alimentation Couche-Tard.
(1) See section on "IFRS and Non-IFRS Measurements"(2) See section on "Forward-looking Information"
- 22 -
SHARE OF AN ASSOCIATE'S EARNINGS
Our share of earnings in Alimentation Couche-Tard was $50.8 million for fiscal 2013 versus $47.6 million for fiscal 2012.
NON-RECURRING GAINS FROM AN INVESTMENT IN AN ASSOCIATE
In the second quarter of 2013, we sold nearly half of our investment in Alimentation Couche-Tard to three financial institutions for cash consideration of $479.0 million, and a pre-tax gain of $307.8 million and a post-tax gain of $266.4 million. We decided, because of the significant value of the investment compared to the Corporation's total value, that it was an appropriate time to realize part of the gain we had accrued over all those years.
In the fourth quarter of 2012, Alimentation Couche-Tard issued 7.3 million shares for net proceeds of approximately $330 million to finance part of its acquisition of Statoil Fuel & Retail ASA. As we did not participate in this share issue, our interest in Couche-Tard decreased from 11.6% to 11.1%. This dilution and our share in Couche-Tard's increased value as a result of the share issue amount to a deemed disposition and deemed proceeds of disposition of part of our investment for a net pre-tax gain of $25.0 million and $21.7 million post-tax.
INCOME TAXES
The fiscal 2013 income tax expense of $203.7 million represented an effective tax rate of 22.2%. The fiscal 2012 income tax expense of $175.0 million represented an effective tax rate of 26.3%.
Excluding the $307.8 million gain on disposal of part of our investment in Alimentation Couche-Tard and related income tax of $41.4 million, the effective tax rate for fiscal 2013 was 26.5%. Excluding the non-recurring income tax expense of $3.0 million recorded in 2012, the effective tax rate for fiscal 2012 was 25.9%.
The income tax expense for the 53rd week of fiscal 2012 was $4.1 million.
NET EARNINGS
Net earnings for fiscal 2013 reached $721.6 million, up 47.5% from $489.3 million for fiscal 2012. Fully diluted net earnings per share were $7.46 compared to $4.84 last year, an increase of 54.1%.
NET EARNINGS (LOSS) FROM DISCONTINUED OPERATION
In the first quarter of 2013, we discontinued our foodservice operation and disposed of the Distagro division which supplied restaurant chains and convenience stores belonging to and operated by gas station chains. The division's sales and expenses are presented under the item “Discontinued operation” for 2012 and 2013.
In fiscal 2013, we recorded net earnings of $6.2 million due chiefly to the gain on disposal versus a net loss of $0.9 million for fiscal 2012.
NET EARNINGS FROM CONTINUING OPERATIONS
Net earnings from continuing operations were $715.4 million for fiscal 2013 versus $490.2 million last year, an increase of 45.9%. Fully diluted net earnings per share from continuing operations were $7.40 for fiscal 2013 versus $4.85 last year, an increase of 52.6%.
(1) See section on "IFRS and Non-IFRS Measurements"(2) See section on "Forward-looking Information"
- 23 -
ADJUSTED NET EARNINGS FROM CONTINUING OPERATIONS(1)
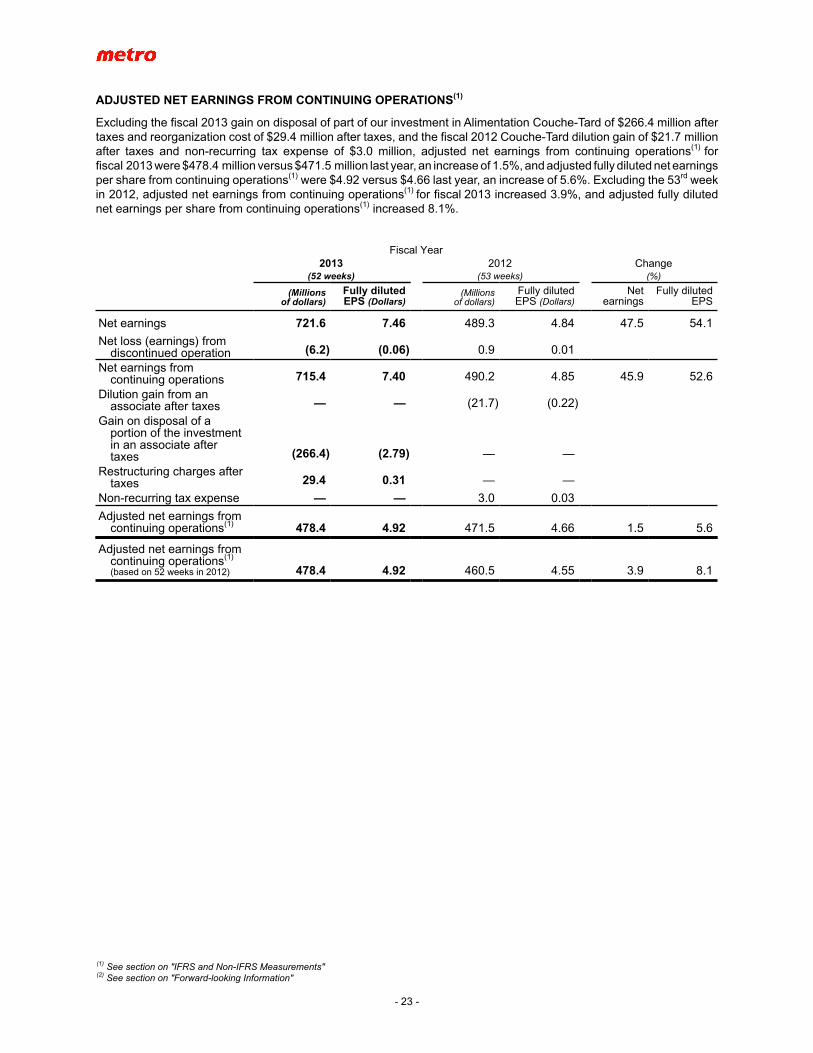
Excluding the fiscal 2013 gain on disposal of part of our investment in Alimentation Couche-Tard of $266.4 million after taxes and reorganization cost of $29.4 million after taxes, and the fiscal 2012 Couche-Tard dilution gain of $21.7 million after taxes and non-recurring tax expense of $3.0 million, adjusted net earnings from continuing operations(1) for fiscal 2013 were $478.4 million versus $471.5 million last year, an increase of 1.5%, and adjusted fully diluted net earnings per share from continuing operations(1) were $4.92 versus $4.66 last year, an increase of 5.6%. Excluding the 53rd week in 2012, adjusted net earnings from continuing operations(1) for fiscal 2013 increased 3.9%, and adjusted fully diluted net earnings per share from continuing operations(1) increased 8.1%.
Fiscal Year2013 2012 Change
(52 weeks) (53 weeks) (%)
(Millionsof dollars)
Fully diluted EPS (Dollars)
(Millionsof dollars)
Fully diluted EPS (Dollars)
Netearnings
Fully dilutedEPS
Net earnings 721.6 7.46 489.3 4.84 47.5 54.1
Net loss (earnings) fromdiscontinued operation (6.2) (0.06) 0.9 0.01
Net earnings fromcontinuing operations 715.4 7.40 490.2 4.85 45.9 52.6
Dilution gain from anassociate after taxes — — (21.7) (0.22)
Gain on disposal of aportion of the investmentin an associate aftertaxes (266.4) (2.79) — —
Restructuring charges aftertaxes 29.4 0.31 — —
Non-recurring tax expense — — 3.0 0.03
Adjusted net earnings from continuing operations(1) 478.4 4.92 471.5 4.66 1.5 5.6
Adjusted net earnings from continuing operations(1) (based on 52 weeks in 2012) 478.4 4.92 460.5 4.55 3.9 8.1
(1) See section on "IFRS and Non-IFRS Measurements"(2) See section on "Forward-looking Information"
- 24 -
QUARTERLY HIGHLIGHTS
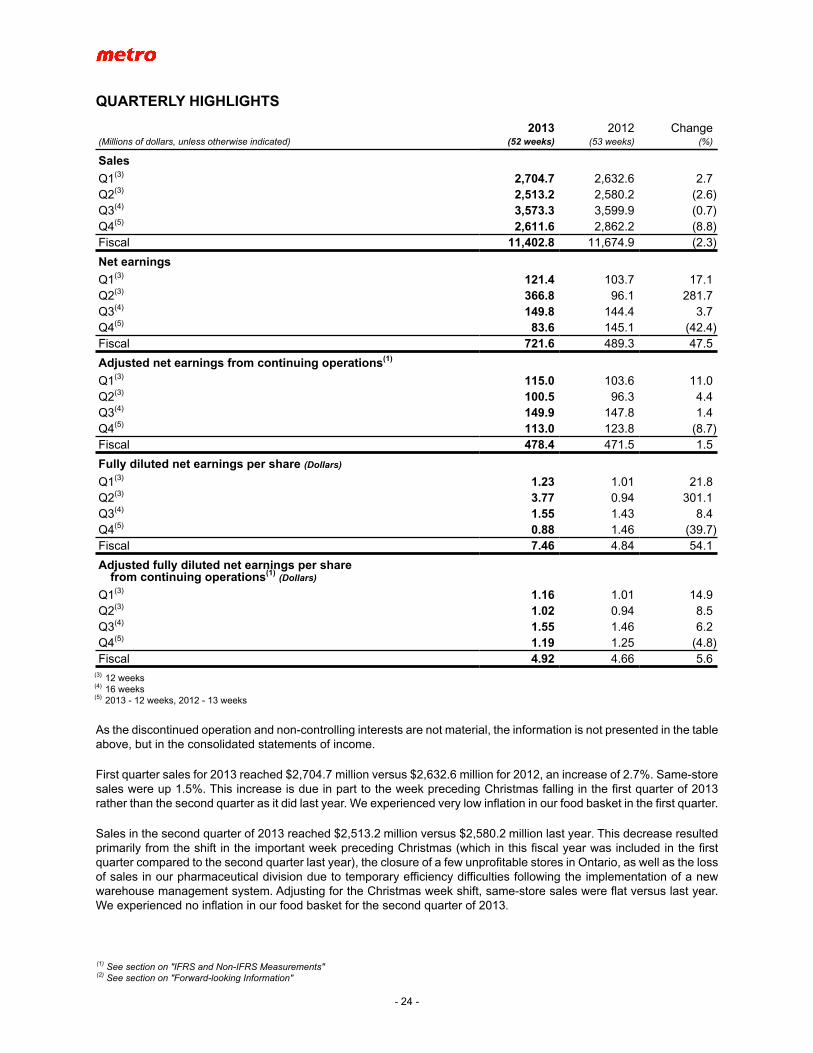
2013 2012 Change(Millions of dollars, unless otherwise indicated) (52 weeks) (53 weeks) (%)
SalesQ1(3) 2,704.7 2,632.6 2.7Q2(3) 2,513.2 2,580.2 (2.6)Q3(4) 3,573.3 3,599.9 (0.7)Q4(5) 2,611.6 2,862.2 (8.8)Fiscal 11,402.8 11,674.9 (2.3)
Net earningsQ1(3) 121.4 103.7 17.1Q2(3) 366.8 96.1 281.7Q3(4) 149.8 144.4 3.7Q4(5) 83.6 145.1 (42.4)Fiscal 721.6 489.3 47.5
Adjusted net earnings from continuing operations(1)
Q1(3) 115.0 103.6 11.0Q2(3) 100.5 96.3 4.4Q3(4) 149.9 147.8 1.4Q4(5) 113.0 123.8 (8.7)Fiscal 478.4 471.5 1.5
Fully diluted net earnings per share (Dollars)
Q1(3) 1.23 1.01 21.8Q2(3) 3.77 0.94 301.1Q3(4) 1.55 1.43 8.4Q4(5) 0.88 1.46 (39.7)Fiscal 7.46 4.84 54.1
Adjusted fully diluted net earnings per share from continuing operations(1) (Dollars)
Q1(3) 1.16 1.01 14.9Q2(3) 1.02 0.94 8.5Q3(4) 1.55 1.46 6.2Q4(5) 1.19 1.25 (4.8)Fiscal 4.92 4.66 5.6
(3) 12 weeks(4) 16 weeks(5) 2013 - 12 weeks, 2012 - 13 weeks
As the discontinued operation and non-controlling interests are not material, the information is not presented in the table above, but in the consolidated statements of income.
First quarter sales for 2013 reached $2,704.7 million versus $2,632.6 million for 2012, an increase of 2.7%. Same-store sales were up 1.5%. This increase is due in part to the week preceding Christmas falling in the first quarter of 2013 rather than the second quarter as it did last year. We experienced very low inflation in our food basket in the first quarter.
Sales in the second quarter of 2013 reached $2,513.2 million versus $2,580.2 million last year. This decrease resulted primarily from the shift in the important week preceding Christmas (which in this fiscal year was included in the first quarter compared to the second quarter last year), the closure of a few unprofitable stores in Ontario, as well as the loss of sales in our pharmaceutical division due to temporary efficiency difficulties following the implementation of a new warehouse management system. Adjusting for the Christmas week shift, same-store sales were flat versus last year. We experienced no inflation in our food basket for the second quarter of 2013.
(1) See section on "IFRS and Non-IFRS Measurements"(2) See section on "Forward-looking Information"
- 25 -
Sales in the third quarter of 2013 reached $3,573.3 million versus $3,599.9 million last year, down 0.7%. Excluding the one-day shift of a holiday versus last year and the closure of some unprofitable stores, our 2013 third quarter sales remained stable compared to 2012. During the last quarters, a very low inflation of our food basket and increased competition affected our sales. Same-store sales decreased 0.9%.
Sales in the fourth quarter of 2013 reached $2,611.6 million versus $2,862.2 million last year, down 8.8%. Excluding the 13th week of the 2012 fourth quarter, our 2013 fourth quarter sales were down 1.1% compared to 2012. Increased competition and higher promotional sales caused minor deflation in our aggregate food basket. Same-store sales decreased 1.8%.
Net earnings for the first quarter of fiscal 2013 were $121.4 million, an increase of 17.1% over net earnings of $103.7 million for the same quarter of 2012. Fully diluted net earnings per share rose 21.8% to $1.23 from $1.01 last year. In the first quarter of 2013, we discontinued our foodservice operation and disposed of the Distagro division which supplied restaurant chains and convenience stores belonging to and operated by gas station chains. Excluding net earnings from discontinued operation, net earnings from continuing operations were $115.0 million and fully diluted net earnings per share from continuing operations were $1.16 in 2013, up 11.0% and 14.9% respectively from $103.6 million and $1.01 in 2012.
Net earnings for the second quarter of fiscal 2013 were $366.8 million compared to $96.1 million for the same quarter of 2012, an increase of 281.7%. Fully diluted net earnings per share rose 301.1% to $3.77 from $0.94 in 2012. Excluding the net loss from the discontinued operation of $0.1 million in the second quarter of 2013 versus $0.2 million in 2012, net earnings from continuing operations for the second quarter of 2013 were $366.9 million, an increase of 281.0% over $96.3 million for the same quarter last year. Fully diluted net earnings per share from continuing operations were $3.77 for the second quarter of 2013 compared to $0.94 last year, an increase of 301.1%. Excluding the after-tax gain on disposal of part of our investment in Alimentation Couche-Tard, 2013 second quarter adjusted net earnings from continuing operations(1) were $100.5 million, up 4.4% from $96.3 million last year, and adjusted fully diluted net earnings per share from continuing operations(1) were $1.02, up 8.5% from $0.94 last year.
Net earnings for the third quarter of 2013 were $149.8 million, up 3.7% from $144.4 million for the corresponding quarter of 2012. Fully diluted net earnings per share were $1.55, up 8.4% from $1.43 last year. Excluding the net loss from the discontinued operation of $0.1 million for the third quarter of 2013 versus $0.4 million for the same quarter of 2012 and excluding also the non-recurring tax expense of $3.0 million of 2012, adjusted net earnings from continuing operations
(1) were $149.9 million in the third quarter of 2013, up 1.4% from $147.8 million last year, and adjusted fully diluted net earnings per share from continuing operations(1) were $1.55, up 6.2% from $1.46 last year.
Net earnings for the fourth quarter of 2013 were $83.6 million, a decrease of 42.4% over net earnings of $145.1 million for the same quarter of 2012. Fully diluted net earnings per share were down 39.7% to $0.88 from $1.46 last year.
Excluding the 2013 fourth quarter $29.4 million post-tax reorganization cost, and excluding the 2012 fourth quarter Couche-Tard dilution gain of $21.7 million after taxes, adjusted net earnings from continuing operations(1) for the fourth quarter of 2013 were $113.0 million, down 8.7% from $123.8 million for the same quarter last year, and adjusted fully diluted net earnings per share from continuing operations(1) were $1.19, down 4.8% from $1.25 last year.
Excluding the 13th week in the fourth quarter of 2012, adjusted net earnings from continuing operations(1) for the fourth quarter of 2013 were up 0.2% and adjusted fully diluted net earnings per share from continuing operations(1) were up 4.4%.
(1) See section on "IFRS and Non-IFRS Measurements"(2) See section on "Forward-looking Information"
- 26 -
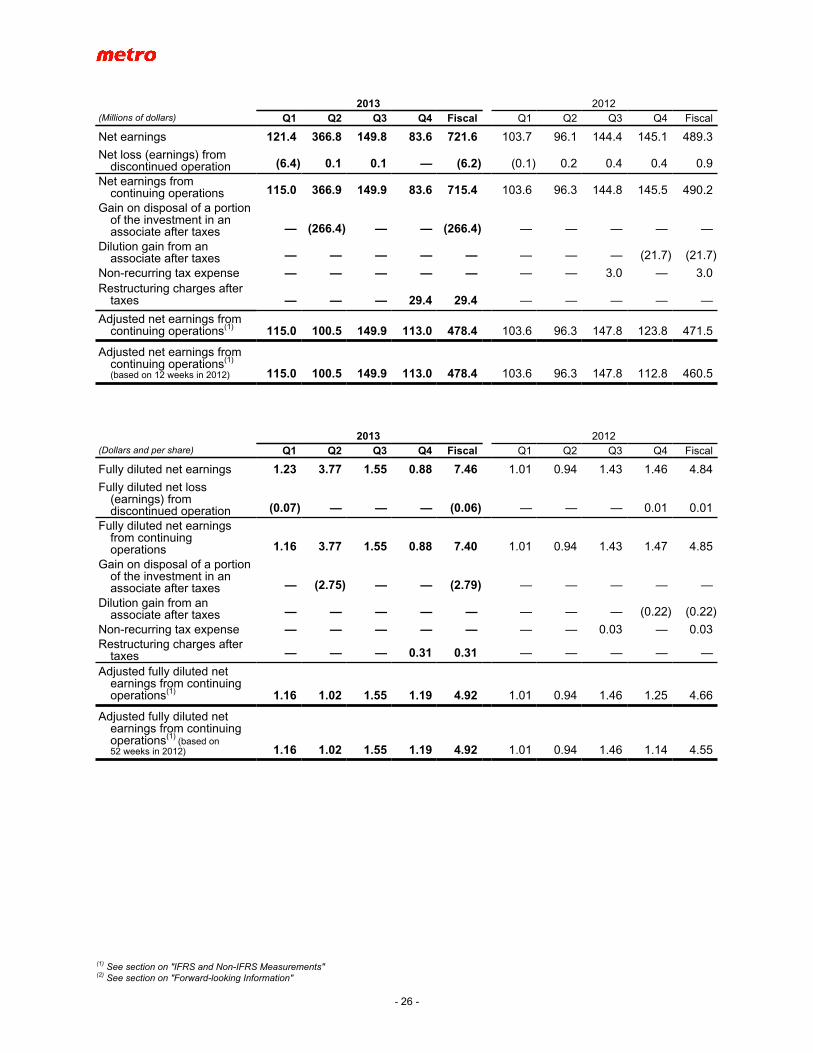
2013 2012(Millions of dollars) Q1 Q2 Q3 Q4 Fiscal Q1 Q2 Q3 Q4 Fiscal
Net earnings 121.4 366.8 149.8 83.6 721.6 103.7 96.1 144.4 145.1 489.3
Net loss (earnings) fromdiscontinued operation (6.4) 0.1 0.1 — (6.2) (0.1) 0.2 0.4 0.4 0.9
Net earnings fromcontinuing operations 115.0 366.9 149.9 83.6 715.4 103.6 96.3 144.8 145.5 490.2
Gain on disposal of a portionof the investment in anassociate after taxes — (266.4) — — (266.4) — — — — —
Dilution gain from anassociate after taxes — — — — — — — — (21.7) (21.7)
Non-recurring tax expense — — — — — — — 3.0 — 3.0Restructuring charges after
taxes — — — 29.4 29.4 — — — — —
Adjusted net earnings from continuing operations(1) 115.0 100.5 149.9 113.0 478.4 103.6 96.3 147.8 123.8 471.5
Adjusted net earnings from continuing operations(1) (based on 12 weeks in 2012) 115.0 100.5 149.9 113.0 478.4 103.6 96.3 147.8 112.8 460.5
2013 2012(Dollars and per share) Q1 Q2 Q3 Q4 Fiscal Q1 Q2 Q3 Q4 Fiscal
Fully diluted net earnings 1.23 3.77 1.55 0.88 7.46 1.01 0.94 1.43 1.46 4.84
Fully diluted net loss(earnings) fromdiscontinued operation (0.07) — — — (0.06) — — — 0.01 0.01
Fully diluted net earningsfrom continuingoperations 1.16 3.77 1.55 0.88 7.40 1.01 0.94 1.43 1.47 4.85
Gain on disposal of a portionof the investment in anassociate after taxes — (2.75) — — (2.79) — — — — —
Dilution gain from anassociate after taxes — — — — — — — — (0.22) (0.22)
Non-recurring tax expense — — — — — — — 0.03 — 0.03Restructuring charges after
taxes — — — 0.31 0.31 — — — — —
Adjusted fully diluted net earnings from continuing operations(1) 1.16 1.02 1.55 1.19 4.92 1.01 0.94 1.46 1.25 4.66
Adjusted fully diluted net earnings from continuing operations(1)
(based on 52 weeks in 2012) 1.16 1.02 1.55 1.19 4.92 1.01 0.94 1.46 1.14 4.55
(1) See section on "IFRS and Non-IFRS Measurements"(2) See section on "Forward-looking Information"
- 27 -
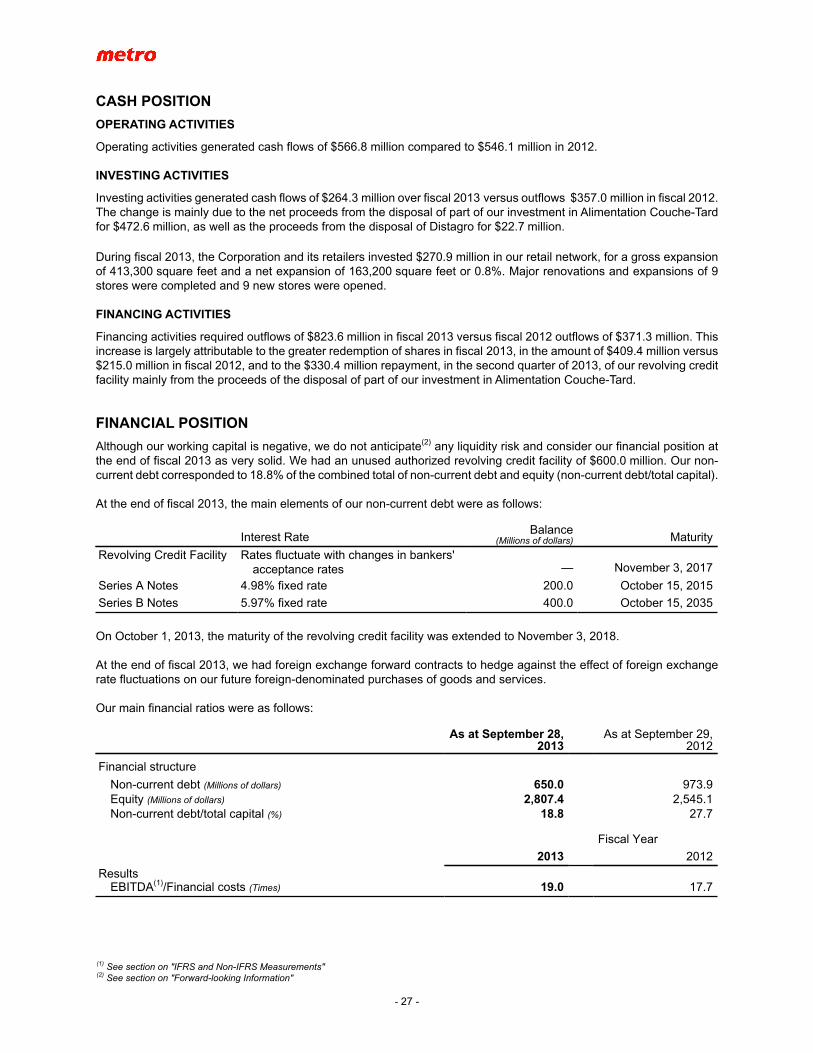
CASH POSITIONOPERATING ACTIVITIES
Operating activities generated cash flows of $566.8 million compared to $546.1 million in 2012.
INVESTING ACTIVITIES
Investing activities generated cash flows of $264.3 million over fiscal 2013 versus outflows $357.0 million in fiscal 2012. The change is mainly due to the net proceeds from the disposal of part of our investment in Alimentation Couche-Tard for $472.6 million, as well as the proceeds from the disposal of Distagro for $22.7 million.
During fiscal 2013, the Corporation and its retailers invested $270.9 million in our retail network, for a gross expansion of 413,300 square feet and a net expansion of 163,200 square feet or 0.8%. Major renovations and expansions of 9 stores were completed and 9 new stores were opened.
FINANCING ACTIVITIES
Financing activities required outflows of $823.6 million in fiscal 2013 versus fiscal 2012 outflows of $371.3 million. This increase is largely attributable to the greater redemption of shares in fiscal 2013, in the amount of $409.4 million versus $215.0 million in fiscal 2012, and to the $330.4 million repayment, in the second quarter of 2013, of our revolving credit facility mainly from the proceeds of the disposal of part of our investment in Alimentation Couche-Tard.
FINANCIAL POSITIONAlthough our working capital is negative, we do not anticipate(2) any liquidity risk and consider our financial position at the end of fiscal 2013 as very solid. We had an unused authorized revolving credit facility of $600.0 million. Our non-current debt corresponded to 18.8% of the combined total of non-current debt and equity (non-current debt/total capital).
At the end of fiscal 2013, the main elements of our non-current debt were as follows:
Interest RateBalance
(Millions of dollars) Maturity
Revolving Credit Facility Rates fluctuate with changes in bankers'acceptance rates — November 3, 2017
Series A Notes 4.98% fixed rate 200.0 October 15, 2015
Series B Notes 5.97% fixed rate 400.0 October 15, 2035
On October 1, 2013, the maturity of the revolving credit facility was extended to November 3, 2018.
At the end of fiscal 2013, we had foreign exchange forward contracts to hedge against the effect of foreign exchange rate fluctuations on our future foreign-denominated purchases of goods and services.
Our main financial ratios were as follows:
As at September 28,2013
As at September 29,2012
Financial structure
Non-current debt (Millions of dollars) 650.0 973.9Equity (Millions of dollars) 2,807.4 2,545.1Non-current debt/total capital (%) 18.8 27.7
Fiscal Year
2013 2012
ResultsEBITDA(1)/Financial costs (Times) 19.0 17.7
(1) See section on "IFRS and Non-IFRS Measurements"(2) See section on "Forward-looking Information"
- 28 -
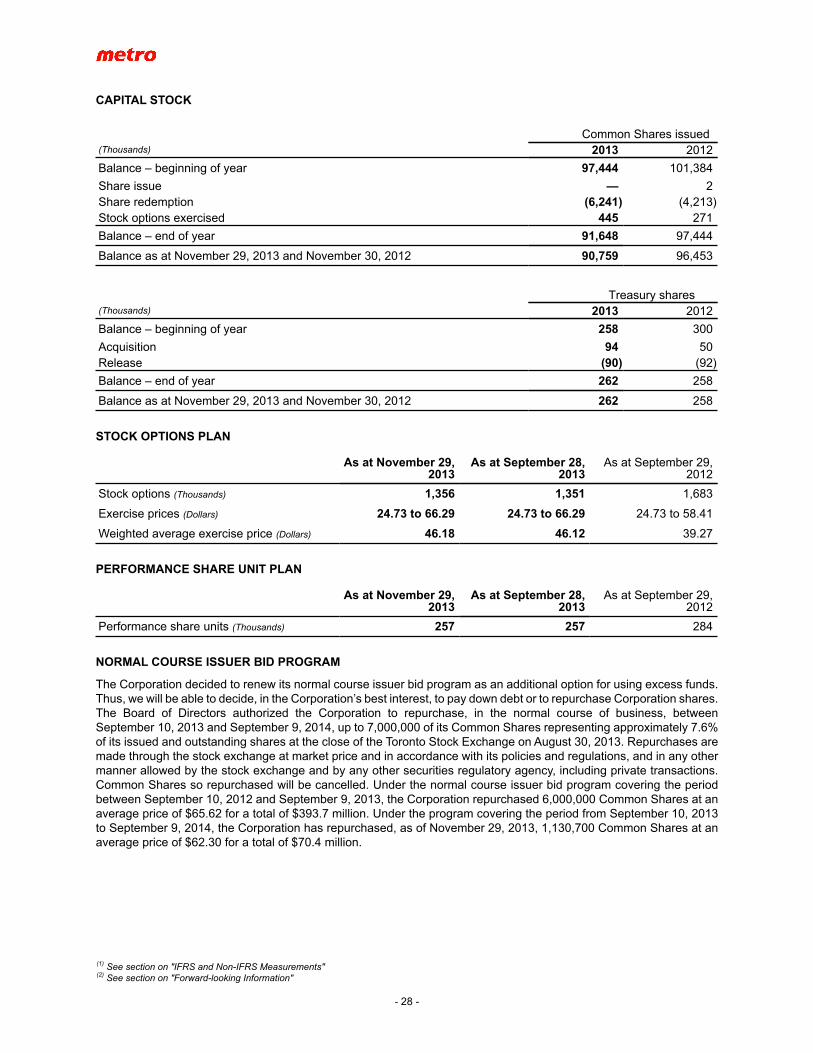
CAPITAL STOCK
Common Shares issued(Thousands) 2013 2012
Balance – beginning of year 97,444 101,384
Share issue — 2Share redemption (6,241) (4,213)Stock options exercised 445 271
Balance – end of year 91,648 97,444
Balance as at November 29, 2013 and November 30, 2012 90,759 96,453
Treasury shares(Thousands) 2013 2012
Balance – beginning of year 258 300
Acquisition 94 50Release (90) (92)
Balance – end of year 262 258
Balance as at November 29, 2013 and November 30, 2012 262 258
STOCK OPTIONS PLAN
As at November 29,2013
As at September 28,2013
As at September 29,2012
Stock options (Thousands) 1,356 1,351 1,683
Exercise prices (Dollars) 24.73 to 66.29 24.73 to 66.29 24.73 to 58.41
Weighted average exercise price (Dollars) 46.18 46.12 39.27
PERFORMANCE SHARE UNIT PLAN
As at November 29,2013
As at September 28,2013
As at September 29,2012
Performance share units (Thousands) 257 257 284
NORMAL COURSE ISSUER BID PROGRAM
The Corporation decided to renew its normal course issuer bid program as an additional option for using excess funds. Thus, we will be able to decide, in the Corporation’s best interest, to pay down debt or to repurchase Corporation shares. The Board of Directors authorized the Corporation to repurchase, in the normal course of business, between September 10, 2013 and September 9, 2014, up to 7,000,000 of its Common Shares representing approximately 7.6% of its issued and outstanding shares at the close of the Toronto Stock Exchange on August 30, 2013. Repurchases are made through the stock exchange at market price and in accordance with its policies and regulations, and in any other manner allowed by the stock exchange and by any other securities regulatory agency, including private transactions. Common Shares so repurchased will be cancelled. Under the normal course issuer bid program covering the period between September 10, 2012 and September 9, 2013, the Corporation repurchased 6,000,000 Common Shares at an average price of $65.62 for a total of $393.7 million. Under the program covering the period from September 10, 2013 to September 9, 2014, the Corporation has repurchased, as of November 29, 2013, 1,130,700 Common Shares at an average price of $62.30 for a total of $70.4 million.
(1) See section on "IFRS and Non-IFRS Measurements"(2) See section on "Forward-looking Information"
- 29 -
DIVIDEND POLICY
The Corporation's dividend policy is to pay an annual dividend representing approximately 20% of net earnings of the preceding fiscal year before extraordinary items. For the nineteenth consecutive year, the Corporation paid quarterly dividends to its shareholders. The annual dividend increased by 15.2%, to $0.9650 per share compared to $0.8375 in 2012, for total dividends of $91.5 million in 2013 compared to $82.9 million in 2012. Dividends paid in 2013 represented 18.7% of net earnings of the preceding fiscal year compared to 21.1% in 2012.
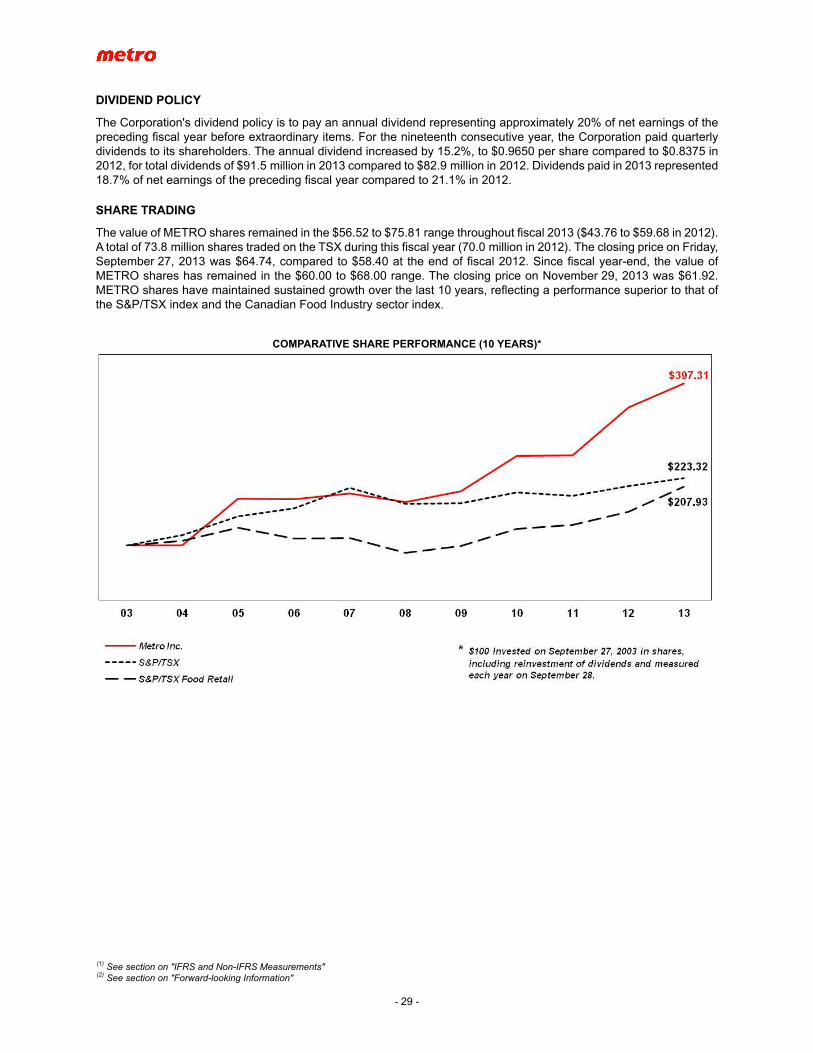
SHARE TRADING
The value of METRO shares remained in the $56.52 to $75.81 range throughout fiscal 2013 ($43.76 to $59.68 in 2012). A total of 73.8 million shares traded on the TSX during this fiscal year (70.0 million in 2012). The closing price on Friday, September 27, 2013 was $64.74, compared to $58.40 at the end of fiscal 2012. Since fiscal year-end, the value of METRO shares has remained in the $60.00 to $68.00 range. The closing price on November 29, 2013 was $61.92. METRO shares have maintained sustained growth over the last 10 years, reflecting a performance superior to that of the S&P/TSX index and the Canadian Food Industry sector index.
COMPARATIVE SHARE PERFORMANCE (10 YEARS)*
(1) See section on "IFRS and Non-IFRS Measurements"(2) See section on "Forward-looking Information"
- 30 -
SOURCES OF FINANCINGOur operating activities as well as the disposal of a portion of our investment in Alimentation Couche-Tard generated respectively cash flows in the amount of $566.8 million and $472.6 million in 2013. These major cash flows were sufficient to finance our investing activities, including the acquisition of $227.8 million in fixed and intangible assets, to redeem shares for an amount of $409.4 million, to pay dividends of $91.5 million, to repay our revolving credit facility of $330.4 million and to carry out other investing and financing activities.
At 2013 fiscal year-end, our financial position mainly consisted of cash and cash equivalents in the amount of $80.8 million, Series A Notes in the amount of $200.0 million maturing in 2015, a revolving credit facility of $600.0 million maturing in 2018, that was unused, and Series B Notes in the amount of $400.0 million maturing in 2035.
We believe that cash flows from next year's operating activities should be sufficient to finance the Corporation's investing activities, including approximately $275 million(2) in fixed and intangible assets.
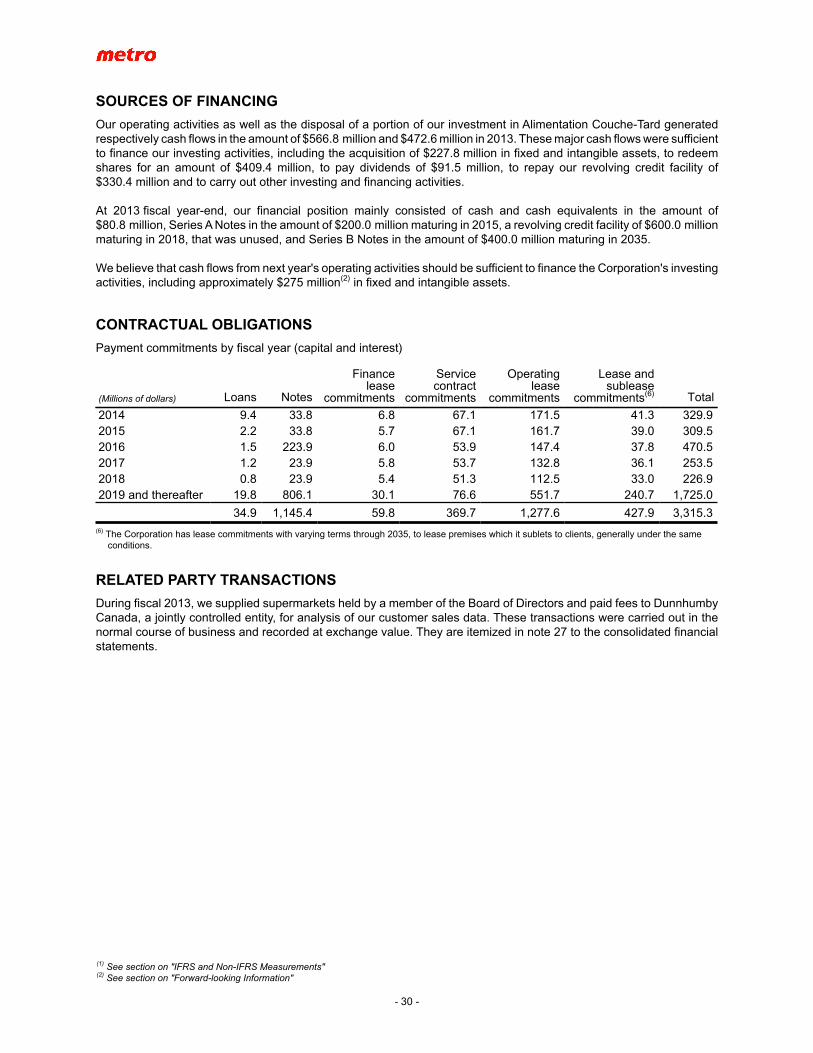
CONTRACTUAL OBLIGATIONSPayment commitments by fiscal year (capital and interest)
(Millions of dollars) Loans Notes
Financelease
commitments
Servicecontract
commitments
Operatinglease
commitments
Lease andsublease
commitments(6) Total
2014 9.4 33.8 6.8 67.1 171.5 41.3 329.92015 2.2 33.8 5.7 67.1 161.7 39.0 309.52016 1.5 223.9 6.0 53.9 147.4 37.8 470.52017 1.2 23.9 5.8 53.7 132.8 36.1 253.52018 0.8 23.9 5.4 51.3 112.5 33.0 226.92019 and thereafter 19.8 806.1 30.1 76.6 551.7 240.7 1,725.0
34.9 1,145.4 59.8 369.7 1,277.6 427.9 3,315.3(6) The Corporation has lease commitments with varying terms through 2035, to lease premises which it sublets to clients, generally under the same
conditions.
RELATED PARTY TRANSACTIONSDuring fiscal 2013, we supplied supermarkets held by a member of the Board of Directors and paid fees to Dunnhumby Canada, a jointly controlled entity, for analysis of our customer sales data. These transactions were carried out in the normal course of business and recorded at exchange value. They are itemized in note 27 to the consolidated financial statements.
(1) See section on "IFRS and Non-IFRS Measurements"(2) See section on "Forward-looking Information"
- 31 -
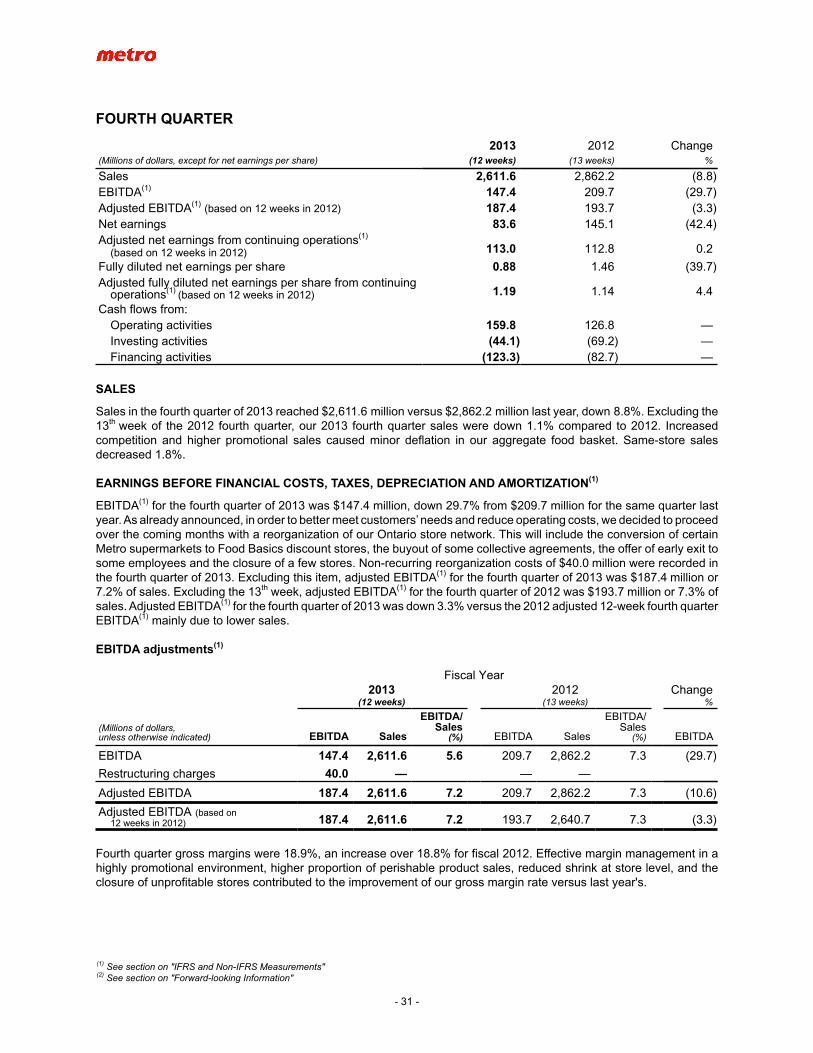
FOURTH QUARTER
2013 2012 Change(Millions of dollars, except for net earnings per share) (12 weeks) (13 weeks) %
Sales 2,611.6 2,862.2 (8.8)EBITDA(1) 147.4 209.7 (29.7)Adjusted EBITDA(1) (based on 12 weeks in 2012) 187.4 193.7 (3.3)Net earnings 83.6 145.1 (42.4)Adjusted net earnings from continuing operations(1)
(based on 12 weeks in 2012) 113.0 112.8 0.2
Fully diluted net earnings per share 0.88 1.46 (39.7)Adjusted fully diluted net earnings per share from continuing
operations(1) (based on 12 weeks in 2012) 1.19 1.14 4.4
Cash flows from:Operating activities 159.8 126.8 —Investing activities (44.1) (69.2) —Financing activities (123.3) (82.7) —
SALES
Sales in the fourth quarter of 2013 reached $2,611.6 million versus $2,862.2 million last year, down 8.8%. Excluding the 13th week of the 2012 fourth quarter, our 2013 fourth quarter sales were down 1.1% compared to 2012. Increased competition and higher promotional sales caused minor deflation in our aggregate food basket. Same-store sales decreased 1.8%.
EARNINGS BEFORE FINANCIAL COSTS, TAXES, DEPRECIATION AND AMORTIZATION(1)
EBITDA(1) for the fourth quarter of 2013 was $147.4 million, down 29.7% from $209.7 million for the same quarter last year. As already announced, in order to better meet customers’ needs and reduce operating costs, we decided to proceed over the coming months with a reorganization of our Ontario store network. This will include the conversion of certain Metro supermarkets to Food Basics discount stores, the buyout of some collective agreements, the offer of early exit to some employees and the closure of a few stores. Non-recurring reorganization costs of $40.0 million were recorded in the fourth quarter of 2013. Excluding this item, adjusted EBITDA(1) for the fourth quarter of 2013 was $187.4 million or 7.2% of sales. Excluding the 13th week, adjusted EBITDA(1) for the fourth quarter of 2012 was $193.7 million or 7.3% of sales. Adjusted EBITDA(1) for the fourth quarter of 2013 was down 3.3% versus the 2012 adjusted 12-week fourth quarter EBITDA(1) mainly due to lower sales.
EBITDA adjustments(1)
Fiscal Year2013 2012 Change
(12 weeks) (13 weeks) %
(Millions of dollars,unless otherwise indicated) EBITDA Sales
EBITDA/Sales
(%) EBITDA Sales
EBITDA/Sales
(%) EBITDA
EBITDA 147.4 2,611.6 5.6 209.7 2,862.2 7.3 (29.7)
Restructuring charges 40.0 — — —
Adjusted EBITDA 187.4 2,611.6 7.2 209.7 2,862.2 7.3 (10.6)
Adjusted EBITDA (based on 12 weeks in 2012) 187.4 2,611.6 7.2 193.7 2,640.7 7.3 (3.3)
Fourth quarter gross margins were 18.9%, an increase over 18.8% for fiscal 2012. Effective margin management in a highly promotional environment, higher proportion of perishable product sales, reduced shrink at store level, and the closure of unprofitable stores contributed to the improvement of our gross margin rate versus last year's.
(1) See section on "IFRS and Non-IFRS Measurements"(2) See section on "Forward-looking Information"
- 32 -
DEPRECIATION AND AMORTIZATION AND NET FINANCIAL COSTS
Total depreciation and amortization expense for the fourth quarter of 2013 amounted to $41.3 million versus $41.8 million in 2012. The closure of unprofitable stores in late fiscal 2012 and early fiscal 2013 reduced depreciation costs compared to last year.
Net financial costs for the fourth quarter of 2013 totalled $8.6 million compared to $11.7 million for the corresponding period of 2012. Financial costs for the 13th week of the 2012 fourth quarter were $0.9 million.
SHARE OF AN ASSOCIATE'S EARNINGS
Our share of earnings in Alimentation Couche-Tard was $15.0 million for the fourth quarter of fiscal 2013 versus $12.1 million for fiscal 2012.
NON-RECURRING GAINS FROM AN INVESTMENT IN AN ASSOCIATE
In the fourth quarter of 2012, Alimentation Couche-Tard issued 7.3 million shares for net proceeds of approximately $330 million to finance part of its acquisition of Statoil Fuel & Retail ASA. As we did not participate in this share issue, our interest in Couche-Tard decreased from 11.6% to 11.1%. This dilution and our share in Couche-Tard's increased value as a result of the share issue amount to a deemed disposition and deemed proceeds of disposition of part of our investment for a net pre-tax gain of $25.0 million and $21.7 million post-tax.
INCOME TAXES
The 2013 fourth quarter income tax expense of $28.9 million represented an effective tax rate of 25.7%. The 2012 fourth quarter income tax expense of $47.8 million represented an effective tax rate of 24.7%.
Income tax expense for the 13th week of the 2012 fourth quarter was $4.1 million.
NET EARNINGS
Net earnings for the fourth quarter of 2013 were $83.6 million, down 42.4% from net earnings of $145.1 million for the same quarter of 2012. Fully diluted net earnings per share were down 39.7% to $0.88 from $1.46 last year.
NET EARNINGS (LOSS) FROM DISCONTINUED OPERATION
In the first quarter of 2013, we discontinued our foodservice operation and disposed of the Distagro division which supplied restaurant chains and convenience stores belonging to and operated by gas station chains. The division's sales and expenses are presented under the item “Discontinued operation” for 2012 and 2013.
There was no net loss from discontinued operation in the fourth quarter of 2013 versus $0.4 million loss for the same quarter of 2012.
NET EARNINGS FROM CONTINUING OPERATIONS
Net earnings from continuing operations were $83.6 million for the fourth quarter of 2013, down 42.5% from $145.5 million for the same quarter last year. Fully diluted net earnings per share from continuing operations were $0.88 for the fourth quarter of 2013 compared to $1.47 last year, a decrease of 40.1%.
ADJUSTED NET EARNINGS FROM CONTINUING OPERATIONS(1)
Excluding the 2013 fourth quarter $29.4 million post-tax reorganization cost, and excluding the 2012 fourth quarter Couche-Tard dilution gain of $21.7 million after taxes, adjusted net earnings from continuing operations(1) for the fourth quarter of 2013 were $113.0 million, down 8.7% from $123.8 million for the same quarter last year, and adjusted fully diluted net earnings per share from continuing operations(1) were $1.19, down 4.8% from $1.25 last year.
Excluding the 13th week in the fourth quarter of 2012, adjusted net earnings from continuing operations(1) for the fourth quarter of 2013 were up 0.2% and adjusted fully diluted net earnings per share from continuing operations(1) were up 4.4%.
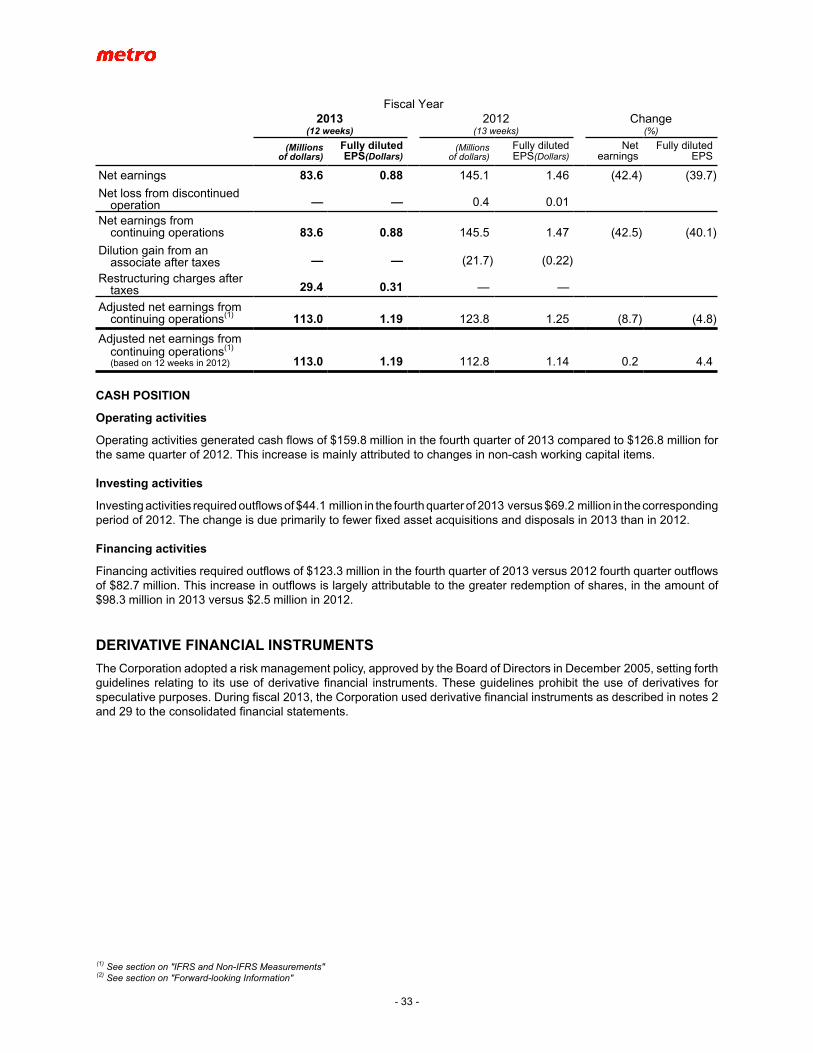
(1) See section on "IFRS and Non-IFRS Measurements"(2) See section on "Forward-looking Information"
- 33 -
Fiscal Year2013 2012 Change
(12 weeks) (13 weeks) (%)
(Millionsof dollars)
Fully diluted EPS(Dollars)
(Millionsof dollars)
Fully diluted EPS(Dollars)
Netearnings
Fully dilutedEPS
Net earnings 83.6 0.88 145.1 1.46 (42.4) (39.7)
Net loss from discontinuedoperation — — 0.4 0.01
Net earnings fromcontinuing operations 83.6 0.88 145.5 1.47 (42.5) (40.1)
Dilution gain from anassociate after taxes — — (21.7) (0.22)
Restructuring charges aftertaxes 29.4 0.31 — —
Adjusted net earnings from continuing operations(1) 113.0 1.19 123.8 1.25 (8.7) (4.8)
Adjusted net earnings from continuing operations(1) (based on 12 weeks in 2012) 113.0 1.19 112.8 1.14 0.2 4.4
CASH POSITION
Operating activities
Operating activities generated cash flows of $159.8 million in the fourth quarter of 2013 compared to $126.8 million for the same quarter of 2012. This increase is mainly attributed to changes in non-cash working capital items.
Investing activities
Investing activities required outflows of $44.1 million in the fourth quarter of 2013 versus $69.2 million in the corresponding period of 2012. The change is due primarily to fewer fixed asset acquisitions and disposals in 2013 than in 2012.
Financing activities
Financing activities required outflows of $123.3 million in the fourth quarter of 2013 versus 2012 fourth quarter outflows of $82.7 million. This increase in outflows is largely attributable to the greater redemption of shares, in the amount of $98.3 million in 2013 versus $2.5 million in 2012.
DERIVATIVE FINANCIAL INSTRUMENTSThe Corporation adopted a risk management policy, approved by the Board of Directors in December 2005, setting forth guidelines relating to its use of derivative financial instruments. These guidelines prohibit the use of derivatives for speculative purposes. During fiscal 2013, the Corporation used derivative financial instruments as described in notes 2 and 29 to the consolidated financial statements.
(1) See section on "IFRS and Non-IFRS Measurements"(2) See section on "Forward-looking Information"
- 34 -
NEW ACCOUNTING POLICIESADOPTED IN 2013
Presentation of financial statements In June 2011, the International Accounting Standards Board (IASB) issued amendments to IAS 1 “Presentation of Financial Statements”. Items of other comprehensive income and the corresponding tax expense are required to be grouped into those that will and will not subsequently be reclassified through net earnings. The Corporation has applied these amendments in its fiscal 2013 annual financial statements. Additional information was disclosed in the consolidated statement of comprehensive income.
RECENTLY ISSUED
Classification and measurement of financial assets and financial liabilities In November 2009, the IASB issued IFRS 9 “Financial Instruments”. This new standard replaces the various rules of IAS 39 “Financial Instruments: Recognition and Measurement” with a single approach to determine whether a financial asset is measured at amortized cost or fair value. This approach is based on how an entity manages its financial instruments and the contractual cash flow characteristics of the financial assets.
In October 2010, the IASB issued revisions to IFRS 9, adding the requirements for classification and measurement of financial liabilities contained in IAS 39.
In December 2011, the IASB deferred the mandatory effective date of IFRS 9 to fiscal years beginning on or after January 1, 2015. Early adoption is permitted under certain conditions. The Corporation will not adopt this new standard early and will, over the next fiscal year, assess the impact of IFRS 9 on its financial statements.
Offsetting financial assets and financial liabilities In December 2011, the IASB issued amendments to IAS 32 “Financial Instruments: Presentation” clarifying the requirements for offsetting financial assets and financial liabilities. The IASB specified that the right of set-off had to be legally enforceable even in the event of bankruptcy.
The IASB also issued amendments to IFRS 7 “Financial Instruments: Disclosures” improving disclosures on offsetting of financial assets and financial liabilities.
The amendments to IFRS 7 are applicable to the first quarter of the Corporation's 2014 fiscal year. The amendments to IAS 32 are applicable to the first quarter of fiscal 2015. In order to co-ordinate the two standards' application, the Corporation will early adopt IAS 32 in the first quarter of its 2014 fiscal year. These amendments will not impact the Corporation's financial statements, but additional information will be disclosed through notes to financial statements.
Consolidated financial statements In May 2011, the IASB issued IFRS 10 “Consolidated Financial Statements” which is a replacement of SIC-12 “Consolidation - Special Interest Entities” and certain parts of IAS 27 “Consolidated and Separate Financial Statements”. IFRS 10 eliminates the risk/benefit-based approach and uses control as the sole basis for consolidation. An investor controls an investee if and only if the investor has all of the following elements: a) power over the investee; b) exposure or rights to variable returns from involvement with the investee; c) the ability to use power over the investee to affect the amount of the investor's returns.
The Corporation will apply IFRS 10 as of the first quarter of its 2014 fiscal year. This standard will not impact the Corporation's financial statements.
(1) See section on "IFRS and Non-IFRS Measurements"(2) See section on "Forward-looking Information"
- 35 -
Joint arrangements In May 2011, the IASB issued IFRS 11 “Joint Arrangements” which supersedes IAS 31 “Interests in Joint Ventures” and SIC-13 “Jointly Controlled Entities - Non-Monetary Contributions by Venturers”. This standard describes two types of joint arrangements which differ according to the rights and obligations of the partners: joint operations and joint ventures. IFRS 11 eliminates the proportionate consolidation method for joint ventures and requires the equity method. However, proportionate consolidation is maintained for joint operations. The Corporation will apply IFRS 11 as of the first quarter of its 2014 fiscal year. This standard will not impact the Corporation's financial statements.
Disclosure of interests in other entities In May 2011, the IASB issued IFRS 12 “Disclosure of Interests in Other Entities” which requires that an entity disclose more information on the nature of and risks associated with its interests in other entities (i.e. subsidiaries, joint arrangements, associates or unconsolidated structured entities) and the effects of those interests on its financial statements. The Corporation will apply IFRS 12 as of the first quarter of its 2014 fiscal year. Additional information will be disclosed through notes to the annual financial statements.
Fair value measurement In May 2011, the IASB issued IFRS 13 “Fair Value Measurement” to establish a single framework for fair value measurement of financial and non-financial items. IFRS 13 defines fair value as the price that would be received to sell an asset or paid to transfer a liability in an orderly transaction between market participants at the measurement date. It also requires disclosure of more information on fair value measurements. The Corporation will apply IFRS 13 as of the first quarter of its 2014 fiscal year. This standard will not impact the Corporation's financial statements, but additional information will be disclosed through notes to financial statements.
Employee benefits In June 2011, the IASB issued amendments to IAS 19 “Employee Benefits” (IAS 19R). IAS 19R eliminates the corridor method for recognizing changes (actuarial gains and losses) in defined benefit obligations and plan assets and requires that they be recognized in other comprehensive income when they occur. Application of this amendment will have no impact, as the Corporation has used immediate recognition of actuarial gains and losses in other comprehensive income since the transition to International Financial Reporting Standards (IFRS).
IAS 19R eliminates the possibility of deferring recognition of past service costs related to unvested benefits and requires their immediate recognition in the income statement. Application of this amendment will have no impact for the Corporation, as no past service costs have been deferred since the transition to IFRS.
Under IAS 19, the employee benefit expense included a financial cost composed of interest income corresponding to the expected return on plan assets measured according to management assumptions based on market expectations. IAS 19R eliminates the expected return on plan assets component and requires recognition of net interest on defined benefit obligations net of plan assets based on the discount rate for measuring obligations. This net interest is not a component of the employee benefit expense and will be presented as part of finance costs. The Corporation expects this amendment to increase annual employee benefit expenses by about $15 million and annual financial costs by about $10 million.The Corporation will apply these amendments as of the first quarter of its 2014 fiscal year.
IAS 19R also requires additional disclosures to present the characteristics of defined benefit plans to the annual financial statements.
Impairment of assets In May 2013, the IASB issued amendments to IAS 36 “Impairment of Assets” to require disclosures about assets or cash generating units for which an impairment loss was recognized or reversed during the period. The Corporation will apply the amendments to IAS 36 along with the new IFRS 13 requirements as of the first quarter of its 2014 fiscal year. Additional information will be disclosed through notes to financial statements.
(1) See section on "IFRS and Non-IFRS Measurements"(2) See section on "Forward-looking Information"
- 36 -
IFRS AND NON-IFRS MEASUREMENTSIn addition to the IFRS earnings measurements provided, we have included certain IFRS and non-IFRS earnings measurements. These measurements are presented for information purposes only. They do not have a standardized meaning prescribed by IFRS and therefore may not be comparable to similar measurements presented by other public companies.
EARNINGS BEFORE FINANCIAL COSTS, TAXES, DEPRECIATION AND AMORTIZATION (EBITDA)
EBITDA is a measurement of earnings that excludes financial costs, taxes, depreciation and amortization, share of an associate's earnings, dilution gain from an associate and gain on disposal of a portion of the investment in an associate. It is an additional IFRS measurement and it is presented separately in the consolidated statements of income. We believe that EBITDA is a measurement commonly used by readers of financial statements to evaluate a company's operational cash-generating capacity and ability to discharge its financial expenses.
ADJUSTED EBITDA, ADJUSTED NET EARNINGS FROM CONTINUING OPERATIONS AND ADJUSTED FULLY DILUTED NET EARNINGS PER SHARE FROM CONTINUING OPERATIONS
Adjusted EBITDA, adjusted net earnings from continuing operations and adjusted fully diluted net earnings per share from continuing operations are earnings measurements that exclude non-recurring items. They are non-IFRS measurements. We believe that presenting earnings without non-recurring items leaves readers of financial statements better informed as to the current period and corresponding period's earnings, thus enabling them to better evaluate the Corporation's performance and judge its future outlook.
FORWARD-LOOKING INFORMATIONWe have used, throughout this annual report, different statements that could, within the context of regulations issued by the Canadian Securities Administrators, be construed as being forward-looking information. In general, any statement contained in this report that does not constitute a historical fact may be deemed a forward-looking statement. Expressions such as “allow”, “anticipate”, “expect”, “estimate”, and other similar expressions are generally indicative of forward-looking statements. The forward-looking statements contained in this report are based upon certain assumptions regarding the Canadian food industry, the general economy, our annual budget, as well as our 2014 action plan.
These forward-looking statements do not provide any guarantees as to the future performance of the Corporation and are subject to potential risks, known and unknown, as well as uncertainties that could cause the outcome to differ significantly. An economic slowdown or recession, or the arrival of a new competitor, are examples described under the “Risk Management” section of this annual report that could have an impact on these statements. We believe these statements to be reasonable and relevant as at the date of publication of this report and represent our expectations. The Corporation does not intend to update any forward-looking statement contained herein, except as required by applicable law.
CONTROLS AND PROCEDURESThe President and Chief Executive Officer, and the Senior Vice-President, Chief Financial Officer and Treasurer of the Corporation, are responsible for the implementation and maintenance of disclosure controls and procedures (DC&P), and of the internal control over financial reporting (ICFR), as provided for in National Instrument 52-109 regarding the Certification of Disclosure in Issuers' Annual and Interim Filings. They are assisted in this task by the Disclosure Committee, which is comprised of members of the Corporation's senior management.
An evaluation was completed under their supervision in order to measure the effectiveness of DC&P and ICFR. Based on this evaluation, the President and Chief Executive Officer and the Senior Vice-President, Chief Financial Officer and Treasurer of the Corporation concluded that the DC&P and the ICFR were effective as at the end of the fiscal year ended September 28, 2013.
(1) See section on "IFRS and Non-IFRS Measurements"(2) See section on "Forward-looking Information"
- 37 -
Therefore, the design of the DC&P provides reasonable assurance that material information relating to the Corporation is made known to it by others, particularly during the period in which the annual filings are being prepared, and that the information required to be disclosed by the Corporation in its annual filings, interim filings and other reports filed or submitted by it under securities legislation is recorded, processed, summarized and reported within the time periods specified in securities legislation.
Furthermore, the design of the ICFR provides reasonable assurance regarding the reliability of the Corporation's financial reporting and the preparation of its financial statements for external purposes in accordance with IFRS.
SIGNIFICANT JUDGEMENTS AND ESTIMATESOur Management's Discussion and Analysis is based upon our consolidated financial statements, prepared in accordance with IFRS, and it is presented in Canadian dollars, our unit of measure. The preparation of the consolidated financial statements and other financial information contained in this Management's Discussion and Analysis requires management to make judgements, estimates and assumptions that affect the recognition and valuation of assets, liabilities, sales, other income and expenses. These estimates and assumptions are based on historical experience and other factors deemed relevant and reasonable and are reviewed at every closing date. The use of different estimates could produce different amounts in the consolidated financial statements. Actual results may differ from these estimates.
JUDGEMENTS
In applying the Corporation's accounting policies, management has made the following judgements, which have the most significant effect on the amounts recognized in the consolidated financial statements:
Consolidation of special purpose entities The Corporation has no voting rights in certain food stores. However, it assumes the majority of their risks and benefits from the majority of their advantages. For these reasons, the Corporation consolidates these food stores in its financial statements.
The Corporation has no voting rights in the trust created for performance share unit plan participants. However, under the trust agreement, it instructs the trustee as to the sale and purchase of Corporation shares and payments to beneficiaries, gives the trustee money to buy Corporation shares, assumes the majority of the risks, benefits from the majority of the advantages, and ensures that the trust holds a sufficient number of shares to meet its obligations to the beneficiaries. Management, having concluded that the Corporation controls the trust, consolidates the entity in its financial statements.
The Corporation also has an agreement with a distributor, whose majority of risks it assumes and whose majority of advantages it benefits from. For these reasons, the Corporation consolidates this distributor in its financial statements.
ESTIMATES The assumptions concerning the future and other key sources of estimation uncertainty at the reporting date, that have a significant risk of causing a material adjustment to the value of assets and liabilities within the next period, are discussed below:
Impairment of assets In testing for impairment of intangible assets with indefinite useful lives and goodwill, value in use and fair value less costs to sell are estimated using the discounted future cash flows model, the capitalized excess earnings before financial costs and taxes (EBIT) and royalty-free licence methods. These methods are based on various assumptions, such as the future cash flows estimate, excess EBIT, royalty rates, discount rate, earnings multiples and growth rate. The key assumptions are disclosed in notes 16 and 17 to the consolidated financial statements.
(1) See section on "IFRS and Non-IFRS Measurements"(2) See section on "Forward-looking Information"
- 38 -
Pension plans and other plans Defined pension plans, ancillary retirements and other long-term benefits obligations and costs associated to these obligations are determined from actuarial calculations according to the projected credit unit method. These calculations are based on management's best assumptions relating to expected long-term return on plan assets, salary escalation, retirement age of participants and expected health care costs. The key assumptions are disclosed in note 24 to the consolidated financial statements.
Non-controlling interest The non-controlling interest-related liability is calculated in relation to the price to be paid by the Corporation for the non-controlling interest, which price is based mainly on the future earnings of Adonis and Phoenicia at the date the options become exercisable. Given the uncertainty associated with the estimation of these future earnings, the Corporation used, at the end of the current fiscal year, its most probable estimate and various other assumptions, including the discount rate, growth rate and capital investments. Additional information is presented in note 29 to the consolidated financial statements.
RISK MANAGEMENTThe Board of Directors, Audit Committee and Steering Committee monitor business risks closely. Internal Audit has the mandate to audit all business risks triennially. Hence, each segment is audited every three years to ensure that controls have been implemented to deal with the business risks related to its business area.
In the normal course of business, we are exposed to various risks, which are described below, that could have a material impact on our earnings, financial position and cash flows. In order to counteract the principal risk factors, we have implemented strategies specifically adapted to them.
MARKET AND COMPETITION
Intensifying competition, the possible arrival of new competitors and changing consumer needs are constant concerns for us.
To cope with competition and maintain our leadership position in the Québec and Ontario markets, we are on the alert for new ways of doing things and new sites. We have an ongoing investment program for all our stores to ensure that our retail network remains one of the most modern in Canada.
We have also developed a successful market segmentation strategy. Our grocery banners: the conventional Metro supermarkets, Super C and Food Basics discount banners, and Adonis ethnic food stores, target three different market segments. In the pharmaceutical market, we have large, medium, and small pharmacies under the Brunet Plus, Brunet, Brunet Clinique, Clini Plus, Pharmacy, and Drug Basics banners.
With the metro&moi and Air Miles® loyalty programs in our Metro and Metro Plus supermarkets and our partner Dunnhumby Canada Limited, we are able to know the buying habits of loyal customers, offer them personalized promotions and increase their purchases at our stores.
In September 2013, we completed another step in our personalization customization strategy with our new website www.metro.ca and smartphone mobile app. So our customers can access their grocery list, weekly menus suited to their needs, flyer specials and coupons to be redeemed at the checkout.
ECONOMIC CONDITIONS
An economic slowdown or recession could affect our supermarkets and discount stores, however, they can adapt to such conditions with appropriate merchandising strategies. Since food is a basic need, the food industry is less affected by an economic slowdown or recession.
(1) See section on "IFRS and Non-IFRS Measurements"(2) See section on "Forward-looking Information"
- 39 -
FOOD SAFETY
We are exposed to potential liability and costs regarding defective products, food safety, product contamination and handling. Such liability may arise from product manufacturing, packaging and labelling, design, preparation, warehousing, distribution and presentation. Food products represent the greater part of our sales and we could be at risk in the event of a major outbreak of food-borne illness or an increase in public health concerns regarding certain food products.
To counter these risks, we apply very strict food safety procedures and controls throughout the whole distribution chain. Employees receive continuous training in this area from Metro's L'École des professionnels. Our main meat distribution facilities are Hazard Analysis and Critical Control Point (HACCP) accredited, the industry's highest international standard. Our systems also enable us to trace every meat product distributed from any of our main distribution centres to its consumer point of sale.
CORPORATE RESPONSIBILITY
If our actions do not respect our environmental, social and economic responsibilities, we are exposed to criticism, claims, boycotts and even lawsuits, should we fail to adhere to our legal obligations.
We are aware that our business operations affect society and have increased our efforts regarding corporate responsibility. In 2012, we published our first Corporate Responsibility Report which was developed based on a prioritization process that considered both internal and external issues and trends impacting our sector and business. The report's development was guided by the requirements set out in the Global Reporting Initiative (GRI) G3.1 Guidelines. In 2013, we updated our report, incorporating the year’s highlights and providing a summary of our efforts and achievements with respect to our commitments and priorities in matters of corporate responsibility. Our Corporate Responsibility Report is available on our website www.metro.ca. The Corporation will issue its next Corporate Responsibility Report in the spring of 2014.
REGULATIONS
Changes are regularly brought about to accounting policies, laws, regulations, rules or policies impacting our operations. We monitor these changes closely.
PRICE OF FUEL, ENERGY AND UTILITIES
We are a big consumer of utilities, electricity, natural gas and fuel. Increases in the price of these items may affect us.
LABOUR RELATIONS
The majority of our store and distribution centre employees are unionized. Collective bargaining may give rise to work stoppages or slowdowns that could hurt us. We negotiate agreements with different maturity dates, conditions that ensure our competitiveness and terms that promote a positive work environment in all our business segments. We have experienced some minor labour conflicts over the last few years but expect(2) to maintain good labour relations in the future.
CRISIS MANAGEMENT
Events outside our control that could seriously affect our operations may arise. We have set up business recovery plans for all our operations. These plans provide for several disaster recovery sites, generators in case of power outages and back-up computers as powerful as the Corporation's existing computers. A steering committee oversees and regularly reviews all our recovery plans. We have also developed a contingency plan in the event of a pandemic to minimize its impact.
(1) See section on "IFRS and Non-IFRS Measurements"(2) See section on "Forward-looking Information"
- 40 -
FINANCIAL INSTRUMENTS
We make some foreign-denominated purchases of goods and services, exposing ourselves to exchange rate risks. According to our risk management policy, we may use derivative financial instruments, such as foreign exchange forward contracts. The policy's guidelines prohibit us from using derivative financial instruments for speculative purposes, but they do not guarantee that we will not sustain losses as a result of our derivative financial instruments.
We hold receivables generated mainly from sales to affiliate customers. To guard against credit losses, we have adopted a credit policy that defines mandatory credit requirements to be maintained and guarantees to be provided. Affiliate customer assets guarantee the majority of our receivables.
We are also exposed to liquidity risk mainly through our non-current debt and creditors. We evaluate our cash position regularly and estimate(2) that cash flows generated by our operating activities are sufficient to provide for all outflows required by our financing activities. Our Series A and Series B Notes mature only in 2015 and 2035, respectively. We also have an unused authorized balance of $600.0 million on our revolving credit facility and, on October 1, 2013, the maturity was extended to November 3, 2018.
CLAIMS
In the normal course of business, we are exposed to various claims and proceedings. We limit our exposure by maintaining insurance to cover the risk of claims related to our operations.
SUPPLIERS
Negative events could affect a supplier and lead to service breakdowns and store delivery delays. As a remedy for this situation, we deal with several suppliers. In the event of a supplier's service breakdown, we can turn to another supplier reasonably quickly.
FRANCHISEES AND AFFILIATES
Some of our franchisees and affiliates might breach prescribed clauses of franchise or affiliation contracts, such as purchasing policies and marketing plans. Non-compliance with such clauses may have an impact on us. A team of retail operations advisers ensures our operating standards' consistent application in all of these stores.
Montréal, Canada, November 29, 2013
- 41 -
MANAGEMENT'S RESPONSIBILITY FOR FINANCIAL REPORTING
The preparation and presentation of the consolidated financial statements of METRO INC. and the other financial information contained in this Annual Report are the responsibility of management. This responsibility is based on a judicious choice of appropriate accounting principles and policies, the application of which requires making estimates and informed judgements. It also includes ensuring that the financial information in the Annual Report is consistent with the consolidated financial statements. The consolidated financial statements were prepared in accordance with International Financial Reporting Standards and were approved by the Board of Directors.
METRO INC. maintains accounting systems and internal controls over the financial reporting process which, in the opinion of management, provide reasonable assurance regarding the accuracy, relevance and reliability of financial information and the well-ordered, efficient management of the Corporation's affairs.
The Board of Directors fulfills its duty to oversee management in the performance of its financial reporting responsibilities and to review the consolidated financial statements and Annual Report, principally through its Audit Committee. This Committee is comprised solely of directors who are independent of the Corporation and is also responsible for making recommendations for the nomination of external auditors. Also, it holds periodic meetings with members of management as well as internal and external auditors to discuss internal controls, auditing matters and financial reporting issues. The external and internal auditors have access to the Committee without management. The Audit Committee has reviewed the consolidated financial statements and Annual Report of METRO INC. and recommended their approval to the Board of Directors.
The enclosed consolidated financial statements were audited by Ernst & Young LLP and their report indicates the extent of their audit and their opinion on the consolidated financial statements.
Eric R. La Flèche François Thibault
President and Chief Executive Officer Senior Vice-President,Chief Financial Officer and Treasurer
November 12, 2013
- 42 -
INDEPENDENT AUDITORS' REPORT
To the shareholders of METRO INC.
We have audited the accompanying consolidated financial statements of METRO INC., which comprise the consolidated statements of financial position as at September 28, 2013 and September 29, 2012, and the consolidated statements of income, comprehensive income, changes in equity and cash flows for the years then ended, and a summary of significant accounting policies and other explanatory information.
Management's responsibility for the consolidated financial statements
Management is responsible for the preparation and fair presentation of these consolidated financial statements in accordance with International Financial Reporting Standards, and for such internal control as management determines is necessary to enable the preparation of consolidated financial statements that are free from material misstatement, whether due to fraud or error.
Auditors' responsibility
Our responsibility is to express an opinion on these consolidated financial statements based on our audits. We conducted our audits in accordance with Canadian generally accepted auditing standards. Those standards require that we comply with ethical requirements and plan and perform the audit to obtain reasonable assurance about whether the consolidated financial statements are free from material misstatement.
An audit involves performing procedures to obtain audit evidence about the amounts and disclosures in the consolidated financial statements. The procedures selected depend on the auditors' judgment, including the assessment of the risks of material misstatement of the consolidated financial statements, whether due to fraud or error. In making those risk assessments, the auditors consider internal control relevant to the entity's preparation and fair presentation of the consolidated financial statements in order to design audit procedures that are appropriate in the circumstances, but not for the purpose of expressing an opinion on the effectiveness of the entity's internal control. An audit also includes evaluating the appropriateness of accounting policies used and the reasonableness of accounting estimates made by management, as well as evaluating the overall presentation of the consolidated financial statements.
We believe that the audit evidence we have obtained in our audits is sufficient and appropriate to provide a basis for our audit opinion.
Opinion
In our opinion, the consolidated financial statements present fairly, in all material respects, the financial position of METRO INC. as at September 28, 2013 and September 29, 2012 and its financial performance and its cash flows for the years then ended in accordance with International Financial Reporting Standards.
Montréal, CanadaNovember 12, 2013
1 CPA auditor, CA, public accountancy permit no. A120803
- 43 -
Annual Consolidated Financial Statements
METRO INC.
September 28, 2013
Table of contents
- 44 -
Page
Consolidated statements of income ............................................................................................................... 45
Consolidated statements of comprehensive income ...................................................................................... 46
Consolidated statements of financial position ................................................................................................ 47
Consolidated statements of changes in equity ............................................................................................... 48
Consolidated statements of cash flows .......................................................................................................... 50
Notes to consolidated financial statements .................................................................................................... 51
1- Description of business ........................................................................................................................... 51
2- Significant accounting policies ................................................................................................................. 51
3- New accounting policies .......................................................................................................................... 56
4- Significant judgements and estimates ..................................................................................................... 58
5- Business acquisitions .............................................................................................................................. 59
6- Additional information on the nature of earnings components .................................................................. 60
7- Income taxes ........................................................................................................................................... 61
8- Discontinued operation ............................................................................................................................ 63
9- Net earnings per share ............................................................................................................................ 64
10- Inventories .............................................................................................................................................. 64
11- Assets held for sale ................................................................................................................................. 64
12- Investment in an associate ...................................................................................................................... 65
13- Other financial assets .............................................................................................................................. 65
14- Fixed assets ............................................................................................................................................ 66
15- Investment properties .............................................................................................................................. 67
16- Intangible assets ..................................................................................................................................... 68
17- Goodwill .................................................................................................................................................. 70
18- Bank loans .............................................................................................................................................. 70
19- Provisions ............................................................................................................................................... 70
20- Debt ........................................................................................................................................................ 71
21- Other liabilities ......................................................................................................................................... 72
22- Capital stock ........................................................................................................................................... 72
23- Dividends ................................................................................................................................................ 74
24- Employee benefits ................................................................................................................................... 75
25- Commitments .......................................................................................................................................... 78
26- Contingencies ......................................................................................................................................... 79
27- Related party transactions ....................................................................................................................... 79
28- Management of capital ............................................................................................................................ 80
29- Financial instruments .............................................................................................................................. 80
30- Comparative figures ................................................................................................................................ 83
31- Approval of financial statements .............................................................................................................. 83
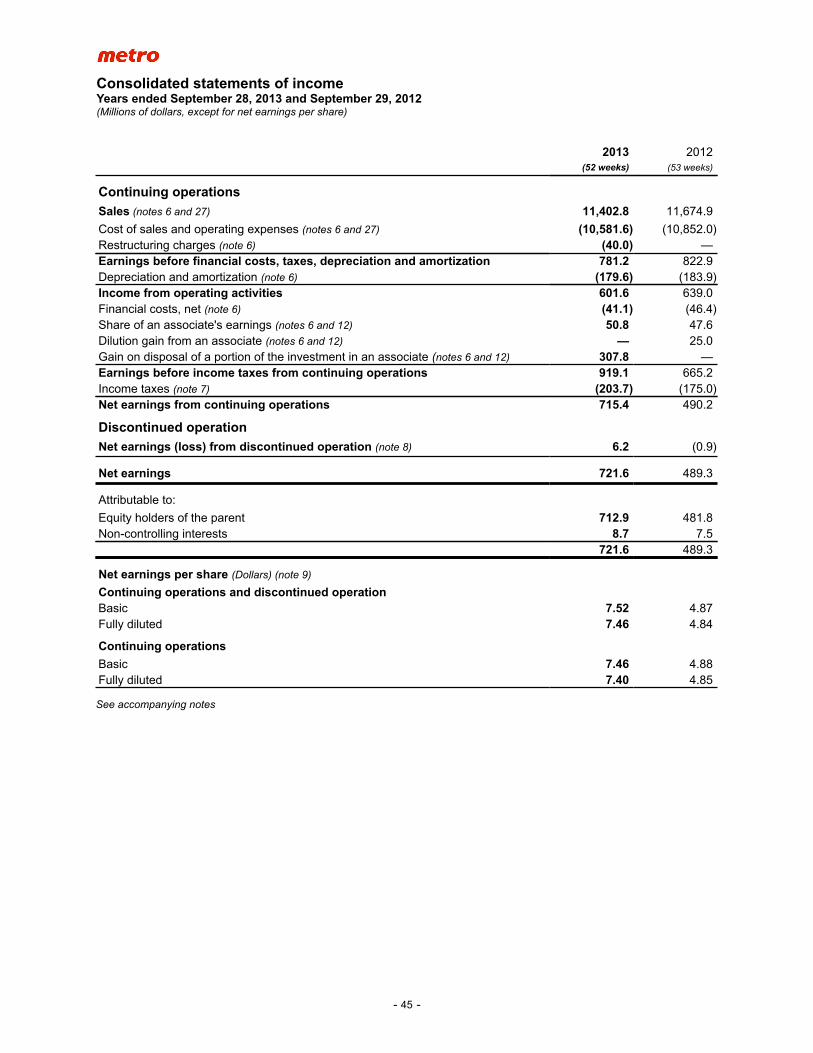
Consolidated statements of incomeYears ended September 28, 2013 and September 29, 2012 (Millions of dollars, except for net earnings per share)
- 45 -
2013 2012(52 weeks) (53 weeks)
Continuing operationsSales (notes 6 and 27) 11,402.8 11,674.9
Cost of sales and operating expenses (notes 6 and 27) (10,581.6) (10,852.0)Restructuring charges (note 6) (40.0) —Earnings before financial costs, taxes, depreciation and amortization 781.2 822.9Depreciation and amortization (note 6) (179.6) (183.9)Income from operating activities 601.6 639.0Financial costs, net (note 6) (41.1) (46.4)Share of an associate's earnings (notes 6 and 12) 50.8 47.6Dilution gain from an associate (notes 6 and 12) — 25.0Gain on disposal of a portion of the investment in an associate (notes 6 and 12) 307.8 —Earnings before income taxes from continuing operations 919.1 665.2Income taxes (note 7) (203.7) (175.0)Net earnings from continuing operations 715.4 490.2
Discontinued operationNet earnings (loss) from discontinued operation (note 8) 6.2 (0.9)
Net earnings 721.6 489.3
Attributable to:
Equity holders of the parent 712.9 481.8Non-controlling interests 8.7 7.5
721.6 489.3
Net earnings per share (Dollars) (note 9)
Continuing operations and discontinued operationBasic 7.52 4.87Fully diluted 7.46 4.84
Continuing operationsBasic 7.46 4.88Fully diluted 7.40 4.85
See accompanying notes
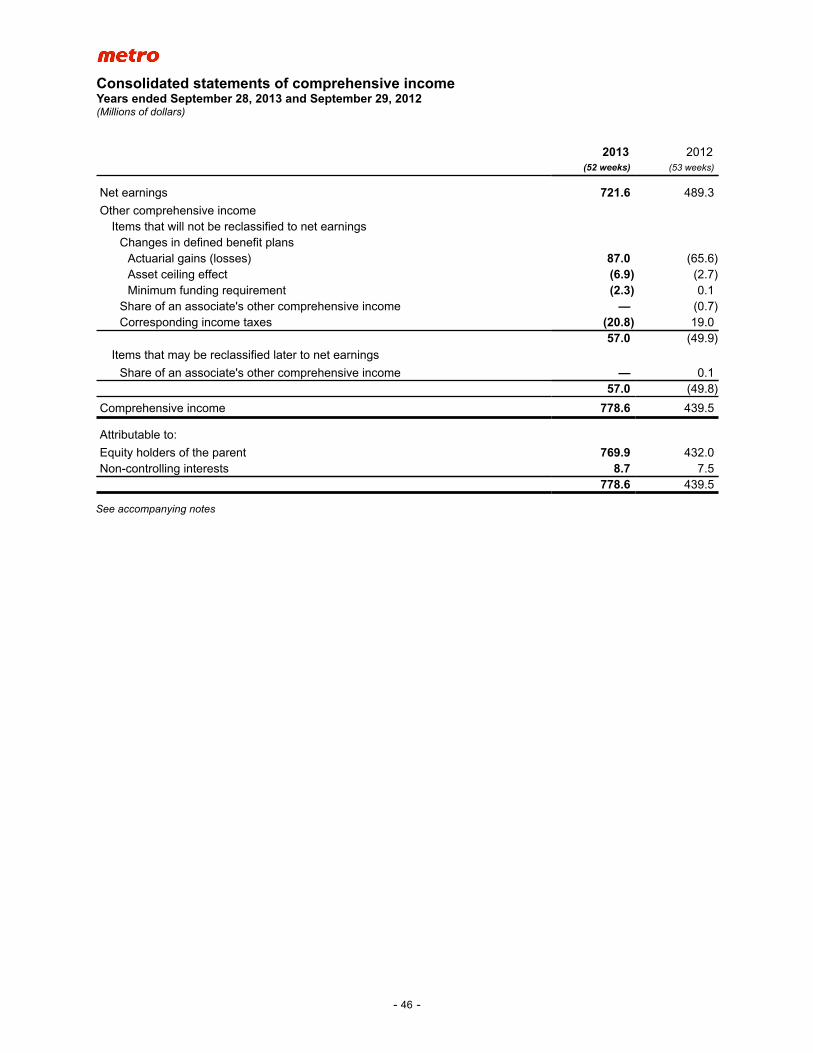
Consolidated statements of comprehensive incomeYears ended September 28, 2013 and September 29, 2012 (Millions of dollars)
- 46 -
2013 2012(52 weeks) (53 weeks)
Net earnings 721.6 489.3
Other comprehensive incomeItems that will not be reclassified to net earnings
Changes in defined benefit plansActuarial gains (losses) 87.0 (65.6)Asset ceiling effect (6.9) (2.7)Minimum funding requirement (2.3) 0.1
Share of an associate's other comprehensive income — (0.7)Corresponding income taxes (20.8) 19.0
57.0 (49.9)Items that may be reclassified later to net earnings
Share of an associate's other comprehensive income — 0.157.0 (49.8)
Comprehensive income 778.6 439.5
Attributable to:
Equity holders of the parent 769.9 432.0Non-controlling interests 8.7 7.5
778.6 439.5
See accompanying notes
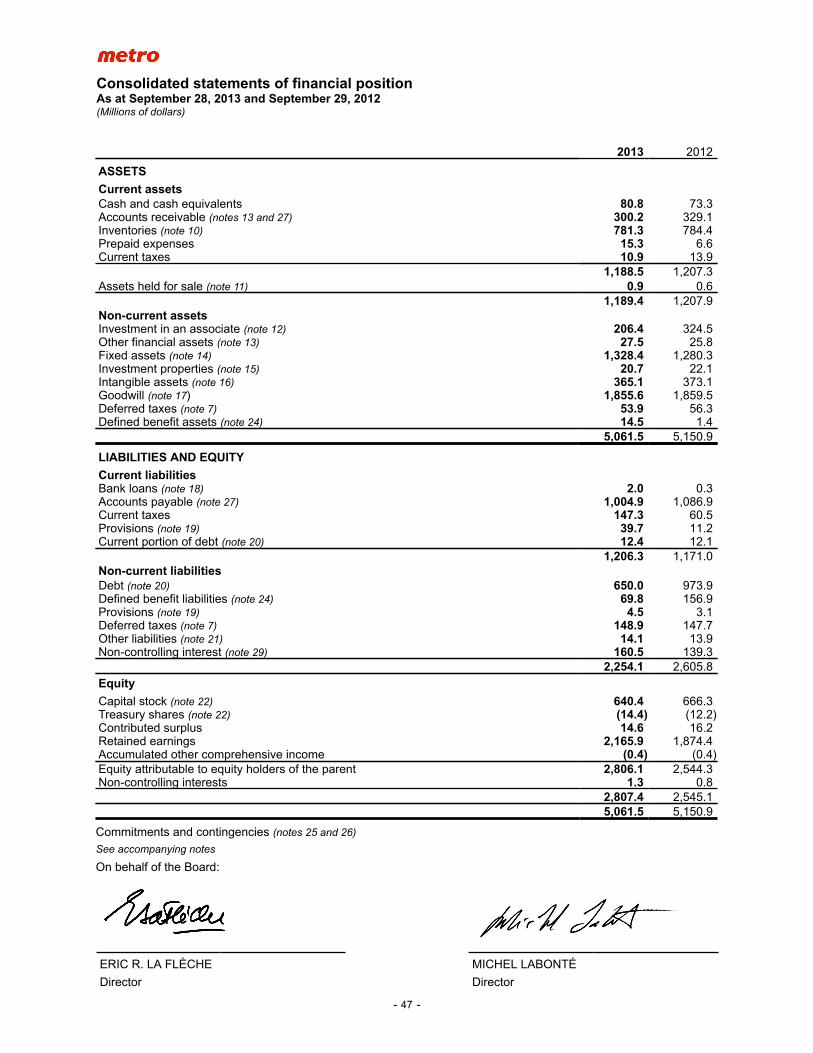
Consolidated statements of financial positionAs at September 28, 2013 and September 29, 2012 (Millions of dollars)
- 47 -
2013 2012
ASSETSCurrent assetsCash and cash equivalents 80.8 73.3Accounts receivable (notes 13 and 27) 300.2 329.1Inventories (note 10) 781.3 784.4Prepaid expenses 15.3 6.6Current taxes 10.9 13.9
1,188.5 1,207.3Assets held for sale (note 11) 0.9 0.6
1,189.4 1,207.9Non-current assetsInvestment in an associate (note 12) 206.4 324.5Other financial assets (note 13) 27.5 25.8Fixed assets (note 14) 1,328.4 1,280.3Investment properties (note 15) 20.7 22.1Intangible assets (note 16) 365.1 373.1Goodwill (note 17) 1,855.6 1,859.5Deferred taxes (note 7) 53.9 56.3Defined benefit assets (note 24) 14.5 1.4
5,061.5 5,150.9
LIABILITIES AND EQUITYCurrent liabilitiesBank loans (note 18) 2.0 0.3Accounts payable (note 27) 1,004.9 1,086.9Current taxes 147.3 60.5Provisions (note 19) 39.7 11.2Current portion of debt (note 20) 12.4 12.1
1,206.3 1,171.0Non-current liabilitiesDebt (note 20) 650.0 973.9Defined benefit liabilities (note 24) 69.8 156.9Provisions (note 19) 4.5 3.1Deferred taxes (note 7) 148.9 147.7Other liabilities (note 21) 14.1 13.9Non-controlling interest (note 29) 160.5 139.3
2,254.1 2,605.8EquityCapital stock (note 22) 640.4 666.3Treasury shares (note 22) (14.4) (12.2)Contributed surplus 14.6 16.2Retained earnings 2,165.9 1,874.4Accumulated other comprehensive income (0.4) (0.4)Equity attributable to equity holders of the parent 2,806.1 2,544.3Non-controlling interests 1.3 0.8
2,807.4 2,545.15,061.5 5,150.9
Commitments and contingencies (notes 25 and 26)See accompanying notes
On behalf of the Board:
ERIC R. LA FLÈCHE MICHEL LABONTÉ
Director Director
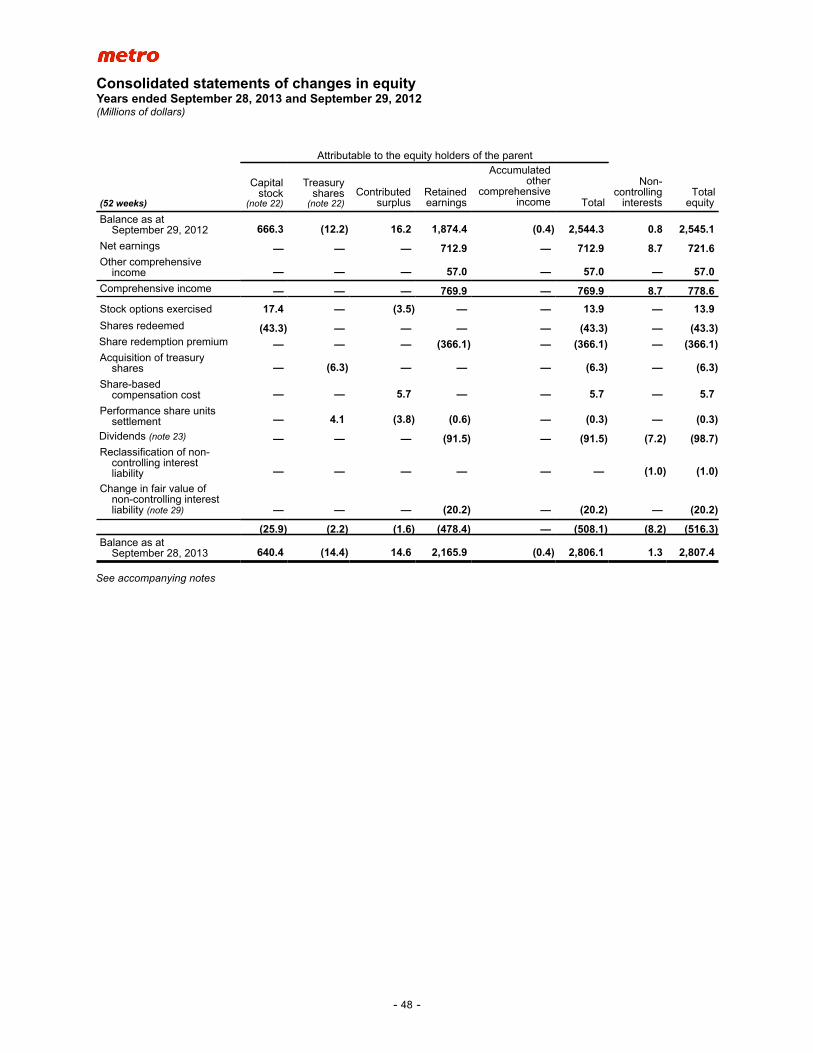
Consolidated statements of changes in equityYears ended September 28, 2013 and September 29, 2012(Millions of dollars)
- 48 -
Attributable to the equity holders of the parent
(52 weeks)
Capital stock
(note 22)
Treasury shares
(note 22)Contributed
surplusRetainedearnings
Accumulated other
comprehensive income Total
Non-controlling
interestsTotal
equity
Balance as atSeptember 29, 2012 666.3 (12.2) 16.2 1,874.4 (0.4) 2,544.3 0.8 2,545.1
Net earnings — — — 712.9 — 712.9 8.7 721.6Other comprehensive
income — — — 57.0 — 57.0 — 57.0Comprehensive income — — — 769.9 — 769.9 8.7 778.6Stock options exercised 17.4 — (3.5) — — 13.9 — 13.9Shares redeemed (43.3) — — — — (43.3) — (43.3)Share redemption premium — — — (366.1) — (366.1) — (366.1)Acquisition of treasury
shares — (6.3) — — — (6.3) — (6.3)Share-based
compensation cost — — 5.7 — — 5.7 — 5.7Performance share units
settlement — 4.1 (3.8) (0.6) — (0.3) — (0.3)Dividends (note 23) — — — (91.5) — (91.5) (7.2) (98.7)Reclassification of non-
controlling interestliability — — — — — — (1.0) (1.0)
Change in fair value of non-controlling interest liability (note 29) — — — (20.2) — (20.2) — (20.2)
(25.9) (2.2) (1.6) (478.4) — (508.1) (8.2) (516.3)Balance as at
September 28, 2013 640.4 (14.4) 14.6 2,165.9 (0.4) 2,806.1 1.3 2,807.4
See accompanying notes
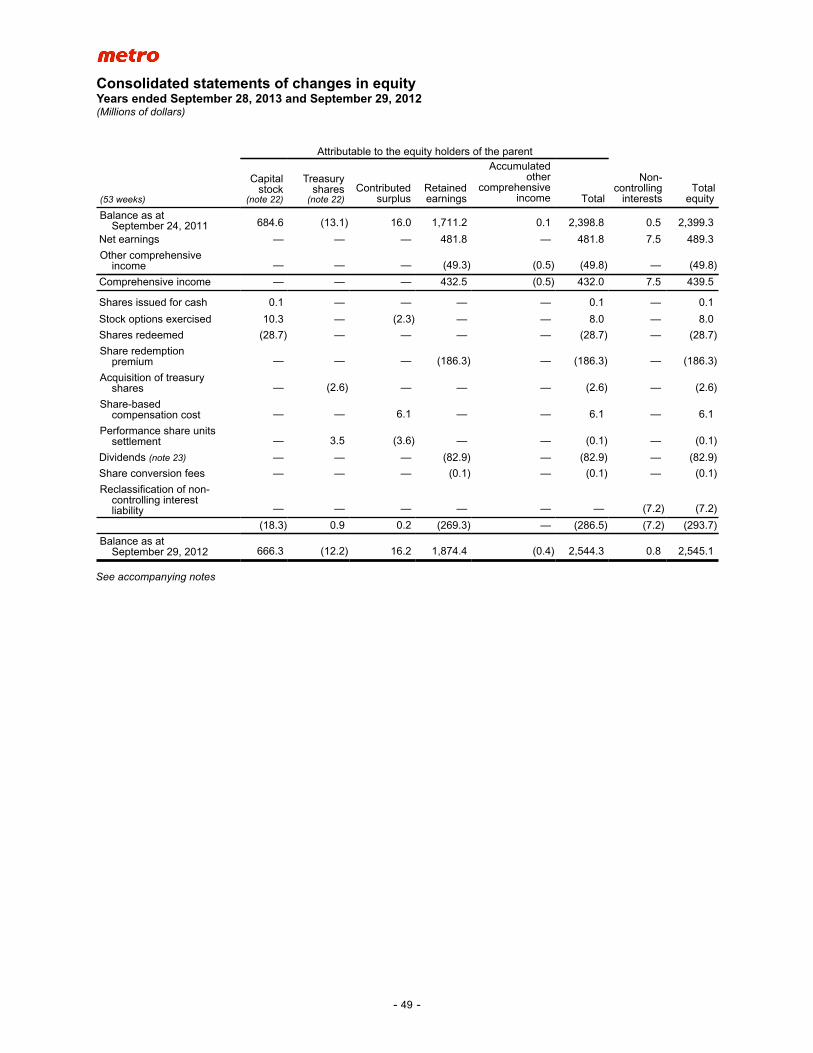
Consolidated statements of changes in equityYears ended September 28, 2013 and September 29, 2012(Millions of dollars)
- 49 -
Attributable to the equity holders of the parent
(53 weeks)
Capital stock
(note 22)
Treasury shares
(note 22)Contributed
surplusRetainedearnings
Accumulated other
comprehensive income Total
Non-controlling
interestsTotal
equity
Balance as atSeptember 24, 2011 684.6 (13.1) 16.0 1,711.2 0.1 2,398.8 0.5 2,399.3
Net earnings — — — 481.8 — 481.8 7.5 489.3
Other comprehensiveincome — — — (49.3) (0.5) (49.8) — (49.8)
Comprehensive income — — — 432.5 (0.5) 432.0 7.5 439.5
Shares issued for cash 0.1 — — — — 0.1 — 0.1
Stock options exercised 10.3 — (2.3) — — 8.0 — 8.0
Shares redeemed (28.7) — — — — (28.7) — (28.7)
Share redemptionpremium — — — (186.3) — (186.3) — (186.3)
Acquisition of treasuryshares — (2.6) — — — (2.6) — (2.6)
Share-basedcompensation cost — — 6.1 — — 6.1 — 6.1
Performance share unitssettlement — 3.5 (3.6) — — (0.1) — (0.1)
Dividends (note 23) — — — (82.9) — (82.9) — (82.9)
Share conversion fees — — — (0.1) — (0.1) — (0.1)
Reclassification of non-controlling interestliability — — — — — — (7.2) (7.2)
(18.3) 0.9 0.2 (269.3) — (286.5) (7.2) (293.7)
Balance as atSeptember 29, 2012 666.3 (12.2) 16.2 1,874.4 (0.4) 2,544.3 0.8 2,545.1
See accompanying notes
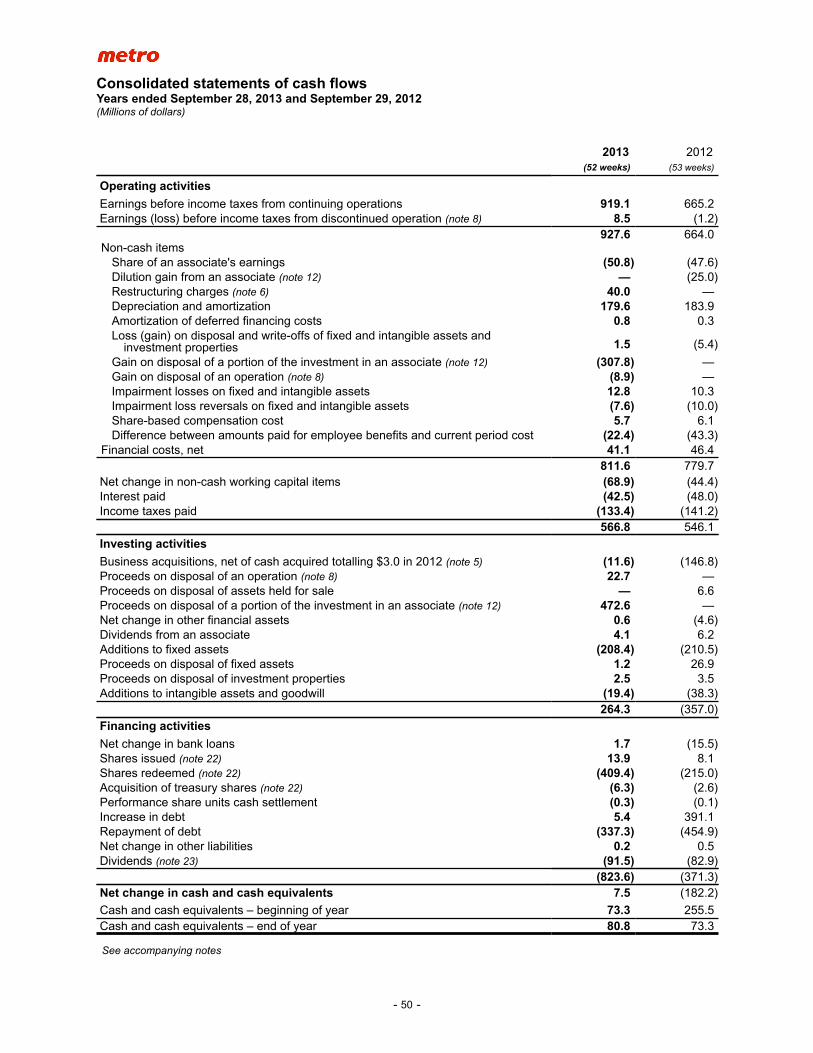
Consolidated statements of cash flowsYears ended September 28, 2013 and September 29, 2012(Millions of dollars)
- 50 -
2013 2012(52 weeks) (53 weeks)
Operating activitiesEarnings before income taxes from continuing operations 919.1 665.2Earnings (loss) before income taxes from discontinued operation (note 8) 8.5 (1.2)
927.6 664.0Non-cash items
Share of an associate's earnings (50.8) (47.6)Dilution gain from an associate (note 12) — (25.0)Restructuring charges (note 6) 40.0 —Depreciation and amortization 179.6 183.9Amortization of deferred financing costs 0.8 0.3Loss (gain) on disposal and write-offs of fixed and intangible assets and
investment properties 1.5 (5.4)
Gain on disposal of a portion of the investment in an associate (note 12) (307.8) —Gain on disposal of an operation (note 8) (8.9) —Impairment losses on fixed and intangible assets 12.8 10.3Impairment loss reversals on fixed and intangible assets (7.6) (10.0)Share-based compensation cost 5.7 6.1Difference between amounts paid for employee benefits and current period cost (22.4) (43.3)
Financial costs, net 41.1 46.4811.6 779.7
Net change in non-cash working capital items (68.9) (44.4)Interest paid (42.5) (48.0)Income taxes paid (133.4) (141.2)
566.8 546.1Investing activitiesBusiness acquisitions, net of cash acquired totalling $3.0 in 2012 (note 5) (11.6) (146.8)Proceeds on disposal of an operation (note 8) 22.7 —Proceeds on disposal of assets held for sale — 6.6Proceeds on disposal of a portion of the investment in an associate (note 12) 472.6 —Net change in other financial assets 0.6 (4.6)Dividends from an associate 4.1 6.2Additions to fixed assets (208.4) (210.5)Proceeds on disposal of fixed assets 1.2 26.9Proceeds on disposal of investment properties 2.5 3.5Additions to intangible assets and goodwill (19.4) (38.3)
264.3 (357.0)Financing activitiesNet change in bank loans 1.7 (15.5)Shares issued (note 22) 13.9 8.1Shares redeemed (note 22) (409.4) (215.0)Acquisition of treasury shares (note 22) (6.3) (2.6)Performance share units cash settlement (0.3) (0.1)Increase in debt 5.4 391.1Repayment of debt (337.3) (454.9)Net change in other liabilities 0.2 0.5Dividends (note 23) (91.5) (82.9)
(823.6) (371.3)Net change in cash and cash equivalents 7.5 (182.2)
Cash and cash equivalents – beginning of year 73.3 255.5Cash and cash equivalents – end of year 80.8 73.3
See accompanying notes
Notes to consolidated financial statementsSeptember 28, 2013 and September 29, 2012(Millions of dollars, unless otherwise indicated)
- 51 -
1. DESCRIPTION OF BUSINESSMETRO INC. (the Corporation) is a company incorporated under the laws of Québec. The Corporation is one of Canada’s leading food retailers and distributors and operates a network of supermarkets, discount stores and drugstores. Its head office is located at 11011 Maurice-Duplessis Blvd., Montréal, Québec, Canada, H1C 1V6. Its various components constitute a single operating segment.
2. SIGNIFICANT ACCOUNTING POLICIESThe consolidated financial statements, in Canadian dollars, have been prepared by management in accordance with International Financial Reporting Standards (IFRS) as issued by the International Accounting Standards Board (IASB). The consolidated financial statements have been prepared within the reasonable limits of materiality, on a historical cost basis, except for certain financial instruments measured at fair value. The significant accounting policies are summarized below:
ConsolidationThe consolidated financial statements include the accounts of the Corporation and its subsidiaries, as well as those of special purpose entities. All intercompany transactions and balances were eliminated on consolidation.
Sales recognitionSales come essentially from the sale of goods. Retail sales made by corporate stores and stores that are special purpose entities are recognized at the time of sale to the customer, and sales to affiliated stores and other customers when the goods are delivered. The rebates granted by the Corporation to its retailers are recorded as a reduction in sales.
Recognition of consideration from vendorsIn some cases, a cash consideration from vendors is considered as an adjustment to the vendor's product pricing and is therefore characterized as a reduction of cost of sales and related inventories when recognized in the consolidated financial statements. Certain exceptions apply if the cash consideration constitutes the reimbursement of incremental costs incurred by the Corporation to promote the vendor's products or a payment for assets or services delivered to vendors. This other consideration from vendors is accounted for, according to its nature, under sales or as a reduction of the cost of sales and operating expenses when receipt is considered likely and can be reasonably estimated.
Loyalty programsThe Corporation has two loyalty programs.
The first program, for which the Corporation acts as an agent, belongs to a third party and its cost is recorded as a reduction in sales at the time of sale to the customer.
The second program belongs to the Corporation. At the time of a sale to the customer, part of it is recorded in accounts payable as deferred revenue equal to the fair value of the program's issued points, as determined based on the exchange value of the points awarded and the expected redemption rate which are regularly remeasured, and recognized as sales when the points are redeemed.
Foreign currency translationThe consolidated financial statements are presented in Canadian dollars, the Corporation's functional currency. Transactions in foreign currencies are initially recorded at the functional currency rate prevailing at the date of the transaction. At each closing, monetary items denominated in foreign currency are translated using the exchange rate at the closing date. Non-monetary items that are measured at historical cost in foreign currency are translated using the exchange rate at the date of the transaction. Non-monetary items that are measured at fair value in foreign currency are translated using the exchange rate at the date when the fair value was determined. Gains or losses resulting from currency translations are recognized in net earnings.
Notes to consolidated financial statementsSeptember 28, 2013 and September 29, 2012(Millions of dollars, unless otherwise indicated)
- 52 -
Income taxesCurrent tax assets and liabilities for the current and prior years are measured at the amount expected to be recovered from or paid to the taxation authorities. The tax rates and tax laws used to determine these amounts are those that are enacted or substantively enacted by tax authorities by the closing date.
The Corporation follows the liability method of accounting for income taxes. Under this method, deferred tax assets and liabilities are accounted for based on estimated taxes recoverable or payable that would result from the recovery or settlement of the carrying amount of assets and liabilities. Deferred tax assets and liabilities are measured using substantively enacted tax rates expected to be in effect when the temporary differences are expected to reverse. Changes in these amounts are included in current net earnings in the period in which they occur. The carrying amount of deferred tax assets is reviewed at every closing date and reduced to the extent that it is no longer probable that sufficient earnings will be available to allow all or part of the deferred tax assets to be utilized.
Income tax relating to items recognized directly in equity is recognized in equity.
Share-based paymentA share-based compensation expense is recognized for the stock option and performance share unit (PSU) plans offered to certain employees.
Stock option awards vest gradually over the vesting term and each tranche is considered as a separate award. The value of the remuneration expense is calculated based on the fair value of the stock options at the option grant date and using the Black-Scholes valuation model. The compensation expense is recognized over the vesting term of each tranche.
The compensation expense for the PSU plan is determined based on the market value of the Corporation's Common Shares at grant date. Compensation expense is recognized on a straight-line basis over the vesting period. The impact of any changes in the number of PSUs is recorded in the period where the estimate is revised. The grant qualifies as an equity instrument.
Net earnings per shareBasic net earnings per share are calculated by dividing the net earnings attributable to equity holders of the parent by the weighted average number of Common Shares outstanding during the year. For the fully diluted net earnings per share, the net earnings attributable to equity holders of the parent and the weighted average number of Common Shares outstanding are adjusted to reflect all potential dilutive shares.
Cash and cash equivalentsCash and cash equivalents consist of cash on hand, bank balances, highly liquid investments (with an initial term of three months or less), outstanding deposits and cheques in transit. They are classified as “Financial assets at fair value through net earnings” and measured at fair value, with revaluation at the end of each period. Resulting gains or losses are recorded in net earnings.
Accounts receivableAccounts receivable and loans to certain customers are classified as “Loans and receivables”. After their initial fair value measurement, they are measured at amortized cost using the effective interest method. For the Corporation, the measured amount generally corresponds to cost.
InventoriesInventories are valued at the lower of cost and net realizable value. Warehouse inventories cost is determined by the average cost method net of certain considerations received from vendors. Retail inventories cost is valued at the retail price less the gross margin and certain considerations received from vendors. All costs incurred in bringing the inventories to their present location and condition are included in the cost of warehouse and retail inventories.
Notes to consolidated financial statementsSeptember 28, 2013 and September 29, 2012(Millions of dollars, unless otherwise indicated)
- 53 -
Assets held for saleNon-current assets are classified as assets held for sale if their carrying amount will be recovered principally through a sale transaction rather than through continuing use. For this to be the case, the sale must be highly probable, assets must be available for immediate sale in their present condition, and management must be committed to a plan to sell assets that should be expected to close within one year from the date of classification. Assets held for sale are recognized at the lower of their carrying amount and fair value less costs to sell. They are not depreciated.
Investment in an associateThe Corporation's investment in its associate is accounted for using the equity method. An associate is an entity in which the Corporation has significant influence.
Investment in a joint ventureThe Corporation has an interest in a joint venture, whereby the venturers have a contractual agreement that establishes joint control over the economic activities of the entity. This investment is accounted for using the equity method. The Corporation's share in the joint venture's earnings is recorded in the cost of sales and operating expenses. The financial information related to this investment is not material and is not presented separately.
Fixed assetsFixed assets are recorded at cost. Principal components of a fixed asset with different useful lives are depreciated separately. Buildings and equipment are depreciated on a straight-line basis over their useful lives. Leasehold improvements are depreciated on a straight-line basis over the shorter of their estimated useful lives or the remaining lease term. The depreciation method and estimate of useful lives are reviewed annually.
Buildings 20 to 50 years
Equipment 3 to 20 years
Leasehold improvements 5 to 20 years
LeasesLeases are classified as finance leases if substantially all risks and rewards incidental to ownership are transferred to the lessee. At the moment of initial recognition, the lessee records the leased item as an asset at the lower of the fair value of the asset and the present value of the minimum lease payments. A corresponding liability to the lessor is recorded in the consolidated statement of financial position as a finance lease obligation. In subsequent periods, the asset is depreciated on a straight-line basis over the term of the lease and interest on the obligation is expensed through net earnings.
Leases are classified as operating leases if substantially all risks and rewards incidental to ownership are not transferred to the lessee. The lease payments are recognized as an expense on a straight-line basis over the lease term.
Investment propertiesInvestment properties are held for capital appreciation and to earn rentals. They are not occupied by the owner for its ordinary activities. They are recognized at cost. Principal components, except for land which is not depreciated, are depreciated on a straight-line basis over their respective useful lives which vary from 20 to 50 years. The depreciation method and estimates of useful lives are reviewed annually.
Notes to consolidated financial statementsSeptember 28, 2013 and September 29, 2012(Millions of dollars, unless otherwise indicated)
- 54 -
Intangible assetsIntangible assets with finite useful lives are recorded at cost and amortized on a straight-line basis over their useful lives. The amortization method and estimates of useful lives are reviewed annually.
Leasehold rights 20 to 40 years
Software 3 to 10 years
Improvements and development of retail network loyalty 5 to 30 years
Prescription files 10 years
The banners that the Corporation intends to keep and operate, the private labels for which it continues to develop new products and the loyalty programs it intends to maintain qualify as intangible assets with indefinite useful lives. They are recorded at cost and not amortized.
GoodwillGoodwill is recognized at cost measured as the excess of purchase price over the fair value of the acquired enterprise's identifiable net assets at the date of acquisition. Goodwill is not amortized.
Impairment of non financial assetsAt each reporting date, the Corporation must determine if there is any indication of depreciation of its fixed assets, intangible assets with finite useful lives, investment properties and investment in an associate. If any indication exists, the Corporation has to test the assets for impairment. Impairment testing of intangible assets with indefinite useful lives and goodwill is to be done at least annually, regardless of any indication of depreciation.
Impairment testing is conducted at the level of the asset itself, a CGU or group of CGUs. A CGU is the smallest identifiable group of assets that generates cash inflows that are largely independent of the cash inflows from other assets or groups of assets. Each store is a separate CGU. Impairment testing of warehouses is conducted at the level of the different groups of CGUs. As for goodwill, certain private labels and support assets that cannot be allocated wholly to a single CGU, impairment testing is conducted at the level of the unique operating segment. Impairment testing of investment properties, investment in an associate, banners, certain private labels and loyalty programs is conducted at the level of the asset itself.
To test for impairment, the carrying amount of an asset, CGU or group of CGUs is compared with its recoverable amount. Generally, the recoverable amount is the higher of the value in use and the fair value less costs to sell. The value in use corresponds to the pre-tax cash flow projections from the management-approved budgets. These projections reflect past experience and are discounted at a pre-tax rate corresponding to the expected market rate for this type of investment. The recoverable amount of investment properties, investment in an associate, banners, certain private labels and loyalty programs is these assets' fair value less costs to sell. If the carrying amount exceeds the recoverable amount, an impairment loss in the amount of the excess is recognized in net earnings. CGU or group of CGUs' impairment losses are allocated pro rata to the assets of the CGU or group of CGUs, without however reducing the carrying amount of the assets below the highest of their fair value less costs to sell, their value in use, and zero.
Except for goodwill, any reversal of an impairment loss is recognized immediately in net earnings. A reversal of an impairment loss for a CGU or group of CGUs is allocated pro rata to the assets of the CGU or group of CGUs. The recoverable amount of an asset increased by a reversal of an impairment loss may not exceed the carrying amount that would have been determined, net of depreciation and amortization, if no impairment loss had been recognized for the asset in prior years.
Deferred financing costsFinancing costs related to debt are deferred and amortized using the effective interest method over the term of the corresponding loans. When one of these loans is repaid, the corresponding financing costs are charged to net earnings.
Employee benefitsEmployee benefits include short-term employee benefits which correspond to wages and fringe benefits and are recognized immediately in net earnings as are termination benefits which are also recorded as a liability when the Corporation is demonstrably committed to terminating the employment.
Notes to consolidated financial statementsSeptember 28, 2013 and September 29, 2012(Millions of dollars, unless otherwise indicated)
- 55 -
Employee benefits also include post-employment benefits which comprise pension benefits (both defined benefit and defined contribution plans) and ancillary benefits such as post-employment life and medical insurance. Employee benefits also comprise other long-term benefits, namely long-term disability benefits not covered by insurance plans and ancillary benefits provided to employees on long-term disability. Assets and obligations and related costs of employee defined benefit plans, ancillary retirement benefits and other long-term benefits plan are accounted for using the following accounting policies:
• Defined benefit obligations and the cost of pension, ancillary retirement benefits and other long-term benefits earned by participants are determined from actuarial calculations according to the projected credit unit method. The calculations are based on management's best assumptions relating to expected long-term return on plan assets, salary escalation, retirement age of participants and expected health care costs.
• For the purpose of calculating the estimated rate of return on plan assets, assets are measured at fair value.
• Defined benefit obligations are discounted using high-quality corporate bond yield rates with cash flows that match the timing and amount of expected benefit payments.
• Actuarial gains or losses arise from the difference between the effective yield of plan assets for a period and the expected yield on plan assets for that period, from changes in actuarial assumptions used to determine defined benefit obligations and from emerging experience that differs from the selected assumptions. Actuarial gains or losses relating to pension plans and ancillary retirement benefit plans are recognized under other comprehensive income in the period in which they occur. Actuarial gains or losses relating to other long-term employee benefits are recognized in full immediately in net earnings.
• Past service cost for vested benefits is recognized immediately in net earnings. For non-vested benefits, past service cost is amortized on a straight-line basis over the average remaining vesting period.
• Defined benefit plans assets or liabilities recognized in the consolidated statement of financial position correspond to the difference between the present value of defined benefit obligations and the fair value of plan assets. In the case of a surplus funded plan, these assets are limited at the lesser of the actuarial value determined for accounting purposes or the value of the future economic benefit by way of surplus refunds or contribution holidays. Furthermore, an additional liability could be recorded when minimum funding requirements for past services exceed economic benefits available. The asset ceiling effect and minimum funding requirement are recognized under other comprehensive income in the period in which they occur.
Defined contribution plans costs, including those of multi-employer plans, are recorded when the contributions are due. As sufficient information to reliably determine multi-employer defined benefit plan obligations and assets is not available and as there is no actuarial valuation according to IFRS, these plans are accounted for as defined contribution plans.
ProvisionsProvisions are recognized when the Corporation has a present obligation (legal or constructive) resulting from a past event and will likely have to settle the obligation, the amount of which can be reliably estimated. The amount recognized as provision is the best estimate of the expense required to settle the present obligation at the closing date. When a provision is measured based on estimated cash flows required to settle the present obligation, its carrying amount is the discounted value of these cash flows.
Present obligations resulting from onerous contracts are accounted for and measured as provisions. A contract is said to be onerous when the costs involved in fulfilling the terms and conditions of the contract are higher than the contract's expected economic benefits.
Other financial liabilitiesBank loans, accounts payable, credit facility, notes and loans payable are classified as “Other financial liabilities”. After their initial fair value measurement, they are measured at amortized cost using the effective interest method. For the Corporation, the measured amount generally corresponds to cost.
Non-controlling interestsNon-controlling interests are usually recognized in equity. However, with respect to the interests in Adonis et Phoenicia, the Corporation has a call option on their minority shareholder’s interest and the minority shareholder has a put option to sell its interest in the two entities to the Corporation under certain conditions at the date the options become exercisable. Given these options, the non-controlling interest is a financial liability. It is classified as "Financial liabilities held for trading" and measured at fair value with gains or losses resulting from the revaluation at the end of each period recorded in net earnings or in retained earnings. The Corporation elected to record them in retained earnings.
Notes to consolidated financial statementsSeptember 28, 2013 and September 29, 2012(Millions of dollars, unless otherwise indicated)
- 56 -
Derivative financial instrumentsIn accordance with its risk management strategy, the Corporation uses derivative financial instruments for hedging purposes. On inception of a hedging relationship, the Corporation indicates whether or not it will apply hedge accounting to the relationship. Should there be any, the Corporation formally documents several factors, such as the election to apply hedge accounting, the hedged item, the hedging item, the risks being hedged and the term over which the relationship is expected to be effective, as well as risk management objectives and strategy.
The effectiveness of the hedging relationship is measured at its inception to determine whether it will be highly effective over the term of the relationship and assessed periodically to ensure that hedge accounting is still appropriate. The results of these assessments are formally documented.
The Corporation uses foreign exchange forward contracts to hedge against foreign exchange rate fluctuations in respect of future foreign-denominated purchases of goods and services. Given their short-term maturity, the Corporation elected not to apply hedge accounting to its foreign exchange forward contracts. These derivative financial instruments are classified as "Financial assets or liabilities at fair value through net earnings" and measured at fair value with revaluation at the end of each period. Resulting gains or losses are recorded in net earnings.
Fiscal yearThe Corporation's fiscal year ends on the last Saturday of September. The fiscal year ended September 28, 2013 included 52 weeks of operations and the fiscal year ended September 29, 2012 included 53 weeks of operations.
3. NEW ACCOUNTING POLICIESADOPTED IN 2013
Presentation of financial statements In June 2011, the IASB issued amendments to IAS 1 “Presentation of Financial Statements”. Items of other comprehensive income and the corresponding tax expense are required to be grouped into those that will and will not subsequently be reclassified through net earnings. The Corporation has applied these amendments in its fiscal 2013 annual financial statements. Additional information was disclosed in the consolidated statement of comprehensive income.
RECENTLY ISSUED
Classification and measurement of financial assets and financial liabilities In November 2009, the IASB issued IFRS 9 “Financial Instruments”. This new standard replaces the various rules of IAS 39 “Financial Instruments: Recognition and Measurement” with a single approach to determine whether a financial asset is measured at amortized cost or fair value. This approach is based on how an entity manages its financial instruments and the contractual cash flow characteristics of the financial assets.
In October 2010, the IASB issued revisions to IFRS 9, adding the requirements for classification and measurement of financial liabilities contained in IAS 39.
In December 2011, the IASB deferred the mandatory effective date of IFRS 9 to fiscal years beginning on or after January 1, 2015. Early adoption is permitted under certain conditions. The Corporation will not adopt this new standard early and will, over the next fiscal year, assess the impact of IFRS 9 on its financial statements.
Offsetting financial assets and financial liabilities In December 2011, the IASB issued amendments to IAS 32 “Financial Instruments: Presentation” clarifying the requirements for offsetting financial assets and financial liabilities. The IASB specified that the right of set-off had to be legally enforceable even in the event of bankruptcy.
Notes to consolidated financial statementsSeptember 28, 2013 and September 29, 2012(Millions of dollars, unless otherwise indicated)
- 57 -
The IASB also issued amendments to IFRS 7 “Financial Instruments: Disclosures” improving disclosures on offsetting of financial assets and financial liabilities.
The amendments to IFRS 7 are applicable to the first quarter of the Corporation's 2014 fiscal year. The amendments to IAS 32 are applicable to the first quarter of fiscal 2015. In order to co-ordinate the two standards' application, the Corporation will early adopt IAS 32 in the first quarter of its 2014 fiscal year. These amendments will not impact the Corporation's financial statements, but additional information will be disclosed through notes to financial statements.
Consolidated financial statements In May 2011, the IASB issued IFRS 10 “Consolidated Financial Statements” which is a replacement of SIC-12 “Consolidation - Special Interest Entities” and certain parts of IAS 27 “Consolidated and Separate Financial Statements”. IFRS 10 eliminates the risk/benefit-based approach and uses control as the sole basis for consolidation. An investor controls an investee if and only if the investor has all of the following elements: a) power over the investee; b) exposure or rights to variable returns from involvement with the investee; c) the ability to use power over the investee to affect the amount of the investor's returns.
The Corporation will apply IFRS 10 as of the first quarter of its 2014 fiscal year. This standard will not impact the Corporation's financial statements.
Joint arrangements In May 2011, the IASB issued IFRS 11 “Joint Arrangements” which supersedes IAS 31 “Interests in Joint Ventures” and SIC-13 “Jointly Controlled Entities - Non-Monetary Contributions by Venturers”. This standard describes two types of joint arrangements which differ according to the rights and obligations of the partners: joint operations and joint ventures. IFRS 11 eliminates the proportionate consolidation method for joint ventures and requires the equity method. However, proportionate consolidation is maintained for joint operations. The Corporation will apply IFRS 11 as of the first quarter of its 2014 fiscal year. This standard will not impact the Corporation's financial statements.
Disclosure of interests in other entities In May 2011, the IASB issued IFRS 12 “Disclosure of Interests in Other Entities” which requires that an entity disclose more information on the nature of and risks associated with its interests in other entities (i.e. subsidiaries, joint arrangements, associates or unconsolidated structured entities) and the effects of those interests on its financial statements. The Corporation will apply IFRS 12 as of the first quarter of its 2014 fiscal year. Additional information will be disclosed through notes to the annual financial statements.
Fair value measurement In May 2011, the IASB issued IFRS 13 “Fair Value Measurement” to establish a single framework for fair value measurement of financial and non-financial items. IFRS 13 defines fair value as the price that would be received to sell an asset or paid to transfer a liability in an orderly transaction between market participants at the measurement date. It also requires disclosure of more information on fair value measurements. The Corporation will apply IFRS 13 as of the first quarter of its 2014 fiscal year. This standard will not impact the Corporation's financial statements, but additional information will be disclosed through notes to financial statements.
Employee benefits In June 2011, the IASB issued amendments to IAS 19 “Employee Benefits” (IAS 19R). IAS 19R eliminates the corridor method for recognizing changes (actuarial gains and losses) in defined benefit obligations and plan assets and requires that they be recognized in other comprehensive income when they occur. Application of this amendment will have no impact, as the Corporation has used immediate recognition of actuarial gains and losses in other comprehensive income since the transition to IFRS.
IAS 19R eliminates the possibility of deferring recognition of past service costs related to unvested benefits and requires their immediate recognition in the income statement. Application of this amendment will have no impact for the Corporation, as no past service costs have been deferred since the transition to IFRS.
Notes to consolidated financial statementsSeptember 28, 2013 and September 29, 2012(Millions of dollars, unless otherwise indicated)
- 58 -
Under IAS 19, the employee benefit expense included a financial cost composed of interest income corresponding to the expected return on plan assets measured according to management assumptions based on market expectations. IAS 19R eliminates the expected return on plan assets component and requires recognition of net interest on defined benefit obligations net of plan assets based on the discount rate for measuring obligations. This net interest is not a component of the employee benefit expense and will be presented as part of finance costs. The Corporation expects this amendment to increase annual employee benefit expenses by about $15 and annual financial costs by about $10.The Corporation will apply these amendments as of the first quarter of its 2014 fiscal year.
IAS 19R also requires additional disclosures to present the characteristics of defined benefit plans to the annual financial statements. Impairment of assets In May 2013, the IASB issued amendments to IAS 36 “Impairment of Assets” to require disclosures about assets or cash generating units for which an impairment loss was recognized or reversed during the period. The Corporation will apply the amendments to IAS 36 along with the new IFRS 13 requirements as of the first quarter of its 2014 fiscal year. Additional information will be disclosed through notes to financial statements.
4. SIGNIFICANT JUDGEMENTS AND ESTIMATESThe preparation of the consolidated financial statements requires management to make judgements, estimates and assumptions that affect the recognition and valuation of assets, liabilities, sales, other income and expenses. These estimates and assumptions are based on historical experience and other factors deemed relevant and reasonable and are reviewed at every closing date. The use of different estimates could produce different amounts in the consolidated financial statements. Actual results may differ from these estimates.
JUDGEMENTS In applying the Corporation's accounting policies, management has made the following judgements, which have the most significant effect on the amounts recognized in the consolidated financial statements:
Consolidation of special purpose entities The Corporation has no voting rights in certain food stores. However, it assumes the majority of their risks and benefits from the majority of their advantages. For these reasons, the Corporation consolidates these food stores in its financial statements.
The Corporation has no voting rights in the trust created for PSU plan participants. However, under the trust agreement, it instructs the trustee as to the sale and purchase of Corporation shares and payments to beneficiaries, gives the trustee money to buy Corporation shares, assumes the majority of the risks, benefits from the majority of the advantages, and ensures that the trust holds a sufficient number of shares to meet its obligations to the beneficiaries. Management, having concluded that the Corporation controls the trust, consolidates the entity in its financial statements.
The Corporation also has an agreement with a distributor, whose majority of risks it assumes and whose majority of advantages it benefits from. For these reasons, the Corporation consolidates this distributor in its financial statements.
ESTIMATES The assumptions concerning the future and other key sources of estimation uncertainty at the reporting date, that have a significant risk of causing a material adjustment to the value of assets and liabilities within the next period, are discussed below:
Impairment of assets In testing for impairment of intangible assets with indefinite useful lives and goodwill, value in use and fair value less costs to sell are estimated using the discounted future cash flows model, the capitalized excess earnings before financial costs and taxes (EBIT) and royalty-free licence methods. These methods are based on various assumptions, such as the future cash flows estimate, excess EBIT, royalty rates, discount rate, earnings multiples and growth rate. The key assumptions are disclosed in notes 16 and 17.
Notes to consolidated financial statementsSeptember 28, 2013 and September 29, 2012(Millions of dollars, unless otherwise indicated)
- 59 -
Pension plans and other plans Defined pension plans, ancillary retirements and other long-term benefits obligations and costs associated to these obligations are determined from actuarial calculations according to the projected credit unit method. These calculations are based on management's best assumptions relating to expected long-term return on plan assets, salary escalation, retirement age of participants and expected health care costs. The key assumptions are disclosed in note 24.
Non-controlling interest The non-controlling interest-related liability is calculated in relation to the price to be paid by the Corporation for the non-controlling interest, which price is based mainly on the future earnings of Adonis and Phoenicia at the date the options become exercisable. Given the uncertainty associated with the estimation of these future earnings, the Corporation used, at the end of the current fiscal year, its most probable estimate and various other assumptions, including the discount rate, growth rate and capital investments. Additional information is presented in note 29.
5. BUSINESS ACQUISITIONSOn October 23, 2011, the Corporation acquired 55% of the net assets of Adonis, a Montréal-area retailer with four existing stores and a fifth one under construction that was opened in December 2011, as well as Phoenicia, an importer and wholesaler with a distribution centre in Montréal and another in the Greater Toronto Area. These businesses specialize in perishable and ethnic food products. The final purchase price paid by the Corporation for the 55% interest was $161.4, the remaining balance of $11.6 as at September 29, 2012 has been paid during the first quarter of 2013. The acquisition was accounted for using the purchase method. The Corporation controls the acquired businesses and consolidated their earnings as of the date of acquisition. The final total purchase price allocation was as follows:
Net assets acquired at their fair valueCash 3.0Accounts receivable 10.6Inventories 24.3Prepaid expenses 0.5Fixed assets 11.9Intangible assets
Finite useful life 10.7Indefinite useful life 63.4
Goodwill 206.8Bank loans (15.5)Accounts payable (5.4)Debt (10.4)Deferred tax liabilities (6.4)
293.5
Cash consideration for the Corporation's interest (55%) 161.4Non-controlling interest (45%) (note 29) 132.1
293.5
The non-controlling interest was measured at 45% of the fair value of the acquired companies' net assets.
The goodwill from the acquisition corresponds to the growth potential of Adonis stores and the broadening of the Corporation’s customer base through improvement of the ethnic food offering in all its stores. In the goodwill’s tax treatment, 53% of the goodwill is treated as an eligible capital property with related tax deductions and 47% as non-deductible.
Between October 23, 2011 and September 29, 2012, the acquired businesses have increased Corporation sales and net earnings by $236.6 and $16.0 respectively. If the acquisition had taken place at the beginning of the year, the acquired businesses would have increased Corporation sales and net earnings by an additional amount of $16.5 and $1.1 respectively for the year ended September 29, 2012.
In fiscal 2012, acquisition-related costs of $1.1 were recorded in cost of sales and operating expenses.
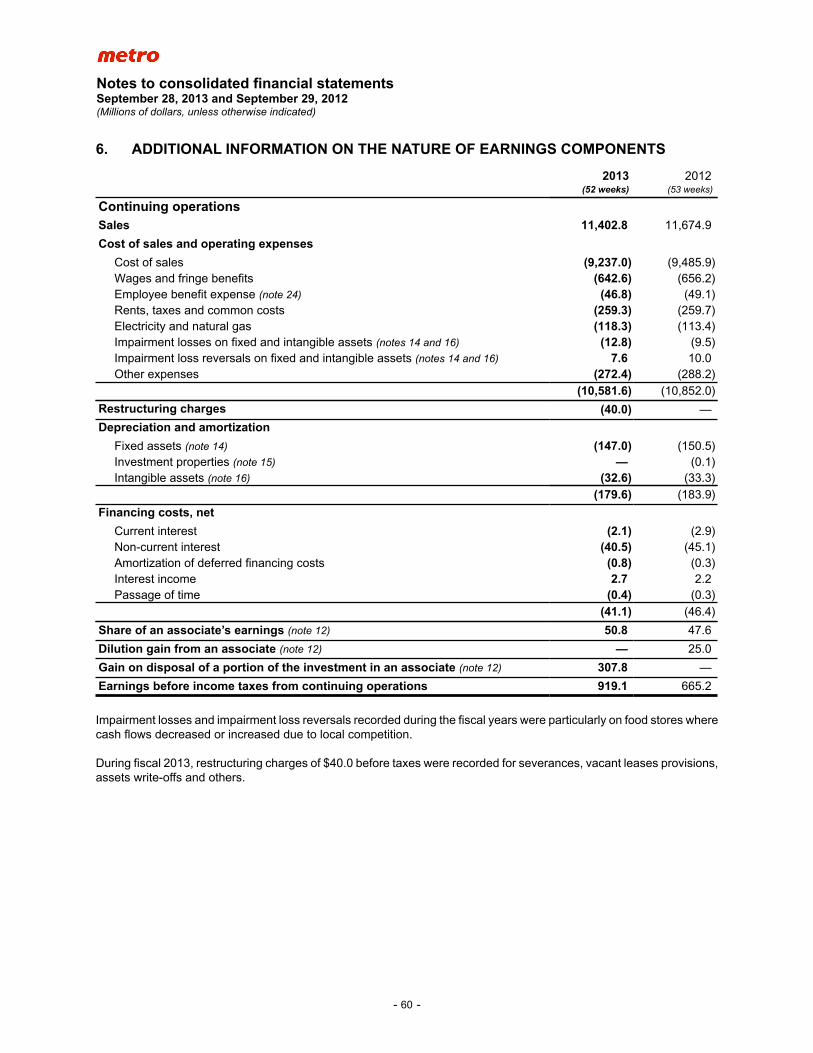
Notes to consolidated financial statementsSeptember 28, 2013 and September 29, 2012(Millions of dollars, unless otherwise indicated)
- 60 -
6. ADDITIONAL INFORMATION ON THE NATURE OF EARNINGS COMPONENTS
2013 2012(52 weeks) (53 weeks)
Continuing operationsSales 11,402.8 11,674.9
Cost of sales and operating expensesCost of sales (9,237.0) (9,485.9)Wages and fringe benefits (642.6) (656.2)Employee benefit expense (note 24) (46.8) (49.1)Rents, taxes and common costs (259.3) (259.7)Electricity and natural gas (118.3) (113.4)Impairment losses on fixed and intangible assets (notes 14 and 16) (12.8) (9.5)Impairment loss reversals on fixed and intangible assets (notes 14 and 16) 7.6 10.0Other expenses (272.4) (288.2)
(10,581.6) (10,852.0)
Restructuring charges (40.0) —
Depreciation and amortizationFixed assets (note 14) (147.0) (150.5)Investment properties (note 15) — (0.1)Intangible assets (note 16) (32.6) (33.3)
(179.6) (183.9)
Financing costs, netCurrent interest (2.1) (2.9)Non-current interest (40.5) (45.1)Amortization of deferred financing costs (0.8) (0.3)Interest income 2.7 2.2Passage of time (0.4) (0.3)
(41.1) (46.4)
Share of an associate’s earnings (note 12) 50.8 47.6
Dilution gain from an associate (note 12) — 25.0
Gain on disposal of a portion of the investment in an associate (note 12) 307.8 —
Earnings before income taxes from continuing operations 919.1 665.2
Impairment losses and impairment loss reversals recorded during the fiscal years were particularly on food stores where cash flows decreased or increased due to local competition.
During fiscal 2013, restructuring charges of $40.0 before taxes were recorded for severances, vacant leases provisions, assets write-offs and others.
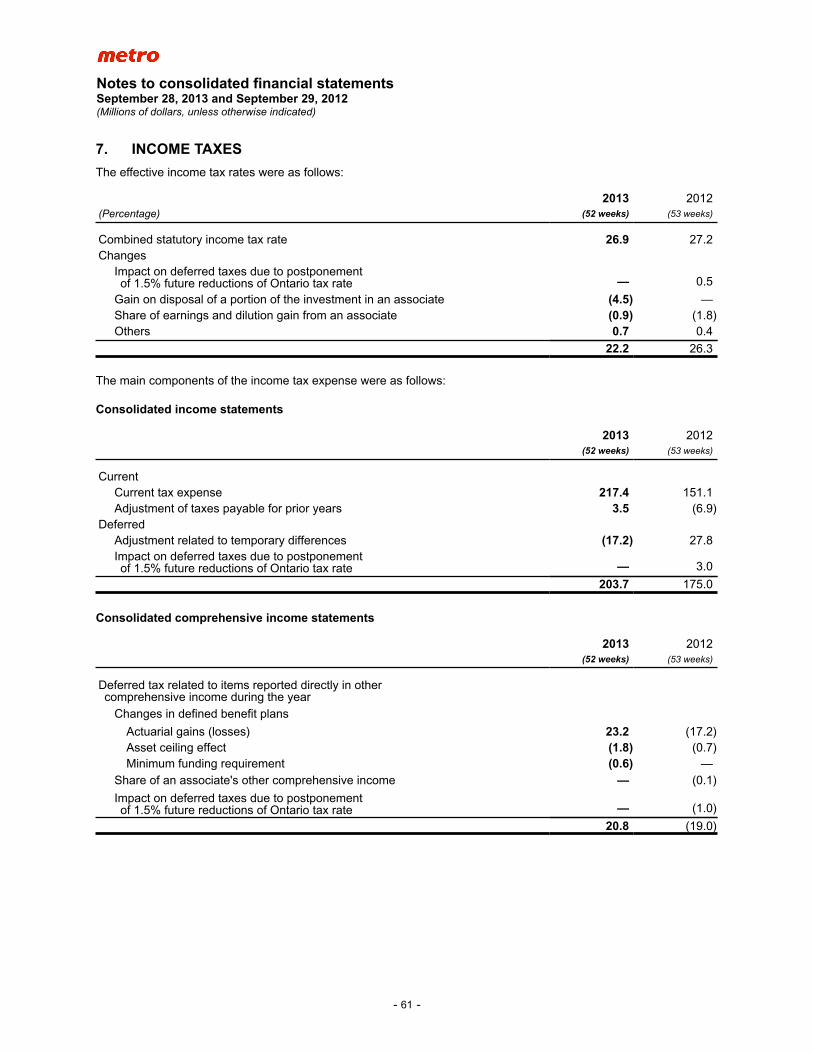
Notes to consolidated financial statementsSeptember 28, 2013 and September 29, 2012(Millions of dollars, unless otherwise indicated)
- 61 -
7. INCOME TAXESThe effective income tax rates were as follows:
2013 2012(Percentage) (52 weeks) (53 weeks)
Combined statutory income tax rate 26.9 27.2Changes
Impact on deferred taxes due to postponement of 1.5% future reductions of Ontario tax rate — 0.5
Gain on disposal of a portion of the investment in an associate (4.5) —Share of earnings and dilution gain from an associate (0.9) (1.8)Others 0.7 0.4
22.2 26.3
The main components of the income tax expense were as follows:
Consolidated income statements
2013 2012(52 weeks) (53 weeks)
CurrentCurrent tax expense 217.4 151.1Adjustment of taxes payable for prior years 3.5 (6.9)
DeferredAdjustment related to temporary differences (17.2) 27.8Impact on deferred taxes due to postponement of 1.5% future reductions of Ontario tax rate — 3.0
203.7 175.0
Consolidated comprehensive income statements
2013 2012(52 weeks) (53 weeks)
Deferred tax related to items reported directly in other comprehensive income during the year
Changes in defined benefit plans
Actuarial gains (losses) 23.2 (17.2)Asset ceiling effect (1.8) (0.7)Minimum funding requirement (0.6) —
Share of an associate's other comprehensive income — (0.1)
Impact on deferred taxes due to postponement of 1.5% future reductions of Ontario tax rate — (1.0)
20.8 (19.0)
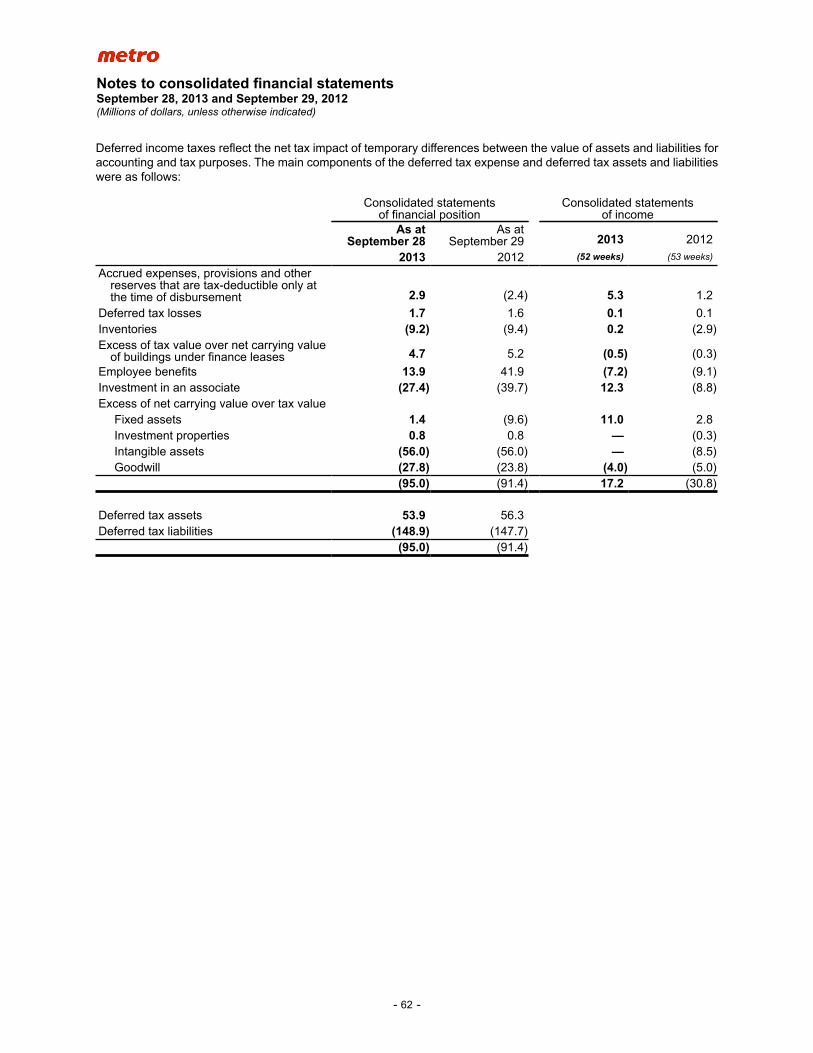
Notes to consolidated financial statementsSeptember 28, 2013 and September 29, 2012(Millions of dollars, unless otherwise indicated)
- 62 -
Deferred income taxes reflect the net tax impact of temporary differences between the value of assets and liabilities for accounting and tax purposes. The main components of the deferred tax expense and deferred tax assets and liabilities were as follows:
Consolidated statements of financial position
Consolidated statements of income
As at September 28
As at September 29 2013 2012
2013 2012 (52 weeks) (53 weeks)
Accrued expenses, provisions and otherreserves that are tax-deductible only atthe time of disbursement 2.9 (2.4) 5.3 1.2
Deferred tax losses 1.7 1.6 0.1 0.1Inventories (9.2) (9.4) 0.2 (2.9)Excess of tax value over net carrying value
of buildings under finance leases 4.7 5.2 (0.5) (0.3)
Employee benefits 13.9 41.9 (7.2) (9.1)Investment in an associate (27.4) (39.7) 12.3 (8.8)Excess of net carrying value over tax value
Fixed assets 1.4 (9.6) 11.0 2.8Investment properties 0.8 0.8 — (0.3)Intangible assets (56.0) (56.0) — (8.5)Goodwill (27.8) (23.8) (4.0) (5.0)
(95.0) (91.4) 17.2 (30.8)
Deferred tax assets 53.9 56.3Deferred tax liabilities (148.9) (147.7)
(95.0) (91.4)
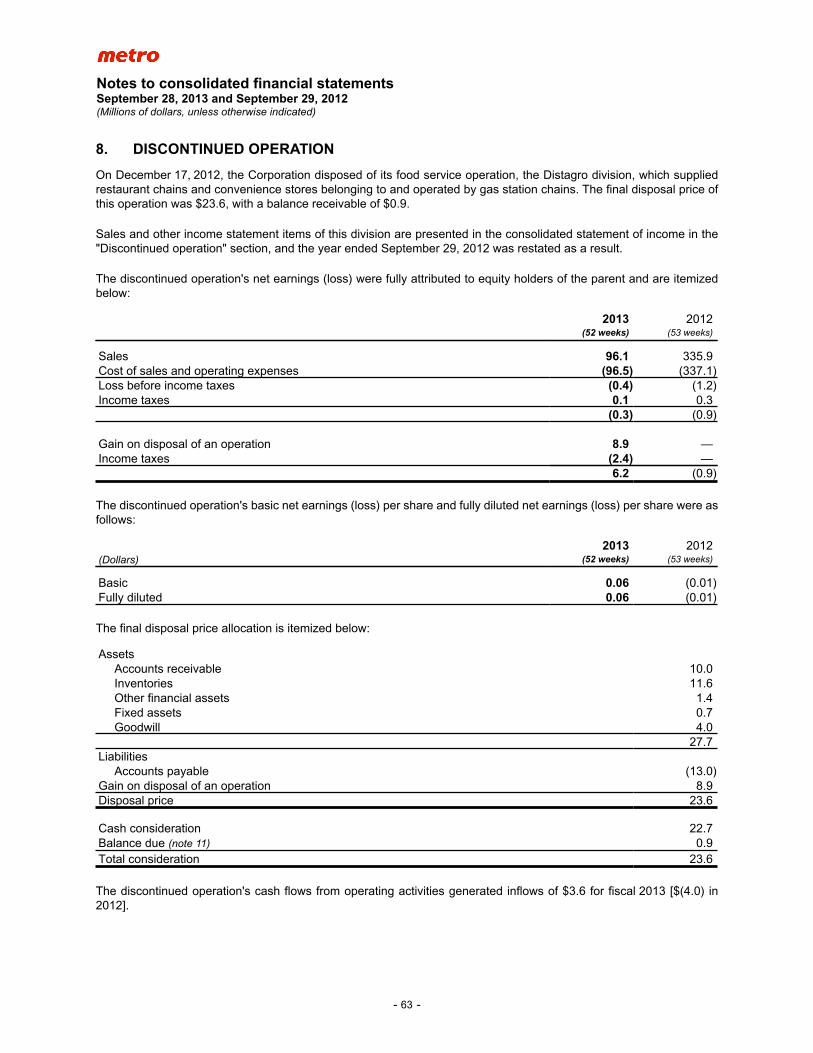
Notes to consolidated financial statementsSeptember 28, 2013 and September 29, 2012(Millions of dollars, unless otherwise indicated)
- 63 -
8. DISCONTINUED OPERATIONOn December 17, 2012, the Corporation disposed of its food service operation, the Distagro division, which supplied restaurant chains and convenience stores belonging to and operated by gas station chains. The final disposal price of this operation was $23.6, with a balance receivable of $0.9.
Sales and other income statement items of this division are presented in the consolidated statement of income in the "Discontinued operation" section, and the year ended September 29, 2012 was restated as a result.
The discontinued operation's net earnings (loss) were fully attributed to equity holders of the parent and are itemized below:
2013 2012(52 weeks) (53 weeks)
Sales 96.1 335.9Cost of sales and operating expenses (96.5) (337.1)Loss before income taxes (0.4) (1.2)Income taxes 0.1 0.3
(0.3) (0.9)
Gain on disposal of an operation 8.9 —Income taxes (2.4) —
6.2 (0.9)
The discontinued operation's basic net earnings (loss) per share and fully diluted net earnings (loss) per share were as follows:
2013 2012(Dollars) (52 weeks) (53 weeks)
Basic 0.06 (0.01)Fully diluted 0.06 (0.01)
The final disposal price allocation is itemized below:
AssetsAccounts receivable 10.0Inventories 11.6Other financial assets 1.4Fixed assets 0.7Goodwill 4.0
27.7Liabilities
Accounts payable (13.0)Gain on disposal of an operation 8.9Disposal price 23.6
Cash consideration 22.7Balance due (note 11) 0.9Total consideration 23.6
The discontinued operation's cash flows from operating activities generated inflows of $3.6 for fiscal 2013 [$(4.0) in 2012].
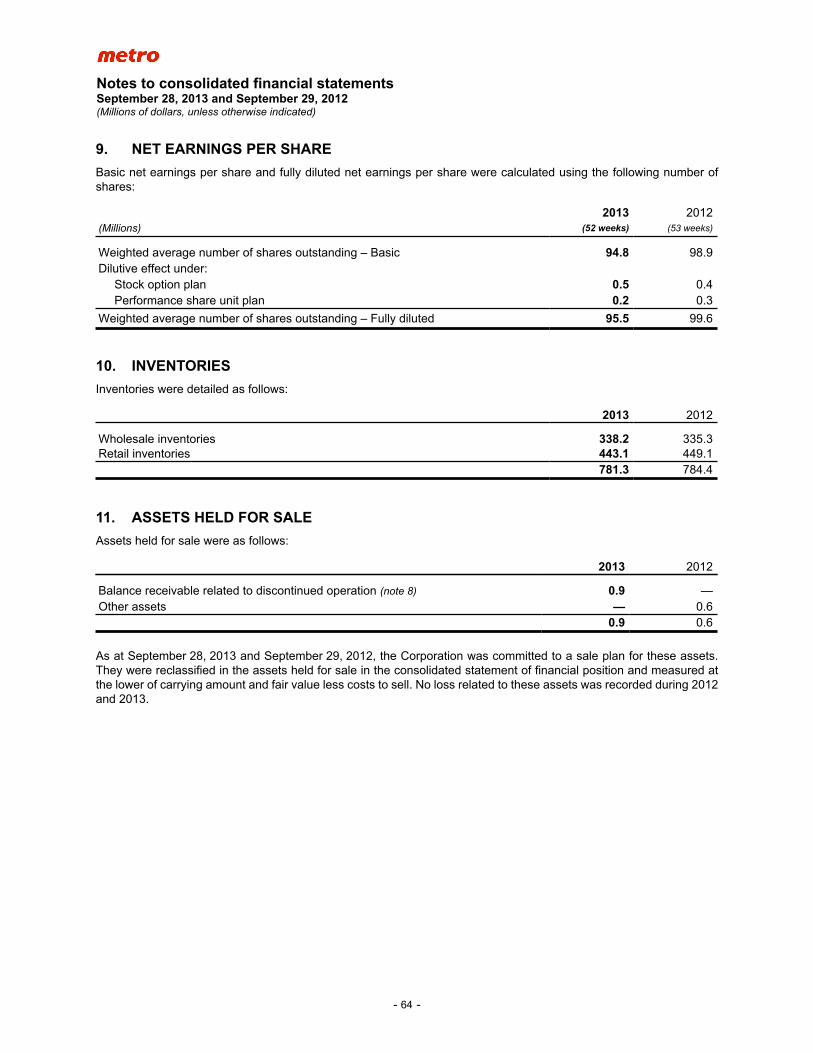
Notes to consolidated financial statementsSeptember 28, 2013 and September 29, 2012(Millions of dollars, unless otherwise indicated)
- 64 -
9. NET EARNINGS PER SHAREBasic net earnings per share and fully diluted net earnings per share were calculated using the following number of shares:
2013 2012(Millions) (52 weeks) (53 weeks)
Weighted average number of shares outstanding – Basic 94.8 98.9Dilutive effect under:
Stock option plan 0.5 0.4Performance share unit plan 0.2 0.3
Weighted average number of shares outstanding – Fully diluted 95.5 99.6
10. INVENTORIESInventories were detailed as follows:
2013 2012
Wholesale inventories 338.2 335.3Retail inventories 443.1 449.1
781.3 784.4
11. ASSETS HELD FOR SALEAssets held for sale were as follows:
2013 2012
Balance receivable related to discontinued operation (note 8) 0.9 —Other assets — 0.6
0.9 0.6
As at September 28, 2013 and September 29, 2012, the Corporation was committed to a sale plan for these assets. They were reclassified in the assets held for sale in the consolidated statement of financial position and measured at the lower of carrying amount and fair value less costs to sell. No loss related to these assets was recorded during 2012 and 2013.
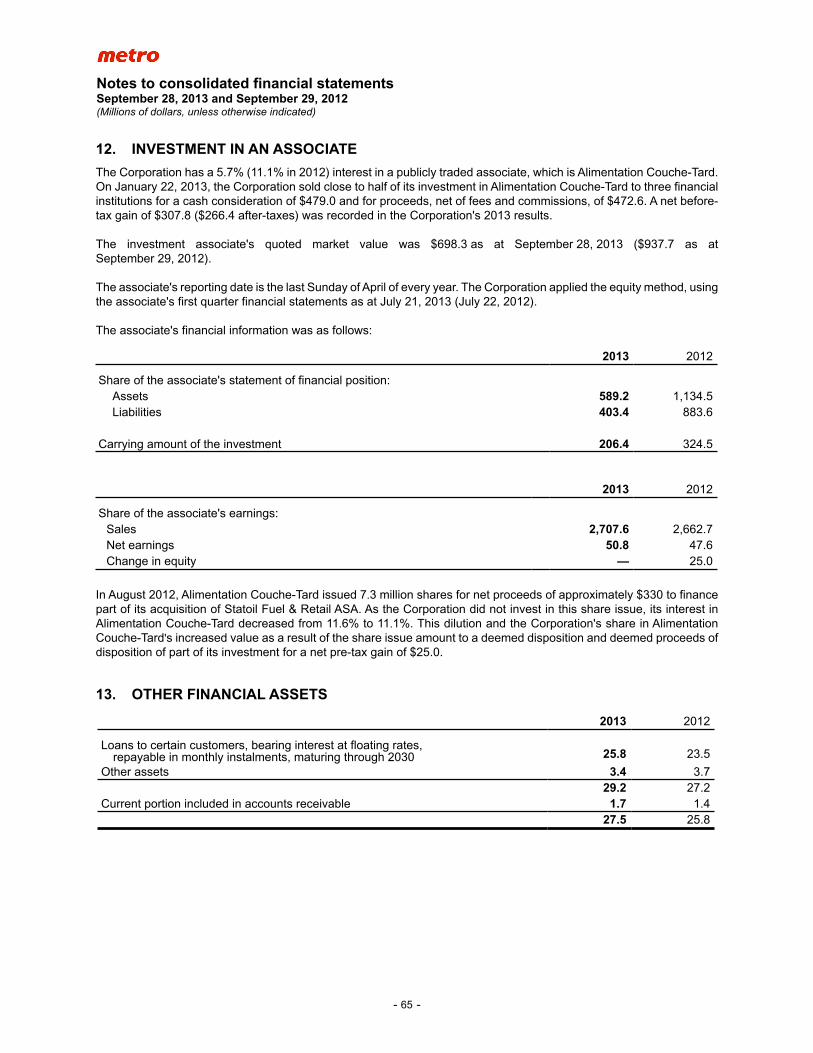
Notes to consolidated financial statementsSeptember 28, 2013 and September 29, 2012(Millions of dollars, unless otherwise indicated)
- 65 -
12. INVESTMENT IN AN ASSOCIATEThe Corporation has a 5.7% (11.1% in 2012) interest in a publicly traded associate, which is Alimentation Couche-Tard. On January 22, 2013, the Corporation sold close to half of its investment in Alimentation Couche-Tard to three financial institutions for a cash consideration of $479.0 and for proceeds, net of fees and commissions, of $472.6. A net before-tax gain of $307.8 ($266.4 after-taxes) was recorded in the Corporation's 2013 results.
The investment associate's quoted market value was $698.3 as at September 28, 2013 ($937.7 as at September 29, 2012).
The associate's reporting date is the last Sunday of April of every year. The Corporation applied the equity method, using the associate's first quarter financial statements as at July 21, 2013 (July 22, 2012).
The associate's financial information was as follows:
2013 2012
Share of the associate's statement of financial position:Assets 589.2 1,134.5Liabilities 403.4 883.6
Carrying amount of the investment 206.4 324.5
2013 2012
Share of the associate's earnings:Sales 2,707.6 2,662.7Net earnings 50.8 47.6Change in equity — 25.0
In August 2012, Alimentation Couche-Tard issued 7.3 million shares for net proceeds of approximately $330 to finance part of its acquisition of Statoil Fuel & Retail ASA. As the Corporation did not invest in this share issue, its interest in Alimentation Couche-Tard decreased from 11.6% to 11.1%. This dilution and the Corporation's share in Alimentation Couche-Tard's increased value as a result of the share issue amount to a deemed disposition and deemed proceeds of disposition of part of its investment for a net pre-tax gain of $25.0.
13. OTHER FINANCIAL ASSETS
2013 2012
Loans to certain customers, bearing interest at floating rates, repayable in monthly instalments, maturing through 2030 25.8 23.5
Other assets 3.4 3.729.2 27.2
Current portion included in accounts receivable 1.7 1.427.5 25.8
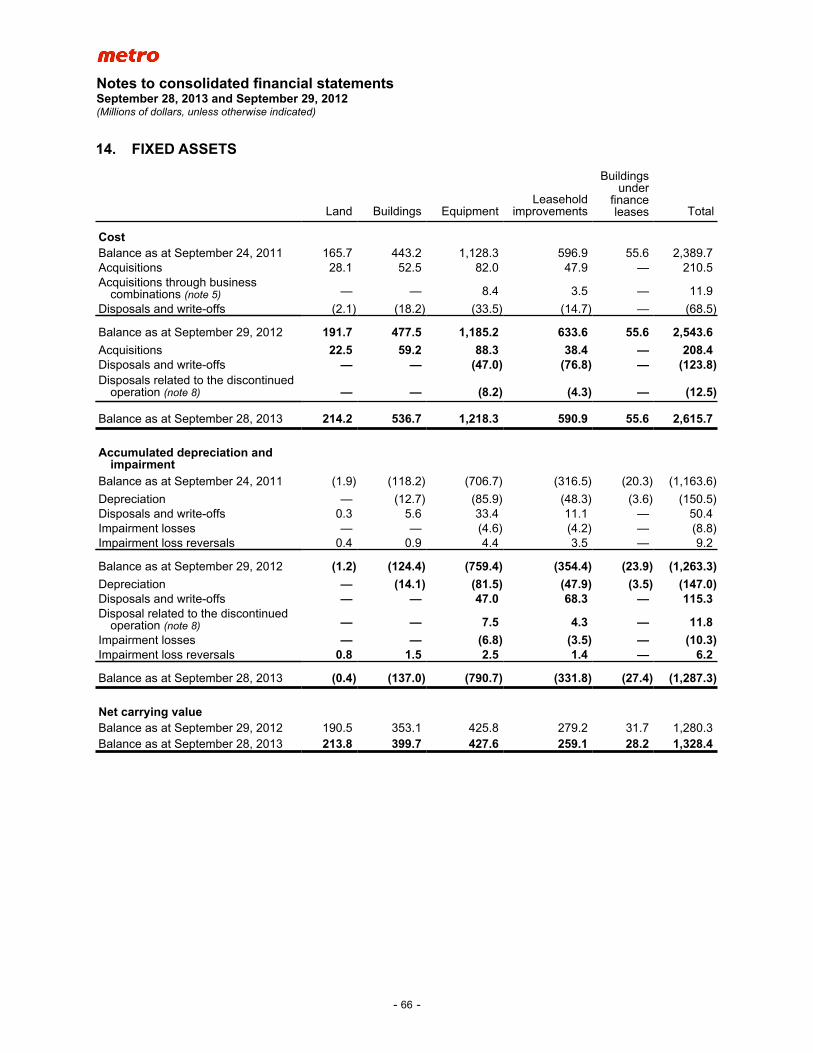
Notes to consolidated financial statementsSeptember 28, 2013 and September 29, 2012(Millions of dollars, unless otherwise indicated)
- 66 -
14. FIXED ASSETS
Land Buildings EquipmentLeasehold
improvements
Buildingsunder
financeleases Total
CostBalance as at September 24, 2011 165.7 443.2 1,128.3 596.9 55.6 2,389.7Acquisitions 28.1 52.5 82.0 47.9 — 210.5Acquisitions through business
combinations (note 5) — — 8.4 3.5 — 11.9
Disposals and write-offs (2.1) (18.2) (33.5) (14.7) — (68.5)
Balance as at September 29, 2012 191.7 477.5 1,185.2 633.6 55.6 2,543.6Acquisitions 22.5 59.2 88.3 38.4 — 208.4Disposals and write-offs — — (47.0) (76.8) — (123.8)Disposals related to the discontinued
operation (note 8) — — (8.2) (4.3) — (12.5)
Balance as at September 28, 2013 214.2 536.7 1,218.3 590.9 55.6 2,615.7
Accumulated depreciation andimpairment
Balance as at September 24, 2011 (1.9) (118.2) (706.7) (316.5) (20.3) (1,163.6)
Depreciation — (12.7) (85.9) (48.3) (3.6) (150.5)Disposals and write-offs 0.3 5.6 33.4 11.1 — 50.4Impairment losses — — (4.6) (4.2) — (8.8)Impairment loss reversals 0.4 0.9 4.4 3.5 — 9.2
Balance as at September 29, 2012 (1.2) (124.4) (759.4) (354.4) (23.9) (1,263.3)Depreciation — (14.1) (81.5) (47.9) (3.5) (147.0)Disposals and write-offs — — 47.0 68.3 — 115.3Disposal related to the discontinued
operation (note 8) — — 7.5 4.3 — 11.8Impairment losses — — (6.8) (3.5) — (10.3)Impairment loss reversals 0.8 1.5 2.5 1.4 — 6.2
Balance as at September 28, 2013 (0.4) (137.0) (790.7) (331.8) (27.4) (1,287.3)
Net carrying valueBalance as at September 29, 2012 190.5 353.1 425.8 279.2 31.7 1,280.3Balance as at September 28, 2013 213.8 399.7 427.6 259.1 28.2 1,328.4
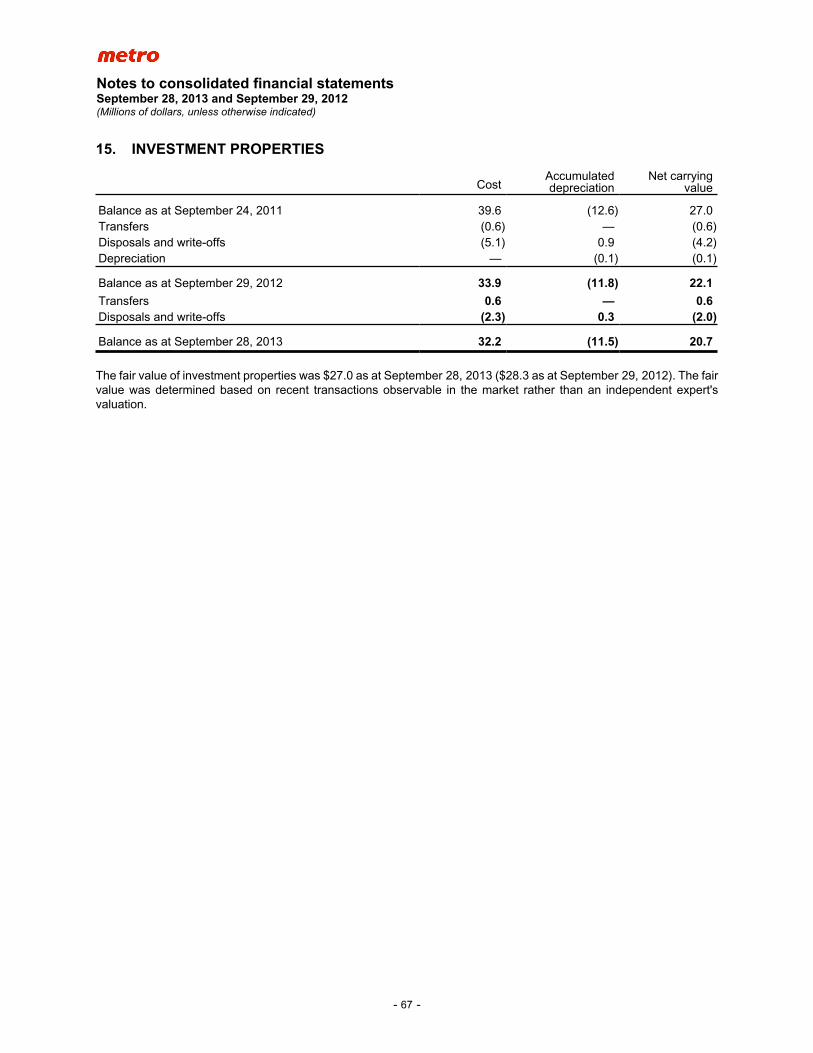
Notes to consolidated financial statementsSeptember 28, 2013 and September 29, 2012(Millions of dollars, unless otherwise indicated)
- 67 -
15. INVESTMENT PROPERTIES
CostAccumulateddepreciation
Net carryingvalue
Balance as at September 24, 2011 39.6 (12.6) 27.0Transfers (0.6) — (0.6)Disposals and write-offs (5.1) 0.9 (4.2)Depreciation — (0.1) (0.1)
Balance as at September 29, 2012 33.9 (11.8) 22.1Transfers 0.6 — 0.6Disposals and write-offs (2.3) 0.3 (2.0)
Balance as at September 28, 2013 32.2 (11.5) 20.7
The fair value of investment properties was $27.0 as at September 28, 2013 ($28.3 as at September 29, 2012). The fair value was determined based on recent transactions observable in the market rather than an independent expert's valuation.
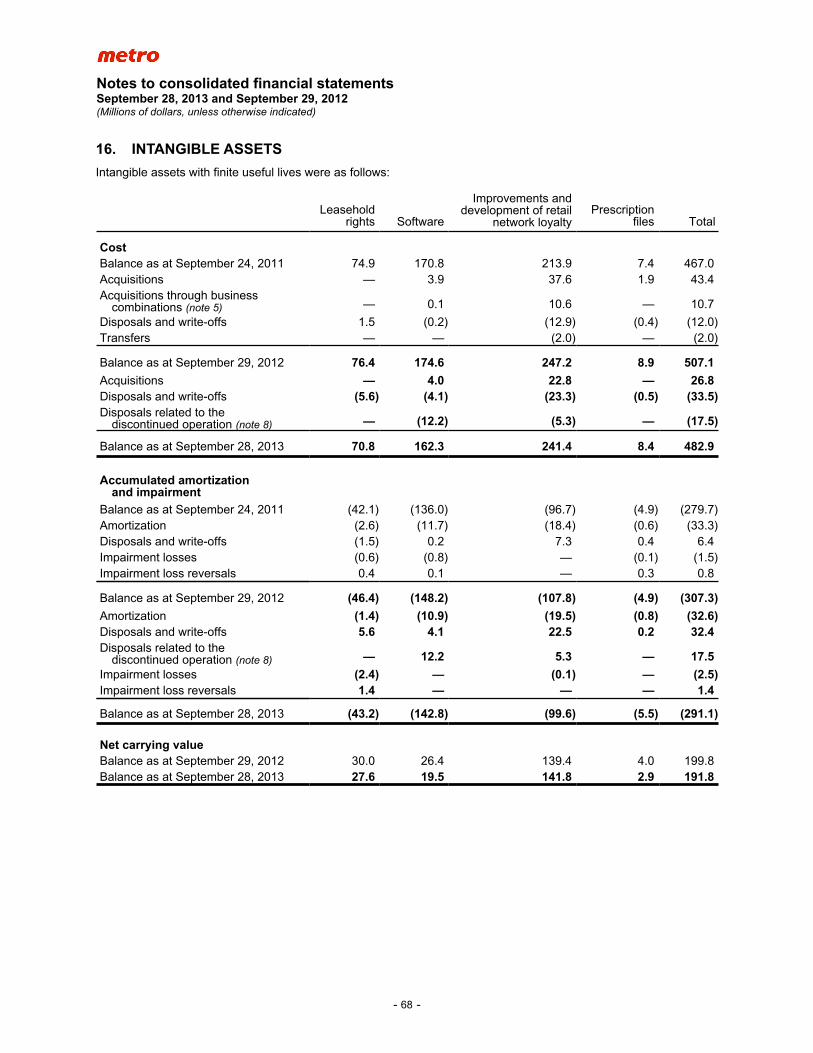
Notes to consolidated financial statementsSeptember 28, 2013 and September 29, 2012(Millions of dollars, unless otherwise indicated)
- 68 -
16. INTANGIBLE ASSETSIntangible assets with finite useful lives were as follows:
Leaseholdrights Software
Improvements anddevelopment of retail
network loyaltyPrescription
files Total
CostBalance as at September 24, 2011 74.9 170.8 213.9 7.4 467.0Acquisitions — 3.9 37.6 1.9 43.4Acquisitions through business
combinations (note 5) — 0.1 10.6 — 10.7
Disposals and write-offs 1.5 (0.2) (12.9) (0.4) (12.0)Transfers — — (2.0) — (2.0)
Balance as at September 29, 2012 76.4 174.6 247.2 8.9 507.1Acquisitions — 4.0 22.8 — 26.8Disposals and write-offs (5.6) (4.1) (23.3) (0.5) (33.5)Disposals related to the
discontinued operation (note 8) — (12.2) (5.3) — (17.5)
Balance as at September 28, 2013 70.8 162.3 241.4 8.4 482.9
Accumulated amortization and impairment
Balance as at September 24, 2011 (42.1) (136.0) (96.7) (4.9) (279.7)Amortization (2.6) (11.7) (18.4) (0.6) (33.3)Disposals and write-offs (1.5) 0.2 7.3 0.4 6.4Impairment losses (0.6) (0.8) — (0.1) (1.5)Impairment loss reversals 0.4 0.1 — 0.3 0.8
Balance as at September 29, 2012 (46.4) (148.2) (107.8) (4.9) (307.3)Amortization (1.4) (10.9) (19.5) (0.8) (32.6)Disposals and write-offs 5.6 4.1 22.5 0.2 32.4Disposals related to the
discontinued operation (note 8) — 12.2 5.3 — 17.5Impairment losses (2.4) — (0.1) — (2.5)Impairment loss reversals 1.4 — — — 1.4
Balance as at September 28, 2013 (43.2) (142.8) (99.6) (5.5) (291.1)
Net carrying valueBalance as at September 29, 2012 30.0 26.4 139.4 4.0 199.8Balance as at September 28, 2013 27.6 19.5 141.8 2.9 191.8
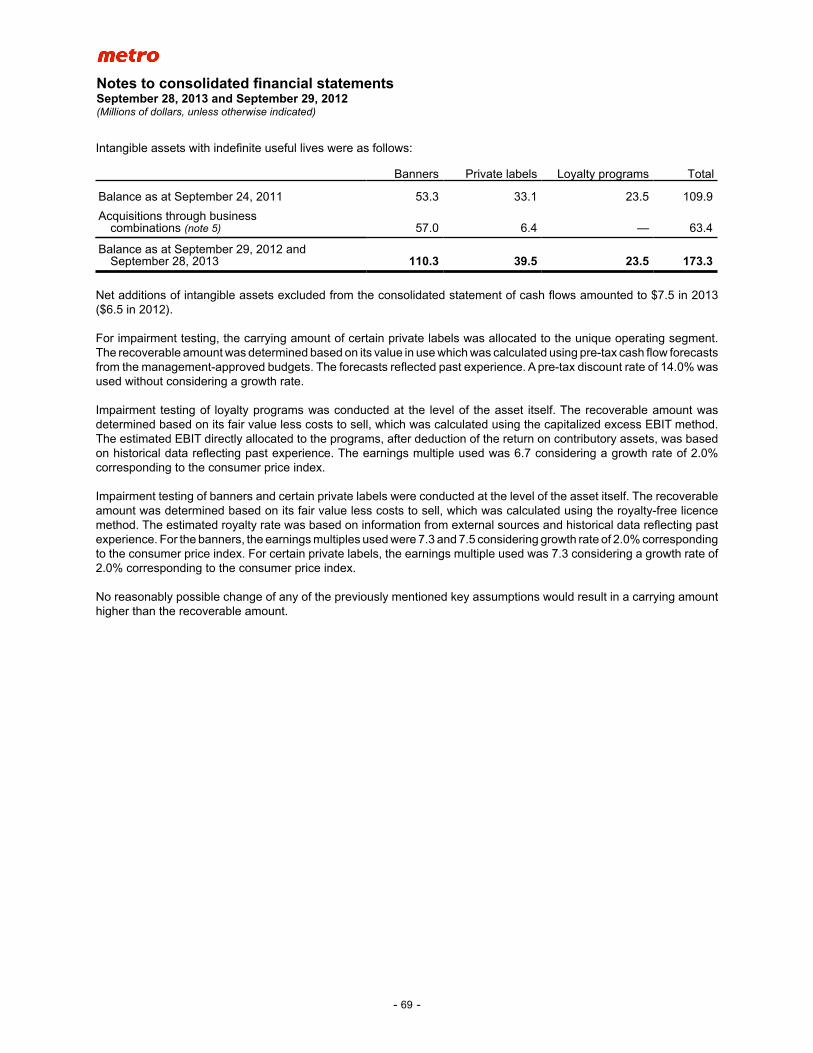
Notes to consolidated financial statementsSeptember 28, 2013 and September 29, 2012(Millions of dollars, unless otherwise indicated)
- 69 -
Intangible assets with indefinite useful lives were as follows:
Banners Private labels Loyalty programs Total
Balance as at September 24, 2011 53.3 33.1 23.5 109.9
Acquisitions through business combinations (note 5) 57.0 6.4 — 63.4
Balance as at September 29, 2012 andSeptember 28, 2013 110.3 39.5 23.5 173.3
Net additions of intangible assets excluded from the consolidated statement of cash flows amounted to $7.5 in 2013 ($6.5 in 2012).
For impairment testing, the carrying amount of certain private labels was allocated to the unique operating segment. The recoverable amount was determined based on its value in use which was calculated using pre-tax cash flow forecasts from the management-approved budgets. The forecasts reflected past experience. A pre-tax discount rate of 14.0% was used without considering a growth rate.
Impairment testing of loyalty programs was conducted at the level of the asset itself. The recoverable amount was determined based on its fair value less costs to sell, which was calculated using the capitalized excess EBIT method. The estimated EBIT directly allocated to the programs, after deduction of the return on contributory assets, was based on historical data reflecting past experience. The earnings multiple used was 6.7 considering a growth rate of 2.0% corresponding to the consumer price index.
Impairment testing of banners and certain private labels were conducted at the level of the asset itself. The recoverable amount was determined based on its fair value less costs to sell, which was calculated using the royalty-free licence method. The estimated royalty rate was based on information from external sources and historical data reflecting past experience. For the banners, the earnings multiples used were 7.3 and 7.5 considering growth rate of 2.0% corresponding to the consumer price index. For certain private labels, the earnings multiple used was 7.3 considering a growth rate of 2.0% corresponding to the consumer price index.
No reasonably possible change of any of the previously mentioned key assumptions would result in a carrying amount higher than the recoverable amount.
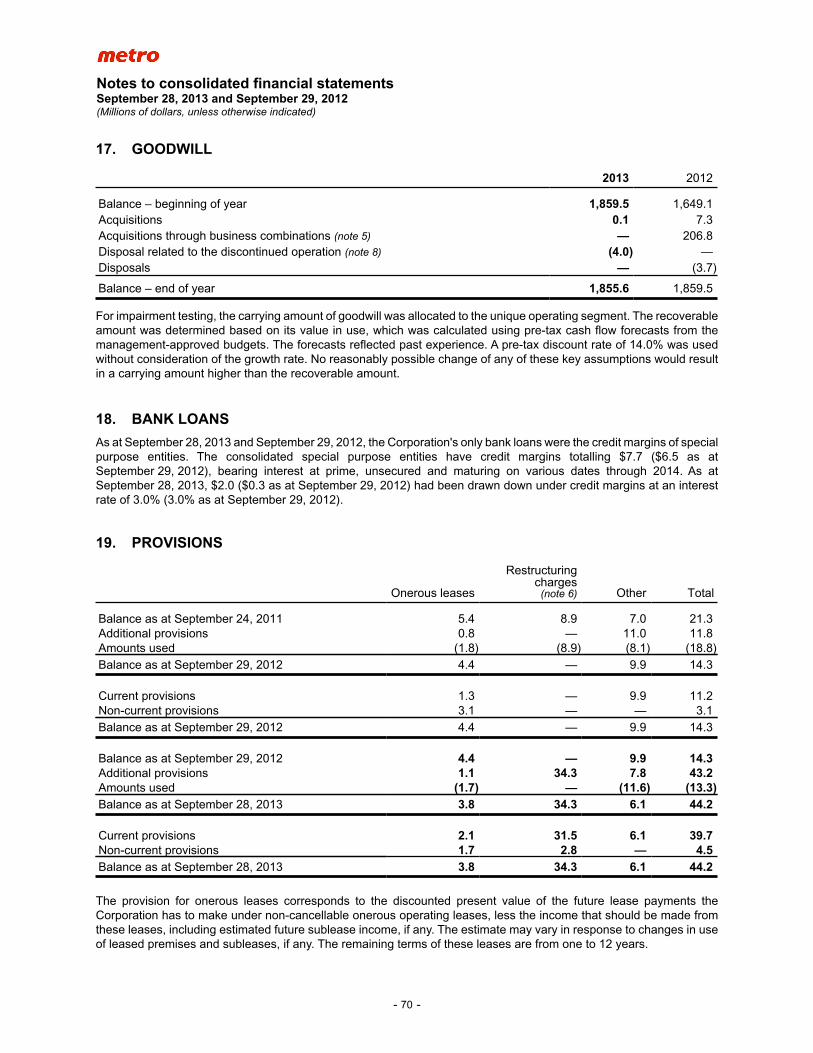
Notes to consolidated financial statementsSeptember 28, 2013 and September 29, 2012(Millions of dollars, unless otherwise indicated)
- 70 -
17. GOODWILL
2013 2012
Balance – beginning of year 1,859.5 1,649.1Acquisitions 0.1 7.3Acquisitions through business combinations (note 5) — 206.8Disposal related to the discontinued operation (note 8) (4.0) —Disposals — (3.7)
Balance – end of year 1,855.6 1,859.5
For impairment testing, the carrying amount of goodwill was allocated to the unique operating segment. The recoverable amount was determined based on its value in use, which was calculated using pre-tax cash flow forecasts from the management-approved budgets. The forecasts reflected past experience. A pre-tax discount rate of 14.0% was used without consideration of the growth rate. No reasonably possible change of any of these key assumptions would result in a carrying amount higher than the recoverable amount.
18. BANK LOANSAs at September 28, 2013 and September 29, 2012, the Corporation's only bank loans were the credit margins of special purpose entities. The consolidated special purpose entities have credit margins totalling $7.7 ($6.5 as at September 29, 2012), bearing interest at prime, unsecured and maturing on various dates through 2014. As at September 28, 2013, $2.0 ($0.3 as at September 29, 2012) had been drawn down under credit margins at an interest rate of 3.0% (3.0% as at September 29, 2012).
19. PROVISIONS
Onerous leases
Restructuring charges
(note 6) Other Total
Balance as at September 24, 2011 5.4 8.9 7.0 21.3Additional provisions 0.8 — 11.0 11.8Amounts used (1.8) (8.9) (8.1) (18.8)Balance as at September 29, 2012 4.4 — 9.9 14.3
Current provisions 1.3 — 9.9 11.2Non-current provisions 3.1 — — 3.1Balance as at September 29, 2012 4.4 — 9.9 14.3
Balance as at September 29, 2012 4.4 — 9.9 14.3Additional provisions 1.1 34.3 7.8 43.2Amounts used (1.7) — (11.6) (13.3)Balance as at September 28, 2013 3.8 34.3 6.1 44.2
Current provisions 2.1 31.5 6.1 39.7Non-current provisions 1.7 2.8 — 4.5Balance as at September 28, 2013 3.8 34.3 6.1 44.2
The provision for onerous leases corresponds to the discounted present value of the future lease payments the Corporation has to make under non-cancellable onerous operating leases, less the income that should be made from these leases, including estimated future sublease income, if any. The estimate may vary in response to changes in use of leased premises and subleases, if any. The remaining terms of these leases are from one to 12 years.
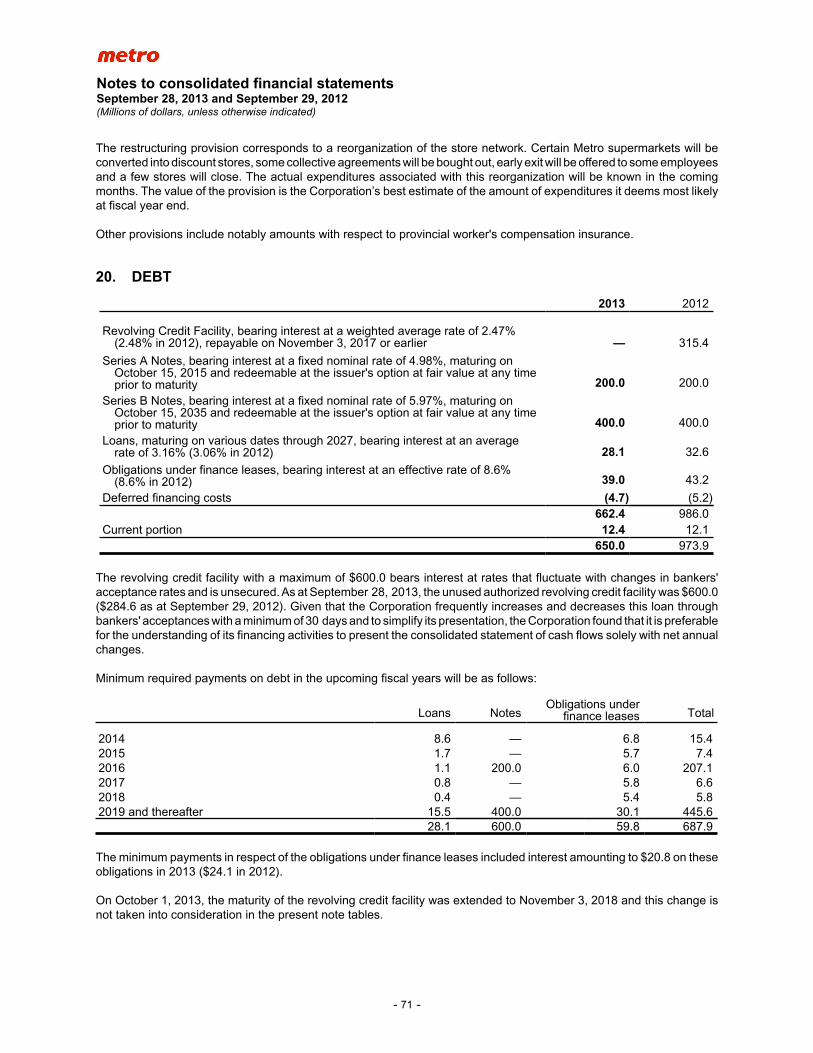
Notes to consolidated financial statementsSeptember 28, 2013 and September 29, 2012(Millions of dollars, unless otherwise indicated)
- 71 -
The restructuring provision corresponds to a reorganization of the store network. Certain Metro supermarkets will be converted into discount stores, some collective agreements will be bought out, early exit will be offered to some employees and a few stores will close. The actual expenditures associated with this reorganization will be known in the coming months. The value of the provision is the Corporation’s best estimate of the amount of expenditures it deems most likely at fiscal year end.
Other provisions include notably amounts with respect to provincial worker's compensation insurance.
20. DEBT
2013 2012
Revolving Credit Facility, bearing interest at a weighted average rate of 2.47%(2.48% in 2012), repayable on November 3, 2017 or earlier — 315.4
Series A Notes, bearing interest at a fixed nominal rate of 4.98%, maturing onOctober 15, 2015 and redeemable at the issuer's option at fair value at any timeprior to maturity 200.0 200.0
Series B Notes, bearing interest at a fixed nominal rate of 5.97%, maturing onOctober 15, 2035 and redeemable at the issuer's option at fair value at any timeprior to maturity 400.0 400.0
Loans, maturing on various dates through 2027, bearing interest at an averagerate of 3.16% (3.06% in 2012) 28.1 32.6
Obligations under finance leases, bearing interest at an effective rate of 8.6%(8.6% in 2012) 39.0 43.2
Deferred financing costs (4.7) (5.2)662.4 986.0
Current portion 12.4 12.1650.0 973.9
The revolving credit facility with a maximum of $600.0 bears interest at rates that fluctuate with changes in bankers' acceptance rates and is unsecured. As at September 28, 2013, the unused authorized revolving credit facility was $600.0 ($284.6 as at September 29, 2012). Given that the Corporation frequently increases and decreases this loan through bankers' acceptances with a minimum of 30 days and to simplify its presentation, the Corporation found that it is preferable for the understanding of its financing activities to present the consolidated statement of cash flows solely with net annual changes.
Minimum required payments on debt in the upcoming fiscal years will be as follows:
Loans NotesObligations under
finance leases Total
2014 8.6 — 6.8 15.42015 1.7 — 5.7 7.42016 1.1 200.0 6.0 207.12017 0.8 — 5.8 6.62018 0.4 — 5.4 5.82019 and thereafter 15.5 400.0 30.1 445.6
28.1 600.0 59.8 687.9
The minimum payments in respect of the obligations under finance leases included interest amounting to $20.8 on these obligations in 2013 ($24.1 in 2012).
On October 1, 2013, the maturity of the revolving credit facility was extended to November 3, 2018 and this change is not taken into consideration in the present note tables.
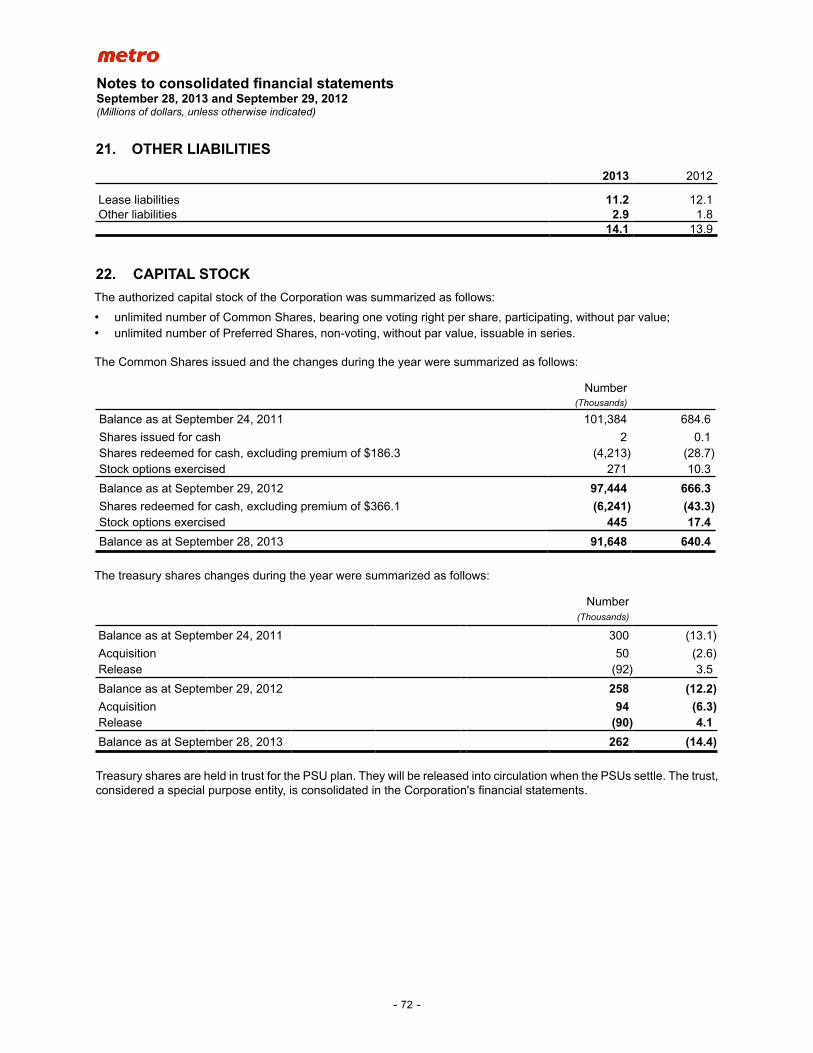
Notes to consolidated financial statementsSeptember 28, 2013 and September 29, 2012(Millions of dollars, unless otherwise indicated)
- 72 -
21. OTHER LIABILITIES
2013 2012
Lease liabilities 11.2 12.1Other liabilities 2.9 1.8
14.1 13.9
22. CAPITAL STOCKThe authorized capital stock of the Corporation was summarized as follows:
• unlimited number of Common Shares, bearing one voting right per share, participating, without par value;• unlimited number of Preferred Shares, non-voting, without par value, issuable in series.
The Common Shares issued and the changes during the year were summarized as follows:
Number(Thousands)
Balance as at September 24, 2011 101,384 684.6
Shares issued for cash 2 0.1Shares redeemed for cash, excluding premium of $186.3 (4,213) (28.7)Stock options exercised 271 10.3
Balance as at September 29, 2012 97,444 666.3Shares redeemed for cash, excluding premium of $366.1 (6,241) (43.3)Stock options exercised 445 17.4Balance as at September 28, 2013 91,648 640.4
The treasury shares changes during the year were summarized as follows:
Number(Thousands)
Balance as at September 24, 2011 300 (13.1)
Acquisition 50 (2.6)Release (92) 3.5
Balance as at September 29, 2012 258 (12.2)Acquisition 94 (6.3)Release (90) 4.1Balance as at September 28, 2013 262 (14.4)
Treasury shares are held in trust for the PSU plan. They will be released into circulation when the PSUs settle. The trust, considered a special purpose entity, is consolidated in the Corporation's financial statements.
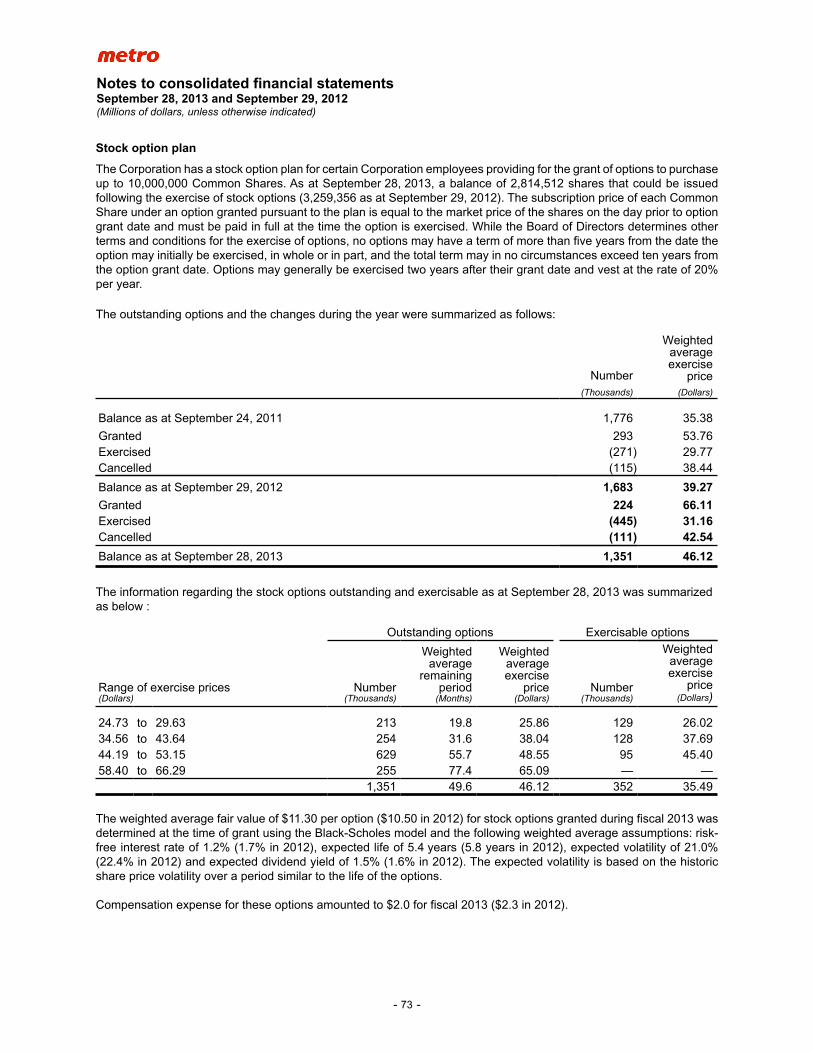
Notes to consolidated financial statementsSeptember 28, 2013 and September 29, 2012(Millions of dollars, unless otherwise indicated)
- 73 -
Stock option plan
The Corporation has a stock option plan for certain Corporation employees providing for the grant of options to purchase up to 10,000,000 Common Shares. As at September 28, 2013, a balance of 2,814,512 shares that could be issued following the exercise of stock options (3,259,356 as at September 29, 2012). The subscription price of each Common Share under an option granted pursuant to the plan is equal to the market price of the shares on the day prior to option grant date and must be paid in full at the time the option is exercised. While the Board of Directors determines other terms and conditions for the exercise of options, no options may have a term of more than five years from the date the option may initially be exercised, in whole or in part, and the total term may in no circumstances exceed ten years from the option grant date. Options may generally be exercised two years after their grant date and vest at the rate of 20% per year.
The outstanding options and the changes during the year were summarized as follows:
Number
Weightedaverageexercise
price(Thousands) (Dollars)
Balance as at September 24, 2011 1,776 35.38
Granted 293 53.76Exercised (271) 29.77Cancelled (115) 38.44
Balance as at September 29, 2012 1,683 39.27Granted 224 66.11Exercised (445) 31.16Cancelled (111) 42.54Balance as at September 28, 2013 1,351 46.12
The information regarding the stock options outstanding and exercisable as at September 28, 2013 was summarized as below :
Outstanding options Exercisable options
Range of exercise prices(Dollars)
Number(Thousands)
Weighted average
remaining period
(Months)
Weighted average exercise
price (Dollars)
Number(Thousands)
Weighted average exercise
price(Dollars)
24.73 to 29.63 213 19.8 25.86 129 26.0234.56 to 43.64 254 31.6 38.04 128 37.6944.19 to 53.15 629 55.7 48.55 95 45.4058.40 to 66.29 255 77.4 65.09 — —
1,351 49.6 46.12 352 35.49
The weighted average fair value of $11.30 per option ($10.50 in 2012) for stock options granted during fiscal 2013 was determined at the time of grant using the Black-Scholes model and the following weighted average assumptions: risk-free interest rate of 1.2% (1.7% in 2012), expected life of 5.4 years (5.8 years in 2012), expected volatility of 21.0% (22.4% in 2012) and expected dividend yield of 1.5% (1.6% in 2012). The expected volatility is based on the historic share price volatility over a period similar to the life of the options.
Compensation expense for these options amounted to $2.0 for fiscal 2013 ($2.3 in 2012).
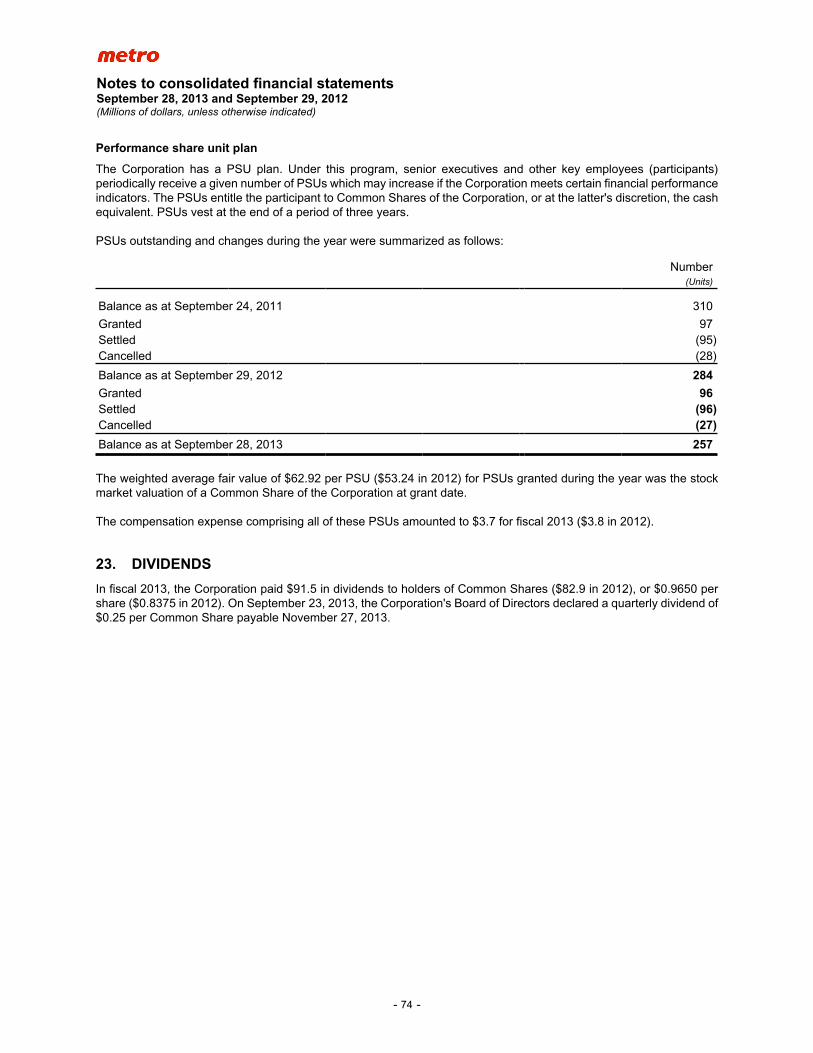
Notes to consolidated financial statementsSeptember 28, 2013 and September 29, 2012(Millions of dollars, unless otherwise indicated)
- 74 -
Performance share unit plan
The Corporation has a PSU plan. Under this program, senior executives and other key employees (participants) periodically receive a given number of PSUs which may increase if the Corporation meets certain financial performance indicators. The PSUs entitle the participant to Common Shares of the Corporation, or at the latter's discretion, the cash equivalent. PSUs vest at the end of a period of three years.
PSUs outstanding and changes during the year were summarized as follows:
Number(Units)
Balance as at September 24, 2011 310
Granted 97Settled (95)Cancelled (28)
Balance as at September 29, 2012 284Granted 96Settled (96)Cancelled (27)Balance as at September 28, 2013 257
The weighted average fair value of $62.92 per PSU ($53.24 in 2012) for PSUs granted during the year was the stock market valuation of a Common Share of the Corporation at grant date.
The compensation expense comprising all of these PSUs amounted to $3.7 for fiscal 2013 ($3.8 in 2012).
23. DIVIDENDSIn fiscal 2013, the Corporation paid $91.5 in dividends to holders of Common Shares ($82.9 in 2012), or $0.9650 per share ($0.8375 in 2012). On September 23, 2013, the Corporation's Board of Directors declared a quarterly dividend of $0.25 per Common Share payable November 27, 2013.
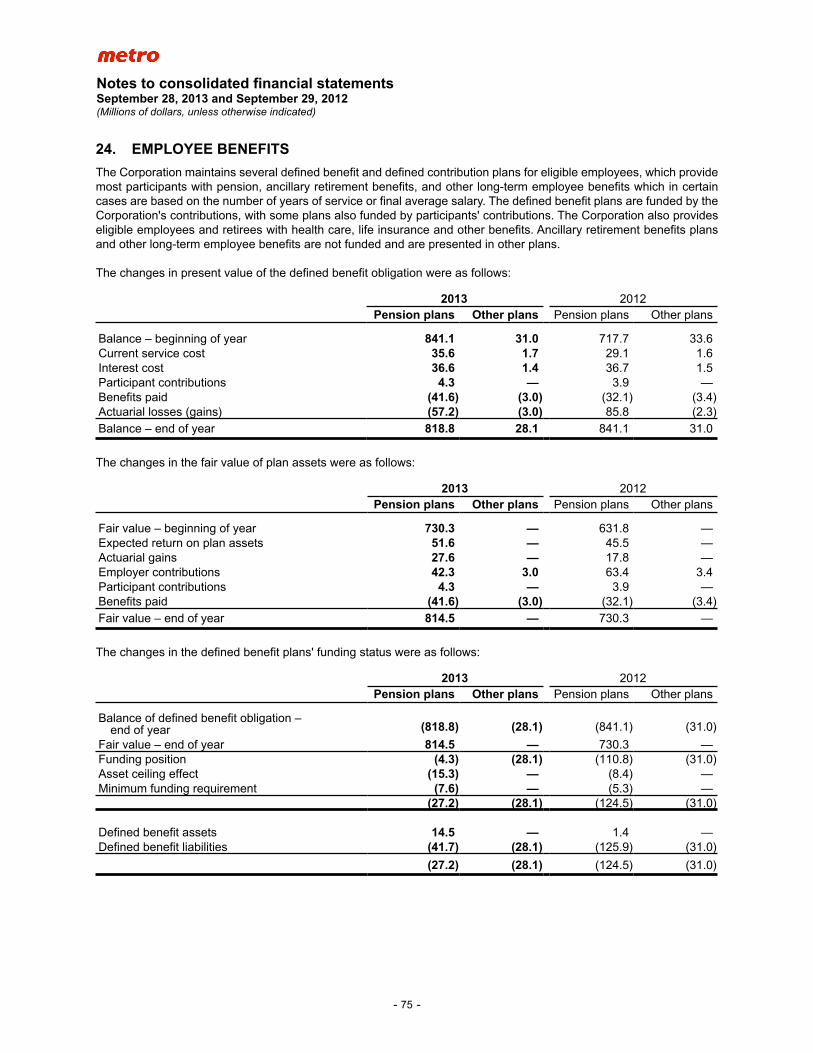
Notes to consolidated financial statementsSeptember 28, 2013 and September 29, 2012(Millions of dollars, unless otherwise indicated)
- 75 -
24. EMPLOYEE BENEFITSThe Corporation maintains several defined benefit and defined contribution plans for eligible employees, which provide most participants with pension, ancillary retirement benefits, and other long-term employee benefits which in certain cases are based on the number of years of service or final average salary. The defined benefit plans are funded by the Corporation's contributions, with some plans also funded by participants' contributions. The Corporation also provides eligible employees and retirees with health care, life insurance and other benefits. Ancillary retirement benefits plans and other long-term employee benefits are not funded and are presented in other plans.
The changes in present value of the defined benefit obligation were as follows:
2013 2012Pension plans Other plans Pension plans Other plans
Balance – beginning of year 841.1 31.0 717.7 33.6Current service cost 35.6 1.7 29.1 1.6Interest cost 36.6 1.4 36.7 1.5Participant contributions 4.3 — 3.9 —Benefits paid (41.6) (3.0) (32.1) (3.4)Actuarial losses (gains) (57.2) (3.0) 85.8 (2.3)Balance – end of year 818.8 28.1 841.1 31.0
The changes in the fair value of plan assets were as follows:
2013 2012Pension plans Other plans Pension plans Other plans
Fair value – beginning of year 730.3 — 631.8 —Expected return on plan assets 51.6 — 45.5 —Actuarial gains 27.6 — 17.8 —Employer contributions 42.3 3.0 63.4 3.4Participant contributions 4.3 — 3.9 —Benefits paid (41.6) (3.0) (32.1) (3.4)Fair value – end of year 814.5 — 730.3 —
The changes in the defined benefit plans' funding status were as follows:
2013 2012Pension plans Other plans Pension plans Other plans
Balance of defined benefit obligation – end of year (818.8) (28.1) (841.1) (31.0)
Fair value – end of year 814.5 — 730.3 —Funding position (4.3) (28.1) (110.8) (31.0)Asset ceiling effect (15.3) — (8.4) —Minimum funding requirement (7.6) — (5.3) —
(27.2) (28.1) (124.5) (31.0)
Defined benefit assets 14.5 — 1.4 —Defined benefit liabilities (41.7) (28.1) (125.9) (31.0)
(27.2) (28.1) (124.5) (31.0)
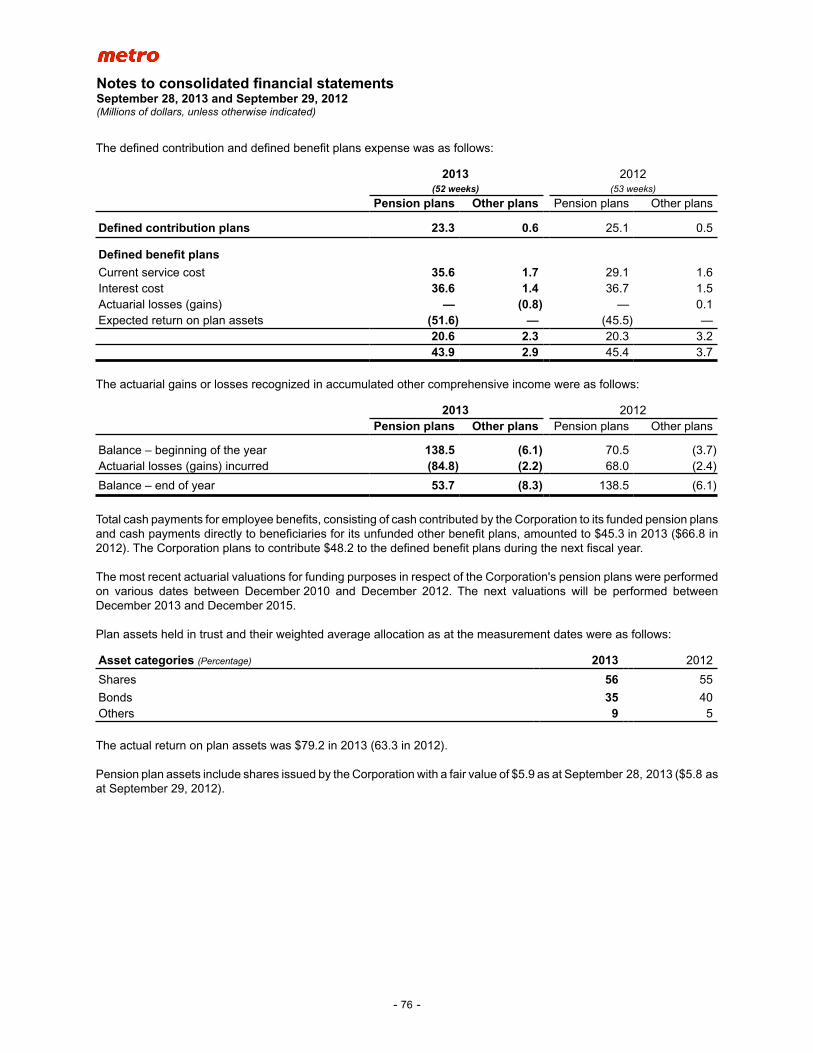
Notes to consolidated financial statementsSeptember 28, 2013 and September 29, 2012(Millions of dollars, unless otherwise indicated)
- 76 -
The defined contribution and defined benefit plans expense was as follows:
2013 2012(52 weeks) (53 weeks)
Pension plans Other plans Pension plans Other plans
Defined contribution plans 23.3 0.6 25.1 0.5
Defined benefit plansCurrent service cost 35.6 1.7 29.1 1.6Interest cost 36.6 1.4 36.7 1.5Actuarial losses (gains) — (0.8) — 0.1Expected return on plan assets (51.6) — (45.5) —
20.6 2.3 20.3 3.243.9 2.9 45.4 3.7
The actuarial gains or losses recognized in accumulated other comprehensive income were as follows:
2013 2012Pension plans Other plans Pension plans Other plans
Balance – beginning of the year 138.5 (6.1) 70.5 (3.7)Actuarial losses (gains) incurred (84.8) (2.2) 68.0 (2.4)
Balance – end of year 53.7 (8.3) 138.5 (6.1)
Total cash payments for employee benefits, consisting of cash contributed by the Corporation to its funded pension plans and cash payments directly to beneficiaries for its unfunded other benefit plans, amounted to $45.3 in 2013 ($66.8 in 2012). The Corporation plans to contribute $48.2 to the defined benefit plans during the next fiscal year.
The most recent actuarial valuations for funding purposes in respect of the Corporation's pension plans were performed on various dates between December 2010 and December 2012. The next valuations will be performed between December 2013 and December 2015.
Plan assets held in trust and their weighted average allocation as at the measurement dates were as follows:
Asset categories (Percentage) 2013 2012
Shares 56 55
Bonds 35 40Others 9 5
The actual return on plan assets was $79.2 in 2013 (63.3 in 2012).
Pension plan assets include shares issued by the Corporation with a fair value of $5.9 as at September 28, 2013 ($5.8 as at September 29, 2012).
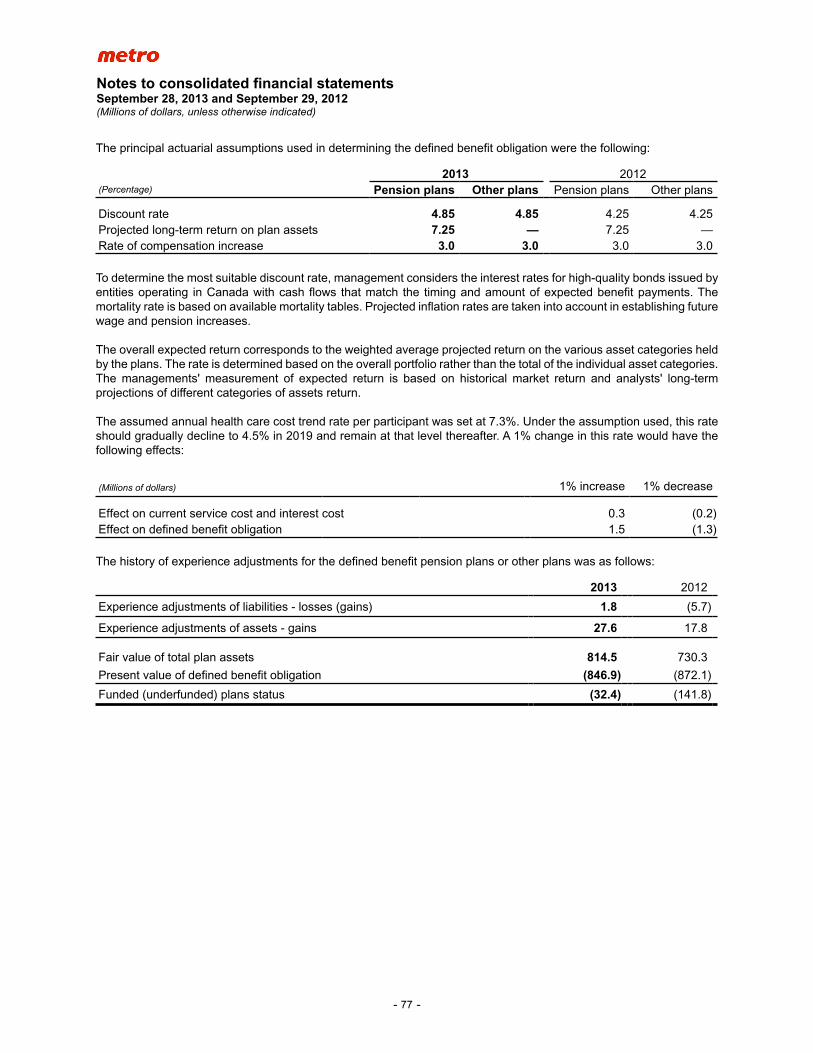
Notes to consolidated financial statementsSeptember 28, 2013 and September 29, 2012(Millions of dollars, unless otherwise indicated)
- 77 -
The principal actuarial assumptions used in determining the defined benefit obligation were the following:
2013 2012(Percentage) Pension plans Other plans Pension plans Other plans
Discount rate 4.85 4.85 4.25 4.25Projected long-term return on plan assets 7.25 — 7.25 —Rate of compensation increase 3.0 3.0 3.0 3.0
To determine the most suitable discount rate, management considers the interest rates for high-quality bonds issued by entities operating in Canada with cash flows that match the timing and amount of expected benefit payments. The mortality rate is based on available mortality tables. Projected inflation rates are taken into account in establishing future wage and pension increases.
The overall expected return corresponds to the weighted average projected return on the various asset categories held by the plans. The rate is determined based on the overall portfolio rather than the total of the individual asset categories. The managements' measurement of expected return is based on historical market return and analysts' long-term projections of different categories of assets return.
The assumed annual health care cost trend rate per participant was set at 7.3%. Under the assumption used, this rate should gradually decline to 4.5% in 2019 and remain at that level thereafter. A 1% change in this rate would have the following effects:
(Millions of dollars) 1% increase 1% decrease
Effect on current service cost and interest cost 0.3 (0.2)Effect on defined benefit obligation 1.5 (1.3)
The history of experience adjustments for the defined benefit pension plans or other plans was as follows:
2013 2012
Experience adjustments of liabilities - losses (gains) 1.8 (5.7)
Experience adjustments of assets - gains 27.6 17.8
Fair value of total plan assets 814.5 730.3
Present value of defined benefit obligation (846.9) (872.1)
Funded (underfunded) plans status (32.4) (141.8)
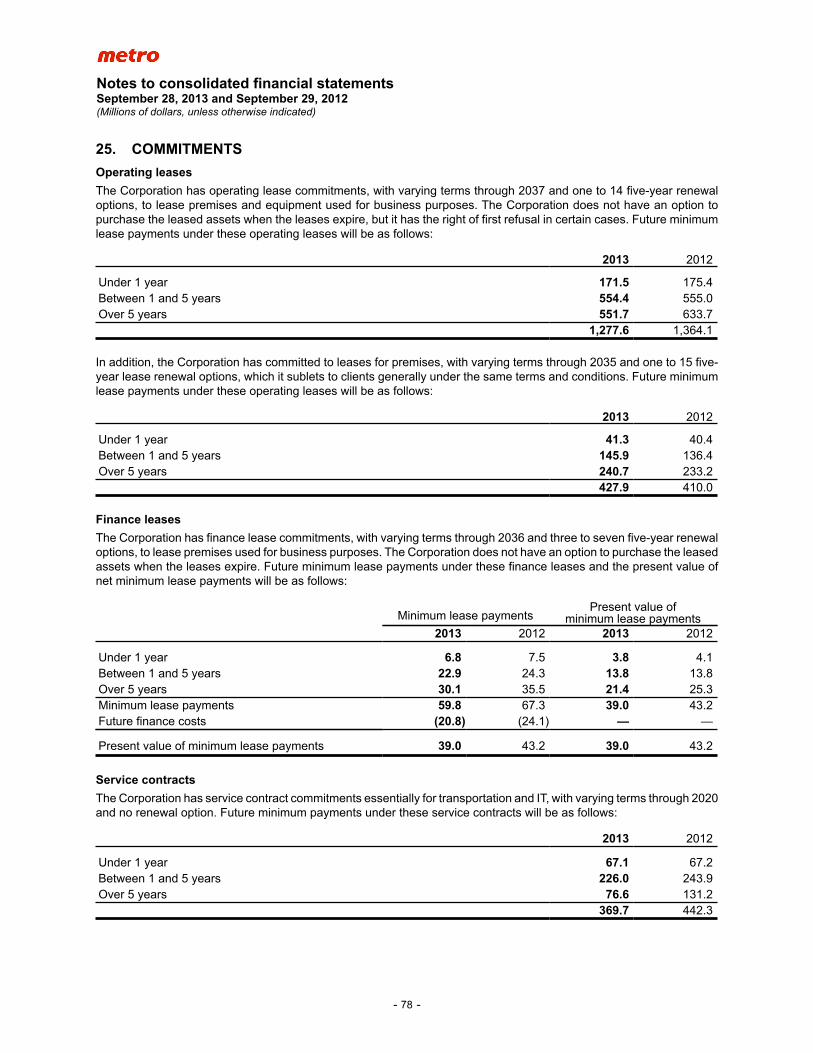
Notes to consolidated financial statementsSeptember 28, 2013 and September 29, 2012(Millions of dollars, unless otherwise indicated)
- 78 -
25. COMMITMENTSOperating leasesThe Corporation has operating lease commitments, with varying terms through 2037 and one to 14 five-year renewal options, to lease premises and equipment used for business purposes. The Corporation does not have an option to purchase the leased assets when the leases expire, but it has the right of first refusal in certain cases. Future minimum lease payments under these operating leases will be as follows:
2013 2012
Under 1 year 171.5 175.4Between 1 and 5 years 554.4 555.0Over 5 years 551.7 633.7
1,277.6 1,364.1
In addition, the Corporation has committed to leases for premises, with varying terms through 2035 and one to 15 five-year lease renewal options, which it sublets to clients generally under the same terms and conditions. Future minimum lease payments under these operating leases will be as follows:
2013 2012
Under 1 year 41.3 40.4Between 1 and 5 years 145.9 136.4Over 5 years 240.7 233.2
427.9 410.0
Finance leasesThe Corporation has finance lease commitments, with varying terms through 2036 and three to seven five-year renewal options, to lease premises used for business purposes. The Corporation does not have an option to purchase the leased assets when the leases expire. Future minimum lease payments under these finance leases and the present value of net minimum lease payments will be as follows:
Minimum lease paymentsPresent value of
minimum lease payments2013 2012 2013 2012
Under 1 year 6.8 7.5 3.8 4.1Between 1 and 5 years 22.9 24.3 13.8 13.8Over 5 years 30.1 35.5 21.4 25.3Minimum lease payments 59.8 67.3 39.0 43.2Future finance costs (20.8) (24.1) — —
Present value of minimum lease payments 39.0 43.2 39.0 43.2
Service contractsThe Corporation has service contract commitments essentially for transportation and IT, with varying terms through 2020 and no renewal option. Future minimum payments under these service contracts will be as follows:
2013 2012
Under 1 year 67.1 67.2Between 1 and 5 years 226.0 243.9Over 5 years 76.6 131.2
369.7 442.3
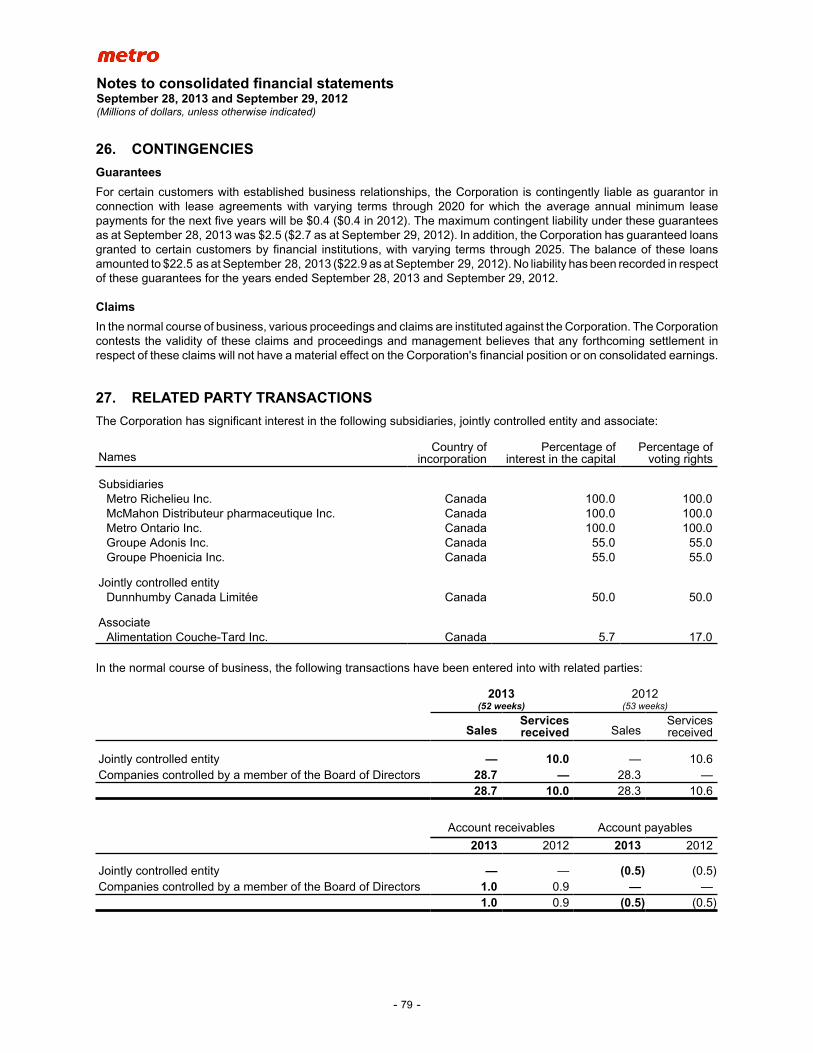
Notes to consolidated financial statementsSeptember 28, 2013 and September 29, 2012(Millions of dollars, unless otherwise indicated)
- 79 -
26. CONTINGENCIESGuaranteesFor certain customers with established business relationships, the Corporation is contingently liable as guarantor in connection with lease agreements with varying terms through 2020 for which the average annual minimum lease payments for the next five years will be $0.4 ($0.4 in 2012). The maximum contingent liability under these guarantees as at September 28, 2013 was $2.5 ($2.7 as at September 29, 2012). In addition, the Corporation has guaranteed loans granted to certain customers by financial institutions, with varying terms through 2025. The balance of these loans amounted to $22.5 as at September 28, 2013 ($22.9 as at September 29, 2012). No liability has been recorded in respect of these guarantees for the years ended September 28, 2013 and September 29, 2012.
ClaimsIn the normal course of business, various proceedings and claims are instituted against the Corporation. The Corporation contests the validity of these claims and proceedings and management believes that any forthcoming settlement in respect of these claims will not have a material effect on the Corporation's financial position or on consolidated earnings.
27. RELATED PARTY TRANSACTIONSThe Corporation has significant interest in the following subsidiaries, jointly controlled entity and associate:
NamesCountry of
incorporationPercentage of
interest in the capitalPercentage of
voting rights
SubsidiariesMetro Richelieu Inc. Canada 100.0 100.0McMahon Distributeur pharmaceutique Inc. Canada 100.0 100.0Metro Ontario Inc. Canada 100.0 100.0Groupe Adonis Inc. Canada 55.0 55.0Groupe Phoenicia Inc. Canada 55.0 55.0
Jointly controlled entityDunnhumby Canada Limitée Canada 50.0 50.0
AssociateAlimentation Couche-Tard Inc. Canada 5.7 17.0
In the normal course of business, the following transactions have been entered into with related parties:
2013 2012(52 weeks) (53 weeks)
SalesServicesreceived Sales
Servicesreceived
Jointly controlled entity — 10.0 — 10.6Companies controlled by a member of the Board of Directors 28.7 — 28.3 —
28.7 10.0 28.3 10.6
Account receivables Account payables
2013 2012 2013 2012
Jointly controlled entity — — (0.5) (0.5)Companies controlled by a member of the Board of Directors 1.0 0.9 — —
1.0 0.9 (0.5) (0.5)
Notes to consolidated financial statementsSeptember 28, 2013 and September 29, 2012(Millions of dollars, unless otherwise indicated)
- 80 -
Compensation for the principal officers was as follows:
2013 2012(52 weeks) (53 weeks)
Compensation and current employee benefits 2.7 2.4Post-employment benefits 0.8 0.5Other long-term benefits 1.5 2.0Share-based payment 3.6 3.1
8.6 8.0
28. MANAGEMENT OF CAPITALThe Corporation aims to maintain a capital level that enables it to meet several objectives, namely:• Striving for a percentage of non-current debt to total combined non-current debt and equity (non-current debt/total
capital ratio) of less than 50%.• Maintaining an adequate credit rating to obtain an investment grade rating for its term notes.• Paying total annual dividends representing approximately 20% of net earnings for the previous fiscal year before
extraordinary items.
In its capital structure, the Corporation considers its stock option and PSU plans for key employees and officers. In addition, the Corporation's stock redemption plan is one of the tools it uses to achieve its objectives.
The Corporation is not subject to any capital requirements imposed by a regulator.
The Corporation's fiscal 2013 annual results regarding its capital management objectives were as follows:• a non-current debt/total capital ratio of 18.8% (27.7% as at September 29, 2012);• a BBB credit rating confirmed by S&P and DBRS (same rating in 2012);• a dividend representing 18.7% of net earnings for the previous fiscal year (21.1% in 2012).
The capital management objectives remain the same as for the previous fiscal year.
29. FINANCIAL INSTRUMENTSFAIR VALUEThe fair value of cash and cash equivalents, accounts receivable, bank loans and accounts payable approximates their carrying value because of the short-term maturity of these instruments.
The fair value of loans to certain customers, credit facility and loans payable is equivalent to their carrying value since their interest rates are comparable to market rates.
The fair value of foreign exchange forward contracts is measured using a generally accepted valuation technique, that is, the discounted value of the difference between the contract's value at maturity based on the foreign exchange rate set out in the contract and the contract's value at maturity based on the foreign exchange rate that the financial institution would use if it were to renegotiate the same contract at today's date under the same conditions.
The fair value of notes represents the obligations that the Corporation would have to meet in the event of the negotiation of similar notes under current market conditions.
The fair value of the obligations under finance leases represents the obligations that the Corporation would have to face in the event of the negotiation of similar leases under current market conditions.
The fair value of the non-controlling interest-related liability is equivalent to the estimated price to be paid which is based mainly on the discounted value of the future earnings of Adonis and Phoenicia at the date the options become exercisable.
Notes to consolidated financial statementsSeptember 28, 2013 and September 29, 2012(Millions of dollars, unless otherwise indicated)
- 81 -
The financial instruments' book and fair values were as follows:
2013 2012Book value Fair value Book value Fair value
Other financial assetsLoans and receivables
Loans to certain customers (note 13) 25.8 25.8 23.5 23.5
Non-controlling interestFinancial liability held for trading 160.5 160.5 139.3 139.3
Debt (note 20)Other financial liabilities
Revolving Credit Facility — — 315.4 315.4Series A Notes 200.0 211.5 200.0 217.2Series B Notes 400.0 417.3 400.0 457.7Loans 28.1 28.1 32.6 32.6
Obligations under finance leases 39.0 43.9 43.2 53.1667.1 700.8 991.2 1,076.0
The foreign exchange forward contracts, classified as “Financial assets or liabilities at fair value through net earnings”, are not shown in the above table, as they are insignificant in value.
FAIR VALUE MEASUREMENTS HIERARCHYFair value measurements recognized in the statement of financial position must be categorized in accordance with the following levels:• Level 1: quoted prices (unadjusted) in active markets for identical assets or liabilities;• Level 2: inputs other than quoted prices included in Level 1 that are observable for the asset or liability, either directly
(i.e., as prices) or indirectly (i.e., derived from prices);• Level 3: inputs for the asset or liability that are not based on observable market data (unobservable inputs).
The Corporation categorized the foreign exchange forward contracts fair value measurement in Level 2, as it is primarily derived from observable market inputs, that is, foreign exchange rates.
For the non-controlling interest-related liability, the Corporation categorized the fair value measurements in Level 3, as they are derived from data that is not observable.
The changes of the non-controlling interest-related liability were as follows:
2013 2012
Balance – beginning of year 139.3 —Issuance through business combinations (note 5) — 132.1Share of earnings 7.8 7.2Dividends (6.8) —Change in fair value 20.2 —
Balance – end of year 160.5 139.3
A 1% increase in future earnings would result in a $1.8 increase in fair value.
INTEREST RATE RISKIn the normal course of business, the Corporation is exposed primarily to interest rate fluctuations risk as a result of loans and receivables that it grants, as well as loans payable that it contracts at variable interest rates.
As at September 28, 2013 and September 29, 2012, there were no outstanding interest rate swap contracts.
Notes to consolidated financial statementsSeptember 28, 2013 and September 29, 2012(Millions of dollars, unless otherwise indicated)
- 82 -
CREDIT RISK
Loans and receivables / GuaranteesThe Corporation sells products to consumers and merchants in Canada. When it sells products, it gives merchants credit. In addition, to help certain merchants finance business acquisitions, the Corporation grants them long-term loans or guarantees loans obtained by them from financial institutions. Hence, the Corporation is subject to credit risk.
To mitigate such risk, the Corporation performs ongoing credit evaluations of its customers and has adopted a credit policy that defines the credit conditions to be met and the required guarantees. As at September 28, 2013 and September 29, 2012, no customer accounted for over 10% of total loans and receivables.
To cover its credit risk, the Corporation holds guarantees from its clients' assets in the form of deposits, movable hypothecs on the Corporation stock and/or second hypothecs on their inventories, movable property, intangible assets and receivables.
In recent years, the Corporation has not suffered any material losses related to credit risk.
As at September 28, 2013, the maximum potential liability under guarantees provided amounted to $22.5 ($22.9 as at September 29, 2012) and no liability had been recognized as at that date.
Financial assets at fair value through net earningsWith regard to its financial assets at fair value through net earnings, consisting of foreign exchange forward contracts, the Corporation is subject to credit risk when these contracts result in receivables from financial institutions. In accordance with its risk management policy, the Corporation entered into these agreements with major Canadian financial institutions to reduce its credit risk.
As at September 28, 2013 and September 29, 2012, the Corporation was not exposed to credit risk in respect of its foreign exchange forward contracts, as they resulted in amounts payable.
LIQUIDITY RISKThe Corporation is exposed to liquidity risk primarily as a result of its debt and trade accounts payable.
The Corporation regularly assesses its cash position and feels that its cash flows from operating activities are sufficient to fully cover its cash requirements as regards its financing activities. Its Series A Notes, its revolving credit facility and its Series B Notes mature only in 2015, 2017 and 2035, respectively. The Corporation also has an unused authorized balance of $600.0 on its revolving credit facility.
Undiscounted cash flows (capital and interest)
Accountspayable Loans Notes
Finance leasecommitments
Non-controlling
interest Total
Maturing under 1 year 1,004.9 9.4 33.8 6.8 — 1,054.9Maturing in 1 to 10 years — 8.0 424.9 36.8 180.1 649.8Maturing in 11 to 20 years — 3.3 238.8 14.0 — 256.1Maturing over 20 years — 14.2 447.9 2.2 — 464.3
1,004.9 34.9 1,145.4 59.8 180.1 2,425.1
Notes to consolidated financial statementsSeptember 28, 2013 and September 29, 2012(Millions of dollars, unless otherwise indicated)
- 83 -
FOREIGN EXCHANGE RISKGiven that some of its purchases are denominated in foreign currencies, the Corporation is exposed to foreign exchange risk.
In accordance with its risk management policy, the Corporation uses derivative financial instruments, consisting of foreign exchange forward contracts, to hedge against the effect of foreign exchange rate fluctuations on its future foreign-denominated purchases of goods and services.
As at September 28, 2013 and September 29, 2012, the fair value of foreign exchange forward contracts was insignificant.
30. COMPARATIVE FIGURESCertain comparative figures have been reclassified to conform to the presentation adopted in the current year.
31. APPROVAL OF FINANCIAL STATEMENTSThe consolidated financial statements of fiscal year ended September 28, 2013 (including comparative figures) were approved for issue by the Board of Directors on November 12, 2013.
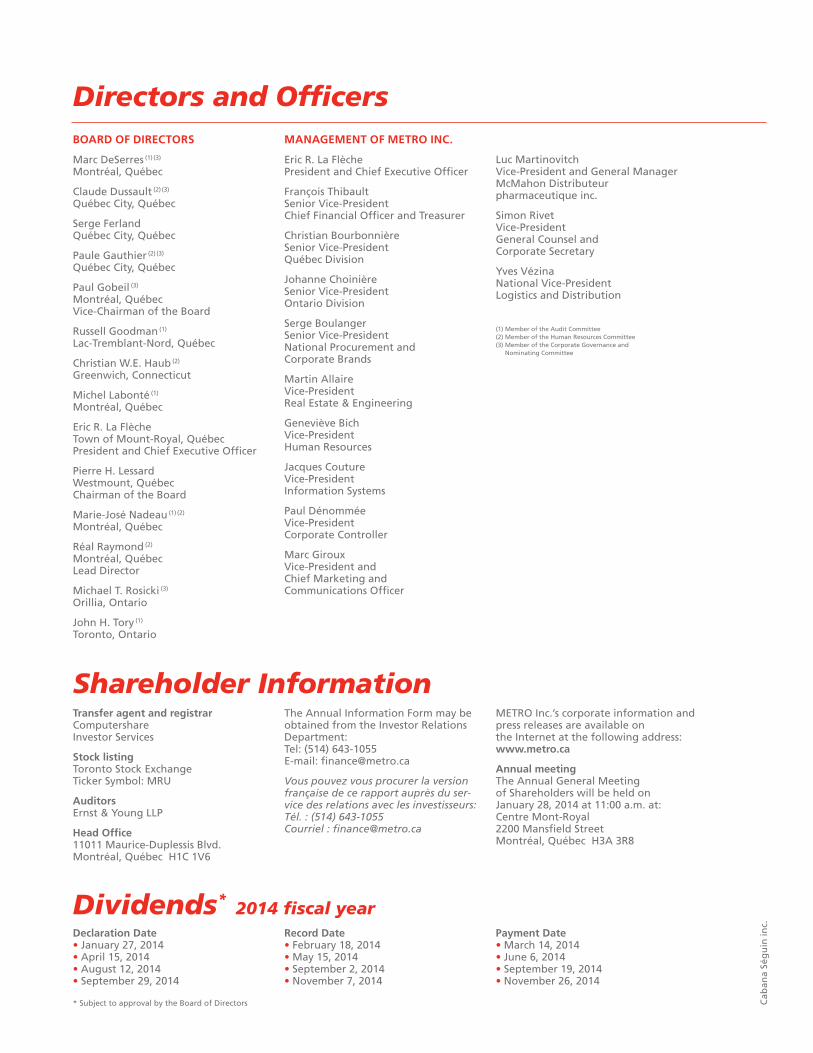
BOARD OF DIRECTORS
Marc deserres (1) (3) Montréal, québec
claude dussault (2) (3) québec city, québec
serge ferland québec city, québec
paule gauthier (2) (3) québec city, québec
paul gobeil (3) Montréal, québec Vice-chairman of the board
russell goodman (1) lac-tremblant-nord, québec
christian W.e. haub (2) greenwich, connecticut
Michel labonté (1) Montréal, québec
eric r. la flèche town of Mount-royal, québec president and chief executive officer
pierre h. lessard Westmount, québec chairman of the board
Marie-José nadeau (1) (2) Montréal, québec
réal raymond (2) Montréal, québec lead director
Michael t. rosicki (3) orillia, ontario
John h. tory (1) toronto, ontario
MANAGEMENT OF METRO INC.
eric r. la flèche president and chief executive officer
françois thibault senior Vice-president chief financial officer and treasurer
christian bourbonnière senior Vice-president québec division
Johanne choinière senior Vice-president ontario division
serge boulanger senior Vice-president national procurement and corporate brands
Martin allaire Vice-president real estate & engineering
geneviève bich Vice-president human resources
Jacques couture Vice-president information systems
paul dénommée Vice-president corporate controller
Marc giroux Vice-president and chief Marketing and communications officer
luc Martinovitch Vice-president and general Manager McMahon distributeur pharmaceutique inc.
simon rivet Vice-president general counsel and corporate secretary
yves Vézina national Vice-president logistics and distribution
(1) Member of the audit committee (2) Member of the human resources committee (3) Member of the corporate governance and nominating committee
Transfer agent and registrar computershare investor services
Stock listing toronto stock exchange ticker symbol: Mru
Auditors ernst & young llp
Head Office 11011 Maurice-duplessis blvd. Montréal, québec h1c 1V6
the annual information form may be obtained from the investor relations department: tel: (514) 643-1055 e-mail: [email protected]
Vous pouvez vous procurer la version française de ce rapport auprès du ser-vice des relations avec les investisseurs: Tél. : (514) 643-1055 Courriel : [email protected]
Metro inc.’s corporate information and press releases are available on the internet at the following address: www.metro.ca
Annual meeting the annual general Meeting of shareholders will be held on January 28, 2014 at 11:00 a.m. at: centre Mont-royal 2200 Mansfield street Montréal, québec h3a 3r8
Shareholder Information
Dividends* 2014 fiscal yearDeclaration Date•January 27, 2014•april 15, 2014•august 12, 2014•september 29, 2014
* subject to approval by the board of directors
Record Date •february 18, 2014•May 15, 2014•september 2, 2014•november 7, 2014
Payment Date •March 14, 2014•June 6, 2014•september 19, 2014•november 26, 2014
cab
ana
ség
uin
inc.
Directors and Officers

metro.ca
Metro is committed to respecting the principles of corporate responsibility notably in terms of the environment. the company is therefore proud to present this annual report, printed using recycled paper that includes post-consumer fibres and is certified fsc.
the fsc® (forest stewardship council®) is an international certification and labeling system that guarantees that the forest products you purchase, from the forest to the shelf, come from responsibly managed sources.