Embed Size (px)
Citation preview

Knock! Knock! Who’s there? “Maurice” Who?
SungAe Suhr Park, Mee Ko, Eleanor Le, Janice Chen
Amgen Inc.
Abstract
SungAe Suhr Park, Mee Ko, Eleanor Le and Janice Chen
Amgen Inc.
Applications of Capillary Electrophoresis (CE) Technique have been increasingly utilized as a key analytical tool to support various areas in academic and industry. The advantages of capillary electrophoresis are ease in quantification, rapid analysis time, enhanced resolution, and automation. In order to meet the increased demand, platform assay and high throughput enhancement formats have been requested.
The applications of CE-sodium dodecyl sulfate (CE-SDS) and Capillary iso-electric focusing (CIEF) methods are required by agencies to release Drug substances and Drug products to replace gel electrophoresis.
In this talk, the new capillary electrophoresis system “Maurice” will be evaluated for suitability as a high throughput and platform system due to ease of use, reproducibility and precision for CE-SDS and CIEF method.
Our Wish for New CE Instrument
• Ease of Use
• Ease of Sample Preparation
• Ease of Method Transfer with GMP Compliance
• Ease of Maintenance
• No Error in Sequence Analysis
• Good Baseline
• Good Sensitivity
• Good Reproducibility
• High Throughput
Why “ Maurice” is here?
• The advantages of capillary electrophoresis compared to Gel Electrophoresis• Ease in quantification• Rapid analysis time • Enhanced resolution• Automation
• Need platform assay and high throughput enhancement formats
• “Maurice” was evaluated for suitability as a high throughput and platform system for CE-SDS and CIEF method
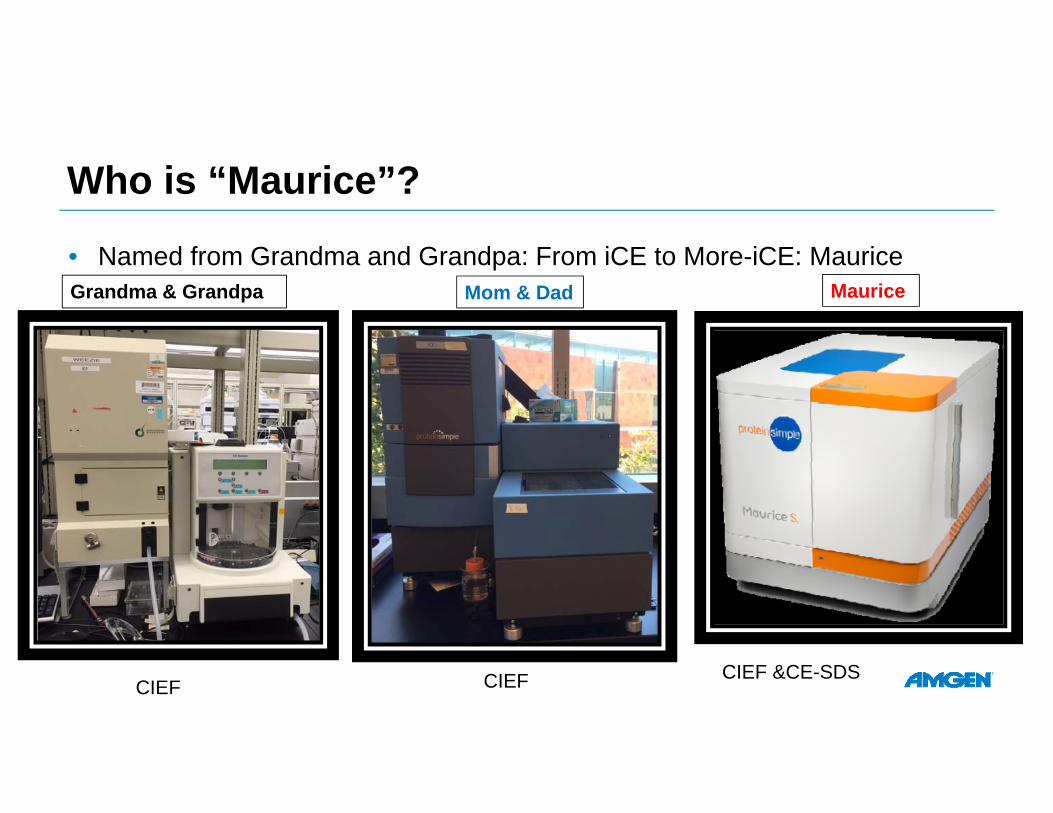
Who is “Maurice”?
• Named from Grandma and Grandpa: From iCE to More-iCE: MauriceGrandma & Grandpa Mom & Dad Maurice
CIEF CIEF CIEF &CE-SDS
What is considered in this study?
• Reproducibility of r-CE-SDS, nr-CE-SDS and CIEF
• Simplicity of method
• Sensitivity
• Comparison with Historical Data
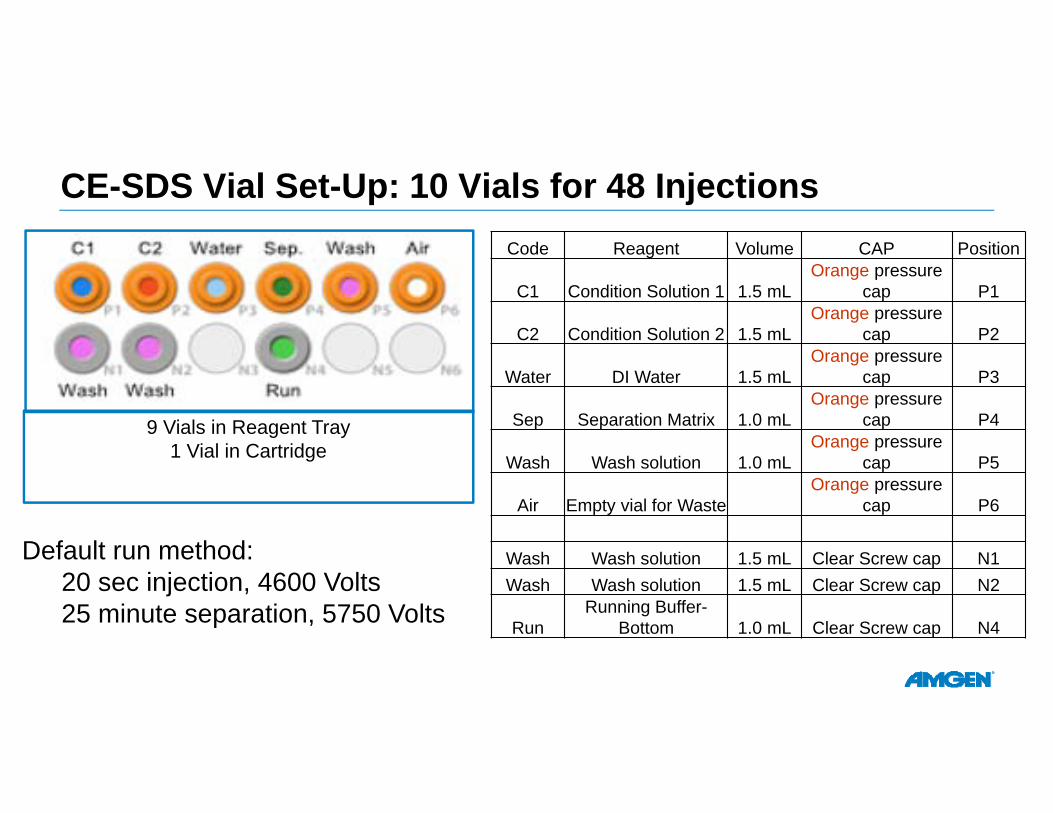
CE-SDS Vial Set-Up: 10 Vials for 48 Injections
9 Vials in Reagent Tray1 Vial in Cartridge
Default run method: 20 sec injection, 4600 Volts25 minute separation, 5750 Volts
Code Reagent Volume CAP Position
C1 Condition Solution 1 1.5 mLOrange pressure
cap P1
C2 Condition Solution 2 1.5 mLOrange pressure
cap P2
Water DI Water 1.5 mLOrange pressure
cap P3
Sep Separation Matrix 1.0 mLOrange pressure
cap P4
Wash Wash solution 1.0 mLOrange pressure
cap P5
Air Empty vial for WasteOrange pressure
cap P6
Wash Wash solution 1.5 mL Clear Screw cap N1Wash Wash solution 1.5 mL Clear Screw cap N2
RunRunning Buffer-
Bottom 1.0 mL Clear Screw cap N4
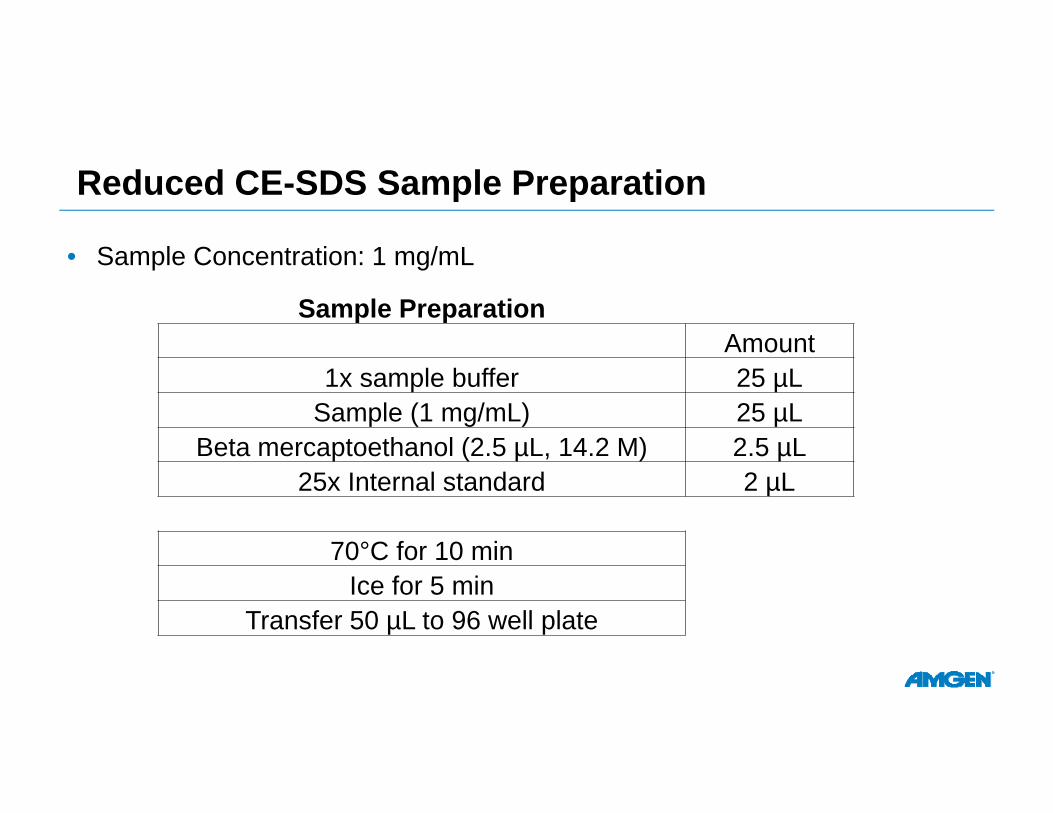
Reduced CE-SDS Sample Preparation
• Sample Concentration: 1 mg/mL
Sample PreparationAmount
1x sample buffer 25 µLSample (1 mg/mL) 25 µL
Beta mercaptoethanol (2.5 µL, 14.2 M) 2.5 µL25x Internal standard 2 µL
70°C for 10 minIce for 5 min
Transfer 50 µL to 96 well plate
Injection: 25, 26, 27, 28, 29, 30
0.6 0.8 1 1.2 1.4 1.6 1.8Relative Migration Time
-2
0
2
4
6
8
10
12
14
Absor
bance
(mAU
)
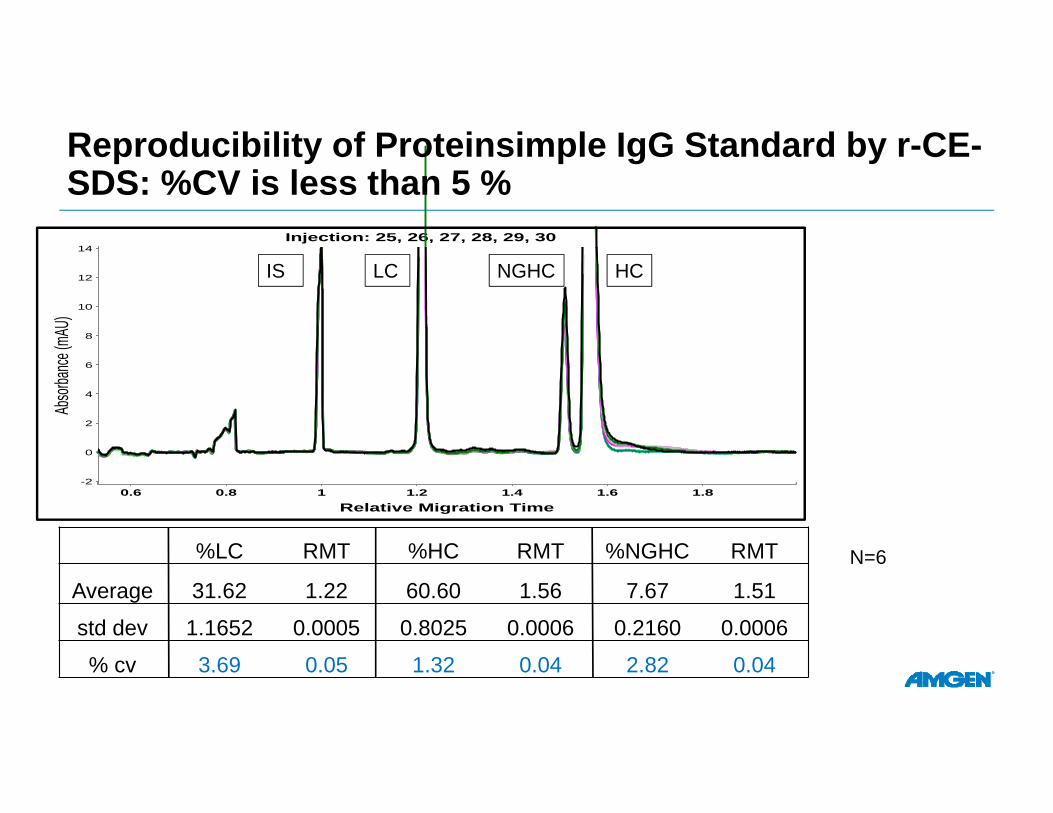
Reproducibility of Proteinsimple IgG Standard by r-CE-SDS: %CV is less than 5 %
HCLC
%LC RMT %HC RMT %NGHC RMT
Average 31.62 1.22 60.60 1.56 7.67 1.51
std dev 1.1652 0.0005 0.8025 0.0006 0.2160 0.0006
% cv 3.69 0.05 1.32 0.04 2.82 0.04
N=6
NGHCIS
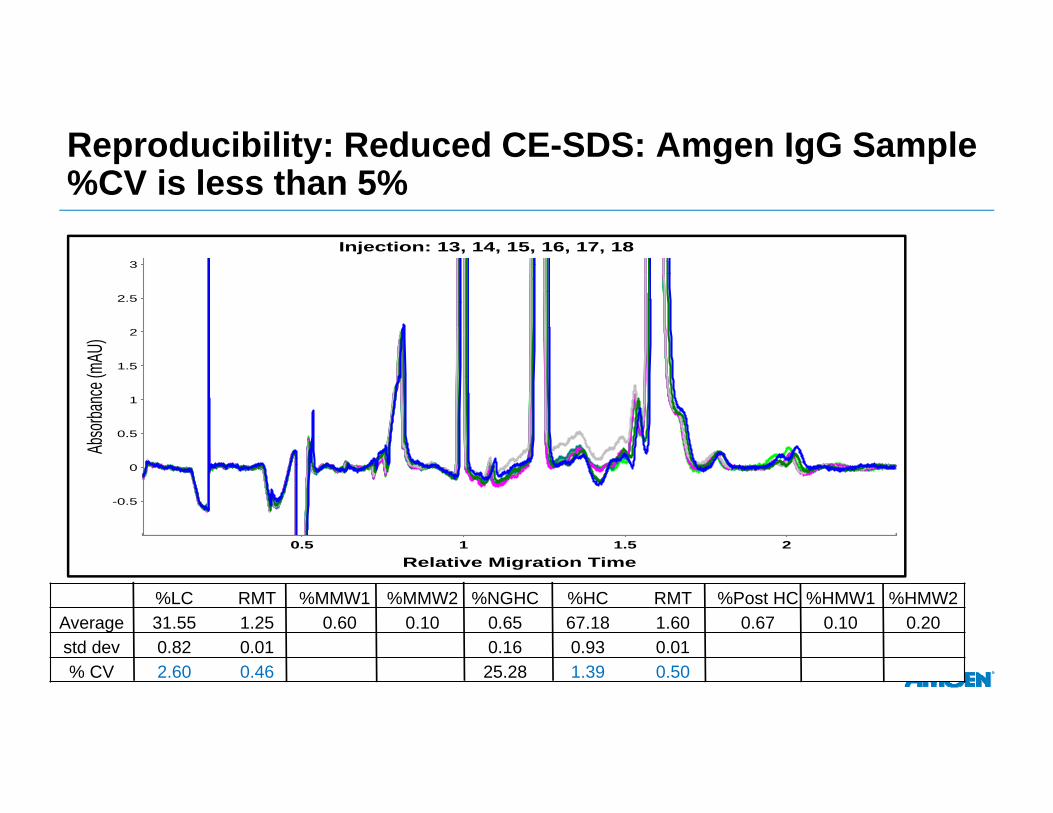
Reproducibility: Reduced CE-SDS: Amgen IgG Sample %CV is less than 5%
Injection: 13, 14, 15, 16, 17, 18
0.5 1 1.5 2Relative Migration Time
-0.5
0
0.5
1
1.5
2
2.5
3
Abso
rbanc
e (mA
U)
%LC RMT %MMW1 %MMW2 %NGHC %HC RMT %Post HC %HMW1 %HMW2Average 31.55 1.25 0.60 0.10 0.65 67.18 1.60 0.67 0.10 0.20std dev 0.82 0.01 0.16 0.93 0.01% CV 2.60 0.46 25.28 1.39 0.50
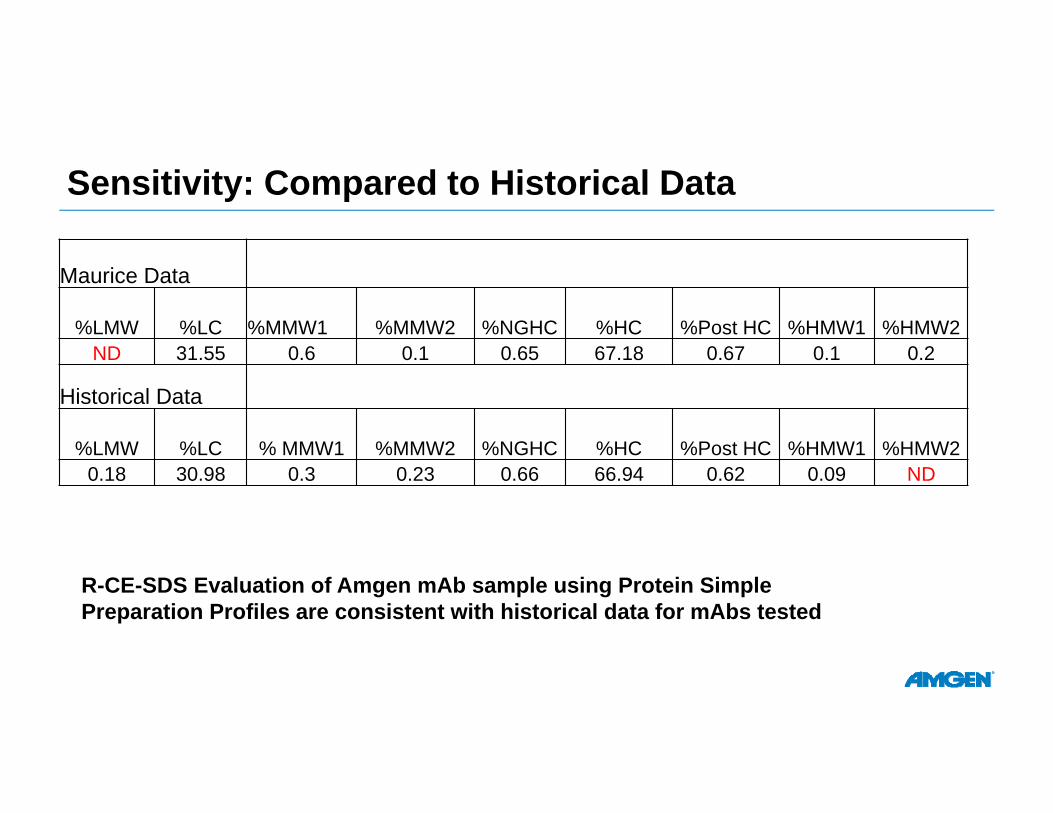
Sensitivity: Compared to Historical Data
R-CE-SDS Evaluation of Amgen mAb sample using Protein Simple Preparation Profiles are consistent with historical data for mAbs tested
Maurice Data
%LMW %LC %MMW1 %MMW2 %NGHC %HC %Post HC %HMW1 %HMW2ND 31.55 0.6 0.1 0.65 67.18 0.67 0.1 0.2
Historical Data
%LMW %LC % MMW1 %MMW2 %NGHC %HC %Post HC %HMW1 %HMW20.18 30.98 0.3 0.23 0.66 66.94 0.62 0.09 ND
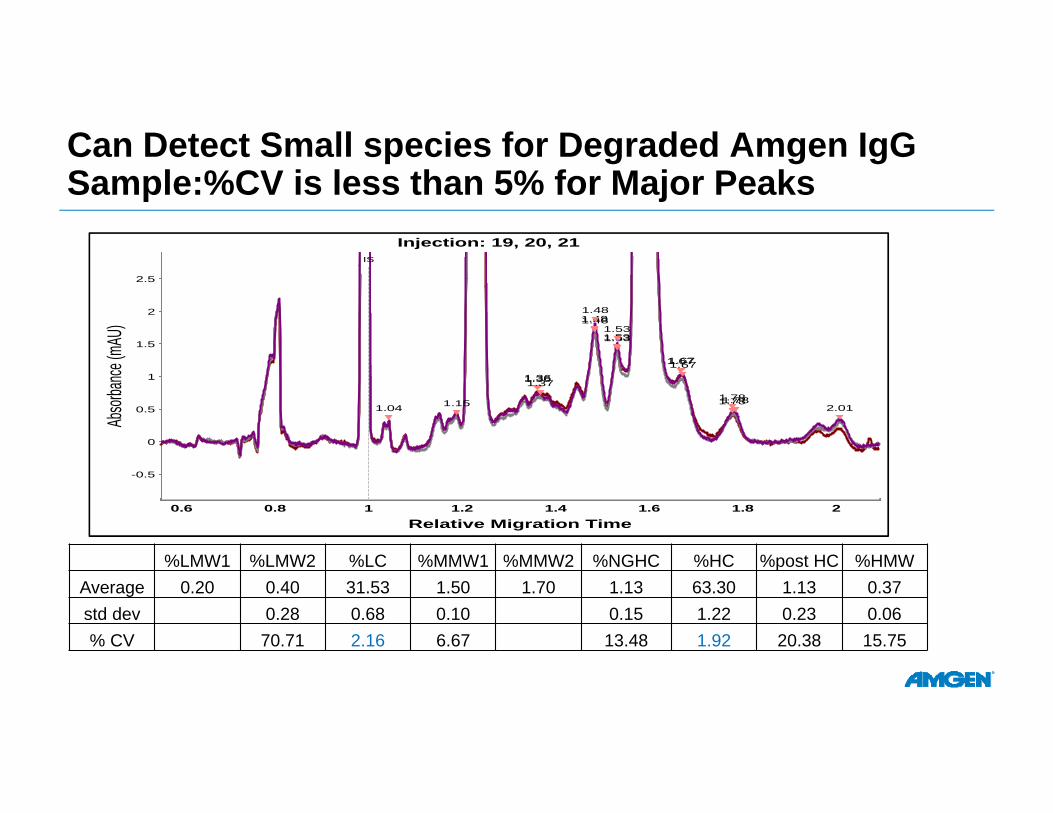
Can Detect Small species for Degraded Amgen IgG Sample:%CV is less than 5% for Major Peaks
Injection: 19, 20, 21
0.6 0.8 1 1.2 1.4 1.6 1.8 2Relative Migration Time
-0.5
0
0.5
1
1.5
2
2.5
Absor
bance
(mAU
)
1.36
1.48
1.53
1.67
1.781.04 1.15
1.37
1.48
1.53
1.67
1.782.01
1.36
1.48
1.53
1.67
1.78
AMG 785, 25C (I19)AMG 785, 25C (I20)AMG 785, 25C (I21)
IS
%LMW1 %LMW2 %LC %MMW1 %MMW2 %NGHC %HC %post HC %HMWAverage 0.20 0.40 31.53 1.50 1.70 1.13 63.30 1.13 0.37std dev 0.28 0.68 0.10 0.15 1.22 0.23 0.06% CV 70.71 2.16 6.67 13.48 1.92 20.38 15.75
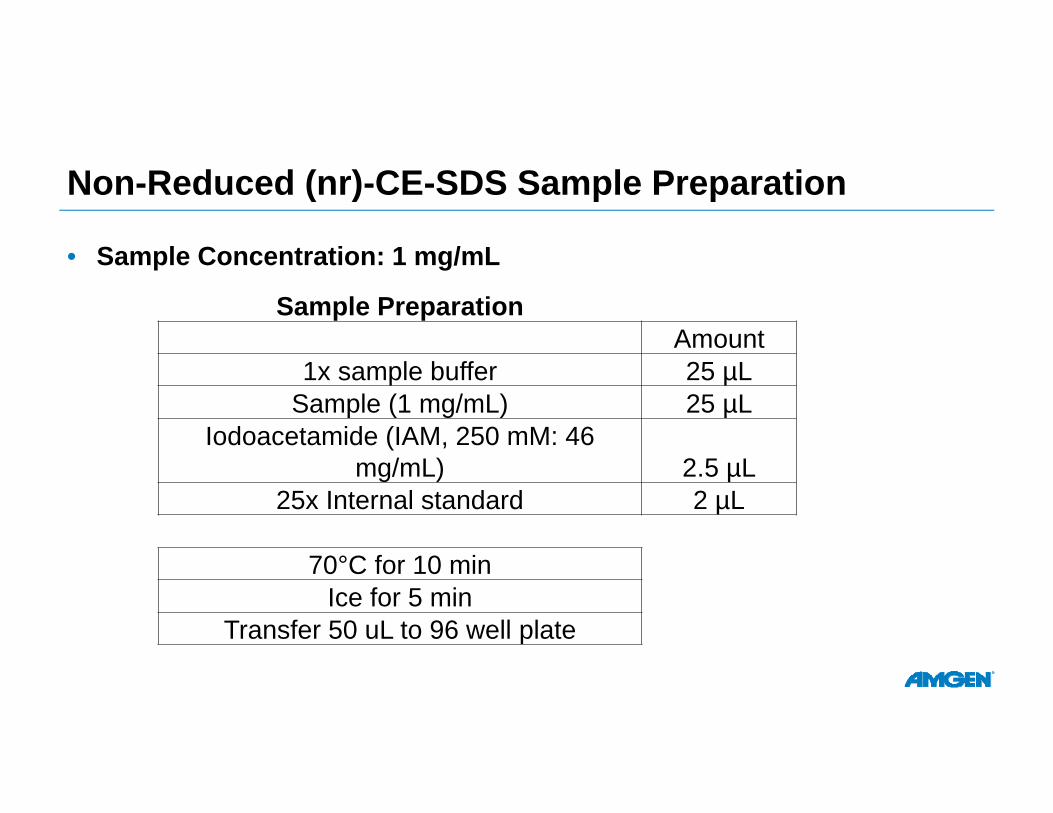
Non-Reduced (nr)-CE-SDS Sample Preparation
• Sample Concentration: 1 mg/mL
Sample PreparationAmount
1x sample buffer 25 µLSample (1 mg/mL) 25 µL
Iodoacetamide (IAM, 250 mM: 46 mg/mL) 2.5 µL
25x Internal standard 2 µL
70°C for 10 minIce for 5 min
Transfer 50 uL to 96 well plate
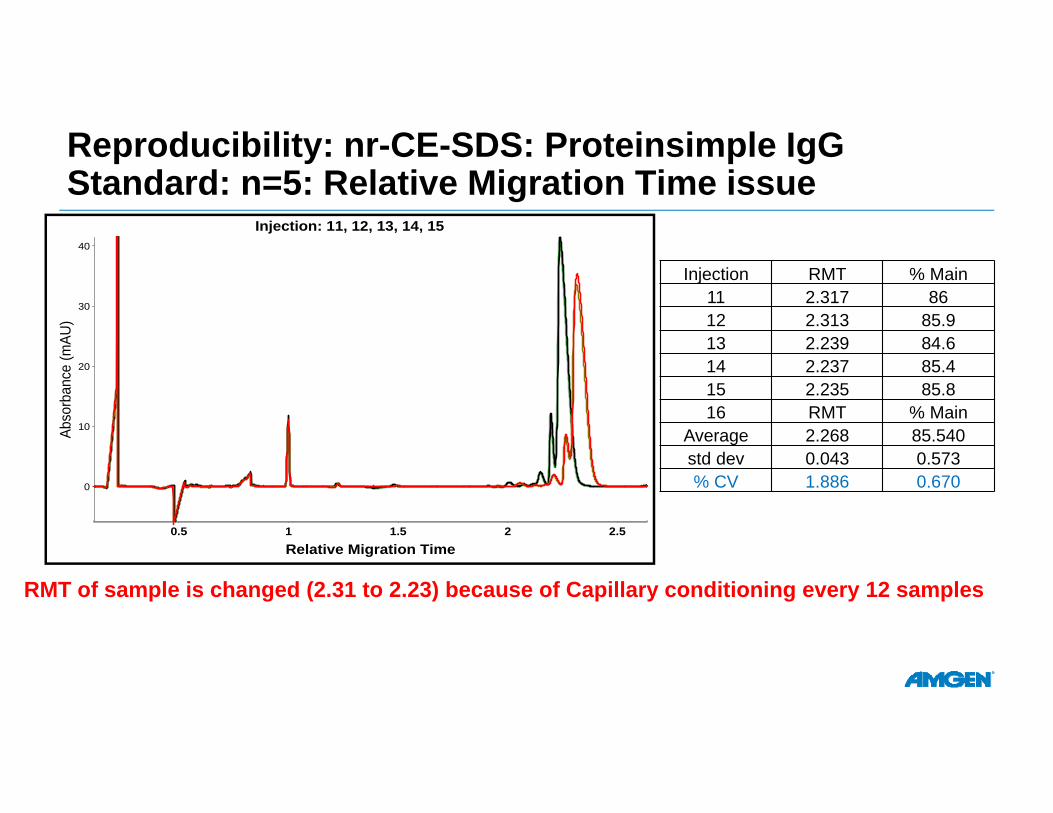
Reproducibility: nr-CE-SDS: Proteinsimple IgG Standard: n=5: Relative Migration Time issue
Injection RMT % Main11 2.317 8612 2.313 85.913 2.239 84.614 2.237 85.415 2.235 85.816 RMT % Main
Average 2.268 85.540std dev 0.043 0.573% CV 1.886 0.670
Injection: 11, 12, 13, 14, 15
0.5 1 1.5 2 2.5Relative Migration Time
0
10
20
30
40
Abso
rban
ce (m
AU)
RMT of sample is changed (2.31 to 2.23) because of Capillary conditioning every 12 samples
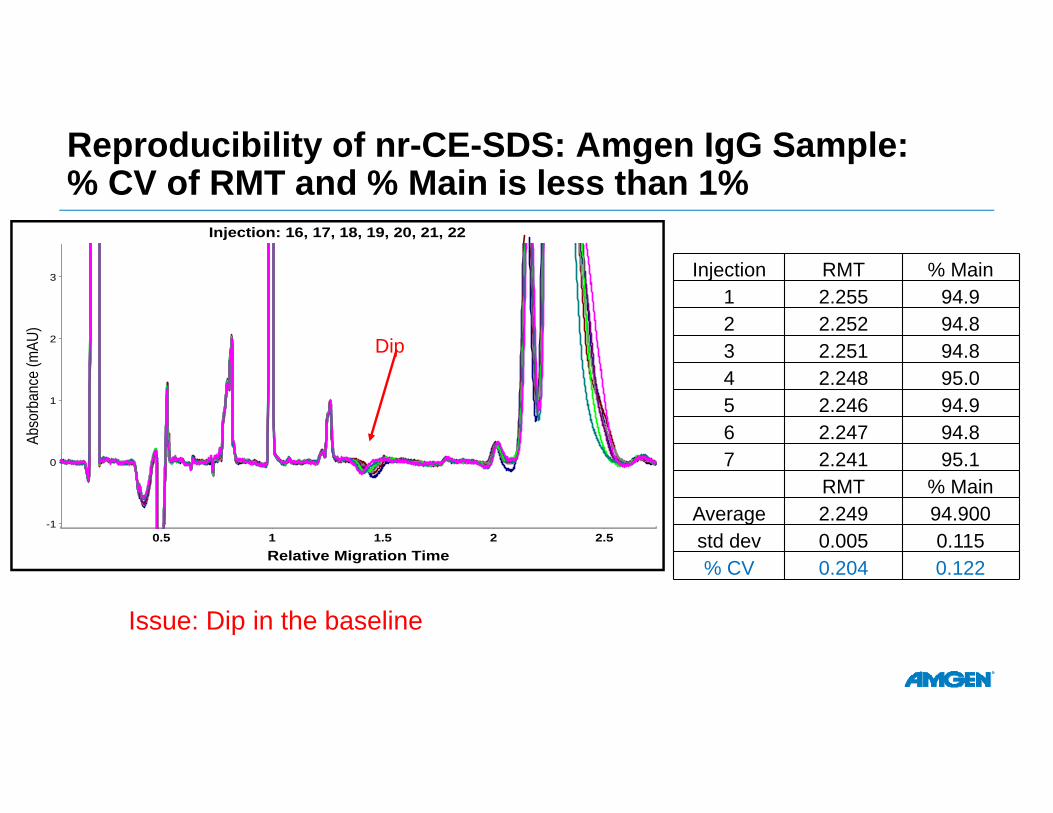
Reproducibility of nr-CE-SDS: Amgen IgG Sample: % CV of RMT and % Main is less than 1%
Injection RMT % Main1 2.255 94.92 2.252 94.83 2.251 94.84 2.248 95.05 2.246 94.96 2.247 94.87 2.241 95.1
RMT % MainAverage 2.249 94.900std dev 0.005 0.115% CV 0.204 0.122
Injection: 16, 17, 18, 19, 20, 21, 22
0.5 1 1.5 2 2.5Relative Migration Time
-1
0
1
2
3
Abso
rban
ce (m
AU)
Dip
Issue: Dip in the baseline
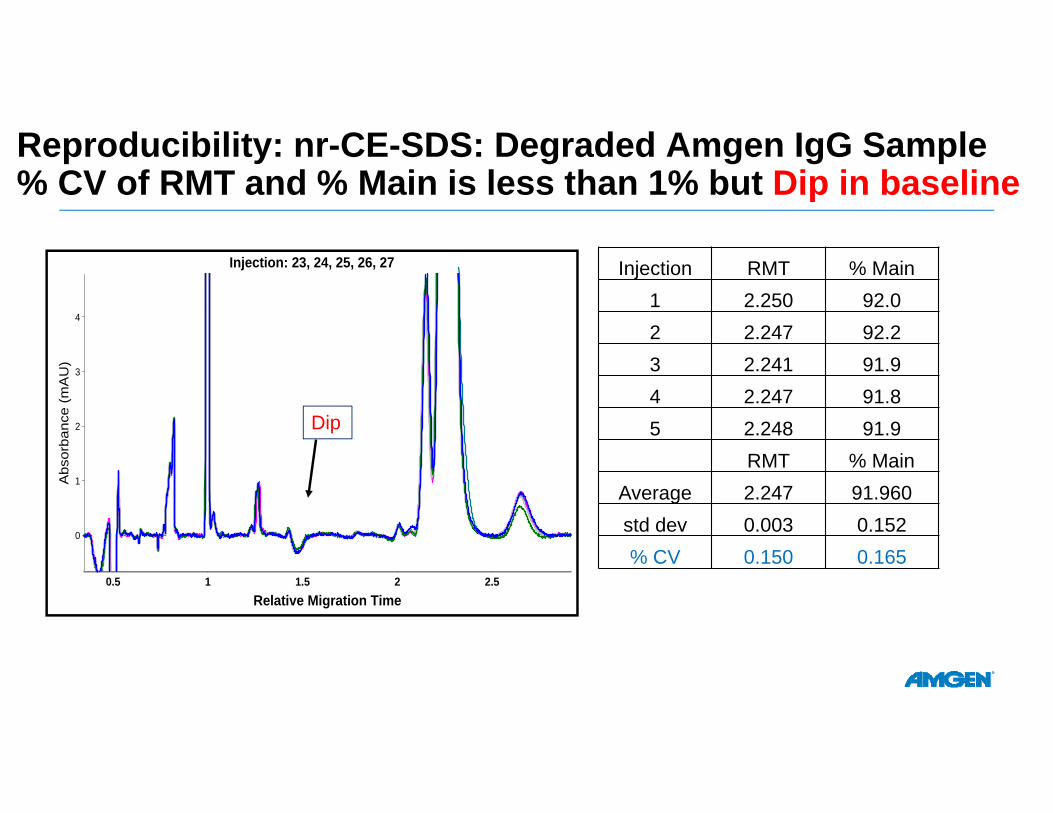
Reproducibility: nr-CE-SDS: Degraded Amgen IgG Sample% CV of RMT and % Main is less than 1% but Dip in baseline
Injection RMT % Main1 2.250 92.02 2.247 92.23 2.241 91.94 2.247 91.85 2.248 91.9
RMT % MainAverage 2.247 91.960std dev 0.003 0.152% CV 0.150 0.165
Injection: 23, 24, 25, 26, 27
0.5 1 1.5 2 2.5Relative Migration Time
0
1
2
3
4
Abs
orba
nce
(mA
U)
Dip
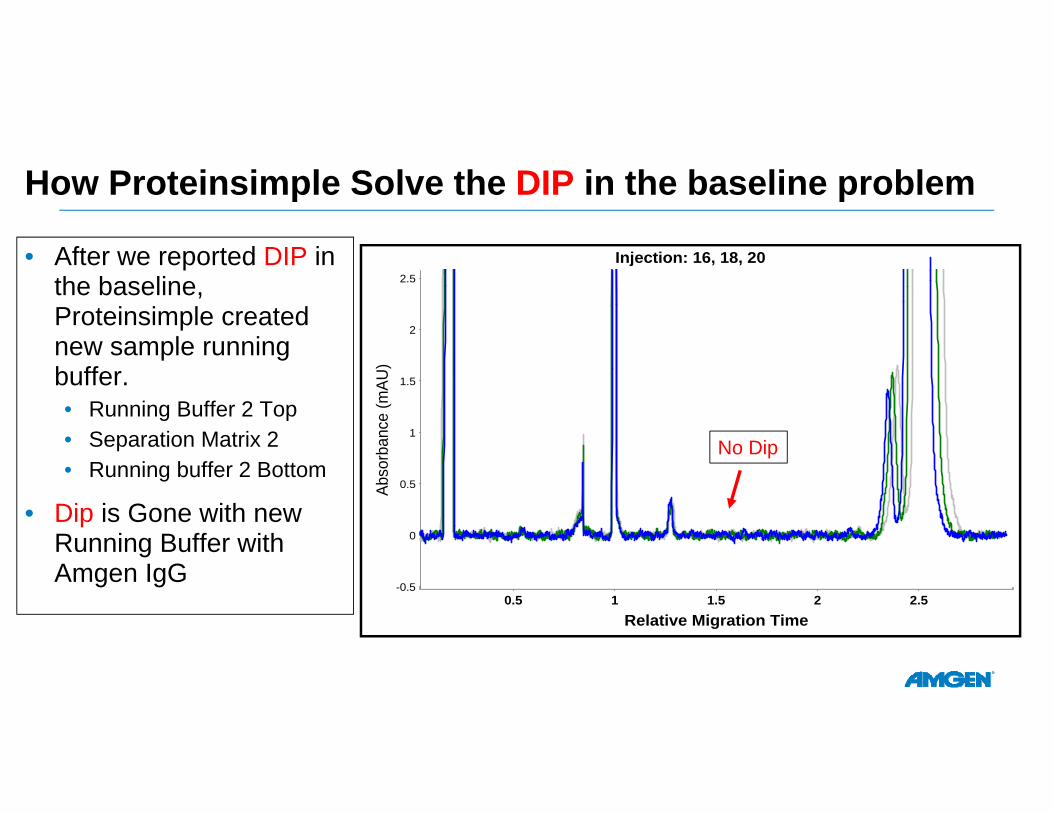
How Proteinsimple Solve the DIP in the baseline problem
• After we reported DIP in the baseline, Proteinsimple created new sample running buffer.• Running Buffer 2 Top• Separation Matrix 2• Running buffer 2 Bottom
• Dip is Gone with new Running Buffer with Amgen IgG
Injection: 16, 18, 20
0.5 1 1.5 2 2.5Relative Migration Time
-0.5
0
0.5
1
1.5
2
2.5
Abso
rban
ce (m
AU)
No Dip
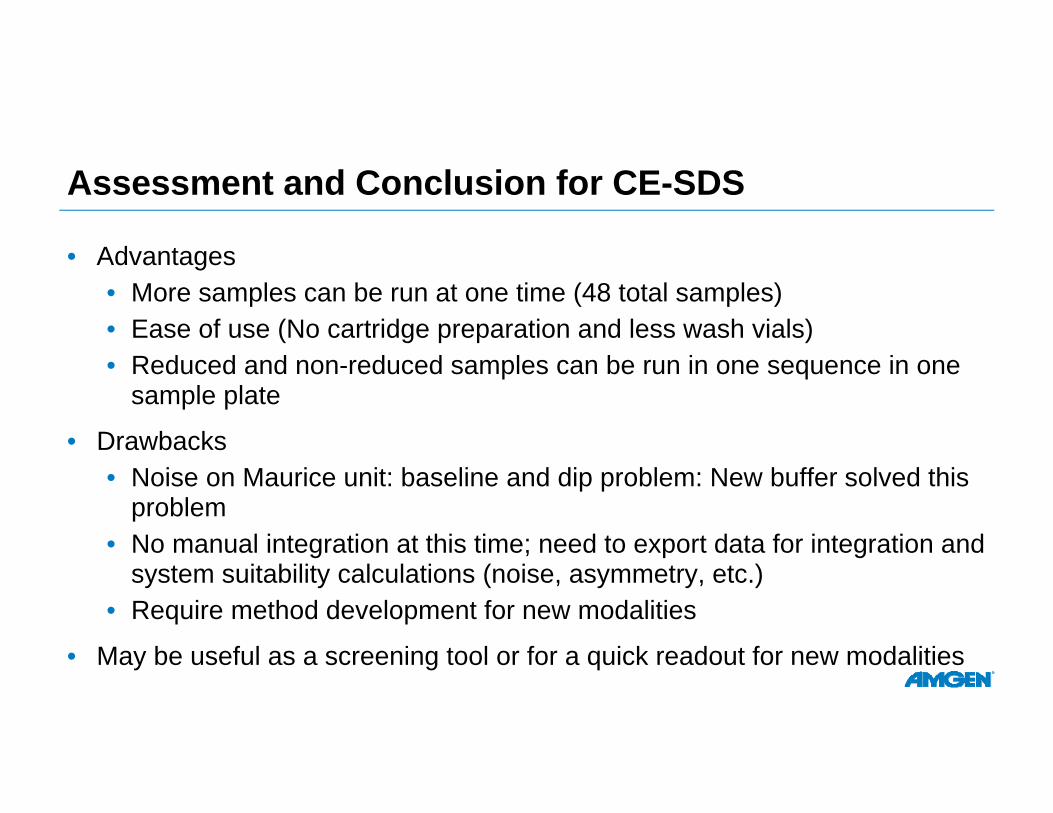
Assessment and Conclusion for CE-SDS
• Advantages• More samples can be run at one time (48 total samples)• Ease of use (No cartridge preparation and less wash vials)• Reduced and non-reduced samples can be run in one sequence in one
sample plate
• Drawbacks• Noise on Maurice unit: baseline and dip problem: New buffer solved this
problem• No manual integration at this time; need to export data for integration and
system suitability calculations (noise, asymmetry, etc.)• Require method development for new modalities
• May be useful as a screening tool or for a quick readout for new modalities
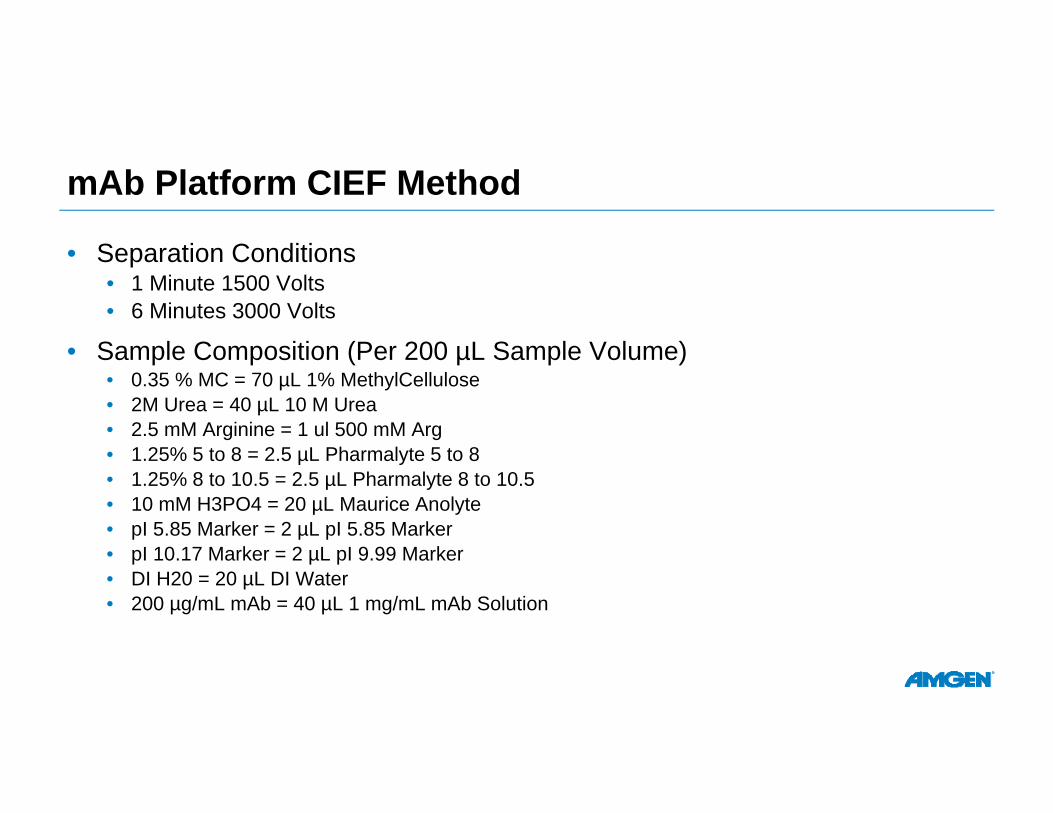
mAb Platform CIEF Method
• Separation Conditions• 1 Minute 1500 Volts• 6 Minutes 3000 Volts
• Sample Composition (Per 200 µL Sample Volume)• 0.35 % MC = 70 µL 1% MethylCellulose• 2M Urea = 40 µL 10 M Urea • 2.5 mM Arginine = 1 ul 500 mM Arg• 1.25% 5 to 8 = 2.5 µL Pharmalyte 5 to 8• 1.25% 8 to 10.5 = 2.5 µL Pharmalyte 8 to 10.5• 10 mM H3PO4 = 20 µL Maurice Anolyte • pI 5.85 Marker = 2 µL pI 5.85 Marker• pI 10.17 Marker = 2 µL pI 9.99 Marker• DI H20 = 20 µL DI Water• 200 µg/mL mAb = 40 µL 1 mg/mL mAb Solution
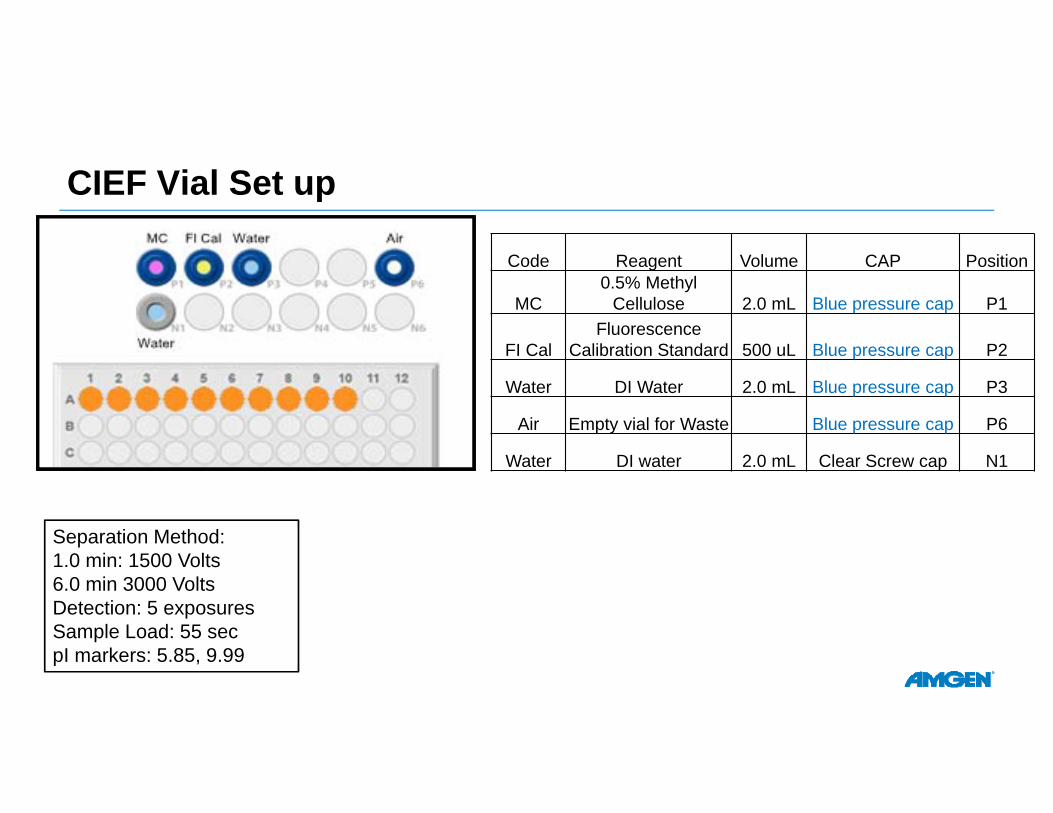
CIEF Vial Set up
Separation Method: 1.0 min: 1500 Volts6.0 min 3000 VoltsDetection: 5 exposuresSample Load: 55 secpI markers: 5.85, 9.99
Code Reagent Volume CAP Position
MC0.5% Methyl
Cellulose 2.0 mL Blue pressure cap P1
FI CalFluorescence
Calibration Standard 500 uL Blue pressure cap P2
Water DI Water 2.0 mL Blue pressure cap P3
Air Empty vial for Waste Blue pressure cap P6
Water DI water 2.0 mL Clear Screw cap N1
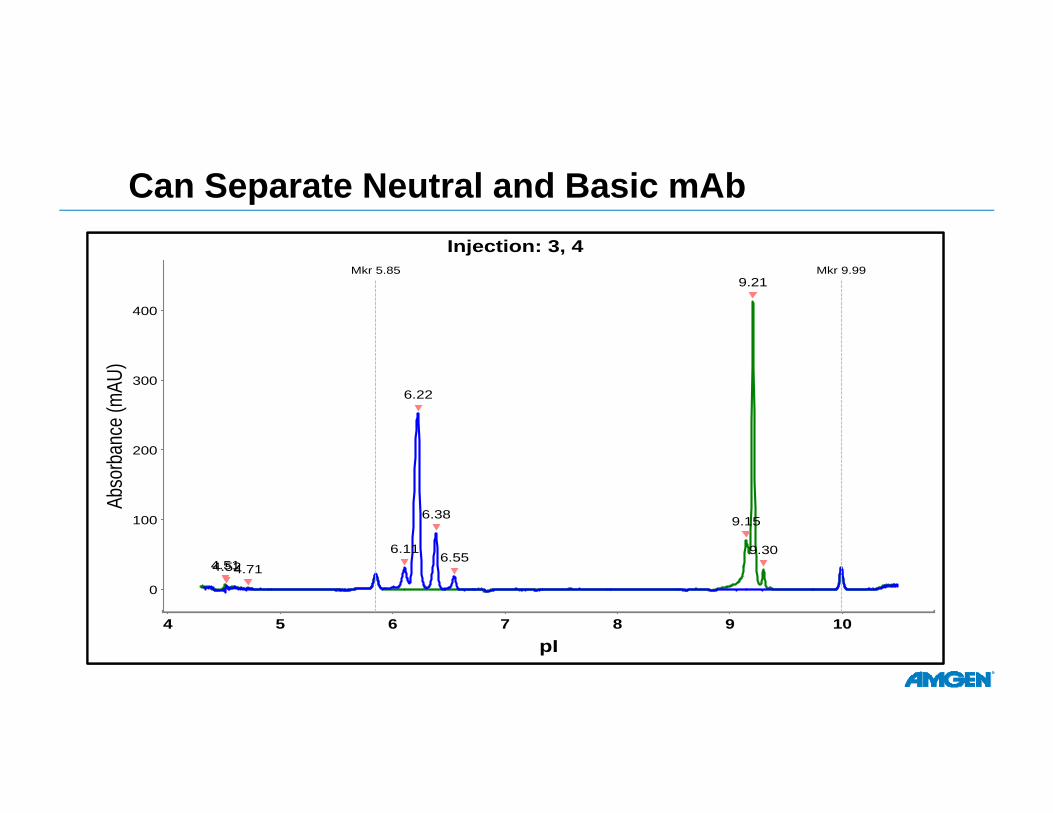
Can Separate Neutral and Basic mAbInjection: 3, 4
4 5 6 7 8 9 10pI
0
100
200
300
400
Abso
rban
ce (m
AU)
4.51
9.15
9.21
9.304.524.71
6.11
6.22
6.38
6.55
Mkr 5.85 Mkr 9.99
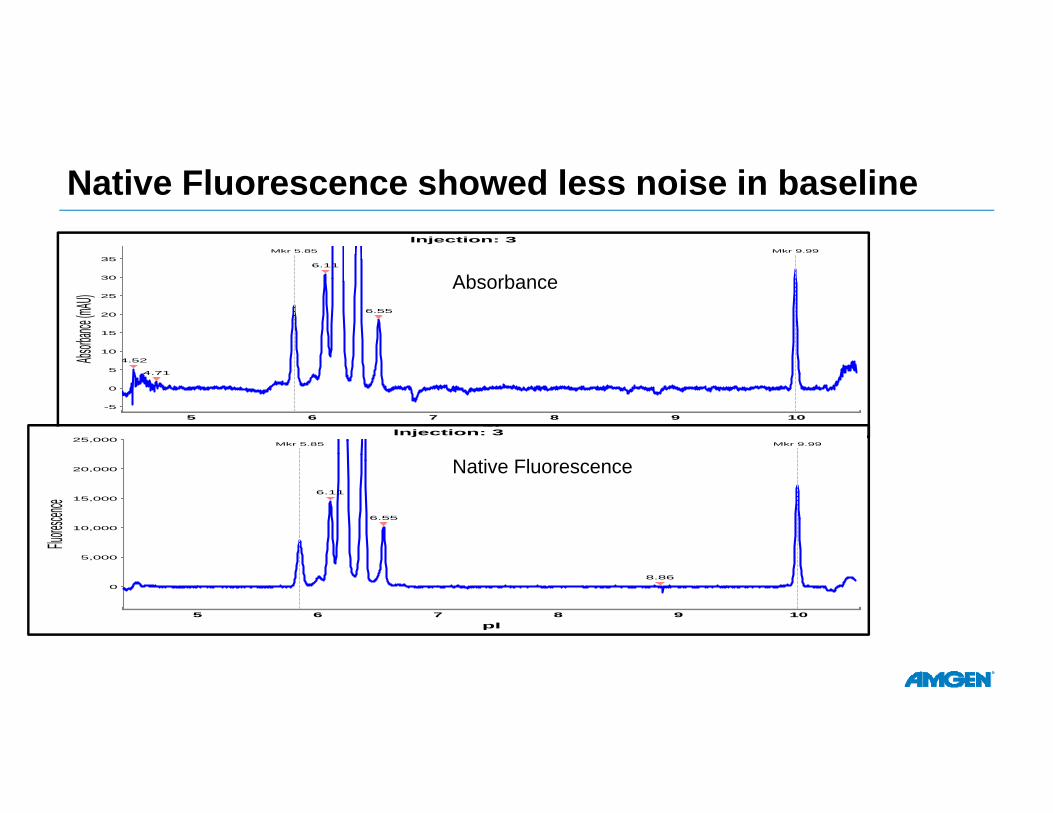
Native Fluorescence showed less noise in baselineInjection: 3
5 6 7 8 9 10pI
-5
0
5
10
15
20
25
30
35
Absorba
nce (mA
U)
4.52
4.71
6.11
6.55
Mkr 5.85 Mkr 9.99
Injection: 3
5 6 7 8 9 10pI
0
5,000
10,000
15,000
20,000
25,000
Fluoresc
ence
6.11
6.55
8.86
Mkr 5.85 Mkr 9.99
Absorbance
Native Fluorescence
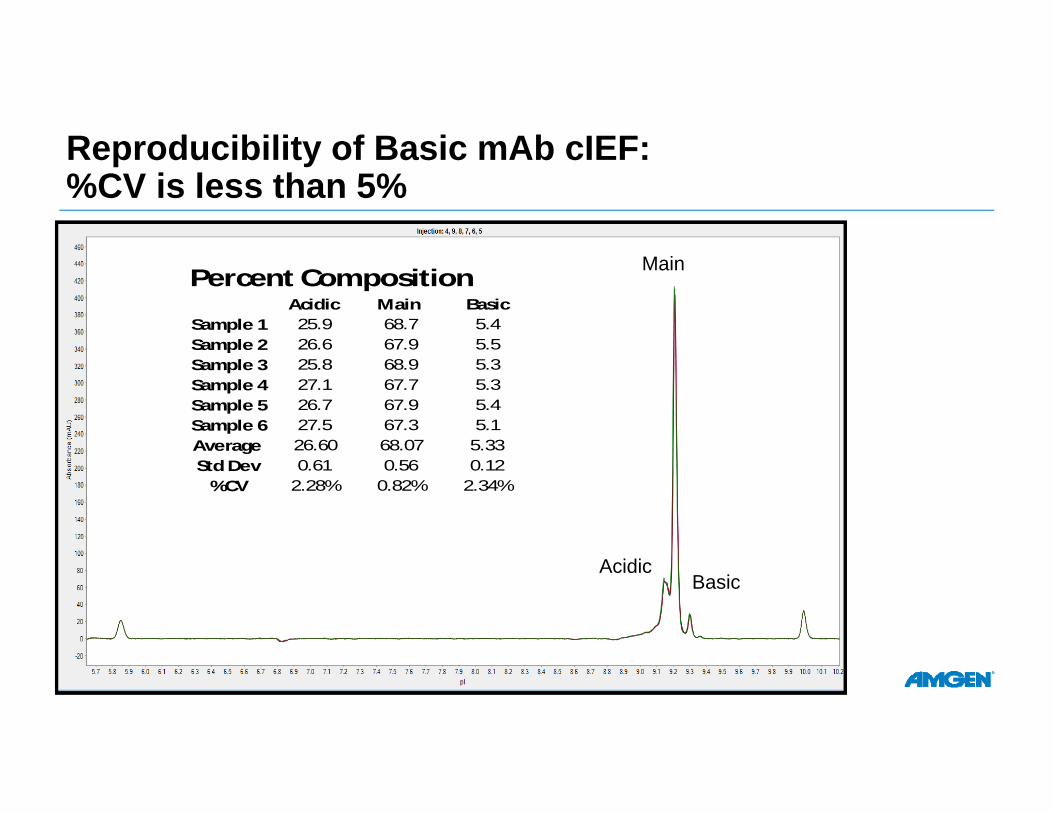
Reproducibility of Basic mAb cIEF: %CV is less than 5%
Percent CompositionAcidic Main Basic
Sample 1 25.9 68.7 5.4Sample 2 26.6 67.9 5.5Sample 3 25.8 68.9 5.3Sample 4 27.1 67.7 5.3Sample 5 26.7 67.9 5.4Sample 6 27.5 67.3 5.1Average 26.60 68.07 5.33Std Dev 0.61 0.56 0.12
%CV 2.28% 0.82% 2.34%
Acidic
Main
Basic
Assessment and Conclusion for CIEF
• Advantages• Native fluorescence detection in CIEF mode for higher sensitivity• Ease of use (No cartridge preparation)• Shorter runtime for CIEF method: 10 min. vs. 60 min• Faster method development for new modalities
• Drawbacks• Need simple sample preparation such as automatic dilution• No manual integration at this time; need to export data for integration and system
suitability calculations (noise, asymmetry, etc.)• Require method development for new modalities
What Can “Maurice” Do?
• Analyze by CIEF and CE-SDS methods
• Simple Cartridge format: No cartridge preparation and Easy Installation
• Smaller footprint with an integrated autosampler with 96 well plate
• 48 samples in one sequence
• Native fluorescence detection in CIEF mode for higher sensitivity
• Analyze reduced and Non-reduced CE-SDS in one sample plate
Acknowledgement
• Jeremy Primack
• Richard Wu
• Matt Fesinmeyer
• Sugu Patro
• Sharel Figueredo
• Tufan Aydogdu
• Scott Mack
• Craig Magee
• Jiang Xin