Embed Size (px)
Citation preview

KLINIK UND POLIKLINIK FÜR INNERE MEDIZIN I PROF. DR. MARTINA MÜLLER-SCHILLING
DER MEDIZINISCHEN FAKULTÄT DER UNIVERSITÄT REGENSBURG
ANALYSIS OF SYSTEMIC MONOCYTE CHEMOATTRACTANT PROTEIN-1 LEVELS IN PATIENTS WITH AND WITHOUT SONOGRAPHIC EVIDENT HEPATIC
STEATOSIS
Inaugural – Dissertation zur Erlangung des Doktorgrades
der Medizin
der Fakultät für Medizin
der Universität Regensburg
vorgelegt von Hanna Huber
2012

Dekan: Prof. Dr. Dr. Torsten E. Reichert
1. Berichterstatter: Prof. Dr. Claus Hellerbrand
2. Berichterstatter: PD Dr. Stefan Farkas
Tag der mündlichen Prüfung: 19.02.2013

Vergleich der Serum MCP-1-Spiegel bei Personen mit und ohne sonographisch
evidenter Steatosis Hepatis
Einleitung - Nicht-alkoholische Fettlebererkrankung und MCP-1
Die Nicht-alkoholischen Fettlebererkrankungen (NAFLD) werden je nach
Fortschreiten der Erkrankung in die drei Schweregrade der reinen Fettleber
(Steatosis hepatis), der Nicht-alkoholischen Steatohepatitis (NASH) und der
Fettleberzirrhose unterteilt.
Die Entstehung der NASH beruht dabei auf zwei Schritten. Im ersten Schritt (first hit)
kommt es zur Fetteinlagerung in der zuvor gesunden Leber, getragen vor allem
durch ungesunde Ernährung und gestörte Zuckerverwertung im Rahmen des
metabolischen Syndroms (1, 2). Anschließend (second hit) entsteht durch einen
entzündlichen Prozess eine Fettleberhepatitis, im Zuge derer Leberzellen zerstört
werden. Dabei spielen mehrere Signalwege, darunter auch Chemokin-vermittelte
eine zentrale Rolle. Insbesondere das Chemokin Monozyten-chemoattractant
Protein-1 (MCP-1) kann bei diesem Schritt vermehrt nachgewiesen werden (3, 4).
Die vorliegende Arbeit zeigt, dass MCP-1 nicht erst im Entzündungsprozess, sondern
bereits im Stadium der Leberverfettung vermehrt sein könnte. Relevant wird dieses
Ergebnis, wenn man berücksichtigt, dass im Rahmen von Routine-
Ultraschalluntersuchungen des Abdomen häufig eine Fettleber detektiert wird.

Patienten und Methode
In einer Gemeinschaft von 3 Studenten wurden von Januar 2008 bis Januar 2009
506 Patienten, die aufgrund unterschiedlicher Indikationen dem Ultraschallzentrum
des Uniklinikums Regensburg zugewiesen wurden, untersucht. Nach einer
ausführlichen Anamnese und körperlichen Untersuchung wurden standardisierte
Ultraschalluntersuchungen durchgeführt. Dabei wurde insbesondere auf Zeichen der
Leberverfettung geachtet: die Echogenität, die Struktur der Leber, ihre Oberfläche
und eventuell vorhandene Leberraumforderungen wurden beurteilt. Außerdem
wurden der Pfortaderfluss, sowie die Lebergröße ausgemessen.
Nach einer nüchtern durchgeführten Blutentnahme bei den Studienteilnehmern
wurden zudem unterschiedliche Serumparameter bestimmt. Mittels ELISA-Tests
wurden die MCP-Spiegel bestimmt.
Ergebnisse
In dieser Studie konnte kein Zusammenhang zwischen den gemessenen MCP-1-
Werten und dem Alter, Geschlecht und Zigarettenkonsum festgestellt werden.
Allerdings fand sich unter den Rauchern eine Korrelation zwischen erhöhten MCP-1-
Werten und der Menge sowie der Dauer des Nikotinkonsums (p=0,012).
Bei Patienten mit metabolischem Syndrom wurden signifikant erhöhte MCP-1-
Spiegel bei erhöhtem BMI (p=0,018), Taillenumfang (p=0,028), erhöhter Blutglukose
(p<0,001) und bei erniedrigtem HDL-Cholesterin (p=0,048) gemessen.
Erhöhte MCP-1-Werte zeigten sich ebenfalls bei erhöhten ALT-Werten (p=0,047).

Bei sonographisch nachgewiesener NAFLD konnten höhere MCP-1-Werte im
Vergleich zur Kontrollgruppe ohne NAFLD festgestellt werden (p=0,042). Keine
Korrelation bestand zwischen MCP-1-Serum-Spiegeln und Pfortaderfluss,
beziehungsweise der Lebergröße.
Diskussion
Zusammenfassend konnte eine Korrelation des MCP-1-Spiegels mit verschiedenen
Merkmalen des metabolischen Syndroms bestätigt werden (5, 6). Wie bereits durch
Haukeland und Kollegen (3) beschrieben, wurden in dieser Studie erhöhte MCP-1-
Werte bei Patienten mit sonographisch nachgewiesener Nicht-alkoholischer
Fettlebererkrankung gemessen. Auch die Serum-Transaminasen zeigten eine
positive, signifikante Korrelation mit MCP-1 (5).
Obwohl histologische Untersuchungen zur Abgrenzung einer reinen Nicht-
alkoholischen Fettlebererkrankung zur Hepatitis fehlen, kann aufgrund von
epidemiologischen Studien (7) jedoch davon ausgegangen werden, dass erhöhte
MCP-1-Werte bereits in einem frühen Stadium der Leberverfettung auftreten.
In diesem Stadium der Fetteinlagerung kann man die erhöhten MCP-1-Werte zum
einen aus dem Lebergewebe selbst erwarten, zum anderen auch durch eine
vermehrte MCP-1-Produktion im Bauchfett erklären. Diese Chemokin-Sekretion aus
dem Fettgewebe kann die Leber direkt über die Pfortader erreichen und somit
zusätzlich den weiteren Prozess zur Steatohepatitis entscheidend fördern.

I
Table of contents I
Abbreviations II
1 Introduction
1.1 Non-alcoholic fatty liver disease 1
1.2 Pathogenesis of Non-alcoholic steatohepatitis 6
1.2.1 First hit – exogenous and endogenous factors 7
1.2.2 Second hit – necroinflammatory response 8
1.3 Chemokines and Monocyte-chemoattractant-protein-1 10
1.4 Aim of the study 13
2 Patients and Methods
2.1 Patients 14
2.2 Methods 15
2.2.1 Questionnaire 15
2.2.2 Anthropometric measurements and clinical examination 16
2.2.3 Biochemical analysis of serum parameters 16
2.2.4 Ultrasound examination 17
2.2.5 Serum analysis of MCP-1 levels 22
2.2.6 Statistical analysis 23
3 Results 24
4 Discussion 28
References 31
Annexe 37

II
Abbreviations
ALT Alanine aminotransferase
AST Aspartate aminotransferase
BMI Body mass index
CCL2 Chemokine (C-C motif) ligand 2 = MCP-1
CCR2 Chemokine (C-C motif) receptor 2
ELISA Enzyme-linked immunosorbent assay
FFA Free fatty acid
GLUT 4 Glucose transporter type 4
GOT Glutamate Oxalacetate Transaminase
GPT Glutamate Pyruvate Transaminase
HCC Hepatocellular carcinoma
HDL High density lipoprotein
HIV Human Immunodeficiency Virus
HSC Hepatic stellate cells
IDF International Diabetes Federation
LDL Low density lipoprotein
MCL Medioclavicular line
MCP-1 Monocyte-chemoattractant-protein-1
NAFL Non-alcoholic fatty liver
NAFLD Non-alcoholic fatty liver disease
NASH Non-alcoholic steatohepatitis
TNF-α Tumor-necrosis factor α
VLDL Very low density lipoprotein
WHO World Health Organisation
γ-GT γ-Glutamyl Transferase

1
1 Introduction
1.1 Non-alcoholic fatty liver disease
Non-alcoholic fatty liver (NAFL) is recognized as the most common cause of chronic
liver disease, especially in the “Western world” (1, 2, 8, 9).
Ludwig et al described the non-alcoholic fatty liver disease (NAFLD) already in 1980
(10), and prosperity leads to the increasing importance of this disease. Today NAFLD
is even considered as part of the metabolic syndrome or as its “hepatic
manifestation”, respectively (1, 2).
NAFLD is defined by a significant lipid accumulation in hepatic tissue in the absence
of chronic alcohol consumption (11, 12) (less than 20g/d for men, and 10g/d ethanol for
women (8)). It includes simple steatosis, its most benign form, non-alcoholic
steatohepatitis (NASH) and liver cirrhosis (2).
Figure 1: NAFLD includes non-alcoholic steatosis, NASH and progressive liver cirrhosis

2
Epidemiology and risk factors
Approximately 20%-30% of our population have NAFLD (9, 11, 13, 14). The prevalence of
NASH is 2% to 3% (13, 15). Only in the Caucasian race, the prevalence in men is
higher than in women (14). Overall, this disease increases with preceding age (13).
Aetiology
Causes of fatty liver are manifold, and categorize the NAFLD in “primary” or
“secondary” (8): Primary NAFLD is associated with obesity, insulin resistance, and the
metabolic syndrome (13).
Association with the metabolic syndrome
Although the metabolic syndrome is an increasing disease in the “Western world” and
associated with a high risk of cardiovascular morbimortality (9, 16), there is no uniform
definition of this syndrome. Some medical organisations like the World Health
Organisation (WHO) or the International Diabetes Federation (IDF, Fig. 2) have tried
to summarise different criteria: The most important factor, which needs to be
included, is the presence of central obesity with a waist circumference of more than
94cm for men and more than 80cm for women (17). Lifestyle and prosperity lead to
raised blood pressure (over 130mmHg systolic or over 85mmHg diastolic) and raised
fasting plasma glucose over 100mg/dl, respectively 110mg/dl, or type-2-diabetes
mellitus (17). In consequence to the renal damage, urine samples often show micro
albuminuria. Furthermore, raised triglycerides over 150mg/dl and reduced high-
density lipoprotein (HDL-) cholesterol (less than 40mg/dl for males and less than
50mg/dl for females) can be analysed in blood samples of adipose individuals (17).

3
Figure 2: Definition of the Metabolic Syndrome according to the International Diabetes Federation
of 2005: Beside central obesity, two of the following four criteria are needed: raised triglycerides,
reduced HDL cholesterol, raised blood pressure or raised fasting plasma glucoe or type-2-
diabestes mellitus.
The NAFLD is considered to be the “hepatic manifestation of metabolic syndrome” (1,
2).
On the one hand, patients with NAFLD are commonly obese (18), have
hypertriglyceridemia, decreased levels of high density lipoprotein (HDL) cholesterol
and hypertension (9, 11, 12, 13, 19). Moreover, patients with a fatty liver might encounter a
higher risk of developing Type 2 diabetes (20, 21).
On the other hand, a high number of patients with metabolic syndrome have steatotic
livers (22). These two perspectives affirm both the metabolic cause of primary NAFLD.

4
Secondary NAFLD includes viral infections, autoimmune or hereditary diseases,
hepatotoxins and drugs such as glucocorticoids or antiestrogens. Furthermore,
endocrine metabolic conditions, nutritional causes and jejuno-ileal bypass surgery
may cause NAFLD (13).
Clinic
Most patients are asymptomatic or have mild, non-characteristic right upper quadrant
complaints (18, 20), some complain of fatigue (18). Apart from hepatomegaly, the clinical
examination is often unremarkable (18). In this case, it is helpful to measure the waist
circumference or to diagnose the BMI in order to prove central obesity.
Blood test results
In the initial stage of liver disease there is a short rise in γ-Glutamyl Transferase (γ-
GT), and subsequently in Glutamate Pyruvate Transaminase (GPT) and Glutamate
Oxalacetate Transaminase (GOT) (18, 23). Afterwards only a fraction of NASH patients
have elevated transaminases (24).
Elevated GPT and degree of abnormal liver lipid levels are predictive of severe
NAFLD graded by ultrasound (1, 11, 23). The GOT:GPT ratio is usually less than 1 (18,
23), a ratio greater than 1 suggests advanced fibrosis (11, 13).
In addition, hyperglycaemia caused in context with diabetes is present in
approximately one-third of patients (18). Furthermore, hyperlipidaemia is often present
(18).
Sonography
A referral to a sonography is often precipitated by abnormal liver enzyme levels,
detected by routine evaluations (11). An increased parenchymal echogenicity can be

5
considered as a reliable criterion for diagnosing fatty liver (1, 25, 26) although a
sensitivity of approximately 83% has to be admitted (27). Although, sonography does
not distinguish between fatty liver and steatohepatitis (12), it represents a valid method
to detect hepatic steatosis (1, 25, 26).
Histology
Liver biopsy remains the “gold standard” for the diagnosis of NAFLD (18). It allows the
simple steatosis to be kept apart from NASH and to stage the disease (12). The initial
lesion of NAFLD is steatosis, but can be accompanied by early mild diffuse lobular
inflammation (11, 23, 28). Afterwards, an increasing inflammation combined with features
of liver cell injury, characterise the steatohepatitis (29, 30). Subsequent liver fibrosis is
the result of progressive collagen deposition (30).
Therapy
Initial therapy for all NAFLD patients should be a complete change of lifestyle (8, 18, 20,
31). Ten per cent weight loss can improve steatosis (12), but more consistent weight
loss may also improve necroinflammation and overall activity in NASH (8). In addition,
there are only experimental but no clinically established therapies (8, 23, 32). There are
no established therapeutic agents, which can reverse fibrosis (32).
Prognosis
NASH develops into fibrosis or cirrhosis within five to ten years in about 10% to 40%
of all cases (23). Cirrhosis related to NASH has also been shown to be associated with
an increased risk of Hepatocellular carcinoma (33).

6
1.2 Pathogenesis of NASH
NAFLD encompasses a spectrum of hepatic pathology, ranging from simple steatosis
(NAFL), its most benign form, to non-alcoholic steatohepatitis (NASH) and liver
cirrhosis (2). The two-hit hypothesis separates the pathway to steatohepatitis into two
different parts (23):
The first hit symbolizes the accumulation of triglycerides in the liver (23, 34), called
steatosis. According to the fat content, one can subdivide the fatty degeneration in
two groups: “Liver steatosis” is defined as a condition in which disseminated liver
cells have a fat content of 3-10% of the liver wet weight (23). In cases where the fat
storage is over 10% of the liver wet weight in over 50% of the hepatocytes it is called
“fatty liver” (23). Steatosis alone is considered to be relatively innocuous and is usually
reversible (34).
The second hit involves an inflammatory insult in combination with deregulated
cytokine production and oxidative stress to the liver (34), leading to steatohepatitis. It
is characterized by hepatocellular injury and death.
The development of inflammation determines whether a patient progresses to
irreversible liver damage and fibrosis or not (34).

7
1.2.1 First hit - exogenous and endogenous factors
Exogenous and endogenous pathogenic factors which disturb the lipid metabolism
may be responsible for the development of liver steatosis (2, 23).
The most important exogenous factor is the increase in lipid uptake from the intestine
(2, 8), associated with hyperalimentation especially in high-fat and high-cholesterol
diets which lead to lipid accumulation in the liver (35).
This malnutrition leads to obesity (23) and insulin resistance (2), which both change the
physiological lipid utilisation, symbolizing the endogenous factor to liver steatosis.
Insulin resistance leads to central elevated serum glucose levels with a concomitant
lack of glucose in peripheral cells. An elevated supply of glucose (or similar energy
sources) or better glucose utilization can improve this situation:
On the one hand, in peripheral adipose tissue, insulin resistance and glucose
deficiency enhance peripheral lipid mobilization with more lipolysis. This increases
the delivery of adipose-derived FFAs to the liver (2, 36, 37). Additionally, an inhibition of
lipid processing in hepatocytes and lower liver export rates lead to fat accumulation in
the liver (2, 23, 38).
On the other hand, more insulin is produced in order to improve the peripheral
glucose uptake. However, elevated serum levels of insulin also augment the feeling
of hunger, closing the circle to the increased lipid uptake, peripheral lipid mobilization
and the metabolic syndrome with obesity.

8
1.2.2 Second hit – necroinflammatory response
Several factors are involved in the progression of Steatosis to Steatohepatitis. This
process, called “necroinflammatory response” (3) includes systemic inflammation,
cytotoxic effects of free fatty acids, oxidative stress and an augmented adipocytokine
production.
Systemic inflammation and TNF-α
Patients with NAFLD are characterized by a chronic low-grade systemic inflammation
(39). This inflammation symbolizes the protective attempt of the liver to remove the
injurious stimuli of fat infiltration. It contains a balance between healing factors and
destruction. Macrophages secrete tumor necrosis factor-α (TNF-α), a cytokine that
plays an important pathogenetic role in the development of NASH (3, 4, 8, 39). It induces
oxidative stress, apoptosis and cytokine production, such as the secretion of MCP-1
(explained in detail below). Moreover TNF-α acts as insulin antagonist, leading to
peripheral lipolysis and in consequence elevates lipid offer to the liver.
In conclusion, NAFL progresses to NASH if the regulation of the inflammation
process overbalances. Adaptive mechanisms that protect hepatocytes become
overwhelmed, and rates of hepatocyte death begin to outstrip mechanisms that
normally regenerate dead hepatocytes (2).

9
Free fatty acids and oxidative stress
The phenomenon of peripheral insulin resistance leads to an increased delivery of
free fatty acids (FFAs) from fat deposits. These FFAs can be directly toxic to hepatic
cells (8, 11), and also the delivery causes abnormal quantities of reactive oxygen and
free radical production that can no longer be detoxified (40, 41).
Due to subsequent cytokine induction, hepatocellular injury especially in mitochondria
further progresses (23, 42).
Figure 3: Effects of free fatty acids: FFAs are directly toxic, induce cytokine production, cause
insulin resistance and produce oxidative stress.

10
1.3 Chemokines and MCP-1
The chemokine monocyte chemoattractant protein (MCP-1) plays an important role in
the conversion from simple steatosis to NASH (3). This cytokine is specifically
implicated in the inflammatory process but also sustains liver steatosis and
fibroinflammatory reactions.
Definition of chemokines
Chemokines or chemotactic cytokines (Greek -kinos, movement) are a family of more
than 50 small proteins with a molecular weight in the range of 8 to 12 kD (43) and
mediate chemo-attraction to regulate cell trafficking (44). Chemokines are released by
infected or damaged cells forming a concentration gradient. The attracted cells move
through the gradient towards the higher local concentration of chemokines (44).
Classification of chemokines
Chemokines are subdivided into four families, based on the number and spacing of
the conserved cysteine residues in the N-terminus of the protein (44), named “CXC”,
“CC”; “CX3C” and “C” (Fig. 4).
One major chemokine subfamily is called “CXC” because the two amino-acids which
are located next to the N-termini of these proteins are separated by a single amino-
acid.
This is in contrast to the other major subfamily which is called “CC”; these two
cysteines are adjacent.

11
Figure 4: Chemokines and their structure
Monocyte chemoattractant protein-1
Monocyte chemoattractant proteins (MCPs) are responsible for the development of
inflammatory responses by recruiting immune cells to sites of inflammation (45).
Monocyte chemoattractant protein-1 (MCP-1) was first identified as chemo-attractant
for monocytes, which are the precursors of macrophages, the “scavenger cells” of
cellular debris (44, 46). MCP-1 is a CC-chemokine, composed of 76 amino acids and
13kDa in size (47). After different stimuli such as TNF-α, macrophages and endothelial
cells produce MCP-1 (46).
MCP-1 interacts as “molecular signal transmitter” in the process of liver steatosis as
well as liver inflammation.

12
MCP-1 and fat accumulation
The monocyte chemoattractant protein-1 may induce steatosis by acting directly on
hepatocytes (37). It increases the hepatic expression of different liver genes that
regulate enzymes to induce fat accumulation (37, 46).
MCP-1 and inflammation
MCP-1 leads to an increased hepatic expression of proinflammatory cytokines (4) and
is a potent activator of leukocytes, macrophages and other cell types at the site of
inflammation (48).
Specialized macrophages in the liver, called Kupffer cells, are activated by MCP-1 (4).
These stimulated macrophages themselves may secrete a variety of chemokines and
other cytokines which further promote the local inflammatory reaction (46).
MCP-1 and adipose tissue
Adipose tissue, especially in obesity, is recognized as a metabolic active endocrine
organ which also has the capability of secreting cytokines like MCP-1 (2). MCP-1
leads to macrophage infiltration into the foci of inflammation, especially in the more
inflammatory visceral adipose tissue, as compared with subcutaneous adipose tissue
(2, 49, 50).
MCP-1 and insulin resistance
Additionally, MCP-1 can induce and boost insulin resistance (5, 45, 51) as a link
between inflammation and metabolic disease (35). In this context, MCP-1 inhibits
insulin-stimulated glucose uptake as well as the adipocyte expression of
metabolically important genes like glucose transporter type 4 (GLUT 4) (51).

13
A reduction in adipose tissue inflammation via inhibition of the MCP-1 receptor CCR2
function ameliorates both insulin resistance and hepatic steatosis (45, 52, 53).
Fibroinflammatory response
Several lines of evidence indicate that MCP-1 plays a role in the recruitment and
maintenance of the inflammatory infiltrate, but also in repair mechanism during liver
injury (45, 46, 54). After destruction of liver tissue, hepatic stellate cells (HSCs), also
known as Ito-cells, undergo a transdifferentiation to myofibroblast-like cells (2, 55, 56).
They are responsible for the secretion of extracellular matrix components (57) and
lead to fibrosis or cirrhosis (58, 59). Additionally, hepatic myofibroblasts express and
secrete different members of the CC chemokine subfamily, including MCP-1 (55, 60).
MCP-1 itself promotes the attraction of other HSCs (54), potentiating the fibrogenic
properties of the first HSC. This leads to an increasing distortion of the hepatic
architecture (8, 58).
1.4 Aim of the study
The study’s aim is to analyse serum MCP-1 levels in patients with sonographically
diagnosed fatty liver and to correlate serum MCP-1 levels with serological and clinic-
pathological parameters.

14
2 Patients and Methods
2.1 Patients
Initially, 506 randomly selected patients from different Departments of the University
Hospital Regensburg were included in this study. The cohort consisted of outdoor
patients and hospitalized patients, who were referred to the interdisciplinary
ultrasound department for sonographic examination of the abdomen from January
2008 to January 2009. The participants were divided into two groups according to the
results of a standardized ultrasound examination: (i) a control group with normal US
liver appearance and (ii) a group of patients with US-diagnosed fatty liver.
All patients took part in a face-to-face interview, based on a standard questionnaire
including a detailed medical history (see annexe 2).
Patients with any of the following criteria were excluded from the study: 1.
hepatobiliary diseases, 2. malignancies, 3. ascites, 4. medications known to cause
hepatic steatosis (as estrogens, corticosteroids, amiodarone, valproate; at present or
within the last 2 years), 5. inflammatory bowel disease, 6. infection with the human
immunodeficiency virus (HIV), 7. chronic drug or alcohol abuse (more than 20 g/day),
9. known (familial) hyperlipidaemia, and 10. acute medical conditions with
confounding effect on laboratory measurements.
Consequently, the remaining study population consisted of 104 patients.

15
2.2 Methods
The collection of patients’ data, examination of patients and collection of patients’
material was performed in collaboration with two other MD students (Catrin Beer and
Christoph Niessen). The data pool was used for theses addressing different aspects
of NAFLD.
2.2.1 Questionnaire
Each patient was asked to answer some questions about their medical history. The
questionnaire included questions to epidemiological facts like date of birth, gender,
nationality and treatment (ambulant or hospitalized). Moreover, the patients were
asked about their medical history, why they were coming to the clinic, what past
medical history they had, what medication they were taking and what diseases were
known in their families. Furthermore, questions were related to known diabetes, liver
disease, problems with the lipid metabolism or cancer.
Further, the history of daily alcohol consumption and nicotine abuse was analysed.
The daily consumption of alcohol was mainly answered in litres of beer or glasses of
wine per day and then converted into mg of alcohol. Furthermore, patients were
asked for their drug consumptions.

16
2.2.2 Anthropometric measurements and clinical examination
After filling out the consent form (see annexe 4) and the questionnaire, each patient
was checked by a general physical examination (see annexe 1). The person’s height
was measured by a fixed scale on the wall. The patients were weighed on a
standardized scale without shoes and wearing only thin clothes.
Their blood pressure and heart rate were taken in a seated position on the right and
left upper arm, located at about the same height as the heart. The blood pressure
cuff had been adjusted to the circumference of the upper arm. Before the blood
pressure was measured, the patient had to rest for a minimum of five minutes.
The waist and hip circumferences were measured on the standing patient with a
flexible tape. The waist circumference was measured at the smallest level of the
torso while the subject was at minimal respiration. The hip circumference was taken
at the largest circumference between the edge of the iliac bone and the upper part of
the thigh bone, at the level of the anterior superior iliac spine.
2.2.3 Collection and storage of serum samples
After a close disinfection of the skin and a minimized congestion, blood samples were
taken from each patient: one EDTA tube of 5ml and one serum tube of 7.5ml after an
overnight fast.
Plasma was obtained by centrifugation at 700g RCF (Relative Centrifugal Force) for
nine minutes and was stored in aliquots at minus 20 degree Celsius for upcoming
analysis.

17
The following laboratory analyses were performed by the certified Institute for Clinical
Chemistry and Laboratory Medicine of the University Hospital Regensburg: aspartate
aminotransferase (AST), alanine aminotransferase (ALT), gamma-glutamyl-
transferase (γ-GT), bilirubin, ALP, total serum protein, albumin, cholinesterase,
triglycerides, total cholesterol, high density lipoprotein (HDL), low density lipoprotein
(LDL), very-low-density lipoprotein (VLDL) and fasting glucose.
2.2.4 Ultrasound examination
In addition to a complete abdominal ultrasound examination all patients underwent a
standardized ultrasound examination (see annexe 3). The following ultrasound
equipment was used: Siemens Sonoline Elegra, Siemens ACUSON Sequoia 512
(Siemens, Erlangen, Germany), GE Healthcare Logic 9 (GE Medical Systems,
Wisconsin, USA) or Hitachi EUB-8500 (Hitachi Medical Corporation, Tokyo, Japan)
with a 3.5-7.5 MHz transducer.

18
First, the liver size was measured as a subcostal, vertical diameter in the
medioclavicular line by using the 3-5 MHz probe (Fig. 5). Hepatomegaly was defined
as a liver size above 155 mm.
Figure 5: Ultrasound-picture of the liver in the right mediclavicular line. Hepatomegaly was
defined as size above 155mm.
Further, we looked for ascites in the Morison pouch (Recessus hepatorenalis), the
part between the liver and the right kidney, one of the lowest points in the upper
abdomen. The Koller-Pouch (Recessus splenorenalis), between the spleen and the
left kidney, and the Douglas pouch were also checked for free fluid.

19
The echogenicity of the liver was diagnosed via comparison of the liver parenchyma
with the parenchyma of the kidney and classified in normal, slight or intense
augmentation of the echogenicity (Fig. 6). The increase of intensity and frequency of
echoes yields the image of a “bright (white) liver” (23), due to the high number of
water-to-fat interfaces in livers with steatosis and can be considered as a sensitive
non-invasive method for steatosis quantification (61).
Figure 6: Ultrasound-picture of the liver and right kidney: Echogenity and liver steatosis can be
analysed.
Further, the structure of the liver parenchyma was staged after a complete
examination of the whole liver. Scans were obtained in transverse and longitudinal
planes from the midline in the hypochondrium (62) to the right costal margin and right
posterior axilla line. We separated homogenous from inhomogeneous parenchyma.

20
Focal sparing or focal fat infiltrations of a diameter of five mm upwards can be
identified with the knowledge of their common areas, often near the gallbladder bed.
Moreover, we looked for other focal lesions, like haemangiomas or metastases.
Additionally, subcutaneous fat thickness in the periumbilical and right subcostal
regions (Fig. 7) was assessed using high frequency transducers (Sonoline Elegra:
7.5L40/5-9 MHz, ACUSON Sequoia 512: 15L8w-S 14 MHz, GE Healthcare Logic 9:
7L/3-7 MHz or 10L/4-10 MHz, Hitachi EUB-8500: EUP-L53/5-10 MHz).
Figure 7: Ultrasound-picture of the subcutaneous adipose tissue: periumbilical and in the right
subcostal region

21
The liver surface was inspected with a 7.5 or 10 MHz transducer and graduated in
smooth, slightly waved or strongly waved (Fig. 8).
Figure 8: Ultrasound-picture of the liver surface
Further, we examined the compressibility of the liver via palpation of the left and right
lobe through the abdominal wall.
With the portal duplex and colour Doppler sonography the maximum velocity and the
direction of the portal vein flow were measured, especially with a right lateral
intercostals approach (Fig. 9). Then it was achieved, that the portal vein passes
almost directly towards the transducer, giving an optimal beam-vessel angle. In
general, the mean velocity of the portal vein blood flow decreases as the severity of
fatty infiltration increases (63).

22
Figure 9: Ultrasound-picture with colour Doppler: Measurement of the portal vein flow
2.2.5 Serum analysis of MCP-1 levels
MCP-1 in human sera was assessed by sandwich enzyme-linked immunosorbent
assay (ELISA) using the human CCL2 DuoSet ELISA development kit (R&D Systems
Inc., catalog number DY279), following the manufacturer’s instructions.
Plates were coated with a known quantity of capture antibodies, which bind to MCP-1
in the samples. The undiluted samples were added and any antigen (MCP-1) present
bound to a capture antibody. In a next step detecting antibodies were added and
bound specifically to the antigens. The antibody was conjugated to an enzyme,
according to the manufacturer’s instructions. Between the last steps the plate had to
be washed to remove unbound antigen and antibodies. In the final step a substrate

23
was added and was converted by the enzymes to a detectable form. The colour was
measured to determine the quantity of MCP-1.
2.2.6 Statistical analysis
Results of continuous variables are expressed as means ± standard deviation.
Comparisons between groups were made using one way analysis of variance (with
Bonferroni correction for multiple comparisons) for variables with normal distribution,
and the Mann-Whitney U test for other variables (serum MCP-1 levels in patients).
Correlation between MCP-1 and serum parameters was assessed by Spearman’s
test. P-values <0.05 were considered as statistically significant.
Statistical analysis was performed on a PC using SPSS 15.0 software (SPSS,
Chicago, IL, USA) and GraphPad Prism Software (GraphPad Software, Inc., San
Diego, USA).
The data of this study was correlated with analysis of murine models of NAFLD.
Together these data have been successfully published (see reference 64). Methods
applied for the assessments of the murine model are described in detail in the above
mentioned publication (see reference 64).
In the following, the data of the human study, which are the basis of this dissertation,
are presented and discussed together with the data obtained in the murine models.

24
3 Results
Baseline characteristics of the 104 subjects included in the study are summarized in
Table 1.
Table 1: Correlation of MCP-1 serum levels with age, gender, and alcohol and nicotine
consumption
Variables Mean ± SD (or %) Correlation coefficient (ρ) p
age (years) 54.4 ± 17.7 0.08 0.423*
male gender (%) 52.3% --- 0.821†
smoking (%) 46.8% --- 0.271†
pack years (n) 15.5 ± 23.6 0.29 0.012*
Correlation between MCP-1 levels and numerical variables was assessed by Spearman´s test (*). Correlation between MCP-1 levels and categorical variables was assessed by ANOVA (†). Bold-face figures indicate significant differences (p<0.05)
Analysis of serum levels of MCP-1 in this group revealed no significant correlation
with age or gender. Further, MCP-1 levels were similar between smokers and non-
smokers, however and interestingly, the number of pack years correlated with MCP-1
serum levels in the group of smokers.

25
Next, we assessed the association between MCP-1 serum levels and liver related
serum parameters and found a significant correlation between ALT and MCP-1
serum levels (Table 2).
Table 2: Correlation of MCP-1 serum levels with liver related serum parameters
Variable Mean (±SD)
Correlation coefficient (ρ) p*
AST [U/l] 28.6 ± 12.6 0.08 0.384
ALT [U/l] 19.7 ± 20.7 0.20 0.047
γ-GT [U/l] 64.7 ± 92.5 0.14 0.172
bilirubin [mg/dl] 0.61 ± 0.44 -0.21 0.838
ALP [U/l] 73.8 ± 32.7 -0.02 0.840
total serum protein [g/l] 74.6 ± 7.7 0.05 0.675
albumin [g/l] 46.7 ± 6.7 -0.01 0.923
cholineesterase [kU/l] 8.69 ± 2.39 0.03 0.771
NAFLD = non-alcoholic fatty liver disease; AST = aspartate aminotransferase; ALT = alanine aminotransferase; γ-GT - gamma-glutamyl-transferase; ALP = alkaline phosphatase * by Spearman´s test Bold-face figures indicate significant differences (p<0.05)
Moreover and interestingly, MCP-1 serum levels were significantly higher in patients
with ultrasound-diagnosed NAFLD (median: 67.3 ng/ml; 25th-75th percentile: 30.2-
100.3 ng/ml) in comparison to the control group (median: 41.3 ng/ml; 25th-75th
percentile: 16.1-100.3 ng/ml; p=0.042), (Fig. 10). No correlation was found between
MCP-1 serum levels and portal vein flow or liver size as assessed by ultrasound
examination (data not shown).

26
Figure 10: Serum MCP-1 levels in patients with ultrasound (US) diagnosed fatty liver compared to
a control (ctr.) group of patients with normal sonographic liver appearance. (*p<0.05 compared to
control).
After hepatic parameters, we analyzed MCP-1 serum levels in relation to biochemical
and anthropometric features of the metabolic syndrome. Spearman´s test revealed
that MCP-1 serum levels correlated with serum levels of glucose and HDL-
cholesterol (inverse), and also with body-mass index (BMI) and waist circumference
(Table 3).

27
Table 3: Correlation of MCP-1 serum levels with features of the metabolic syndrome.
Variable Mean ± SD (or %)
Correlation coefficient (ρ) p
body mass index (kg/m²) 25.9 ± 4.4 0.23 0.018*
waist circumference (mm) 92.2 ± 15.4 0.22 0.028*
hip circumference (mm) 97.6 ± 13.4 0.06 0.544*
waist to hip ratio 0.94 ± 0.09 0.26 0.007
triglycerides (mg/dl) 124.1 ± 58.3 0.17 0.095*
total cholesterol (mg/dl) 199.1 ± 46.2 -0.09 0.392*
HDL cholesterol (mg/dl) 55.6 ± 19.8 -0.22 0.048*
LDL cholesterol (<150 mg/dl) 105.4 ± 36.8 -0.02 0.840*
VLDL cholesterol 38.4 ± 19.4 0.18 0.073*
reported diabetes mellitus type II (%) 20.2 % --- 0.046†
fasting glucose (mg/dl) 106.7 ± 32.9 0.37 <0.001*
reported hypertension (%) 37.5 % --- 0.632†
systolic blood pressure (mmHg) 130.8 ± 16.4 0.11 0.263*
diastolic blood pressure (mmHg) 78.9 ± 10.7 -0.11 0.259*
HDL = high-density lipoprotein; LDL = low-density lipoprotein; VLDL = very-low-density lipoprotein Correlation between MCP-1 levels and numerical variables was assessed by Spearman´s test (*). Correlation between MCP-1 levels and categorical variables was assessed by ANOVA (†). Bold-face figures indicate significant differences (p<0.05)

28
4 Discussion
The contribution of MCP-1 to inflammatory and fibrogenic processes in chronic liver
disease has long been recognized (59, 65). The pathophysiological role played by
MCP-1 has been demonstrated by the finding that MCP-1 inactivation abrogates
hepatic inflammation and fibrosis in an experimental murine model of chronic liver
injury (66).
Recently, it has been shown that hepatic MCP-1 expression is up-regulated in
patients with NAFLD (67). Further, Haukeland and collegues reported elevated MCP-1
serum levels in NAFLD patients and found that circulating MCP-1 levels correlated
with the severity of liver damage (3). In line with this report, we found in the present
study higher MCP-1 serum levels in patients with ultrasound-diagnosed NAFLD, and
circulating MCP-1 levels correlated significantly with serum transaminases. Still,
despite the lack of histological examination in this hospital cohort of randomly
selected patients, it can be estimated from epidemiological studies (7), that only a
minority of cases had significant hepatic inflammation (i.e. criteria for NASH), which
may have caused elevated MCP-1 levels.
Animal and human studies show a correlation of serum MCP-1 with serum
transaminases (5), HDL-cholesterol, body-mass index (BMI) and waist-hip ratio (6) as
indicative of systemic insulin resistance and metabolic syndrome. In our study, serum
MCP-1-levels correlated with serum ALT and glucose levels as well as BMI and waist
circumference.
Effects on the progression of simple steatosis to NASH may take place in addition to
- or possibly even prior to - hepatic MCP-1 expression in response to hepatocellular
lipid accumulation.

29
In summary with data obtained in murine model of hepatosteatosis without
inflammation (reference 64), our data indicate both the liver and adipose tissue as
cellular sources of elevated circulating MCP-1 levels already in the early phase of
hepatic steatosis. Since MCP-1 derived from visceral adipose tissue reaches the liver
via portal circulation at high concentrations, it may significantly contribute to the
progression of simple steatosis to NASH.

30
ACKNOWLEDGEMENT
I would like to thank Prof. Dr. Claus Hellerbrand for his guidance, understanding and
patience.
I would like to express my gratitude to the collaboration with Catrin Niessen,
Christoph Niessen, the members of the ultrasound department, the Institute for
Clinical Chemistry and Laboratory Medicine and the research group of Experimental
Hepatology of the University Hospital Regensburg.
Special thanks go to my twin sister Susanne and to my parents, who supported me
during my studies and who made this dissertation possible.
31
1: Fu CC, Chen MC, Li YM, Liu TT, Wang LY. The risk factors for ultrasound-diagnosed non-alcoholic fatty liver disease among adolescents. Annals of the Academy of Medicine, Singapore. 2009 Jan; 38 (1):15-21. 2: Jou J, Choi SS, Diehl AM. Mechanisms of disease progression in non-alcoholic fatty liver disease. Semin Liver Dis. 2008 Nov;28 (4): 370-379. 3: Haukeland JW, Damås JK, Konopski Z, Løberg EM, Haaland T, Goverud I, Torjesen PA, Birkeland K, Bjøro K, Aukrust P. Systemic inflammation in nonalcoholic fatty liver disease is characterized by elevated levels of CCL2. Journal of hepatology. 2006 June; 44 (6): 1167-1174. 4: Day CP. From fat to inflammation. Gastroenterology 2006; 130: 207-210. 5: Bose T, Alvarenga JC, Tejero ME, Voruganti VS, Proffitt JM, Freeland-Graves JH, Cole SA, and Comuzzie AG. Association of monocyte chemoattractant protein-1 with adipocyte number, insulin resistance and liver function markers. J Med Primatol 2009; 38: 418-424. 6: Kim CS, Park HS, Kawada T, Kim JH, Lim D, Hubbard NE, Kwon BS, Erickson KL, and Yu R. Circulating levels of MCP-1 and IL-8 are elevated in human obese subjects and associated with obesity-related parameters. Int J Obes (Lond) 2006; 30: 1347-1355. 7: Bellentani S, Scaglioni F, Marino M, and Bedogni G. Epidemiology of non-alcoholic fatty liver disease. Dig Dis 2010; 28: 155-161. 8: Musso G., Gambino R., Cassader M. Non-alcoholic fatty liver disease from pathogenesis to management: an update: Etiology and pathophysiology. International Association for the study of Obesity. Obesity reviews. 2009; 1-16. 9: Bedogni G, Miglioli L, Masutti F, Tiribelli C, Marchesini G, and Bellentani S. Prevalence of and risk factors for nonalcoholic fatty liver disease: the Dionysos nutrition and liver study. Hepatology 2005; 42: 44-52. 10: Ludwig J, Viggiano TR, McGill DB, Oh BJ. Nonalcoholic steatohepatitis: Mayo Clinic experiences with a hitherto unnamed diseases. Mayo Clin Pro 1980; 55(7): 434-438. 11: Neuschwander-Tetri BA, Caldwell SH. Nonalcoholic steatohepatitis: summary of an AASLD Single Topic Conference. Hepatology. 2003 Mai; 37(5):1202-1219. 12: American Gastroenterology Association. Medical position statement: nonalcoholic fatty liver disease. Gastroenterology. 2002; 123: 1702-1704. 13: Clark J.M.: The Epidemiology of Nonalcoholic Fatty Liver Disease in Adults. J Clin Gastroenterol, Vol 40, Supp. 1, March 2006, S5-S10.

32
14: Browning JD, Szczepaniak LS, Dobbins R, Nuremberg P, Horton JD, Cohen JC, et al. Prevalence of hepatic steatosis in an urban population in the United States: impact of ethnicity. Hepatology 2004; 40: 1387-1395. 15: Farrell GC. Non-alcoholic steatohepatitis: what is it, and why is it important in the Asia-Pacific region? J Gastroenterol Hepatol 2003; 18: 124-138. 16: Kirovski G, Schacherer D, Wobser H, Huber H, Niessen C, Beer C, Schoelmerich J and Hellerbrand C. Prevalence of ultrasound-diagnosed non-alcoholic fatty liver disease in a hospital cohort and its association with anthropometric, biochemical and sonographic characteristics. Int J Clin Exp Med 2010 [in press] 17: Alberti G, Zimmet P, Shaw J, Grundy SM. The metabolic syndrome. International Diabetes Federation, 2006. 18: Björnsson E, Angulo P. Non-alcoholic fatty liver disease. Scandinavian Journal of Gastroenterology 2007; 42: 1023-1030. 19: Kim HJ, Lee KE, Kim DJ, Kim SK, Ahn CW, et al. Metabolic significance of non-alcoholic fatty liver disease in nonobese, nondiabetic adults. Arch Intern Med 2004; 164:2169-2175. 20: Dancygier, Henryk. Die nichtalkoholische Steatohepatitis. Dtsch Arztebl 2001; 98( Heft 39): A-2511 – 2516. 21: Su CC, Wang K, Hsia TL, Chen CS, Tung TH. Association of nonalcoholic fatty liver disease with abnormal aminotransferase and postprandial hyperglycemia. Journal of clinical gastroenterology. 2006 July; 40 (6): 551-554. 22: Yasemin H, Balaban H, Halis S, Durdal U, Gonca T. Metabolic syndrome, non-alcoholic steatohepatitis (NASH), and hepatocyte growth factor (HGF). Annals of Hepatology 2006; 5(2): April-June: 109-114. 23: Kuntz E, Kuntz H-D. Hepatology. Textbook and Atlas, 3rd Edition. Heidelberg. Springer. 2008: 132-548. 24: Mofrad P, Contos MJ, Haque M, Sargeant C, Fisher RA, Luketic VA, Sterling RK, Shiffman ML, Stravitz RT, Sanyal AJ. Clinical and histologic spectrum of nonalcoholic fatty liver disease associated with normal ALT values. Hepatology 2003 Jun; 37(6): 1286-92. 25: Tchelepi H, Ralls PW, Radin R, Grant E. Sonography of diffuse liver disease. Journal of ultrasound in medicine: official journal of the American Institute of Ultrasound in Medicine. 2002 September; 21 (9): 1023-1032. 26: Yu W, Hu S, Qi Y, Li B. The correlation between sonographic diagnosis and laparoscopic observations on fatty liver. Journal of laparoendoscopic & advanced surgical techniques. 2009 April; Part A; 19 (2): 163-169.

33
27: Yajima Y, Ohta K, Narui T, Abe R, Suzuki H, Ohtsuki M. Ultrasonographical diagnosis of fatty liver: significance of the liver-kidney contrast. Tohoku J Exp Med 1983;139:43-50. 28: Brunt EM. Nonalcoholic steatohepatitis: definition and pathology. Semin Liver Dis. 2001; 21(1): 3-16. 29: Syn WK, Choi SS, Diehl AM. Apoptosis and cytokines in non-alcoholic steatohepatitis. Clin Liver Dis. 2009 Nov; 13(4): 565-580. 30: Tiniakos DG. Liver biopsy in alcoholic and non-alcoholic steatohepatitis patients. Gastroenterol Clin Biol. 2009 Oct-Nov; 33(10-11): 930-939. 31: Park SH, Kim BI, Kim HJ, Kim H, Kim SH, Park DI, Cho YK, Sung IK, Sohn CI, Jeon WK, Keum DK. Clinical features associated with improvement of fatty liver disease. Internal medicine journal.2005 August; 35 (8): 473-477. 32: Georgescu EF, Georgescu M. Therapeutic options in non-alcoholic steatohepatitis (NASH). Are all agents all alike? Results of a preliminary study. J Gastrointest Liver Dis 2007; 16: 39-46. 33: Bugianesi E, Leone N, Vanni E, Marchesini G, Brunello F, Carucci P, et al. Expanding the natural history of nonalcoholic steatohepatitis: from cryptogenic cirrhosis to hepatocellular carcinoma. Gastroenterology 2002; 123: 134-140. 34: Lalor PF, Faint J, Aarbodem Y, Hubscher SG, Adams DH. The role of cytokines and chemokines in the development of steatohepatitis. Seminars in liver disease. 2007 Mai; 27 (2): 173-193. 35: Rull A, Rodíguez F, Aragonès G, Marsillach J, Beltrán R, Alonso-Villaverde C, Camps J, Joven J. Hepatic monocyte chemoattractant protein-1 is upregulated by dietary cholesterol and contributes to liver steatosis. Elsevier Ltd. 2009; 48: 273-279. 36: Donnelly KL, Smith CI, Schwarzenberg SJ, et al.: Sources of fatty acids stored in liver and secreted via lipoproteins in patients with nonalcoholic fatty liver disease. J Clin Invest 2005; 115: 1343-1351. 37: Clément S, Juge-Aubry C, Sgroi A, Conzelmann S, Pazienza V, Pittet-Cuenod B, Meier CA, Negro F. Monocyte chemoattractant protein-1 secreted by adipose tissue induces direct lipid accumulation in hepatocytes. Hepatology (Baltimore, Md.). 2008 September; 48 (3): 799-807. 38: Fabbrini E, Mohammed BS, Magkos F, Korenblat KM, Patterson BW, Klein S. Alterations in adipose tissue and hepatic lipid kinetics in obese men and women with non-alcoholic fatty liver disease. Gastroenterology 2008; 134: 424-431. 39: Diehl AM. Tumor necrosis factor and its potential role in insulin resistance and non-alcoholic fatty liver disease. Clin Liver Dis 2004; 8: 619-638.

34
40: Bradbury MW. Lipid metabolism and liver inflammation: I. Hepatic fatty acid uptake: possible role in steatosis. Am J Physiol Gastrointest Liver Physiol 2006; 290: G194-G198. 41: http://en.wikipedia.org/wiki/Oxidative_stress (15/01/2011) 42: McCullough AJ. Pathophysiology of non-alcoholic steatohepatitis. J Clin Gastroenterol 2006; 40: S17-S29 43: Rollins BJ: Chemokines. Blood 1997. 90: 909-928. 44: Deshmane SL, Kremlev S, Amini S, Saxaya BE. Monocyte chemoattractant protein-1 (MCP-1): an overview. J Interferon Cytokine Res. 2009 Jun: 29 (6): 313-326. 45: Weisberg SP, Hunter D, Huber R et al.: CCR2 modulates inflammatory and metabolic effects of high fatty feeding. J Clin Invest 2006; 116: 115-124. 46: Kanda H, Tateya S, Tamori Y, Kotani K, Hiasa K, Kitazawa R, Kitazawa S, Miyachi H, Maeda S, Egashira K, Kasuga M. MCP-1 contributes to macrophage infiltration into adipose tissue, insulin resistance, and hepatic steatosis in obesity. The Journal of clinical investigation. 2006 June; 116 (6): 1494-1505. 47: Van Coillie E, Van Damme J, Opdenakker G. The MCP/eotaxin subfamily of CC chemokines. Cytokine Growth Factor Rev 1999; 10: 61-86. 48: Aukrust P, Berge RK, Ueland T, Aaser E, Damas JK, Wikeby L, et al. Interaction between chemokines and oxidative stress: possible pathogenetic role in acute coronary syndromes. J Am Coll Cardiol 2001; 37: 485-491. 49: Lihn AS, Bruun JM, He G, Pedersen SB, Jensen PF, Richelsen B: Lower expression of adiponectin mRNA in visceral adipose tissue in lean and obese subjects. Mol Cell Endocrinol 2004; 219: 9-15. 50: Baldwin AS: Jan series introduction: the transcription factor NF-κB and human disease. J Clin Invest, 2001; 107: 3-6. 51: Sartipy P, Luskutoff DJ: Monocyte chemoattractant protein 1 in obesity and insulin resistance. Proc Natl Acad Sci USA 2003; 100: 7265-7270. 52: Yang SJ, IglayReger HB, Kadouh HC, Bodary PF. Inhibition of the chemokine (C-C motif) ligand 2/ chemokine (C-C motif) receptor 2 pathway attenuates hyperglycaemia and inflammation in a mouse model of hepatic steatosis and lipoatrophy. Diabetologia. 2009 May; 52(5):972-981. 53: Tamura Y, Sugimoto M, Murayama T, Ueda Y, Kanamori H, Ono K, Ariyasu H, Akamizu T, Kita T, Yokode M, Arai H. Inhibition of CCR2 ameliorates insulin resistance and hepatic steatosis in db/db mice. Arterioscler Thromb Vasc Biol. 2008 Dec; 28(12): 2195-2201.

35
54: Marra F, Romanelli RG, Giannini C, Failli P, Pastacaldi S, Arrighi MC, Pinzani M, Laffi G, Montalto P, Gentilini P. Monocyte chemotactic protein-1 as a chemoattractant for human hepatic stellate cells. Hepatology. 1999 Jan; 29 (1):140-148. 55: Dagouassat M, Suffee N, Hlawaty H, Haddad O, Charni F, Laguillier C, Vassy R, Martin L, Schischmanoff PO, Gattegno L, Oudar O, Sutton A, Charnaux N. Monocyte chemoattractant protein-1 (MCP-1)/CCL2 secreted by hepatic myofibroblasts promotes migration and invasion of human hepatoma cells. Int J Cancer. 2009 Jul 29; 126: 1095-1108. 56: Reeves HL, Friedman SL. Activation of hepatic stellate cells – a key issue in liver fibrosis. Front Biosci 2002 (April 1); 7: d808-826. 57: Friedman SL. The cellular basis of hepatic fibrosis. Mechanisms and treatment strategies. N Engl J Med 1993; 328: 1828-1835. 58: Seki E, de Minicis S, Inokuchi S, Taura K, Miyai K, van Rooijen N, Schwabe RF, Brenner DA. CCR2 promotes hepatic fibrosis in mice. Hepatology. 2009 Jul; 50(1): 185-197. 59: Marra F, DeFranco R, Grappone C, Milani S, Pastacaldi S, Pinzani M, Romanelli RG, Laffi G, and Gentilini P. Increased expression of monocyte chemotactic protein-1 during active hepatic fibrogenesis: correlation with monocyte infiltration. Am J Pathol 1998; 152: 423-430. 60: Marra F, Valente AJ, Pinzani M, Abboud HE. Cultured human liver fat-storing cells produce monocyte chemoattractant protein-1. Regulation by proinflammatory cytokines. J Clin Invest 1993; 92: 1674-1680. 61: Webb M; Yeshua H; Zelber-Sagi S; Santo E; Brazowski E; Halpern Z; Oren R. Diagnostic value of a computerized hepatorenal index for sonographic quantification of liver steatosis. AJR. American journal of roentgenology. 2009 April; 192 (4); 909-914. 62: Baxter Grant M, Allan Paul LP, Morley Patricia. Clinical Diagnostic Ultrasound. Blackwell Science: 367-381. 63: Balci A, Karazincir S, Sumbas H, Oter Y, Egilmez E, Inandi T. Effects of diffuse fatty infiltration of the liver on portal vein flow hemodynamics. Journal of clinical ultrasound. 2008 Mar-Apr; 36 (3): 134-140. 64: Kirovski G, Dorn C, Huber H, Moleda L, Niessen C, Wobser H, Schacherer D, Buechler C, Wiest R, Hellerbrand C. Elevated systemic monocyte chemoattractrant protein-1 in hepatic steatosis without significant hepatic inflammation. Exp Mol Pathol. 2011 Dec; 91(3): 780-3. 65: Muhlbauer M, Bosserhoff AK, Hartmann A, Thasler WE, Weiss TS, Herfarth H, Lock G, Scholmerich J, and Hellerbrand C. A novel MCP-1 gene polymorphism is associated with hepatic MCP-1 expression and severity of HCV-related liver disease. 2003; 125: 1085-1093.

36
66: Imamura M, Ogawa T, Sasaguri Y, Chayama K, and Ueno H. Suppression of macrophage infiltration inhibits activation of hepatic stellate cells and liver fibrogenesis in rats. Gastroenterology 2005; 128: 138-146. 67: Palmer C, Corpuz T, Guirguis M, O'Toole S, Yan K, Bu Y, Jorgenson J, Talbot M, Loi K, Lloyd A, and Zekry A. The effect of obesity on intrahepatic cytokine and chemokine expression in chronic hepatitis C infection. Gut 2010; 59: 397-404.

37
Annexe 1: Cover and examination Zusammenfassung Patienten-Nr.:__________________
Untersucher:___________________
Untersuchungsdatum:___________
Aufklärung und Einverständniserklärung □ erledigt
Anamnesebogen □ erledigt
Ultraschalldokumentation □ erledigt
körperliche Untersuchung □ erledigt
Größe: ______ cm
Gewicht: ______ kg
Hüftumfang: ______ cm
Beckenumfang: ______ cm
RR systolisch: ______ mmHg
RR diastolisch: ______ mmHg
Herzfrequenz: ______ / min
Blutabnahme □ erledigt
1x EDTA 5ml, 1x Serum 7.5ml
- abzentrifugieren
- aliquottieren
- minus 20°C asservieren
(Name des Patienten/der Patientin, Geburtsdatum)
38
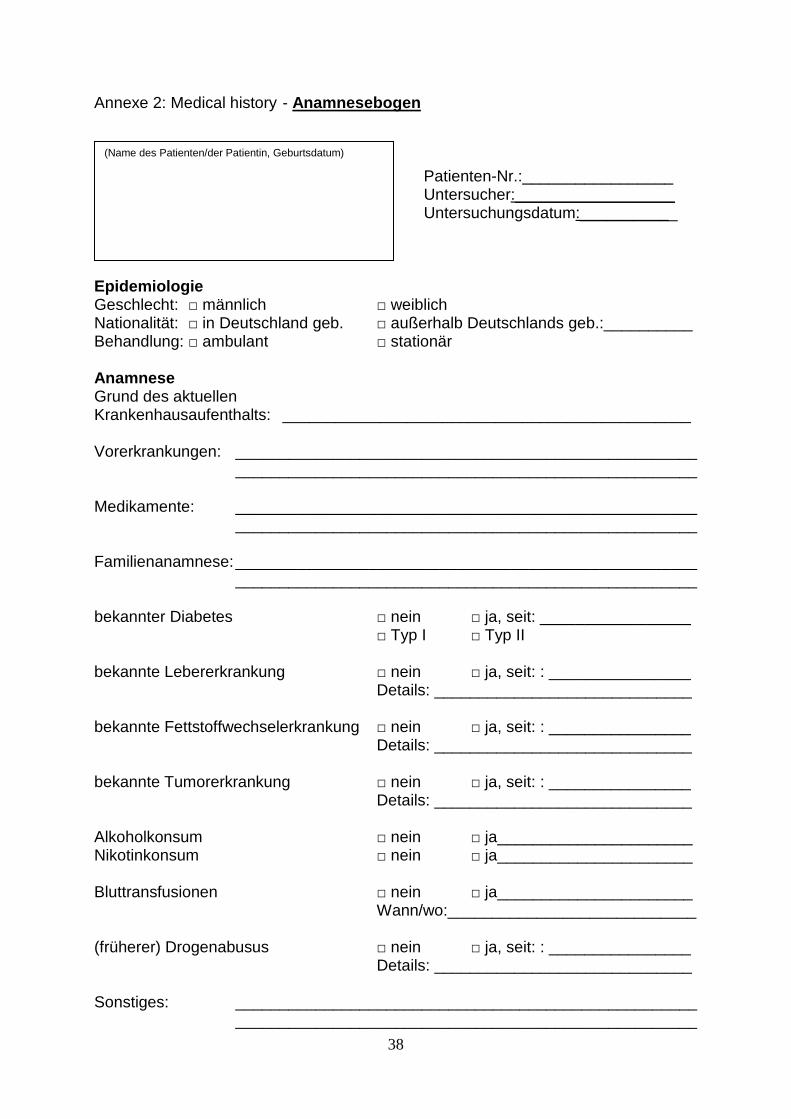
Annexe 2: Medical history - Anamnesebogen
Patienten-Nr.:_________________
Untersucher:__________________ Untersuchungsdatum:___________ Epidemiologie Geschlecht: □ männlich □ weiblich Nationalität: □ in Deutschland geb. □ außerhalb Deutschlands geb.:__________ Behandlung: □ ambulant □ stationär Anamnese Grund des aktuellen Krankenhausaufenthalts: ______________________________________________ Vorerkrankungen: ____________________________________________________ ____________________________________________________ Medikamente: ____________________________________________________ ____________________________________________________ Familienanamnese: ____________________________________________________ ____________________________________________________ bekannter Diabetes □ nein □ ja, seit: _________________
□ Typ I □ Typ II bekannte Lebererkrankung □ nein □ ja, seit: : ________________ Details: _____________________________ bekannte Fettstoffwechselerkrankung □ nein □ ja, seit: : ________________ Details: _____________________________ bekannte Tumorerkrankung □ nein □ ja, seit: : ________________ Details: _____________________________ Alkoholkonsum □ nein □ ja______________________ Nikotinkonsum □ nein □ ja______________________ Bluttransfusionen □ nein □ ja______________________ Wann/wo:____________________________ (früherer) Drogenabusus □ nein □ ja, seit: : ________________ Details: _____________________________ Sonstiges: ____________________________________________________ ____________________________________________________
(Name des Patienten/der Patientin, Geburtsdatum)

39
Annexe 3: Ultrasound examination - Untersuchungsbogen Ultraschall
Bitte alle Untersuchungen mit THI durchführen! Pat-Nr.______ Bitte Untersuchungsanforderung und Bilddokumentation anheften! ___________________ _________________ _____________ Nachname Patient Vorname Patient Geb-Datum ___________________ _________________ _____________ Gerät Untersuchungsdatum Untersucher 3,5 MHz-Schallkopf: Lebergröße rechte MCL:________cm Aszites □ nein □ ja (Menge in l ca.):________________________________________ Echogenität Leberparenchym (Bilddoku: Leber + Niere auf ein Bild) □ normal □ leicht echovermehrt □ stark echovermehrt Struktur Leberparenchym (Bilddoku) □ homogen □ leicht inhomogen □ irregulärer Gefäßverlauf fokale Minderverfettungen □ nein □ ja (Größe, Lage):_________________________________________ andere Leberraumforderungen (Bilddoku) □ nein □ ja (Größe, Lage):_________________________________________ Körperfett (in cm) re Rippenbogen___________________ paraumbilikal________________________ 7,5 MHz-Schallkopf: Leberoberfläche (Bilddoku) □ glatt □ leicht gewellt □ stark gewellt Komprimierbarkeit li LL (Fingerpalpation!) □ gut □ schlecht □ nicht beurteilbar Duplexsonographie: Pfortaderfluss: __________ cm/sec □ hepatopetal □ hepatofugal □ nicht beurteilbar Diagnose (betreffend die Leber): __________________ _____________________

40
Annexe 4: Information and agreement
Leber auf den Prüfstand Patientenaufklärung Pat-Nr.:_________ Sehr geehrte Patientin, sehr geehrter Patient, Im Rahmen unserer wissenschaftlichen Forschung beschäftigen wir uns u.a. mit den zugrundeliegenden Mechanismen der Gewebeschädigung bei unterschiedlichen Lebererkrankungen. Wir bitten Sie daher darum, 15 ml Blut (zwei Röhrchen) für Studienzwecke abnehmen zu dürfen. Wie bei jeder Blutentnahme aus einer Vene kann es zu geringen Schmerzen, einem Bluterguß, einer Entzündung oder Gerinnselbildung kommen. Durch sorgfältige Ausführung läßt sich die Häufigkeit dieser Komplikationen auf ein Minimum reduzieren. Außerdem würden wir Sie um einige anamnestische Angabe bitten und einige Daten der Ultraschalluntersuchung auswerten. Die Untersuchung verlängert sich dadurch um einige Minuten. Vertraulichkeit der Unterlagen: Um die ärztliche Schweigepflicht und den Datenschutz zu wahren, werden die für die wissenschaftlichen Untersuchungen benötigten Krankheitsdaten anonymisiert, d.h. die nötigen Einzelheiten über Ihre Krankheit werden bei den Untersuchungen ohne Ihren Namen verwendet.
Wir möchten Sie darauf hinweisen, dass Ihre Einwilligung auf freiwilliger Basis erfolgt. Sie haben das Recht, Ihre Einwilligung jederzeit zurückzuziehen, ohne dass dies Ihre übliche ärztliche Versorgung oder Ihr Verhältnis zu dem Sie betreuenden Arzt/Personal beeinflussen würde.
Mit Ihrer Einverständniserklärung unterstützen Sie die wissenschaftliche Arbeit auf dem Gebiet des Leberleidens.
Wir danken für Ihre Mithilfe. (Name des Patienten/der Patientin, Geburtsdatum)
Ich erkläre hiermit, dass ich die Patientenaufklärung gelesen habe und mir verbliebene Fragen erläutert wurden. Regensburg, den ------------------------------------------------ ------------------------------------------------------------ (Unterschrift des Patienten) (Unterschrift des/der aufklärenden Arztes/Ärztin)

41
Leber auf den Prüfstand Einverständniserklärung Pat-Nr.:_________ (Name des Patienten/der Patientin, Geburtsdatum)
Ich bin damit einverstanden, dass Blut, das im Rahmen der Routinediagnostik von
mir gewonnen wird, und Ergebnisse der Ultraschalluntersuchung zu
wissenschaftlichen Analysen verwendet wird. Über die Risiken der
routinediagnostischen Maßnahmen wurde ich aufgeklärt. Mir wurde zugesichert,
dass meine Daten - unter Berücksichtigung der gesetzlichen
Datenschutzbestimmungen - anonym behandelt werden und ich meine Einwilligung
jederzeit zurückziehen kann.
Regensburg, den ----------------------------------------------- ----------------------------------------------------------- (Unterschrift des Patienten) (Unterschrift des/der aufklärenden Arztes/Ärztin)


![Amphibien und Reptilien des Prespa-Nationalparks und der ... fileSalamandra 30 3 209-220 ] Rheinbach, 15.8.1994 Amphibien und Reptilien des Prespa-Nationalparks und der Gebirgsregion](https://img.pdfslide.us/doc/110x75/5d63256188c993f97d8b6831/amphibien-und-reptilien-des-prespa-nationalparks-und-der-30-3-209-220-rheinbach.jpg)


![Schüler und Schülerinnen in eTwinning · 2019-07-15 · 2.2 Profile der Lehrkräfte ... (PDW)] werden von der Zentralen und den Nationalen Koordinierungsstellen (CSS und NSS) der](https://img.pdfslide.us/doc/110x75/5f088f087e708231d4229b8f/schler-und-schlerinnen-in-etwinning-2019-07-15-22-profile-der-lehrkrfte.jpg)