Embed Size (px)
Citation preview
Klaus GierensInstitut für Physik der Atmosphäre
DLR Oberpfaffenhofen
Cirrus Clouds
MOD 10

Overview
Cirrus clouds – definition and historical notes
Picture gallery
Frequency of cirrus clouds
Generation mechanisms
Properties of cirrus clouds
Climate issues related to cirrus clouds
Recommended book: Cirrus (Lynch et al., Eds.), Oxford UP, 2002
Cirrus clouds – definition
• The highest clouds in the troposphere, therefore cold.
• Sometimes reaching into the lowermost stratosphere.
• Composed of ice, no liquid water.
- There should be often many aqueous solution droplets at temperatures below the supercooling limit if liquid water.
- These might play a role in the formation of irregular crystal habits (aggregates).

historical notes
• Descartes and Mariotte concluded that Ci are made of ice, because of the 22° halo, that they could explain by ray tracing.
• Classification and naming of these wispy fibrous clouds as “cirrus” by Luke Howard (1803).
• That Ci are the highest clouds in the troposphere became clear in the 2nd half of the 19th century.
• Theories on formation pathways of ice in the atmosphere became established in the 1930/40ies (Volmer, Krastanow, Wall).
• In the 40es first ice crystals were collected in the UT by Helmut Weickmann.
Forecasting and WMO classification
• Ci forecasting using physical rules (instead of weather sayings) began in the late 50ies/ early 60ies. The first Ci climatology was established in 1961 by H. Appleman.
• WMO’s definition of Ci, Cc, Cs is based purely on morphology and visual appearance, not on physical properties.
• Special kinds or forms of cirrus are sub-visual cirrus and condensation trails. These are not yet included in official classification.
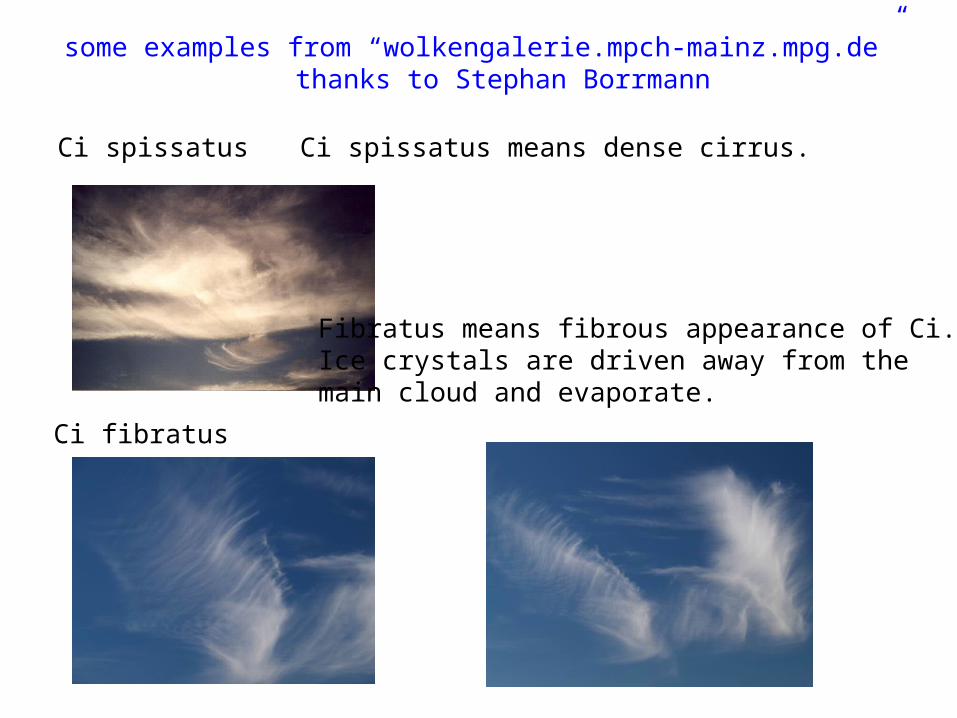
some examples from “wolkengalerie.mpch-mainz.mpg.de”thanks to Stephan Borrmann
Ci spissatus
Ci fibratus
Ci spissatus means dense cirrus.
Fibratus means fibrous appearance of Ci. Ice crystals are driven away from themain cloud and evaporate.

Ci stratiformis undulatus
Ci floccus
Slow development of a cirrus cloud deck,with some wave action making the undulatus effect.
Cirrus clouds with a rounded “head”

Ci uncinus
A cirrus cloud with a mare’s tail is called cirrus uncinus.
The mare’s tail is due to ice crystals falling in a sheared wind field.
While falling into subsaturated air below,the ice crystals evaporate, set free latent heat, which can induce instable stratification, local convection and new formation of ice crystals above the shear layer.
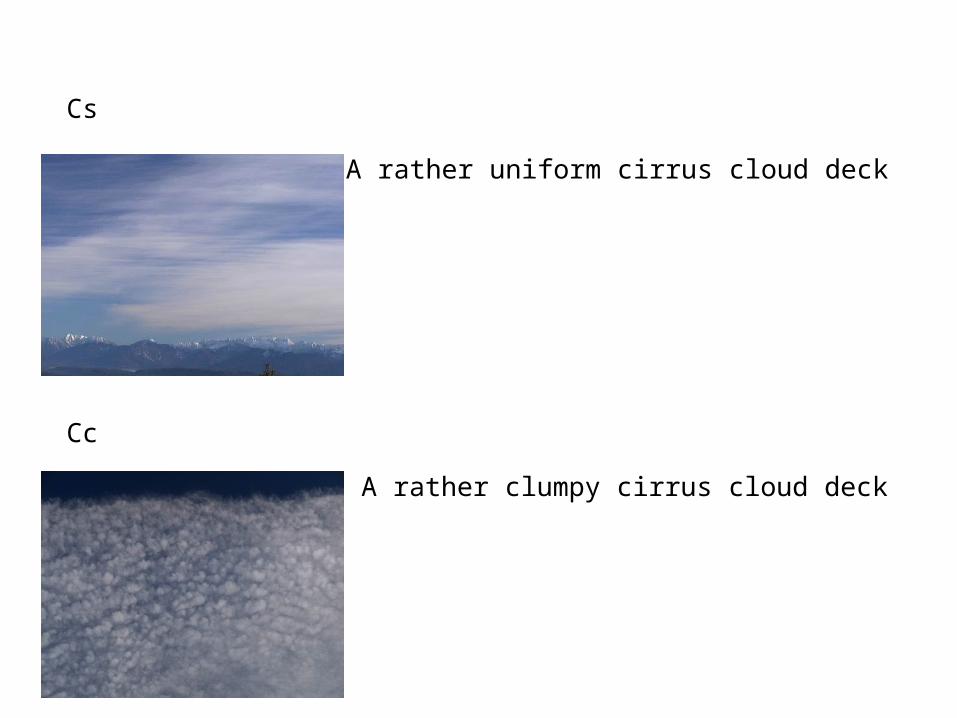
Cs
Cc
A rather uniform cirrus cloud deck
A rather clumpy cirrus cloud deck

Condensation trails (contrails)• special form of cirrus• form before natural Ci forms• persistent in ice-supersaturated air
• spread and expand in a sheared wind field,
• eventual transformation into natural looking cirrus
• until ice crystals fall out and evaporate
• or until subsidence terminates contrail lifetime
• global coverage (1992) 0.1% (line-shaped contrails)
• Contrail-cirrus can cover 10 times as much (Mannstein & Schumann, MZ, 2005)
Contrails over central Europe on 4th May 1995 at 7:43 UTC based on NOAA12 AVHRR
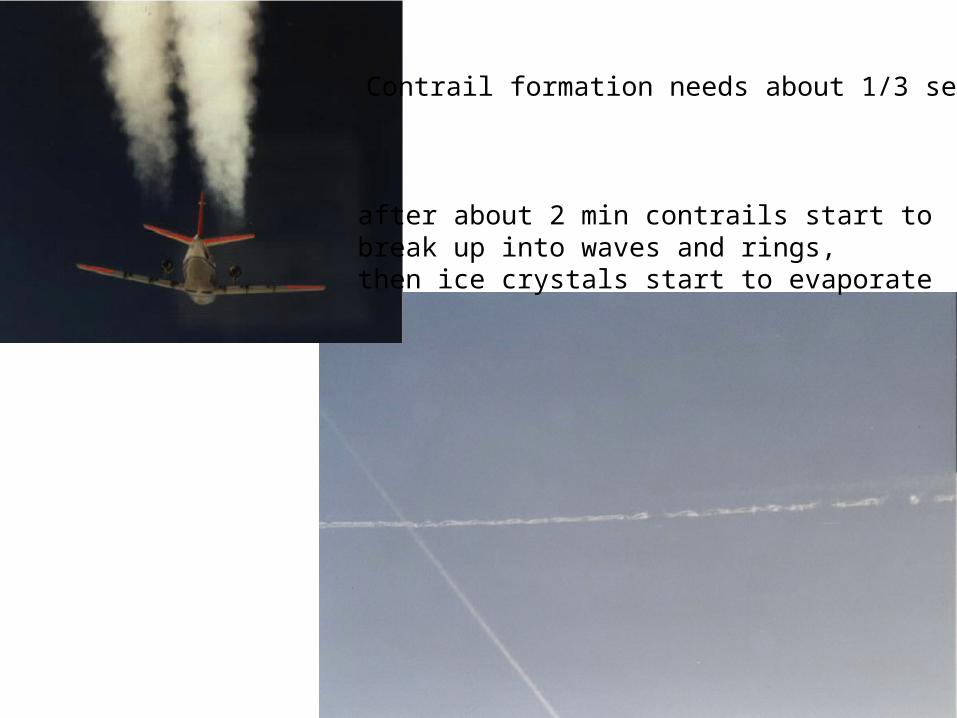
Contrail formation needs about 1/3 sec
after about 2 min contrails start to break up into waves and rings,then ice crystals start to evaporate

In slightly supersaturated air the ice in the rings vanishes (becauseof adiabatic heating in the downward travelling vortices), howevera faint spoor of an ice curtain extending from the flight altitude downto the location of the vortices (secondary wake) stays persistent.

In more supersaturated air also the ice in the bursting vortices survives, a strong contrail appears that can undergo contrail-to-cirrus transformation.
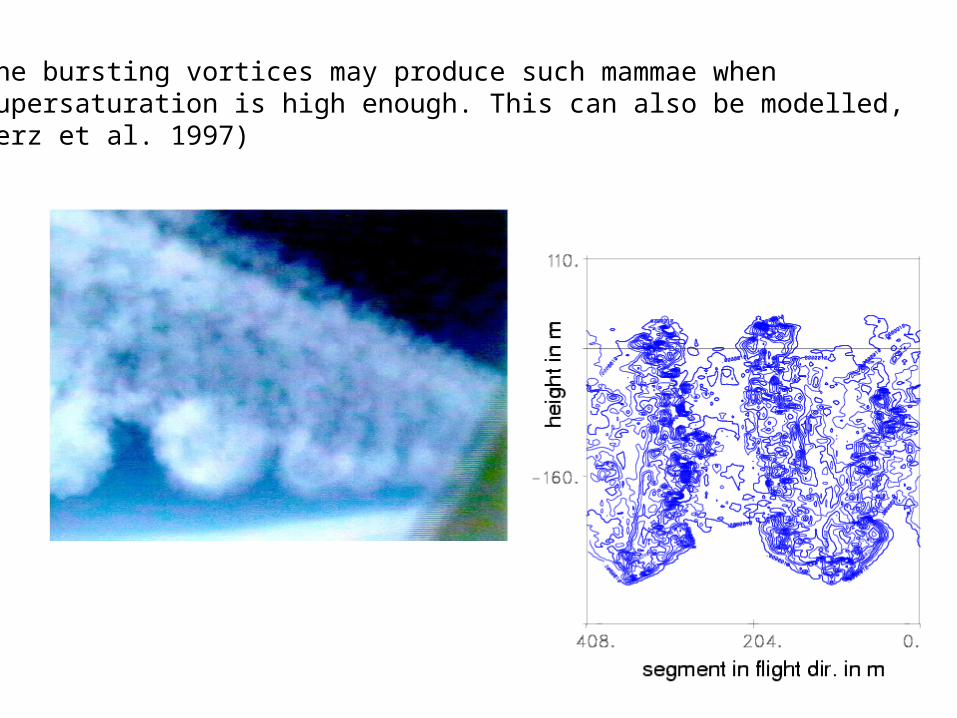
The bursting vortices may produce such mammae when supersaturation is high enough. This can also be modelled,Gerz et al. 1997)
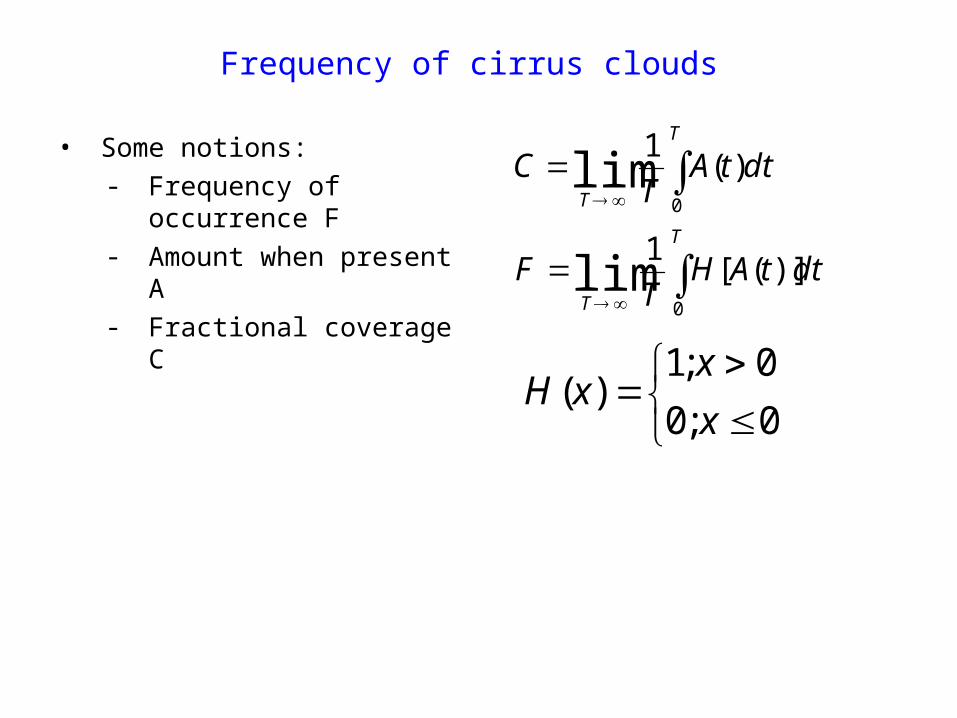
Frequency of cirrus clouds
• Some notions:- Frequency of occurrence
F- Amount when present A- Fractional coverage C
T
T
T
T
dttAHT
F
dttAT
C
0
0
)]([1
)(1
lim
lim
0;0
0;1)(
x
xxH
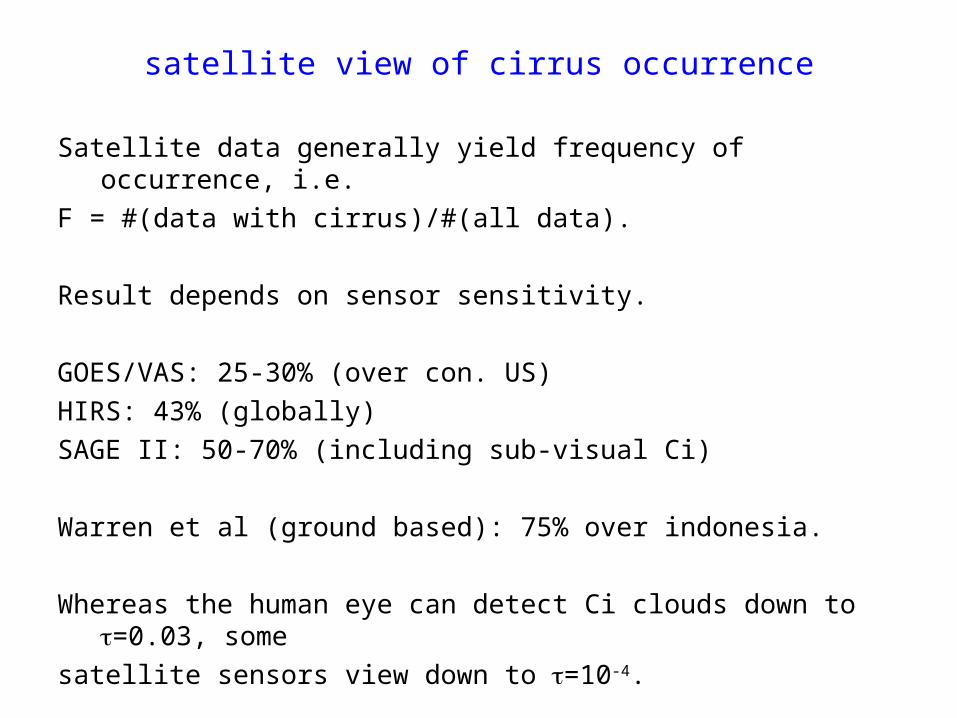
satellite view of cirrus occurrence
Satellite data generally yield frequency of occurrence, i.e.
F = #(data with cirrus)/#(all data).
Result depends on sensor sensitivity.
GOES/VAS: 25-30% (over con. US)
HIRS: 43% (globally)
SAGE II: 50-70% (including sub-visual Ci)
Warren et al (ground based): 75% over indonesia.
Whereas the human eye can detect Ci clouds down to =0.03, some
satellite sensors view down to =10-4.

HIRS high cloud amounts (all clouds with 0.1)
from Don Wylie’sweb page
>14 km
>10 km
>6 km
January July
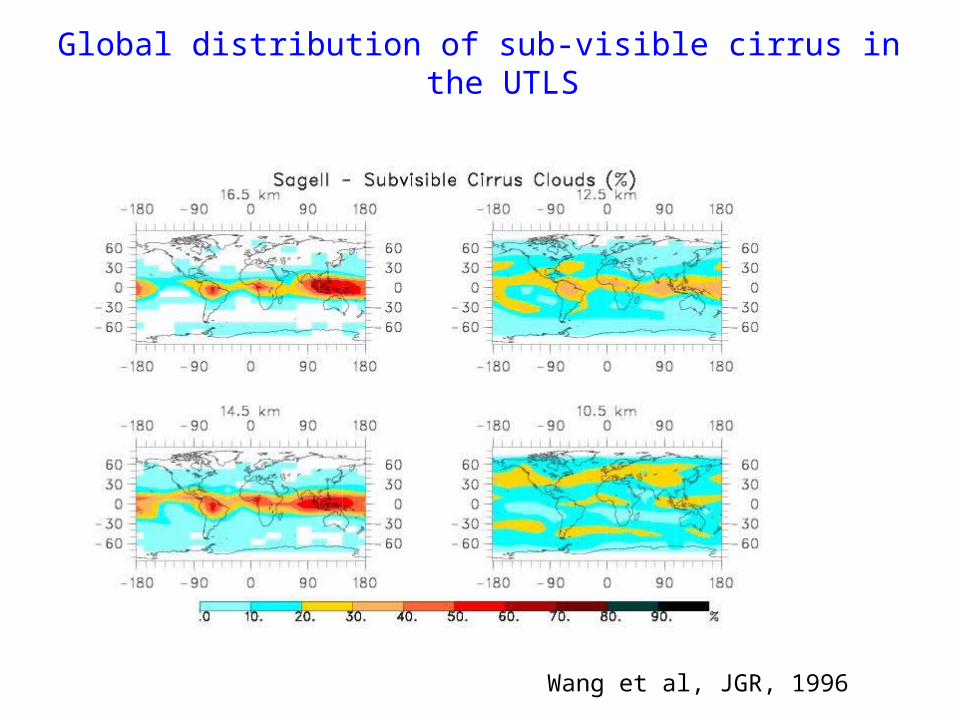
Global distribution of sub-visible cirrus in the UTLS
Wang et al, JGR, 1996
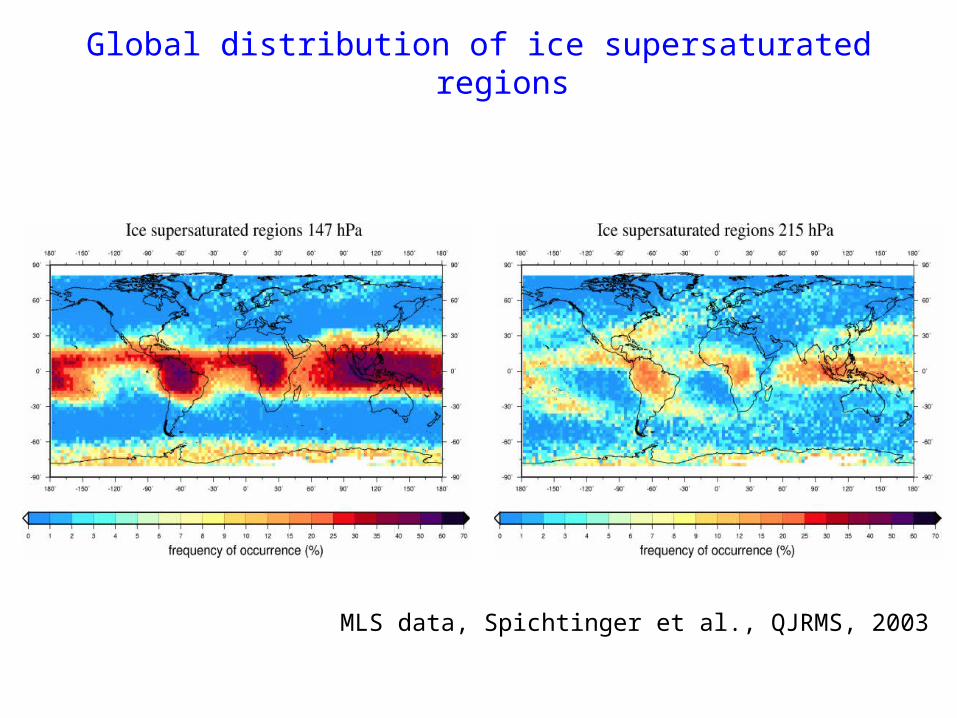
Global distribution of ice supersaturated regions
MLS data, Spichtinger et al., QJRMS, 2003
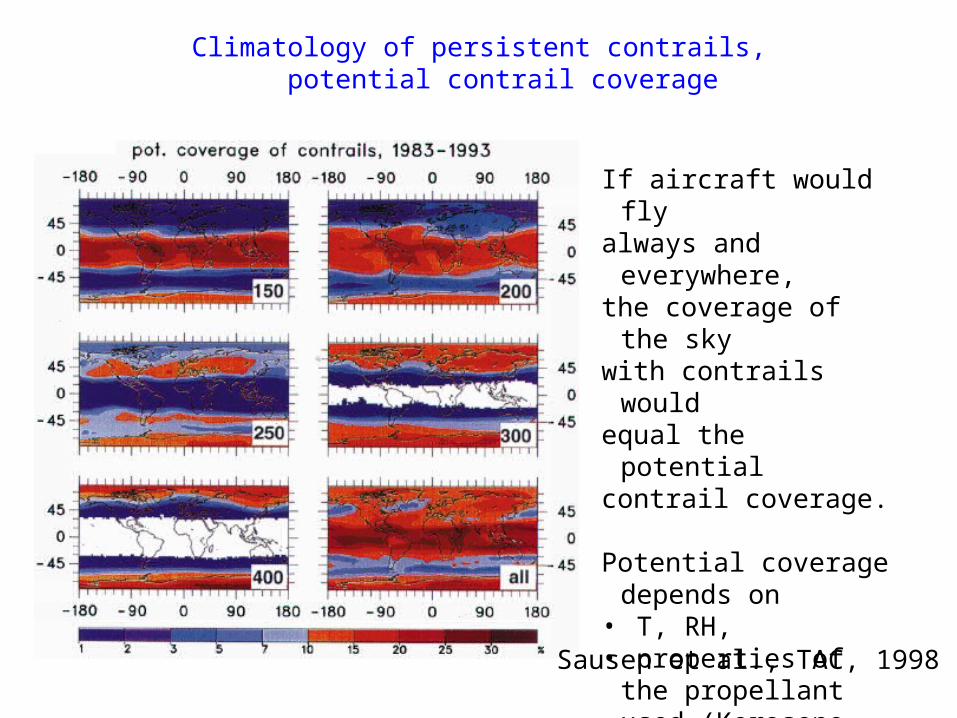
Climatology of persistent contrails,potential contrail coverage
If aircraft would flyalways and everywhere,the coverage of the skywith contrails wouldequal the potentialcontrail coverage.
Potential coverage depends on
• T, RH,• properties of the
propellant used (Kerosene, LH2)
• aircraft performance
Sausen et al., TAC, 1998

Climatology of persistent contrails, current climate
The actual coverageof persistent (line-shaped,i.e. young) contrailsdepends on the actualair traffic. The main aviation flightpaths show up here.
Sausen et al., TAC, 1998

Dynamic cirrus generation mechanisms
1. Cumulonimbus convection anvil cirrus
2. Baroclinic fronts and lows
3. Orographic lifting
All these mechanisms imply upward vertical motion.
(There may be some ice formation in downward motion, via contact nucleation and via efflorescence nucleation).
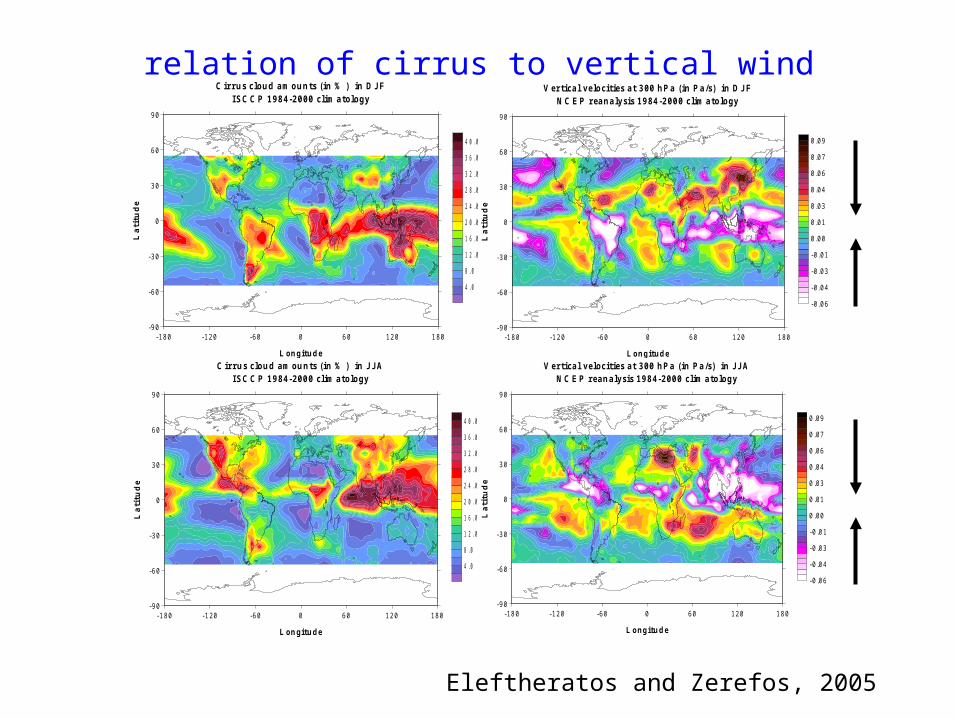
relation of cirrus to vertical wind
Eleftheratos and Zerefos, 2005
-180 -120 -60 0 60 120 180
L o n g itu d e
-9 0
-60
-30
0
30
60
90
Lat
itu
de
4 .0
8 .0
12 .0
16 .0
20 .0
24 .0
28 .0
32 .0
36 .0
40 .0
C irru s c lo u d a m o u n ts (in % ) in D JFIS C C P 1 9 8 4 -2 0 0 0 c lim a to lo g y
-1 80 -120 -60 0 60 120 180
L on g itu d e
-9 0
-60
-30
0
30
60
90
Lat
itu
de
-0 .06
-0 .04
-0 .03
-0 .01
0 .00
0 .01
0 .03
0 .04
0 .06
0 .07
0 .09
V ertica l v e lo c ities a t 3 0 0 h P a (in P a /s) in D J FN C E P rea n a ly sis 1 9 8 4 -2 0 0 0 c lim a to lo g y
-1 80 -120 -60 0 60 120 180
L o n g itu d e
-9 0
-60
-30
0
30
60
90
Lat
itu
de
4 .0
8 .0
12 .0
16 .0
20 .0
24 .0
28 .0
32 .0
36 .0
40 .0
C irru s c lo u d a m ou n ts (in % ) in JJ AIS C C P 1 98 4 -2 00 0 c lim ato lo g y
-1 80 -120 -60 0 60 120 180
L o n g itu d e
-9 0
-60
-30
0
30
60
90
Lat
itu
de
-0 .0 6
-0 .04
-0 .03
-0 .01
0 .00
0 .01
0 .03
0 .04
0 .06
0 .07
0 .09
V ertica l v e lo c ities a t 30 0 h P a (in P a /s) in J JAN C E P rean a ly sis 19 84 -2 00 0 c lim ato log y

Generation mechanisms reflected in satellite imagery
The basic generation mechanisms are reflected in the satellite climatologies:
1. ITCZ maxima: Mostly anvil cirrus.
Tropical convection most important source of water vapour in the UT; keeps Ci alive even far away from and long after the convective event.
Stormtracks
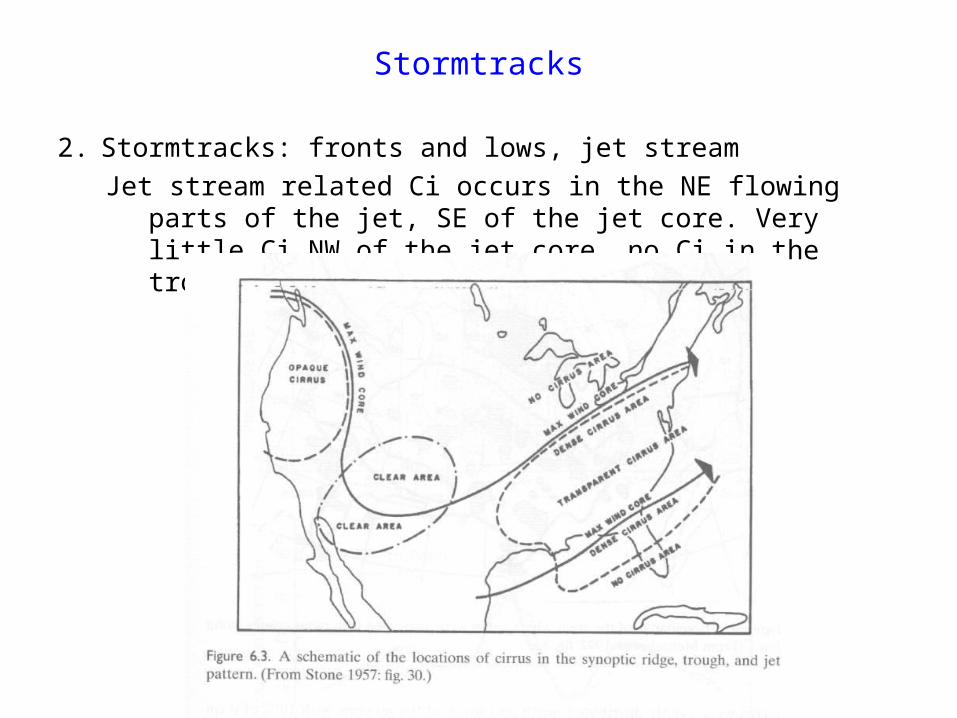
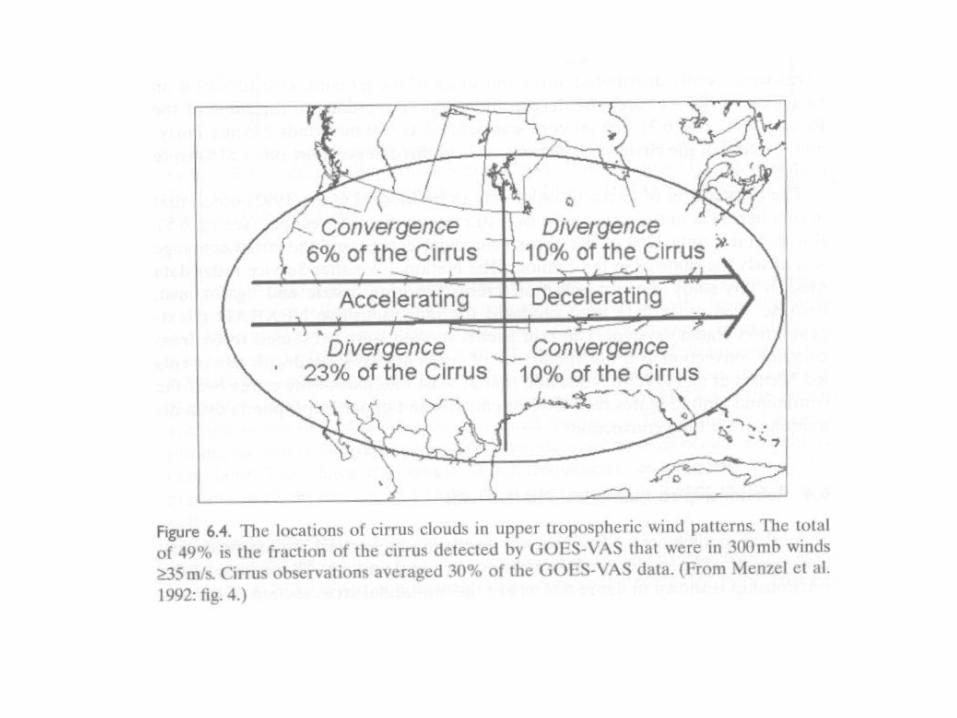
2. Stormtracks: fronts and lows, jet stream
Jet stream related Ci occurs in the NE flowing parts of the jet, SE of the jet core. Very little Ci NW of the jet core, no Ci in the trough.

Orographic cirrus
3. Maximum over Himalaya: orographic cirrus.
• Orographic cirrus induced by flow over a mountain ridge - strong vertical motions in the UT
• favourite subject for in-situ observations• stay at the same place for some period while air is flowing through• onset of ice formation is relatively clearly defined• quasi-Lagrangian experiments (i.e. flight along the air trajectories)
• Orographic cirrus clouds are at the wave crests of the air flow. The aerosol particles form ice at upward motion and evaporate at the downslope, potentially several times.
• study cloud processing affecting the aerosol, in particular its ice formation ability
Formation of contrails
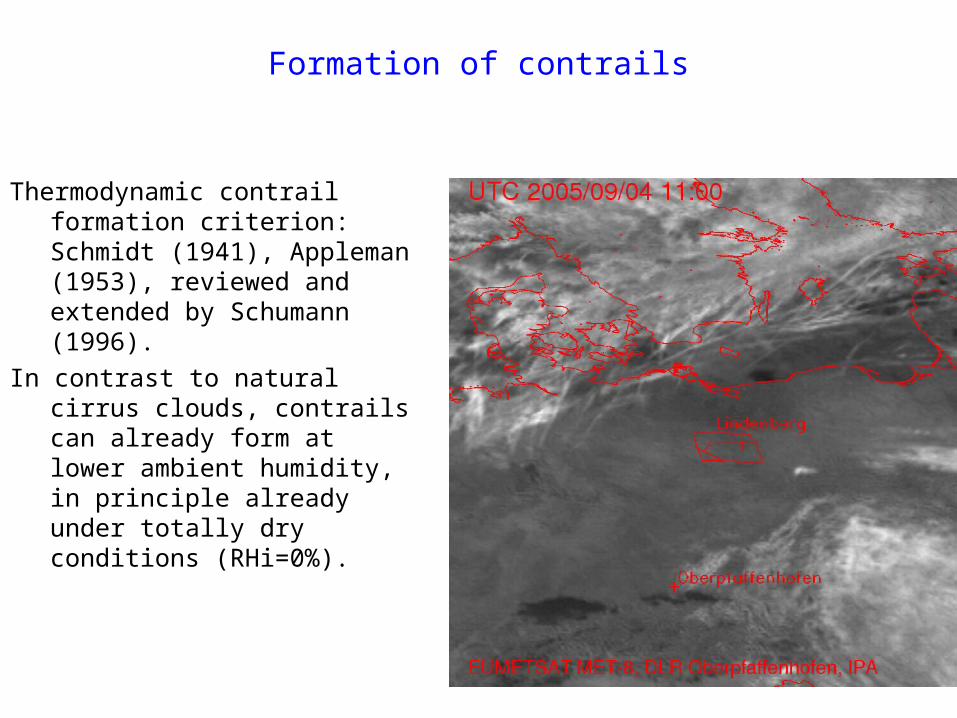
Thermodynamic contrail formation criterion: Schmidt (1941), Appleman (1953), reviewed and extended by Schumann (1996).
In contrast to natural cirrus clouds, contrails can already form at lower ambient humidity, in principle already under totally dry conditions (RHi=0%).

The Schmidt-Appleman criterion
Q
EIpcG OHp
)1(2
Water saturation must be reached during the mixing process.

The Schmidt-Appleman criterion for LH2 contrails
• EIH2O/Q is 2.55 times larger for LH2 than for
Kerosene• contrail formation at higher T, i.e. at lower altitude.
• LH2 burning does not produce particles
• LH2 contrails optically thinner than
Kerosene contrails.
persistent contrails and indirect effect
Only under ice-supersaturated conditions contrails can survive the initial jet- (20 s) and vortex-phases (ca. 2 min), to disperse then and spread by diffusion and wind shear into the atmosphere until it can only hardly be distinguished from natural cirrus clouds.
It is conceivable, but not yet proven, that also the aerosol emitted from jet engines can lead to cirrus formation later on, even when no contrail was formed initially.
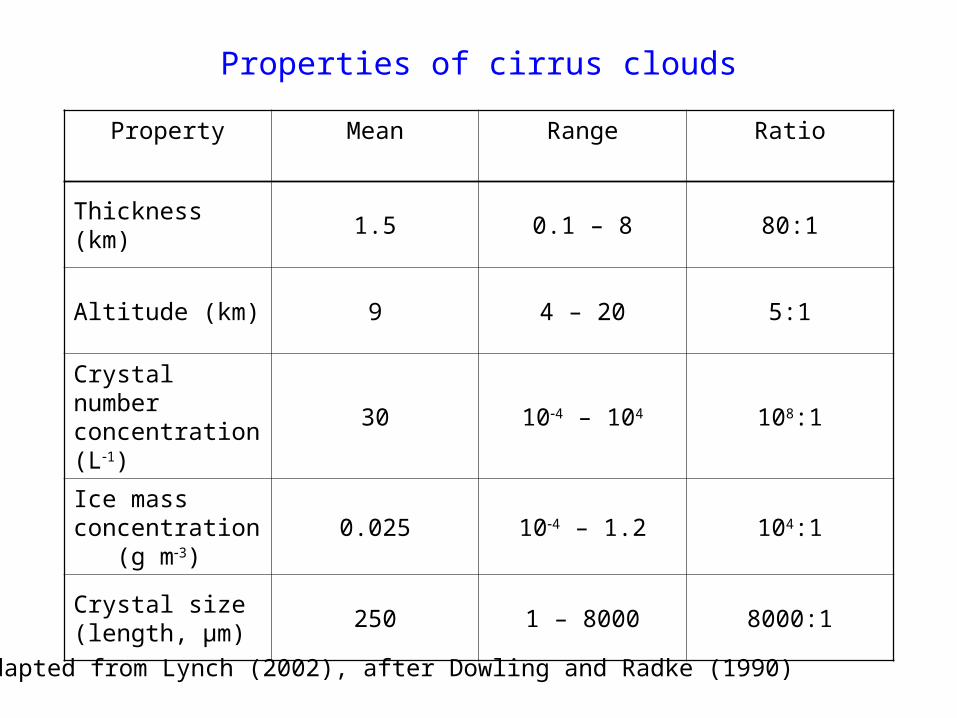
Properties of cirrus clouds
Property Mean Range Ratio
Thickness (km) 1.5 0.1 – 8 80:1
Altitude (km) 9 4 – 20 5:1
Crystal number concentration (L1)
30 104 – 104 108:1
Ice mass concentration (g m3)
0.025 104 – 1.2 104:1
Crystal size (length, µm)
250 1 – 8000 8000:1
Adapted from Lynch (2002), after Dowling and Radke (1990)

Crystal habits
http://www.its.caltech.edu/~atomic/snowcrystals/class/class.htm
Nakaya created the first systematic classification scheme for snowflakes.
Classification of falling snow into 41 individual morphological types.
The most complex classification scheme is an extension of Nakaya's table, published by Magono and Lee in 1966. There are 80 separate morphological types in their classification scheme.
K. G. Libbrecht Caltech

http://www.dri.edu/Projects/replica/magono/snow.html
Predominant crystal habit dependsin a complex way on temperature andsupersaturation during the history ofcrystal growth. Other factors may alsoplay a role.

Climate issues related to cirrus clouds
• Cold ice clouds trap IR radiation, but also reflect solar radiation.• Balance between greenhouse and albedo effects determines net
impact on climate system.• For Ci, this can be + or -.• Sign depends on micro- and macrophysical properties, which in
turn depend on generation mechanism (and many other circumstances).
• The predominant sign depends on geographic location.
• Different cooling/heating effects at TOA, UT, and surface.• This could imply, in a changing climate, dynamical feedbacks from
cirrus changes.
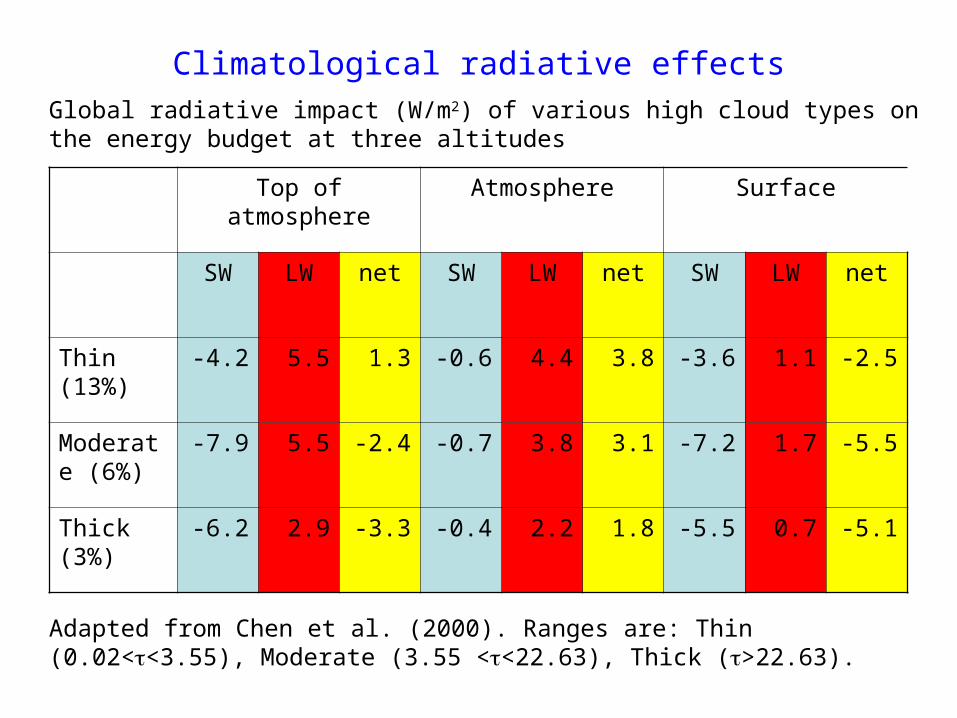
Climatological radiative effects
Top of atmosphere Atmosphere Surface
SW LW net SW LW net SW LW net
Thin (13%)
-4.2 5.5 1.3 -0.6 4.4 3.8 -3.6 1.1 -2.5
Moderate (6%)
-7.9 5.5 -2.4 -0.7 3.8 3.1 -7.2 1.7 -5.5
Thick (3%)
-6.2 2.9 -3.3 -0.4 2.2 1.8 -5.5 0.7 -5.1
Adapted from Chen et al. (2000). Ranges are: Thin (0.02<<3.55), Moderate (3.55 <<22.63), Thick (>22.63).
Global radiative impact (W/m2) of various high cloud types on the energy budget at three altitudes
Climatological radiative effects, cont’d (1)
• Climate change can induce - changes in predominant cloud types - changes of mean (+- variance) cloud properties cloud-climate feedback - variations of cloud fraction are another kind of feedback

Climatological radiative effects, cont’d (2)
• Different cloud types affect different components of the radiative flux in different layers of the atmosphere:
- High level clouds most effectively change OLR, because they are much colder than the lower troposphere and the surface.
- For the same reason their effect on the downward LW radiation at the surface is small.
- Optically thin clouds have always a small effect by themselves, but it must be weighted with their average amount.

Other roles of cirrus clouds in the atmosphere
• heterogeneous chemistry ice surfaces. Contribution to ozone destruction in the UTLS.
• important factor in the dehydration of air entering the tropical lower stratosphere.