Embed Size (px)
Citation preview
kiV I~4 SPATIAL VARIATIONS IN ENERGY ACCESSIBILITY
W4J IN THE SOVIET UNION, 1960-1975
00 by
RUSSELL VICTOR OLSON, JR.
B.A., The Citadel, 1969
JU
A Thesis Submitted to the Graduate Faculty
of the University of Georgia in Partial Fulfillment
of the
Requirements for the Degree
MASTER OF ARTS
~ 1 ~eATHENS, GEORGIA,
La~ 1980
7rg"FFFi 77

SPATIAL VARIATIONS IN ENERGY ACCESSIBILITY
IN THE SOVIET UNION, '2960-1975
by
RUSSELL VICTOR OLSON, JR.4
Approved:
Major Professor
-L b~~'.~4! Date -(3
Chalrman, Reading Committee
Approved: Ac~~~ o
0 - 1iiTI*S Grlia&.DOTAB
Un rlofc ed
Acting Dean Graduadte ScholB*
Ic tD5i/stpjribit 00 e
Dit spec al

UNCLASSIFIEDSECURITY CLASSIFICATION OF THIS PAGE (When Data Entered)
REPORT DOCUMENTATION PAGE READ INSTRUCTIONS
I. PREPORT NUMBER 1.GVT ACCESSION NO. 3. RECIPIENT'S CATALOG NUMBER
5 'T "t100 CO VER ED
S.PATIAL RIATIONS IN ,;NERGY ~CESS1IBILFiY Fin~al ~t1 Jun 80lii T-
_4 L epr
^fNTB SVIET U11O 16-197,-I- -------- PERORMNG OG'.*ER0.TMIMBE
8. CONTRACT OR GRANT NUMbER(s)
R1USSELL VICTOR OQLSON, J R , CAT11~i, FILD, ' Y -
9. PERFORMING ORGANIZATION NAME AND ADDRESS 10. PROGRAM ELEMENT, PROJECT, TASK
Student, HQDA, MILPERCEN (DAPC-OPP-B),200 Stovall Street, Alexandria, VA 22332
It. CONTROLLING OFFICE NAME AND ADDRESS 11. *..O
HAMILPERCEN, ATTN: DAPC-OPP-E, 200 / IStovall Street, Alexandria, VA 22332 :
14. MONITORING AGENCY NAME & ADDRESS(If different from Controling Office) 15. SECURITY CLAS.
UNCLASSIFIED
15a. DECLASSI FICATION/ DOWNGRADING
16. DISTRIBUTION STATEMENT (of thi. Report)
Approved for public release; distribution unlimited.
17. DISTRIBUTION STATEMENT (of thme abstract entered In Riock 20, If different from Report) 1AII. SUPPLEMIENTARYNOE
A thesis submitted to the University of Georgia, Athens, GA, in~partial fulfillment of the requirements for the degree of Masterof Arts, Geography.
49. KEY WORDS (Continue on reverse aide If necessary end Identify by black number)IjSoviet UnionjEnergy accessibilityUrban population growthIlEnergy potential model
20ZGrR3S1ACr (Cttue am #*veon * t negcesawy aad identlif by block gluebet)IThe emphasis in coal, oil, and natural gas production in the Soviet-lUnion Wshifted dramatically eastward after 1960, but spatial1p~rns of energy accessibility remained fairly stable from 1960 to:~1975. Utilizing annual coal, oil, and natural gas production datajexpressed in terms of standard fuel units and distances measured
61n railroad and pipeline routes, aps,,energpoetamdl
i mrrittbd the computation of ernergy potential indices based, onditance, and. distance. modif ied' by generalized transport costs- for -
DD "" iSECUMTY CLASSIFI CATION6 OF -THIS PAGE (When Dat EnteWe-
71"

I
UNCTASSIFIEDSECURITY CLASSIFICATION OF THIS PAGE(Uha Data Bnteed)
Block 20 continued...
129 major administrative and industrial centers for, 1960, 1970,and 1975. A general purpose contouring program mapped relativeenergy potential indices, and these maps showed that the areaswith the highest energy accessibility were alsoamong the most important industrial areas. A correlation analysisbetween energy accessibility and urban population growth revealedthat changes in energy accessibility have had a modest influenceon urban population growth rates. Soviet-industrial locationand urban population growth have been relatively unrestrainedby the location of energy resources.
.
1
- .~-, ¢ • ° ,-- - - -- - ;-iL - -
- -- ,-sEcuRiTY;"CL'Ass ~ct OF-tISl PAOE(When bataFnteted)h /

ACKNOWILEDGEMENTS
Tiae and space do not permit me to mention all the graduate stu-
dents and members of the Geography Department's staff and faculty who
knowingly, or otherwise, made some contribution to this study. Some in-
dividuals, though, deserve recognition because of the significance of
their contributions. Dr. Berentsen was my mentor, advisor, and friend
during my graduate studies and was the source of inspiration for this
thesis topic. The members of my reading comittee, Drs. Pannell and
Wheeler, were helpful with their timely assistance and comments. Al-
though not a member of my reading committee, Dr. Mitchelson was generous
with his time and advice. Dr. Houston of the University of Toronto was
kind enough to lend his railroad distance matrix and saved me many hours
of work. Mrs. Mildred Bell spared me the tedious job of typing a rough
draft and Mrs. Ann Clark graciously accepted the task of typing the fi-
nal copy at short notice. Delores of Cartographic Services did a
L thoroughly professional job of drafting the final maps. My "carrell-
mates," Betsy, Linda, and Mary, provided often needed distractions dur-
ing my work. My wife, Linda, uncomplainingly bore the brunt of the many
nights and weekends consumed by this thesis and was a tireless cheer-
leader on the home front. All of the above individuals will be remem-
bered by me for a long time to come.
iii
4 -
MP_

TABLE OF CONTENTS
ACKNOWLEDGEMENTS ........ .. ......................... . ii
LIST OF TABLES ........ .... .......................... vi
LIST OF FIGURES ....... ..... ......................... vii
CHAPTER I INTRODUCTION ....... ... ................... 1
Background ................... .I.........1Problem Statement ....... ................ 5Research Objectives ...... ............... 8Outline of Chapter Contents . . . . . . . . . . . 8
CHAPTER II LITERATURE REVIEW ..... ................ .I.i. 11
Introduction ...... .................. . i.11Urban Growth .................. 11Industrial Location .... ............... .... 16Natural Resources ..... ................ .... 20Potential Models ...... ................ ... 24Summary . ........ . . . ......... 26
CHAPTER III DATA AND METHODOLOGY
Introduction . . . . . . . . . . ...... 30
An Energy Potential Model . . .. . ........ 33Energy Production Data ... ......... 35Distance Measurement .............. 43Energy Potential: Indices and Maps ....... 46
CHAPTER IV ANALYSIS OF ENERGY ACCESSIBILITY . . . . . . . . . . 56
Introduction . . . . . . . . . . . ....... 56Nodal Rank Ordering and Energy Potential Maps . . 56
* Urban Population Growth and Energy Accessibility 80Summary . . . . . . . . ....... . . . . . . 84
CHAPTER V CONCLUSION . ................... . 87
j Introduction 87Implications .......... . . . . . . . . 87Areas for Future Research. ......... . 92
iv
WOFr:'

Page
BIBLIOGRAPHY .. ............................ 95IAPPENDIX A DISTANCES TO COAL SOURCES .. ............. 100
APPENDIX B DISTANCES TO OIL SOURCES .. .. .. .. .. .. . .107
APPENDIX C DISTANCES TO GAS SOURCES. .. ............. 117
APPENDIX D COAL, OIL, AND NATURAL GAS POTENTIAL INDICES BASEDON DISTANCE AND TRANSPORT COSTS .. ......... 124
APPENDIX E URBAN POPULATION DATA .. ............... 131
7--7777
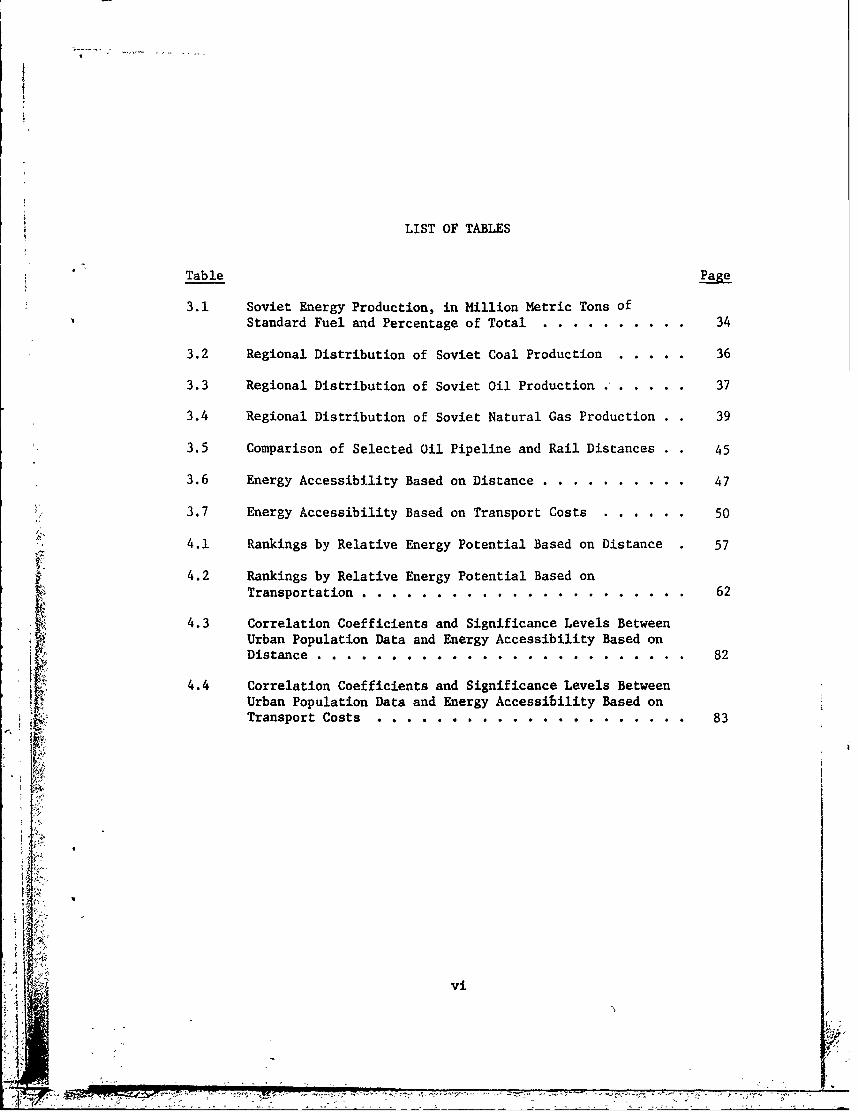
LIST OF TABLES
Table Page
3.1 Soviet Energy Production, in Million Metric Tons ofStandard Fuel and Percentage of Total .. .......... ... 34
3.2 Regional Distribution of Soviet Coal Production . . ... 36
3.3 Regional Distribution of Soviet Oil Production ..... .. 37
3.4 Regional Distribution of Soviet Natural Gas Production 39
3.5 Comparison of Selected Oil Pipeline and Rail Distances 45
3.6 Energy Accessibility Based on Distance ............ ... 47
3.7 Energy Accessibility Based on Transport Costs . ...... .. 50
4.1 Rankings by Relative Energy Potential Based on Distance 57
4.2 Rankings by Relative Energy Potential Based onTransportation. .. .......... .. .................... 62
4.3 Correlation Coefficients and Significance Levels BetweenUrban Population Data and Energy Accessibility Based onDistance ....... ..... ......................... 82
4.4 Correlation Coefficients and Significance Levels BetweenUrban Population Data and Energy Accessibility Based onTransport Costs .. .. .. .. .. .. .. .. .. . .. 83
vi

LIST OF FIGURES
Figure Page
1.1 Population Distribution ........ ................. 4
1.2 Soviet Energy Sources ......... .................. 6
3.1 Nodes Used in Study . ...... . .. ................ 32
4.1 Soviet Energy Potential: 1960 Based on Distance ....... 67
4.2 Soviet Energy Potential: 1970 Based on Distance ....... 69
4.3 Soviet Energy Potential: 1975 Based on Distance ....... 71
4.4 Soviet Energy Potential: 1960 Based on Transport Costs . 73
4.5 Soviet Energy Potenti,,.; 1 97 0 B a se d on T r an s p or t C o s ts . 7 5
4.6 Soviet Energy Potential: 1975 Based on Transport Costs 77
vii
7r

CHAPTER I
INTRODUCTION
Background
The Soviet Union is the only large industrialized country in the
world to be completely self-sufficient in energy resources at the present
and for the foreseeable future (Lydoiph 1979, p. 261). Although the So-
viet Union has imported natural gas from its neighbors to the south,
Iran and Afghanistan (Ebel 1978, p. 165, Lydolph 1979, p. 280), and some
coal from Poland (Lydolph 1979, p. 288), these imports reflect the un-
even spatial distribution of energy resources within the U.S.S.R. and
the desire of the Soviets to minimize transportation costs in providing
I energy to outlying areas of the country. In fact, the Soviet Union is a
net exporter of coal, oil, and gas with oil being its primary hard cur-
rency earning export. It is largely through the export of energy re-
sources that the Soviets have been able to gain the hard currency with
which they have purchased the large quantities of feed grain needed to
maintain livestock herds at levels sufficient to placate the desires of
the Soviet consumer for more meat. This hard currency is also used to
i Iobtain the high technology items which the U.S.S.R. is either unable or
4unwilling to produce itself due to production bottlenecks inherent ini ;its centrally planned economy.
A 1

2
Even more important than their current position as major export
items has been the use of energy resources to fuel the boilers of Soviet
industry and thus provide the foundation upon which the steady g-owth of
Soviet GNP during the past three decades has depended (Lydolph 1979, pp.
199-200; Cohn 1970). Dienes (1978) has demonstrated the uniqueness of
the high level of energy intensity of Soviet ecuOL1mic development, and
Dewdney (1976) has stated that "among the many factors that have favoured
the industrial growth of the Soviet Union, none has been more important
than that country's possession, within its own borders, of vast energy
resources of all types" (p. 62). Unfortunately for the Soviets, "there
is a striking lack of coincidence between the location of most of this
industrial energy and the present centres of consumption" (Hooson 1966,
p. 81). Three-fourths of the population and four-fifths of the industry
of the Soviet Union are found in the European portion of the country, in-
cluding the Urals and the Caucasus, while as much as 90% of the estimated
energy reserves, including hydroelectricity, are located east of the Ur-
als and the Caspian Sea (Dienes 1971).
When Soviet industrial energy needs were mudh more modest than they
I are now, adequate energy resources were easily accessible in locations
favorably situated in the so-called "fertile triangle" of the country
where most of the population is located (Figure 1.1). The Soviet Union
possesses vast reserves of energy resources, but, as Hardt (1973) so
aptly paraphrased Khruschev, "the U.S.S.R. cannot fire its diesels with
. statistics" (p. 27). Consequently, the Soviets bove been forced to
search elsewhere for new sources of energy. The spatial distribution of
energy resources within the Soviet Union has resulted in the exploita-
tion of coal, oil, and gas fields that are far removed from the population
I I 7i .

FIGURE 1.1
Source: Lydoiph (1979, p. 156)
4 .~~-; ,';~~ -- Zz
N.

INS
ci
)IIz

5
and industrial centers of the country. Examples of this include in-
creased production at the coal basins of Pechora, Kansk-Achinsk, and
Ekibastuz, as well as the discovery of the supergiant oil and gas fields
of Tyumen Oblast in Western Siberia (Figure 1.2). The further burdening
of an already overtaxed railroad network and the building of oil and gas
pipelines have been necessary to make these energy resources accessible
to the bulk of Soviet energy consumers.
Problem Statement
As the emphasis of Soviet energy production shifted eastward and
links were built to make this energy available for use to the urban and
industrial consuming centers of the European U.S.S.R., certain areas and
nodes (industrial and administrative centers) have undoubtedly undergone
significant changes (absolute and relative in comparison to other areas
and nodes) in accessibility to energy. The purpose of this study is to
examine the changes in energy accessibility in the Soviet Union through
the use of an energy potential model and to determine what influences
these changes might have had on urban growth and industrial location.
The aim of this research is not to expl2in all the complex factors in-
volved in Soviet urban growth and industrial location but only to inves-
tigate the interrelationship between energy accessibility on the one
hand and urban growth and indust i'al'location on the other.
Energy accessibility will. be determined for 129 nodes, and energy
potential maps of the Soviet Union will be compiled for the years 1960,
197Q, and 1975. Only coal, oil, and gas will be used in this study.
Peat, oil shale, firewood,, and electricity from hydroelectric and nuclear
power plants can be Very Important on a local level but contribute little
I17 77I% j ...

417
FIGURE 1. 2
Source: Data for outline arid cities taken from Soviet Union
National Geographic Society, 1976,
transverse polyconic projection
mv ;7
VY.
VI, 77

77777
00
o cl
0=
0 -S>
0(
a,0 0 i
C J Cl, 0
-,O 0
r.. F 0
z w z ~ Y. caI- N
4 w a 0
-A U 0
0I 0
UU . UCOE
13 0
0 3
A 4
'4~~ > I
In~ <
13 (
In,;

8
on a national basis. The three major types of energy together accounted
for 89.2, 92.1, and 93.6 percentage of total Soviet production for the
years 1960, 1970, and 1975 respectively (Dienes and Shabad 1979, pp. 32-
34).
Research Objectives
This study will attempt to provide answers to the following central
research questions.
1. How can energy accessibility be measured through the use of a
potential model?
2. What have been the changing patterns of energy accessibility in
the Soviet Union? How has energy accessibility in the Soviet Union
changed during the study period?
3. How do spatial patterns of energy accessibility correspond with
industrial areas in the Soviet Union?
4. What is the relationship between energy accessibility and urban
growth?
5. If energy accessibility has been an irip6rtant factor in urban
growth and industrial location, has its importance been increasing or de-
creasing? Is it likely to be an important factor in the future?
Outline of Chapter Contents
Chapter II reviews major studies dealing with Soviet urban growth,
industrial location, and natural resources. Specifically, it summarizes
V lfactors influencing Soviet urban growth, socialist principles of indus-
trial location, links between resources and industrial output, links be-
tween industrial output and urban population, and the use of potential
SW.;
1111'k, T 7""-'7777 - 7 t

9
models. Methodology is the theme of Chapter III, which discusses the se-
lection of the data points and the types of energy and describes the en-
ergy potential model, the compilation of the data matrices, and the de-
velopment of the energy potential maps. Chapter IV analyzes the data as-
sembled in Chapter III in an effort to determine and evaluate whatever
links may exist between energy accessibility on the one hand and urban
growth and industrial location on the other. A summary of findings and
the implications of this study are presented in Chapter V.

10
References
Cohn, S.H. 1970. General Growth Performance of the Soviet Economy. InEconomic Performance and the Military Burden in the Soviet Union,Subcommittee on Foreign Economic Policy of the Joint Economic Com-mittee, Congress of the United States, pp. 9-17, Washington, D.C.:U.S. Government Printing Offices.
Dewdney, J.C. 1976. The U.S.S.R. Kent, England: Wm. Dawson & Sons Ltd.
Dienes, L. 1971. Issues in Soviet Energy Policy and Conflicts over FuelCosts in Regional Development. Soviet Studies 23, 1:26-58.
Dienes, L. 1978. Soviet Energy Policy and the Hydrocarbons. Washing-ton, D.C.: Association of American Geographers Project on SovietNatural Resources in the World Economy, Discussion Paper 2.
Dienes, L. and Shabad, T. 1979. The Soviet Energy System. Washington,D.C.: V.H. Winston & Sons.
Ebel, R.E. 1970. Communist Trade in Oil and Gas. New York: PraegerPublishers.
Hardt, J.P. 1973. West Siberia: The Quest for Energy. Problems ofCommunism 22, 3:25-36.
flooson, D.J.M. 1966. The Soviet Union. London: University of LondonPress.
Lydolph, P.E., 1979. Geography of the U.S.S.R., Topical Analysis. Elk-hart Lake, Wisconsin: Misty Valley.
.I
k

CHAPTER II
LITERATURE REVIEW
Introduction
This research has been undertaken in an effort to determine patterns
of energy accessibility in the Soviet Union and to assess the signifi-
•cance of energy accessibility on urban growth and industrial location.
The literature dealing with Soviet urban growth, industrial distribution,
and natural resources is quite diverse, and this chapter reviews the pub-
lished literature relevant to the establishment of links between urban
population, industrial location, and natural resources, particularly en-
ergy. In order to place the relationship between energy accessibility
and urban growth in proper perspective, it is necessary to summarize the
many factors influencing urban growth and industrial location and to dem-
I-nstrpte how urban population can be used as a surrogate measure of in-dustrial distribution. There are five sections in this review. The
first three cover Soviet urban growth, industrial location, and natural
resources. The fourth reviews uses of potential models, and the last
section is a summary.
Urban Growth
In their study of Russian and Soviet urbanization, Lewis and Row-
land (1969) asserted that "the growth of Soviet cities is the most
11
III

12
visible geographic change that has occurred in the U.S.S.R." (p. 776).
Their definition of urbanization had two applications (Lewis and Rowland
1969, p. 779). Level of urbanization referred to the percentage of to-
tal population living in centers with a population of at least 15,000,
and change in urbanization was the absolute change in the level of ur-
banization. Although they analyzed urbanization in terms of industriali-
zation, transportation accessibility, and in-migration, they felt that
urban population growth was so obviously the most important factor in ur-
banization that it was unnecessary to test the relationship. In some
parts of their study, they even used urban population as an index of ur-
banization (Lewis and Rowland, 1969, pp. 779, 782, 785, and 789).
To determine national and regional patterns of urbanization, data
for population centers of 50,000 and over were aggregated at the economic
region level for the period 1959-1966 (Data were not available for cen-
ters under 50,000 for that period, but centers of 50,000 and over ac-
counted for 76 percent urban population). During 1959-1966, the Donets-
Dnepr, Central Chernozem, Volga-Vyatka, Northwest, and Belorussia regions
exhibited the greatest increase in urbanization,*and the most rapid urban
growth occurred in Moldavia, Central Asia, Kazakhstan, Belorussia, and
the Central Chernozem regions (Lewis and Rowland 1969, p. 789).
A rank correlation analysis of the effect of industrialization (as
measured by the percentage of the total population in manufacturing) on
urbanization (as measured by the percentage of the total population
classified as urban) showed that between 1926 and 1961 industrialization
was a significant factor (.05 level) in promoting the "city-forming pro-
cess," with a Spearman rank correlation coefficient of +0.794. The level
of urbanization in 1959 had a rank correlation of 0.828 with the
1

13
percentage of the total population in manufacturing in 1961 (Lewis and
Rowland 1969, p. 791). Further analysis revealed that industrialization
was more significant in stimulating the growth of large cities with a
population of over 100,000 (r =+0.766) than of small ones (r = +0.609)
for the period 1926-1961. The authors also mentioned that large cities
produced 70-75% of Soviet gross industrial production (Lewis and Rowland
1969, p. 792). Transportation accessibility and in-migration were also
noted as important factors in Russian and Soviet urbanization (Lewis and
Rowland 1969, pp. 792-795).
Harris (1971) examined the growth of Soviet urban population be-
tween 1959 and 1970. At the regional level, variations in urban popula-
tion growth were due primarily to the different stages each region had
reached in the urban and demographic revolutions. "The urban revolution
is marked by high rates of urban growth sustained by a massive rural-
urban migration," and "the demographic revolution is characterized by
falling death rates and falling birth rates but at different times"
(Harris 1971, pp. 102-103). He stated that "among the major economic
regions, variations in the rate of increase in urban population are in-
versely related to the proportion of the population urban, are positively
connected with rate of natural increase in population, and are negatively
associated with change in level of rural population" (Harris 1971, p.
110).
U At the oblast level, high urban growth rates were associated with
a low percentage of population urban, as in Rovno and Belgorod oblasts,
in the Ukraine and the RSFSR, respectively, or with a high rate of na-
tural increase, as in Guryev oblast in Kazakhstan ane oblasts in Soviet
Central Asia. A number of urban districts that had experienced the most
14
rapid urban growth during 1926-1939 displayed low urban growth rates dur-
ing 1959-1970 (20 percent or less compared to the national average of 36
percent). These included Donetsk and Voroshilovgrad oblasts in the Don-
bas area, Tula oblast in the Moscow Coal Basin, and Kemerovo oblast in
the Kuzbas region, all of which were heavily dependent on the coal in-
dustry "which has suffered from the competition of rapidly expanding pe-
troleum and natural gas production" (Harris 1971, p. 116). Petroleum
and natural gas discoveries helped account for rapid urban growth in ob-
lasts in Soviet Central Asia, western Kazakhstan, and Western Siberia.
Of the 221 cities with 100,00 or more population in 1970, Harris
(1971) briefly examined the growth of 28 cities with high growth rates
(over 75 percent) and six cities with population decreases since 1959.
Of the 28 cities with high growth rates, 16 were industrial cities, and
12 were diversified political-administrative centers. Of the 16 indus-
trial cities, seven were associated with chemical industries, four with
hydroelectric projects, three with iron and steel mills, and two with
other industries. Of the seven industrial cities with chemical indus-
tries, Novgorod, Grodno, Rovno, and Cherkassy were old cities with fuel
deficiencies that had had slow growth rates stimulated by the piping-in
of natural gas (Harris 1971, p. 119). The six cities which showed popu-
lation declines during 1959-1970 were coal-mining cities in the Donbas,
Kuzbas, and Chelyabinsk coal basin (Harris 1971, p. 122-123).
A similar study by Lydolph and Pease (1972) found that during the
period 1939-1959, most cities from the Volga eastward experienced high
growth rates with particularly high rates for coal mining towns, while
western cities grew less rapidly (Lydolph and Pease 1972, p. 252). This
pattern of growth generally reversed itself during 1959-1970, and the
44

15
growth rate and absolute declines of coal mining centers across the coun-
try reflected the declining importance of coal in the Soviet energy mix-
ture (Lydolph and Pease 1972, pp. 252-255). These declines give sub-
stance to the statement that "trends in industrialization are intimately
related to trends in city growth" (Lydolph and Pease 1972, p. 252).
Lydolph and Pease (1972) felt that the growing importance of oil
and natural gas would smooth the way for the location of industries in
the western heavily populated areas. They wrote:
The discovery and exploitation of huge deposits of oil andgas in such remote regions as Western Siberia and the Mangy-shlak Peninsula of Central Asia will bring boom times tothese areas and will produce a few workers' settlements ofconsiderable size, but these energy sources will be removedfrom their regions of origin for consumption elsewhere andwill not provide an impetus for widespread settlement ofthese empty areas. Western Siberia's anticipated role asproducer of one-third of all Soviet oil in 1980 will haveits primary impact not on potential changes within the re-gion itself, but rather on its contribution to total Sovietenergy production, the increased supplies of easily trans-ported fluid fuels, permitting the establishment of people-oriented industries serving the labor and markets of theSoviet West (Lydolph and Pease 1972, p. 261).
Urbanization continued unabated during the 1970-1979 intercensal
period, and patterns of urban growth corresponded closely with those of
the 1959-1970 period (Lydolph et al. 1978, p. 525; Bond and Lydolph
1979, pp. 461-475). The growth rates of most cities with populations
over 100,000 declined from the 1959-1970 period, but this seemed "to be
related more to stages of development than to geographical location"
(Lydolph et al. 1978, p. 528). Although "no universally applicable ax-
iom emerges relating magnitudes of growth to city functions" (Bond and
Lydolph 1979, p. 471), diversified political-administrative centers,
such as Minsk and Yerevan, had moderate and steady annual growth rates,
and industrial cities displayed both the highest and the lowest growth

16
rates. The industrial cities with the highest growth rates were based
on automotive activities along the Kama and Volga, oil and gas exploita-
tion in West Siberia, and, in one case, the construction of a new iron
and steel industry in the Kursk Magnetic Anomaly area. Cities with low
or negative growth rates were in older industrial areas, such as coal
mining centers in the Donets and Kuznetsk basins and metallurgical areas
in the Urals (Bond and Lydolph 1979, pp. 471-475).
Urban growth and industrialization have been closely linked through-
out the Soviet period. Prior to 1959, the eastern part of the country
experienced high urban growth rates, especially coal mining areas includ-
ing those in the western part of the country. During the intercensal
periods 1959-1970 and 1970-1979, the western cities grew at a faster rate
than did the eastern cities, but the annual growth rates were generally
lower for all cities during the 1970-1979 period. Cities in Seviet Cen-
tral Asia and the Transcaucasus exhibited high growth rates during both
periods because of their initial low levels of urbanization and high na-
tural population increase. The impact of the changing nature of the en-
ergy mixture was demonstrated by the low growth *ates or population de-
clines of coal mining cities during 1959-1970 and 1970-1979 while some
4 cities had slow growth stimulated by the piping-in of natural gas. Oil
and gas were expected to have more impact on the nation as a whole than
I on the producing regions.
~Industrial Location
Although Western literature on Soviet industrial location is re-
plete with references to Soviet location theory, Rodgers (1974) has ob-
served that "no distinctive and coherent body of ideas than can
W

17
legitimately be called 'socialist location theory' has been produced in
the U.S.S.R. or in any other socialist state" (p. 235). It is possible
though to identify the following general Soviet industrial planning
goals or principles (Huzinec 1977; Koropeckyj 1970; Lonsdale 1961;
Lydolph and Pease 1972; Rodgers 1974):
1. Locate industry close tc sources of raw materials and to mar-
kets in order to minimize transporu costs.
2. Plan regional industrial development to make all regions as
economically self-sufficient as possible.
3. Promote regional specialization to take advantage of favorable
conditions and to utilize natural resources most effectively.
4. Raise the level of development of the underdeveloped regions
of the country to that of the most advanced.
5. Eliminate the socioeconomic differences between rural and urban
areas by distributing industry throughout the country.
6. Create and maintain the greatest possible capacity for defense.
Several of these objectives are incompatible or mutually exclusive,
and the emphasis placed on them has shifted throUgh time. These princi-
ples have often been used as justification for decisions made for prag-
matic or political reasons. This is especially true as Soviet planners
have wrestled with the problems of:
development of well-populated, industrially underdeveloped* regions; rejuvenation or diversification of old industrial
areas with the attraction of growth industries; and inte-gration of harsh pioneer areas, rich in natural resources,into the mainstream of the country's economic life (Dienes1971, p. 27;Dienes 1972, p. 437).
Studies have endeavored to detect motives behind regional economic
development which might reveal adherence to one or more of the planning
-,- .77 7 7

18
principles. Dienes (1972) examined the rate of capital return and mar-
ginal capital product in Soviet industry during the 1960s and found that
1"regional investment allocation evidently was guided by strategic con-
v siderations" (p. 446) because "the under-industrialized western regions,
where capital and labor productivity are satisfactory or high, have been
slighted in favor of more easterly provinces" (p. 437).
In his study of Soviet industrial location policy, Koropeckyj (1970)
noted the concentration of industry in large cities and the importance
of large cities in total industrial output. Soviet writers were then
bemoaning "the excessive concentration of industrial development pri-
marily in large and major cities" (Mikhailov and Solovev 1969, p. 130).
Manufacturing plants were attracted to cities because labor and capital
productivity were generally higher in such locations. Advances in tech-
nology tended to occur more rapidly in urban areas. These factors con-
tributed to the location of industry in Soviet cities and the growth of
cities during the 1960s (Koropeckyj 1970, pp. 280-284). Koropeckyj con-
cluded by pointing out that no single principle dominated Soviet indus-
trial location policy and that among all the forbes at work the most im-
portaut one was probably the one which reflected the political interests
of the ruling group (Koropeckyj 1970, p. 285). This conclusion was sup-
ported by Abouchar (1979) who stateA that "no single broad social or
economic policy emerges . . behind the pattern of attained and planned
Industrial groa, h rates since 1965" (p. 102).
Rodge (1974) used average ntmbers of industrial production per-
sonnel on a region scale (generally oblast and autonomous republic level
with some union republic data) to reveal shifts of industry in the
j "U.S.S.R. 1940-1955 and 1955-1965. In 1940, there was a high correlation
JR,",
7 7]

19
(r = 0.75) between the distribution of urban population and industrial
employment (Rodgers 1974, p. 229). The German invasion of World War 11
was largely responsible for a general eastward shift of industry be-
tween 1950 and 1955 (Rodgers 1974, pp. 233-235). The shifts between
1955 and 1965 were more complex with no single area of industrial expan-
sion. The areas with the highest growth were the Baltic republics,
Belorussia, Moldavia, the Ukraine, the northern and western Caucasus,
and the middle and lower Volga Valley (Rodgers 1974, p. 235).
Thinking that the reasons behind the 1955-1965 patterns might have
been connected with regional variations in energy production, Rodgers
(1974) calculated fuel and power output by region for 1965 and regressed
those values on the shifts in industrial employment with results that
were statistically insignificant. Rodgers argued that these results re-
flected the shift in emphasis from coal to oil and gas, whose relative
ease of movement permitted a "high degree of locational freedom" (Rod-
gers 1974, p. 237). To test the relationship between changes in indus-
trial location and the distribution of markets, population distribution
for 1965 was used as a surrogate measure for markets, and the correla-
tion between the regional population values and the shifts in industrial
employment was "quite strong" (r2 - 0.42). An R2 of 0.46 resulted from
a multiple regression with the 1955-1965 shifts in industrial employment
as the dependent variable and population and fuel outputs for 1965 as
the independent variables (Rodgers 1974, p. 237). This further under-
scored that the role of energy was less important than might otherwise
have been expected in industrial location.
Additional analyses revealed that "there was remarkably limited
evidence of the implementation of the equality principle" (Rodgers 1974,
TvI

20
p. 238). Rodgers (1974) concluded that "if there is a conscious region-
al planning policy in the U.S.S.R., it appears to support growth rather
than equity" (p. 238). This observation was also noted by Fuchs and
Demko (1979) who wrote that continued spatial inequalities in socialist
states "can be explained in terms of the priority placed on efficiency
or military security as opposed to equity in industrial location deci-
sions" (p. 304).
The principles of industrial location ascribed to socialist plan-
ners are somewhat contradictory, and no clear guiding principle has
emerged although military considerations and growth appear to be the
most important factors. Industry is concentrated in large cities, and
industrial growth has been highest in the western regions of the country
in recent years. Markets were much more important than energy produc-
tion in changes in industrial location.
Natural Resources
"The study of the role of natural resources in the location of the
economy and population has been an important and traditional research
area in economic geography" (Runova 1976, p. 73). F:ints and Kakhanov-
skaya (1974) developed a generalized resource potercial index in an ef-
fort to quantitatively assess the natural resource potential of regions
in the U.S.S.R. The natural resources included in their study were
coal, oil, natural gas, iron ore, hydroelectric resources, timber re-
sources, arable land, natural forage, and other major resources, such as
chemical raw materials or nonferrous metals if particularly sigiificant
for a given region. The areal units for which data were available were
union republics, krays, oblasts, and autonomous republics (Mints and
7A

21
Kakhanovskaya 1974, pp. 556-557). The resource data were converted to
annual productivity indicators. In the case of mineral resources, re-
serves were divided by the estimated periods of extraction. Addition-
ally, reserve estimates were limited to those likely to be accessible in
the next ten to 15 years. Once annual productivity indicators were de-
termined, they were expressed in monetary units using rounded current
prices, and the values were then arithmetically manipulated to determine
the resource potential of each region (Mints and kakhanovskaya 1974, pp.
559-561). The prices chosen for their calculations are probably the
most controversial part of their study, considering the complex and of-
ten irrational pricing system of centrally planned economies.
The values were replaced with percentages to show the relative con-
tribution of each resource to the rescurce potential of a region and
each region to the total national potential. The results were somewhat
startling, showing that the European part of the country (including the
Urals) accounted for more than 40% of the nation's total potential,
whereas Siberia and the Far East accounted for only 33%. This was due
largely to the way values for mineral reserves were calculated and to
the significant role of agriculture which represented 69% of the total
resource potential in Kazakhstan, 65% in the European south, 64% in the
middle and northern latitudes of the European U.S.S.R., and 61% in So-
viet Central Asia. In Siberia and the Far East, agriculture accounted
for only around 15% of total resource potential (Mints and Kakhanovskaya
1974, p. 561).
A choropleth map of resource density by unit area showed high val-
ues for southern agricultural areas, particularly those with signifi-
-Ai cant mineral and hydroelectric resources. A map of resource availability
!ia
. ... . . .. .. .. . . . ' . .. .. .. ... . . ... . . I L Il!Ill I I I I I - I et ,

- y
22
on a per capita basis showed high values for the eastern regions (Mints
and Kakhanovskaya 1974, pp. 562-563). Mints and Kakhanovskaya (1974)
felt that "the results obtained and the maps compiled on that basis may
already be useful in small-scale research on regional-planning and re-
source-use problems covering the Soviet Union as a whole or some of its
major regions" (p. 556).
In a later study, Mints (1976) stated that "the resource factor
plays a steadily declining role in shaping the spatial structure of the
economy as a whole" (p. 9), in part, because of advances in transporta-
tion technology which make it easier to transport energy and raw mater-
ials (Mints 1976, p. 10). Although West Siberia is rich in oil and gas
reserves, such reserves should be considered part of the energy base of
the European part of the U.S.S.R., because the hostile environment pre-
cludes the establishment of local processing industries in areas as the
West Siberian gas fields (Mints 1976, p. 12). Mints (1976) observed
that recent trends to locate oil refineries in market areas are expected
to continue (p. 15) and that "the existing spatial distribution of popu-
lation and current migration trends are likely to become key factors in
industrial location" (p. 21). His statement refers to the availability
of labor in the western regions where most of the markets are, the con-
tinuous labor shortage in Siberia and the eastern regions, and the lack
of success with inducing labor to stay in labor-short areas.
Using the resource-potential data determined by Mints and Kakhanov-
skaya (1974), Runova (1976) examined the links between the distribution
of resources, economic activity, and population at the economic region
level. The results of a linear correlation analysis on a pairwise ba-
sis showed that the correlations were extremely low between resources

23
as a whole and the distribution of total economic output (r +0.02) and
between resources and total population (r = +0.04). The correlations
between industrial resources and industrial output and between industri-
al resources and urban population were also quite low (r = +0.03 for
both relationships). There was a strong relationship (r = +0.96) be-
tween the distribution of industrial output and urban population. The
difficulty of working with data at the economic region level was under-
scored when the great centers of production (the Central Region) and of
resources (West Siberia) were omitted from the analysis. The correla-
tions between total resources and total economic output (r = +0.43) and
for total resources and population (r = +0.65) were then much higher
(Runova 1976, pp. 83-85).
Dienes examined Soviet energy policy and regional development
(Dienes 1971) and the problems of allocation in the Soviet fuel supply
(Dienes 1973). Both studies were concerned with the concept of marginal
fuel costs and the regional allocation of energy resources. A linear
programming solution yielded an optimal fuel mix for each region (Dienes
1971, pp. 45-48; Dienes 1973, pp. 9-14). This linear programming solu-
1 tion was followed by a discussion of the heated debates between the "pro-
Siberian" planners who wanted to severely curtail industrial location
west of the Urals and the "pro-European" plauners who had chafed under
the relatively slow development of western mineral reserves, such as the
Kursk Magnetic Anomaly (Dienes 1971, pp. 49-56; Dienes 1973, pp. 16-20).
Dienes felt that resistance to a strongly pro-Siberian energy-oriented
investment policy would grow because "taking workers and industry to en-
ergy sources has proved less effective than hoped for, and Soviet

wt T
24
planners are learning what Adam Smith knew: 'Of all baggage, people are
the most expensive to move"' (Dienes 1971, pp. 57-58).
Efforts to quantify natural resource potential have been largely de-
scriptive and highly aggregated. The relationship between resources on
the one hand and industrial output and urban population on the other was
rather weak, but the relationship between the distribution of industrial
production and urban population was quite strong. The importance of re-
sources as a factor in industrial location is expected to decline because
of advances in transportation technology. The harsh environment of the
eastern regions and the availability of labor in the western region is
expected to further encourage the location of industry in the western
market areas.
Potential Models
Although the concept of potential models has been criticized (Hous-
ton 1969; Taaffe and Gauthier 1973, pp. 97-99; Yeates 1974, pp. 130-131),
potential models have been widely used as macrogeographic tools by human
geographers in a variety of ways. Some of their'uses have been to con-
struct potential maps showing possible interactions between people or be-
tween producers and markets, to discover empirical regularities in the
distribution of population, and to analyze patterns of transport costs and
the effects of highway location on such patterns (Lukermann and Porter
1960; Stewart and Warntz 1958; Taaffe and Gauthier 1973, pp. 90-92). This
oection reviews some uses of potential models which are particularly
relevant to this study.
Harris (1954) pioneered the use of potential models and maps con-
structed from them when he examined the importance of market accessibility
-,-;7

. ..... L v- . i.• . .. ... . . 0 . , o . T ! v, ;
25
as a factor in industrial location in the United States. He calculated
an index of accessibility to markets with a market potential model using
the formula, P = E[r], where P = the market potential for a given city,
M = county retail sales, and d = straight line distance as modified by a
generalized estimate of freight rates. Two assumptions underlay this
model. One was that county retail sales provided a good measure of the
overall market for goods, and the other was that straight line distances
measured from a map could be used instead of actual route distances be-
cause of the dense transportation network of the United States (Harris
1954, pp. 316-323).
New York City was found to have the highest market potential, and
utilizing the values of the other cities in his study expressed as a
percentage below New York City, Harris (1954) drew an isarithmic market
potential map of the United States with contours representing lines of
equal market potential. Harris (1954) relied on visual inspection to
show how closely the area with the highest market potential coincided
with the American Manufacturing Belt (Harris 1954, pp. 323-326).
Fifteen years later, Houston (1969) compiled several market poten-
L tial maps of the Soviet Union employing total population, urban popula-
tion, and total population weighted by retail sales per capita by repub-
lic as measures of market size. Distances between the 128 points used
in calculating market potential indices were shortest rail and/or rail-
-: ferry distances instead of straight line distances because of the nature
of the Soviet transportation network which is a great deal less dense
than that of the United States (Houston 1969, pp. 218-220). Since he
was concerned primarily with at analysis of the concept of potential
models, Houston (1969) made no interpretation of their application to
iW
'11,71__ 7

26
the U.S.S.R., but the market potential generally matched population dis-
tribution and was highest around Moscow.
In his monograph, Cities of the Soviet Union, Harris (1970) deter-
mined population potential indices for the entire country and compiled
potential maps based on total, rural, and urban population. Harris
(1970) used population by oblasts or similar administrative units and
direct airline distances between the geographical centers of the oblasts
at which the entire population was considered to be concentrated (Harris
1970, p. 187). Harris (1970) stated that urban population potential
"measures on a country-wide basis and in a highly generalized and ab-
stract fcrm many elements of industrial location: market, labor, indus-
trial materials for complex industries, and of the interaccessibility
of such elements" (p. 194).
Summary
Soviet urban growth has been highest in the Soviet West, Transcau-
casia, and Central Asia and has been affected primarily by trends in in-
dustrialization and stages in the urban and demographic revolutions. Al-
fthough no single principle has been dominant, Soviet industrial locationpolicy has appeared to favor maximizing national economic growth and de-
fense considerations. The pull of markets and the availability of la-
bor apparently have been strong factors in industrial location and have
9 resulted in the concentration of industrial production in large cities
* Iin the western regions of the country. Analyses have shown the rela-
tionship between the distribution of urban population and industrial
output to be quite strong.
9 .. .. .. . . . . . .. . ,F[

27
Urban population and industrial distribution are inextricably
linked in the U.S.S.R., but not much effort has been made to link urban
and industrial growth to accessibility to energy, except for occasional
comments on the impact of energy on the growth of individual cities or
clusters of cities. Those studies which sought to examine the relation-
ship of energy on the one hand and the distribution of urban population
and industrial production on the other attained results that were sur-
prisingly low. These low results were probably due to the fact that
they were not considering the availability of energy. Rather, the en-
ergy data were in a highly aggregated form either as regional energy
production data or submerged in regional industrial resource data. No
one has examined nationwide patterns of energy accessibility, and the
links between urban growth and energy accessibility have not been rigor-
ously tested on a macrogeographic basis. Any link which can be estab-
lished between urban growth and energy accessibility will provide addi-
tional information on the nature of Soviet urban-industrial growth poli-
cies.

28
References
Abouchar, A. 1979. Regional Industrial Policies of the U.S.S.R. in the1970s. In Regional Development in the U.S.S.R., NATO Colloquium25-27 April 1979, pp. 93-103. Newtonville, Mass.: Oriental Re-search Partners.
Bond, A.R. and Lydolph, P.E. 1979. Soviet Population Change and CityGrowth 1970-79. A Preliminary Report. Soviet Geography: Reviewand Translation 20, 8:461-488.
Dienes, L. 1971. Issues in Soviet Energy Policy and Conflicts overFuel Costs in Regional Development. Soviet Studies 23, 1:26-58.
Dienes, L. 1972. Investment Priorities in Soviet Regions. Annals ofthe Association of American Geographers 62, 3:437-454.
Dienes, L. 1973. Geographical Problems of Allocation in the SovietFuel Supply. Energy Policy 1, 1:3-20.
Fuchs, R.J. and Demko, G.J. 1979. Annals of the Association of Ameri-can Geographers 69, 2:304-318.
Harris, C.D. 1954. The Market as a Factor in the Localization of In-dustry in the United States. Annals of the Association of AmericanGeographers 64, 4:315-348.
Harris, C.D. 1970. Cities of the Soviet Union. Washington, D.C.: As-sociation of American Geographers.
Harris, C.D. 1971. Urbanization and Population Growth in the Soviet
Union, 1959-1970. The Geographical Review 61, 1:102-124.
Houston, C. 1969. Market Potential and Potential Transportation Costs:An Evaluation of the Concepts and Their Surface Patterns in theU.S.S.R. The Canadian Geographer 13, 3:216-236.
Huzinec, G.A. 1977. A Reexamination of Soviet Industrial LocationTheory. The Professional Geographer 29, 3:259-265.
Koropeckyj, I.S. 1970. Industrial Location in the U.S.S.R. During thePostwar Period. In Economic Performance and the Military Burdenin the Soviet Union, Subcommittee on Foreign Economic Policy ofthe Joint Economic Committee, Congress of the United States, pp.233-295. Washington, D.C.: U.S. Government Printing Offic,
Lewis, R.A. and Rowland, R.H. 1969. Urbanization in Russia and theU.S.S.R.: 1897-1966. Annals of the Association of American Geo-graphers, 59, 4:776-796.
Lonsdale, R.E. 1961. Industrial Location Planning in the Soviet Union.The Professional Geographer 13, 6:11-15.

29
Lukermann, F. and Porter, P.W. 1960. Gravity and Potential Models inEconomic Geography. Annals of the Association of American Geo-graphers 50, 4:493-504.
Lydolph, P.E., Johnson, R., Mintz, J., and Mills, M.E. 1978. RecentPopulation Trends in the U.S.S.R. Soviet Geography: Review andTranslation 19, 8:505-539.
Lydolph, P.E. and Pease, S.R. 1972. Changing Distributions of Popula-tion and Economic Activities in the U.S.S.R. Tijdschrift voorEconomische en Sociale Geografie 63, 4:244-261.
Mikhailov, S. and Solovev, N. 1969. Small and Medium-Size Cities andthe Location of Industry in the U.S.S.R. In Contemporary SovietEconomics, vol. 2, ed. M. Yanowitch, pp. 129-136. White Plains,New York: International Arts and Sciences Press, Inc.
Mints, A.A. and Kakhanovskaya, T.G. 1974. An Attempt at a QuantitativeEvaluation of the National Resource Potential of Regions in theU.S.S.R. Soviet Geography: Review and Translation 15, 9:554-565.
Mints, A.A. 1976. A Predictive Hypothesis of Economic Development inthe Eurpoean Part of the U.S.S.R. Soviet Geography: Review andTranslation 17, 1:1-27.
Rodgers, A. 1974. The Locational Dynamics of Soviet Industry. Annalsof the Association of American Geographers 64, 2:226-240.
Runova, T.G. 1976. The Location of the Natural Resource Potential ofthe U.S.S.R. in Relation to the Geography of Productive Forces.Soviet Geography: Review and Translation 17, 2:73-85.
Stewart, J.Q. and Warntz, W. 1958. Macrogeography and Social Science.The Geographical Review 48, 2:167-184.
Taaffe, E.J. and Gauthier, H.L. Jr. 1973. Geography of Transportation.Englewood Cliffs, N.J.: Prentice-Hall, Inc.
Yeates, M. 1974. An Introduction to Quantitative Analysis in HumanGeography. New York: McGraw-Hill Book Company.

CHAPTER III
DATA AND METHODOLOGY
Introduction
This chapter deals with how energy accessibility was determined
for 129 cities of the Soviet Union. This introductory section discusses
the selection of the nodes, years, and types of energy used in this
study. Five sections follow. The first describes an energy potential
model used to calculate energy accessibility. The next two sections
cover the computation of energy production data and the measurement of
distances needed in the energy potential model. The last section pre-
sents the energy potential indices and map compilations.
For the purpose of determining the patterns of energy accessibility
in the Soviet Union, 129 nodes were selected (Figure 3.1). These nodes
are cities which are either union republic capitals or centers of auton-
omous republics, oblasts, or krays (except for Norilsk). Although they
do not include all of the almost 200 capitals or administrative centers
of the country, they do provide adequate coverage of the ecumene of the
Soviet Union and represent almost half of the 272 cities with popula-
tions of 100'000 or over in 1979. In addition to being administrative
centers, many, if not most, of these 129 cities are also industrial
cities. Large cities were selected in favor of smaller cities because
census data for them were readily available.
301 *
_14- .t 7-
____"___

FIGURE 3.1
Source: Data for outline and cities taken from Soviet Union,
National Geographic Society, 1976,
transverse- polyconic projection

32
,00
0o
000
# 0
0- 0
33
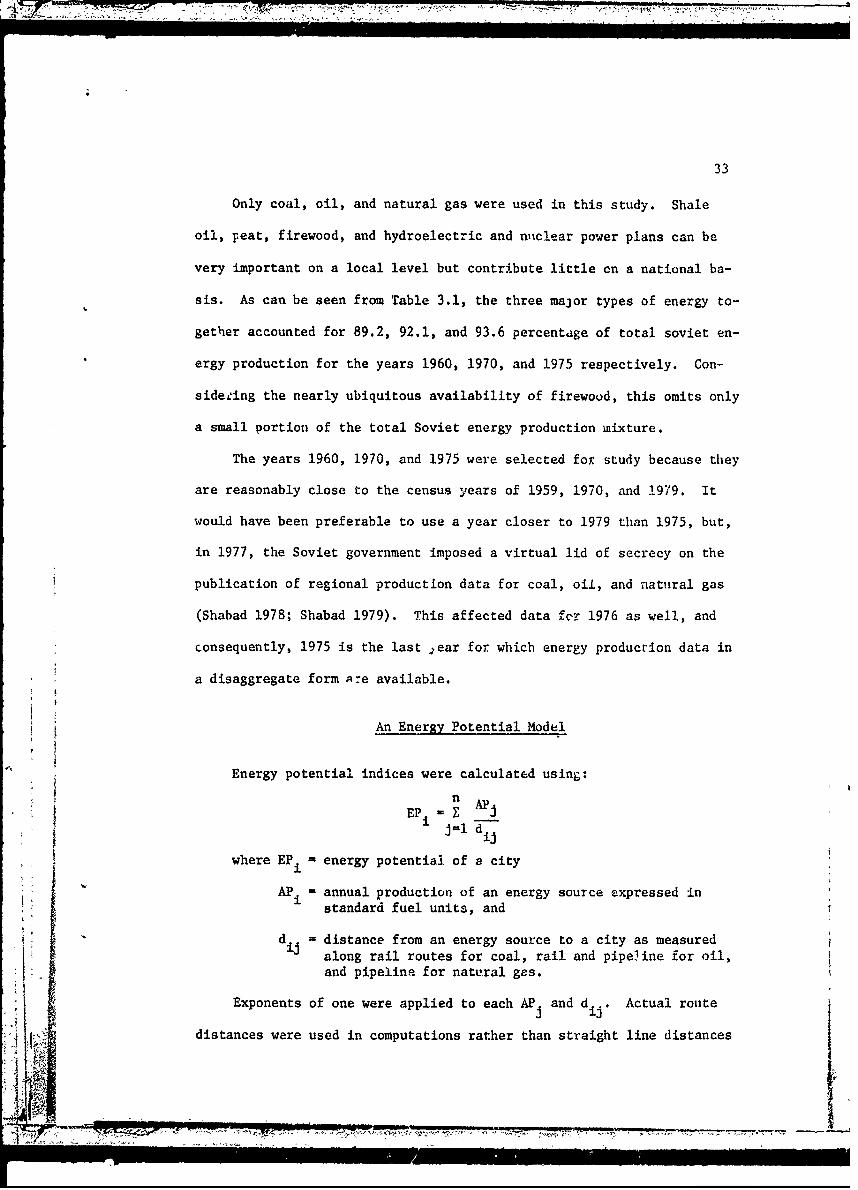
Only coal, oil, and natural gas were used in this study. Shale
oil, peat, firewood, and hydroelectric and nitclear power plans can be
very important on a local level but contribute little on a national ba-
sis. As can be seen from Table 3.1, the three major types of energy to-
gether accounted for 89.2, 92.1, and 93.6 percentage of total soviet en-
ergy production for the years 1960, 1970, and 1975 respectively. Con-
sideeing the nearly ubiquitous availability of firewood, this omits only
a small portion of the total Soviet energy production mixture.
The years 1960, 1970, and 1975 were selected for study because they
are reasonably close to the census years of 1959, 1970, and 1979. It
would have been preferable to use a year closer to 1979 than 1975, but,
in 1977, the Soviet government imposed a virtual lid of secrecy on the
publication of regional production data for coal, oil, and natural gas
(Shabad 1978; Shabad 1979). This affected data fcr 1976 as well, and
consequently, 1975 is the last ,ear for which energy production data in
a disaggregate form A:e available.
An Energy Potential Model
Energy potential indices were calculated using:
EP n AP JEPi Z
j=l dwhere EPi = energy potential of a city
AP. = annual production of an energy source expressed instandard fuel units, and
V d = distance from an energy source to a city as measuredV along rail routes for coal, rail and pipeline for oil,
and pipeline for natural gas.
Exponents of one were applied to each AP and di. Actual routej ii*
distances were used in computations rather than straight line distances
. ..... . . .. .~ ~~~ ~~ ~~ II-_7 " iiI i ,," . . . . . . .

34
cn H4 0' H 0 H N 0 C;
a% * c- a 01% 00 un 00 IT 00 m 0u- 4.8 C* * 4 a 8 L
:3 0 It r- H- HI Nl Ct410 r-. M~* % 0
00
0%
Q) '.0 r-I H . .n
0d 0 C:5-4 0 ~ C ~ H 0 '
u C.4 H CV 9 oC
$4 0 cq
r- 0
M 0' %D rf' 0f' m.r. C . .
4) 0 0 N0 c' r O '. 4~HH 0 C0 ("H 0 t
%10 0 tf'1 N 10 H -H -4 T'.04 0 l 0
E- -di
000 H4
4.8 41 0M0 H %D 'T 00 -T0 -
H~0 0d aA0 'd .
Ln .0
0 0% H~
Hn 04 0H
0 0 ta.0
~~-4~ r44 HH. .5.4u 14 Hn -d a)0-. C C .4.4 .4 H A r- NN4 0 p
4o 0 4 0f- -X 60
H4 0) 44Q) ~ ~ ~ ~ ~ . 0- N.( - 4 0 0t
0~~ 0 )ci
w 0 $4 rq 4)
4J 4J 0'0). Ifo 0 0) Hj r
0a4 o.

35
in order to make the results more realistic. Energy potential indices
were calculated using both route distances and route distances modified
by estimated transport costs.
Energy Production Data
Before energy production data could be entered into the energy po-
tential model, two tasks had to be performed with the available regional
energy production data. First, the data had to be disaggregated from
regional data to point data in order to have energy source points from
which to measure distance to the cities under study. Because the spa-
tial distribution of energy production is not homogeneous within re-
gions, the geographic center of each region for which energy data were
available could not be used as the energy source point for that region.
Instead, the selection of points for energy sources was based on an ex-
amination of the locationj of energy producing fields within each re-
gion, and the actual positions of the energy source centers were deter-
mined by the distribution of coal, oil, and natural gas fields within a
region. The sources consulted in the determination of the energy source
point and the points themselves are contained in the appropriate produc-
tion data tables (Tables 3.2, 3.3, and 3.4).
The other task involved the standardizing of coal, oil, and natural
gas production data by converting them into standard fuel units. The
term standard fuel (or conventional fuel) is often employed by the So-
viets for comparing different forms of energy. Standard fuel has a heat
content of 7,000 kilocaluries per kilogram (Ebel 1970, p. xix; Elliot
1974, p. 266), and conversion factors may be applied to the various
I j. types of fuel to obtain standard fuel equivalents.
71I

36
Table 3.2
Regional Distribution of Soviet Coal Production(in Million Metric Tons of Standard Fuel)
Region 1960 1970 1975 XSFa Centerb
Pechora Basin 17.4 20.0 21.8 0.90 Vorkuta-IntaMoscow Basin 17.9 14.2 13.0 0.38 TulaDonets Basin
Rostov 26.4 24.9 24.5 0.75 ShakhtyUkraine 128.7 142.1 141.8 0.75 Gorlovka
Lvov-Volhynia 3.9 10.3 11.7 0.81 ChervonogradDneper Basin 3.3 2.8 3.2 0.25 AleksandriyaGeorgia 1.9 1.4 1.3 0.61 KutaisiBashkir 1.1 2.1 2.7 0.29 KamertauPerm 11.9 8.0 6.1 0.90 KizelSverdlovsk 6.5 5.2 2.9 0.29 SerovChelyabinsk 10.7 9.2 8.2 0.43 KorkinoKuznetsk Basin 69.0 87.3 102.8 0.75 KemerovoKansk-Achinsk 4.5 9.0 13.4 0.48 KrasnoyarskChernogorskc 3.1 4.1 3.7 0.75 AbakanNorilskc 1.9 2.5 2.2 0.70 NorilskCheremkhovo 12.1 12.1 10.2 0.73 CheremkhovoAzey 0.4 2.7 4.3 0.43 TulunBuryat 0.4 0.6 0.6 0.43 GusinoozerskChita 2.6 2.9 5.2 0.70 KarymskoyeYakut 0.7 1.1 1.4 0.70 YakutskAmur 4.1 5.5 5.8 0.43 RaychikhinskKhabarovsk 0.7 0.9 1.1 0.71 UrgalMaritime 5.0 6.5 7.1 0.70 ArtemSakhalin 3.5 3.4 3.5 0.70 UglegorskMagadan 0.9 1.0 1.5 0.80 KadykchanKaraganda 22.7 31.6 37.0 "0.80 KaragandaEkibastuz 4.0 14.0 27.5 0.60 EkibastuzUzbekistan 2.2 2.3 3.2 0.61 AngrenFerganad 3.0 2.9 3.0 0.61 Andizhan
Total 370.5 430.6 470.7 0.67
aactors used to convert 1975 raw production data into standard fuel
units. These values were multiplied by 1.03 and 1.10 to obtain factorsfor 1970 and 1960 respectively.
bDistances 7ere measured from these energy source centers to the nodes
under study.cEstimates based on 1965 production.
d Represents the combined production of the Kirghiz and Tadzhik SSRs.
VSources: Dienes and Shabad (1979); Elliot (1974); Hodgkins (1961);Lydolph (1977); Lydolph (1970); Shabad (1969).
4

* ~ ~ ....... -r~n- ....... r-rn 111 nl ... m .... .. ,,, , 1rf " :l l-'-....,-.- -
37
Table 3.3
Regional Distribution of Soviet Oil Production(in Million Metric Tons of Standard Fuel)
Region 19 60a 1970 a 1975 a Centerb
Komi 1.2 10.9 15.7 PechoraKrasnodar 10.0 8.4 8.9 KrasnodarStavropol 2.3 9.2 10.0 NeftekumskChechen-Ingush 4.7 28.6 12.9 GroznyyDagestan 0.3 3.1 2.9 MakhachkalaTatar 66.2 145.7 148.3 AlmetyevskBashkir 36.2 56.1 55.9 TuymazyKuybyshev 31.5 50.0 49.8 KuybyshevSaratovc 2.9 1.9 1.9 SaratovVolgogradc 7.2 10.0 9.6 ZhirnovskPerm 3.3 23.0 31.9 PermOrenburg 1.7 10.6 19.9 PokrovkaUdmurt h 0.7 4.9 SarapulBelorussia h 6.0 11.4 RechitsaWest Ukrained 3.1 4.0 2.7 DolinaEast Ukrained h 15.9 15.6 GadyachAzerbaijan 25.5 28.9 24.6 BakuTyumenShaim h 6.0 7.2 ShaimSamotlore h 34.0 197.3 Megion
Tomske h 4.9 7.2 StrezhevoySakhalin 2.3 3.6 3.4 OkhaKazakhstanEmba 2.2 3.9 5.4 Makat-DossorMangyshlak h 14.9 28.7 Uzen
Fergana Valleyf 3.0 3.3 2.7 AndizhanTurkmenia 7.6 20.7 22.3 Nebit DagGeorgiag h h 0.4
Total 211.2 504.3 701.5
aA factor of 1.43 was used to convert raw regional production data into
standard fuel units.bDistances were measured from these energy source centers to the nodes
under study.cEstimates for 1970 and 1975 based on 1960 and 1965 data.
dEstimates based on relative contribution to total Ukrainian production.eCombined into one source with center near Megion when determining dis-
tances to nodes.fReprerients the combined production of the Uzbek, Kirghiz, and TadzhikSSRs.
g ot used because coitribution to any node's energy potential was soslight.

38
Table 3. 3--Continued
h Negligible or no production.
Sources: Campbell (1968); Dienes and Shabad (1979); Ebel (1961);Ebel (1970); Elliot (1974); Lydoiph (1977); Lydoiph (1979); Lydoiphand Shabad (1960); Shabad (1969).

39
Table 3.4
Regional Distribution of Soviet Natural Gas Production(in Million Metric Tons of Standard Fuel)
Region 1960 a 1970a 1975a Centerb
Komi 1 .2e 8.1 22.0 VuktylKrasnodar 6.1 29.1 9.4 TikhoretskStavropol 9.8 19.4 13.6 StavropolChechen-ingush 0.4 5.0 4.2 GroznyyDagestan 0.1 1.9 1.2 MakhachkalaTatar 1.7 4.6 5.2 AlmetyevskBashkir 1.6 2.2 1.7 BelebeyKuybyshev 1 .2d 2.7 2.5 KuybyshevSaratov 3.0 4.0 1.2 SaratovVolgograd 3.1 4.7 3.6 KotovoAstrakhand f 0.9 0.6 AstrakhanPerm f 1.1 1.3 PermOrenburg 0 .6d 1 .5d 23.9 OrenburgAzerbaijan 7 .0d 6.5 11.8 BakuWest Ukraine 6.2 14.4 8.2 BorislavEast Ukraine 11.0 57.4 73.6 ShebelinkaBelorussiae f 0.2 0.7 RechitsaTyumen
Punga-Igrim f 10.9 4.3 Punga-IgrimMedvezhye f f 35.1 NE of NadymOb oil gas f 0 .1c 2.6 Samotlor
Norilskd f 0.5 3.1 MessoyakhaYakutd f 0.2 0.6 Tas-TumusSakhalinc 0.4 0.9 1.2 OkhaKazakhstanBazay f 1.8c 1.8 BazazUzen f 0.7 4.4 Uzen
Uzbekistan 0.5c 37.8 44.3 GazliTurkmeniaWest Turkmen 0.3 1.6 3.6 Kum-DagNorth Turkmen f 11.6 36.7 AchakSouth Turkmen f 2.4d 21.4 Mary
Kirghiziac f 0.4 0.3Tadzhikistan f 0 .5d 0 .5e Dushanbe
Total 54.2 233.1 344.6
aFactors to convert raw regional production data into standard fuel unitswere 1.20 for 1960, 1.18 for 1970, and 1.19 for 1975.
Distances were measured from these energy source centers to the nodesunder study.
cNot used because of lack of transportation link to any node in this
41 IIstudy.
II
40
Table 3.4--Continued
dApplied only to local nodes because of lack of access to nationwide
network.eNot used because contribution to any particular node's energy poten-
tial was negligible.fNegligible or no production.
Sources: Campbell (1968); Dienes and Shabad (1979); Ebel (1970);Elliot (1974); Lydolph (1977); Lydolph (1979); Lydolph and Shabad(1960); Shabad (1969).
t1
41
The quality and caloric value of Soviet coal varies tremendously
between regions. In 1975, a ton of hard coal (anthracite and bitumin-
ous) ranged from 0.57 to 0.93 ton of standard fuel and lignite or brown
coal from 0.29 to 0.57 ton of standard fuel. The average heat content
of a ton of Soviet coal has declined slightly over time from 0.73 ton of
standard fuel in 1960, 0.69 ton in 1970, to 0.67 ton in 1975 (Dienes and
Shabad 1979, pp. 32-33, 110-111). This decline meant that the factors
needed to convert raw coal production data into standard fuel units (Ta-
ble 3.2) varied not only by region but also through time. Regional con-
version factors-were first obtained for 1975 from several sources (Dienes
and Shabad 1979; Elliot 1974; Lydolph 1979; Shabad 1969). If a precise
conversion factor could not be found for a coal basin, an estimate was
made based on the description of the type and quality of the coal and
the range of values for hard and brown coal. Because the average heat
content of Soviet coal has declined through time, the regional conver-
sion fActors for 1975 were multiplied by 1.03 to obtain values for 1970
factors and 1.10 for 1960. These conversion factors, when applied to
the raw production data, gave totals (Table 3.2)'that were fairly close
-' to the actual aggregated production figures for coal in terms of stand-
ard fuel (Table 3.1).
Oil and natural gas also vary somewhat in quality (such as paraffin
content for oil and sulfur content for natural gas), but their heat con-
tent is sufficiently uniform among regions that one conversion factor
was used for all regions when transforming raw regional production data
into standard fuel units (Table 3.3 for oil; Table 3.4 for gas). The
conversion factors for oil and natural gas were calculated by dividing
total staadardized production (in standard fuel units) for each (Dienes
J ,
A
42
and Shabad 1979, p. 32) by total raw production for each (Dienes and
Shabad 1979, pp. 46 and 70). A ton of oil had a heat content equivalent
to 1.43 tons of standard fuel in 1975, and this value was also used for
1970 and 1960. The heat value of 1000 cubic meters of natural gas in
1975 was approximately 1.19 tons of standard fuel, and this value varied
only slightly over time with values of 1.18 for 1970 and 1.20 for 1960.
The eastward shift in Soviet energy production is evident in all
three major fuels. The Kuznetsk, Kansk-Achinsk, Karaganda, and Ekibas-
tuz basins have all greatly expanded their output since 1960 (Table 3.2).
The oil fields of the Volga-Urals area, including the Tatar and Bashkir
ASSRs, and Kuybyshev, Perm, and Orenburg oblasts, more than doubled
their combined production from 1960 to 1970, while the Baku oil fields'
production remained stagnant. Almost 800 kilometers east of the Urals,
the newly developed middle-Ob oil fields of Tyumen Oblast were the larg-
est single source of energy in the Soviet Union in 1975 (Table 3.3). The
shifts in gas production were rather erratic (Table 3.4). The North
Caucasus gas fields of Krasnodar and Stavropol krays were up sharply in
production in 1970 from 1960 and down in 1975, while the eastern Ukraine
gas fields experienced dramatic increases in production from 1960 to
1970 and 1975. Similar increases occurred in Orenburg and Tyumen ob-
lasts, Uzbekistan, and Turkmenia. The Komi ASSR in the northeastern
part of the Northwest economic region achieved substantial increases in
oil and gas production and a modest increase in production at its Pe-
chora coal basin from 1960 to 1975. These production trends suggest
that the patterns of energy potential will be somewhat different from
those of population or market potential and will shift eastward through
time.
A
43
Distance Measurement
After the regional energy production data had been converted into
standard fuel units and assigned to a specific point within each region,
it was necessary to measure the distances from each of the coal, oil,
and gas source points to each of the 128 cities (Norilsk was treated as
a closed system. Itn energy "ccessibility was determined by the coal
and natural gas which were available to it in its immediate area.). The
basic unit of distince measurement was 100 kilometers because of the
great distances involved in working with the Soviet Union and also be-
cause of the degree of generalization already effected by assignment of
regional data to points. For those nodes located at or within 150 kilo-
meters of an energy source point, the distance was recorded as one unit.
The shortest distances along rail and rail-ferry routes were deter-
mined between the 128 cities and 29 coal sources. Houston greatly faci-
litated what still proved to be a laborious and time-consuming task by
graciously supplying the railroad distance matrix he used in his study
of market potential surface patterns in the Soviet Union (Houston 1969).
Marine and river transport routes were not considered except for Yuzhno-
Sakhalinsk, Magadan, Yakutsk, and Petrc.psvlovsk-Kamchatskiy. This was
not a serious omission because almost ali'. coal in the Soviet Union is
transported by rail with marine and river shipments never accounting
for more than 4% of total coal loadings (.uring the period of this study
(Elliot 1974, p. 173; Lydolph 1979, p. 421). The basic pattern of the
Soviet rail network remained virtually unchanged from 1960 to 1975, and
the distance matrix tabulated for 1060 required only slight modifica-
tions for use in 1970 and 1975 (Appendix A). The Soviets completed rail

k
44
links between Astrakhan and Guryev on the north shore of the Caspian
Sea in 1967, Makat and Beyneu along the northeast edge of the Caspian
Depression in 1965, and Beyneu and Kungrad across the Ust-Urt Plateau in
1970 (Lydolph 1977, p. 330; Yonge 1975). These added rail links had an
appreciable effect on the distances for only four cities--Astrakhan,
Volgograd, Guryev, and Aktyubinsk.
Distances between the oil sources and 128 cities were measured
along the shortest pipeline, rail, and rail-ferry routes. River and mar-
ine tankers engaged in domestic trade carried only 6% of crude oil ship-
ments in 1960, while pipelines and railroad tanker cars handled 72% and
22% respectively. The share carried by pipelines has increased since
1960, and that of rail and tankers has decreased (Dienes and Shabad
1979, pp. 62-63). It was possible to obtain actual lengths, general lo-
cations, and dates of completion of major pipelines from a number of
sources (Campbell 1968; Dienes and Shabad 1979; Ebel 1961; Ebel 1970;
Elliot 1974; Fullard 1965; Fullard 1972; Hassmann 1953; Hodgkins 1961;
Kish 1960; Kish 1970; Lydolph 1977; Lydolph 1979; Lydolph and Shabad
1960; National Geographic Society 1976; Shabad 1961b; Shabad 1969;
Taaffe and Kingsbury 1965). Pipelines were generally built parallel to
rail lines, and their distances were often similar (Table 3.5). This
similacity meant that if actual oil pipeline lengths were unknown ad-
justed rail distances could be used. If no rail link existed between
two points connected by a pipeline, the pipeline distance was estimated.
The similarity between pipeline and rail distances also meant that only
relatively minor changes had to be made in the distance matrices (Ap-
pendix B) to ref!fct the expansion of the oil pipeline network from 1960
77;

45
Table 3.5
Comparison of Selected Oil PipeTine and Rail Distances
Origin Terminus Length (km) Rail Distance (kn)
Omnsk Irkutsk 2470 2475
Omsk Chita 3500 3488
Tuymazy Leningrad 1500 1800
Kuybyshev Mozyr 1350 1700
Unecha Polotsk 375 445
Polotsk Klaipeda 475 550
Polotsk Ventspils 475 551
Kuybyshev Bryansk 1185 1318
Omsk Pavlodar 420 664
Gorkiy Ryazan 415 634
Michurinsk Kremenchug 700 869
Ryazan Moscow 250 197
Sources: Ebel (1961, p. 149); Houston (1969); USSR Geological Ministry(1966); Yonge (1975).
77
!I
2I'iI

46
to 1975. The major c'anges in the distance matrices consisted of bring-
ing new oil sources into the tranaportation network.
Natural gas travels only by pipeline in the Soviet Union, and all
cities did not have access to the natural gas pipeline network. Forty-
two of the cities in this study had access to natural gas in 1960, 90 in
1970, and 94 in 1975. The distance matrices for natural gas (Appendix
C) were derived in the same manner as for oil with respect to pipeline
locations, construction dates, and lengths (Sources the same as for oil
plus Shabad 1961a). The distance matrices for natural gas changed sig-
nificantly from 1960 to 1975 as new gas fields were brought into produc-
tion, the natural gas pipeline network expanded, and additional cities
gained access to the network.
Energy Potential: Indices and Maps
Coal, oil, and natural gas potential indices for 1960, 1970, and
1975 were calculateid for each city (Appendix D) by an SAS matrix alge-
bra problem (Helwig and Council 1979) using the previously determined
energy production and distance data. These indites were added together
to give total energy potential indices for 1960, 1970 and 1975 (Table
3.6), and the highest energy potential index for each year was diviota
into the others for that year to give relative measures of energy acces-
sibility (Table 3.6). The same procedure was followed to arrive at to-
tal energy potential indices based on transport costs (Table 3.7). A
generalized transport cost ratio of 5:1:4 was used to represent esti-
mated transport costs for coal, oil, and natural gas (Campbell 1968, p.
21]; Dienes and Shabad 1979, p. 43 note 45 and p. 236 note 41; Elliot
• p1975, p. 271). I

.7
Table 3.6
Energy Accessibility Based on Distance
MODE TEp6la TFP7Oa TFP?5 a RFp 0 b o n7-b RE ,5b
LENINGO ) 31 54 65 16 21 24IUM ANSK L9 ?q 35 to 11 13PETR07AV09SK 25 39 46 1 5 1740VGCR3) 32 5S 50 17 23 74VOLOGODA 34 A( A( L8 6 inARKHANGELSK 2! 39 46 13 15 7SYKTYVKWR 25 52 68 14 20 2540SCOW 51 86 99 26 33 37YAROSLAVL 39 73 Q 21 29 i3VLAOImtR 43 84 97 23 33 -%I VANOVO 39 78 91 21 30 34KALININ '1 72 Be 22 2 32KALJGA 57 89 I 31 35 39KOSTROA4 37 -2 S7 20 28 32RYAZAN 50 95 C) 27 33 37TULA 61 96 107 33 37 40KAZAN 76 148 156 41 58 62GORKIY 48 89 105 26 35
KIROV 36 62 75 20 24 25YOSHKAROLA 52 104 123 28 40 46SARANSK 52 91 lOq 28 35 41CHESOKSARY 58 10 126 32 42 47)LYANnVSK 68 119 133 37 46 495ELGORID 6? 121 144 36 49 54VOR0IF.ZH 58 104 11S 32 41) 44KURSK 56 lot 114 30 3Q 42OREL 52 92 104 28 36 39BRYANSK 49 86 100 27 33 27LIPETSK 52 96 108 28 37 40TAMBOV 51 01 103 Z 35 -PFNZA 57 99 116 31 39 43ASTQAKHaN 41 69 76 22 27 28VOLGnGlAl 62 98 114 34 3q 42KUYBYSHEV 95 177 206 52 69 77SARATOV 69 114 133 38 44 49ROSTOV 126 195 187 6P 76 71)KRASNOOAR 66 121 113 36 47 47STAVRODOL 62 110 Ill 34 43 414AKH4C%'KALA 49 75 73 22 20 27NALCHIK 42 92 93 23 36 35ODZHON[KIOZF 49 108 102 27 42 39GROZNYY 49 Ill 104 27 43 39KIEV 44 92 105 24 36 3q
ZAPCROZHvE 67 119 132 36 46 4qKIARKOV 84 169 193 46 66 72LVOV 41 79 P3 22 31 31KISHINEV 30 59 (,8 16 23 25TALLIN 26 48 C)8 14 19 22RIGA 26 40 60 14 19 22VILNIUS 28 54 '- 65 15 21 24KALININGRAI 24 37 44 13 14 16SMOLENSK 37 73 86 20 2P 32PSKOV 28 44 52 15 17 194 INe 34 61 76 18 24 23TBIL.,I 32 62 70 1? 2 I6BAKU 59 92 101 32 .6 38
i!77-,

48
Table 3.6--Continued
'JOOE rFP60 TF070 TEP75 P rP6Q p o3 0 7;YEREVAN 26 50 5g 14 IQ 22L'JTSK 31 65 77 17 25 27qcVNO 32 67 7S 17 26 70IZHGORI'0 28 58 73 15 26 25[V A 0FQ A4KVSK 30 73 79 16 22 3rERNOPOL 36 70 77 20 27 20Z1I1TOMIR 39 75 P5 21 ?9 32VINNITSA 36 70 81 20 27 30KHMELNITSIY 3P 69 7c L7 27 29CHEPNOVSTY 2q S 67 16 23 25CHERNIGOV 40 87 1(3 22 34 .SlimY 47 111 124 26 43 46POLTAVA 59 162 I8t 32 63 69CHERKASSY 51 qq 111 28 30 41KIROVOGR40 43 63 73 23 25 25ODESSA 3'4 6q 79 1q 27 20NIKOLAYEV 41 83 94 73 32 35KHEPSON 43 .93 q4 23 32 35S14FEROPr)L 42 60 65 23 23 Z40IEPROPFTROVSK 76 133 14A 41 52 55004FTSK 164 241 254 09 94 94VOROSHILQVRAo 144 257 76o tOn 1oo 10GRO )NO 26 52 6) 14 20 23VITEBSK 34 53 79 tS 21 29'1OGILEV 36 S7 As 2 22 32GOMEL 38 78 01 21 33 35qPEST 32 60 6q 17 23 26UFA 73 135 162 40 53 60IZHEVSK 52 105 131 29 41 49ORENIBURG 48 84 136 26" 33 51PFR. 59 12f 154 32 48 57SVEROLOVSK 41 78 106 22 30 39CHELYABI NSK 50 qR 114 27 34 4?TYUMEN 33 5q S2 18 23 30KURGAN 3q 65 86 21 25 3?OMSK 33 53 73 18 2L 27NrVOSIBIRSK 42 S3 91 . 23 25 34TC4SK 40 60 6 22 23 36BARNAUL 33 49 7n 18 19 26KRASNOYARSK 30 47 71 16 14 26IRKUTSK 29 37 46 15 14 17CHITA 16 23 32 9 9 12Afl'KAN 2q 43 5 15 17 22KEIEROVO 86 It 156 47 46 58_ULANUDE 16 24 33 9 9 12VLAOIVnSTr)K I 19 23 7 7 9KHABAROVSK 10 15 19 5 6 7B 8LAGOVESHrHENSK 11 16 21 6 6 8YUZHNOSAKHAL1NSK 9 t4 17 5 5 6MASADAN 8 12 16 4 5 6YAKUTSK 10 15 19 5 6 7PETROPAVLOVSKKAM 7 12 14 4 5 5GURYEV 29 72 91 is 28 34AKTYUSINSK 37 73 o9 20 28 35URALSK 42 68 79 23 26 29KUSTANAY 40 72 95 22 28 35
i7

49
Table 3.6--Continued
NODE TFP6O TFP71 TEP75 RFPO REP7O zE27s
PETROPdVLOVS< 3 55 76 In 73KOKCHFTAV 32 54 71 17 21TSELINOGRAD 35 57 75 19 22 28KARAGA'9t 47 72 00 26 2 q 1KZYLORnA 24 3q 4P 13 15 IPCH1MKENT 23 45 6n 13 19 ?2OZHAMBUL 21 43 57 it 17 21SEMIPALAT1SK 24 37 50 13 14 19PAVLCDAR 32 58 86 17 23 32USTKAMENOGRSK 24 37 49 13 14 11ALIAATA 20 39 52 11 15 19AS11KHAfW. 23 33 63 13 15 23OUSHANRE 16 27 49 9 11 isTASHKENT 23 47 61 13 19 23FRUNZE 20 40 54 11 16 20MORILSK ? 2 3 1 1 1ELISTA 37 54 59 2() 21 22
aTotal energy potentials for 1960, 1970, and 1975 based on distance.
bRelative energy potentials for 1960, 1970, and 1975 as percentages of Voroshilov-
grad.
i

50
Table 3.7
Energy Accessibility Based on Transport Costs
NODE TEP60 a TEP70a TEP75 a REP6Ob REPTOb REP75b
LENINGRAD 15 31 39 19 21 24MURMANSK 9 19 25 12 13 15PETROZAVOOSK 13 26 32 17 18 20NOVGOROD L5 34 41 20 23 25VOLOGDA I8 40 50 23 27 30ARKHANGELSK 13 26 32 17 is 20SYKTYVKAR 13 32 42 t7 22 26MOSCOw 24 48 58 31 33 35YAROSLAVL 20 45 55 26 31 33VLAI41R 25 53 62 32 36 37IVANOVO 22 49 58 29 33 35KALININ 20 42 51 26 29 31KALUGA 24 47 56 31 32 34KOSTRO4A 20 45 55 26 30 33RYAZAN 25 50 59 32 34 36TULA 25 50 58 33 34 35KAZAN 58 121 135 75 .2 82GORKIY 29 61 72 38 41 44KIROV 21 45 57 27 31 35YOSHKAROLA 37 78 92 48 53 55SARANSK 31 62 74 41 42 45CHEBOKSARY 39 80 93 5L 54 56ULYANOVSK 51 101 113 66 68 68BELGOROO 24 57 66 31 39 40VORONEZH 25 53 61 32 36 3TKURSK 23 50 59 29 34 35OREL 22 47 56 28 32 34BRYANSK 21 45 55 28 31 33LIPETSK 24 51 60 31 35 36TANBOV 26 54 63 34 37 38PENZA 34 67 78 44 46 47ASTRAKHAN 23 48 54 30 33 33VOLGOGRAD 30 57 66 39 39 40KUYBYSHEV 77 147 166 100 100 10SARATOV 44 79 91 57 54 55ROSTOV 39 71 72 50 48 43KRASNODAR 32 58 59 42 39 36STAVROOOL 26 51 54 34 35 33MAKHACHKALA 24 56 54 31 38 32NALCHIK 23, 55 55 30 38 33ORDZHCNIKIDZE 26 71 62 34 48 38GROZNYY 28 75 67 36 51 40KIEV 18 47 55 23 32 33ZAPOROZHYE 23 49 56 30 34 34KHARKOV 29 67 78 37 46 47LVOV 18 37 41 24 25 25KISHINEV 13 30 35 17 20 21TALLIN i5 28 35 16 19 21RIGA 13 29 36 17 19 22VILNIUS 14 31 38 18 21 23KALININGRAD L2 23 30 16 16 18S14OLENSK 18 40 49 23 27 30PSKOV 14 29 36 19 20 22MINSK 16 35 44 20 24 27TBILISI L8 35 40 23 24 24
BAKU 41 66 68 53 45 41
V,ydl"IT

51
Table 3.7--Continued
NODE TEP60 TEPTO TEP75 REP60 REP70 REP75
YEREVAN 14 29 34 18 20 20LUTSK 14 33 38 le 22 23ROVNO 14 34 41 1- 23 24UZHGOROD 14 32 36 18 22 22IVANOFRANKOVSK 15 36 39 JQ 24 23TERNOPOL 15 34 40 20 23 24ZHITOMIR 17 38 45 22 26 27VINNITSA 15 36 43 20 24 26KHMEI.NITSKIY 14 35 41 19 24 24CHERNOVSTY 14 30 36 1q 21 22CHERNIGOV L8 49 61 23 33 37SUMY 20 59 67 26 40 40POLTAVA 22 TO 81 29 48 49CHERKASSY 19 47 54 25 32 33KIROVOGRAO 17 36 42 23 24 25ODESSA 15 34 40 19 23 24NIKOLAYEV 17 40 46 23 27 28KHERSON 17 40 46 23 27 28SIMFEROPOL 17 33 37 22 22 22DNEPROPETROVSK 25 54 62 33 37 37DONETSK 44 77 85 57 52 51VOROSHILOVGRAD 48 80 88 63 55 53GROONO 12 29 36 16 20 21VITEBSK 16 34 46 21 23 28MOGILEV 17 36 50 22 25 30GOMEL 17 44 56 22 30 33BREST 15 32 39 19 22 23UFA 56 109 126 72 74 76IZHEVSK 36 79 98 47 54 59
4 ORENBURG 33 66 88 43 45 53PERM 40 97 121 52 66 73SVERDLOVSK 23 52 73 29 35 44fCHELYABINSK 27 57 75 35 39 45TYUMEN i8 41 63 23 28 38KURGAN 21 45 64 28 31 39
OMSK 16 33 50 21 22 30NOVOSIBIRSK 15 29 50 19 19 30TOMSK 14 26 57 18 18 34BARNAUL 13 24 40 17 16 24KRASNOYARSK 11 21 39 14 15 23IRKUTSK 10 16 25 12 11 15CHITA 6 12 18 8 8 11ABAKAN 10 21 33 14 14 20KEMEROVO 23 38 62 30 26 37ULANUDE 6 13 20 8 9 12VLADIVOSTOK 5 9 12 6 6 7KHABAROVSK 4 9 12 6 6 7BLAGOVESHCHENSK 5 9 13 6 6 8YUZHNO-SAKHALIhSK 3 8 11 4 5 6MAGADAN 4 7 10 5 5 6YAKUTSK 4 9 12 6 6 TPETROPAVLOVSK-KAM 3 7 9 4 5 6GURYEV 17 46 58 22 31 35AKTYUBINSK 23 50 64 29 34 38
URALSK 26 50 61 34 34 37KUSTANAY 22 45 61 28 31 37
SOF
_F__,__ _ V.

52
Table 3.7-Continued
NODE TEP6O TEP7O TEP75 REP60 REP70 REP75
PETROPAVLOVSK 18 38 53 24 26 32KOKCHETAV 16 34 48 21 23 29TSELINOGRAD 16 31 44 21 21 26KARAGANDA 17 33 44 23 22 26KZYLOROA L4 27 34 18 18 21CHIMKENT 12 25 34 15 17 21OZHAMBUL it 24 32 14 16 IQSEMIPALATINSK t0 20 30 14 14 18PAVLOOAR 13 28 43 17 19 26USTKAMENOGORSK to 20 29 14 14 17ALMAATA 10 21 29 12 14 17ASHKHAEAO 13 27 37 17 18 22DUSHANBE 9 17 26 11 12 16TASHKENT L2 26 34 15 18 20FRUNZE 10 22 31 14 15 18NORILSK 0 0 1 1 0 0ELISTA 18 33 37 23 23 23
aTotal energy potentials for 1960, 1970, and 1975 based on distance.bRelative energy potentials for 1960, 1970, and 1975 as percentages of Voroshilov-
grad.
i
4?i
53
A Dell Foster digitizer was employed to determine the co-ordinates
(X, Y) of the 129 nodes under study and the boundary of the Soviet Union
using a base map with a scale of 1:10,140,000 (National Geographic So-
ciety 1976). Z-values for each node were the relative energy potential
indices as calculated for distance and transport costs for 1960, 1970,
and 1975. A general purpose contouring program, GPCP-TI (CALCOW 1972),
and a CALCOMP drum plotter created six isarithmic energy potential maps.
I
I,
'.

54
References
CALCOMP 1972. GPCP-II User's Manual. Anaheim, Ca: California Comput-er Products, Inc.
Campbell, R.W. 1968. The Economics of Soviet Oil and Gas. Baltimore,Md.: The Johns Hopkins Press.
Dienes, L. and Shabad, T. 1979. The Soviet Energy System: ResourceUse and Policies. Washington, D.C.: V.H. Winston and Sons.
Ebel, R.E. 1961. The Petroleum Industry of the Soviet Union. Arling-ton, Va.: Royer and Royer, Inc.
Ebel, R.E. 1970. Communist Trade in Oil and Gas. New York: PraegerPublishers.
Elliot, I.F. 1974. The Soviet Energy Balance. New York, N.Y.: Prae-ger Publishers, Inc.
Fullard, H., ed. 1965. Soviet Union in Maps. London: George Philip& Son, Ltd.
Fullard, H., ed. 1.972. Soviet Union in Maps. London: George Philip& Son Ltd.
Hassmann, H. 1953. Oil in the Soviet Union. Princeton, N.J.: Prince-ton University Press.
Helwig, J.T. and Council, K.A., eds. 1979. SAS User's Guide, 1979Edition. Raleigh, N.C.: SAS Institute, Inc.
Hodgkins, J.A. 1961. Soviet Power: Energy Resources, Production andPotentials. Englewood Cliffs, N.J.: Prentice-Hall, Inc.
Hooson, D.J.M. 1966. The Soviet Union. London: University of LondonPress.
Houston, C. 1969. Market Potential and Potential Transportation Costs:An Evaluation of the Concepts and Their Surface Patterns in theUSSR. The Canadian Geographer 13, 3:216-236.
Kish, G. 1960. Economic Atlas of the Soviet Union. Ann Arbor: TheUniversity of Michigan Press.
Kish, G. 1970. Economic Atlas of the Soviet Union. Ann Arbor: TheUniversity of Michigan Press.
t Lydolph, P.E. 1977. Geography of the U.S.S.R. New York: John Wiley
& Sons.
V

55
Lydolph, P.E. 1979. Geography of the U.S.S.R., Topical Analysis. Elk-hart, Wisconsin: Misty Valley Publishing.
Lydolph, P.E. and Shabad, T. 1960. The oil and Gas Industries in theU.S.S.R. Annals of the Association of American Geographers 50, 4:461-486.
National Geographic Society. 1976. Soviet Union. Washington, D.C.:
National Geographic Society.
Shabad, T. 1961a. News Notes. Soviet Geography: Review and Transla-tion 2, 1:76.
Shabad, T. 1961b. News Notes. Soviet Geography: Review and Transla-tion 2, 3:80-81.
Shabad, T. 1969. Basic Industrial Resources of the U.S.S.R. New York:Columbia University Press.
Shabad, T. 1978. News Notes. Soviet Geography: Review and Transla-tion 19, 4:273-285.
Shabad, T. 1979. News Notes. Soviet Geography: Review and Transla-tion 20, 4:255-265.
Taaffe, R.N., and Kingsbury, R.C. 1965. An Atlas of Soviet Affairs.New York: Frederick A. Praeger.
USSR Geological Ministry. 1966. USSR Railroads: Directions and Sta-tions. Moscow: Central Board in Geology and Cartography.
Yonge, J.R. 1975. U.S.S.R. Railways. Exeter, England: The Quail MapCompany.
IL

CHAPTER IV
ANALYSIS OF ENERGY ACCESSIBILITY
Introduction
This chapter analyzes the spatial patterns of energy accessibility
in the Soviet Union and its effect on Soviet urban population growth.
Three sections follow. The first discusses the rank ordering of the 129
nodes based on their energy potentials and describes the six energy po-
tential maps for 1960, 1970, and 1975 based on relative energy potential
values determined by distance and distance modified by transport costs.
The second section presents the results of correlation analyses between
energy accessibility and urban growth. The last section is a summary.
Nodal Rank Ordering and Energy Potential Maps
Three regions dominate the top positions when the 129 nodes are
rank ordered by their relative energy potentials based on distance for
1960, 1970, and 1975 (Table 4.1). These regions are the eastern Ukraine
(Voroshilovgrad, Donetsk, Poltava, Dnepropetrovsk, Kharkov, Zaporozhye,
Sumy), the western North Caucasus region (Rostov, Krasnodar, Stavropol),
and the area of the Volga-Urals oil fields (Kuybyshev, Kazan, Ufa, Sara-
toy, Perm, Ulyanovsk). Voroshilovgrad and Donetsk occupy the top two
positions throughout primarily because of their favorable positions with
respect to the Donets Basin. Rostov and Kharkov are near the Donets
Basin and are also close to the gas fields of the North Caucasus and
56

57
Table 4.1g~an1kings by Rlelative Energy Potent jol Based on Diatance
IB, kJP EPS') b OB.i 40: P7 b i' knE oc7 b
I V3RCSH (L0vCQ'i A0 )0 1 Votk S141 L 0G'? A I f - 1 '/03S.I II AO~ I')A2 0:'4Fr4 89 1 OONETS(< Q4 2 .1)0 4E TS X Q4? QOSTO3V '.R 3 QOStn3V 76 3 -(JYIYSHEV 774 KJYYSH4V 52 4 K'JYrYSHEV 6n 4 KH4AQ'2V 75 F5 047 S K4ARKOV 66 5 ROSTOV 706 KHARKO0V 46 6 POLTAVA 63 6 DOLTAVi So7 KAZAN* 41 7 KA ZAN 1 7 K AZ A.1 623 OV0 PQ (PFT R2V SK~ 41 8 UFA 53 8 'J%:A 1(9 UFA 40 9 ONEPRDPITROVSK 52 9 K S R:)V'l 5R10 SAAATOV 3P 10 BELGOROD 4q 10 PFRM S711 ULYA.40VSK 37 It PERM 4A [t n4EPRODF.TR VSK 55;12 flEL',OP'lf3 36 12 (Q A S N0. Or AQ#7 12 9EL G3O0 5413 KR A S~40AR 36 13 KE4ER~v0 46f 13 ORE48UPS 5114 74POROZHYrE 36 14 ULYANOVSK 46 14 ULYA40VSK 4915 VC1L/j'GA() 34 15 ZAPDROZHYE 46 15 ZAPORgZHYS 4916 STAV,?fW0L 34 16 SARATOV 44 16 SARArOV 4917 tUL A 33 IT STAVROPOL. 43 17 Il$EVSK 4c)18 CItE 8r'KSIR Y 2 18 GRO1'4YY 43 18 CHEBI3KSARY 4719 V0R01JF ZH 32 19 S'J'Y 43 19 SU'IY 4620) AiU 37 20 CHFBO,(SAQY 42 20 YOSHiKAR-L.. 4621 POLTAVA 32 21 R 090 U (3I K I D 42 2t VO3'J1F ZH 4422 PER9M 32 22 tZHEVSK 41 22 PFkIZA '. 323 9AL ')G 31 23 VORnNEZH 40 23 K IAS5N!30Ab 4224 PENIA 31 24 YIHKAR-016 40 24 K.Jm SK 4225 KJR SK 30 25 PENZA 39 25 VOL1GQSftAF1 4226 MOSCOW 28 26 KURSK 39 26 r4E LY A clI NSK 4?27 YOSHK~AR-OLA 29 27 CHERKASSY 39 27 STAVRC~fL 4128 S4AANSK 17 28 VflLGOGRAO 38 28 C'W9'(ASSv 4129 OREL 28 29 TULA 37 21) SAPANS( 4130 LIPETr5K 28 30 LIDFTSK 37 30 T*LlA 40l31 T44.ROV ?q 31 RAKII 36 31 LIDETSK 4032 C'fERKASSY 28 32 08.51 36 32 GPOZ'4Yv 3933 I2HEVSK ?q 33 KIEV 36 33 OIREL 3c34 PYAZ4'q 27 34 N4ALCIIIK 36 34 KIEV 3
35 K~Ai ~ 2 ALUGA 35 35 GORKIY 30)36 flRO7HDqNIKflE 27 36 SARANSK is 36 SVER'113VS< 3937 (Zzjyy 27 37 TAMBO0V 35 37 OROZHCNIKIOZE 38338 CHIELYA01'15K 27 38 GORKIY 35 38 BiKU 3p39 r3ORKIY 26 39 CHELYABINSK 34 39 ICALIJ'3A 38*40 SJ4Y 26 40 CHERNIG07 34 40 TA'4A0V 3n41OFJ*R 6 41 40SCOW 33 41 CHEqN[GOV 3p42 KARAGANDA ?6 42 DYAZAN 33 42 MOSCOW 37*43 K IEV 24 43 P8.YA*4SK 33 43 RYAZANI 37
44 IILCHt'IK 23 44 0RFEN5j~j 33 44 BRYA11SA 314545CI 2 VLAD1IR 33 45 VL A f)141R 3646 9 IQ 0 V-PAO 23 46 M IKOLAYEV 32 46 tOMSK 3647 NIKOLAYEV 73 47 KHFqSON 12 47 4JALCMef' 35r48 KHERS04J 23 48 LVOV 31 48 NI1KOLAYEV 35)49 5SIMFEROPOt. 23 49 SVEADLOVS( 30 49 KEQS01 355 v011S 23 50 yVANOVO 30 50 ,04EL 3-'51 UqALSK 23 51 GOM~EL 30 51 KUSTA44Y 35Z KCALtiPV 22 52 4~AK4AC4KALA 29 52 A< TYJB I SK 3553 AS1'RAKC'..4 22 53 Z.- IT04 I R 29. 53 1 VANO 3',54 -4AKHAC'iKALA 22 54 KAR AGAIJOA 28 54 GURYEv 4455 LVOV 22 55 KALININ 28 55 N1IVOSII1PSK 34*56 CHERN!GOV 22 56 KUSTANAY 28 56 KARAGAM406 33
1.r

58
Table 4.1--Continued
135S JODE RE-060 03S NOOE SEP70 ORS NiD0E Ar75
57 SVERDLOVSA 22 57 YAROSLAVL 21 57 Y-AROSLiVL 3158 TOMSK 22 58 KOSTqO04A 28 58 Z4 I T-4l I3 259 IUSTANAY 22 59 SMOLENS5K 281 59 ALI4IIH 3260 YAROSLAVL 21 60 AKTY.J8!NSK 2'c 60 KOSTRrAi 3761 1vAN40vn 21 61 IVANO..FRAtIXOVSK 28 61 S'401F.SK 3262 ZHITO&IIR 21 62 GURYEv 28 62 K J 0GA %, 3263 GCMEL 2: 63 ASTRAKH1AN 27 63 PAVIDDAR 3264 K'JRGAN 21 64 TERNOP31L 27 64 MO [LEV 3265 KnSTROM~A 20 65 VINNITSA 27 65 LVOV 3166 KIROV 20 66 ODESSA 27 66 V14JN!TSA 3067 S'40LFNSK 20 67 KHMELNITSKIY 21 67 VOLOGOA 3066 TERNOPOL 110 68 IJRALSK 26 68 TYU4EN 3069 VINNITSA 20 69 VOLOGOA 26 69 TERNOPOL '970 MO0GILEV 20 70 ROVNO 26 70 CD)ESSA 2971 Al(TYUBP4SK 20) 71 UZHGORO0 26 71 K9'4EL1TS1Y 2972 FLISTA 20 72 Ktq0V0GRAP) 25 72 URALS,' 2973 PETROPAVLOVSK 19 73 NOVOS1IqSK 25 VIFS74 TSFLI'4OGRkA 19 74 KURGAd 25 73 VIVATF< KS 2975 VOLOGOA 18 75 LUTSK 25 15 ASTRAKHAN 2876 LJ!NSK 18 76 KIROV 24 76 0 VNO 2977 'C0ESSA to 77 414SK 24 77 KIR.OV78 VITEBSK 18 78 TBILISI 24 7 IS79 TYUME~4 is 79 SIMFEROPOL 23 79 PF TRflPA.L)VK ?p80 0'4SK 18 RD T04SK 23 80 TSELPAD0 I141 BARNAUL 18 81 PETRO2PAVLOVSK 23 81 4AKHACHKAPLA ?82 *IIV';O~r,[ 17 82 TYJ4E41 23 82 LJT SK( ?783 T8iLISI 17 83 NOVGORIO 23 83 0'1SK 2784 LUTSK, 17 84 AREST 23 84 UZHGOPOD 2685 ROVNm 17 85 PAVIODAR 23 85 KI ROV91RAD 2486 KHMFLN!?TS<1v 17 86 KISHINFv 23 86 r311151 24,87 BqEST 17 87 CHEQkjO'STY 23 87 .40VGU1RDD18 KOKCI4ETAV 17 88 MOGILFV 22 9q8~ 8FS T89 PAVODAR 17 89 TSELI-40GPAO 2? 89 KOKC14FTAV 2690) LE'J1INGRAI' 16 90 ELIST6 21 90 BAR4JAULI 2691 KISH1NFV I f 91 VITEBSK 21 91 KRAS4YARSK 269? IVANOF'.ANK1VSK 16 92 C.MSK 21 92 KISHINEV 2593 CHEINOJVSTY 16 93 KnKCFIETAV 21 93 CHERNIJVSTY 2594 KRA SIFYA8 SK 16 94 LENINGRAO 71 44 SYKTYVKAR 25S95 VILNIUJS 15 95 VI LNIUS 21 95 S14FEROPOL. 2496 PSKOV 15 96 SYKTVVAR 20 96 LEN IfIGRAD ?497 UZHGORO0 15 97 GROONO 20 97 VILNIUS 249S IRKU'TSK( 15 98 5ARNAUL 19 98 GROONO 7399 AqAKAN 15 99 TALLIN 19 99 TASHKEN4t 23
100 GUR Y9V 15 100 RIGA 19 100 ASHI(IIARAO 23101 DFTROZAV00SK 14 101 YEREVAI 19 101 ELISTA 2210? SYKTYVKAR 14 102 KIASNOYARSK 18 102 TALLf4 72103 TiLL1'4 14 103 CHIN4KENr 18 103 RIGA 2210 IA1 04 TASH*KENT to L04 YEREVA4 2P35 YEREVAN 14 105 PSKOV 17 105 C414KENT 22106 GROfl4 14 106 ABAKAN 17 0 AAAN2107 ARICHANGELSX L3 107 CIZHAMBUL 17 107 OZHAMI8UL 21108 KALININGRAD 13 108 FRIJNZF 16 108 FRUNZF 20109 XZYL-O90A 13 109 PETROZAVOOSK 15 109 PSKOV 19110 CH1'4KE'IT 13 110 ARK'4A
44GELSK 15 110 AL'qA_.ATA 19
Ill SEm tPALATI NSK 13 111 KZYL-OROA 15 Il SEktIPAL4TPJ1Sf 1q
112 liST-KAM1EJDG0D.So 13 3.12 ASH'ABAO 15 112 KZYL-.0RDA 18
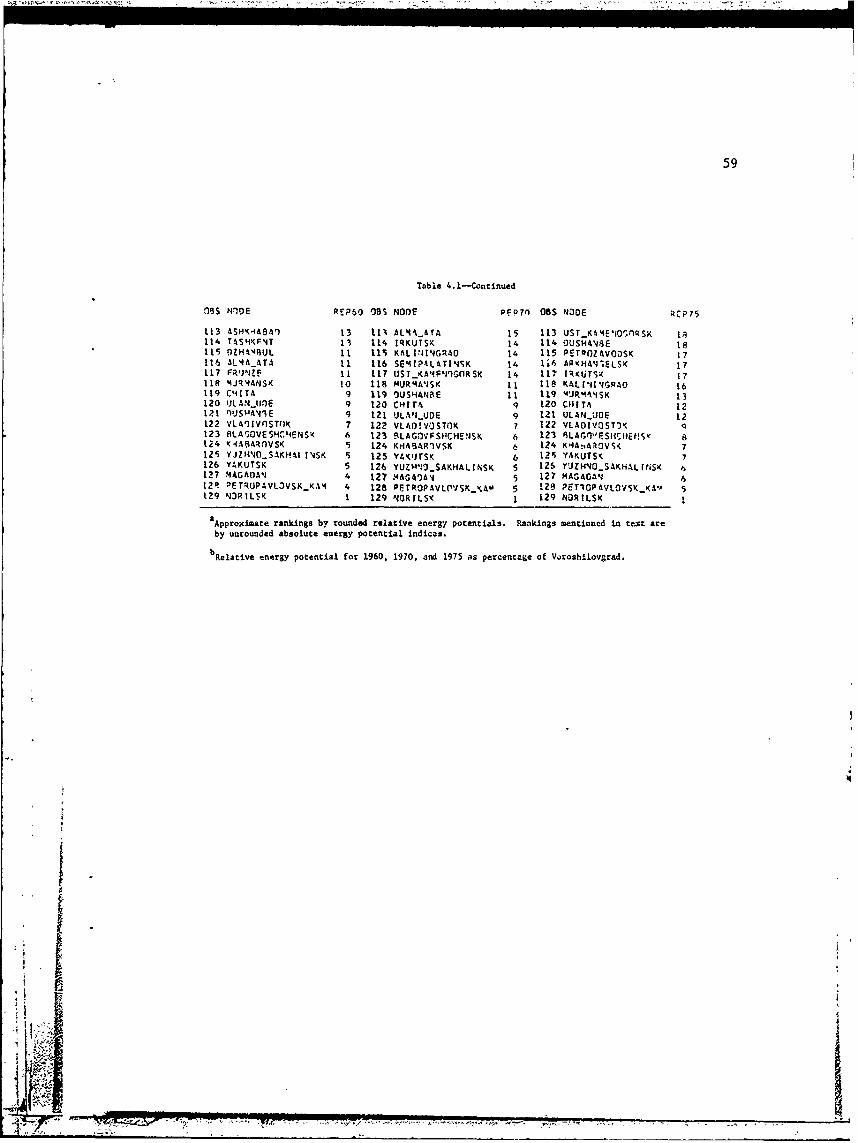
59
Table 4.1-Continued
O8S N"0E REP6O JBS NODE PE P7n OS NODE RP75
1.13 ASHK,4A9') 13 t.13 ALMAATA 15 113 USTKA4E'10flnRSK t,8114 TASH FNT 13 114 IRKUTSK 14 114 OUSH4N8E 18115 DZHA'4UL it 115 KAL1 IGRAO 14 115 PETOOZAVDSK 17116 AL4ATA 11 116 SEMIPALATINSK 14 1i6 ARKHA^;ELSK 17117 FR'JNjF 11 117 US T _K AM F 111GI1RSK 14 11"; IRKUTSK 17118 JR'4ANSK 1o 118 MURA'ISK 11 I18 KALI1I'GRAO 16
119 C41TA 9 119 9USHANSE 11 119 4JR A4SK 13
L20 ULANtIOE 9 120 CHITA 9 120 CIITA 121M1 nJS A1' E 9 121 ULA#._UDE 9 121 ULANUDE t2122 VL AnV'nST0K 7 122 VLAD!VOSTOX 7 122 VLAOIVST3123 ALAOVESH4ENS~ 6 123 RLAGOVrSHCHEVSK 6 123 ALAG("RFSH'I4iEt!Sw124 K 1A ARlVSK 5 124 KHABARIVSK 6 124 KHA.,AROVSK 7125 YJZH'40..SAKH6,I INSK 5 125 YAKrsK 6 12S YAKUTSK 7126 YAKUTSK 5 126 YUZHO_SAKHALINSK 5 126 YUZH4O_SAKHALFNSK 6127 MAGADAN 4 127 .1AGA044 5 127 MAGADAN 612. DETRUPAVL3VSKK.%4 4 128 PETROPAVLflVSK_(Am 5 128 PET IOPAVLO'ISK_K-'A 5129 N3RILSK 1 129 NORILS( 1 129 NORILSK I
aApproxlmate rankings by rounded relative energy potentials. Rankings mentioned in text areby unrounded absolute energy potential indices.
bRelative energy potential for 1960, 1970, and 1975 as percentzge of Viroshilovgrad.
;I
iw

60
eastern Ukraine respectively. Poltava's rise from 21st place in 1960 to
6th place in 1970 and 1975 was caused by the rapid increase in produc-
tion of the east Ukrainian gas fields. Kuybyshev and the other cities
in the Volga-Urals oil fields area owe their rankings to their proximity
to oil producing sources. Kemerovo is not near any of the three regions
mentioned but owes its high rankings to its location ini the middle of
the Kuznetsk Basin along with some contribution from the West Siberian
oil fields in 1975.
A number oZ nodes outside major production areas showed large
changes in rank from 1960 to 1975. The old oil producing center of Baku
experienced an increase in its energy accessibility from 1960 to 1975
but dropped in ranking from 19th place in 1960 to 40th place in 1975.
Largely because of its gas fields, Orenburg rose from 39th place in 1960
and 44th place in 1970 to 13th place in 1975. Simferopol, on the Cri-
mean Peninsula, experienced only a modest increase in its absolute en-
ergy accessibility from 1960 to 1975, and its relative accessibility re-
mained virtually the same, but most other nodes increaspd their relative
energy accessibility. Simferopol, consequently; steadily declined in
rank from 49th place in 1960, 80th place in 1970, to 96th place in 1975.
Guryev, on ithe other hand, underwent proportionally substantial absolute
and relative increases in energy accessibility from 1960 to 1975 and
rose from 97th place in 1960, 60th place in 1970, to 54th place in 1975.
The areas with the lowest energy potentials throughout the period 1960-
1975 were the Balti2, Central Asia, East Siberia, Far East, and North-
west regions.
The general patterns of energy accessibility do not appear to have
changed much from 1960 to 1975, and the correlations were quite high
A

61
between the halues for 1960 and 1970 (r = +0.96), 1970 and 1975 (r =
+0.98), and 1960 and 1975 (r = +0.94). Practically all nodes underwent
increases in energy accessibility relative to Voroshilovgrad which ex-
perienced some of the lowest percent increases in absolute energy poten-
tial during the period 1960-1975 because of the virtually stagnant, a!-
beit high, production of the Donets Basin.
A different pattern was evident when the rankings were by relative
energy accessibility based on distance modified by transport costs (Ta-
ble 4.2). The low cost of transporting oil compared to coal and gas re-
sulted in those nodes in or near oil producing areas dominating the top
positions. Additional cities (Cheboksary, Izhevsk, Penza, Saransk) in
or near the Volga-Urals oil fields join those nodes in that region which
were among the top when rankings were by energy acceisibility based on
distance. Nodes in the eastern Ukraine and others, such as Kemerovo,
which were dependent on coal for a large portion of their energy acces-
sibility dropped sharply from their earlier rankings by energy accessi-
bility based on distance. Rostov and other cities in the North Caucasus
region generally declined in rankings from 1960 to 1975. Baku, whose
oil production dipped slightly from 1960 to 1975, fell from 8th place
in 1960 to 21st place in 1975 as oil production greatly increased in
other areas of the Soviet Union. Orenburg remained in the top 20 posi-
tions during 1960-1975 because of its location near the Volga-Urals oil
fields and its own gas fields. Cities in the eastern Urals region
(Chelyabinsk, Sverdlovsk, Kurgan) rose in rankings from 1960 to 1975 as
a result of the influence of the Volga-Urals oil fields and the newly
discovered oil fields of West Siberia. Simferopol and Guryev moved
through positions as before whei the rankings were base .i distance
Ir T-

62
Table 4.2
Rankings by Relative Energy Potential Based on Distance odified by Transport Costs
08?NOOF RCP4Ob OS aN30 REPT0 0D NObE EOTqb
I KJY'YSHEV ti0 I KJYBYSHEV too I KUYBYSHEV 1n02 KAZAN '5 2 KAZAN 32 2 KA1I 23 UFA 72 3 UFA 74 3 UFA '64 ULYANOVSK 66 4 ULYANOVSK 68 4 PERM 735 VOROS41LOVr.RAD 63 5 PER4 66 5 ULYANOVSK 66 SARATCV 57 6 VOQnS4tLOVG01f 55 6 IZHEVSK 57 DONETSK 57 7 SARATCV 54 ? CHEPnKSAPV 569 BAKU 53 8 C.1E) K SARf 54 8 SARAT3V ;5q PFR4 52 9 IZHEVSK 54 9 YOSHKAq-0LA 5S
10 CHEOKSARY 51 10 YOSHKAROLA 53 10 VOR1SHIL OVr A r, 53It POSTOV so 11 00ETSK 52 It ORENSUAG 512 YOSHKAR-OLA 44 12 GROZJIYY 51 12 rDNETSK 5113 IHFVSK 47 13 ROSTOV 48 13 POLTAVA 40
14 PENZ4 44 14 LRDZHNIKIDZE 48 14 PEN7A 4715 ORF'IBUQG 43 15 P3LTAVA 4a 15 KHARKOV 47t6 KRAS'40AP 47 16 PE41A 46 16 SAA4SK 4517 SARANS( 41 17 KHARKOV 46 17 C4ELY&BINSK 4513 VOLGOGRAS) 3n 18 PAKU 45 18 GORKIY 1.419 GORKIY 38 19 OREIJRG 45 19 SVER3LOVSK 4420 KIARKOV 37 20 SAR NSK 42 20 ROSTOV 4321 GROLNYY A6 21 GORKIY 41 21 PAKU 4122 CHELY ARI ISK 35 22 SJMY 40 22 GROZIIYv 4f.23 TAMRGV 34 23 KRASNODAR 39 23 SU'Y 4324 STAVROPOL 34 24 VOLGO.RA0 39 24 VOLGOGRAD 4025 nROZHIONIKI!ZF 34 25 CHFLYARINSK 3q 25 AELGOR3O 4026 URALSK 3'. 26 BELGOROD 39 26 KJR14N 3027 TJLA 33 27 4AKHACHKALA 38 27 OR DZ:I11IK107E 3828 3NEOROPETDOVSK 33 21 NALCHIK 38 28 TA490V 3829 VLAO!M8R 32 29 T9480V 37 29 AKTYUBINS. 3Q30 PYAZAN 32 30 DNEPROPETROVSK 37 30 TYUMEN 3931 V3PON Zf 32 31 VLAOIMIR 36 31 DNEPROPETROVSK 3732 MOSCOw 31 32 VOR0'IEZH 36 32 VLA914IR 3733 KALUGA 31 33 STAVROPOL 35 33 VOROEZH 3734 PELGOROD 31 34 LIPETSK 35 34 URALSK 3735 LIPETS< 31 35 SVERnLOVSK 35 35 CHE041GOV 3736 MAKHACIIKALA 31 36 URALSK 34 36 KUSTA4AY 3737 ASTRAKHAN 30 37 TULA 34 37 KEMEROVO 1738 NALC4IK 30 38 RYAZAN 34 38 KRASNODAR 3439 ZAPO010HYE , 30 39 ZAPOROZHYE 34 39 LIPETSK 3640 KFMFROVO 30 40 KURSK 34 40 RYAZA4 36
41 IVANOVII 7c 41 AKTYU6INSK 34 41 TULA 3542 KURSK 29 42 MOSCOW 3 42 KURSK 3543 PGLTAVA 29 43 ASTRAKHAN 33 43 MOSCOW 35
44 SVER3LOVSK 2q 44 IVANOVO 33 44 IVANOV. 3545 AKTYURI14SK 29 45 CHERNIMOV 33 45 KIROV 35
46 OREL 28 46 KALUGA 32 46 GURYEV 354, 7 8RYAN4SK 2P 47 ORFL 32 47 Z A P ROZ NYE 34
48 KJRGA4 ?q 46 CHERKASSY 32 48 KALUGA 344Q KUSTANAY 2R 49 KIEV 3? 49 OREL 34
50 KIROV 7 50 BRYANSK 31 50 TOMSK 34
51 YAROSLAVL 26 51 KJRGAN 3t 51 NALCHIK ?352 KALININ 26 52 KJSTANAY 31 52 STAVROPOL 3353 KOSTRO4A 26 53 KIROV 31 53 ASTRAKHAN 3354 SUMY 26 54 YAROSLAVL 31 54 CHERKASSY 3355 CHEqKASSY 25 55 GURYEV 31 55 KIEV 33
56 LVOV 24 56 KOSTRO'4A 30 56 SRYANSK 33
, , .6, WC',.l

63
Table 4.2--Continued
113S N30E RE060 OSS N3JE RFP71 OBS NODE QrP75
57 PETROPAVLOVSK Z4 57 GOMFL 30 57 YAR()SLVL 3358 VOLO30A 23 58 KALI 414 29 58 x0STQn4' il59 KIFV 23 59 TYU4EN ?;3 59 GO4FL 3360 S-13LE'ISK '3 60 VOL01) A 27 60 4AKHMV4K,, A 3261 TBILISI 23 61 SMOLENSK 27 61 ETRODAVLJVSK 3?62 CHEQP4IGOV ?3 62 NIKOLAYEV ?7 62 KALII4 3163 KIROVO,'PAi 3 63 KHERS04 27 63 VOLflGA 1064 NIKOL&YEV 23 64 KEA4ROWv 26 64 S40LENSK 3065 KHFQSO'4 23 65 PFTR')PAVLOVSK 26 65 40GILEV 3)66 TVUME4 i3 66 ZIrOmIP 26 66 OUSK 3067 KARAGA1OA 23 67 LVOV ?5 67 NOVOS 1810SK 3n68 FLISTA 23 68 MOGILEV ?s 64 KOKCL4ETAV 2969 Z4ITCOIR 22 69 TILISI 24 69 NIKOLAEV Z870 SIMFEROPOL 22 TO KIROVOIRAO 24 70 KHE9SO'4 2871 MOGILEV 22 71 MINSK 74 71 VITEBSK 2A72 GUMCL 22 72 VINNITSA 24 72 ZHItOIR ?773 GURYEV 22 73 IVA'411FRANKOVS( 24 73 MINSK 2774 VITEBSK 21 74 KHMFL.'1TS<IY 24 74 V1NNITSA ?675 04SK 21 75 ELISTA 23 75 KARAA40A 26T6 K3KC4FTAV 21 76 VITE3SK 23 76 SYKTYVKAO 2677 TSELIN)GR\d 21 77 K34CHETAV 23 77 TSELINOGRAO 1678 WfVGOROD 20 78 NOVGOROD 23 78 PAVLODAP 2679 M14SK 20 79 TERNPOL 23 79 IVOV ?s80 TERNOPOL 20 80 POVNO 23 80 KIROVOGQ AD 2581 VINNITSA 20 81 OESSA 23 81 NOV1Oq00 2582 LFNJ1GqA) 19 82 KAkArAOA ?2 82 TSILISI Z483 PSKOV 19 83 SIMFEROPnL 22 81 KN4EL4ITSKIv 2484 ROVNO IQ 84 04SK 22 84 TRNf]P)L 2485 IVANO_FRA'IK1VS% IQ 85 BREST 22 85 R3VN' ?86 KHmFLNITSKIY 19 86 LUTSK 22 96 OOESSA 2'87 OOESSA 19 87 UZNGOR09 22 87 LENINGRAO 2488 BREST 19 88 SY;TYVKAR 22 88 BARPIAUL ?489 NOVOSIIPSK IQ 89 TSELINOGRAO 21 89 IVA40.FRA'4'OVSK ?390 VILNItJS 18 90 LENIGRA) 21 90 ELISTA 1391 YEREVAI 1 91 VILNIUS 21 91 9REST 7392 IUTSK 18 92 CHER40VSTY 21 92 LJTSK ?393 UZHGORC' 18 93 PSKOV 20 93 VILNIUS 2394 CHFQIIOVSTY 18 94 YEREVAN 21 94 KRASPIOYARSK 2395 TOMSK 1q 95 KISF41NEV 20 05 I4FEROPOL 2296 KZYLOCfA 18 96 GROIO4 20 96 UZri'OR' ?297 PETROIAVOr5 17 97 NOVOSI9RSK 19 97 C4ERNOVSTY 2298 ARKHA'JGELSK 17 9e RIGA 19 98 PSKOV ?299 SYKTYVKAq 17 99 PAVLODR 19 99 RIGA ?2
100 KISHI'IqV 17 100 TALLIN 19 100 ASHKHARAO 77lot RiIA 17 101 T04SK 18 101 KISHINEV 21102 RARNAJL L7 102 KZYL-OPOA 18 102 GROO'IJ 21103 PAVLODAR 17 103 PETOZAVOOSK 18 103 TALLIN 21
L04 ASHKIA3AD 17 104 ARKHANGFLSK 18 104 KZYL-OARA 21105 TALL[N 16 105 ASHKHAJAO 11 105 CHI4KEHFT 21106 KAL 11 I'GRen 16 106 TASHKENT 18 106 YEREVAN 20107 GROONO L6 107 CH14KENT 17 107 PETROZAVPOSK Z)105 CHImKcNT 1 108 BARNAUL 16 108 ARKHANGELSK 201O TASHKENT 15 109 KALINI4GRAO 16 109 TASHKENT 20110 KRASNOYAPSK L4 110 OZHAMBJL 16 110 ABAKAN 20Ill A!AKkN 14 Ill KRA!I3YARSK Is 11 OZHA'3'L IQ112 OZHAMBJL 14 112 FRI'IZE 15 112 KALININGRAO 19
i K
t

64
Table 4.2--Continued
ORS t0D QFP6O OS 43OE P, F7 8S N,)E nFP75
113 SE 41PALAT1 1SK 14 113 ARAKAN 14 113 FqU"JZF IQ
114 UST_K-AVFNnGnSv
14 114 SE'IPALATINSK 14 114 SEIPILATII I K 1811$ FRU4ZE 14 115 USTKAe")GoRSK 14 115 USTKAmEWIgGOPS
< |7
116 MJR'4ASK 12 116 AL'AATA 14 116 AL%44_ATA 171l? IRKurSK 1? 117 MJR'ANSK 13 117 OUSHA413E 16118 AL tiA AT 12 118 fnUSHA145E 12 I1R MURqANSC 15119 OJSHANBF It 119 PKUSK 11 119 IqKUTSx 15120 C-4ITA 8 120 ULAN_Un}E 9 120 ULAN.ijtJE 121Z1 ULAICUDE 8 121 C41TA 8 121 C-ITA it122 VLADIVOSTOK 6 122 VLAOIV'0.T'K 6 122 8LAGOVESHCHPISK 8123 KHA AROVSK 6 123 KIABARO SK 6 123 VLAr)IvnST'K 7124 8LAGWVESIHCHFUSK 6 LZ4 BLAGOVF>,'CHENS,( 6 L24 K4AAR3VSA 7IS VYAKUTSK 6 L25 YAKJTSK 6 125 YAKUTSK126 mAGA0A 5 126 MAAA 5 L26 4AAOAN 6127 YJZ4NOSAKHALINSK 4 127 YJZHN40SAKMALIPISK 5 127 YUZ'NO_SAKHALM'JSK A128 PETP3PAVL,)VSKK.I 4 123 PETP.]PAVLOVSKKAM 5 128 PFTROAVL"IVSKKA4 6129 P,3RILSK 1 129 N3kILSK 0 129 NORILSK 0
,Approximate rankings by rounded relative energy potentials. Rankings mentioned in text areby unrounded absolute energy potential indices.
bRelative energy potential for 1960, 1970, and 1975 as percentage of Kuybyshev.
4
'a
-ii------ _________________

65
alone, but their changes in rankings were not quite as large. The areas
with the lowest energy potential based on transport costs during 1960-
1975 were generally the same as those when energy accessibility was de-
termined by distance. The overall patterns of energy accessibility
based on transport costs varied even less through time than those for
distance, with correlation coefficients of +0.97 for 1960 and 1970,
+0.97 for 1970 and 1975, and +0.95 for 1960 and 1975.
The patterns of energy accessibility using unmodified distance are
similar to those determined by distance modified by transport costs. The
correlations between the two sets of values were high with correlation
coefficients of +0.78 for 1960, +0.83 for 1970, and +0.84 for 1975. This
similarity occurs because, although the top positions changed from one
set of rankings to the other, the bulk of the nodes remained fairly con-
stant in their positions. Moscow, for example, fluctuated between 32nd
and 43rd places when the rankings were based on distance and between
34th and 44th places when transport costs were used. Moscow's values
were somewhat higher than might otherwise have been expected because of
its distance from major sources of energy, but Moscow benefits from be-
ing the center of the transportation network in the European USSR. En-
ergy thus has a shorter distance to travel to get to Moscow than to
other nodes around Moscow.
The energy potential indices of the 129 nodes were used to con-
struct maps showing energy accessibility as calculated using distance
and distance modified by transport costs for 1960, 1970, and 1975 (Fig-
ures 4.1 through 4.6). On the basis of the indices determined for each
node, contour lines of equal energy potential were drawn. For easier
comparison, the values of the contour lines are expressed as percentages
i 5®

FIGURE 4.1
Source: Data for outline and cities taken from Soviet Union.
National Geographic Society, 1976,
transverse polyconic projection.
'-J
-*~~~ w~4~ , d
f&~iiz'

67
0
00
o 0x ->
0
C',
0 oQ2
o ~C 0
00
0~
00
0y

FIGURE 4.2
Source: Data for outline and cities taken from Soviet Union,
National Geographic Society, 1976,
transverse polyconic projection.
-te 1
-4,~ -~' 5

69
in ~00
00
00
IL 0 >0 C03 v*

FIGURE 4.3
Source: Data for outline and cities taken from Soviet Union,
National Geographic Society, 1976
transverse polyconic projection.
"Vt--7
C'' -"~4
K7
- -T

71
00
COO
o vo 0
Fj 0iiV) int
_ _ _ _ _ _ _
I ~'-' ~- --- -~ -',.-,o-

FIGURE 4.4
Source: Data for outline and cities taken from Soviet Union,
National Geographic Society, 1976,
transverse polyconic. projection.
A-.
NIO, *n' 11-0
41 -- %:~-A X j~~~

73
00
00
I..2CO) a*6
I- I
CO)2m EC i0
'D 0
cn 00
CW>. X
C-,
>; 010o I
LU
0 00
0~0

FIGURE 4.5
Source: Data for outline and cities taken from Soviet Union,
National Geographic Society, 1976,
transverse polyco-nic projection.
7 ~4>~-7

75
00F-n
0
>000
0 JJ
4 In
1 X~~ 0
0 0 0
01 r
1pVP 1=
'I,

FIGURE 4.6
Source: Data for outline and cities taken from Soviet Union,
National Geographic Society, 1976,
transverse polyconic projection.
- n-,
4~ '~-
3-,*
f Mill
77"-~~

7;
01
10 .K
o CC:
0-. , ,T.
ui~
0 4
oo
o
00
00

78
of the nodes having the highest energy potential. The contour interval
is ten percentage, and the zero and 50 percentage lines are darker than
the other lines. These nodes are Voroshilovgrad for the maps based on
distance and Kuybyshev for the maps based on transport costs.
The 1960 energy potential map based on distance alone (Figure 4.1)
contained two major peaks and one minor peak. The dominant peak occurs
in the eastern Ukraine and North Caucasus area where Voroshilovgrad,
Donetsk, and Rostov are so favorably located in the Donets Basin. This
peak subsumes a large part of the Donets-Dnepr industrial complex. A
secondary major peak rises over the Volga-Urals oil fields and straddles
the boundary between the Volga and the Urals industrial regions. A mi-
nor peak is centered over Kemerovo and the Kuznetsk Basin and is coinci-
dent with the Kuzbas heavy industrial region. There is a slight rise
around Baku, and closed contour lines surround the Moscow and Karaganda
coal basins. Despite the region's huge energy reserves, the nodes in
the trans-Baikal area have the lowest relative energy accessibility val-
ues in the U.S.S.R. because of their great distance from major energy
producing sources.
The Donets Basin peak also dominates the 1970 energy potential map
based on distance (Figure 4.2), but the Volga-Urals peak increases its
relative height and area because of the doubling of oil production in
that region between 1960 and 1970. A slight spur now runs from Voroshi-
iovgrad westward to Kharkov and Poltava because of the five-fold in-
crease in production of the east Ukrainian natural gas fields and the
discovery of oil near Poltava. A notable prolongation extends eastward
from Kuybyshev through Ufa generally along the Trans-Siberian Railroad
to Kemerovo and encompasses Karaganda. A minor peakc appears in the

79
North Caucasus region around Groznyy and Ordzhonikidze because of a dra-
matic but temporary spurt in pro ction of the Chechen-Ingush ASSR oil
fields.
The size and shape of the Voroshilovgrad energy potential peak re-
mained virtually unchanged in 1975 (Figure 4.3), while the Volga-Urals
peak grew in height and expanded its base northward and eastward to in-
clude the cities of the eastern Urals region. This expansion was influ-
enced by production from the middle-Ob oil fields of Tyumen Oblast. In-
creased coal production at the, Kuznetsk Basin aided by input from the
middle-Ob oil fields, enabled the Kemerovo peak to grow and expand with
a prolongation southwestward to include Karaganda.
The Volga-Urals oil fields peak towers over the map of relative en-
ergy potential based on di3tance modified by transport costs in 1960
(Figure 4.4). Two secondary peaks are centered over the Donets Basin
and the Baku oil fields. A closed contour line surrounds Kemerovo be-
cause of the Kuznetsk Basin. The peaks at Voroshilovgrad and Kuybyshev
bulge toward each other as though they might coalesce, but this never
happens because the production of the Donets Basin rose only slightly
from 1960 while the Volga-Urals production doubled from 1960 to 1970.
The patterns vary little from 1960 to 1970 (Figure 4.5). The peak
at Voroshilovgrad has shrunk a bit, but a slight prolongation now runs
northwestward through the gas and oil fields near Kharkov and PolItava.
The peak at Kuybyshev has expanded its base, and the distended ridge run-
ning northeast to Perm is more pronounced. The spasmodic increase in
production of the Groznyy oil fields is evident in the minor peak ap-
t! pearing in the eastern North Caucasus region.
w~

80
The Groznyy peak disappears by 1975 (Figure 4.6), and the peak at
Voroshilovgrad has diminished even more. The base of the Volga-Urals
peak expands eastward and northward as the cities of the eastern Urals
region increase their energy potentials because of the influence of the
West Siberian oil fields along the Ob. There is a small rise in the Kuz-
netsk Basin area, but the values there are generally less than those in
the Central region around Moscow.
A few general observations can be made about both series of energy
potential maps. The areas with the lowest energy accessibility were the
Far East, East Siberia, the Northwest, Soviet Central Asia, the Baltic
states, and the area along the western border of the country. The lat-
ter three areas contain some of the highest concentrations of population
in the Soviet Union and some of the nodes with the highest urban popula-
tion growth rates as well as the Leningrad industrial region. On all
maps, major peaks occur in or near the Donets-Dnepr, Volga, and Urals
industrial areas, and minor peaks often rise at the Baku, Karaganda, and
Kuznetsk industrial centers. The nodes of the long-established indus-
trialized region around Moscow displayed moderatn energy potential val-
ues largely because of their locations with respect to the Donets Basin
and Volga-Urals oil fields. The dramatic increases in the oil and natur-
al gas production of West Siberia were reflected by modest eastward and
northward shifts in the base of the Volga-Urals peak.
Urban Population Growth and Energy Accessibility
bility was analyzed using urban population data from the 1959, 1970, and
1979 censuses (Appendix E) and nodal energy potential indices for 1960,

81
1970, and 1975 based on distance and transport costs. Norilsk and
Elista were not included in the correlation analyses because Norilsk
had been treated as a separate system with no energy inputs from sources
other than those in its immediate area and because population data for
Elista were not available for the entire period of study.
The results of the correlation analysis between the urban popula-
tion data and energy accussibility based on distance revealed that en-
ergy accessibility has had little impact on urban population growth (Ta-
ble 4.3). Those nodes with high growth rates were, in fact, located
away from areas of high energy accessibility as indicated by the nega-
tive signs of the correlation coefficients between urban population
growth and energy potential. A small positive relationship exists, how-
ever, between changes in energy accessibility and urban population
growth. Evidence of a lag effect is present in that the change in en-
ergy accessibility 1960-1970 had a higher correlation with urban popula-
tion growth 1970-1979 than did the change in energy accessibility 1960-
1970 with urban population growth 1959-1970. The evidence of a lag ef-
fec!. .s also supported by the lack of any significant correlation be-
tween urban population growth 1970-1979 and the change in energy accessi-
bility 1970-1975. As might be expected, the correlation coefficients
between urban population and urban population growth demonstrates that
larger cities tend to grow at slower rates than small cities. The sub-
stantial correlation between urban population growth 1959-1970 and urban
population growth 1970-1979 shows that the patterns of growth were some-
what similar during both periods.
IThe correlation coefficients matrix for urban population data andenergy accessibility calculated using transport costs again indicates
d| I

82
JISA4 -M'9ILtIC1 OAT& OlgO f4E-Y ICCSSML:? 4A0 f"4 'f'-
a:o 14 2:7,r.i£ l SM f2 c~ 4 Tc214 ff0:Llll a&.s C--1(3
1 1."007 1).114,52 -).31540 -0.3.300 0.1'12-S 0. 13311 0.1413-. *0?qQ .0.14Is -1).04 51-).!W)) 0.01-1 1.0031 1.02 1.20M1 0.13A 0.113.) 3.11I.e I.sd70 .451
O'JA1 1'A3 I ''1 . 3441 - 3.3314. 0. 1.70;' 0.1411) 2. 10) -3.041-3 -0.0' 10' -. 2344.501 0.00. e001 3.0401 0.034S 1. 1131 1.1901 306?' 13.6457 e).4111
1R -o03561 -0.14115 1 .01003 '3.494 -0.1 ?4t5 -C. 12489 -0.11 21 375 'I tFS1301 *)..73710.2(Wi1 0.0101 3.1000 1.100t 0.3102 1.16130. 31I~ 0.') 142 0.36V7 0.00?1
-0.~ .1. 32'0 '). )33'144 l.ft4q94 1.1,00 -,).;2140 -0.1L6%4 -'3. 17 260 3.257%4 -0.0000? J.215511.1001 0.1n1l 13.0001 0.13000 0.00 it2 .,)At I 3I.0123 0.30134 13.1494 0.016)
?F' ) .1432$4. 01 44M! -13.174IS -3. 221 V) 1 .0(0010 -. q4417 13.93647 -1.0107 -1.3511 -,,. 341311). 11)11 0.344-1 0.0302 3.023 1.0010 1.001t 0.0001 1.4W0 CO.OMOL ().00Wt
"0 *.13314 1).1 0131 -3.1?44% -0.1t656 0.95547 t.00300 0.47-49 0.14261 -1).4%4q -1. 16C521. 1:3 14 .1It31 1.1615 1.16013 .0001 0.00 0.3001 3.0300l 1 301 0.ep61I
76'370 1. 14t134 0.151' 1).1 J -0.1 72.'40 0. 936A? 0.97149 1,00000 0.16414 -1.30168 -0.1101'?(I. 110 1.031 3. 193t1 '.0523 4.0001 1.301% 0.0100 0.1474 0.3005 0).563?
C.ZI-0.057110 -305104 13.21 ?16 0.25411 -1.047 0.10263 -1. t6900 1.01011 -1). 0p7253 0.67'41n. 1146 3.40 0.0142 0.0034 0.4390 0.0300 11.0574 0.1001 3.311z 0.0001
C4t- 10''5 .134I11g 034019 '.00 -0.34515 -'3.44664 -0.313611 -).3022 1.000 0.444?21.91 1.64117 0.3692 '). lq44 0.0001 11.1031 0.300-5 1.3012 0.3100 .0e01
l'. -0.)S t4 -0.01008 ').27070 1.2314) -13.341130 -1.16452 -0.0S997 13.6791 0.46520 .00n. 3615 1).4403 0.102t n.004Z 0.303t 1.3613 0.1037 3.3111 e).0001 0.001
'T~ic~1935 am! 1970
art'" lo POP14LOO1f6t 1139-1070
Ctrbss pop..lla growth 1970-1979
doa -aaq ~s pc~stll 1540. 1970. aId 15
*chW44Ia 13 arp 74aIU.1s 1560-1070
f0 5.w Ia "Orlgy patsa~i" 1970-1575
In nergy PstwtW~ 1970-1073
h coiaalo efcMciburea
1SI1ac 1'18 3
IIW

83
COOMIELATIMfl COEFPICIE4TI 44 SIM~I~ ZCANCE LEVELS 817WE41.u68M. POP.JL A tC OA or A s'o SF46907 ACCESSIIILITY SASED OX tR4N$PCzr CO.STS
POPl a 00704 GROh7NI" 080147HZ 7(eO 767 71775TfIS Ci418Gf CHAIGE2 0H696734
00019 L.00000 00.9Z -0.39560 -0.3*800 0.15114 0.L27:0 0.t3497 -0.10613 -0.03170 -.0.0000 0.0001 0.0001 0.0002 0.0491 0.1544 0.1303 3.2350 0.6739 3.2167
O0P70 .2.94691 1.00000 -O.3'009S -0.33044 0.1546S I.13571 MOWS0 -0.10379 -0.03446 -0.104960.0001 0.0300 0.000t 0.0001 3.0724 0.1212 0.1036 0.2401s ).6464 0.,402
01047'41 -0.35563 -0.34001 1.00000 0.49494 -O.1500? -0.0906 -0.09326 3.26767 0.03667 0.224700.0.0 .000 0.0000 3.0001 0.0922 1.2713 0.2470 0.0023 0.94C& 0.O111
060474H2 -0.328000.34 0.6"994 1.00000 -0.24947 -0. 10473 -0.20144 3.32617 -0.32791 0.23391.0.0002 0.0001 0.0001 0.0000 3.0047 3.02:2 0.0231 0.0032 3.7554 0.03e1
TEP40 0.0114 4.13%64 -0.1500? -0.146947 1.00000 0.96941 0.45140 -3.13937 -0.4414t -0.5075'0.00 0.4721 0.0922 3.0047 0.0000 3.0001 0.000t1 3.1200 200 .0001 Co
71P70 0.12713 0.1317t -,' 14836 -0.19473 0.96941 1.30000 0.91610 0.08845 -0.0W -0.31426,0.1544 0.1232 0.2713 0.0282 0.0001 0.0000 0.0001 3.32291 0.0001 0.003t
71770 0.10497 0.14500 -0.0932t -0.20144 0.91160 0.47410 1.30000 0.14427 -0.32835 -0.257290.0303 0.13)0 0.2170 0.0231 0.0001 0.30t 0.0000 1.5900 0.3002 0.0035
00-411I -0.10413 -0.11179 0.26767 0.326t7 -0.13847 0.06445 0.04827 1.00000 -,).9821 0.474910.2310 0.2055 0.0023 0.0002 0.k200 0.0228 0.5000 0.0000 0.0007 0.0001
CHONGEZ -0.03770 -0.00496 0.047 -0.02741 -0.44741 -0.50827 -0.32835 -0.29927 1.00000 0.492110.6739 0.4904 0.9406 0.7554 0.0001 3.000t 0.0002 0.0007 0.0000 0.000t
CHAN063V -0.11018 -0.10494 ).22470 0.23394 -0.50754 -0.39026 -0.2S729 0.4,7441 0.69211 1.000000.2167 0.2402 1.0111 0.00a1 4.0001 0.0001 0.0005 0.0001 0.0001 0.0000
spo.4aclas 1959 &M4 197061r6m ps"Is.8tos p4.06h 1839-1570
dT*W "aty@cestiM O. 18 1870. am 1075
*Chas$* in .ntru voconci*1 1840-1870
.k Oss in onota poceazta 1970-197S
schmase in "or"7 votes"" 1980-197
haeac .offio0*.ts
ASpfcmsLws

84
that those nodes with high growth rates tended to have low energy poten-
tial (Table 4.4). Changes in energy accessibility based on transport
costs have a stronger relationship with urban population growth than did
energy accessibility based on distance. The stronger relationship of en-
ergy accessibility based un transport costs with urban population growth
reflects the superiority of transport costs over sheer distance as a mea-
sure of impedance. Evidence of a lag effect of changes in energy acces-
sibility on urban population growth is even more pronounced than before.
This is exhibited by the higher correlation coefficient between the
change in energy accessibility 1960-1970 and urban population growth
1970-1979.
Summary
The analysis of energy accessibility revealed peaks and troughs
which were fairly stable through time and relatively invariant with re-
gard to the way energy accessibility was calculated. Nodes in two areas,
the Donets Basin and the Volga-Urals oil fields, had the highest energy
potential indices. Voroshilovgrad in the easterh Ukraine was ranked
first when energy accessibility was determined by distance alone, and
Kuybyshev was first when transport costs were used. East Siberia, the
Far East, the Northwest, the Baltic states, Belorussia, the western
Ukraine, Moldavia, and Soviet Central Asia had the lowest accessibility
to energy based on actual energy production. Areas with moderate levels
of energy accessibility were the Kuznetsk Basin, the North Caucasus, and
Baku. Moscow and the Central industzial region had modest levels of en-
ergy accessibility. The energy potential patterns as determined by dis-
tance were fairly similar to those determined by transport costs. These

85
patterns also changed little between 1960 and 1975 despite the eastward
shift in emphasis of energy production. The huge oil and gas fields of
Western Siberia were simply too far away from any of the nodes studied
to have more than a modest impact on energy potential patterns, although
there was a gradual eastward expansion of the base of the Volga-Urals
peak between 1960 and 1975.
Three major industrial regions of the Soviet Union, the Donets-
Dnepr, Volga, and Urals, are nearly coincident with the areas of highest
energy accessibility. The Central, Karaganda, Bak,, and Kuznetsk Basin
industrial areas had energy accessibility values ranging from moderate
to moderately high respectively. Leningrad and th emerging industrial
area around Tashkent had low energy potential values. Some of the -reas
with the lowest energy potentials were also those with high urban popula-
tion growth rates, such as Soviet Central Asia, Belorussia, Lithuania,
and Moldavia. This high urban population growth was generally due to
high birth rates and rural to urban migration potential. On the other
hand, many nodes in the well-established, industrial regions which have
high energy accessibility values displayed relatively low growth rates.
These low growth rates were the result of an already high level of urban-
ization, low rates of natural increases in population, and lack of rural
to urban migration potential.
The correlation analysis between urban population growth and energy
accessibility supported the apparent disconformity between patterns of
high urban population growth and high energy accessibility. Changes in
energy accessibility were, however, positively correlated with urban
population growth. A lag effect was evident in the correlation between

-- -- --.
86
the change in energy accessibility 1960-1970 and urban population growth
1970-1979.
The role of energy accessibility in Soviet urban population growth
appears to be relatively modest at best. Reasons for this modest role
will be considered in the final chapter.
I.
4 1I

CHAPTER V
CONCLUSION
Introduction
"Coal is the actual bread of industry; without this bread, industry
cannot function" (Lenin as quoted by Hodgkins 1961, p. 40). What Lenin
said about coal in the early 1920s can now be applied to oil and gas as
well. Energy, in whatever form, is absolutely essential for most endea-
vors of modern man. Because of the essential nature of energy to indus-
try, it was intuitively appealing to strive to establish a link between
energy accessibility and urban population growth, which can be regarded
a fair indicator of industrial growth under the Soviet system. The pur-
pose of this research, then, was to determine the patterns of energy ac-
cessibility in the Soviet Union, examine the spatial and temporal varia-
tions of such patterns, and investigate the influence of energy accessi-
bility on urban population growth. This purpose was accomplished, but
the study would be incomplete without a discussion of the implication~s
of the results of this research on urban population growth, industriloca-
tion, and regional development. Two sections follow. The first deals
with implications; the second suggests areas for future research.
Implications
There have been excellent works on the growth of Soviet cities and
the Soviet energy system, but this is the first in-depth study examining
87
7r

88
the interrelationships between energy and urban population growth on a
macrogeographic basis. This work is also unique in that it represents
a new application of potential models to determine patterns of energy
accessibility. There are several implications regarding the results of
this study.
The influence of energy accessibility on urban population growth on
a nation-wide level proved to be relatively modest. Although access to
energy can dramatically affect the growth of individual cities or groups
of cities (Bond and Lydolph 1979; Harris 1971; Lydolph et al. 1978),
other factors are clearly more important in determining Soviet urban
population growth. Regional variations in levels of urbanization, rural
to urban migration potential, and natural increase in population result
in high urban population growth for nodes with relatively low levels of
energy accessibility. Lithuania, Belorussia, Moldavia, and Central Asia
are examples. Rural to urban migration was a major factor in the high
urban population growth in Lithuania, Belorussia, and Moldavia. Natural
increase in population was less important in those three republics, al-
though Lithuania had the highest rate among the Baltic states, Belorussia
had the highest rate among the Slavic republics, and Moldavia was above
the national average. Levels of urbanization were important in Moldavia
and Soviet Central Asia, both of which are still predominately rural.
Natural increase in population wae the dominant factor in urban popula-
tion growth in Central Asia which had rates of natural increase in popu-
lation two to three times higher than the national average (Bond and
lILydolph 1979).
Nodes in the Donets-')nepr, Volga, Uralsi and Kuzbas industrial re-
gions all had relatively high energy potential indices, but their urban
177. "7 -7,
" ° .... °

89
population growth was generally well below the national average. These
well-established industrial regions were characterized by high levels
of urbanization, low rural to urban migration potential, and low natural
increase in population. In addition, increasing mechanization of coal
mining and the decreasing importance of coal in the Soviet energy budget
adversely affecteJ urban population growth of cities in coal mining re-
gions such as the Donets, Kuznetsk, and Karaganda basins (Bond and Ly-
dolph 1979; Harris 1971).
Energy may act as a catalyst for economic activities, and a city
undoubtedly requires a certain minimum level of energy to survive or
prosper. Despite the wide range in levels of energy accessibility, all
cities in this study apparently had access to enough energy to sustain
urban population growth. Any amount of energy over the minimum require-
ment may have been largely superfluous, though there was a small posi-
tive correlation between changes in energy accessibility and urban popu-
lation growth.
The eastward shift in energy production and grandiose construction
projects such as the Baikal Amur Mainline or BA in Siberia and the Far
East do not necessarily portend an eastward shift in urban population
growth and industry. The eastward shift in energy production to sites
that are far away from the market areas of the western part of the
U.S.S.R. has been forced on the Soviets by the need for more energy to
fuel economic growth and to earn hard currency from energy exports. The
Soviets are building the BAM for several reasons: (1) to relieve the
overburdened Trans-Siberian Railroad, (2) to open remote resource areas
for exploitation, (3) to bolster defense capabilities in Siberia and the
-7

90
Far East, and (4) to strengthen foreign and domestic commercial ties
(Lydolph 1979, pp. 424-425).
The eastward shift in energy production and the completion of the
Baikal Amur Mainline may stimulate some settlement in areas of Siberia
and the rar East which are now largely uninhabited. Some cities in
those areas may exhibit spectacular growth rates, such as Surgut near
the Samotlor oil fields of Western Siberia, but these will be resource
oriented "boom towns" whose growth is closely dependent on production
trends. The hostile environment and labor shortage in much of Siberia
and the Far East are severe constraints on regional development in those
areas, and the Soviets will probably meet with only limited success with
their plans to urbanize and industrialize areas such as the lower reach-
es of the Yenisey (Myakinenkov 1975).
The high urban population growth demonstrated by nodes with low ac-
cessibility to energy supports the notion that the Soviets have yielded
to the pull of the market as a factor in industrial location as suggest-
ed by Soviet geographer A.A. Mints (3.976) and American geographers, Ly-
dolph and Pease (.972). Energy resource locatioh will more than likely
continue to be a lesser important factor in industrial location, The
"fluid" nature of oil and natural gas and the rapidly expanding pipeline
networks have doubly blessed the Soviets by facilitating the export of
oil.and natural gas to Eastern and Western Europe and by enabling the
Soviets to develop the energy-poor western areas of their own country.
Future emphasis will likely be on developing mineral resources, such as
the Kursk Magnetic Anomaly, in the market areas of the western U.S.S.R.
where there is an available labor pool (Lydolph and Pease 1972).
%,,j
91
The findings and maps compiled as the result of this study might be
useful in small-scale economic planning for the Soviets. The data points
for which energy accessibility was calculated were major administrative
and industrial nodes generally within the "fertile triangle" of the So-
viet Union. The energy potential indices and maps thus represent or
portray energy accessibility of marketiareas within the Soviet Union
rather than areas that are sparsely inhabited. Siberia and the Far East
may possess vast reserves of energy resources, but such reserves are
like the coal field described by Harris (1954) as "useless until it
falls within the technological capabilities of specific human groups and
until it can be utilized in a favorable economic environment" (p. 315).
Contour maps of energy potential would probably be more useful to
Soviet economic planners in making industrial location decisions than
existing choropleth maps of resource potential (See: Mints and Kakhanov-
skaya 1975). Soviet geographers have long advocated the location of in-
dustry in small and medium-size cities of their country (Mikhailov and
Solovev 1969). Industry could be located in such cities in or near areas
of high energy accessibility such as between the Donets Basin and the
Volga-Urals oil fields. This would minimize transport costs because the
industry would be fairly close to energy sources as well as still within
the market area of the Soviet Union. This would also achieve other aims
which the Soviets have been striving for, such as a reduction in the ex-
cessive concentration of industrial production in large cities and a
more equitable distribution of population and industrial production
(Koropeckyj 1970; Mikhailov and S61ovev 1969)'.
21[

92
Areas for Future Research
The aims of this study were achieved, but future research might be
undertaken in a number of related areas. Changes in energy accessibi-
lity based on generalized transport costs had slightly stronger corre-
lations with urban population growth that did changes in energy accessi-
bility based on distance alone. This suggests that transport costs are
a superior measure of friction in accessibility studies than sheer dis-
tance. The same generalized transport costs were used throughout the
period of study, and exponents of 1.0 were used in calculating energy
potential indices. Additional research might be directed toward deter-
mining how the transport cost ratio for coal, oil, and natural gas has
changed over time and what the actual exponents should be.
A temporal series of energy potential maps with energy producing
sources used as data points rather than nodes in the energy consuming
market area of the Soviet Union would more clearly show the dramatic
eastward shift in energy production. For planning purposes, energy po-
tential maps could be drafted based on projected production rather than
on actual production. What would be the effect of including the energy
imports from Poland, Afghanistan, or Iran on the patterns of energy ac-
cessibility within the Soviet Union? Conversely, should some allowance
be made for the coal, oil, and natural gas that the Soviets export?
Large cities were selected for study because census data were read-
ily available. The influence of energy accessibility on medium-size
(50,000-100,000 population) should be examined. Medium-size cities
might be more sensitive to changes in energy accessibility than large
I1 ~cities. A study utilizing medium-size cities rather than large cities
93
might possibly reveal more information concerning Soviet regional de-
velopment priorities. Other variables, such as changes in industrial
production or percentage of labor force engaged in manufacturing, could
be used instead of urban population growth. Use of other variables,
though, would present problems of data availability and aggregation.
• Urban population data were used because the Soviets are not as reticent
in publishing population data as they are with economic data.
The results of this study could be included in a model for urban
population growth. Additional variables could include an index of rural
to urban migration potential, the rate of natural increase in population,
and the population of the city. Similar energy accessibility studies
could be done for other large countries of the world, such as the Peo-
ple's Republic of China or Brazil, which do not have homogeneous distri-
butions of population or energy resources.
The purpose of this research was accomplished. Temporal and spa-
tial variations in energy accessibility were determined and mapped, and
the influence of energy accessibility on urban population growth was ex-
[I amined. Spatial patterns of energy accessibility have not varied a
great deal despite the intense sectoral and spatial shifts in energy
production. Energy accessibility has had a limited effect on urban
population growth because other factors more profoundly influence Soviet
urban population and because Soviet regional development policy appears
to follow a course relatively unrestrained by energy resource locations.
Although this work cannot be considered exhaustive, it has provided some
additional insight on the interrelationship between energy accessibility
and human activity in the Soviet Union.
iI-4
94
References
Bond, A.R. and Lydolph, P.E. 1979. Soviet Population Change and CityGrowth 1970-79: A Preliminary Report. Soviet Geography: Reviewand Translation 20, 8:461-
Harris, C.D. 1954. The Market as a Factor in the Localization of In-dustry in the United States. Annals of the Association of AmericanGeographers 64, 4:315-348.
Harris, C.D. 1971. Urbanization and Population Growth in the SovietUnion, 1959-1970. The Geographical Review 61, 1:102-124.
Hodgkins, J.A. 1961. Soviet Power: Energy Resources, Production andPotentials. Englewood Cliffs, N.J.: Prentice-Hall, Inc.
Koropeckyj, I.S. 1970. Industrial Location in the USSR During the Post-war Period. In Economic Performance and the Military Burden in theSoviet Union. Subcommittee on Foreign Economic Policy of the JointEconomic Committee, Congress of the United States, pp. 233-294.Washington, D.C.: U.S. Government Printing Office.
Lydolph, P.E. 1979. Geography of the U.S.S.R., Topical Analysis.Elkhart, Wisc.: Misty Valley Publishing.
Lydolph, P.E., Johnson, R., Mintz, J., and Mills, M.E. 1978. RecentPopulation Trends in the USSR. Soviet Geography: Review and Trans-lation 19, 8:505-539.
Lydolph, P.E. and Pease, S.R. 1972. Changing Distributions of Popula-tion and Economic Activities in the U.S.S.R. Tijdschrift voor Eco-nomische en Sociale Geografie 63, 4:244-261.
Mints, A.A. 1976. A Predictive Hypothesis of Ebonomic Development inthe European Part of the USSR. Soviet Geography: Review and Trans-lation 17, 1:1-27.
Mints, A.A. and Kakhanovskaya, T.G. 1974. An Attempt at a QuantitativeEvaluation of the National Resource Potential of Regions in theUSSR. Soviet Geography: Review and Translation 15, 9:554-565.
Mikhailov, S. and Solovev, N. 1969. Small and Medium-Size Cities andthe Location of Industry in the USSR. In Contemporary Soviet Eco-nomics, vol. 2, ed. M. Yanowitch, pp. 129-136. White Plains, N.Y.:International Arts and Sciences Press, Inc.
Myakinenkov, V.M. 1975. Prospects of the Development of Production andSettlement in the Northern Yenisey Region. Soviet Geography: Re-view and Translation 16, 9:578-583.
/~

BIBLIOGRAPHY
Abouchar, A. 1979. Regional Industrial Policies of the U.S.S.R. in the1970s. In Reg!onal Development in the U.S.S.R., NATO Colloquium25-27 April 1979, pp. 93-103. Newtonville, Mass.: Oriental Re-search Partners.
Bond, A.R. and Lydolph, P.E. 1979. Soviet Population Change and CityGrowth 1970-79. A Preliminary Report. Soviet Geography: Reviewand Translation 20, 8:461-488.
CALCOMP 1972. GPCP-II User's Manual. Anaheim, Ca: California ComputerProducts, Inc.
Campbell, R.W. 1968. The Economics of Soviet Oil and Gas. Baltimore,Md.: The Johns Hopkins Press.
Cohn, S.H. 1970. General Growth Performance of the Soviet Economy. InEconomic Performance and the Military Burden in the Soviet Union,Subcommittee on Foreign Economic Policy of the Joint Economic Com-mittee, Congress of the United States, pp. 9-17, Washington, D.C.:U.S. Government Printing Office.
Dewdney, J.C. 1976. The U.S.S.R. Kent, England: Wm. Dawson & SonsLtd.
Dienes, L. 1971. Issues in Soviet Energy Policy and Conflicts OverFuel Costs in Regional Development. Soviet Studies 23, 1:26-58.
Dienes, L. 1972. Investment Priorities in Soviet Regions. Annals ofthe Association of American Geographers 62, 3:437-454.
Dienes, L. 1973. Geographical Problems of Allocation in the SovietFuel Supply. Energy Policy 1, 1:3-20.
Dienes, L. 1978. Soviet Energy Policy and the Hydrocarbons. Washing-ton, D.C.; Association of American Geographers Project on SovietNatural Resources in the World Economy, Discussion Paper 2.
Dienes, L. nd Shabad, T. 1979. The Soviet Energy System. Washington,D.C.: V.H. Winston & Sons.
Ebel, R.E. 1961. The Petroleum Industry of the Soviet Union. Arling-ton, Va.: Royer and Royef, Inc.
95
/

4
96
Ebel, R.E. 1970. Communist Trade in Oil and Gas. New York: PraegerPublishers.
Elliot, I.F. 1974. The Soviet Energy Balance. New York, N.Y.: Prae-ger Publishers, Inc.
Fuchs, R.J. and Demko, G.J. 1979. Annals of the Association of Ameri-can Geographers 69, 2:304-318.
Fullard, H., ed. 1965. Soviet Union in Maps. London: George Philip& Son, Ltd.
Fullard, H., ed. 1972. Soviet Union in Maps. London: George Philip& Son Limited.
Hardt, J.P. 1973. West Siberia: The Quest for Energy. Problems ofCommunism 22, 3:25-36.
Harris, C.D. 1954. The Market as a Factor in the Localization of In-dustry in the United States. Annals of the Association of AmericanGeographers 64, 4:315-348.
Harris, C.D. 1970. Cities of the Soviet Union. Washington, D.C.:Association of American Geographers.
Harris, C.D. 1971. Urbanization and Population Growth in the SovietUnion, 1959-1970. The Geographical Review 61, 1:102-124.
Hassmann, H. 1953. Oil in the Soviet Union. Princeton, N.J.: Prince-ton University Press.
Helwig, J.T. and Council, K.A., eds. 1979. SAS User's Guide, 1979 Edi-tion. Raleigh, N.C.: SAS Institute, Inc.
Hodgkins, J.A. 1961. Soviet Power: Energy Resources, Production andPotentials. Englewood Cliffs, N.J.: Prentice-Hall, Inc.
Hooson, D.J.M. 1966. The Soviet Union. London: University of LondonPress.
Houston, C. 1969. Market Potential and Potential Transportation Costs:An Evaluation of the Concepts and Their Surface Patterns in theUSSR. The Canadian Geographer 13, 3:216-236.
Huzinec, G.A. 1977. A Reexamination of Soviet Industrial Location The-ory. The Professional Geographer 29, 3:259-265.
Kish, G. 1960. Economic Atlas of the Soviet Union. Ann Arbor: TheUniversity of Michigan Press.
Kish, G. 1970. Economic Atlas of the Soviet-Union. Ann Arbor: TheUniversity of Michigan Press.
1r
• " . . ./ -.
97
Koropeckyj, I.S. 1970. Industrial Location in the U.S.S.R. During thePostwar Period. In Economic Performance and the Military Burden inthe Soviet Union, Subcommittee on Foreign Economic Policy of theJoint Economic Committee, Congress of the United States, pp. 233-295. Washington, D.C.: U.S. Government Printing Office.
Lewis, R.A. and Rowland, R.H. 1969. Urbanization in Russia and theU.S.S.R.: 1897-1966. Annals of the Association of American Geo-graphers 59, 4:776-796.
Lonsdale, R.E. 1961. Industrial Location Planning in the Soviet Union.The Professional Geographer 13, 6:11-15.
Lukermann, F. and Porter, P.W. 1960. Gravity and Potential Models inEconomic Geography. Annals of the Association of American Geo-graphers 50, 4:493-504.
Lydolph, P.E. 1977. Geography of the U.S.S.R. New York: John Wiley& Sons.
Lydolph, P.E. 1979. Geography of the U.S.S.R., Topical Analysis. Elk-hart, Wisconsin: Misty Valley Publishing.
Lydolph, P.E., Johnson, R., Mintz, J., and Mills, M.E. 1978. RecentPopulation Trends in the U.S.S.R. Soviet Geography: Review andTranslation 19, 8:505-539.
Lydolph, P.E. and Pease, S.R. 1972. Changing Distributions of Popula-tion and Economic Activities in the U.S.S.R. Tijdschrift voorEconomische en Sociale Geografie 63, 4:244-261.
Lydolph, P.E. and Shabad, T. 1960. The Oil and Gas Industries in theU.S.S.R. Annals of the Association of American Geographers 50, 4:461-486.
Mikhailov, S. and Solovev, N. 1969. Small and Medium-Size Cities andthe Location of Industry in the U.S.S.R. In Contemporary SovietEconomics, vol. 2, ed. M. Yanowitch, pp. 129-136. White Plains,New York: International Arts and Sciences Press, Inc.
Mints, A.A. and Kakhanovskaya,. T.G. 1974. An Attempt at a QuantitativeEvaluation of the National Resource Potential of Regions in theU.S.S.R. Soviet Geography: Review and Translation 15, 9:554-565.
Mints, A.A. 1976. A Predictive Hypothesis of Economic Development inthe European Part of the U.S.S.R. Soviet Geography: Review and
Translation 17, 1:1-27.
Myakinenkov, V.M. 1975. Prospects of the Development of Production andSettlement in the Northern Yenisey Region. Soviet Geography: Re-view and Translation 16, 9:578-583.
National Geographic Society. 1976. Soviet Union. Washington, D.C.:National Geographic Society.
Rodgers, A. 1974. The Locational Dynamics of Soviet Industry. Annals
of the Association of American Geographers 64, 2:226-240.
Runova, T.G. 1976. The Location of the Natural Resource Potential ofthe U.S.S.R. in Relation to the Geography of Productive Forces.Soviet Geography: Review and Translation 17, 2:73-85.
Shabad, T. 1961a. News Notes. Soviet Geography: Review and Transla-tion 2, 1:76.
Shabad, T. 1961b. News Notes. Soviet Geography: Review and Transla-tion 2, 3:80-81.
Shabad, T. 1969. Basic Industrial Resources of the U.S.S.R. New York:Columbia University Press.
Shabad, T. 1978. News Notes. Soviet Geography: Review and Transla-tion 19, 4:273-285.
Shabad, T. 1979. News Notes. Soviet Geography: Review and Transla-tion 20, 4:255-265.
Stewart, J.Q. and Warntz, W. 1958. Macrogeography and Social Science.The Geographical Review 48, 2:167-184.
Taaffe, E.J. and Gauthier, H.L. Jr. 1973. Geography of Transportation.Englewood Cliffs, N.J.: Prentice-Hall, Inc.
Taaffe, R.N., and Kingsbury, R.C. 1965. An Atlas of Soviet Affairs.New York: Frederick A. Praeger.
USSR Geological Ministry. 1966. USSR Railroads Directions and Sta-tions. Moscow: Central Board in Geology and Cartography.
Yeates, M. 1974. An Introduction to Quantitative Analysis in Hum'!iGeography. New York: McGraw-Hill Book Company.
Yonge, J.R. 1975. U.S.S.R. Railways. Exeter, England: The Quail Map
Company.
i~... . q _P -- '0M 0t 0

APPENDICES
lvlI
I99
77 Ey.- -77-T-0--

APPENDIX A
DISTANCES TO COALJ SOURCES
100

101
'I, .. 0N 1UN O.N-a g ooN .0 om Af~ % a.0O'U- I&j. 1-# * l9 m C NV M.1U~OO' 4C010 a 0
Wm-OWO4Zm m~m M~MmmNmNNNNNNNMMMM fmNmN NmI.mmmmm
lf4w4OZ204 M1MMNNMNMNNNMNNN Nmmmmmmm
X40404Z .4O4C00O00'000- 00o.4O'0...4. !n--- -- -- -- ----------- ------
. 4NI.N*00 0' , r( -*0.M.4 .. 0' mvm*UB% ,O'NWO00000 a. V0 a, 47, 0, 0 0 600m000
40-# - N0NNN49 r9V%0PP 1-P- --4 - -UN M --- f-mK Za OO.-Z o . N A 1E0'N* e" e o s pM.U0. M0.1.-.UU0O ... N.4
4 lap-000 4040oc1 .0 k.0 ofVWW 40-z kt 4m - P -
u UZN cc'400000'400f'' rl~~ltU ' le02- mW m- %I r L% - U rW NkW t#0U ..
0r 0;: IN m OA1'0 Mf '0 a, eU P .- 0 U ND ft0' m .0 N U.t - 0-0 m ND N I 0 a,% 0.0, OD' 4
44 u~ T cc 0 W%0.V
O 4
LU I wa0 NN N.4 .4.NN .4NN .4 4 4. . . NN N NN4N"M M~ f .
OU -0. -P .0f P-NMV y ''
zUM0g MU n0C ' .NW -W D N&4 0 0P
Wol44 4m ,t W
tW~g- NM N MMNAN~N p Ot 0 t0% A1 . ev =9Tl L vZ
UO W M. >' .0 I.. >1 9x' E1 14 . '. 0 N) B*..00UUN0 .. 01 0o- '0K:g4 Z MN I. NN 4.~ .4 4. v. . ow.tJ 4 b.42C W -z
I., .4.4- .4. 71..4 . - - -1...

102~ 0 C N - ~ g% ( M C :WNWU % T. a,0 M - - , 0 V% 4AI N N M NF N P -tN
U.w 9 04 24 4...*4I . N 4 *444'?.r7744#Ew4,4 4 t MM N
w4 * M 0 N f .t#* 04MM It *4NCMM* 0MCIMIN
P. v F...*0ANtNmNNUN40CNMC..N m*N4N PN -
~~c4~~4c~~~C 4 M M . M 4. !I M 4 . M OM M M ,. 4 e M. mM 4 4 0
(P 40404 N.N N N-. 0 N M0%r 0ccM W M0 0'M
- - - - - -------- - ---
40 WM f-- -.. 4 -,, P- -N-tN00N 0g O M NP,,400000.
O'CO' 00'0O'O'041.47-0 Cal00a 00 "21 0 0 oo~00' o'o' & a vvty 0'wa or..
*NM1- 4 4 4 NC10A410OCN 4CM .010NN4401.0 4404' 0
MC C00a 040NN&PN'O F Il'CNIAMM00C: o %M NCIM *.a
w A MO &M IP In"4 4 4 N 4 4 N QN4'%o No4#4 -400 om amt4444 400 44
u e0>0 0U %I %V 2A 01 4N .40 M0 0 N 0NU0 0VN mW % 01 C CQ I 4m I 0 %,A V% 0 m M- .W- I A O A 4 I AAe~ ~
-9 6
o 2~4 4 4 4 4 I A 4 44CM4 I Inc
o e0met NNM4IA UIA .NNN NCMEMM NN40'N.0C MN-. .. -NMN
af0 NNZWI-&A# 44I 4 4 4f4I40 'VV%4-* C"MO0A.v444444440.W 4 4444NClNN
D Cez NN4 N O4 SAN4C N N .. 00C 4 II O O
w ~ NM NNwg~mN NN MNm MNrMM N mNNNNN fNNNMNNNN'A -
wo~go- NNN yfyNyy ty N y6 fvIN tNNNNN"NN -N-NN- -N-NNNN N N
C4 >O> ~.g N M~eNI NNMffNMN N M NN N N NN N N N
0w~ 0 DR. 0 Nm N WN0N m#N .#N t 44 N NN N N.. 0a 017 e. 4N NN N
.J~* ".4 -. 4 . NNPN .. - NN
M~'.Z 0 U %g 6. P . 4 NW40 0 AU h)NMNNP D0M
-- ~ ~ ~ ~ ' I.-- -- -- -- -> -a >-
0 If CLW - 0 w
zo w X4 g .W z ) 0K .W ~ 0 W jg 9 0 20:r

103
W#MON. -4
.0 !4 M ; c WaN M 00
-0 -P 0-4. N -00MU -4M N0 - i
94:40Z*f' .O4 : 4N - m ., O . 4Nry
P. P. F. low% m M -N M W W-
OOM %r 'C N-**N- .. NN t.'C 'Cg-4'
b- 4M~MMMNNN- NN
j - 4N W I. A ft M NN N.44 rm % b% M M N Ne M A
-a UX043O~0 NNfNNN.4i N %W 0440MM
mJ be -9 NNNN.4 ry ~ C C4f mm ~ N . E i i
Cn N 1 nI . - w N
~N W ef 0 NW%4.i-e O-N t-w O NO'D n a44* ON-iNV~ 0-o Op. 4NN c
' U --.MM4% *n re-m-Co .o .. 44 0O.NN N0- Nfr
0p 0 0 Mab 4 0M Ini4 v 01 0 sNN ~ N i
- ~ xw z = 4NNp& PlMNN U0'C VIA ow Pt.O P.O.. 4 4 0 0.
I- D.J 0~4 NNi%.0I 4 ui Wfa~ M O Mt-N- 0I;0 # A
a- NN-rNNi
-4A4
! "I ,~
te I.WUZ0 >
cc wP n -C j c w0-
W4 in to, in b.>4 - c .
i ZZ - =0 z 00:WcO w IZ&4 - 44'04 Z1.aK-zwC3 W n 4 a-4 -0~a0 . 0 - 1,MI.031 lxZ4lpql
2--) Iow~
z ~ w &O bwoZ,- - 4 1 2. il .. 0W &9 . d2u 0& w ObP
77 7 7__ _ _ __ _ _ _ _ __ _ _ _ _ _
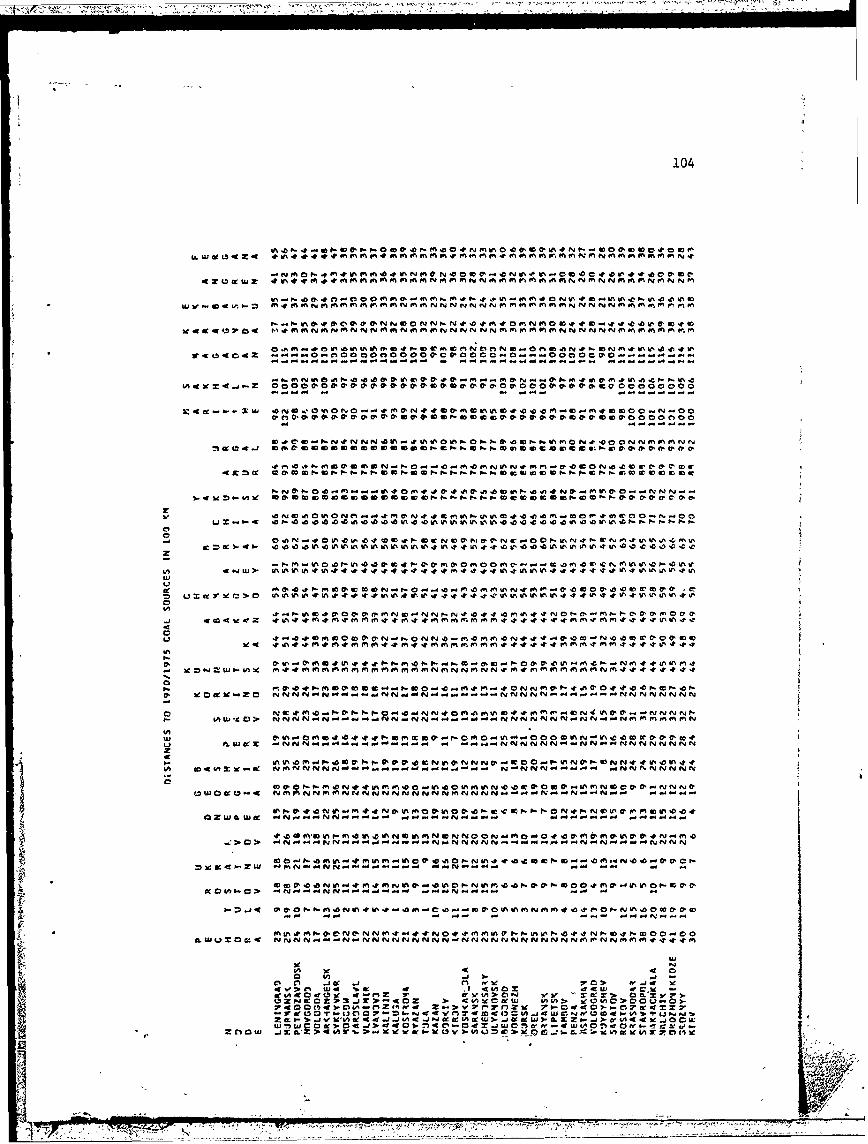
104
I%. 4S 0 a- P . 0 o .en 000 ly n kf% 0 a, 4D 0.1 PA)I- *00. 0 .L'&0 CO
-4N f m4001m 0% 4 m m nNr f N 0 N0% f e O 4 m. o0%N1 m mtvff t 00 ' v0'
41% - 00. 0,. n 0 0 0 0% f" 0., -0 M on 0*n - &k .. 41% - 0% m 0 N V 't .0 ~U 0P.4'0. 1
N.N~~~~~~~ ~~~ M%.0. %~ 0.N 0 N N 4 .0 0N 0 . V 0 a0..0440 .0
0 . .% &~ &0 1 .0 1 N1 W1 0 . N ft P . .4 N # 0 N M W 0 W f m M 0 N0 0~ ' a W vO0 1 I D 100
.9-- - -- -- - - - - - - - -
~~0.0j-Z 0 a. 0 a- a-0 0.010O 0000000
0.0 0' .A 000'0 .O0 00C 0 0 0 N n m- CP N 4., M 0' f . 00 VM# 0' 0 0 ' a.0 CC 0 ! ft00 : 0 0
S-XNN9 0P_40 04 nNN.00 00O OV% " ov.06 ONNOOONN
C 0CUCN0.~400N0MOlt.MW0CSC'0' O ft
WZ5 V%5- C C C C
.0NS.0041%0N044-~mm MON r0. C P 4 C 0 % -0LJ..4444444004 4 4 ----
0 "0&a %-mzp
=- e
b4.4%0 . t.t4. *40 0, Q, m N ,% o N t N0tV..t1 NU0 - 00 'e4 #
4 nm c 0~~' * 0 t . .f 0 mVN0 v ap U '.t % 14 c,
4. Zo - - - -
:1 a- W . '0 n LT:7.
cz 4 W 0 Inv>Sfg.NWv 40 40040*.0-4040CN400Cw0'0.>
~~~~Ftvr t.0 0 ~ . . e 0 . . 400 0E J. m..3r o 70 t a 1 9 ,m . .a.I A e3 fc4J C NWzoC U> ., .
0.W 0 g 0. C*.04 -4-44- a s-.401 1 .6 W ICN Z If 0~1~NW-44 5 L" 0NO N 0 0 00 0 . 0 I?0 .1.1 04Wru> wi 0b. 3v3 AL)mc"UNm z% .0 O 0.5 4.t.CL0 NM . .4 0'..4.0 S-
0'~~~~~7 -%-~'Z -7NN N N N N .~ N N N

105
6 0 . '0-a 'N0 z0 WV It NM N__W el WM .0 ZW .-Mn DC -. 0.00 W W m 0- a, mo m9 0N
a N -eel C 0 ;! VA .- f3 W - a0 Nf - IA I MO fl. N a~ 0.0 NO a -OZ: V_ DW' ft Do- - N
I." - C - .'b M. 0. M NV% N c' v ft P- N P.-N 04- W9 MA 10.0 fN 0 0 fN C'E KAN N MA m 0'I
V-r - x
.0 - 14.3NO I.0 A O 0 0.IA N N I .. Na v C - 0' 0940 A. C~ P*I rl' m00.
a-a 1 l . - a,0C0 a0 .a,,a- 0 . yV.V&- -v1 CV c P
m VM W MW I-NIIA6' . m IAN V% ft m 0 N 'D M N P~. . z Ir 0 W z .OI.0-c Be C c a '0 W 0. 0 v &.9- a,40'0 V. V, &0'00.'00V .c r& 0'0 W V0'0 mC. 0
< )c m vi - zI'- tN ft, .' N.0 O..IA0 m Nz mm.Im.N.00.0NM M 'OI a &N..MOC 0, M . N
D, v & 0060y, o- . 0 . 0 00cp .o.'00,Lo.v .o. oC . & . . . 00 06E .. 0N
NA 0.n a ftp N 01 0 m mAN C.0N1- 0 0 WM v.0NIc. IP.p'OOW0M N W IA0W 0
IA N 0.N V0%C 10'D ON M9 N 1 0 .0 0 N 'r- C 01 N W. IA U0 P 0 0 M C' A N N M9 0 W' Z C
v % C EC 01 M IAEp-0 ft N .0Iu%.W.N0 0 0 v .0.a.M0 m t-4VN l ENNzaa N
CA. 0. W A. V% C IV, 4 IA -6 U%.N I .0 N IA .0 ;A. 0' N m t- N ;. -- . Nz9
N t cb c V N A A AM if% W W UN W% U% m N..N60% .o N WW . UN W ' .%r. V% 0OIAIWWAW.4OI 0 M
1 Vmvf001& - r, CM-~ vvN NNOAPNA N IIIIIIII NNNIANNNr NNIANNmNNN.IANNI 0A 03e. rWU %4 WU O N00 0I C0 V% fN .VI % VU% V VI VVI WW W NN I V%0 V% 4 4W bIA WoW fi N
LAu 9D mr mg NN N N t" W Mn" (o ~NNNmmNN NI N N NN A N NN N I NNNNNyNN4 - -
U, 4 491% M1 %'0C& %. .u * .WE NMIINNANINAAIINNPNNNNNNNNNNNN -
N N N N NNf p v NN--- - - - -N N N - NNN N
... ~NE.4 N 49 N N6MAN N IA N N *E IA m M 4 0. N 0.IA -00 O NAI
W ~ -K4 4-Zl MM -P. 0N V%N a 0O 9 -a ~4 .9 -M- 9N a-MnNN a
------- - -- - ----- - --- -N N -
COIANC> .6 MI-0.OAU0A0 EIN0 UNN N 00.C4 0 .0 a-0.0 C0.N_ a WM
- - N -N-- - - -- - - -- - - - - 4 - - - N-
e.Mj40.IA.IA. vm.OIv~aCNP..EN0O..E.0N.0ANNZ6.0C...00..IAA
IA
M -- 0
b.J U &AZI -V) 4 3,' ?O ~72~~ VA7 0A 1. M IL.2~. ~'O E f' IW w me-- & WZ~~. w,0 0.~.Z tg~r frI'LACA..,
0W~~~ -44 -_c.aw~~ %f 77NWC'-w -)CA 0 .w ~ L W Pb Now 4^'..j W 0V 7 1g- W W . iJ W"'w '2'WC KwC r
X0mf=&O .'. m lL.JC

106
OL U) af t4ot atI I, a NM 0y in n ~ Cl f, I .- %A - t IA 0 4 ? V% a. . a- UN -4 W% ul
M 2 CY)WWY t nNNNINA4 VIIMIA opN0OVVlf ONNNNN. NN .. " lA
54~~~4~~~~ 6. 4 po - W% & 6-4one 4M. IA 44 N 4...Nc 4 IMI00m2::EAN 'A -%-f NI%:4 Z2.N. ly -. I-I-e-JMeE
M 4P : Z 0-t ~ ~ Ift d4~f4f5 1'-N.. 10SM M00P -MM9 f- f
M M 4- a- - *a-ce1
wwt--P.44Vloo44N N M -Ia a pft F I-- a a . c
w~~~~~~~~~~~~ w -p %0N- , l .
4 It 4AII4f NN 5 NC 4 444104#00
01,0 VO P- 4 0 N. AAI 0 : N P-.6 0'- N V4 W 10 1-0 CFI 4 .0* 00
3. 4 9P. vO UlmAJ~P.. N MM- Ms #-4 a' -% o P-PP in'c sf-C C'0 ot P-.N4 a # 09 % N44z44I**Ia-AP4IA4m:-IAI I 4IA4% C iIA4S f-N
0 uA T.0 44 *. S0 40 ' f'JC#.t.*.M.MOIAIMN.0I0n( 01 P. In. P. P It-ACD0 #- V NN *4 A 40 a 0 N VP c 0 M, Cp'a
d25d .- 0-W~ *MO MMN N - r y MM v t&r - & *I I * I~ I^ M ^ M % r r M 1 a (W
a0. ''A 4 N- . V fAc M0 M - -0 w 0v M MnMO0 -a04C
Lu
V) 40 M4 NNNN N Vw .N1 NI I .0 M M MN~ N N * M
z b~Z P-El V) N N 0 -N 14 W'NIMA N - -N-.-.-.t4NN4
u ~ 0~.4IA~NPNIAAIA N4.0..NNI~MU NI~-0N Np0NMlt4N"MCL L lez t4WP aMI- NIAC W 'IN 4. wfCNS4 owo N w W_6 t- Z'..N N.N IINNIA
0 I nA-
Ln u0 AS IA ' N S S J O .4 r, 'C*OC , rt .. A NSJ O C"0' CN NPZ- 5 N5.... NIWwN4NI
- 64~ S - -N NNNMMN'-1 M1~NN I N NIrI M
C t~0EC...E NIA 4IA0 C'C4IAIIAI.46A0.I N 4 *N*N O..dIA0ONO0he
19 cc -- -9 1 f,.-N ~ ~ ~ ~ ~ ~ ~ ~ ~ ~ s >.O N0 A4 C' 0 30 ac4C C 4 N ' A '.l '* A @ * 'I I N M . .. S
4 of,;-w :. z . ca 9A lC9woLJ NIIAAA9 Z Z = IA4 2 0 O -> - NC Ne I W - we 044 *wAAIIA.t
3... 9,A- I- W Oc - OLj 4-c --3z OC1 010-l=r 4
~~g 4 - 2 u jwW~ b xSI C N P - N P N C .. A xC I'' 0 A N.'AA IA 4 * 0
NNNNPJIAIA44xww iwIA 4*l4w'C'.5 N 50NN AI I I *I * NA M4= eV, 0w vl3-.bw3-r *4 CpN ' N PP N N ' 4 Sa o cZ C o N.lei- ie 0IA4 .9 - L.L'N
APPENDIX B
DISTANCES TO OIL SOURCES
I
itt I" -

____ ____ ____ ____ ___ ____ -17
108
to" fM"W Mtn4.MN to"I M N N NN N N N N N NN N
bc i o 'tfn n 0 's f" " AZ 0 ' -a A A %0O F.
u. w CC0WZ W rIA44 It# m- ee ffen .? m M en MeNM MN4
wZ.840 C a0 eNNNNNNNNNNNNN N N NN N N
x N9 Z 00 W0.8U m. a0. It N wn 0n P.Ue0 4-.O ~-N 0 a O -. 0 en N N m t m N. mt
le4 mwf~rn f"ne eNNNNNNNNNNNN N4...I.NNNNM J N
.0 mom W0.0.' .. Ot. N4NrAW- enN0. O..0 M4. -M Me N W
>0.WZCood .efN NN. . -- -a -- - -.-. -
cc g f 0 N- N -- - -de..... -- -NN -N -
mo P-p c C 0 0(
o <0=hctflw. -NN-4.44N - ~ .. -4 - -~- --
b- -% a: V .. N - - - - .- - - - - - - - - - -- - - -.. -
f"o wo 1e.0 laWOW ao0NN.D- PO. M~N.400- 0 &NNW NN-OO Q0
La 4..C N~~4....4. . ..
*~~~~~~~~~~~~ 0 C.uLI4 eN~ nnNNNNNNNN.-.
39 a .949 j 11 Of v 2 0 8N.O -. o N.. -4P
0NZ~~~~~~~~~.~~ #ANe m N N N -4- N ---. ~~...44 -
.4 dQ0C O NQ @ Z~ 0t z K JA21 aNOIti,..4.OC.0 WUm~ nn N ~ N N N NN N.~4 N.-.. --- -93 C
0 . wLvAw t A . w0G :.. 0
0 0 .J i. 0f 0c W.. & ~ J r -1*w0 9491
w~2N0w3-Io.5K-0 .I~w J&Z0 r 9%(0 0 2.oz o 4 ~o z o

109
0 00000 N 0 0IION 0 N 0 0 N 4cc
N mN NmqNNNNNNNN NN -NM-N N
InN 1 -In1-0 1 mI~O ~N I 0 ~ N N"
oww mz- -N" N- NN N~YN N M4 r -N
ILu NNNNNnN"- NMNNNNNNN NNNNN..NNN.4~NNNN NNN
m.iUIn N% o0 InCInN4,C
0NNNN-I N -- -
Ou J- S419-NNN"NN--N"NNNNNNN NN NNNNNNNNN'N -
C
c- NNNMNNNN .. e NNN M N N NN NNNNNMNNNNNN"
ibe
00
I.. 4A 0
04i Xz I& 0 O O M - n
7 -7
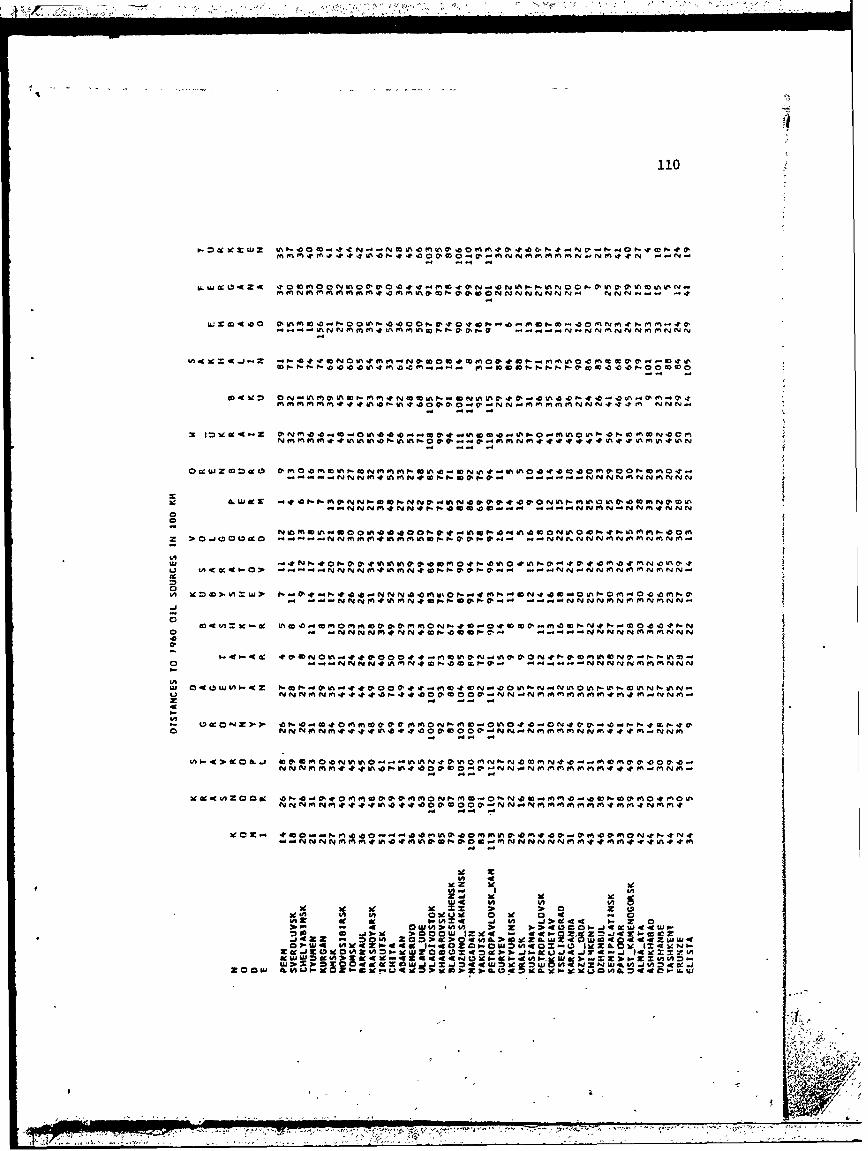
110
m~~~ ~ ~ ~ "N fn r- r -rI 00 enNNMMM rN - N
_NNNNNNN NmNN-mMNN
N~ ~ m n n P- -.7 ----- N M f~ m N
p- P. t'- P. O.E u% IA U M Oz MA -.00 - .. - .- . a I-. . P. .P- U%* w t WZ 4 IA p- IA 0
N P mm Na i - - .. 0 y .- 0U,40f 7aL
NNN 4NNP~feO e- .. 44.NNMN-N m..NNN
N Q M aOV~. .0 w00 04 4A .I.@ N Lft 0 10 F * P. V mm f- .ooz OJO W (A -#~ - -- N m *I M m ,g -. . P, V...4 .. 4-N C% C .tyM NVrn m N . y
CA
U -C w 4 0.N'N m4AI-0-'.-- ...... N4N mmpm N
N -.- N N M 4 UfImN4 P. 0M0'- 0- - -. 44.- N -mtIN-N
t-. -NNwffeN e -.-w.-- - .4.- - NN N"M MMNN
LA
U ~ ~ ~ ~ ~ ~ CZ NmN..',,'O00.N.N mMMMMMM *Mt M.NNM.4
N N M M -T4,tV% 0W 4%0 01 0 0' PA N MM M N M t,# M NN N ~N M .t ',,* P A.tO0 00WO0 4 N N.- N MM M M MN M.m# W
49
3e n in~.frru 0 u W O0 w 0 w 0mm m~m1. 0 4. 1 .4 o 9.
-. 4N N~m m~taw fi002.100.4 N N N ~ 41In >IA4
1~ ~ .= -. 00.0lx.2
0 ~ ~ ~ o)X m~ gumI~4 - .I-Z~~JK-
PTOZ - I Z 0g4A.0~ow~W 0 44Z W

W Z Pe . 2 6MI mwmImm MINNNM IN N N N N N- . N N
L.w614f Z61v dU A NM MM M m INI N I N I M N
0W9XCW.IA-a 0' a of-c".0 oweNN .t 4MI "IMIN- .a I0NIM, CIANM
~WZ 0N '. MfyM N I N N I NN N N N N NN NN - -Nm#AmM@M
WI1NO A MN NNN NN NNNm.N.Cy....4 - N
eI 0' IA * y ey MIf 'e66~ 'N -I NNI N tw-II M I NNE N .6 10 N ry N NCU
tn a i7 C0 NMIMI NNNN NN.N NNNN NMIM IMIM MIM
- I0. 1A. j0A IIM A.W-.~0 . IC N0* M tNNI 'me ~ e MIrMM M M N N N N N N N NN..N N N .N...-
LnI-Cew4- . NNNN- -N . . E N N N . ' . . 4 . . . . .NNN- ---------
0
N - N 40 . - - C -UN m low 4- -- - -0-.- 'a---
W
M 6WZ61U61t -MNNI'......'..
N- W 01 10 f. .ON t- N N ' N 0 N O 01 -r ?- W1 fn 0 I %t P-. MI AI N M.. N- CI MI 0* M N
o - - - - - - -- -N-N---.- -- - - - - -
- .0~N NNNMMN00NNNNN o1INACC'60C4N4-yNNIyMN
0-r~.0 0.. 0 .4P-.N 4 d4 -UN # Or N- 0 1 rMf
NM-
*~y NNNNNM6 NN4 .'fy . . NN
NL3eA0 N0 01tNN O O0. 4M 0 r A 1N ICINN660 '0 .0
C CNC N .. 4 .. -. 4..--. .
6161~r :l-N.. It-610..A 6 O .'C OO I 6. C N~ 6...tI\604t~~WIAI-ot %MN N IINN N N N N 3f -9
g4IA006 NM 0 NNM N N.4.*
P00' U a IOIt1,- .0 61AA1AO1A6N0PN.0 flQON1N4AA IA
ZOMw

112
zw~ex -r fE None OP. % m m' m N Cv'f N N -4 NM NO N ft N "m. m0. My mN m N0 0 N - n IV
I- Inc c- aME MMM MI-MNNNNNN NNNNNN M -r
U.@ W W CN -W =. .9 N M #AC~ V% IA N W 4 - A0 0 .. -O NNN
I.W~ Z a r W EA EEV'm, .E ZEN E II E E E E E. m EEa. EN.EgoE MW
~NWZN0PNNMNNNN NYNNN M N N N N N N M Pey
W~ OEP-OF-in NNMNMNNN NNNNNNNN N N N N-NN .
MorI- 0'NmmpN0- 0 p. mI N.0 OMNE~C'. 40" ME NO II 0 0 0 0 A-m M
go -C --- Z) -NM M M ey - tv N Z- N" - ---- -- - - -- ------ N
Lu 1:) le or Z 0 N OmIAmE0 m N I. N - NMNN p-m 0 4OzIW.%0 cM
=cxzd -- N NIINN N~ .NNAJNvN...MNN
-Wz = N N N N NNN - ee - y N -N NN
S IL y y4Z Nf -- N1 mNM .N4 '-in. NNNNN N N N
0 ly
0~~~~~~ m- O.NM0 Q0 PONW .W00v .OV 0 m 'D Nt A* W 0 000IE
.W CYN NN NNN NNNNNN N-NNNNNNNNNN NNNNN -N
IAZI
00N- zi
0 ~ ~ ~ ~ ~ ~ ~ ~ ~~w M0NiI00OOIAO0. 'AA-0n-.b~MN~-~u w W4I0 N N -jN N
04 W0 12 20 " O ).90C e b 1 e0
N~~~~~~ NM O ME E OE N NI 000Ci &EEIA.0..OOaC-00ZW 0NxN N WN>NN N NcN N N N N N N N N N....NzxWL=
L4 W p =ln; x x 0;uJ C1 0.70W~- VNNNNU N wn&..NN NNNNNNN. N CNNN N..

113
&-=acbeVWX- b " 0 40 -twd0 Nd @ N ~ d~ o to
LU. c~cZ 0.MNMMey mM MM t m~w% DP- , ONc NNN(NN N.' fy f NNyyfj
NNN MNM~m W% C U%4 rm a0cc .. fNNNNmNftNN Nf
0~ % m.0- N00u" .. .00 Ic ofv * ed -0r pwi. 0 P 0 M t
M Wj -7.W g-4 r4: O %A#M M7 0= 1am!& -@*mmn Om w & 9-r
. P M d @ .-. P.--fiC - .0.. am I 0Nu O [email protected] 0Ne
O.Czi..JWVNo -... NC N N .iiPN N. NwMMN.NM rvnmm
4.N.C@ 0.0@! *rU #VT*Z& f N@MID M = =: J 4=- g4.NC2 00 o Viu',of~iE~tNNM M.-..f.rndgoM .00Pm0@ aN ym . NF "M mmm
dd~m.0Nr.CMeM-MMW &N Cfnd # N N
NN 4N ~ plo w N--- - - N MY M r,
u M OWU 4.-.7 M~nIo of" IA.0 0-NMui'IAM Cow c;:CM-r, -V . dN..MP~r 0. .0-
W U. cc -- r.m&NNP % -w%
O NNNM NNdC0owo w ----N M"CM m"""
n- .. WKIf. p- ' %0F %P-NNN 4 in M N P . 0 - . v O y N NN N f" rym r N
4Aw
-NNNMCU4NN4ifN1mOe Nt NNNNMNNM N V
6-At c 0.L 0f d0 N n 4 .NN0. a NNa 4 M0@ @. W% N0N4r aMW %
O~v~f N.M~AMO~d 30O dLiN W .fO l 0Nd AM-MN nC
Jt~OtNPf MW44 MMWIMN"tmN -t N N N N N N f,
0 of aA04 %M0NfM n f- yo
& lo- N 0 mI fl t ag,*.0m .&mn~-M.tN0C dI NO C. N mi ow,-v iff'0 y ty ty fn . tN 0r 0 f4I M*~ mN O@ M.*. M on It P onM 4r
IA Iin~ ~~ ~ se~i .r
Im-.o0C.mnNmn@NNwvU0-NNA--~~~u -- N N fM C . .m N@ 6n IA %A 0'MNN
W 1 e2Ow-C2 4 N W*@u.C@O .*.mCmN.NVONin uN
zN M M C CO C deomoo- .9.N M 0..N fl
tJ D,4A40 > 3- . C. 0 e0eN N w w4.. .. Oc @ .9 U3 $doMN CC C 20CC o@UOO@-C -.. DNMMNNMCCCM&.NN
Ifle-4~'ifCB.. MO0IA % 2dtO N .C fN .~iM ~ ~ 0~.
CC~~~m.0~~ t3OO0 @. -3 NMC3 liim mrn- n M-
ow "g 19' .- . %cV w V
atWObc p V- Mi:> dc. 3d L c

114
.0 m.0. m~'h'~pp.8 0'0. . :! !tNI.
w rA a' 4 P- -- -P- 9% Nm NNM ftN 0y N8.80U .U m U A.*00 8m -C
W V . 8 N O; M -M P-i N m N p N N N N *.0 . n N
0'00 0 m I .t M.0.' 0'0'W.aW 000'' m0a .0 000 00
n~8.rPV' Np pm NN NNN"NN N p mNNN NNN-.N N NPY
N N .~.0VIImNNNNNNNN...NNN . " N N
U) I K~g- .. N4NN.--- -NN N fw N..* N NN NNNNNNN
Nm 2..dc z 1Ny - - -.4 -N --
LU
0.w4 ' V) - -4N-..-4 -n- - -- - - 4.-NN M
II.
C- S0 NU'Jo g4wo
w') C Joo0 .Nd..w.s4. - - - .

115
P- ~ ~ ~ ~ M NN NN f NN ftMfV. M NN f N N N N N N NN,4ff4-N
$A 0 : ill N M #1- 0 v ti NM 6 'A 0 0C W I V% 0 aI4--~ ' I ' N M 1& P 0P a
oZ C I F- V% mM MNNN 'j0%pM piMMMNNNMNNNNN M4MVM .I
cwv, NI 0.-4 w lot* NO'm 4... :;-. C M N NP N 0 # ICWVCWNONIAN N P NM N NN N N NNN NN MN..N NNN~N
N N ey fl-.
MNWVM e 'tNOaa o uw
be. in *4"IV NJN
gwoz.tN4.Z V-o-O O c (C M44. MIP-M 41 V~o 4 cql &Vt-D w NPVQ 4- WNNN
01-NN N.. I'JNN
~0X~I- NNNNNN NMNNNNNNNN.NNNNNN4N-.
z OUd UC( 0 9 N ON ;; NNN "NNN..NNNN.4 N.1I
ftI~X N N NN N.IN N NN N NJNNNNNNNNN C.J4NN --- yN
-MM
IA ~.JOt3S0 .. 4N.N..4N.44.4IN.4.4N ..... ....-. 44~....-4 ..6M
4 w~~C~~-~~iZ~ ZOO se ocI4 N NN N N N.- N .44.zIAwx jM0 1 . -Je -6- >30u ub )r2 n001 .- T0c
:3E-77 14N.N N N N N NN. N N N. - -0'CIA 0.4~I CQN.0~.A.A A~b~J .A7p C.477-777,Pe.NNA'

-77
116
6- I 31 xw z V -404. .0U(V N UV%- Mb% - I 0 *P- - -
ry N N EU~~ tNNNvNIMNaNNNE NN
*NN .8%. . M. 4. M U P U.0 0 0 40 a m c
mmNmmm m NM p*0U41 -O ..rNN 0N 'D F- um a, M MN -. Ue cl) ~ NN
u44KI.Jg,.w WIMID ... N .m4N 8 4 . NM N N - MM N M f
.4 ~N N 8 8 O~ ' P444. N @N C , a8 UN 0 V.f4 N N r -c .4i @0 . 0 U N .8 N NM m t N f
4fl-2-Z- - -4 N .N MEvN . f- c 0,.1.. ..... NNNN.4NN*MNN
tnC ,(9r41 p -ma N NN M04 U. w N a14. UN zQ0., .. ,8W4C.P m%0 V 0 z N m p M 0-- - NM - 14NN.
m- O -- c 0 - P-a , tf
KQ M Mt Nt - -- W - - - NN N ~ N
b- 4O~ 1 M.C %c %v P 'wmv , N- .. NNNNww MN wt.8U0 , WMNCNMt-Ma,
oWU~2:::t" 0
~.0.IL~04b~ NNMM4I4MMMNN00'N0... ... N NNN MNMM MNA
N e e AU,- n1
t14484N0~m N NP 41M 4 NO0 .. !p 0 MZ (3 N..
0A W I )h b , 0 I4fk X0- A2 J 41 _.N..O4N,08IO 4n -j :0 me 0W4N Ob- a
. ~ ~ ~ W, 0u 0: .. 4. NN 4 4 N U 0 'N .2wNN NM NM N
2 ~ ~ ~ ~ ~ ~ ~ > M U .43C -4N N 4 N U .0 U O W.- .44NNMS
0 0 n4 2
700wwCLOW$- voN. .'O M- E .0 -N.4NNwe3- .ILU-C4D UL1N1- V NUJ 0 '& =We Oo
.N M M 4 0 - * 8 0 O 0 .. . . . . . .. N. .

4I
I
APPENDIX C
DISTANCES TO GAS SOURCES
4
117
-. 7,77

118
C
kn - -fN -N NN N - - -N IVf .vevf
pv LV = ! =!wN4tZ-
uj 0ol~vlz tp =~ f-cMF !-p c - N NOW, w NN...N..
''NI f, NVYr Nmo
r C
61 LNNNN-N -
K ae
Cw <C :p vN N .i N N Jv% Wft W WIVtw>. V)fcW w4c0
le 0-3e 4-, 3,lcmgL 6Aw 'A 0 3ci-4 .

119
V, of Cy 0 w C O C 0 0 .0 a- a. 4 0 .0 N1 In r PN ft -V ft r fy 0 .4 C 0
M~.Nd IC IN C n 00-Nt P 60 C t V~
CYe
N NNg Nml fy( mM0
WK NNCN - - - - - - - - - NNNMN"N
LA -W cc -C > N - - - - - - N N- - N V
P- 39 0In > ~ N -M N N N ty y e NNNN -n In
N N4 N4KM fn.v -top -- f --. 4r-. O pNNNNIVgo. NNNNN-:*
~~ NN~N NN "MNN........NN NN
&'- 9 CA z J rPN NN.-...- - N .-. eiNN --.. NMN
~K~'~CC ... N -. - - -'N .-- -- N
ih 1P- V% w O4 0 P-~E N#N 0NfN P 0* .0 'N N a.
.J ,.Q.w c -AK " Luwo
C 3. 0 WCJ~ W1 040w x K4 3e 0 0 4W 0f 21wc0- -0 n nz00w 2
gC4~ 4-C Z ~ C' g ~ M~ CgZ) P.ITT 4d

120
-= -9 u A mW ~ W w fi m m~ N 0mm -N A.DN N . M N~m MW IA-UIA IA try, NN I
4 wj4 mul WIrWW f W ftrf,
OW44.J * MvWNN.....N -f* W M M% W yr
Z ~ ~ ~ N IA se OA IA Np -P- M 0 0% A N N 0- 4 0- Z M 0 fm b 6- V% N N 0- C -* W 0 WN.0 V N 9% C~
- - NfNMN NIMM WV% WWI
MA NI0.0 fft M - v - V, M4 MAI C ft b W. % V. N mM t- aO W O 0- 4D .0 W -0 ;A tN 0 U%Lm aN-- - - - - - - NNMMM Vb, IV
10- e5 NM IAAMNNNNMNMN NNNftft ww .MN~M .. WW0.0.J.0
cc~U~ NMM mm MNN"MN NMMMNNNAN N....m m W 0
IA OtNm NNNNNN NN...N..NNNNN-N..NI:I
wA .- MI0 MM NN NN-NN" "..NNNN ..NN fnyN nn It n IA
0 MIMNNNNN..NNNNNNNNNNNN N NMN..NNP U% 1 0 V b
- fIy- N- - - NNNNNI NNNNN NNNNI NM - n blVIIA
31 L
2 sc4z be-4 6mIN N NN A N . N NN N N A I a,- .p .
L4! &
IA I 20-0 z 0 0' V. v 0 .IA0 r r w wA N N j . VA. wA IA N x. :0.0 . 3 : r 0c Nc =0 2
wM -00 &= =.. IN
IA MNNZN- O 0MI .. ~', 0Imp If. s.N - 8N&LO; w... g C D4.4. f 4u::~ &i N.NNIANAAIII .It
MO'C .C - *.*M S0 'Mf NN0'* 0 A...50I ANI A0

121
& Z.00O C-ON 000N MC N e m rvv& 00 N
N GQ fm 0 O NN- No N so 0- P- (1 0 N. rc , 0. ~ C S ft. ~ sVs ~ ~N 0 0 m N
10 -c 0 00 ' N v ty N tv Ny ty e N tv .c AC i " ey M v r - 0i j y f" on m mS mS 0v e fn m~ m% r
10 i'C PS% fft m% N m% m% m t N C 0 Ny ty - y - v fv. Z 11 W CUSP * C a V, N 0 ;; -N ZO
2E0)-X PS0%M%0NYN 0 0NN Nw.C CCC CC C C C C
>.5
0%NVS no.OVSMO.C AU'U' t 0 s U' V O C ' aV s'0NZO0'' Vl CC0 MWA
.04 4)- 0%0%N % NN N0% Mo e 0% 0% N N K O-v Nl NO -g o VN0 ' %0 N0 %0 %0 ' N# C VIC % C
U~~Zt5C ~ a 0% N% N N NN N3.. VIC% O= = 000%IC CC%0%C0%a
O~~~~N WCU' %' C0 . C N % C dC SCC N0 %0t N mN 0Cm S-. &0:1- N
o LL. ImuirC 2 -
CawUS4: C N-- -- - - - - N -- - - -NN .4 NN -- .-
wu
0C~~~~~~~~ 0% P0 N N N N N % M 0 N m NN NNN ........ N- NM fn f.
4
a. U a A W t N NN NN N...NNNN0 P N % t
M Cz 0IMNI- LA MO) -- 0 o- N P. C N
w
49 6S -K N .' -: N - -- NP'0NWNNNNN
tNzV 0. A U U .. C.0~r0''N 0 .C ' O % % 0tN V
oft*I- M-'LAOU' P%*Z !Z0 00NMOP lo aN0Ng%~ .&% I.. 00%NCNC -- - N. -... NNN NNNN NNNN
CN0 ....'OC U.4 Vs N~s C0 N*0NC ON 0W . 'C. N0P ''5)40942)-)-~. b ... N N N
cl w m- x N r3 !W 31 q9 &I le U' ~ l woz 0C'0UV CN-NN 0N0 '00 C U S O
'a t- -, UI
-0 = W n -c w 0) n .4 e- = -cm
x 2e )- z :1. 0 4 w ..J w wA bJ.s W 0b 0 . 4w 0 . P .3)- wt IA C 4 w V. X 0 V A % J UJ 3e
w77

F' F,77 7, --- ,
122
me W 2U do m 19 tv Ny t m fnNeyN f .yN.t t y fy-4N N ... V4 -0 - onnm mN M
~ r c~ ~c~fn I& rn &t Itenn It~ e mn m et Mn N N Ifn f" Mn m N NM enfil en e N fnMe n N NM N N
f-0 N M 0f us N - M N M N f nNI 0 t ~N*- M 00 PI. -00 n0
~*4ZNNMM MMM NeNNNNNNNNNNNNNNNMN NMenNNNNN NNNNN.N
-C L3-C 3 f n nm MMPN-. N NM ^.00000.0UNMeNO ANN NN e .
Nn 'c -w c0 J, N " .0 o "% N on "t N m mt m on f1 0% on fn o 0n n in - .. --0 -t -. 0
U41J4) enME ~...nenne * Mmmmennnnnnnnnn ff%..4 .... t'j- -N.4# .
CC-
u:o 93 1 yM N N M NE-44-- mmmm .4 .4N-NNNe mu"Dn
w it ZN MMMM~NNNNMNNNNNNN-...NNN NNeN N mt M Mt M MIA
LMKCC. .-W0UK NN~ N nN - -N-e-NN - -n - -NNNN N - - - - - - - M"Ne
mN VJ~D~ 14 VNN N N ~ 4 4 N .. N4NZ...4m.NNm.-....Nv r f-N.:CCNN
0 N 14, -O ~N NNNN N4.'.I.... 4N .Nn~
War FM0)IfZ -NN enNNNNNN--'-4M-.MN~N..-NN NMM M %V f
z 4
oEIZ- -N 9enen ZenMNNNNNMNNNNNNoNNNNNNN c N- w;'4c'-NIx
W be-0tee6 >wao n 00 jMNVI.0 K*M0U0V.ffINIAt6.4a.-9eO I .0-N-0Z Z0r - Wo %44nnnNNNN.. ty NNNNNNNW C. W usNN wz..4NM..4eveni'e
0Nen.C.~en O00enUen.N.00en 0 x w W r W CK W W 9 . 0 oe
V. 0e0 0 fm AI2 0 X20 NMNOII * NNU. N00.ONO.N U #400=wI4.0A..J -- I- 4e~..4.. SOW- NlC%3P NNMK enOZ nenL enW e.C9 -n
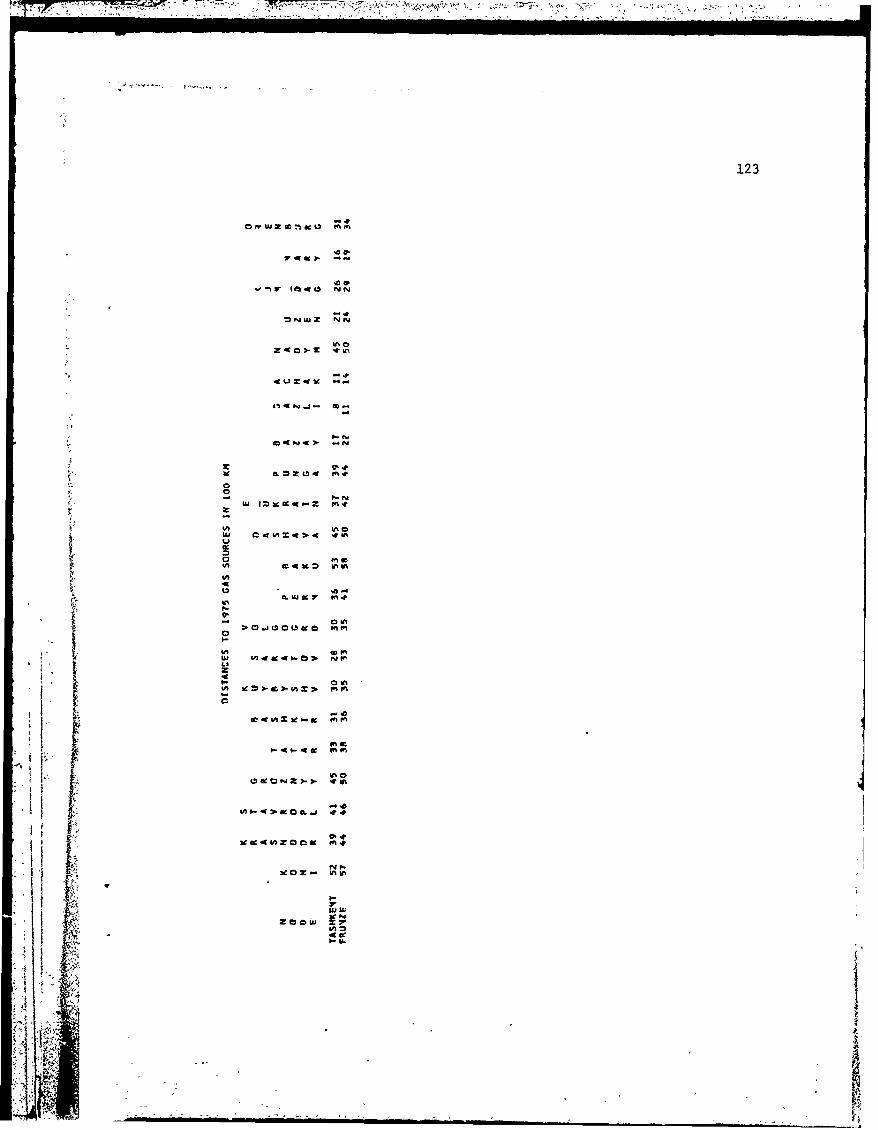
123
low
cli .N N
tvIjZ N
z 0-C M.
Wk0
00
U, U0
W4AWWm
oI41. 4 a I"
Vp
me4
no .....

APPENDIX D
COAL, OIL, AND NATURALJ GAS POTENTIAL INDICES BASED ON
DISTANCE AND TRANSPORT COSTS
lZ4

125
COAL, OIL, AND GAS POTE4TIAL 1N0iCFS BASSO CN OISTA'CE
'JODE C:6*3 OP60 GP60 CP7O 0:70 GP7O CP75 0P75 GP75
LENINGRAD 17 1I 2 t8 25 11 19 32 t4MURMANSK 11 7 0 12 17 0 13 22 0PETRGZAVODSK 19 1O 0 16 23 0 17 29 0NOVGOROD lq it 3 1) 27 L2 20 33 16VOLOGODA 20 14 0 2. 33 12 22 41 17ARKHANGELSK 14 to 0 16 23 0 17 29 0
SYKTYVKAR 15 10 0 17 26 9 1q 35 151OSCOIA 30 17 4 31 38- 17 31 47 21YAROSLAVL 22 16 0 23 37 13 24 46 i8VLADIMIR 23 20 0 25 44 15 26 52 19IVANOVO 21 18 0 23 41 14 23 49 19KALININ 23 15 3 24 34 14 25 41 19KALUGA 38 15 4 37 35 17 37 43 21KOSTROMA 21 16 0 i2 37 13 23 46 isRYAZAN 28 18 4 30 40 15 31 48 20TULA 41 16 4 40 37 19 40 44 23KAZAN 20 53 3 22 113 13 23 126 19GORKIY 21 24 3 22 53 14 23 63 19KIROV 19 17 0 21 41 0 22 53 0YOSHKAR-OLA 19 33 0 21 71 12 22 83 18SAqANSK 23 26 3 25 54 12 26 64 19CHEBVKSARY 21 34 3 23 72 13 24 63 19'JLYAIOVSK 21 47 0 23 96 0 25 108 0IELGOROO 46 13 8 50 37 40 51 43 50VCRONEZIA 36 16 6 39 38 27 40 45 33KURSK 37 14 5 40 36 25 41 43 30
O;lEL 34 14 4 36 35 21 36 42 26RAYANS$ 31 14 4 33 34 19 34 42 24LIPETSK 35 17 0 37 39 20 37 46 25TAMOV 31 20 0 33 44 14 33 52 18oENZA 25 28 4 27 58 14 28 67 21ASTRAKHAN 21 L9 0 25 43 1 26 49 1
VfLGOGRAD 36 22 4 39 46 1 40 53 21KUYBYSHEV 22 72 1 24 139 14 26 154 26SARATOV 25 37 7 27 69 18 28 79 26QOSTOV 98 16 12 104 36 55 105 40 42KLASNOOAR 33 23 1o 36 39 46 37 44 32STAVRnPOL 33 16 13 36 34- .40 37 38 36'AKHACHKALA 20 20 0. 22 51 2 23 4q I-IALCHIK 24 18 0 26 45 21 27 44 22GROZHONIKIOZE 24 20 5 26 60 22 27 51 24IGJZNYY 22 22 5 24 65 22 25 56 23
KIEV 30 11 3 33 34 25 34 41 30ZAPOPDOZHYE 55 12 0 60 30 29 61 35 36KHARKOV 56 14 14 62 37 70 62 44 87LVCV 21 12 8 29 25 25 31 29 23KISHIAJEV 21 9 0 23 22 14 24 26 isTALLIN 15 9 2 ,17 22 9 17 28 13QIGA 16 10 0 18 23 8 19 29 12VILNIUS 18 to 0 20 24 10 21 30 14
KALI INGRAZ. 15 9 0 17 .20 0 18 26 0SMOLE14SK 24 13 0 26 31 16 27 39 20
PSKOV 17 11 0 1q 25 0 20 32 0414SK 21 11 2 23 28 10 24 35 17TBILISI 17 14 1 19 27 16 23 31 19BAKU 16 36. 7 18 58 16 1,) 58 24
RT7-7

126
COIL# OIL, AND GAS D'TENTIAL INDICES BASED ON OISTANCE
NODE C060 OP60 GP60 CP7O OP70 GP7O CP75 OP?5 GP75
YER EVAN 14 11 1 15 23 12 16 27 15LUTSK 21 10 0 26 24 15 27 29 16q0VNO 22 10 0 27 25 15 23 31 16UZWGORO0) 18 10 0 21 22 25 22 26 22IVAtIOFRANKOVSK 19 11 0 23 25 25 25 25 22TERNOPCL :I 1o 5 ?6 24 20 27 29 21ZHITOMIR 25 11 3 29 27 20 29 33 23VINNITSA 23 10 3 26 26 is 29 32 21#H'lELlIITSKIY 22 10 0 25 25 19 27 30 21CHERNOVSTY 19 10 0 22. 22 15 23 27 17CHERNIGOV 28 12 0 30 38 19 31 49 23SU4Y 34 13 0 37 44 30 3R 50 34POLTAVA 46 13 0 50 43 69 51 49 86CHERKASSY 40 11 0 43 32 24 44 38 29KIPOVOGRAD 32 11 0 34 29 0 35 35 0'DFSSA 24 to 0 27 24 18 29 29 22'4IKOLAYEV 32 i 0 35 28 20 36 33 25<HrRSON 32 t 0 - 35 28 20 36 33 25SIMFER010L 3L 11 0 34 26 0 35 30 014EPPOPE TRnVSK 56 12 8 61 32 40 62 37 490lfIFTS( 150 t4 0 163 33 45 164 39 5I
VOQCSHILOVGRAO 163 14 7 L75 33 49 176 39 543ROPN0 17 9 0 19 23 10 ?0 28 14VITF9SK 22 12 0 24 29 0 24 37 1840GfLEV 24 12 0 26 31 0 27 '0 IAGOMFL 26 12 0 28 34 16 29 45 19SREST 19 10 3 23 24 13 ?4 30 15UFA 20 51 2 22 102 It ?4 t16 22IZ4EVSK 20 32 0 21 7? 12 22 89 20ORENRUNG 18 29 1 21 61 2 22 74 40
24ER .2 35 0 24 a9 11 25 1lZ 1?SVERLOVS< 23 to 0 24 45 9 26 64 16C14SLYABINSK 29 21 0 30 49 9 32 64 1nTYIJIAE t
4 19 L4 0 22 37 0 24 53 0KURGAN 22 17 0 25 40 0 27 59 0O4SK 21 12 0 25 28 0 29 44 0NOVOSIPIRSK 34 8 0 43 20 0 51 40 0TO.4SK 33 7 0 42 18 0 49 47 0qARNAUL 25 a 0 31 18 0 3? 33 0KRASNOYARS.K Z4 6 0 32 15 0 40 31 0IRKUTSK 23 5 0 2f 11 0 26 20 0CHITA 12 4 0 14 9 0 17 15 0AAAKAN 22 6 0 28 i5 0 32 27 0KEMEROVO 79 7 0 100 1s 0 118 38 0JLANUDE 12 4 0 14 10 0 16 1? 0VLAOIVOSTOK 10 3 0 13 6 0 14 9 0KHABAROVSK 7 3 0 8 7 0 9 10 03LAGOVFSHCHENSK 8 3 0 9 7 0 10 it 0YUZHNO_SAKHALINSK 7 2 0 8 6 0 i 9 0
MAGADAN 5 3 0 6 6 0 7 9 0!YAKUTSK 7 3 0 a 7 a 9 10 0
PETFOPAVLOVSKKAM 5 2 0 6 6 o 6 a 09 AGURYFV 14 14 0 22 39 it 23 48 20
AKTYUBINSK 18 19 0 20 44 9 22 55 18URAILSK 20 22 0 22 46 0 23 56 0KUSTANAY 23 17- 0 25 38 9 27 51 17411, '

I
127
CALt OILt AND' CS POTEtNTIA. I'IOICES BASED C4 9ISTA'4CE
NIODE CP60 0P60 G?60 CP70 OP70 GP70 C275 P75 GP7S
PETROPAVLOVSK 2t 14 0 25 33 0 29 4? 0KQKCHFTAV 23 12 0 25 zQ 0 29 42 3TSELINOGRAO 24 11 0 32 25 0 39 36 CKAPAGANDA 37 10 0 49 23 0 58 32 1KZYLGROA L3 11 0 15 24 0 17 31 3CH '4KEAJT 14 9 0 16 20 9 18 Z? 15DZHAMBUL 13 8 0 16 19 8 is 25 14SF.$IPALATINSK 17 7 0 21 16 0 25 25 0PAVLOOAR 24 8 0 38 20 ) 54 32 0UST-KA4ENCGORSK 17 7 0 21 16 0 25 24 1)ALMA ATA 13 7 0 16 16 7 18 22 12ASHKHAIAO 12 I 0 14 24 0 15 29 19OUSHANRE 9 7 0 it 15 1 12 19 isTASHKENT 14 9 0 17 20 10 19 26 16FRUNIZE 12 8 0 15 17 9 1? 24 13;IR I LSK 2 0 0 2 0 0 2 0 1ELISTA 24 13 0 26 28 0 27 32 0
_ +g/ +: ; ., -
+ a. ..
K '+ ,- + Y 7 + ++ + + + + +J +: ++ + + ..+ .+ ., + + ++ .-._ : + ? + ., p + , > +? A ? + + ; + , .+ + + + m + + + : _ .+ ..++ + . + + + " + + + + ' : '

128
COAL. OIL, ANt GAS POTENTIAL INOICES AASE') O4 TRANSPORT COSTS
1OOE C063 0P60 GP60 CP7O 0071) GPO CPS OPTS GP75
LFNINGRAD 3 it 1 4 25 3 4 324URMANSK 2 7 0 2 17 0 3 22 0OFTROZAVOOSK 3 10 0 3 23 0 3 29 04OVGOROD 4 11 1 4 27 3 4 33 4VOLOGCA 4 14 0 4 33 3 4 41ARKHANGELSK 2 10 0 3 23 0 3 29 0SYKTYVKAR 3 10 0 3 26 2 4 35 4MOSCOW 6 17 1 6 39 4 0 47 AYAROSLAVL 4 16 1 5 37 3 5 4b 5VLAOIMIR 5 20 0 S 44 4 5 52 5IVAtI ~v 4 1s 0 5 41 4 5 4qKALININ 5 15 1 5 34 4 5 41 5KALUGA q s 5 7 35 4 7 4! 5KDSTROMA 4 16 0 4 37 3 5 4t 5RYAZAN 6 18 I & 40 4 6 4R STULA 8 16 1 8 37 5 9 44 6KAZAN 4 53 1 4 Ill 3 5 126 5GORKIY 4 24 1 4 53 4 5 63 5KIPOV 4 17 0 4 41 0 4 53 0YOSHKAP.OLA 4 33 0 4 71 3 4 83 5SARANSK 5 26 1 5 54 3 5 64 5f 1EHOKSARY 4 34 1 5 72 3 5 83 5ULYANOVSK 4 47 0 5 96 0 5 loq 06ELGCRO0 9 13 2 to 31 10 t) 41 L3VGROtIEZH 7 lt 2 8 38 7 8 45 8KUQSx 7 14 1 1 36 6 8 43 9OREL 7 14 1 T 35 5 7 42 7iRYANSK 6 14 1 7 14 5 7 42 6LIPETSK 7 17 0 7 39 5 7 46 6TA400V 6 20 0 7 44 4 7 52 5PFNA 5 28 1 5 58 4 6 "67 5ASTRAKHAN 4 19 0 5 43 0 5 49 0VOLGOGRAO 7 22 1 8 46 3 8 53 5KUYBYSHFV 4 72 0 5 139 4 5 154 7SARATOV 5 37 2 5 69 S 6 79 7POSTOV 20 16 3 21 36 14 21 40 itKRASNOOAR 7 23 3 7 39 12 7 44 8STAVROPOL 7 16 3 T 34 10 7 38 TMAKHACHKALt 4 20 0 4 51 1 1 5 49 0NALCHIK 5 1 0 5 45 5 5 44 6OROZHONIKIDZE 5 20 1 5 60 6 5 51 6GpnZ$4YY 4 22 1 5 6r 6 5 56 6KIEV 6 11 t 7 34 6 7 41 8ZA"OROZHYE 11 12 0 12 30 7 12 35 qKHARKOV 11 14 4 12 37 18 12 44 2?LVOV 4 12 2 6 25 6 6 29 6KISH14EV 4 9 0 5 22 4 5 26 5TALL
14 3 9 1 3 22 2 3 28 3
RIGA 3 ;o 0 4 23 2 4 29 3VILNIUS 4 10 0 4 24 3 4 30 4KALININGRAD 3 4 0 3 20 0 4 26 0SMOLENSK 5 13 a 5 3! 4 9 39 5PSKOV 3 11 0 4 25 0 4 32 f)%INSK 4 11 1 5 2$ 3 5 35 4TBILISI 3 14 0 4 27 4 4 31 5BAKU 3 36 2 4 . 4 4 58 6
7-77
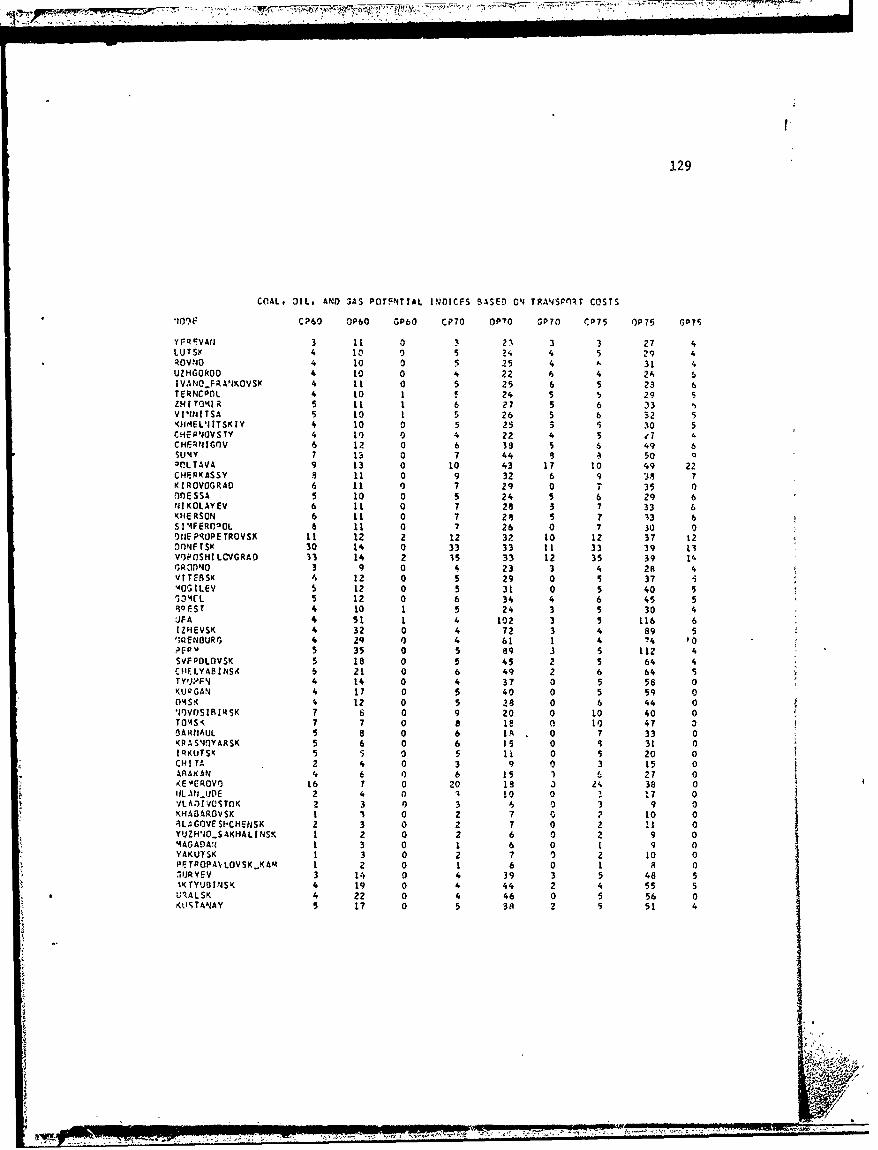
129
COAL, OIL, AI0 GAS POTCNTIAL INOICFS 5SAED 04 TRANS nRT COSTS
CP60 OP60 GP60 CP70 OP'0 GP70 '075 OP75 GO7S
YFQVAA 3 11 0 3 2V 3 3 27 4LUTS 4 10 0 5 24 4 5 29 4ROVNO 4 10 0 5 25 4 A 31 4UZHGO0D 4 10 0 4 22 6 4 26 6|VANO_.FR.IKOVSK 4 1 0 5 25 6 5 23 6TERNCPOL 4 t0 1 24 5 29 5zH1 T0~4 R 5 11 1 6 27 5 6 33V IPIJ I TSA 5 10 1 5 26 S 6 32 5KIHMEL'I ITSK IY 4 10 0 5 25 5 5 30 5CHERJ OVSTY 4 10 0 4 22 4 5 e? &CHFQNJIGnV 6 12 0 6 33 5 6 49 6SU'MY 7 13 0 7 44 5 50 Q2f.LTAVA 9 13 0 t0 43 17 0 49 22CH.RKASSY 3 11 0 9 32 6 9 "38 7KIROVOGRAD 6 11 0 7 29 0 T 35 0flfESSA 5 10 0 5 24 5 6 29 6NI KOLAYEV 6 1 0 7 28 5 7 33 6KHERSON 6 11 0 7 28 5 7 13 6S!14FERfl30L 6 11 0 7 26 0 7 30 0tIE PRUPE TROVSK 11 12 2 12 32 10 1z 37 12
DONFTSK 30 14 0 33 33 11 33 39 13VOPOSHI LCVGRAO 33 14 2 35 33 12 35 39 1&GR,1)ONO 3 9 0 4 23 3 4 28 4VtTEBSK 4 12 0 5 29 0 3 37"0GILEV 5 12 0 5 31 0 5 40 5
5 12 0 6 34 4 6 45 5qQFST 4 10 1 5 24 3 5 30 4JFA 4 51 1 4 102 3 5 116 6IZHEVSK 4 32 0 4 72 3 4 89 5';RENBURG 4 29 0 4 61 1 4 74 10Pea 5 35 0 5 89 3 5 l1Z 4SVFPDLOVSK 5 18 0 5 45 2 5 64 4C IF.LYA INSA 6 21 0 6 49 2 6 64 5TYIJ;AFN 4 14 0 4 37 0 5 58 0KURGAN 4 17 0 5 40 0 5 59 0
4'4SK 12 0 5 28 0 6 4 0'1OVOSIBIRSK 7 6 0 9 20 0 1o 40 0TO14S, 7 7 0 a 18 c0 10 47 33ARUAUL 5 8 0 6 1A. 0 7 33 0KPASNj'YARSK 5 6 0 6 15 0 q 31 0IRKUTSK 5 5 0 5 it 0 5 20 0CHITA 2 4 0 3 9 0 3 15 0AnAKAN 4 6 a 6 Is 1 6 27 0
KEvEROVO 16 7 0 20 1s 3 24 38 0IJLI NUE 2 4 0 10 0 3 17 0VLAi) VCSTfK 2 3 0 3 6 0 3 9 0KHABAROVSK I 1 0 2 7 0 ? 10 04LAGOVE SHCHENSK 2 3 0 2 7 0 2 "1 0YUZH'JO.S AKHiLIlNSK 1 2 0 2 6 0 2 9 04AGADA:l 1 3 0 1 6 0 t 9 0YAKUTSK 1 3 0 2 7 0 2 10 0PfTROPA1.rS K.KAM 1 2 0 1 6 0 1 8 0:UJRY-V 3 14 0 4 39 3 5 48 5
4 TYUBIlSK 4 19 0 4 44 2 4 55 5U ALSK 4 22 0 4 46 0 5 56 0KUSTANAY 5 17 0 5 38 2 5 51 4
T- 7I777'
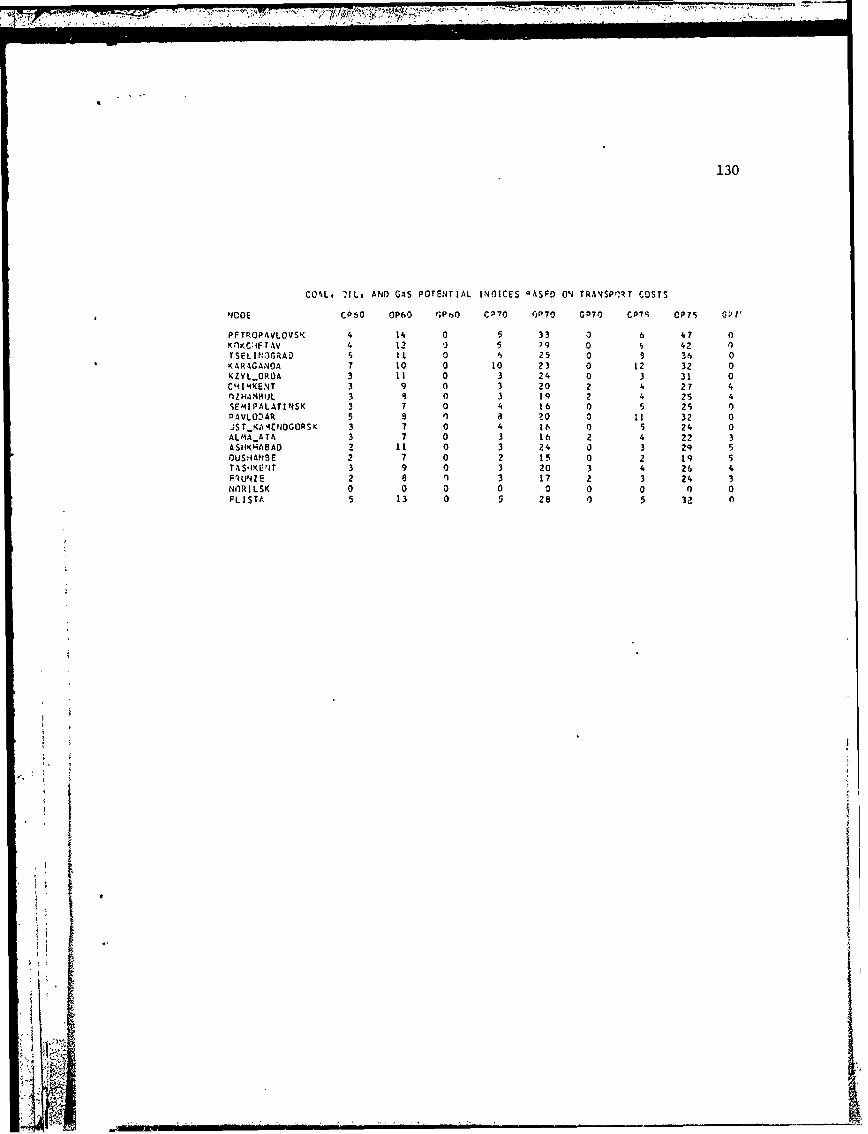
-~ ~ ~~ VIVA,,,-- ~ -,.
130
COLL IlL# ANi0 GAS POTENTIAL1 INOICES OASFO ON TRA4SP T COSTS
NJODE C060 OP60 f;Pe, C~l70 09p70 GP70 CP7l; OPTS 1.;, 1
PFTROPAVLOVSK( 4 14 0 5 33 0 6 4? 0KnKC:IFT.%V 4 12 115 '9 0 42 0TSELIrV3GRAD 5 it 0 6 25 0 3 36 0KARAGAN10A 1 10 0 10 23 0 12 32 0KZYL-..R0A 3 11 0 3 24 0 3 31 0C4 I MKENT 3 9 0 3 20 2 4 27 4nZHA,4I4IJt 3 3 0 3 IQ 2 4 25 4SEMIPALATINSK 3 7 0 4 16 0 5 2 S 0P AVL 0:)AR 5 9 0) a ?o 0 11 32 0JST-K 'tNOGURSK 3 7 0 4 16 0 5 24 0ALMAATA 3 7 0 3 16 2 4 22 3AS11KHABAD 2 11 0 3 24 a 3 2q 5OUSR4SNIE 2 7 0 2 15 0 2 19 5TA S,uKE NT 3 9 0 3 20 3 4 26 4FlU4~ZE 2 8 n 3 17 2 3 24 3NARLLSK 0 0 0 a 0 0 0 0 0PLISTA 5 13 0 5 28 05 32 fl

APPENDIX E
URBAN POPULATION DATA
, 131
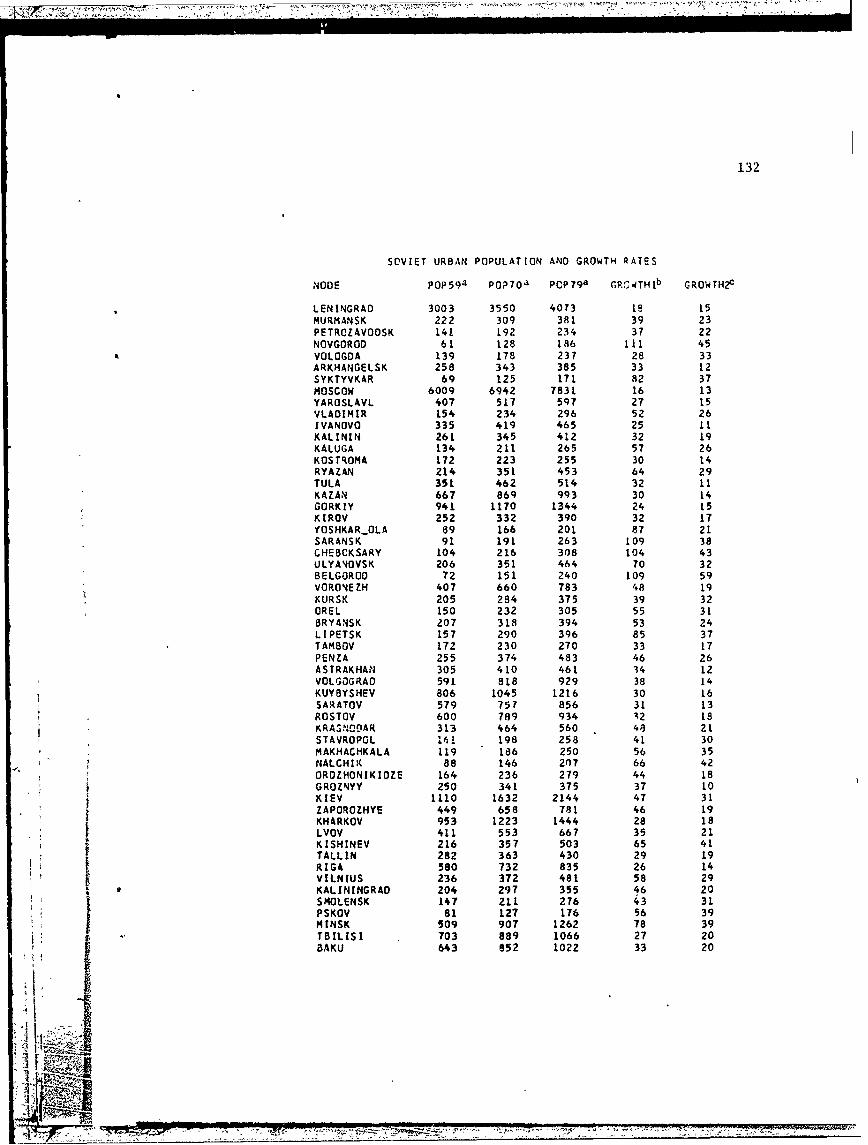
.. .
132
SOVIET URBAN POPULATION AND GROWTH RATES
NODE POP59a PO P7 0 a PcP79a GR' WTHlb GROWTH2C
LENINGRAD 3003 3550 4073 19 15MURMANSK 222 309 381 39 23PETROZAVOOSK 141 192 234 37 22NOVGOROD 61 128 186 111 45VOLOGDA 139 178 237 28 33ARKHANGELSK 258 343 385 33 12SYKTYVKAR 69 125 171 82 37MOSCOW 6009 6942 7831 16 13YAROSLAVL 407 517 5q7 27 15VLADIMIR 154 234 296 52 26IVANOVO 335 419 465 25 11KALININ 261 345 412 32 19KALUGA 134 211 265 57 26KOSTROMA 172 223 255 30 14RYAZAN 214 351 453 64 29TULA 35L 462 514 32 11KAZAN 667 869 993 30 14GORKIY 941 1170 1344 24 15KIROV 252 332 390 32 17YOSHKAROLA 89 166 201 87 21SARANSK 91 191 263 109 38CHEBCKSARY 104 216 308 104 43ULYA4OVSK 206 351 464 70 32BELGOROD 72 151 240 109 59VORONEZH 407 660 783 48 19KURSK 205 284 375 39 32OREL 150 232 305 55 31BRYANSK 207 318 394 53 24LIPETSK 157 290 396 85 37TAMBOV 172 230 270 33 17PENZA 255 374 483 46 26ASTRAKHAN 305 410 461 34 12VOLGOGRAD 591 818 929 38 14KUYBYSHEV 806 1045 1216 30 16SARATOV 579 757 856 31 13ROSTOV 600 789 934 -2 18KRAS3O0AR 313 464 560 48 21STAVROPOL 1'1i 198 258 41 30MAKHACHKALA 119 186 250 56 35NALCHIK 88 146 207 66 42
ORDZHONIKIDZE 164 236 279 44 18GROZNYY 250 341 375 37 t0KIEV 1110 1632 2144 47 31ZAPOROZHYE 449 658 781 46 19KHARKOV 953 1223 1444 28 18LVOV 411 553 667 35 21KISHINEV 216 357 503 65 41TALLIN 282 363 430 29 19RIGA 580 732 835 26 14i VILNIUS 236 372 481 58 29KALININGRAD 204 297 355 46 20SMOLENSK 147 21L 276 43 31PSKOV 81 127 176 56 39MINSK 509 907 1262 78 39TBILISI 703 889 1066 27 20•AKU 643 852 1022 33 20
7
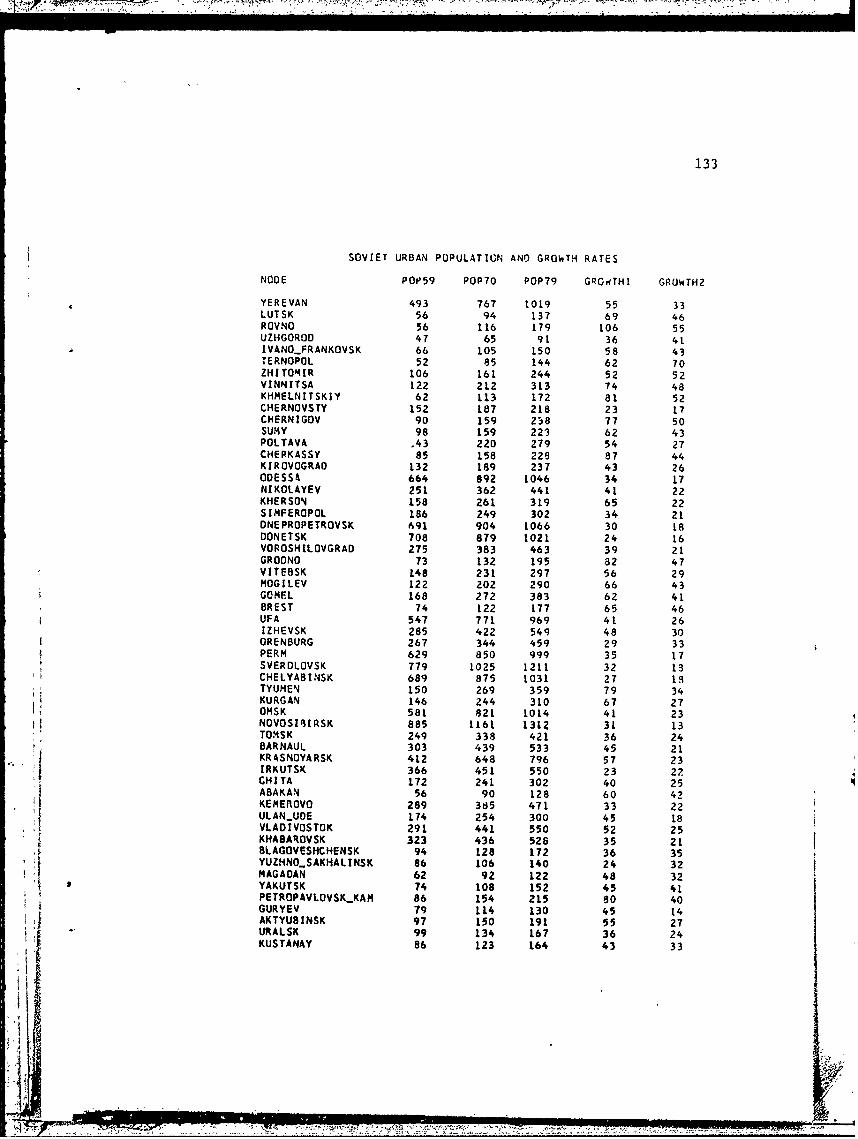
133
SOVIET URBAN POPULATION AND GROWTH RATES
NODE POP59 POP70 POP79 GROWTH1 GROWTH2
YEREVAN 493 767 1019 55 33LUTSK 56 94 137 69 46ROVNO 56 116 179 106 55UZHGOROD 47 65 91 36 41IVANOFRANKOVSK 66 105 150 58 43TERNOPOL 52 85 144 62 70ZHITOMIR 106 161 244 52 52VINNITSA 122 212 313 74 48KHMELNITSKIY 62 113 172 81 52CHERNOVSTY 152 187 218 23 17CHERNIGOV 90 159 238 77 50SUMY 98 159 223 62 43POLTAVA .43 220 279 54 27CHERKASSY 85 158 228 ST 44KIROVOGRAD 132 189 237 43 26ODESSA 664 892 L046 34 17NIKOLAYEV 251 362 441 41 22KHERSON 158 261 319 65 22SINFEROPOL 186 249 302 34 21DNEPROPETROVSK 691 904 1066 30 18DONETSK 708 879 1021 24 16VOROSHILOVGRAD 275 383 463 39 21GROONO 73 132 195 82 47VITEBSK L48 231 297 56 29MOGILEV 122 202 290 66 43GOMEL 168 272 383 62 41BREST 74 122 177 65 46UFA 547 771 969 41 26IZHEVSK 285 422 549 48 30ORENBURG 267 344 459 29 33PERM 629 850 999 35 17SVERDLOVSK 779 1025 1211 32 13CHELYABINSK 689 875 t031 27 13TYUMEN 150 269 359 79 34KURGAN 146 244 310 67 27OMSK 581 821 1014 41 23NOVOSIlIRSK 885 1161 1312 3L 13TOMSK 249 338 421 36 24BARNAUL 303 439 533 45 214 KRASNOYARSK 412 648 796 57 23IRKUTSK 366 451 550 23 22CHITA 172 241 302 40 25ABAKAN 56 90 128 60 42KEMEROVO 289 385 4T 33 22ULANUOE 174 254 300 45 18VLADIVOSTOK 291 441 550 52 25KHABAROVSK 323 436 528 35 218LAGOVESHCHENSK 94 128 t72 36 35YUZHNOSAKHALINSK 86 106 140 24 32MAGAOAN 62 92 122 48 32YAKUTSK 74 108 152 45 41PETROPAVLOVSK-KAM 86 154 215 80 40GURYEV 79 114 130 45 14AKTYUBINSK 97 150 191 55 27URALSK 99 134 167 36 24KUSTANAY 86 123 164 43 33
-I

'34
SOVIET URBAN POPULATION ANO GROWTH RATES
NODE POP59 POP70 POP79 GROWTHL GROWTH2
PETROPAVLOVSK 131 173 207 32 20KOKCHETAV 53 81 103 52 29TSELINOGRAD 99 180 234 82 30KARAGANDA 383 523 572 37 9KZYLOROA 66 122 156 86 27ChIMKENT 153 247 321 61 30DZHAMSUL 1L3 187 264 65 41SEMIPALATINSK 156 236 283 51 20PAVLODAR 90 187 273 ld 46USTKAMENOGaRSK 150 230 274 53 19ALMA-ATA 456 733 910 60 24ASHKHABAO 170 253 312 49 23DUSHANBE 227 374 493 65 32TASHKENT 927 1385 1779 49 28FRUNZE 220 43L 533 96 24NOPILSK 118 135 180 14 33ELISTAd
aPopulation in 1959, 1970, and 1979
bee increase 1959-1970
Percent increase 1970-1979.
Data not available.
Source: Data compiled by Shabad in Bond and Lydolph (1979).
~1