Embed Size (px)
Citation preview
Bringing life and convenience together in one place™
30 S. MERIDIAN STREET • INDIANAPOLIS, INDIANA 46204 • 317.577.5600
KITE REALTY GROUP TRUST QUARTERLY FINANCIAL SUPPLEMENT
June 30, 2009
INVESTOR RELATIONS CONTACTS:
Dan Sink, Chief Financial Officer Adam Chavers, Director of Investor Relations
SUPPLEMENTAL INFORMATION – JUNE 30, 2009
p.2 Kite Realty Group Trust Supplemental Financial and Operating Statistics – 6/30/09
PAGE NO. TABLE OF CONTENTS
3 Corporate Profile 4 Contact Information 5 Important Notes 6 Corporate Structure Chart 7 Condensed Consolidated Balance Sheets 8 Consolidated Statements of Operations for the Six Months Ended June 30 9 Funds from Operations and Other Financial Information for the Three and Six Months Ended June 30 10 Market Capitalization 10 Ratio of Debt to Total Undepreciated Assets as of June 30, 2009 11 Same Property Net Operating Income for the Three and Six Months Ended June 30 12 Net Operating Income by Quarter 13 Summary of Outstanding Debt as of June 30, 2009 14 Schedule of Outstanding Debt as of June 30, 2009 17 Refinancing Update 18 Joint Venture Summary – Unconsolidated Properties 19 Condensed Combined Balance Sheets of Unconsolidated Properties 20 Condensed Combined Statements of Operations of Unconsolidated Properties for the Three and Six Months Ended June 30 21 Top 10 Retail Tenants by Gross Leasable Area 22 Top 25 Tenants by Annualized Base Rent 23 Lease Expirations – Operating Portfolio 24 Lease Expirations – Retail Anchor Tenants 25 Lease Expirations – Retail Shops 26 Lease Expirations – Commercial Tenants 27 Summary Retail Portfolio Statistics Including Joint Venture Properties 28 Summary Commercial Portfolio Statistics 29 Current Development Pipeline 30 Current Redevelopment Projects 31 Visible Shadow Pipeline 32 Geographic Diversification – Operating Portfolio 33 Operating Retail Properties 37 Operating Commercial Properties 38 Retail Operating Portfolio – Tenant Breakdown
30 S. Meridian Street Indianapolis, IN 46204
317.577.5600
CORPORATE PROFILE
p.3 Kite Realty Group Trust Supplemental Financial and Operating Statistics – 6/30/09
General Description
Kite Realty Group Trust is a full-service, vertically integrated real estate company engaged primarily in the development, construction, acquisition, ownership and operation of high-quality neighborhood and community shopping centers in selected markets in the United States. We are organized as a real estate investment trust ("REIT") for federal income tax purposes. As of June 30, 2009, we owned interests in 55 operating properties totaling approximately 8.4 million square feet, an additional 0.3 million square feet in two properties currently under development and another 0.5 million square feet in six properties under redevelopment.
Our strategy is to maximize the cash flow of our operating properties, successfully complete the construction and lease-up of our development portfolio and identify additional growth opportunities in the form of new developments and acquisitions. New investments are focused in the shopping center sector, although we may selectively pursue commercial development or acquisition opportunities in markets where we currently operate and where we believe we can leverage existing infrastructure and relationships to generate attractive risk-adjusted returns.
Company Highlights as of June 30, 2009
Operating Retail Properties 51 Operating Commercial Properties 4 Total Properties Under Development 2 Total Properties Under Redevelopment 6 States 9 Total GLA/NRA of Operating Properties 8,377,744 Owned GLA/NRA of Operating Properties 5,488,791 Owned GLA of Properties Under Development/Redevelopment 861,026 Percentage of Owned GLA/NRA Leased – Total Portfolio 91.1% Percentage of Owned GLA Leased – Retail Operating 90.7% Percentage of Owned NRA Leased – Commercial Operating 95.2% Total Full-Time Employees, including 71 home office employees 98
Stock Listing: New York Stock Exchange symbol: KRG
CONTACT INFORMATION
p.4 Kite Realty Group Trust Supplemental Financial and Operating Statistics – 6/30/09
Corporate Office 30 South Meridian Street, Suite 1100
Indianapolis, IN 46204 1-888-577-5600 317-577-5600
www.kiterealty.com
Investor Relations Contacts: Analyst Coverage: Analyst Coverage: Dan Sink, Chief Financial Officer BMO Capital Markets KeyBanc Capital Markets Adam Chavers, Director of Investor Relations Mr. Paul E. Adornato, CFA Mr. Jordan Sadler /Mr. Todd Thomas Kite Realty Group Trust (212) 885-4170 (917)368-2280/(917) 368-2286 30 South Meridian Street, Suite 1100 [email protected] [email protected] Indianapolis, IN 46204 [email protected] (317) 577-5609/(317) 713-5684 Citigroup Global Markets [email protected] Mr. Michael Bilerman Raymond James [email protected] (212) 816-1383 Mr. Paul Puryear [email protected] (727) 567-2253 Transfer Agent: [email protected] Goldman, Sachs & Co. BNY Mellon Shareholder Services Mr. Jonathan Haberman RBC Capital Markets Mr. James Balsan (917) 343-4260 Mr. Rich Moore 480 Washington Blvd., 29th Floor [email protected] (440) 715-2646 Jersey City, NJ 07310 [email protected] (800) 820-8521 Janney Montgomery Scott Mr. Andrew T. Dizio, CFA Stifel, Nicolaus & Company, Inc. (215) 665-6439 Mr. David M. Fick, CPA/Mr. Nathan Isbee Stock Specialist: [email protected] (443) 224-1308/(443) 224-1346 [email protected] Barclays Capital [email protected] 45 Broadway 20th Floor Wells Fargo Securities, LLC New York, NY 10006 Mr. Jeffrey J. Donnelly, CFA (646) 333-7000 (617) 603-4262 [email protected]
IMPORTANT NOTES
p.5 Kite Realty Group Trust Supplemental Financial and Operating Statistics – 6/30/09
Interim Information This Quarterly Financial Supplement contains historical information of Kite Realty Group Trust (“the Company” or “KRG”) and is intended to supplement the Company’s Quarterly Report on Form 10-Q for the three months ended June 30, 2009 to be filed on or about August 10, 2009, which should be read in conjunction with this supplement. The supplemental information is unaudited, although it reflects all adjustments which, in the opinion of management, are necessary for a fair presentation of operating results for the interim periods.
Forward-Looking Statements This supplemental information package contains certain forward-looking statements within the meaning of Section 27A of the Securities Act of 1933 and Section 21E of the Securities Exchange Act of 1934. Such statements are based on assumptions and expectations that may not be realized and are inherently subject to risks, uncertainties and other factors, many of which cannot be predicted with accuracy and some of which might not even be anticipated. Future events and actual results, performance, transactions or achievements, financial or otherwise, may differ materially from the results, performance, transactions or achievements expressed or implied by the forward-looking statements. Risks, uncertainties and other factors that might cause such differences, some of which could be material, include, but are not limited to:
• national and local economic, business, real estate and other market conditions, particularly in light of the current recession and governmental action and policies;
• financing risks; including access to capital at desirable terms • the level and volatility of interest rates; • financial stability of tenants; including their ability to pay rent; • the competitive environment in which the Company operates; • acquisition, disposition, development and joint venture risks; • property ownership and management risks; • the Company’s ability to maintain its status as a REIT for federal income tax purposes; • potential environmental and other liabilities; • other factors affecting the real estate industry generally; and • other risks identified in reports the Company files with the Securities and Exchange Commission (“the SEC”) or in other
documents that it publicly disseminates, including, in particular, the section titled “Risk Factors” in our Annual Report on Form 10-K for the fiscal year ended December 31, 2008 and in our quarterly reports on Form 10-Q.
The Company undertakes no obligation to publicly update or revise these forward-looking statements, whether as a result of new information, future events or otherwise. Funds from Operations Funds from Operations (FFO) is a widely used performance measure for real estate companies and is provided here as a supplemental measure of operating performance. We calculate FFO in accordance with the best practices described in the April 2002 National Policy Bulletin of the National Association of Real Estate Investment Trusts (NAREIT), which we refer to as the White Paper. The White Paper defines FFO as net income (determined in accordance with generally accepted accounting principles (GAAP)), excluding gains (or losses) from sales of depreciated property, plus depreciation and amortization, and after adjustments for unconsolidated partnerships and joint ventures. Considering the nature of our business as a real estate owner and operator, we believe that FFO is helpful to investors in measuring our operational performance because it excludes various items included in net income that do not relate to or are not indicative of our operating performance, such as gains or losses from sales of depreciated property and depreciation and amortization, which can make periodic and peer analyses of operating performance more difficult. FFO should not be considered as an alternative to net income (determined in accordance with GAAP) as an indicator of our financial performance, is not an alternative to cash flow from operating activities (determined in accordance with GAAP) as a measure of our liquidity, and is not indicative of funds available to satisfy our cash needs, including our ability to make distributions. Our computation of FFO may not be comparable to FFO reported by other REITs that do not define the term in accordance with the current NAREIT definition or that interpret the current NAREIT definition differently than we do. Net Operating Income Net operating income (NOI) is provided here as a supplemental measure of operating performance. NOI is defined as property revenues less property operating expenses, excluding depreciation and amortization, interest expense and other items. We believe this presentation of NOI is helpful to investors as a measure of our operational performance because it is widely used in the real estate industry to measure the performance of real estate assets without regard to various items, included in net income, that do not relate to or are not indicative of operating performance, such as depreciation and amortization, which can vary depending upon accounting methods and book value of assets. We also believe NOI helps our investors to meaningfully compare the results of our operating performance from period to period by removing the impact of our capital structure (primarily interest expense on our outstanding indebtedness) and depreciation of the basis in our assets from our operating results. NOI should not, however, be considered as an alternative to net income (determined in accordance with GAAP) as an indicator of our financial performance.
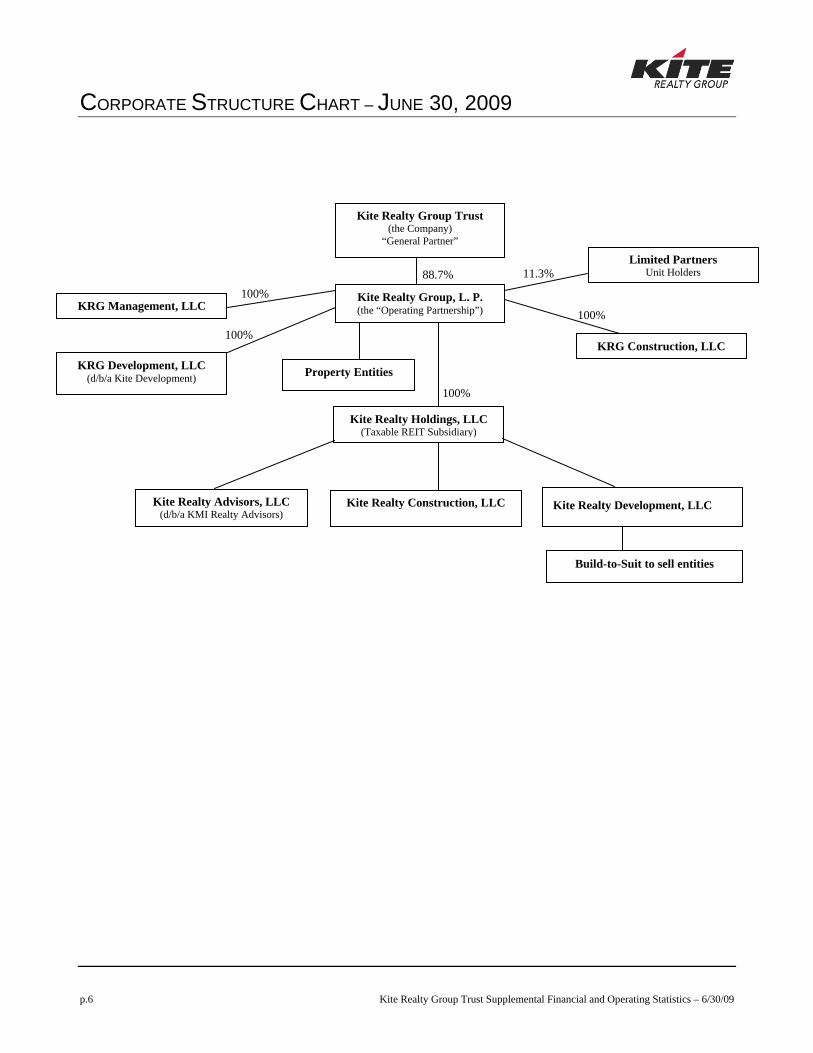
CORPORATE STRUCTURE CHART – JUNE 30, 2009
p.6 Kite Realty Group Trust Supplemental Financial and Operating Statistics – 6/30/09
Kite Realty Construction, LLC Kite Realty Development, LLC
Kite Realty Group Trust (the Company)
“General Partner”
Kite Realty Group, L. P. (the “Operating Partnership”)
Limited Partners Unit Holders
KRG Construction, LLC
Property Entities KRG Development, LLC (d/b/a Kite Development)
KRG Management, LLC
Kite Realty Advisors, LLC (d/b/a KMI Realty Advisors)
Build-to-Suit to sell entities
Kite Realty Holdings, LLC (Taxable REIT Subsidiary)
100%
100%
100%
100% 88.7% 11.3%
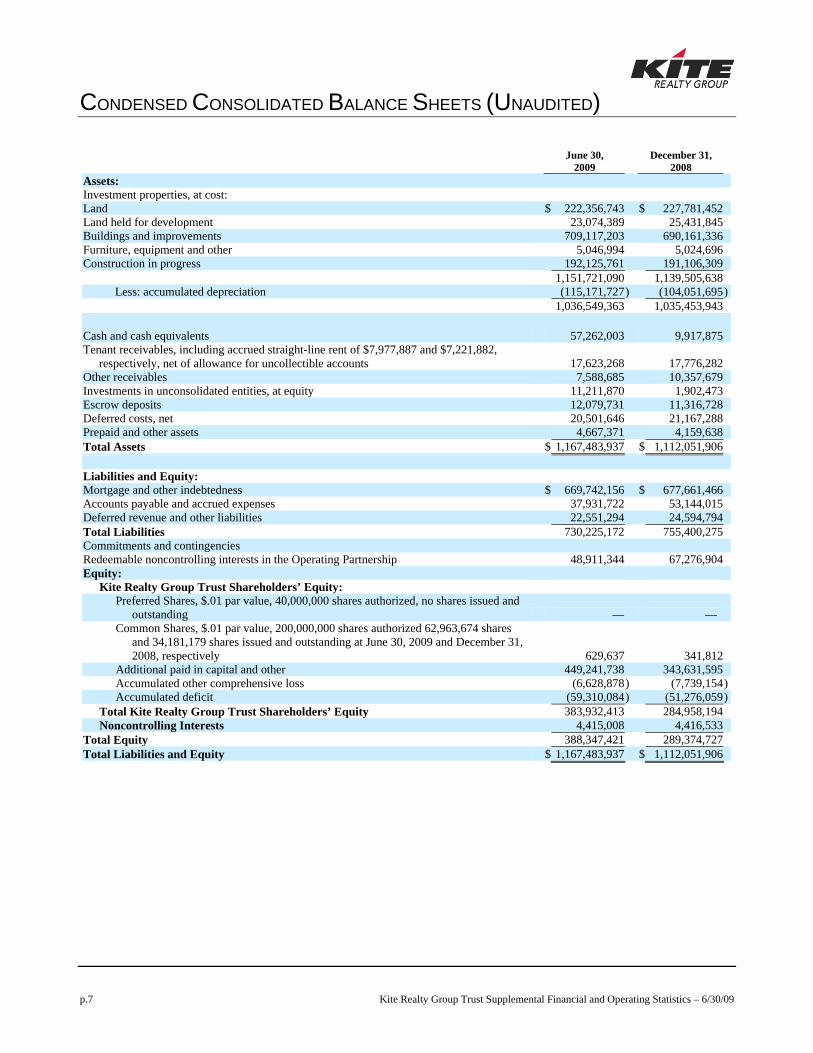
CONDENSED CONSOLIDATED BALANCE SHEETS (UNAUDITED)
p.7 Kite Realty Group Trust Supplemental Financial and Operating Statistics – 6/30/09
June 30,
2009 December 31,
2008 Assets: Investment properties, at cost: Land $ 222,356,743 $ 227,781,452 Land held for development 23,074,389 25,431,845 Buildings and improvements 709,117,203 690,161,336 Furniture, equipment and other 5,046,994 5,024,696 Construction in progress 192,125,761 191,106,309 1,151,721,090 1,139,505,638
Less: accumulated depreciation (115,171,727 ) (104,051,695) 1,036,549,363 1,035,453,943
Cash and cash equivalents 57,262,003 9,917,875 Tenant receivables, including accrued straight-line rent of $7,977,887 and $7,221,882,
respectively, net of allowance for uncollectible accounts 17,623,268 17,776,282 Other receivables 7,588,685 10,357,679 Investments in unconsolidated entities, at equity 11,211,870 1,902,473 Escrow deposits 12,079,731 11,316,728 Deferred costs, net 20,501,646 21,167,288 Prepaid and other assets 4,667,371 4,159,638 Total Assets $ 1,167,483,937 $ 1,112,051,906 Liabilities and Equity: Mortgage and other indebtedness $ 669,742,156 $ 677,661,466 Accounts payable and accrued expenses 37,931,722 53,144,015 Deferred revenue and other liabilities 22,551,294 24,594,794 Total Liabilities 730,225,172 755,400,275 Commitments and contingencies Redeemable noncontrolling interests in the Operating Partnership 48,911,344 67,276,904 Equity:
Kite Realty Group Trust Shareholders’ Equity: Preferred Shares, $.01 par value, 40,000,000 shares authorized, no shares issued and
outstanding — — Common Shares, $.01 par value, 200,000,000 shares authorized 62,963,674 shares
and 34,181,179 shares issued and outstanding at June 30, 2009 and December 31, 2008, respectively 629,637 341,812
Additional paid in capital and other 449,241,738 343,631,595 Accumulated other comprehensive loss (6,628,878 ) (7,739,154)Accumulated deficit (59,310,084 ) (51,276,059)
Total Kite Realty Group Trust Shareholders’ Equity 383,932,413 284,958,194 Noncontrolling Interests 4,415,008 4,416,533
Total Equity 388,347,421 289,374,727 Total Liabilities and Equity $ 1,167,483,937 $ 1,112,051,906
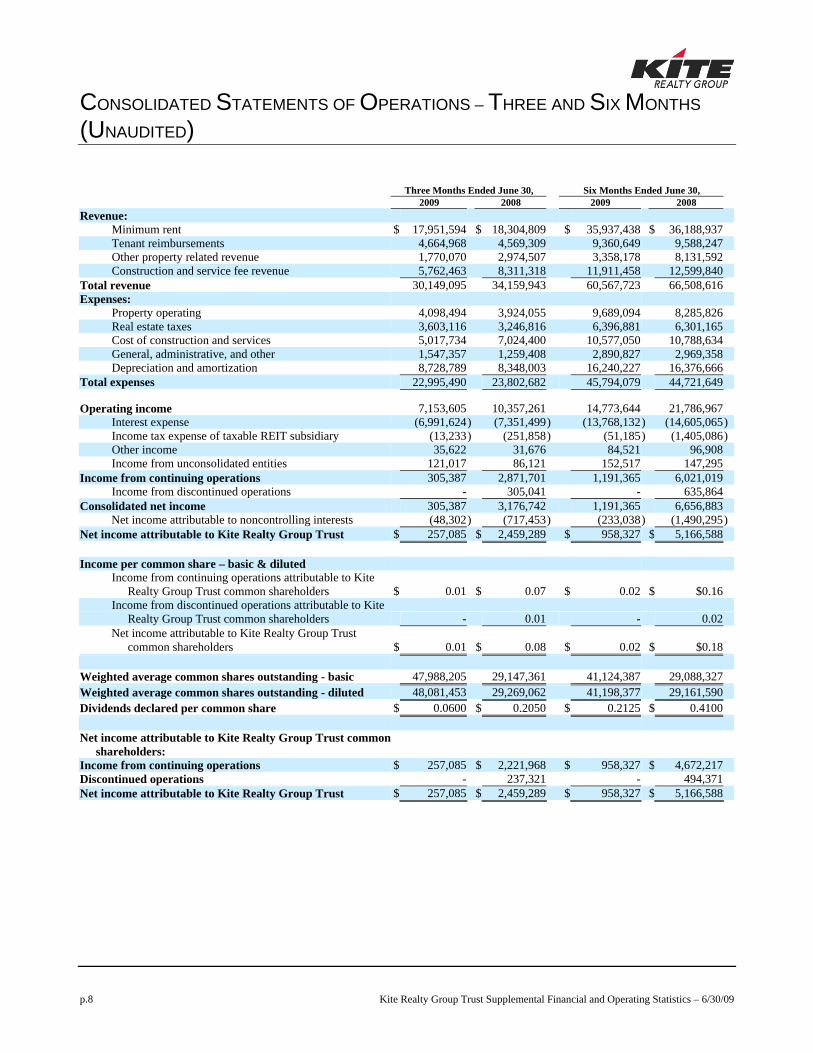
CONSOLIDATED STATEMENTS OF OPERATIONS – THREE AND SIX MONTHS
(UNAUDITED)
p.8 Kite Realty Group Trust Supplemental Financial and Operating Statistics – 6/30/09
Three Months Ended June 30, Six Months Ended June 30, 2009 2008 2009 2008 Revenue:
Minimum rent $ 17,951,594 $ 18,304,809 $ 35,937,438 $ 36,188,937 Tenant reimbursements 4,664,968 4,569,309 9,360,649 9,588,247 Other property related revenue 1,770,070 2,974,507 3,358,178 8,131,592 Construction and service fee revenue 5,762,463 8,311,318 11,911,458 12,599,840
Total revenue 30,149,095 34,159,943 60,567,723 66,508,616 Expenses:
Property operating 4,098,494 3,924,055 9,689,094 8,285,826 Real estate taxes 3,603,116 3,246,816 6,396,881 6,301,165 Cost of construction and services 5,017,734 7,024,400 10,577,050 10,788,634 General, administrative, and other 1,547,357 1,259,408 2,890,827 2,969,358 Depreciation and amortization 8,728,789 8,348,003 16,240,227 16,376,666
Total expenses 22,995,490 23,802,682 45,794,079 44,721,649
Operating income 7,153,605 10,357,261 14,773,644 21,786,967 Interest expense (6,991,624) (7,351,499) (13,768,132 ) (14,605,065) Income tax expense of taxable REIT subsidiary (13,233) (251,858) (51,185 ) (1,405,086) Other income 35,622 31,676 84,521 96,908 Income from unconsolidated entities 121,017 86,121 152,517 147,295
Income from continuing operations 305,387 2,871,701 1,191,365 6,021,019 Income from discontinued operations - 305,041 - 635,864
Consolidated net income 305,387 3,176,742 1,191,365 6,656,883 Net income attributable to noncontrolling interests (48,302) (717,453) (233,038 ) (1,490,295)
Net income attributable to Kite Realty Group Trust $ 257,085 $ 2,459,289 $ 958,327 $ 5,166,588 Income per common share – basic & diluted
Income from continuing operations attributable to Kite Realty Group Trust common shareholders $ 0.01 $ 0.07 $ 0.02 $ $0.16
Income from discontinued operations attributable to Kite Realty Group Trust common shareholders - 0.01 - 0.02
Net income attributable to Kite Realty Group Trust common shareholders $ 0.01 $ 0.08 $ 0.02 $ $0.18
Weighted average common shares outstanding - basic 47,988,205 29,147,361 41,124,387 29,088,327 Weighted average common shares outstanding - diluted 48,081,453 29,269,062 41,198,377 29,161,590 Dividends declared per common share $ 0.0600 $ 0.2050 $ 0.2125 $ 0.4100 Net income attributable to Kite Realty Group Trust common
shareholders: Income from continuing operations $ 257,085 $ 2,221,968 $ 958,327 $ 4,672,217 Discontinued operations - 237,321 - 494,371 Net income attributable to Kite Realty Group Trust $ 257,085 $ 2,459,289 $ 958,327 $ 5,166,588
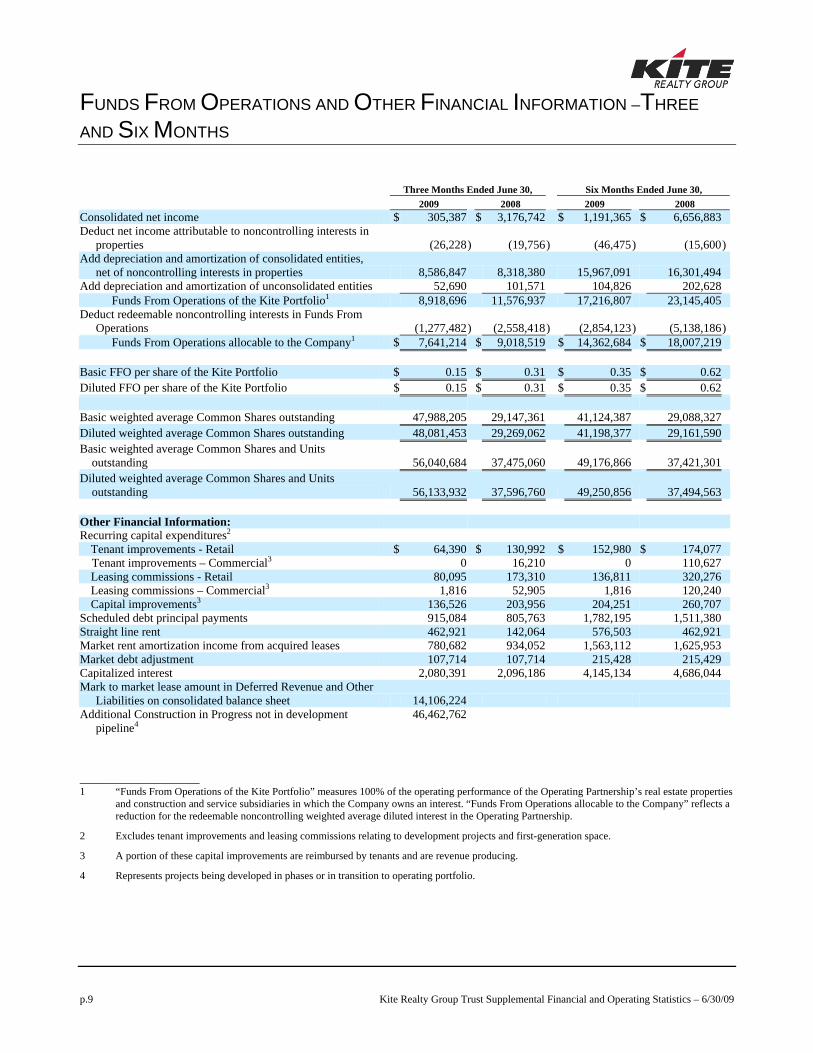
FUNDS FROM OPERATIONS AND OTHER FINANCIAL INFORMATION –THREE
AND SIX MONTHS
p.9 Kite Realty Group Trust Supplemental Financial and Operating Statistics – 6/30/09
Three Months Ended June 30, Six Months Ended June 30,
2009 2008 2009 2008 Consolidated net income $ 305,387 $ 3,176,742 $ 1,191,365 $ 6,656,883 Deduct net income attributable to noncontrolling interests in
properties (26,228) (19,756) (46,475 ) (15,600)Add depreciation and amortization of consolidated entities,
net of noncontrolling interests in properties 8,586,847 8,318,380 15,967,091 16,301,494 Add depreciation and amortization of unconsolidated entities 52,690 101,571 104,826 202,628
Funds From Operations of the Kite Portfolio1 8,918,696 11,576,937 17,216,807 23,145,405 Deduct redeemable noncontrolling interests in Funds From
Operations (1,277,482) (2,558,418) (2,854,123 ) (5,138,186)Funds From Operations allocable to the Company1 $ 7,641,214 $ 9,018,519 $ 14,362,684 $ 18,007,219
Basic FFO per share of the Kite Portfolio $ 0.15 $ 0.31 $ 0.35 $ 0.62 Diluted FFO per share of the Kite Portfolio $ 0.15 $ 0.31 $ 0.35 $ 0.62 Basic weighted average Common Shares outstanding 47,988,205 29,147,361 41,124,387 29,088,327 Diluted weighted average Common Shares outstanding 48,081,453 29,269,062 41,198,377 29,161,590 Basic weighted average Common Shares and Units
outstanding 56,040,684 37,475,060 49,176,866 37,421,301 Diluted weighted average Common Shares and Units
outstanding 56,133,932 37,596,760 49,250,856 37,494,563
Other Financial Information: Recurring capital expenditures2 Tenant improvements - Retail $ 64,390 $ 130,992 $ 152,980 $ 174,077
Tenant improvements – Commercial3 0 16,210 0 110,627
Leasing commissions - Retail 80,095 173,310 136,811 320,276 Leasing commissions – Commercial3 1,816 52,905 1,816 120,240
Capital improvements3 136,526 203,956 204,251 260,707Scheduled debt principal payments 915,084 805,763 1,782,195 1,511,380Straight line rent 462,921 142,064 576,503 462,921Market rent amortization income from acquired leases 780,682 934,052 1,563,112 1,625,953Market debt adjustment 107,714 107,714 215,428 215,429Capitalized interest 2,080,391 2,096,186 4,145,134 4,686,044Mark to market lease amount in Deferred Revenue and Other
Liabilities on consolidated balance sheet 14,106,224 Additional Construction in Progress not in development
pipeline4 46,462,762
____________________ 1 “Funds From Operations of the Kite Portfolio” measures 100% of the operating performance of the Operating Partnership’s real estate properties
and construction and service subsidiaries in which the Company owns an interest. “Funds From Operations allocable to the Company” reflects a reduction for the redeemable noncontrolling weighted average diluted interest in the Operating Partnership.
2 Excludes tenant improvements and leasing commissions relating to development projects and first-generation space.
3 A portion of these capital improvements are reimbursed by tenants and are revenue producing.
4 Represents projects being developed in phases or in transition to operating portfolio.
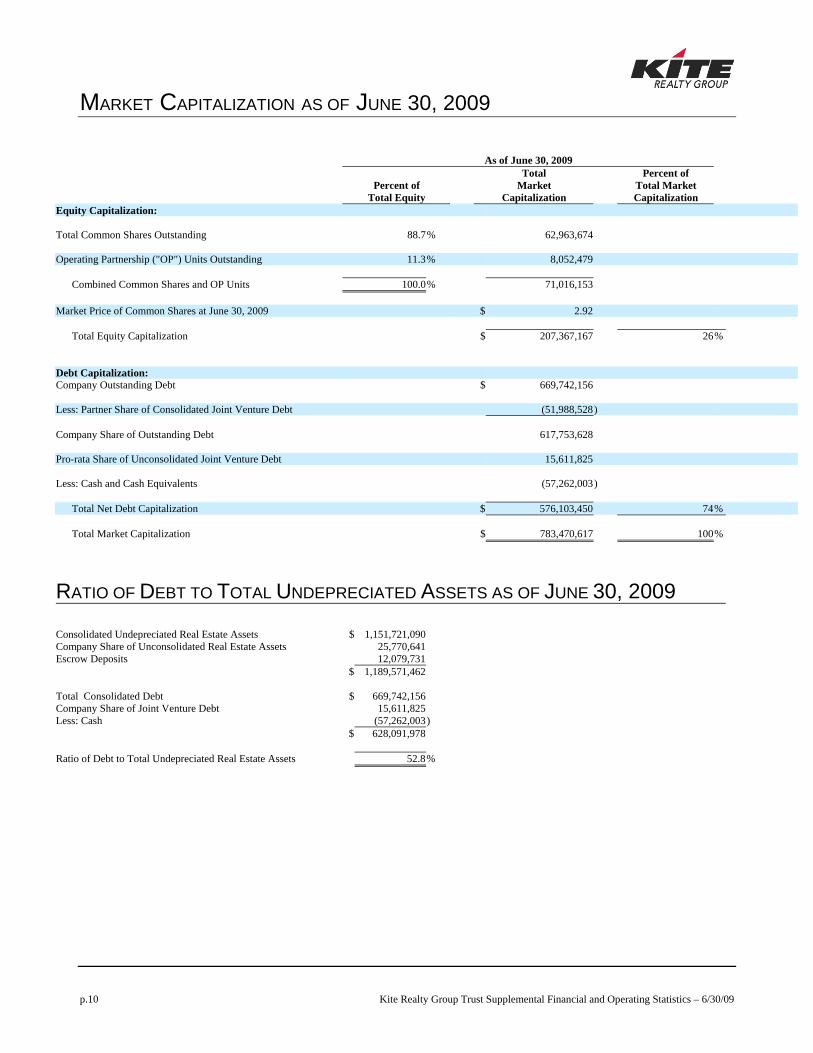
MARKET CAPITALIZATION AS OF JUNE 30, 2009
p.10 Kite Realty Group Trust Supplemental Financial and Operating Statistics – 6/30/09
As of June 30, 2009 Total Percent of Percent of Market Total Market Total Equity Capitalization Capitalization Equity Capitalization: Total Common Shares Outstanding 88.7% 62,963,674 Operating Partnership ("OP") Units Outstanding 11.3% 8,052,479
Combined Common Shares and OP Units 100.0% 71,016,153 Market Price of Common Shares at June 30, 2009 $ 2.92
Total Equity Capitalization $ 207,367,167 26%
Debt Capitalization: Company Outstanding Debt $ 669,742,156 Less: Partner Share of Consolidated Joint Venture Debt (51,988,528 ) Company Share of Outstanding Debt 617,753,628 Pro-rata Share of Unconsolidated Joint Venture Debt 15,611,825 Less: Cash and Cash Equivalents (57,262,003 )
Total Net Debt Capitalization $ 576,103,450 74% Total Market Capitalization $ 783,470,617 100%
RATIO OF DEBT TO TOTAL UNDEPRECIATED ASSETS AS OF JUNE 30, 2009
Consolidated Undepreciated Real Estate Assets $ 1,151,721,090 Company Share of Unconsolidated Real Estate Assets 25,770,641 Escrow Deposits 12,079,731 $ 1,189,571,462 Total Consolidated Debt $ 669,742,156 Company Share of Joint Venture Debt 15,611,825 Less: Cash (57,262,003) $ 628,091,978 Ratio of Debt to Total Undepreciated Real Estate Assets 52.8%
SAME PROPERTY NET OPERATING INCOME (NOI)
p.11 Kite Realty Group Trust Supplemental Financial and Operating Statistics – 6/30/09
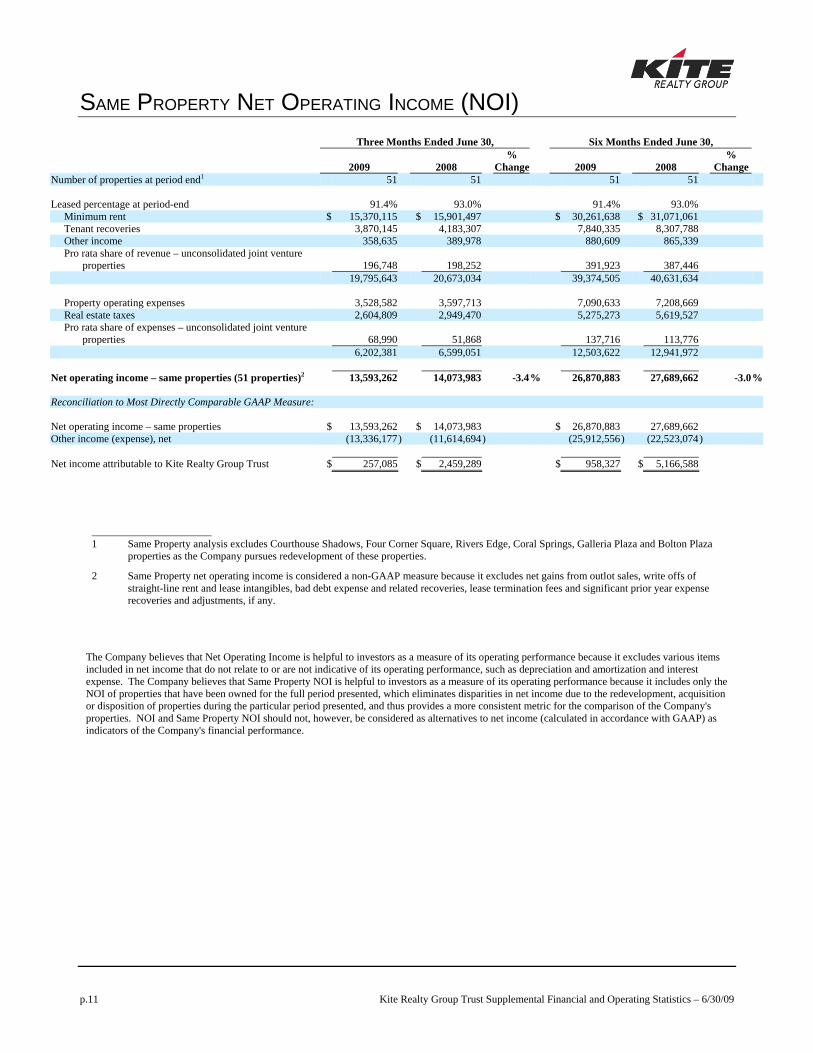
Three Months Ended June 30, Six Months Ended June 30,
2009 2008 %
Change 2009 2008 %
Change Number of properties at period end1 51 51 51 51 Leased percentage at period-end 91.4% 93.0% 91.4% 93.0% Minimum rent $ 15,370,115 $ 15,901,497 $ 30,261,638 $ 31,071,061 Tenant recoveries 3,870,145 4,183,307 7,840,335 8,307,788 Other income 358,635 389,978 880,609 865,339 Pro rata share of revenue – unconsolidated joint venture
properties 196,748 198,252 391,923 387,446 19,795,643 20,673,034 39,374,505 40,631,634 Property operating expenses 3,528,582 3,597,713 7,090,633 7,208,669 Real estate taxes 2,604,809 2,949,470 5,275,273 5,619,527 Pro rata share of expenses – unconsolidated joint venture
properties 68,990 51,868 137,716 113,776 6,202,381 6,599,051 12,503,622 12,941,972 Net operating income – same properties (51 properties)2 13,593,262 14,073,983 -3.4% 26,870,883 27,689,662 -3.0% Reconciliation to Most Directly Comparable GAAP Measure: Net operating income – same properties $ 13,593,262 $ 14,073,983 $ 26,870,883 27,689,662Other income (expense), net (13,336,177) (11,614,694) (25,912,556 ) (22,523,074) Net income attributable to Kite Realty Group Trust $ 257,085 $ 2,459,289 $ 958,327 $ 5,166,588
____________________ 1 Same Property analysis excludes Courthouse Shadows, Four Corner Square, Rivers Edge, Coral Springs, Galleria Plaza and Bolton Plaza
properties as the Company pursues redevelopment of these properties.
2 Same Property net operating income is considered a non-GAAP measure because it excludes net gains from outlot sales, write offs of straight-line rent and lease intangibles, bad debt expense and related recoveries, lease termination fees and significant prior year expense recoveries and adjustments, if any.
The Company believes that Net Operating Income is helpful to investors as a measure of its operating performance because it excludes various items included in net income that do not relate to or are not indicative of its operating performance, such as depreciation and amortization and interest expense. The Company believes that Same Property NOI is helpful to investors as a measure of its operating performance because it includes only the NOI of properties that have been owned for the full period presented, which eliminates disparities in net income due to the redevelopment, acquisition or disposition of properties during the particular period presented, and thus provides a more consistent metric for the comparison of the Company's properties. NOI and Same Property NOI should not, however, be considered as alternatives to net income (calculated in accordance with GAAP) as indicators of the Company's financial performance.
NET OPERATING INCOME BY QUARTER
p.12 Kite Realty Group Trust Supplemental Financial and Operating Statistics – 6/30/09
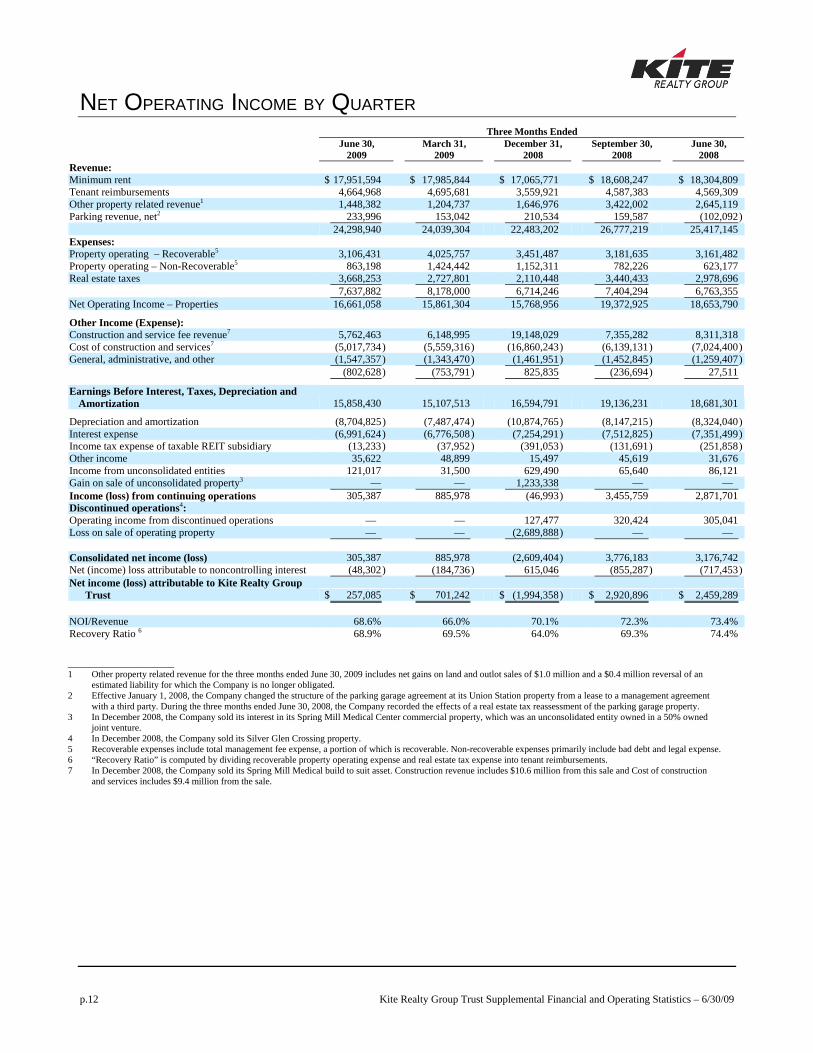
Three Months Ended
June 30,
2009 March 31,
2009 December 31,
2008 September 30,
2008 June 30,
2008 Revenue: Minimum rent $ 17,951,594 $ 17,985,844 $ 17,065,771 $ 18,608,247 $ 18,304,809 Tenant reimbursements 4,664,968 4,695,681 3,559,921 4,587,383 4,569,309 Other property related revenue1 1,448,382 1,204,737 1,646,976 3,422,002 2,645,119 Parking revenue, net2 233,996 153,042 210,534 159,587 (102,092) 24,298,940 24,039,304 22,483,202 26,777,219 25,417,145 Expenses: Property operating – Recoverable5 3,106,431 4,025,757 3,451,487 3,181,635 3,161,482 Property operating – Non-Recoverable5 863,198 1,424,442 1,152,311 782,226 623,177 Real estate taxes 3,668,253 2,727,801 2,110,448 3,440,433 2,978,696 7,637,882 8,178,000 6,714,246 7,404,294 6,763,355 Net Operating Income – Properties 16,661,058 15,861,304 15,768,956 19,372,925 18,653,790
Other Income (Expense): Construction and service fee revenue7 5,762,463 6,148,995 19,148,029 7,355,282 8,311,318 Cost of construction and services7 (5,017,734) (5,559,316) (16,860,243) (6,139,131 ) (7,024,400)General, administrative, and other (1,547,357) (1,343,470) (1,461,951) (1,452,845 ) (1,259,407) (802,628) (753,791) 825,835 (236,694 ) 27,511
Earnings Before Interest, Taxes, Depreciation and Amortization 15,858,430 15,107,513 16,594,791 19,136,231 18,681,301
Depreciation and amortization (8,704,825) (7,487,474) (10,874,765) (8,147,215 ) (8,324,040)Interest expense (6,991,624) (6,776,508) (7,254,291) (7,512,825 ) (7,351,499)Income tax expense of taxable REIT subsidiary (13,233) (37,952) (391,053) (131,691 ) (251,858)Other income 35,622 48,899 15,497 45,619 31,676 Income from unconsolidated entities 121,017 31,500 629,490 65,640 86,121 Gain on sale of unconsolidated property3 — — 1,233,338 — — Income (loss) from continuing operations 305,387 885,978 (46,993) 3,455,759 2,871,701 Discontinued operations4: Operating income from discontinued operations — — 127,477 320,424 305,041 Loss on sale of operating property — — (2,689,888) — — Consolidated net income (loss) 305,387 885,978 (2,609,404) 3,776,183 3,176,742 Net (income) loss attributable to noncontrolling interest (48,302) (184,736) 615,046 (855,287 ) (717,453)Net income (loss) attributable to Kite Realty Group
Trust $ 257,085 $ 701,242 $ (1,994,358) $ 2,920,896 $ 2,459,289 NOI/Revenue 68.6% 66.0% 70.1% 72.3% 73.4% Recovery Ratio 6 68.9% 69.5% 64.0% 69.3% 74.4%
____________________ 1 Other property related revenue for the three months ended June 30, 2009 includes net gains on land and outlot sales of $1.0 million and a $0.4 million reversal of an
estimated liability for which the Company is no longer obligated. 2 Effective January 1, 2008, the Company changed the structure of the parking garage agreement at its Union Station property from a lease to a management agreement
with a third party. During the three months ended June 30, 2008, the Company recorded the effects of a real estate tax reassessment of the parking garage property. 3 In December 2008, the Company sold its interest in its Spring Mill Medical Center commercial property, which was an unconsolidated entity owned in a 50% owned
joint venture. 4 In December 2008, the Company sold its Silver Glen Crossing property. 5 Recoverable expenses include total management fee expense, a portion of which is recoverable. Non-recoverable expenses primarily include bad debt and legal expense.6 “Recovery Ratio” is computed by dividing recoverable property operating expense and real estate tax expense into tenant reimbursements. 7 In December 2008, the Company sold its Spring Mill Medical build to suit asset. Construction revenue includes $10.6 million from this sale and Cost of construction
and services includes $9.4 million from the sale.
SUMMARY OF OUTSTANDING DEBT AS OF JUNE 30, 2009 SEE REFINANCING UPDATE ON PAGE 17
p.13 Kite Realty Group Trust Supplemental Financial and Operating Statistics – 6/30/09
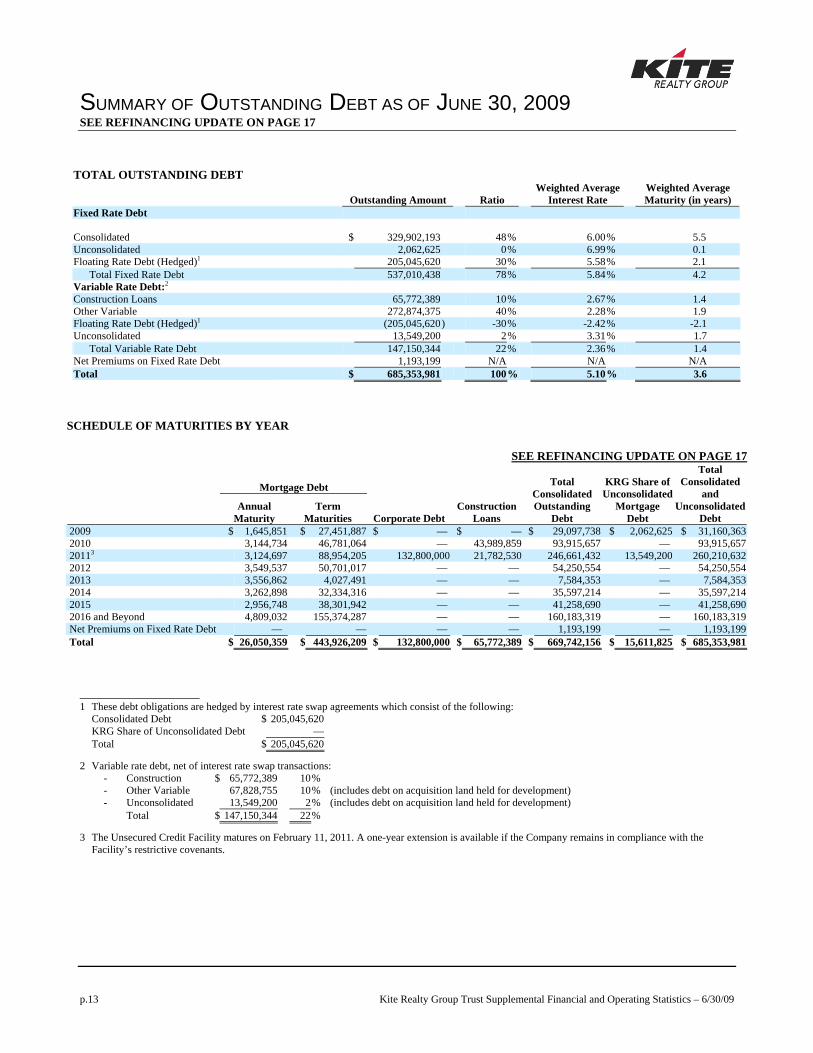
TOTAL OUTSTANDING DEBT
Outstanding Amount Ratio Weighted Average
Interest Rate Weighted Average Maturity (in years)
Fixed Rate Debt
Consolidated $ 329,902,193 48% 6.00 % 5.5 Unconsolidated 2,062,625 0% 6.99 % 0.1 Floating Rate Debt (Hedged)1 205,045,620 30% 5.58 % 2.1
Total Fixed Rate Debt 537,010,438 78% 5.84 % 4.2 Variable Rate Debt:2 Construction Loans 65,772,389 10% 2.67 % 1.4 Other Variable 272,874,375 40% 2.28 % 1.9 Floating Rate Debt (Hedged)1 (205,045,620) -30% -2.42 % -2.1 Unconsolidated 13,549,200 2% 3.31 % 1.7
Total Variable Rate Debt 147,150,344 22% 2.36 % 1.4 Net Premiums on Fixed Rate Debt 1,193,199 N/A N/A N/A Total $ 685,353,981 100% 5.10 % 3.6
SCHEDULE OF MATURITIES BY YEAR
SEE REFINANCING UPDATE ON PAGE 17
Mortgage Debt
Annual
Maturity Term
Maturities Corporate Debt Construction
Loans
Total Consolidated Outstanding
Debt
KRG Share of Unconsolidated
Mortgage Debt
Total Consolidated
and Unconsolidated
Debt 2009 $ 1,645,851 $ 27,451,887 $ — $ — $ 29,097,738 $ 2,062,625 $ 31,160,363 2010 3,144,734 46,781,064 — 43,989,859 93,915,657 — 93,915,657 20113 3,124,697 88,954,205 132,800,000 21,782,530 246,661,432 13,549,200 260,210,632 2012 3,549,537 50,701,017 — — 54,250,554 — 54,250,554 2013 3,556,862 4,027,491 — — 7,584,353 — 7,584,353 2014 3,262,898 32,334,316 — — 35,597,214 — 35,597,214 2015 2,956,748 38,301,942 — — 41,258,690 — 41,258,690 2016 and Beyond 4,809,032 155,374,287 — — 160,183,319 — 160,183,319 Net Premiums on Fixed Rate Debt — — — — 1,193,199 — 1,193,199 Total $ 26,050,359 $ 443,926,209 $ 132,800,000 $ 65,772,389 $ 669,742,156 $ 15,611,825 $ 685,353,981
____________________ 1 These debt obligations are hedged by interest rate swap agreements which consist of the following: Consolidated Debt $ 205,045,620 KRG Share of Unconsolidated Debt — Total $ 205,045,620
2 Variable rate debt, net of interest rate swap transactions: - Construction $ 65,772,389 10 % - Other Variable 67,828,755 10 % (includes debt on acquisition land held for development) - Unconsolidated 13,549,200 2 % (includes debt on acquisition land held for development) Total $ 147,150,344 22 %
3 The Unsecured Credit Facility matures on February 11, 2011. A one-year extension is available if the Company remains in compliance with the Facility’s restrictive covenants.
SCHEDULE OF OUTSTANDING DEBT AS OF JUNE 30, 2009
p.14 Kite Realty Group Trust Supplemental Financial and Operating Statistics – 6/30/09
CONSOLIDATED DEBT
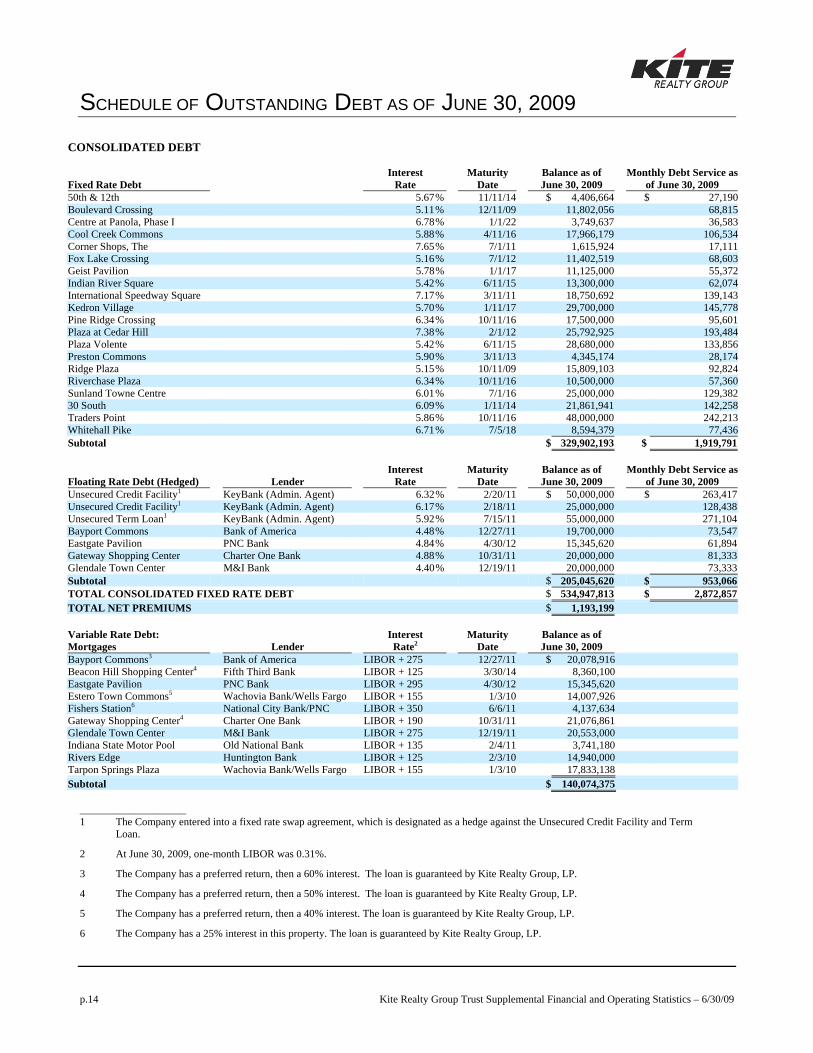
Fixed Rate Debt Interest
Rate Maturity
Date Balance as of June 30, 2009
Monthly Debt Service as of June 30, 2009
50th & 12th 5.67% 11/11/14 $ 4,406,664 $ 27,190Boulevard Crossing 5.11% 12/11/09 11,802,056 68,815Centre at Panola, Phase I 6.78% 1/1/22 3,749,637 36,583Cool Creek Commons 5.88% 4/11/16 17,966,179 106,534Corner Shops, The 7.65% 7/1/11 1,615,924 17,111Fox Lake Crossing 5.16% 7/1/12 11,402,519 68,603Geist Pavilion 5.78% 1/1/17 11,125,000 55,372Indian River Square 5.42% 6/11/15 13,300,000 62,074International Speedway Square 7.17% 3/11/11 18,750,692 139,143Kedron Village 5.70% 1/11/17 29,700,000 145,778Pine Ridge Crossing 6.34% 10/11/16 17,500,000 95,601Plaza at Cedar Hill 7.38% 2/1/12 25,792,925 193,484Plaza Volente 5.42% 6/11/15 28,680,000 133,856Preston Commons 5.90% 3/11/13 4,345,174 28,174Ridge Plaza 5.15% 10/11/09 15,809,103 92,824Riverchase Plaza 6.34% 10/11/16 10,500,000 57,360Sunland Towne Centre 6.01% 7/1/16 25,000,000 129,38230 South 6.09% 1/11/14 21,861,941 142,258Traders Point 5.86% 10/11/16 48,000,000 242,213Whitehall Pike 6.71% 7/5/18 8,594,379 77,436Subtotal $ 329,902,193 $ 1,919,791
Floating Rate Debt (Hedged) Lender Interest
Rate Maturity
Date Balance as of June 30, 2009
Monthly Debt Service as of June 30, 2009
Unsecured Credit Facility1 KeyBank (Admin. Agent) 6.32% 2/20/11 $ 50,000,000 $ 263,417Unsecured Credit Facility1 KeyBank (Admin. Agent) 6.17% 2/18/11 25,000,000 128,438Unsecured Term Loan1 KeyBank (Admin. Agent) 5.92% 7/15/11 55,000,000 271,104Bayport Commons Bank of America 4.48% 12/27/11 19,700,000 73,547Eastgate Pavilion PNC Bank 4.84% 4/30/12 15,345,620 61,894Gateway Shopping Center Charter One Bank 4.88% 10/31/11 20,000,000 81,333Glendale Town Center M&I Bank 4.40% 12/19/11 20,000,000 73,333Subtotal $ 205,045,620 $ 953,066TOTAL CONSOLIDATED FIXED RATE DEBT $ 534,947,813 $ 2,872,857TOTAL NET PREMIUMS $ 1,193,199 Variable Rate Debt: Mortgages Lender
Interest Rate2
Maturity Date
Balance as of June 30, 2009
Bayport Commons3 Bank of America LIBOR + 275 12/27/11 $ 20,078,916 Beacon Hill Shopping Center4 Fifth Third Bank LIBOR + 125 3/30/14 8,360,100 Eastgate Pavilion PNC Bank LIBOR + 295 4/30/12 15,345,620 Estero Town Commons5 Wachovia Bank/Wells Fargo LIBOR + 155 1/3/10 14,007,926 Fishers Station6 National City Bank/PNC LIBOR + 350 6/6/11 4,137,634 Gateway Shopping Center4 Charter One Bank LIBOR + 190 10/31/11 21,076,861 Glendale Town Center M&I Bank LIBOR + 275 12/19/11 20,553,000 Indiana State Motor Pool Old National Bank LIBOR + 135 2/4/11 3,741,180 Rivers Edge Huntington Bank LIBOR + 125 2/3/10 14,940,000 Tarpon Springs Plaza Wachovia Bank/Wells Fargo LIBOR + 155 1/3/10 17,833,138 Subtotal $ 140,074,375
____________________ 1 The Company entered into a fixed rate swap agreement, which is designated as a hedge against the Unsecured Credit Facility and Term
Loan.
2 At June 30, 2009, one-month LIBOR was 0.31%.
3 The Company has a preferred return, then a 60% interest. The loan is guaranteed by Kite Realty Group, LP.
4 The Company has a preferred return, then a 50% interest. The loan is guaranteed by Kite Realty Group, LP.
5 The Company has a preferred return, then a 40% interest. The loan is guaranteed by Kite Realty Group, LP.
6 The Company has a 25% interest in this property. The loan is guaranteed by Kite Realty Group, LP.
SCHEDULE OF OUTSTANDING DEBT AS OF JUNE 30, 2009 (CONTINUED)
SEE REFINANCING UPDATE ON PAGE 17
p.15 Kite Realty Group Trust Supplemental Financial and Operating Statistics – 6/30/09
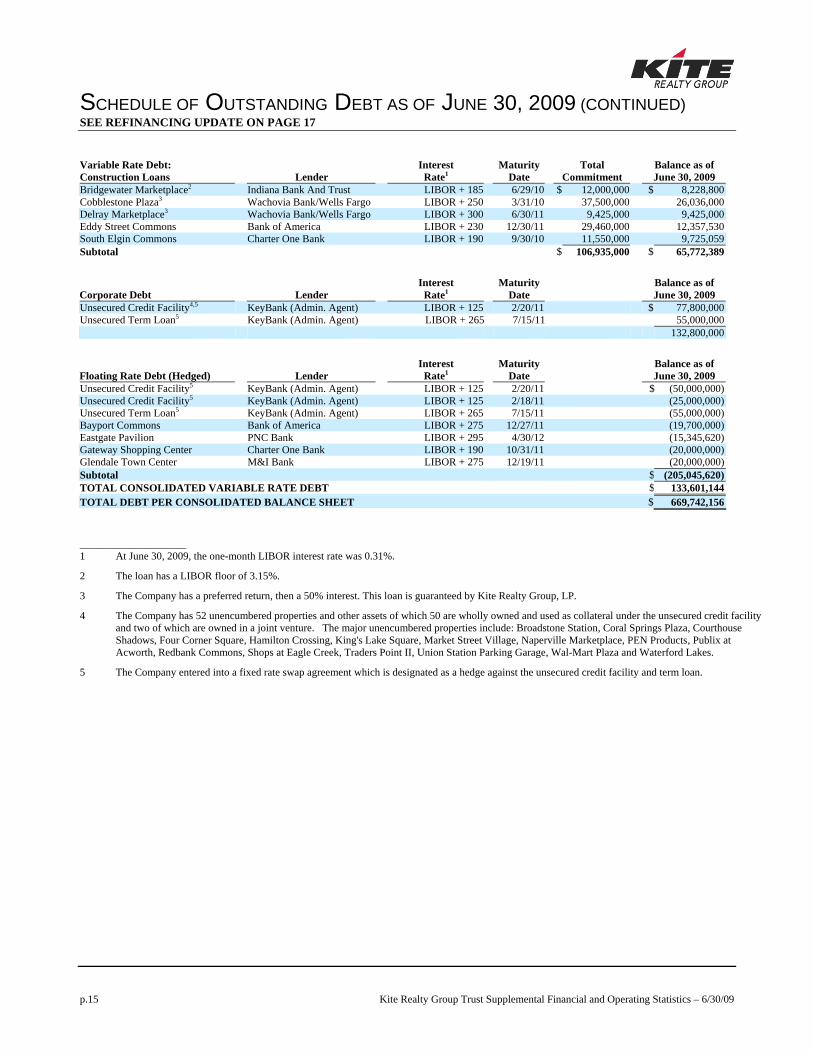
Variable Rate Debt: Construction Loans Lender
Interest Rate1
Maturity Date
Total Commitment
Balance as of June 30, 2009
Bridgewater Marketplace2 Indiana Bank And Trust LIBOR + 185 6/29/10 $ 12,000,000 $ 8,228,800Cobblestone Plaza3 Wachovia Bank/Wells Fargo LIBOR + 250 3/31/10 37,500,000 26,036,000Delray Marketplace3 Wachovia Bank/Wells Fargo LIBOR + 300 6/30/11 9,425,000 9,425,000Eddy Street Commons Bank of America LIBOR + 230 12/30/11 29,460,000 12,357,530South Elgin Commons Charter One Bank LIBOR + 190 9/30/10 11,550,000 9,725,059Subtotal $ 106,935,000 $ 65,772,389
Corporate Debt Lender Interest
Rate1 Maturity
Date Balance as of June 30, 2009
Unsecured Credit Facility4,5 KeyBank (Admin. Agent) LIBOR + 125 2/20/11 $ 77,800,000Unsecured Term Loan5 KeyBank (Admin. Agent) LIBOR + 265 7/15/11 55,000,000 132,800,000
Floating Rate Debt (Hedged) Lender Interest
Rate1 Maturity
Date Balance as of June 30, 2009
Unsecured Credit Facility5 KeyBank (Admin. Agent) LIBOR + 125 2/20/11 $ (50,000,000)Unsecured Credit Facility5 KeyBank (Admin. Agent) LIBOR + 125 2/18/11 (25,000,000)Unsecured Term Loan5 KeyBank (Admin. Agent) LIBOR + 265 7/15/11 (55,000,000)Bayport Commons Bank of America LIBOR + 275 12/27/11 (19,700,000)Eastgate Pavilion PNC Bank LIBOR + 295 4/30/12 (15,345,620)Gateway Shopping Center Charter One Bank LIBOR + 190 10/31/11 (20,000,000)Glendale Town Center M&I Bank LIBOR + 275 12/19/11 (20,000,000)Subtotal $ (205,045,620)TOTAL CONSOLIDATED VARIABLE RATE DEBT $ 133,601,144TOTAL DEBT PER CONSOLIDATED BALANCE SHEET $ 669,742,156 ____________________ 1 At June 30, 2009, the one-month LIBOR interest rate was 0.31%.
2 The loan has a LIBOR floor of 3.15%.
3 The Company has a preferred return, then a 50% interest. This loan is guaranteed by Kite Realty Group, LP.
4 The Company has 52 unencumbered properties and other assets of which 50 are wholly owned and used as collateral under the unsecured credit facility and two of which are owned in a joint venture. The major unencumbered properties include: Broadstone Station, Coral Springs Plaza, Courthouse Shadows, Four Corner Square, Hamilton Crossing, King's Lake Square, Market Street Village, Naperville Marketplace, PEN Products, Publix at Acworth, Redbank Commons, Shops at Eagle Creek, Traders Point II, Union Station Parking Garage, Wal-Mart Plaza and Waterford Lakes.
5 The Company entered into a fixed rate swap agreement which is designated as a hedge against the unsecured credit facility and term loan.
SCHEDULE OF OUTSTANDING DEBT AS OF JUNE 30, 2009 (CONTINUED)
SEE REFINANCING UPDATE ON PAGE 17
p.16 Kite Realty Group Trust Supplemental Financial and Operating Statistics – 6/30/09
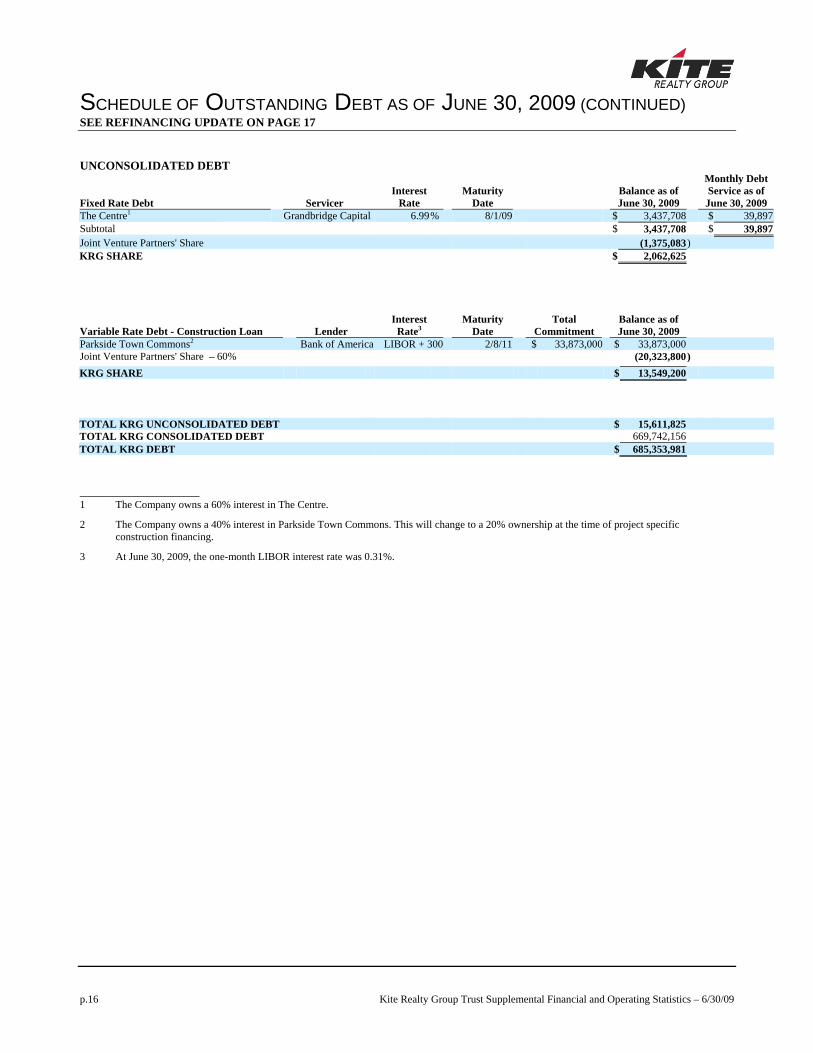
UNCONSOLIDATED DEBT
Fixed Rate Debt Servicer Interest
Rate Maturity
Date Balance as of June 30, 2009
Monthly Debt Service as of June 30, 2009
The Centre1 Grandbridge Capital 6.99% 8/1/09 $ 3,437,708 $ 39,897Subtotal $ 3,437,708 $ 39,897Joint Venture Partners' Share (1,375,083) KRG SHARE $ 2,062,625
Variable Rate Debt - Construction Loan
Lender Interest
Rate3 Maturity
Date Total
Commitment Balance as of June 30, 2009
Parkside Town Commons2 Bank of America LIBOR + 300 2/8/11 $ 33,873,000 $ 33,873,000Joint Venture Partners' Share – 60% (20,323,800) KRG SHARE $ 13,549,200 TOTAL KRG UNCONSOLIDATED DEBT $ 15,611,825 TOTAL KRG CONSOLIDATED DEBT 669,742,156 TOTAL KRG DEBT $ 685,353,981
____________________ 1 The Company owns a 60% interest in The Centre.
2 The Company owns a 40% interest in Parkside Town Commons. This will change to a 20% ownership at the time of project specific construction financing.
3 At June 30, 2009, the one-month LIBOR interest rate was 0.31%.
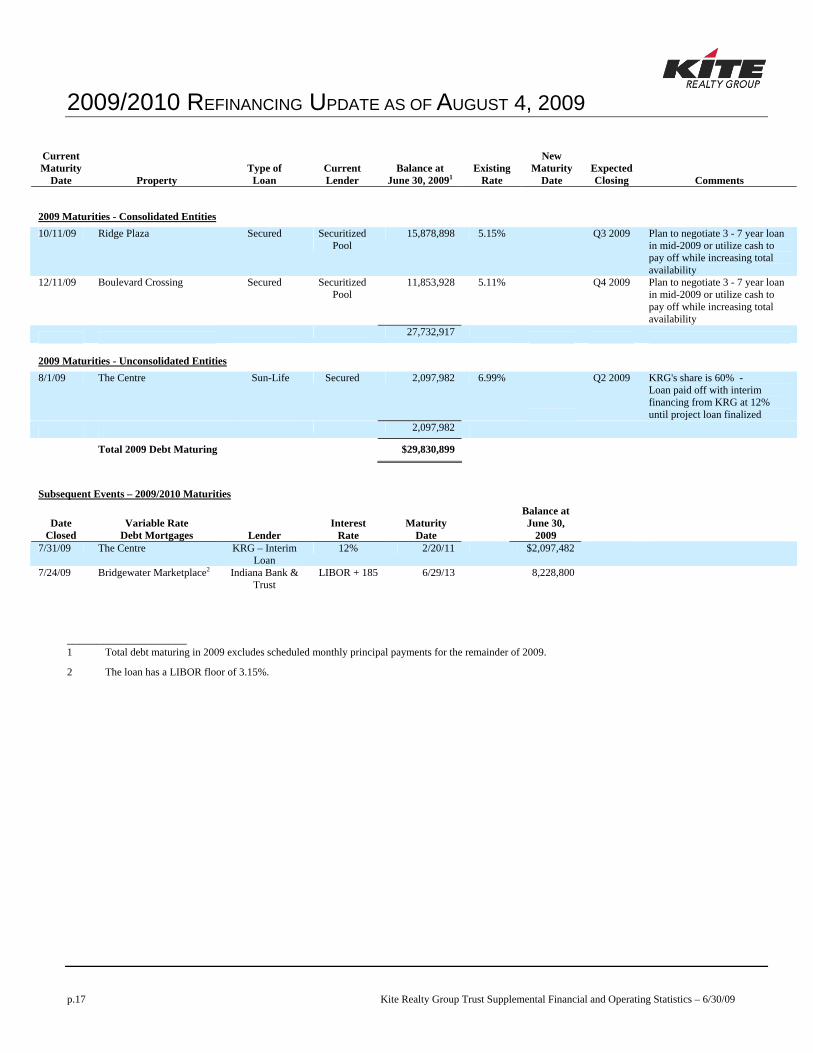
2009/2010 REFINANCING UPDATE AS OF AUGUST 4, 2009
p.17 Kite Realty Group Trust Supplemental Financial and Operating Statistics – 6/30/09
Current Maturity
Date Property Type of
Loan
Current Lender
Balance at June 30, 20091
Existing Rate
New Maturity
Date Expected Closing Comments
2009 Maturities - Consolidated Entities
10/11/09 Ridge Plaza Secured Securitized
Pool 15,878,898 5.15% Q3 2009 Plan to negotiate 3 - 7 year loan
in mid-2009 or utilize cash to pay off while increasing total availability
12/11/09 Boulevard Crossing
Secured Securitized Pool
11,853,928 5.11%
Q4 2009 Plan to negotiate 3 - 7 year loan in mid-2009 or utilize cash to pay off while increasing total availability
27,732,917
2009 Maturities - Unconsolidated Entities
8/1/09 The Centre Sun-Life Secured 2,097,982 6.99%
Q2 2009 KRG's share is 60% - Loan paid off with interim financing from KRG at 12% until project loan finalized
2,097,982
Total 2009 Debt Maturing $29,830,899
Subsequent Events – 2009/2010 Maturities
Date Closed
Variable Rate Debt Mortgages Lender
Interest
Rate
Maturity
Date
Balance at June 30,
2009 7/31/09 The Centre KRG – Interim
Loan 12% 2/20/11 $2,097,482
7/24/09 Bridgewater Marketplace2 Indiana Bank & Trust
LIBOR + 185 6/29/13 8,228,800
____________________ 1 Total debt maturing in 2009 excludes scheduled monthly principal payments for the remainder of 2009.
2 The loan has a LIBOR floor of 3.15%.
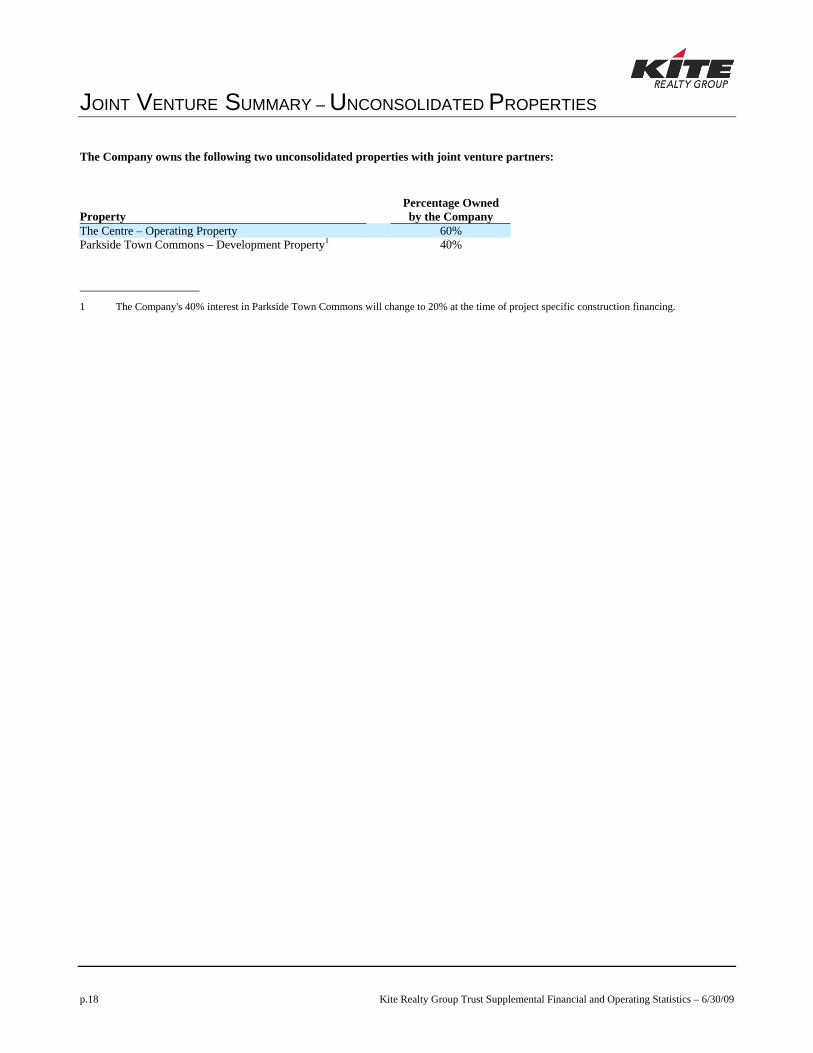
JOINT VENTURE SUMMARY – UNCONSOLIDATED PROPERTIES
p.18 Kite Realty Group Trust Supplemental Financial and Operating Statistics – 6/30/09
The Company owns the following two unconsolidated properties with joint venture partners:
Property Percentage Owned by the Company
The Centre – Operating Property 60% Parkside Town Commons – Development Property1 40% ____________________
1 The Company's 40% interest in Parkside Town Commons will change to 20% at the time of project specific construction financing.
CONDENSED COMBINED BALANCE SHEETS OF UNCONSOLIDATED
PROPERTIES
p.19 Kite Realty Group Trust Supplemental Financial and Operating Statistics – 6/30/09
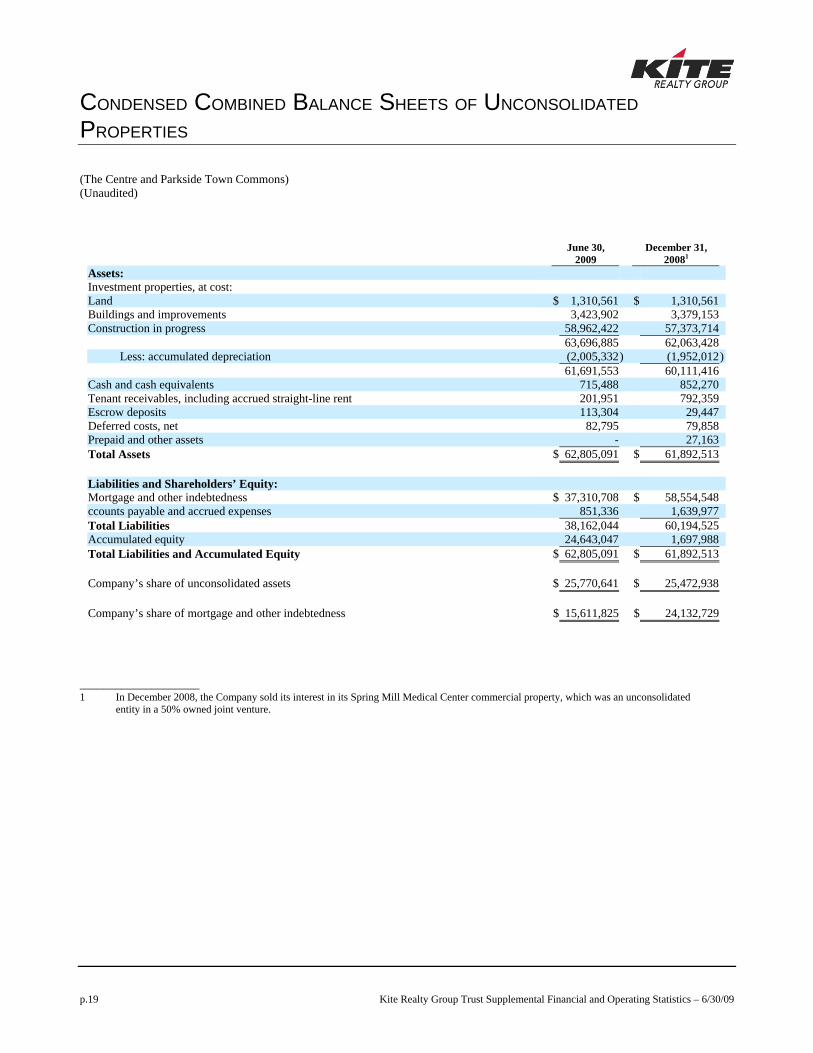
(The Centre and Parkside Town Commons) (Unaudited)
June 30,
2009 December 31,
20081 Assets: Investment properties, at cost: Land $ 1,310,561 $ 1,310,561 Buildings and improvements 3,423,902 3,379,153 Construction in progress 58,962,422 57,373,714 63,696,885 62,063,428
Less: accumulated depreciation (2,005,332 ) (1,952,012) 61,691,553 60,111,416 Cash and cash equivalents 715,488 852,270 Tenant receivables, including accrued straight-line rent 201,951 792,359 Escrow deposits 113,304 29,447 Deferred costs, net 82,795 79,858 Prepaid and other assets - 27,163 Total Assets $ 62,805,091 $ 61,892,513 Liabilities and Shareholders’ Equity: Mortgage and other indebtedness $ 37,310,708 $ 58,554,548 ccounts payable and accrued expenses 851,336 1,639,977 Total Liabilities 38,162,044 60,194,525 Accumulated equity 24,643,047 1,697,988Total Liabilities and Accumulated Equity $ 62,805,091 $ 61,892,513 Company’s share of unconsolidated assets $ 25,770,641 $ 25,472,938
Company’s share of mortgage and other indebtedness $ 15,611,825 $ 24,132,729
____________________ 1 In December 2008, the Company sold its interest in its Spring Mill Medical Center commercial property, which was an unconsolidated
entity in a 50% owned joint venture.
CONDENSED COMBINED STATEMENTS OF OPERATIONS OF UNCONSOLIDATED PROPERTIES
p.20 Kite Realty Group Trust Supplemental Financial and Operating Statistics – 6/30/09
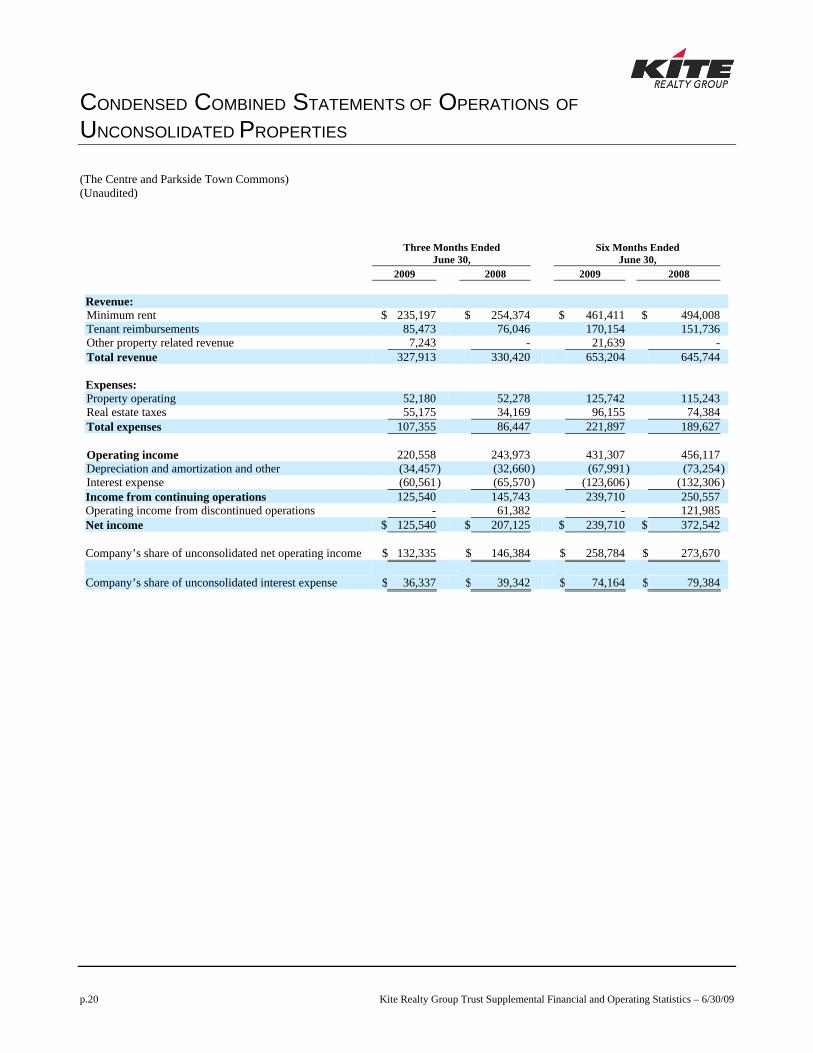
(The Centre and Parkside Town Commons) (Unaudited)
Three Months Ended
June 30, Six Months Ended
June 30, 2009 2008 2009 2008 Revenue: Minimum rent $ 235,197 $ 254,374 $ 461,411 $ 494,008 Tenant reimbursements 85,473 76,046 170,154 151,736 Other property related revenue 7,243 - 21,639 - Total revenue 327,913 330,420 653,204 645,744
Expenses: Property operating 52,180 52,278 125,742 115,243 Real estate taxes 55,175 34,169 96,155 74,384 Total expenses 107,355 86,447 221,897 189,627 Operating income 220,558 243,973 431,307 456,117 Depreciation and amortization and other (34,457) (32,660) (67,991 ) (73,254)Interest expense (60,561) (65,570) (123,606 ) (132,306)Income from continuing operations 125,540 145,743 239,710 250,557 Operating income from discontinued operations - 61,382 - 121,985 Net income $ 125,540 $ 207,125 $ 239,710 $ 372,542
Company’s share of unconsolidated net operating income $ 132,335 $ 146,384 $ 258,784
$ 273,670
Company’s share of unconsolidated interest expense $ 36,337 $ 39,342 $ 74,164
$ 79,384
TOP 10 RETAIL TENANTS BY GROSS LEASABLE AREA (GLA)
p.21 Kite Realty Group Trust Supplemental Financial and Operating Statistics – 6/30/09
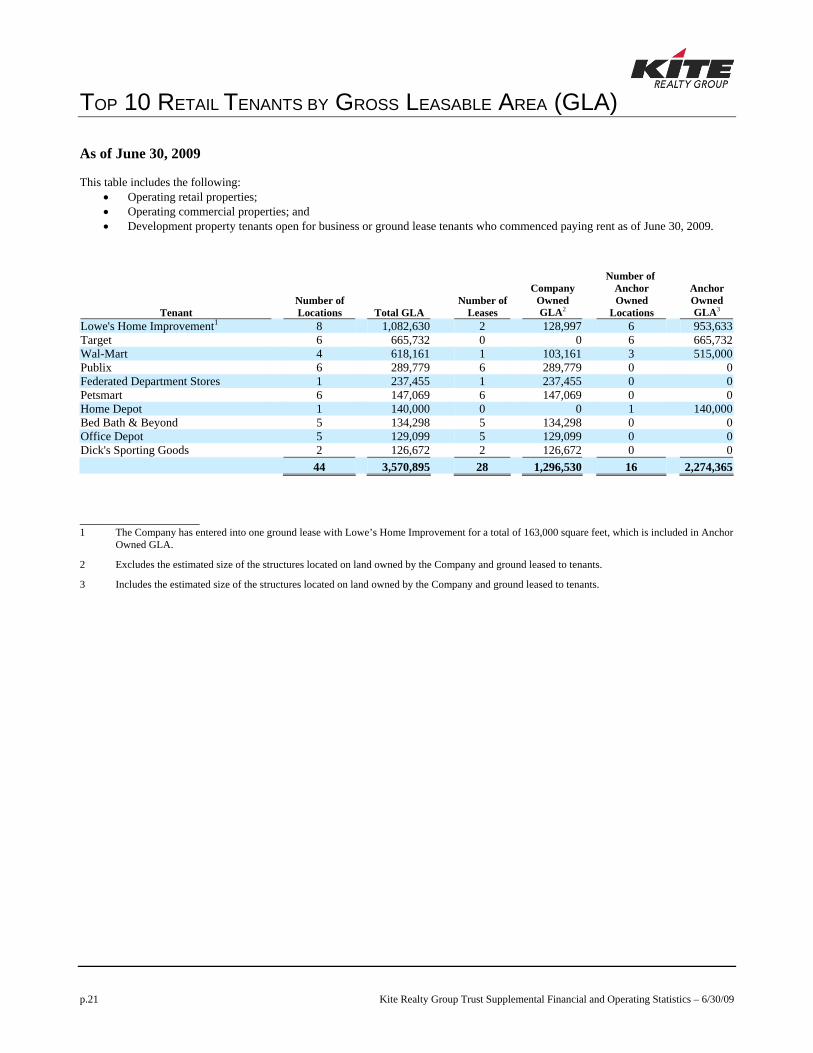
As of June 30, 2009 This table includes the following:
• Operating retail properties; • Operating commercial properties; and • Development property tenants open for business or ground lease tenants who commenced paying rent as of June 30, 2009.
Tenant Number of Locations Total GLA
Number of Leases
Company Owned GLA2
Number of Anchor Owned
Locations
Anchor Owned GLA3
Lowe's Home Improvement1 8 1,082,630 2 128,997 6 953,633 Target 6 665,732 0 0 6 665,732 Wal-Mart 4 618,161 1 103,161 3 515,000 Publix 6 289,779 6 289,779 0 0 Federated Department Stores 1 237,455 1 237,455 0 0 Petsmart 6 147,069 6 147,069 0 0 Home Depot 1 140,000 0 0 1 140,000 Bed Bath & Beyond 5 134,298 5 134,298 0 0 Office Depot 5 129,099 5 129,099 0 0 Dick's Sporting Goods 2 126,672 2 126,672 0 0 44 3,570,895 28 1,296,530 16 2,274,365 ____________________ 1 The Company has entered into one ground lease with Lowe’s Home Improvement for a total of 163,000 square feet, which is included in Anchor
Owned GLA.
2 Excludes the estimated size of the structures located on land owned by the Company and ground leased to tenants.
3 Includes the estimated size of the structures located on land owned by the Company and ground leased to tenants.
TOP 25 TENANTS BY ANNUALIZED BASE RENT1,2
p.22 Kite Realty Group Trust Supplemental Financial and Operating Statistics – 6/30/09
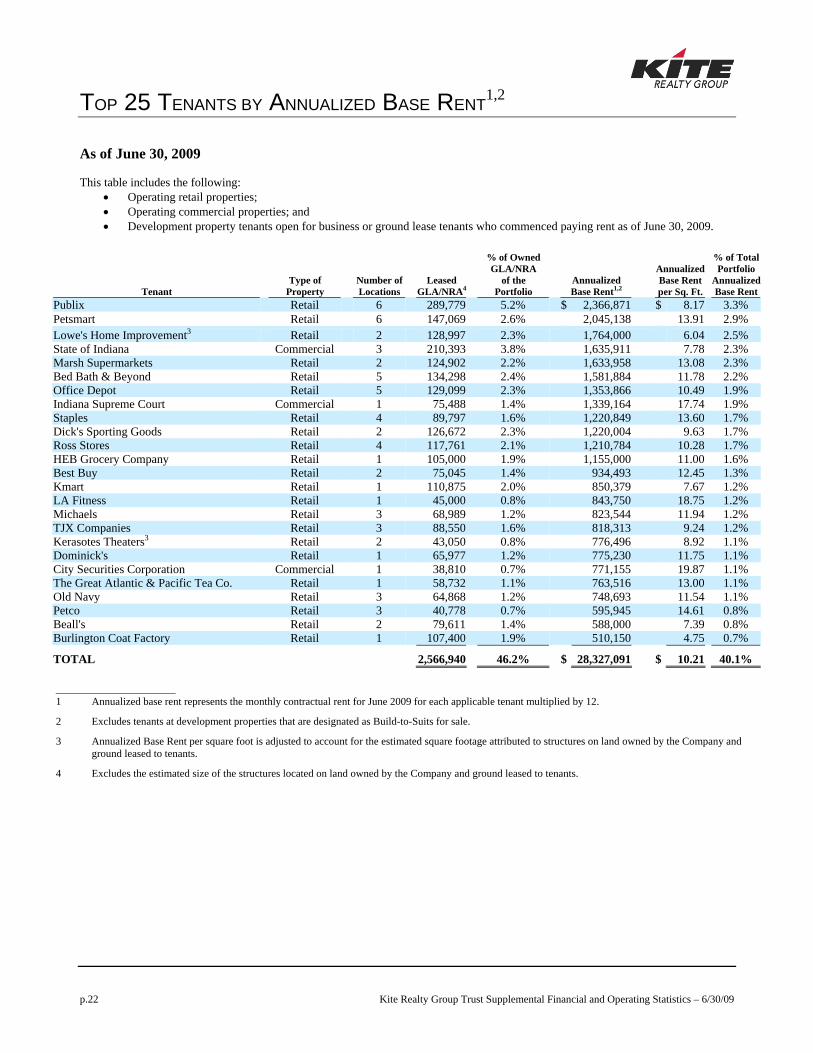
As of June 30, 2009 This table includes the following:
• Operating retail properties; • Operating commercial properties; and • Development property tenants open for business or ground lease tenants who commenced paying rent as of June 30, 2009.
Tenant Type of Property
Number ofLocations
Leased GLA/NRA4
% of Owned GLA/NRA
of the Portfolio
Annualized Base Rent1,2
Annualized Base Rent per Sq. Ft.
% of Total Portfolio
Annualized Base Rent
Publix Retail 6 289,779 5.2% $ 2,366,871 $ 8.17 3.3% Petsmart Retail 6 147,069 2.6% 2,045,138 13.91 2.9% Lowe's Home Improvement3 Retail 2 128,997 2.3% 1,764,000 6.04 2.5% State of Indiana Commercial 3 210,393 3.8% 1,635,911 7.78 2.3% Marsh Supermarkets Retail 2 124,902 2.2% 1,633,958 13.08 2.3% Bed Bath & Beyond Retail 5 134,298 2.4% 1,581,884 11.78 2.2% Office Depot Retail 5 129,099 2.3% 1,353,866 10.49 1.9% Indiana Supreme Court Commercial 1 75,488 1.4% 1,339,164 17.74 1.9% Staples Retail 4 89,797 1.6% 1,220,849 13.60 1.7% Dick's Sporting Goods Retail 2 126,672 2.3% 1,220,004 9.63 1.7% Ross Stores Retail 4 117,761 2.1% 1,210,784 10.28 1.7% HEB Grocery Company Retail 1 105,000 1.9% 1,155,000 11.00 1.6% Best Buy Retail 2 75,045 1.4% 934,493 12.45 1.3% Kmart Retail 1 110,875 2.0% 850,379 7.67 1.2% LA Fitness Retail 1 45,000 0.8% 843,750 18.75 1.2% Michaels Retail 3 68,989 1.2% 823,544 11.94 1.2% TJX Companies Retail 3 88,550 1.6% 818,313 9.24 1.2% Kerasotes Theaters3 Retail 2 43,050 0.8% 776,496 8.92 1.1% Dominick's Retail 1 65,977 1.2% 775,230 11.75 1.1% City Securities Corporation Commercial 1 38,810 0.7% 771,155 19.87 1.1% The Great Atlantic & Pacific Tea Co. Retail 1 58,732 1.1% 763,516 13.00 1.1% Old Navy Retail 3 64,868 1.2% 748,693 11.54 1.1% Petco Retail 3 40,778 0.7% 595,945 14.61 0.8% Beall's Retail 2 79,611 1.4% 588,000 7.39 0.8% Burlington Coat Factory Retail 1 107,400 1.9% 510,150 4.75 0.7%
TOTAL 2,566,940 46.2% $ 28,327,091 $ 10.21 40.1%
____________________ 1 Annualized base rent represents the monthly contractual rent for June 2009 for each applicable tenant multiplied by 12.
2 Excludes tenants at development properties that are designated as Build-to-Suits for sale.
3 Annualized Base Rent per square foot is adjusted to account for the estimated square footage attributed to structures on land owned by the Company and ground leased to tenants.
4 Excludes the estimated size of the structures located on land owned by the Company and ground leased to tenants.
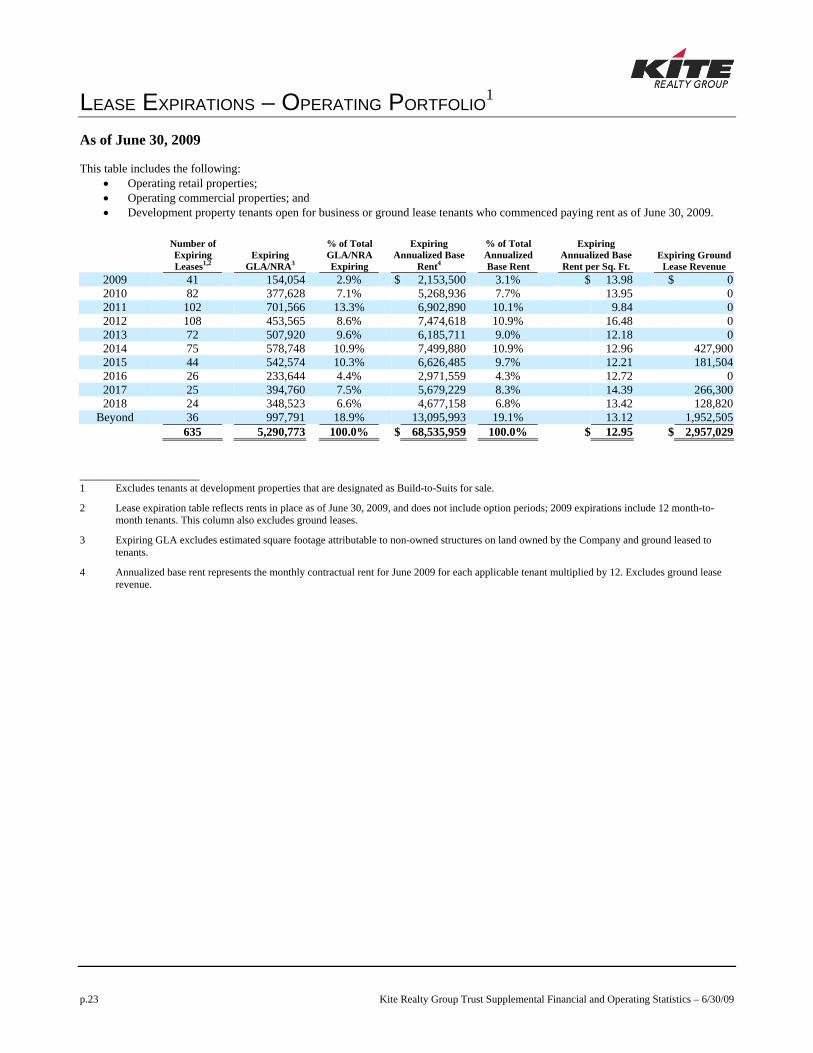
LEASE EXPIRATIONS – OPERATING PORTFOLIO1
p.23 Kite Realty Group Trust Supplemental Financial and Operating Statistics – 6/30/09
As of June 30, 2009 This table includes the following:
• Operating retail properties; • Operating commercial properties; and • Development property tenants open for business or ground lease tenants who commenced paying rent as of June 30, 2009.
Number of Expiring Leases1,2 Expiring
GLA/NRA3 % of Total GLA/NRA Expiring
Expiring Annualized Base
Rent4 % of Total Annualized Base Rent
Expiring Annualized Base Rent per Sq. Ft. Expiring Ground
Lease Revenue 2009 41 154,054 2.9% $ 2,153,500 3.1% $ 13.98 $ 0 2010 82 377,628 7.1% 5,268,936 7.7% 13.95 0 2011 102 701,566 13.3% 6,902,890 10.1% 9.84 0 2012 108 453,565 8.6% 7,474,618 10.9% 16.48 0 2013 72 507,920 9.6% 6,185,711 9.0% 12.18 0 2014 75 578,748 10.9% 7,499,880 10.9% 12.96 427,900 2015 44 542,574 10.3% 6,626,485 9.7% 12.21 181,504 2016 26 233,644 4.4% 2,971,559 4.3% 12.72 0 2017 25 394,760 7.5% 5,679,229 8.3% 14.39 266,300 2018 24 348,523 6.6% 4,677,158 6.8% 13.42 128,820
Beyond 36 997,791 18.9% 13,095,993 19.1% 13.12 1,952,505 635 5,290,773 100.0% $ 68,535,959 100.0% $ 12.95 $ 2,957,029
____________________ 1 Excludes tenants at development properties that are designated as Build-to-Suits for sale.
2 Lease expiration table reflects rents in place as of June 30, 2009, and does not include option periods; 2009 expirations include 12 month-to-month tenants. This column also excludes ground leases.
3 Expiring GLA excludes estimated square footage attributable to non-owned structures on land owned by the Company and ground leased to tenants.
4 Annualized base rent represents the monthly contractual rent for June 2009 for each applicable tenant multiplied by 12. Excludes ground lease revenue.
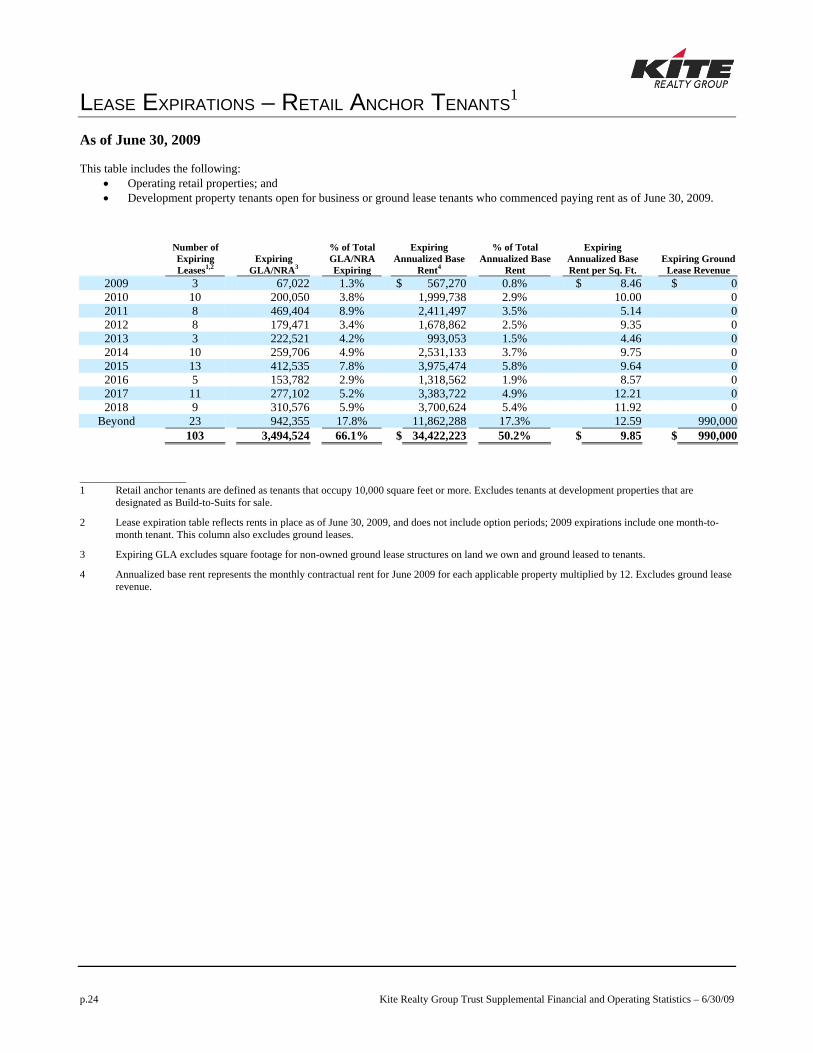
LEASE EXPIRATIONS – RETAIL ANCHOR TENANTS1
p.24 Kite Realty Group Trust Supplemental Financial and Operating Statistics – 6/30/09
As of June 30, 2009 This table includes the following:
• Operating retail properties; and • Development property tenants open for business or ground lease tenants who commenced paying rent as of June 30, 2009.
Number of Expiring Leases1,2
Expiring GLA/NRA3
% of Total GLA/NRA Expiring
Expiring Annualized Base
Rent4
% of Total Annualized Base
Rent
Expiring Annualized Base Rent per Sq. Ft.
Expiring Ground Lease Revenue
2009 3 67,022 1.3% $ 567,270 0.8% $ 8.46 $ 02010 10 200,050 3.8% 1,999,738 2.9% 10.00 02011 8 469,404 8.9% 2,411,497 3.5% 5.14 02012 8 179,471 3.4% 1,678,862 2.5% 9.35 02013 3 222,521 4.2% 993,053 1.5% 4.46 02014 10 259,706 4.9% 2,531,133 3.7% 9.75 02015 13 412,535 7.8% 3,975,474 5.8% 9.64 02016 5 153,782 2.9% 1,318,562 1.9% 8.57 02017 11 277,102 5.2% 3,383,722 4.9% 12.21 02018 9 310,576 5.9% 3,700,624 5.4% 11.92 0
Beyond 23 942,355 17.8% 11,862,288 17.3% 12.59 990,000 103 3,494,524 66.1% $ 34,422,223 50.2% $ 9.85 $ 990,000
____________________ 1 Retail anchor tenants are defined as tenants that occupy 10,000 square feet or more. Excludes tenants at development properties that are
designated as Build-to-Suits for sale.
2 Lease expiration table reflects rents in place as of June 30, 2009, and does not include option periods; 2009 expirations include one month-to-month tenant. This column also excludes ground leases.
3 Expiring GLA excludes square footage for non-owned ground lease structures on land we own and ground leased to tenants.
4 Annualized base rent represents the monthly contractual rent for June 2009 for each applicable property multiplied by 12. Excludes ground lease revenue.
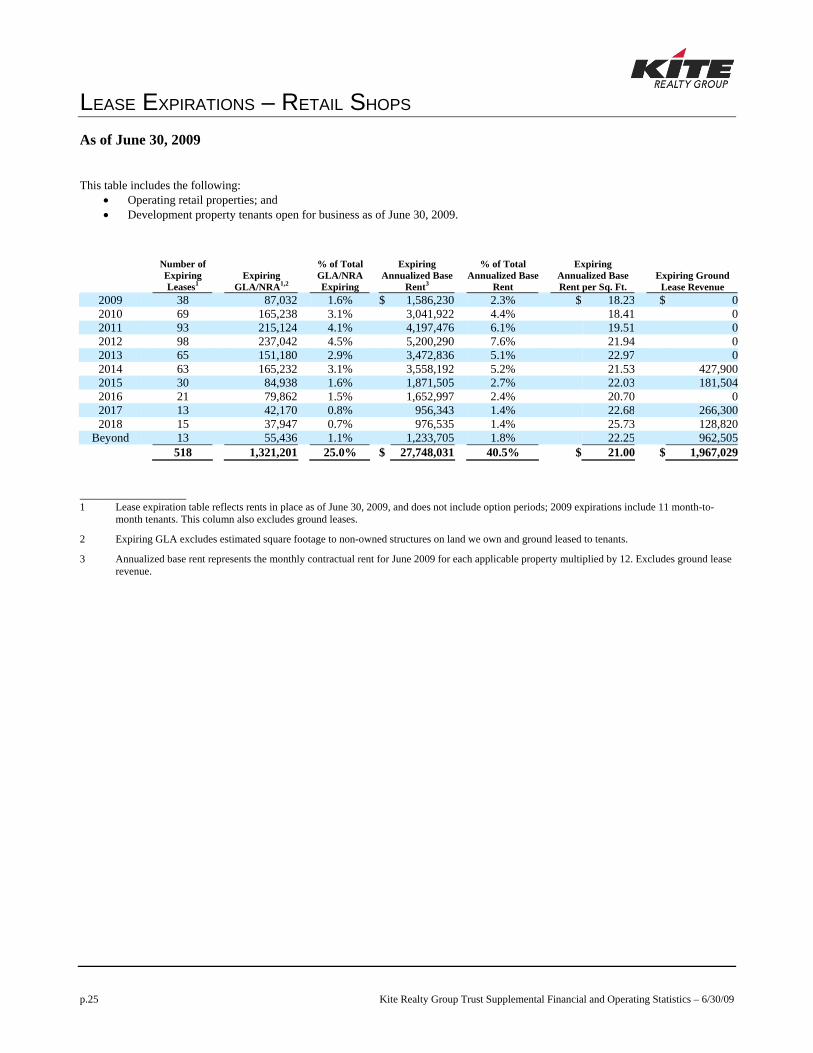
LEASE EXPIRATIONS – RETAIL SHOPS
p.25 Kite Realty Group Trust Supplemental Financial and Operating Statistics – 6/30/09
As of June 30, 2009 This table includes the following:
• Operating retail properties; and • Development property tenants open for business as of June 30, 2009.
Number of Expiring Leases1 Expiring
GLA/NRA1,2 % of Total GLA/NRA Expiring
Expiring Annualized Base
Rent3 % of Total
Annualized Base Rent
Expiring Annualized Base Rent per Sq. Ft. Expiring Ground
Lease Revenue 2009 38 87,032 1.6% $ 1,586,230 2.3% $ 18.23 $ 02010 69 165,238 3.1% 3,041,922 4.4% 18.41 02011 93 215,124 4.1% 4,197,476 6.1% 19.51 02012 98 237,042 4.5% 5,200,290 7.6% 21.94 02013 65 151,180 2.9% 3,472,836 5.1% 22.97 02014 63 165,232 3.1% 3,558,192 5.2% 21.53 427,9002015 30 84,938 1.6% 1,871,505 2.7% 22.03 181,5042016 21 79,862 1.5% 1,652,997 2.4% 20.70 02017 13 42,170 0.8% 956,343 1.4% 22.68 266,3002018 15 37,947 0.7% 976,535 1.4% 25.73 128,820
Beyond 13 55,436 1.1% 1,233,705 1.8% 22.25 962,505 518 1,321,201 25.0% $ 27,748,031 40.5% $ 21.00 $ 1,967,029
____________________ 1 Lease expiration table reflects rents in place as of June 30, 2009, and does not include option periods; 2009 expirations include 11 month-to-
month tenants. This column also excludes ground leases.
2 Expiring GLA excludes estimated square footage to non-owned structures on land we own and ground leased to tenants.
3 Annualized base rent represents the monthly contractual rent for June 2009 for each applicable property multiplied by 12. Excludes ground lease revenue.
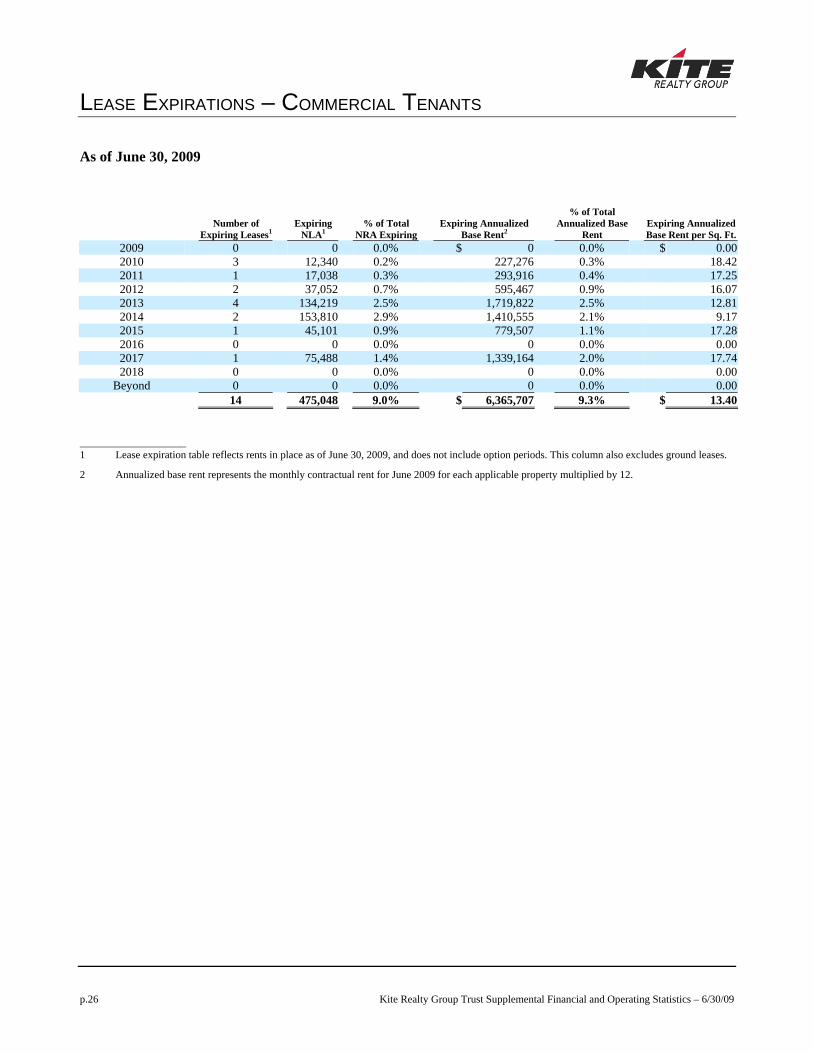
LEASE EXPIRATIONS – COMMERCIAL TENANTS
p.26 Kite Realty Group Trust Supplemental Financial and Operating Statistics – 6/30/09
As of June 30, 2009
Number of
Expiring Leases1 Expiring NLA1
% of Total NRA Expiring
Expiring Annualized Base Rent2
% of Total Annualized Base
Rent Expiring Annualized Base Rent per Sq. Ft.
2009 0 0 0.0% $ 0 0.0% $ 0.00 2010 3 12,340 0.2% 227,276 0.3% 18.42 2011 1 17,038 0.3% 293,916 0.4% 17.25 2012 2 37,052 0.7% 595,467 0.9% 16.07 2013 4 134,219 2.5% 1,719,822 2.5% 12.81 2014 2 153,810 2.9% 1,410,555 2.1% 9.17 2015 1 45,101 0.9% 779,507 1.1% 17.28 2016 0 0 0.0% 0 0.0% 0.00 2017 1 75,488 1.4% 1,339,164 2.0% 17.74 2018 0 0 0.0% 0 0.0% 0.00
Beyond 0 0 0.0% 0 0.0% 0.00 14 475,048 9.0% $ 6,365,707 9.3% $ 13.40
____________________ 1 Lease expiration table reflects rents in place as of June 30, 2009, and does not include option periods. This column also excludes ground leases.
2 Annualized base rent represents the monthly contractual rent for June 2009 for each applicable property multiplied by 12.
SUMMARY RETAIL PORTFOLIO STATISTICS INCLUDING JOINT VENTURE
PROPERTIES
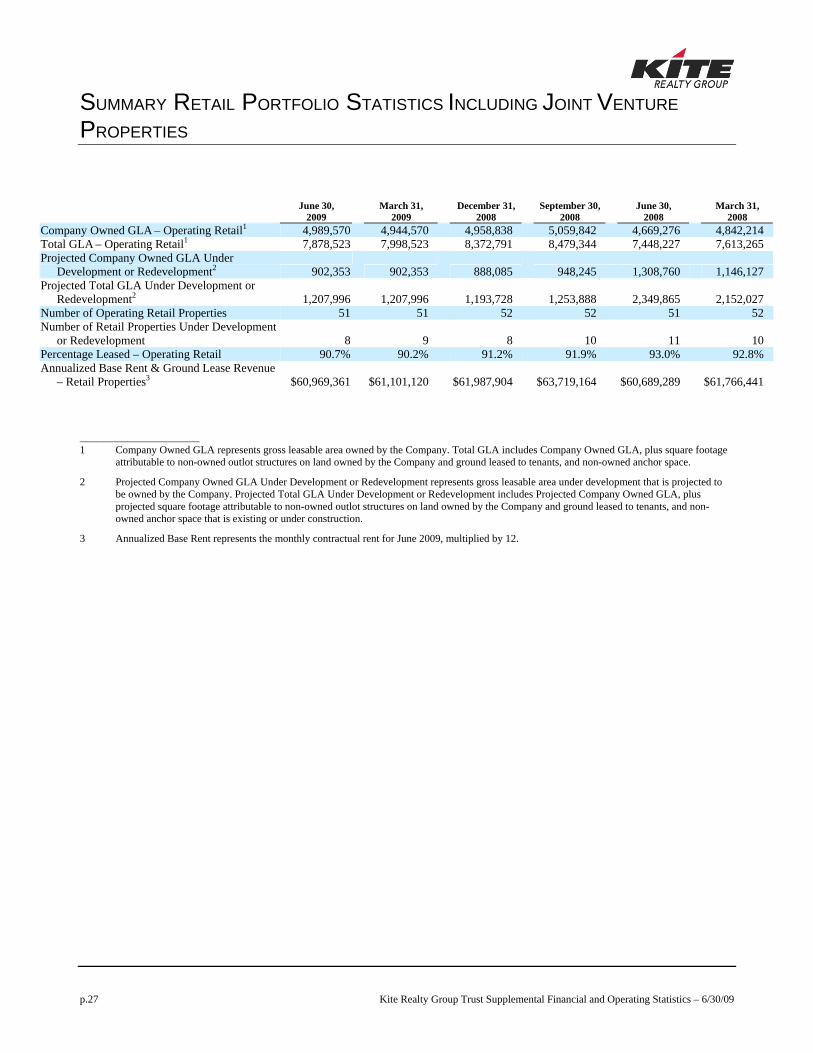
p.27 Kite Realty Group Trust Supplemental Financial and Operating Statistics – 6/30/09
June 30,
2009 March 31,
2009 December 31,
2008 September 30,
2008 June 30,
2008 March 31,
2008 Company Owned GLA – Operating Retail1 4,989,570 4,944,570 4,958,838 5,059,842 4,669,276 4,842,214 Total GLA – Operating Retail1 7,878,523 7,998,523 8,372,791 8,479,344 7,448,227 7,613,265 Projected Company Owned GLA Under
Development or Redevelopment2 902,353 902,353 888,085 948,245 1,308,760 1,146,127 Projected Total GLA Under Development or
Redevelopment2 1,207,996 1,207,996 1,193,728 1,253,888 2,349,865 2,152,027 Number of Operating Retail Properties 51 51 52 52 51 52 Number of Retail Properties Under Development
or Redevelopment 8 9 8 10 11 10 Percentage Leased – Operating Retail 90.7% 90.2% 91.2% 91.9% 93.0% 92.8% Annualized Base Rent & Ground Lease Revenue
– Retail Properties3 $60,969,361 $61,101,120 $61,987,904 $63,719,164 $60,689,289 $61,766,441 ____________________ 1 Company Owned GLA represents gross leasable area owned by the Company. Total GLA includes Company Owned GLA, plus square footage
attributable to non-owned outlot structures on land owned by the Company and ground leased to tenants, and non-owned anchor space.
2 Projected Company Owned GLA Under Development or Redevelopment represents gross leasable area under development that is projected to be owned by the Company. Projected Total GLA Under Development or Redevelopment includes Projected Company Owned GLA, plus projected square footage attributable to non-owned outlot structures on land owned by the Company and ground leased to tenants, and non-owned anchor space that is existing or under construction.
3 Annualized Base Rent represents the monthly contractual rent for June 2009, multiplied by 12.
SUMMARY COMMERCIAL PORTFOLIO STATISTICS
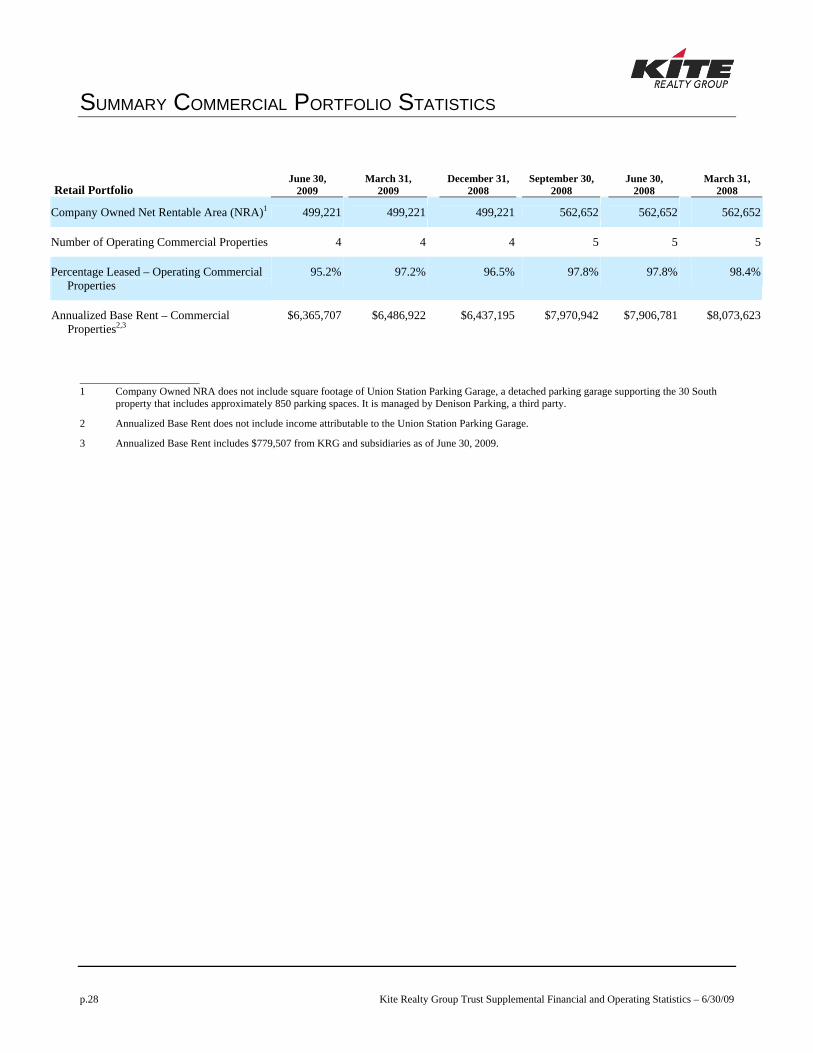
p.28 Kite Realty Group Trust Supplemental Financial and Operating Statistics – 6/30/09
Retail Portfolio June 30,
2009 March 31,
2009 December 31,
2008 September 30,
2008 June 30,
2008 March 31,
2008
Company Owned Net Rentable Area (NRA)1 499,221 499,221 499,221 562,652 562,652 562,652
Number of Operating Commercial Properties 4 4 4 5 5 5
Percentage Leased – Operating Commercial Properties
95.2% 97.2% 96.5% 97.8% 97.8% 98.4%
Annualized Base Rent – Commercial Properties2,3
$6,365,707 $6,486,922 $6,437,195 $7,970,942 $7,906,781 $8,073,623
____________________ 1 Company Owned NRA does not include square footage of Union Station Parking Garage, a detached parking garage supporting the 30 South
property that includes approximately 850 parking spaces. It is managed by Denison Parking, a third party.
2 Annualized Base Rent does not include income attributable to the Union Station Parking Garage.
3 Annualized Base Rent includes $779,507 from KRG and subsidiaries as of June 30, 2009.
CURRENT DEVELOPMENT PIPELINE
p.29 Kite Realty Group Trust Supplemental Financial and Operating Statistics – 6/30/09
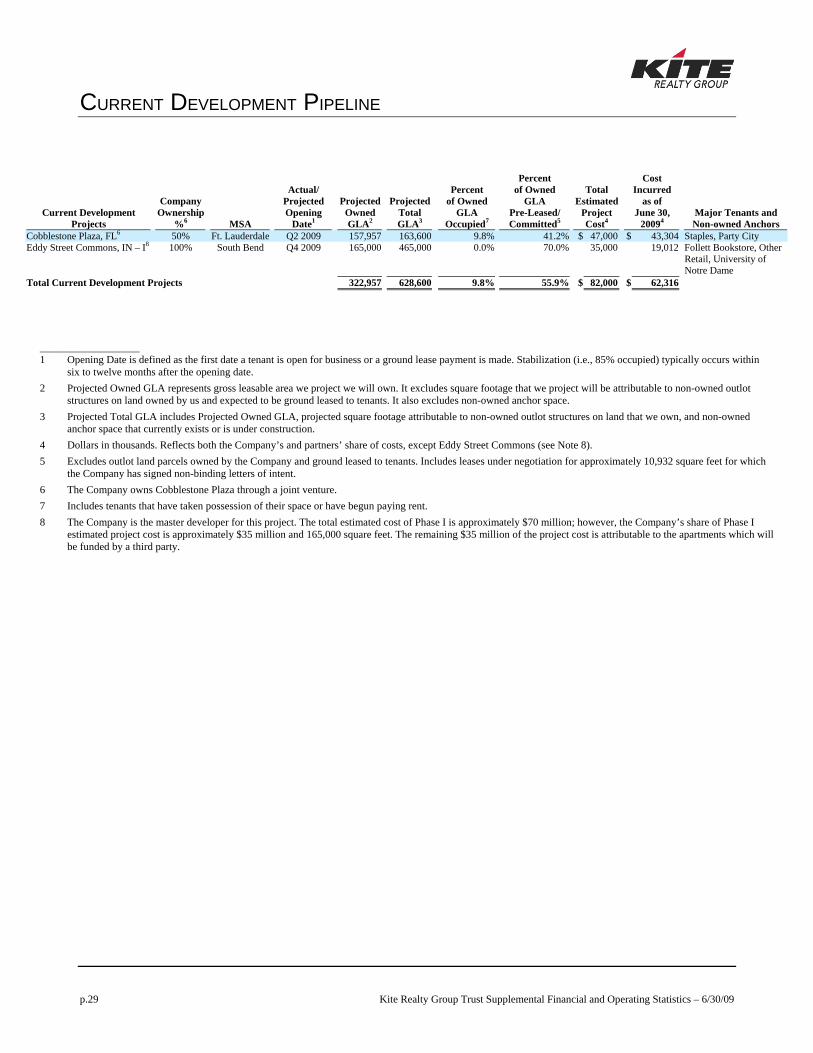
Current Development Projects
Company Ownership
%6 MSA
Actual/ Projected Opening
Date1
Projected Owned GLA2
Projected Total GLA3
Percent of Owned
GLA Occupied7
Percent of Owned
GLA Pre-Leased/Committed5
Total Estimated
Project Cost4
Cost Incurred
as of June 30,
20094 Major Tenants and Non-owned Anchors
Cobblestone Plaza, FL6 50% Ft. Lauderdale Q2 2009 157,957 163,600 9.8% 41.2% $ 47,000 $ 43,304 Staples, Party City Eddy Street Commons, IN – I8 100% South Bend Q4 2009 165,000 465,000 0.0% 70.0% 35,000 19,012 Follett Bookstore, Other
Retail, University of Notre Dame
Total Current Development Projects 322,957 628,600 9.8% 55.9% $ 82,000 $ 62,316
____________________ 1 Opening Date is defined as the first date a tenant is open for business or a ground lease payment is made. Stabilization (i.e., 85% occupied) typically occurs within
six to twelve months after the opening date. 2 Projected Owned GLA represents gross leasable area we project we will own. It excludes square footage that we project will be attributable to non-owned outlot
structures on land owned by us and expected to be ground leased to tenants. It also excludes non-owned anchor space. 3 Projected Total GLA includes Projected Owned GLA, projected square footage attributable to non-owned outlot structures on land that we own, and non-owned
anchor space that currently exists or is under construction. 4 Dollars in thousands. Reflects both the Company’s and partners’ share of costs, except Eddy Street Commons (see Note 8). 5 Excludes outlot land parcels owned by the Company and ground leased to tenants. Includes leases under negotiation for approximately 10,932 square feet for which
the Company has signed non-binding letters of intent. 6 The Company owns Cobblestone Plaza through a joint venture. 7 Includes tenants that have taken possession of their space or have begun paying rent. 8 The Company is the master developer for this project. The total estimated cost of Phase I is approximately $70 million; however, the Company’s share of Phase I
estimated project cost is approximately $35 million and 165,000 square feet. The remaining $35 million of the project cost is attributable to the apartments which will be funded by a third party.
CURRENT REDEVELOPMENT PROJECTS
p.30 Kite Realty Group Trust Supplemental Financial and Operating Statistics – 6/30/09
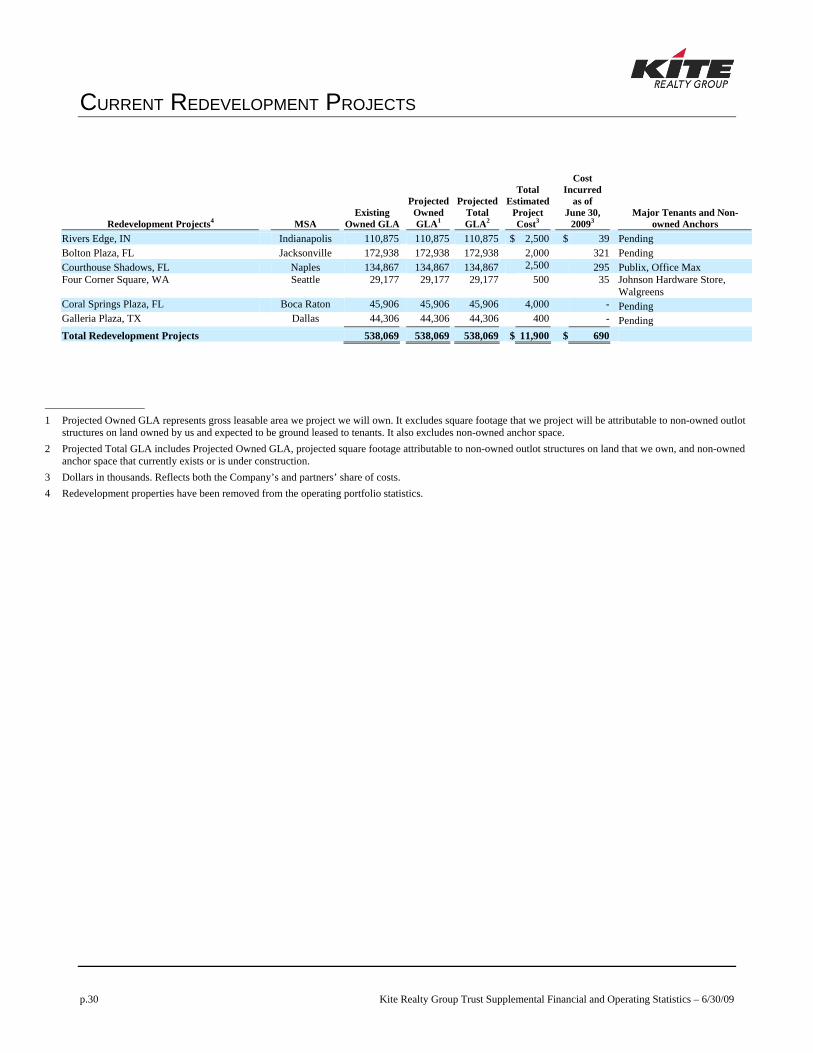
Redevelopment Projects4 MSA Existing
Owned GLA
Projected Owned GLA1
Projected Total GLA2
Total Estimated
Project Cost3
Cost Incurred
as of June 30,
20093 Major Tenants and Non-
owned Anchors Rivers Edge, IN Indianapolis 110,875 110,875 110,875 $ 2,500 $ 39 Pending Bolton Plaza, FL Jacksonville 172,938 172,938 172,938 2,000 321 Pending Courthouse Shadows, FL Naples 134,867 134,867 134,867 2,500 295 Publix, Office Max Four Corner Square, WA
Seattle 29,177 29,177 29,177 500 35 Johnson Hardware Store,
Walgreens Coral Springs Plaza, FL Boca Raton 45,906 45,906 45,906 4,000 - Pending Galleria Plaza, TX Dallas 44,306 44,306 44,306 400 - Pending Total Redevelopment Projects 538,069 538,069 538,069 $ 11,900 $ 690
____________________ 1 Projected Owned GLA represents gross leasable area we project we will own. It excludes square footage that we project will be attributable to non-owned outlot
structures on land owned by us and expected to be ground leased to tenants. It also excludes non-owned anchor space. 2 Projected Total GLA includes Projected Owned GLA, projected square footage attributable to non-owned outlot structures on land that we own, and non-owned
anchor space that currently exists or is under construction. 3 Dollars in thousands. Reflects both the Company’s and partners’ share of costs. 4 Redevelopment properties have been removed from the operating portfolio statistics.
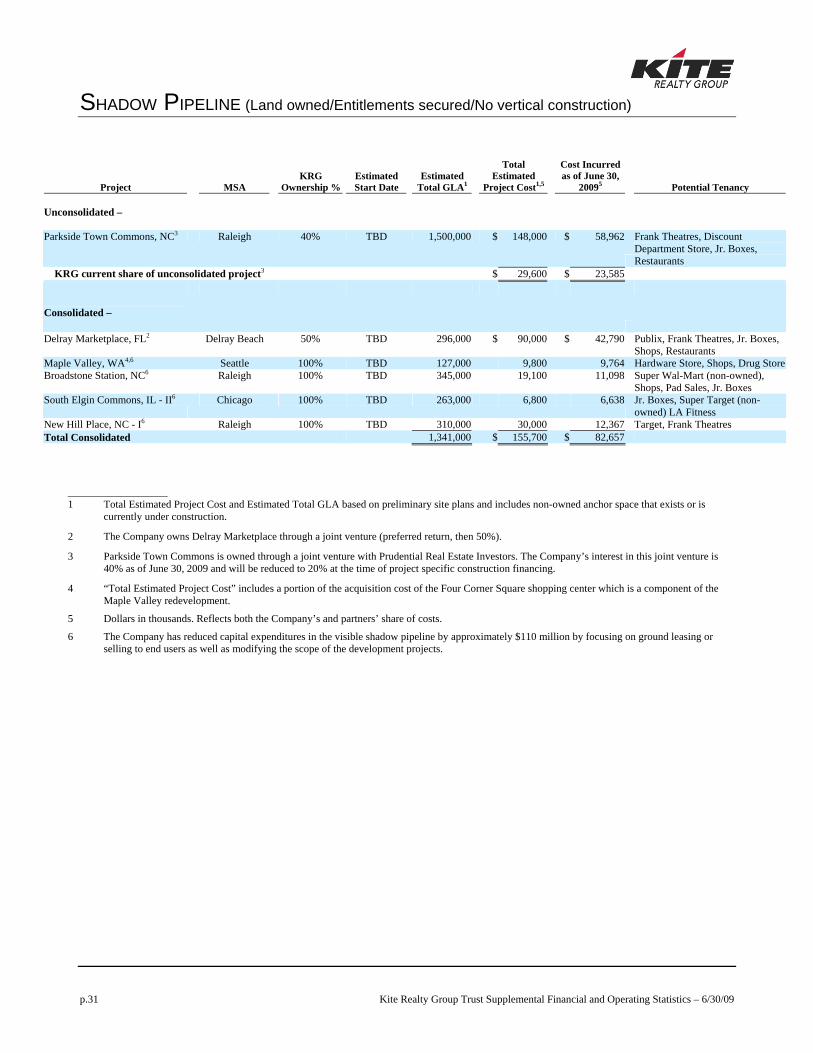
SHADOW PIPELINE (Land owned/Entitlements secured/No vertical construction)
p.31 Kite Realty Group Trust Supplemental Financial and Operating Statistics – 6/30/09
Project MSA KRG
Ownership %Estimated Start Date
Estimated Total GLA1
Total Estimated
Project Cost1,5
Cost Incurred as of June 30,
20095 Potential Tenancy Unconsolidated –
Parkside Town Commons, NC3 Raleigh 40% TBD 1,500,000 $ 148,000 $ 58,962 Frank Theatres, Discount Department Store, Jr. Boxes, Restaurants
KRG current share of unconsolidated project3 $ 29,600 $ 23,585 Consolidated –
Delray Marketplace, FL2 Delray Beach 50% TBD 296,000 $ 90,000 $ 42,790 Publix, Frank Theatres, Jr. Boxes, Shops, Restaurants
Maple Valley, WA4,6 Seattle 100% TBD 127,000 9,800 9,764 Hardware Store, Shops, Drug StoreBroadstone Station, NC6
Raleigh 100% TBD
345,000 19,100 11,098 Super Wal-Mart (non-owned),
Shops, Pad Sales, Jr. Boxes South Elgin Commons, IL - II6
Chicago 100% TBD
263,000 6,800 6,638 Jr. Boxes, Super Target (non-
owned) LA Fitness New Hill Place, NC - I6 Raleigh 100% TBD 310,000 30,000 12,367 Target, Frank Theatres Total Consolidated 1,341,000 $ 155,700 $ 82,657
____________________ 1 Total Estimated Project Cost and Estimated Total GLA based on preliminary site plans and includes non-owned anchor space that exists or is
currently under construction.
2 The Company owns Delray Marketplace through a joint venture (preferred return, then 50%).
3 Parkside Town Commons is owned through a joint venture with Prudential Real Estate Investors. The Company’s interest in this joint venture is 40% as of June 30, 2009 and will be reduced to 20% at the time of project specific construction financing.
4 “Total Estimated Project Cost” includes a portion of the acquisition cost of the Four Corner Square shopping center which is a component of the Maple Valley redevelopment.
5 Dollars in thousands. Reflects both the Company’s and partners’ share of costs.
6 The Company has reduced capital expenditures in the visible shadow pipeline by approximately $110 million by focusing on ground leasing or selling to end users as well as modifying the scope of the development projects.
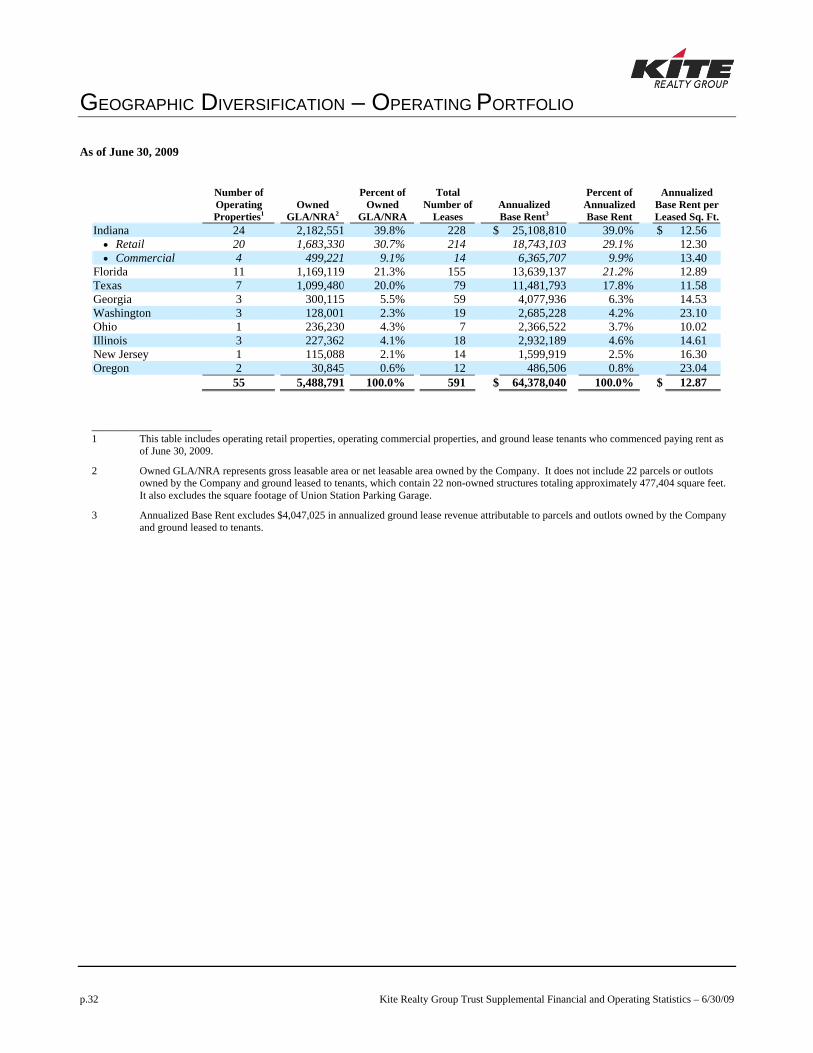
GEOGRAPHIC DIVERSIFICATION – OPERATING PORTFOLIO
p.32 Kite Realty Group Trust Supplemental Financial and Operating Statistics – 6/30/09
As of June 30, 2009
Number of Operating Properties1
Owned GLA/NRA2
Percent of Owned
GLA/NRA
Total Number of
Leases Annualized Base Rent3
Percent of Annualized Base Rent
AnnualizedBase Rent perLeased Sq. Ft.
Indiana 24 2,182,551 39.8% 228 $ 25,108,810 39.0% $ 12.56 • Retail 20 1,683,330 30.7% 214 18,743,103 29.1% 12.30 • Commercial 4 499,221 9.1% 14 6,365,707 9.9% 13.40
Florida 11 1,169,119 21.3% 155 13,639,137 21.2% 12.89 Texas 7 1,099,480 20.0% 79 11,481,793 17.8% 11.58 Georgia 3 300,115 5.5% 59 4,077,936 6.3% 14.53 Washington 3 128,001 2.3% 19 2,685,228 4.2% 23.10 Ohio 1 236,230 4.3% 7 2,366,522 3.7% 10.02 Illinois 3 227,362 4.1% 18 2,932,189 4.6% 14.61 New Jersey 1 115,088 2.1% 14 1,599,919 2.5% 16.30 Oregon 2 30,845 0.6% 12 486,506 0.8% 23.04 55 5,488,791 100.0% 591 $ 64,378,040 100.0% $ 12.87
____________________ 1 This table includes operating retail properties, operating commercial properties, and ground lease tenants who commenced paying rent as
of June 30, 2009.
2 Owned GLA/NRA represents gross leasable area or net leasable area owned by the Company. It does not include 22 parcels or outlots owned by the Company and ground leased to tenants, which contain 22 non-owned structures totaling approximately 477,404 square feet. It also excludes the square footage of Union Station Parking Garage.
3 Annualized Base Rent excludes $4,047,025 in annualized ground lease revenue attributable to parcels and outlots owned by the Company and ground leased to tenants.
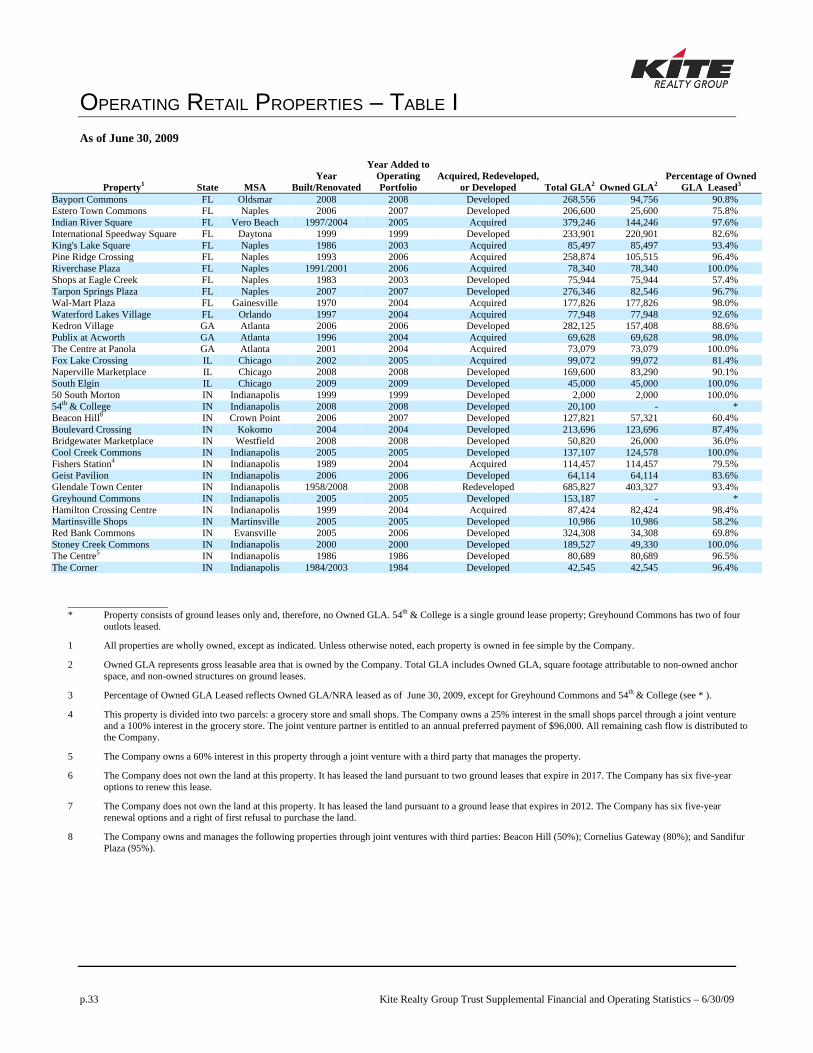
OPERATING RETAIL PROPERTIES – TABLE I
p.33 Kite Realty Group Trust Supplemental Financial and Operating Statistics – 6/30/09
As of June 30, 2009
Property1 State MSA Year
Built/Renovated
Year Added to Operating Portfolio
Acquired, Redeveloped, or Developed Total GLA2 Owned GLA2
Percentage of Owned GLA Leased3
Bayport Commons FL Oldsmar 2008 2008 Developed 268,556 94,756 90.8% Estero Town Commons FL Naples 2006 2007 Developed 206,600 25,600 75.8% Indian River Square FL Vero Beach 1997/2004 2005 Acquired 379,246 144,246 97.6% International Speedway Square FL Daytona 1999 1999 Developed 233,901 220,901 82.6% King's Lake Square FL Naples 1986 2003 Acquired 85,497 85,497 93.4% Pine Ridge Crossing FL Naples 1993 2006 Acquired 258,874 105,515 96.4% Riverchase Plaza FL Naples 1991/2001 2006 Acquired 78,340 78,340 100.0% Shops at Eagle Creek FL Naples 1983 2003 Developed 75,944 75,944 57.4% Tarpon Springs Plaza FL Naples 2007 2007 Developed 276,346 82,546 96.7% Wal-Mart Plaza FL Gainesville 1970 2004 Acquired 177,826 177,826 98.0% Waterford Lakes Village FL Orlando 1997 2004 Acquired 77,948 77,948 92.6% Kedron Village GA Atlanta 2006 2006 Developed 282,125 157,408 88.6% Publix at Acworth GA Atlanta 1996 2004 Acquired 69,628 69,628 98.0% The Centre at Panola GA Atlanta 2001 2004 Acquired 73,079 73,079 100.0% Fox Lake Crossing IL Chicago 2002 2005 Acquired 99,072 99,072 81.4% Naperville Marketplace IL Chicago 2008 2008 Developed 169,600 83,290 90.1% South Elgin IL Chicago 2009 2009 Developed 45,000 45,000 100.0% 50 South Morton IN Indianapolis 1999 1999 Developed 2,000 2,000 100.0% 54th & College IN Indianapolis 2008 2008 Developed 20,100 - * Beacon Hill8 IN Crown Point 2006 2007 Developed 127,821 57,321 60.4% Boulevard Crossing IN Kokomo 2004 2004 Developed 213,696 123,696 87.4% Bridgewater Marketplace IN Westfield 2008 2008 Developed 50,820 26,000 36.0% Cool Creek Commons IN Indianapolis 2005 2005 Developed 137,107 124,578 100.0% Fishers Station4 IN Indianapolis 1989 2004 Acquired 114,457 114,457 79.5% Geist Pavilion IN Indianapolis 2006 2006 Developed 64,114 64,114 83.6% Glendale Town Center IN Indianapolis 1958/2008 2008 Redeveloped 685,827 403,327 93.4% Greyhound Commons IN Indianapolis 2005 2005 Developed 153,187 - * Hamilton Crossing Centre IN Indianapolis 1999 2004 Acquired 87,424 82,424 98.4% Martinsville Shops IN Martinsville 2005 2005 Developed 10,986 10,986 58.2% Red Bank Commons IN Evansville 2005 2006 Developed 324,308 34,308 69.8% Stoney Creek Commons IN Indianapolis 2000 2000 Developed 189,527 49,330 100.0% The Centre5 IN Indianapolis 1986 1986 Developed 80,689 80,689 96.5% The Corner IN Indianapolis 1984/2003 1984 Developed 42,545 42,545 96.4%
____________________ * Property consists of ground leases only and, therefore, no Owned GLA. 54th & College is a single ground lease property; Greyhound Commons has two of four
outlots leased. 1 All properties are wholly owned, except as indicated. Unless otherwise noted, each property is owned in fee simple by the Company. 2 Owned GLA represents gross leasable area that is owned by the Company. Total GLA includes Owned GLA, square footage attributable to non-owned anchor
space, and non-owned structures on ground leases. 3 Percentage of Owned GLA Leased reflects Owned GLA/NRA leased as of June 30, 2009, except for Greyhound Commons and 54th & College (see * ). 4 This property is divided into two parcels: a grocery store and small shops. The Company owns a 25% interest in the small shops parcel through a joint venture
and a 100% interest in the grocery store. The joint venture partner is entitled to an annual preferred payment of $96,000. All remaining cash flow is distributed to the Company.
5 The Company owns a 60% interest in this property through a joint venture with a third party that manages the property. 6 The Company does not own the land at this property. It has leased the land pursuant to two ground leases that expire in 2017. The Company has six five-year
options to renew this lease. 7 The Company does not own the land at this property. It has leased the land pursuant to a ground lease that expires in 2012. The Company has six five-year
renewal options and a right of first refusal to purchase the land. 8 The Company owns and manages the following properties through joint ventures with third parties: Beacon Hill (50%); Cornelius Gateway (80%); and Sandifur
Plaza (95%).
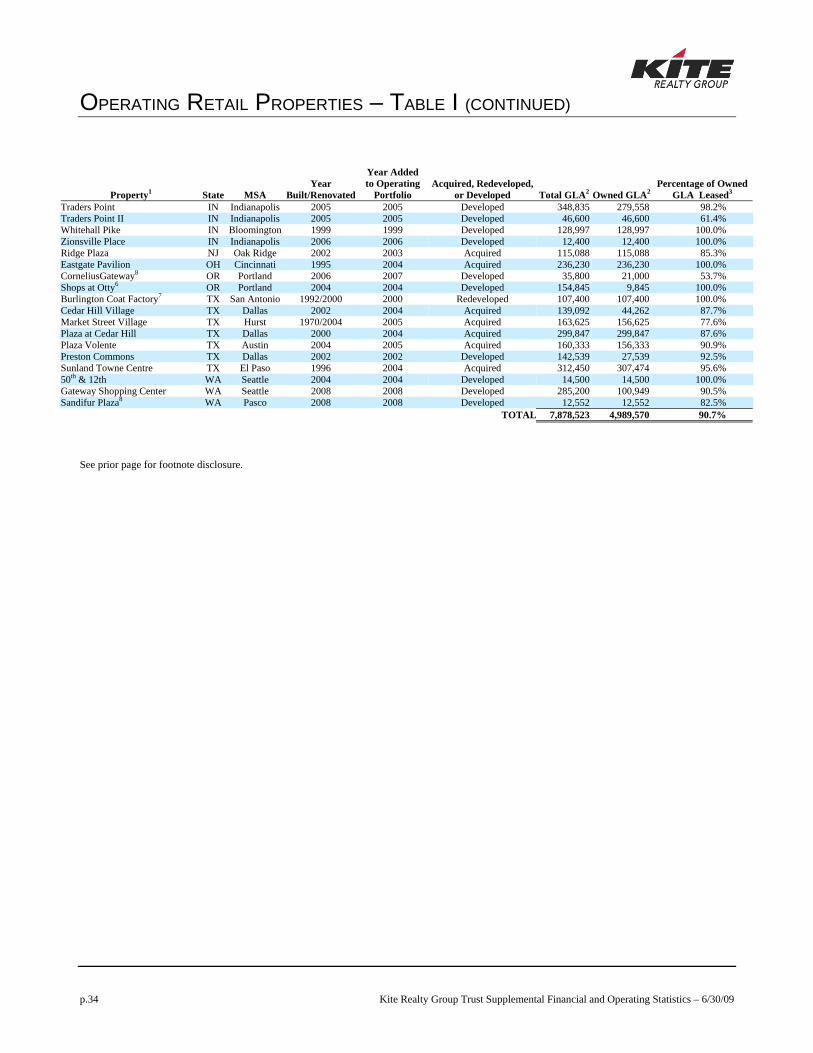
OPERATING RETAIL PROPERTIES – TABLE I (CONTINUED)
p.34 Kite Realty Group Trust Supplemental Financial and Operating Statistics – 6/30/09
Property1 State MSA Year
Built/Renovated
Year Added to Operating
Portfolio Acquired, Redeveloped,
or Developed Total GLA2 Owned GLA2 Percentage of Owned
GLA Leased3 Traders Point IN Indianapolis 2005 2005 Developed 348,835 279,558 98.2% Traders Point II IN Indianapolis 2005 2005 Developed 46,600 46,600 61.4% Whitehall Pike IN Bloomington 1999 1999 Developed 128,997 128,997 100.0% Zionsville Place IN Indianapolis 2006 2006 Developed 12,400 12,400 100.0% Ridge Plaza NJ Oak Ridge 2002 2003 Acquired 115,088 115,088 85.3% Eastgate Pavilion OH Cincinnati 1995 2004 Acquired 236,230 236,230 100.0% CorneliusGateway8 OR Portland 2006 2007 Developed 35,800 21,000 53.7% Shops at Otty6 OR Portland 2004 2004 Developed 154,845 9,845 100.0% Burlington Coat Factory7 TX San Antonio 1992/2000 2000 Redeveloped 107,400 107,400 100.0% Cedar Hill Village TX Dallas 2002 2004 Acquired 139,092 44,262 87.7% Market Street Village TX Hurst 1970/2004 2005 Acquired 163,625 156,625 77.6% Plaza at Cedar Hill TX Dallas 2000 2004 Acquired 299,847 299,847 87.6% Plaza Volente TX Austin 2004 2005 Acquired 160,333 156,333 90.9% Preston Commons TX Dallas 2002 2002 Developed 142,539 27,539 92.5% Sunland Towne Centre TX El Paso 1996 2004 Acquired 312,450 307,474 95.6% 50th & 12th WA Seattle 2004 2004 Developed 14,500 14,500 100.0% Gateway Shopping Center WA Seattle 2008 2008 Developed 285,200 100,949 90.5% Sandifur Plaza8 WA Pasco 2008 2008 Developed 12,552 12,552 82.5% TOTAL 7,878,523 4,989,570 90.7%
See prior page for footnote disclosure.
OPERATING RETAIL PROPERTIES – TABLE II
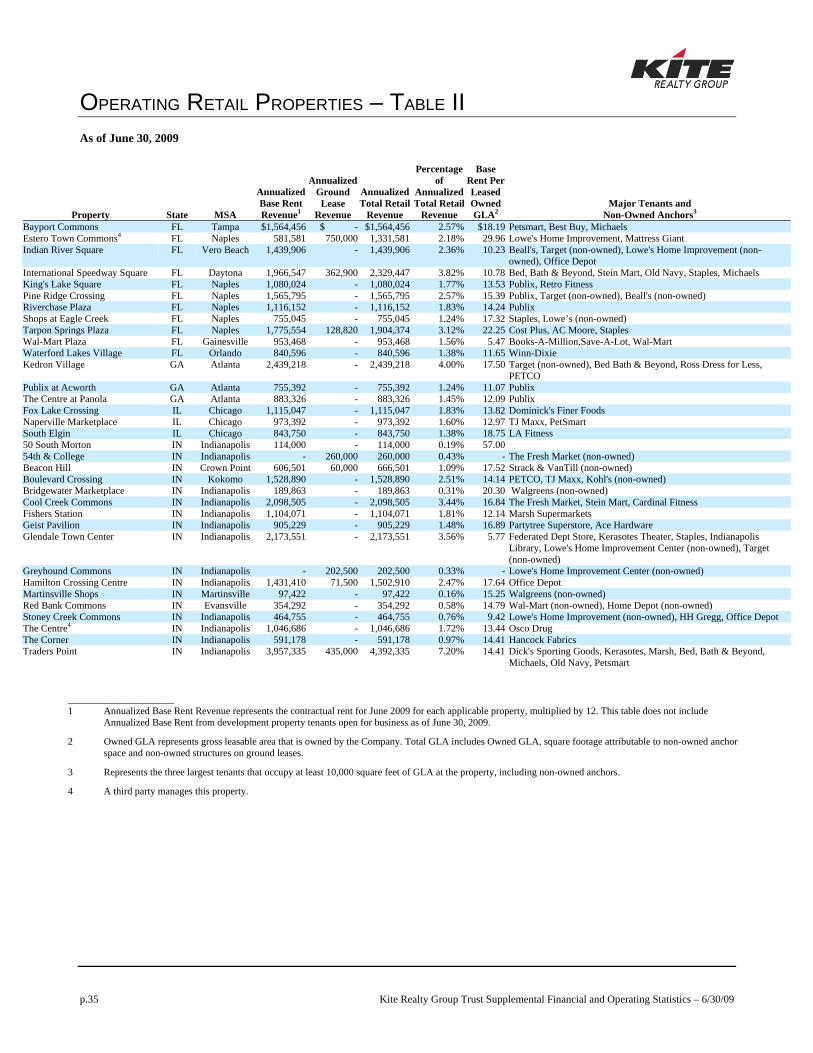
p.35 Kite Realty Group Trust Supplemental Financial and Operating Statistics – 6/30/09
As of June 30, 2009
Property State MSA
Annualized Base Rent Revenue1
Annualized Ground Lease
Revenue
Annualized Total Retail
Revenue
Percentage of
Annualized Total Retail
Revenue
Base Rent Per Leased Owned GLA2
Major Tenants and Non-Owned Anchors3
Bayport Commons FL Tampa $1,564,456 $ - $1,564,456 2.57% $18.19 Petsmart, Best Buy, Michaels Estero Town Commons4 FL Naples 581,581 750,000 1,331,581 2.18% 29.96 Lowe's Home Improvement, Mattress Giant Indian River Square FL Vero Beach 1,439,906 - 1,439,906 2.36% 10.23 Beall's, Target (non-owned), Lowe's Home Improvement (non-
owned), Office Depot International Speedway Square FL Daytona 1,966,547 362,900 2,329,447 3.82% 10.78 Bed, Bath & Beyond, Stein Mart, Old Navy, Staples, Michaels King's Lake Square FL Naples 1,080,024 - 1,080,024 1.77% 13.53 Publix, Retro Fitness Pine Ridge Crossing FL Naples 1,565,795 - 1,565,795 2.57% 15.39 Publix, Target (non-owned), Beall's (non-owned) Riverchase Plaza FL Naples 1,116,152 - 1,116,152 1.83% 14.24 Publix Shops at Eagle Creek FL Naples 755,045 - 755,045 1.24% 17.32 Staples, Lowe’s (non-owned) Tarpon Springs Plaza FL Naples 1,775,554 128,820 1,904,374 3.12% 22.25 Cost Plus, AC Moore, Staples Wal-Mart Plaza FL Gainesville 953,468 - 953,468 1.56% 5.47 Books-A-Million,Save-A-Lot, Wal-Mart Waterford Lakes Village FL Orlando 840,596 - 840,596 1.38% 11.65 Winn-Dixie Kedron Village GA Atlanta 2,439,218 - 2,439,218 4.00% 17.50 Target (non-owned), Bed Bath & Beyond, Ross Dress for Less,
PETCO Publix at Acworth GA Atlanta 755,392 - 755,392 1.24% 11.07 Publix The Centre at Panola GA Atlanta 883,326 - 883,326 1.45% 12.09 Publix Fox Lake Crossing IL Chicago 1,115,047 - 1,115,047 1.83% 13.82 Dominick's Finer Foods Naperville Marketplace IL Chicago 973,392 - 973,392 1.60% 12.97 TJ Maxx, PetSmart South Elgin IL Chicago 843,750 - 843,750 1.38% 18.75 LA Fitness 50 South Morton IN Indianapolis 114,000 - 114,000 0.19% 57.00 54th & College IN Indianapolis - 260,000 260,000 0.43% - The Fresh Market (non-owned) Beacon Hill IN Crown Point 606,501 60,000 666,501 1.09% 17.52 Strack & VanTill (non-owned) Boulevard Crossing IN Kokomo 1,528,890 - 1,528,890 2.51% 14.14 PETCO, TJ Maxx, Kohl's (non-owned) Bridgewater Marketplace IN Indianapolis 189,863 - 189,863 0.31% 20.30 Walgreens (non-owned) Cool Creek Commons IN Indianapolis 2,098,505 - 2,098,505 3.44% 16.84 The Fresh Market, Stein Mart, Cardinal Fitness Fishers Station IN Indianapolis 1,104,071 - 1,104,071 1.81% 12.14 Marsh Supermarkets Geist Pavilion IN Indianapolis 905,229 - 905,229 1.48% 16.89 Partytree Superstore, Ace Hardware Glendale Town Center IN Indianapolis 2,173,551 - 2,173,551 3.56% 5.77 Federated Dept Store, Kerasotes Theater, Staples, Indianapolis
Library, Lowe's Home Improvement Center (non-owned), Target (non-owned)
Greyhound Commons IN Indianapolis - 202,500 202,500 0.33% - Lowe's Home Improvement Center (non-owned) Hamilton Crossing Centre IN Indianapolis 1,431,410 71,500 1,502,910 2.47% 17.64 Office Depot Martinsville Shops IN Martinsville 97,422 - 97,422 0.16% 15.25 Walgreens (non-owned) Red Bank Commons IN Evansville 354,292 - 354,292 0.58% 14.79 Wal-Mart (non-owned), Home Depot (non-owned) Stoney Creek Commons IN Indianapolis 464,755 - 464,755 0.76% 9.42 Lowe's Home Improvement (non-owned), HH Gregg, Office Depot The Centre4 IN Indianapolis 1,046,686 - 1,046,686 1.72% 13.44 Osco Drug The Corner IN Indianapolis 591,178 - 591,178 0.97% 14.41 Hancock Fabrics Traders Point IN Indianapolis 3,957,335 435,000 4,392,335 7.20% 14.41 Dick's Sporting Goods, Kerasotes, Marsh, Bed, Bath & Beyond,
Michaels, Old Navy, Petsmart
____________________ 1 Annualized Base Rent Revenue represents the contractual rent for June 2009 for each applicable property, multiplied by 12. This table does not include
Annualized Base Rent from development property tenants open for business as of June 30, 2009. 2 Owned GLA represents gross leasable area that is owned by the Company. Total GLA includes Owned GLA, square footage attributable to non-owned anchor
space and non-owned structures on ground leases. 3 Represents the three largest tenants that occupy at least 10,000 square feet of GLA at the property, including non-owned anchors. 4 A third party manages this property.
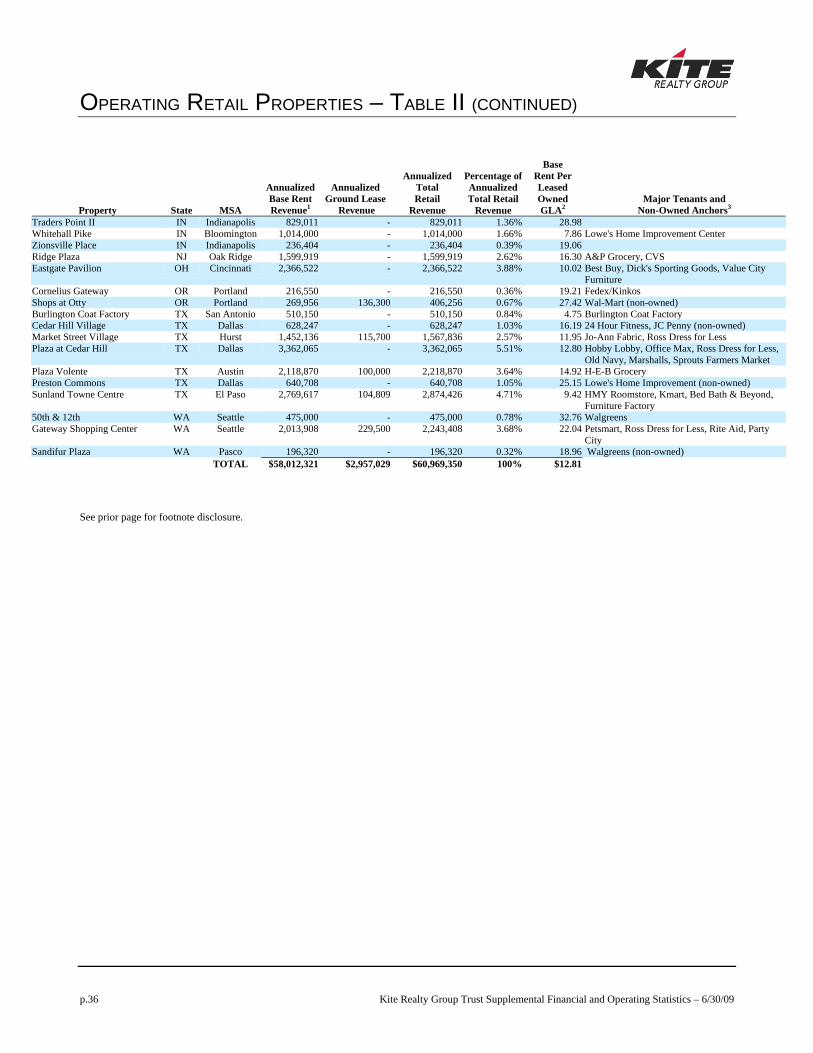
OPERATING RETAIL PROPERTIES – TABLE II (CONTINUED)
p.36 Kite Realty Group Trust Supplemental Financial and Operating Statistics – 6/30/09
Property State MSA Annualized Base Rent Revenue1
Annualized Ground Lease
Revenue
Annualized Total Retail
Revenue
Percentage of Annualized Total Retail
Revenue
Base Rent Per Leased Owned GLA2
Major Tenants and Non-Owned Anchors3
Traders Point II IN Indianapolis 829,011 - 829,011 1.36% 28.98 Whitehall Pike IN Bloomington 1,014,000 - 1,014,000 1.66% 7.86 Lowe's Home Improvement Center Zionsville Place IN Indianapolis 236,404 - 236,404 0.39% 19.06 Ridge Plaza NJ Oak Ridge 1,599,919 - 1,599,919 2.62% 16.30 A&P Grocery, CVS Eastgate Pavilion OH Cincinnati 2,366,522 - 2,366,522 3.88% 10.02 Best Buy, Dick's Sporting Goods, Value City
Furniture Cornelius Gateway OR Portland 216,550 - 216,550 0.36% 19.21 Fedex/Kinkos Shops at Otty OR Portland 269,956 136,300 406,256 0.67% 27.42 Wal-Mart (non-owned) Burlington Coat Factory TX San Antonio 510,150 - 510,150 0.84% 4.75 Burlington Coat Factory Cedar Hill Village TX Dallas 628,247 - 628,247 1.03% 16.19 24 Hour Fitness, JC Penny (non-owned) Market Street Village TX Hurst 1,452,136 115,700 1,567,836 2.57% 11.95 Jo-Ann Fabric, Ross Dress for Less Plaza at Cedar Hill TX Dallas 3,362,065 - 3,362,065 5.51% 12.80 Hobby Lobby, Office Max, Ross Dress for Less,
Old Navy, Marshalls, Sprouts Farmers Market Plaza Volente TX Austin 2,118,870 100,000 2,218,870 3.64% 14.92 H-E-B Grocery Preston Commons TX Dallas 640,708 - 640,708 1.05% 25.15 Lowe's Home Improvement (non-owned) Sunland Towne Centre TX El Paso 2,769,617 104,809 2,874,426 4.71% 9.42 HMY Roomstore, Kmart, Bed Bath & Beyond,
Furniture Factory 50th & 12th WA Seattle 475,000 - 475,000 0.78% 32.76 Walgreens Gateway Shopping Center WA Seattle 2,013,908 229,500 2,243,408 3.68% 22.04 Petsmart, Ross Dress for Less, Rite Aid, Party
City Sandifur Plaza WA Pasco 196,320 - 196,320 0.32% 18.96 Walgreens (non-owned) TOTAL $58,012,321 $2,957,029 $60,969,350 100% $12.81
See prior page for footnote disclosure.
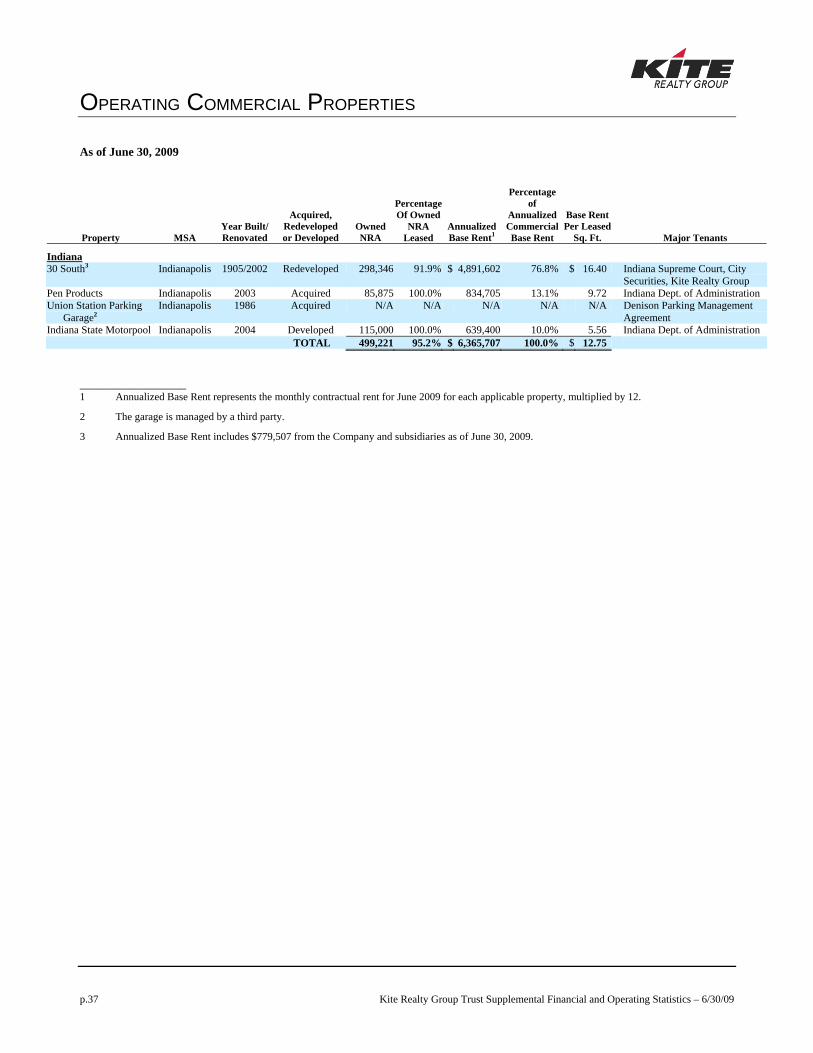
OPERATING COMMERCIAL PROPERTIES
p.37 Kite Realty Group Trust Supplemental Financial and Operating Statistics – 6/30/09
As of June 30, 2009
Property MSA Year Built/ Renovated
Acquired, Redevelopedor Developed
Owned NRA
PercentageOf Owned
NRA Leased
AnnualizedBase Rent1
Percentageof
AnnualizedCommercialBase Rent
Base Rent Per Leased
Sq. Ft.
Major Tenants
Indiana 30 South3 Indianapolis 1905/2002 Redeveloped 298,346 91.9% $ 4,891,602 76.8% $ 16.40 Indiana Supreme Court, City
Securities, Kite Realty Group Pen Products Indianapolis 2003 Acquired 85,875 100.0% 834,705 13.1% 9.72 Indiana Dept. of Administration Union Station Parking
Garage2 Indianapolis 1986 Acquired N/A N/A N/A N/A N/A Denison Parking Management
Agreement Indiana State Motorpool Indianapolis 2004 Developed 115,000 100.0% 639,400 10.0% 5.56 Indiana Dept. of Administration TOTAL 499,221 95.2% $ 6,365,707 100.0% $ 12.75
____________________ 1 Annualized Base Rent represents the monthly contractual rent for June 2009 for each applicable property, multiplied by 12.
2 The garage is managed by a third party.
3 Annualized Base Rent includes $779,507 from the Company and subsidiaries as of June 30, 2009.
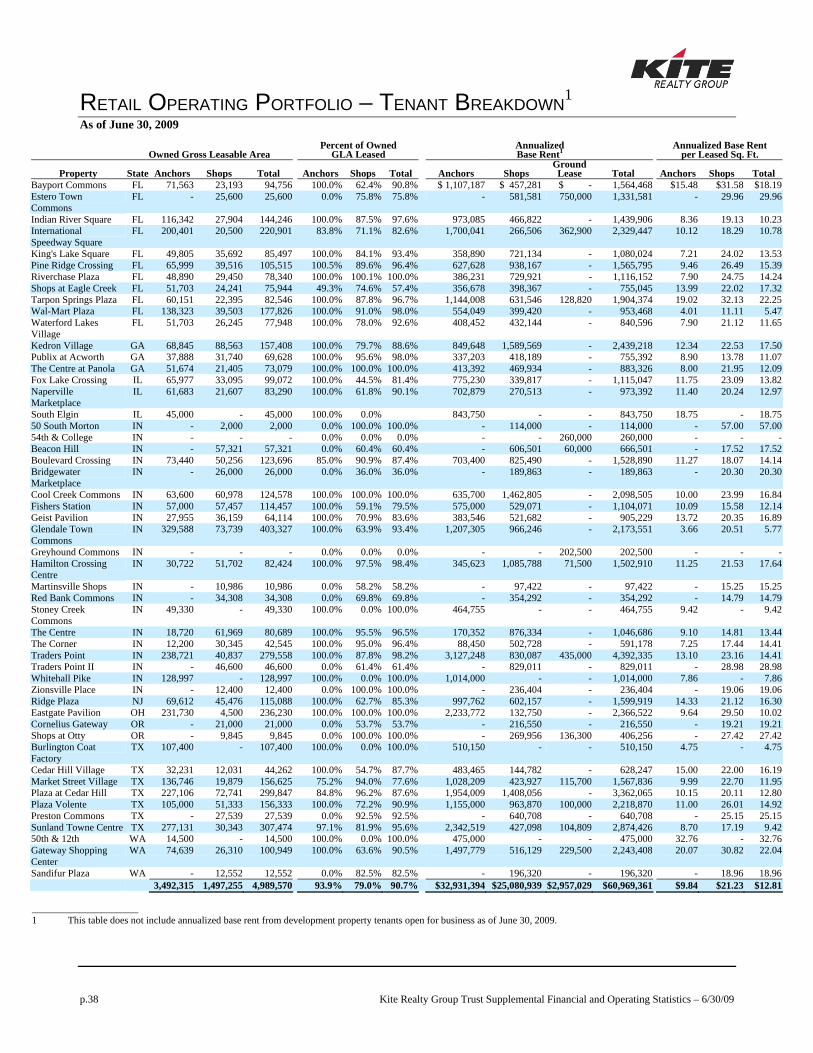
RETAIL OPERATING PORTFOLIO – TENANT BREAKDOWN1
p.38 Kite Realty Group Trust Supplemental Financial and Operating Statistics – 6/30/09
As of June 30, 2009
Owned Gross Leasable Area Percent of Owned
GLA Leased Annualized Base Rent1
Annualized Base Rent per Leased Sq. Ft.
Property State Anchors Shops Total Anchors Shops Total Anchors Shops Ground Lease Total Anchors Shops Total
Bayport Commons FL 71,563 23,193 94,756 100.0% 62.4% 90.8% $ 1,107,187 $ 457,281 $ - 1,564,468 $15.48 $31.58 $18.19Estero Town Commons
FL - 25,600 25,600 0.0% 75.8% 75.8% - 581,581 750,000 1,331,581 - 29.96 29.96
Indian River Square FL 116,342 27,904 144,246 100.0% 87.5% 97.6% 973,085 466,822 - 1,439,906 8.36 19.13 10.23International Speedway Square
FL 200,401 20,500 220,901 83.8% 71.1% 82.6% 1,700,041 266,506 362,900 2,329,447 10.12 18.29 10.78
King's Lake Square FL 49,805 35,692 85,497 100.0% 84.1% 93.4% 358,890 721,134 - 1,080,024 7.21 24.02 13.53Pine Ridge Crossing FL 65,999 39,516 105,515 100.5% 89.6% 96.4% 627,628 938,167 - 1,565,795 9.46 26.49 15.39Riverchase Plaza FL 48,890 29,450 78,340 100.0% 100.1% 100.0% 386,231 729,921 - 1,116,152 7.90 24.75 14.24Shops at Eagle Creek FL 51,703 24,241 75,944 49.3% 74.6% 57.4% 356,678 398,367 - 755,045 13.99 22.02 17.32Tarpon Springs Plaza FL 60,151 22,395 82,546 100.0% 87.8% 96.7% 1,144,008 631,546 128,820 1,904,374 19.02 32.13 22.25Wal-Mart Plaza FL 138,323 39,503 177,826 100.0% 91.0% 98.0% 554,049 399,420 - 953,468 4.01 11.11 5.47Waterford Lakes Village
FL 51,703 26,245 77,948 100.0% 78.0% 92.6% 408,452 432,144 - 840,596 7.90 21.12 11.65
Kedron Village GA 68,845 88,563 157,408 100.0% 79.7% 88.6% 849,648 1,589,569 - 2,439,218 12.34 22.53 17.50Publix at Acworth GA 37,888 31,740 69,628 100.0% 95.6% 98.0% 337,203 418,189 - 755,392 8.90 13.78 11.07The Centre at Panola GA 51,674 21,405 73,079 100.0% 100.0% 100.0% 413,392 469,934 - 883,326 8.00 21.95 12.09Fox Lake Crossing IL 65,977 33,095 99,072 100.0% 44.5% 81.4% 775,230 339,817 - 1,115,047 11.75 23.09 13.82Naperville Marketplace
IL 61,683 21,607 83,290 100.0% 61.8% 90.1% 702,879 270,513 - 973,392 11.40 20.24 12.97
South Elgin IL 45,000 - 45,000 100.0% 0.0% 843,750 - - 843,750 18.75 - 18.7550 South Morton IN - 2,000 2,000 0.0% 100.0% 100.0% - 114,000 - 114,000 - 57.00 57.0054th & College IN - - - 0.0% 0.0% 0.0% - - 260,000 260,000 - - -Beacon Hill IN - 57,321 57,321 0.0% 60.4% 60.4% - 606,501 60,000 666,501 - 17.52 17.52Boulevard Crossing IN 73,440 50,256 123,696 85.0% 90.9% 87.4% 703,400 825,490 - 1,528,890 11.27 18.07 14.14Bridgewater Marketplace
IN - 26,000 26,000 0.0% 36.0% 36.0% - 189,863 - 189,863 - 20.30 20.30
Cool Creek Commons IN 63,600 60,978 124,578 100.0% 100.0% 100.0% 635,700 1,462,805 - 2,098,505 10.00 23.99 16.84Fishers Station IN 57,000 57,457 114,457 100.0% 59.1% 79.5% 575,000 529,071 - 1,104,071 10.09 15.58 12.14Geist Pavilion IN 27,955 36,159 64,114 100.0% 70.9% 83.6% 383,546 521,682 - 905,229 13.72 20.35 16.89Glendale Town Commons
IN 329,588 73,739 403,327 100.0% 63.9% 93.4% 1,207,305 966,246 - 2,173,551 3.66 20.51 5.77
Greyhound Commons IN - - - 0.0% 0.0% 0.0% - - 202,500 202,500 - - -Hamilton Crossing Centre
IN 30,722 51,702 82,424 100.0% 97.5% 98.4% 345,623 1,085,788 71,500 1,502,910 11.25 21.53 17.64
Martinsville Shops IN - 10,986 10,986 0.0% 58.2% 58.2% - 97,422 - 97,422 - 15.25 15.25Red Bank Commons IN - 34,308 34,308 0.0% 69.8% 69.8% - 354,292 - 354,292 - 14.79 14.79Stoney Creek Commons
IN 49,330 - 49,330 100.0% 0.0% 100.0% 464,755 - - 464,755 9.42 - 9.42
The Centre IN 18,720 61,969 80,689 100.0% 95.5% 96.5% 170,352 876,334 - 1,046,686 9.10 14.81 13.44The Corner IN 12,200 30,345 42,545 100.0% 95.0% 96.4% 88,450 502,728 - 591,178 7.25 17.44 14.41Traders Point IN 238,721 40,837 279,558 100.0% 87.8% 98.2% 3,127,248 830,087 435,000 4,392,335 13.10 23.16 14.41Traders Point II IN - 46,600 46,600 0.0% 61.4% 61.4% - 829,011 - 829,011 - 28.98 28.98Whitehall Pike IN 128,997 - 128,997 100.0% 0.0% 100.0% 1,014,000 - - 1,014,000 7.86 - 7.86Zionsville Place IN - 12,400 12,400 0.0% 100.0% 100.0% - 236,404 - 236,404 - 19.06 19.06Ridge Plaza NJ 69,612 45,476 115,088 100.0% 62.7% 85.3% 997,762 602,157 - 1,599,919 14.33 21.12 16.30Eastgate Pavilion OH 231,730 4,500 236,230 100.0% 100.0% 100.0% 2,233,772 132,750 - 2,366,522 9.64 29.50 10.02Cornelius Gateway OR - 21,000 21,000 0.0% 53.7% 53.7% - 216,550 - 216,550 - 19.21 19.21Shops at Otty OR - 9,845 9,845 0.0% 100.0% 100.0% - 269,956 136,300 406,256 - 27.42 27.42Burlington Coat Factory
TX 107,400 - 107,400 100.0% 0.0% 100.0% 510,150 - - 510,150 4.75 - 4.75
Cedar Hill Village TX 32,231 12,031 44,262 100.0% 54.7% 87.7% 483,465 144,782 - 628,247 15.00 22.00 16.19Market Street Village TX 136,746 19,879 156,625 75.2% 94.0% 77.6% 1,028,209 423,927 115,700 1,567,836 9.99 22.70 11.95Plaza at Cedar Hill TX 227,106 72,741 299,847 84.8% 96.2% 87.6% 1,954,009 1,408,056 - 3,362,065 10.15 20.11 12.80Plaza Volente TX 105,000 51,333 156,333 100.0% 72.2% 90.9% 1,155,000 963,870 100,000 2,218,870 11.00 26.01 14.92Preston Commons TX - 27,539 27,539 0.0% 92.5% 92.5% - 640,708 - 640,708 - 25.15 25.15Sunland Towne Centre TX 277,131 30,343 307,474 97.1% 81.9% 95.6% 2,342,519 427,098 104,809 2,874,426 8.70 17.19 9.4250th & 12th WA 14,500 - 14,500 100.0% 0.0% 100.0% 475,000 - - 475,000 32.76 - 32.76Gateway Shopping Center
WA 74,639 26,310 100,949 100.0% 63.6% 90.5% 1,497,779 516,129 229,500 2,243,408 20.07 30.82 22.04
Sandifur Plaza WA - 12,552 12,552 0.0% 82.5% 82.5% - 196,320 - 196,320 - 18.96 18.96 3,492,315 1,497,255 4,989,570 93.9% 79.0% 90.7% $32,931,394 $25,080,939 $2,957,029 $60,969,361 $9.84 $21.23 $12.81
____________________ 1 This table does not include annualized base rent from development property tenants open for business as of June 30, 2009.