Embed Size (px)
Citation preview
KINGCOME TIMBER SUPPLY AREA TIMBER SUPPLY REVIEW 3 ANALYSIS REPORT
Prepared for:
Kingcome TSA Licensee- Group
Prepared by: Timberline Natural Resource Group Ltd.
Victoria, B.C.
Project: 4061921
December 24, 2008

Kingcome TSA TSR 3 Analysis Report
Kingcome Licensee-Agency Group ii
Kingcome TSA TSR 3 Analysis Report
Kingcome Licensee-Agency Group iii
ACKNOWLEDGEMENTS
We would like to acknowledge the support and contributions made by the following organizations:
Interfor Gerry Sommers
Mike Landers
Richmond Plywood Tom Cole
Mill & Timber Products Ltd. Ione Brown
Kruger Forest Products Phil O’Connor
Western Forest Products Peter Kofoed
Northwest Hardwoods Neil Hughes
B.C. Timber Sales Deidre Haight
Ministry of Forests and Range – Coast Forest Region Jim Brown
Ministry of Forests and Range – North Island Central Coast Forest District Jennifer Barolet
Christina Mardell
First Nations Gary Ardron
Ted Stevens
This document was prepared to support an allowable annual cut determination by British Columbia’s Chief Forester. To learn more about this process please visit the following website:
http://www.for.gov.bc.ca/hts/
Or contact:
Forest Analysis and Inventory Branch
Ministry of Forests and Range
P.O. Box 9512, Stn. Prov. Govt.
Victoria, B.C. V8W 9C2
Telephone: (250) 356-5947

Kingcome TSA TSR 3 Analysis Report
Kingcome Licensee-Agency Group iv
www.timberline.ca
December 24, 2008
File number 4061921
Kingcome TSA Licensee-Agency Group c/o Forsite #213 – 1720 14th Ave. Campbell River BC V9W 8B9 Attention: Ian Robertson, RPF Program Coordinator Reference: Kingcome TSA TSR3 Analysis Report Attached please find the updated Analysis Report as part of the Kingcome TSA TSR3 process. This report summarizes the results of the analysis scenarios which evaluate the inputs and assumptions for the Pre-EBM and EBM as described in the Kingcome TSA TSR3 Data Package. All scenarios have been updated to include landscape unit – site series surrogate retention zones within the EBM land base as well as the stand retention adjustments for natural stands. In addition, revisions based on feedback from Ministry of Forests and Range staff have been made. Thank you for your input and assistance during the preparation of the analysis. Yours truly, TIMBERLINE NATURAL RESOURCE GROUP LTD.
Erik Wang, RPF Senior Resource Analyst
Main: 250.480.1101 Fax: 250.480.1412
Suite 601
1207 Douglas St Victoria BC
Canada V8W 2E7

Kingcome TSA TSR 3 Analysis Report
Kingcome Licensee-Agency Group
Kingcome TSA TSR 3 Analysis Report
Kingcome Licensee-Agency Group vii
EXECUTIVE SUMMARY
A Timber Supply Review (TSR) process for the Kingcome Timber Supply Area (Kingcome TSA) began in spring 2006. This report describes the timber supply analysis prepared to inform and support the allowable annual cut (AAC) determination to be made by the Chief Forester shortly after accepting this analysis. This analysis was prepared by Timberline Natural Resource Group Ltd., on behalf of the Kingcome TSA Licensee Group. This is the third major TSR process initiated in the Kingcome TSA since 1996 and is identified as TSR3.
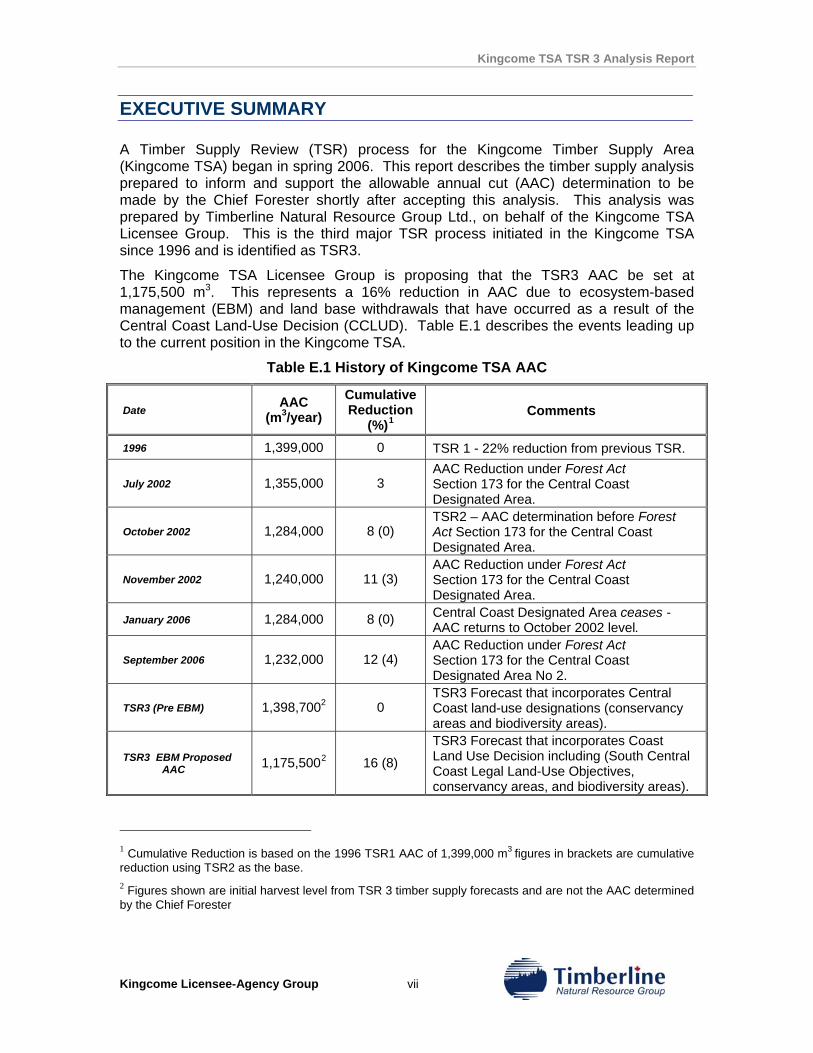
The Kingcome TSA Licensee Group is proposing that the TSR3 AAC be set at 1,175,500 m3. This represents a 16% reduction in AAC due to ecosystem-based management (EBM) and land base withdrawals that have occurred as a result of the Central Coast Land-Use Decision (CCLUD). Table E.1 describes the events leading up to the current position in the Kingcome TSA.
Table E.1 History of Kingcome TSA AAC
Date AAC (m3/year)
Cumulative Reduction
(%)1 Comments
1996 1,399,000 0 TSR 1 - 22% reduction from previous TSR.
July 2002 1,355,000 3 AAC Reduction under Forest Act Section 173 for the Central Coast Designated Area.
October 2002 1,284,000 8 (0) TSR2 – AAC determination before Forest Act Section 173 for the Central Coast Designated Area.
November 2002 1,240,000 11 (3) AAC Reduction under Forest Act Section 173 for the Central Coast Designated Area.
January 2006 1,284,000 8 (0) Central Coast Designated Area ceases -AAC returns to October 2002 level.
September 2006 1,232,000 12 (4) AAC Reduction under Forest Act Section 173 for the Central Coast Designated Area No 2.
TSR3 (Pre EBM) 1,398,7002 0 TSR3 Forecast that incorporates Central Coast land-use designations (conservancy areas and biodiversity areas).
TSR3 EBM Proposed AAC 1,175,5002 16 (8)
TSR3 Forecast that incorporates Coast Land Use Decision including (South Central Coast Legal Land-Use Objectives, conservancy areas, and biodiversity areas).
1 Cumulative Reduction is based on the 1996 TSR1 AAC of 1,399,000 m3 figures in brackets are cumulative reduction using TSR2 as the base. 2 Figures shown are initial harvest level from TSR 3 timber supply forecasts and are not the AAC determined by the Chief Forester
Kingcome TSA TSR 3 Analysis Report
Kingcome Licensee-Agency Group viii
The figures detailed above, and the associated sensitivity runs, are based on analyses reflecting the objectives described in the Legal Order for the South Central Coast3 dated July 27, 2007 (as corrected in December 2007) and the land base removals associated with new Conservancy, Biodiversity, Mining & Tourism Areas. The inputs to these analysis scenarios are documented in the Kingcome Timber Supply Area TSR3 Data Package (Timberline 2008).
Although the land base has had several significant areas removed as a consequence of new parks and conservancies and EBM objectives, much of this is offset by the revised operability information used in this analysis. Additional operable area has been identified as economically contributing to timber supply and confirmed by several years of harvest performance data in parts of the land base previously identified in TSR2 as non-contributing. However, considerable good and medium site hemlock stands are still considered economically inoperable and do not contribute. Consequently the Base Case timber harvesting land base (THLB) is 186,914 hectares and the Pre-EBM THLB is 192,580 hectares. For comparison, the TSR2 Base Case THLB was 168,726 hectares. The Pre-EBM THLB does not include area in new parks, conservancies or biodiversity areas; had this area been included in a “pre Central Coast Land-Use Decision” analysis, it would have reflected an even larger THLB and increased harvest levels. Currently the impact of EBM specific land base removals and constraints on available harvest volume is 16%.
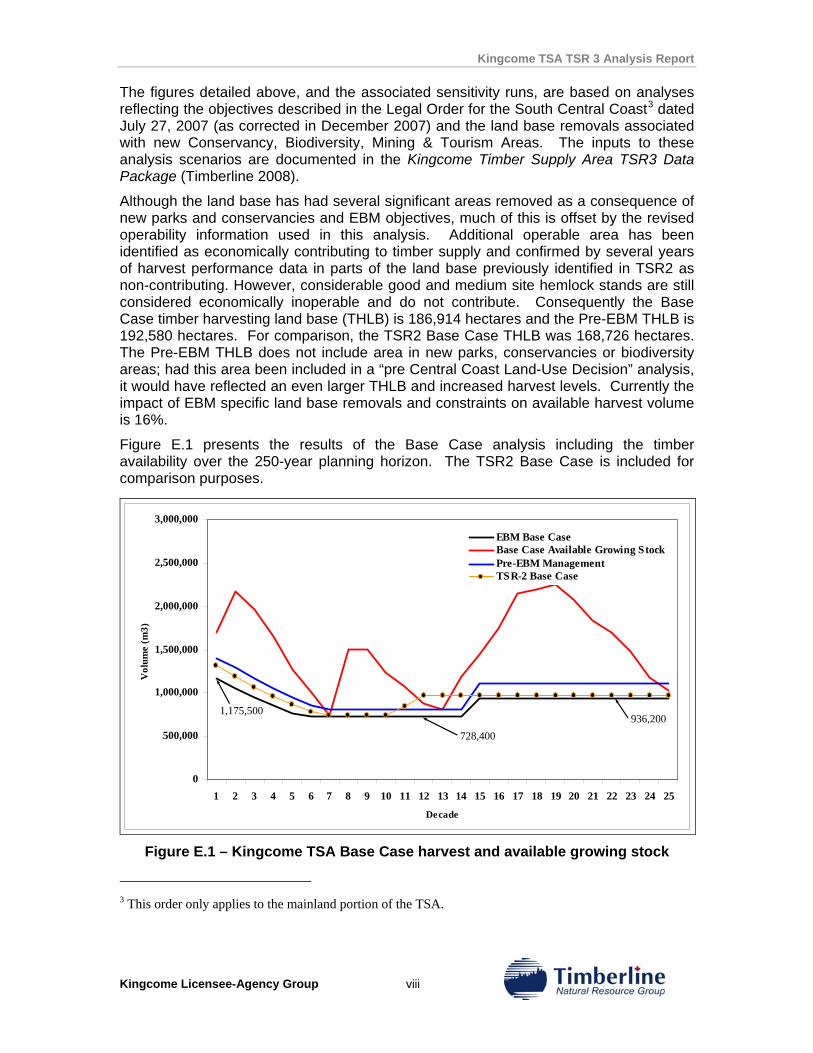
Figure E.1 presents the results of the Base Case analysis including the timber availability over the 250-year planning horizon. The TSR2 Base Case is included for comparison purposes.
0
500,000
1,000,000
1,500,000
2,000,000
2,500,000
3,000,000
1 2 3 4 5 6 7 8 9 10 11 12 13 14 15 16 17 18 19 20 21 22 23 24 25
Decade
Vol
ume
(m3)
EBM Base CaseBase Case Available Growing StockPre-EBM ManagementTSR-2 Base Case
1,175,500936,200
728,400
Figure E.1 – Kingcome TSA Base Case harvest and available growing stock
3 This order only applies to the mainland portion of the TSA.
Kingcome TSA TSR 3 Analysis Report
Kingcome Licensee-Agency Group ix
The initial harvest is 1,175,500 m3/year, representing a 5% reduction from the most recent re-determination of the current AAC of 1,232,000 m3/year, and an 8% reduction from the October 2002 TSR 2 AAC determination (1,284,000 m3/year). During each of the next four decades there is a 10% drop in annual harvest, followed by a 5% drop in decade 6 to the mid-term level of 728,400 m3/year. This mid-term level is 5.6% higher than the estimated natural stand long-run sustained yield4 (LRSY) for the land base (1.6% lower than TSR2). Initial declines and the level of the mid term are dictated by the critical points at decades 7 and 13. At these periods the available volume is lowest and, based on the harvest flow objectives, limits the harvest level over the short (initial 50 years) and mid term (61 – 140 years).
This initial harvest level includes a second growth harvest component of 277,000 m3/year, which then declines in sequence with the overall Base Case harvest flow. However, sensitivity analysis indicates that higher second growth harvest levels are possible.
Availability in the short term is influenced by the current age class structure, which is dominated by over mature (251+ years old) stands, with an additional component of young (less than 30 years old) stands. As the old stands are harvested or placed in reserve to accommodate non-timber objectives the supply is reduced, forcing the annual harvest to drop.
At year 130, low availability is the result of stands regenerated after harvest during years 61 to 140 not having reached minimum harvest age. There are also a number of older stands on poor quality sites that contribute low volume to the harvest during this time period. Beyond year 141 the supply increases and this allows the harvest to increase to the long-term level of 936,200 m3/year. The inflection point for this transition to the long-term level is delayed several decades when compared to the TSR2 analysis because the EBM old seral representation targets require extended retention of old growth forest. This delays the realization gains associated with industrial forest management. In the long term, the overall growing stock becomes stable after a recovery period and has reached a level similar to the initial level.
In addition to the limits available growing stock imposes on timber supply, forest cover constraints related to old seral representation, visual quality, community watersheds, and to a lesser extent Special Management Zones, restrict the harvest at various times during the planning horizon.
Included in this report are results of several sensitivity analyses which provide interpretive context for the Base Case, which is being proposed as the AAC for the TSA. These additional runs were conducted to test their impact on timber supply and demonstrate which analysis inputs are most important in terms of both management decisions and additional information requirements for future analyses.
In many sensitivity analyses it was possible to increase the short-term harvest volume above 1,175,500 m3/year. However, the short-term harvest has not been elevated for two reasons:
4 Harvest level supported by the land base without gains from forest management such as species selection, density control, genetic gain and vegetation management.
Kingcome TSA TSR 3 Analysis Report
Kingcome Licensee-Agency Group x
• Increasing the harvest level excessively in the short term has negative consequences later, causing harvest levels to decline, possibly below the natural stand LRSY; and
• Increasing the mid-term supply was stated as a priority in harvest flow policy.
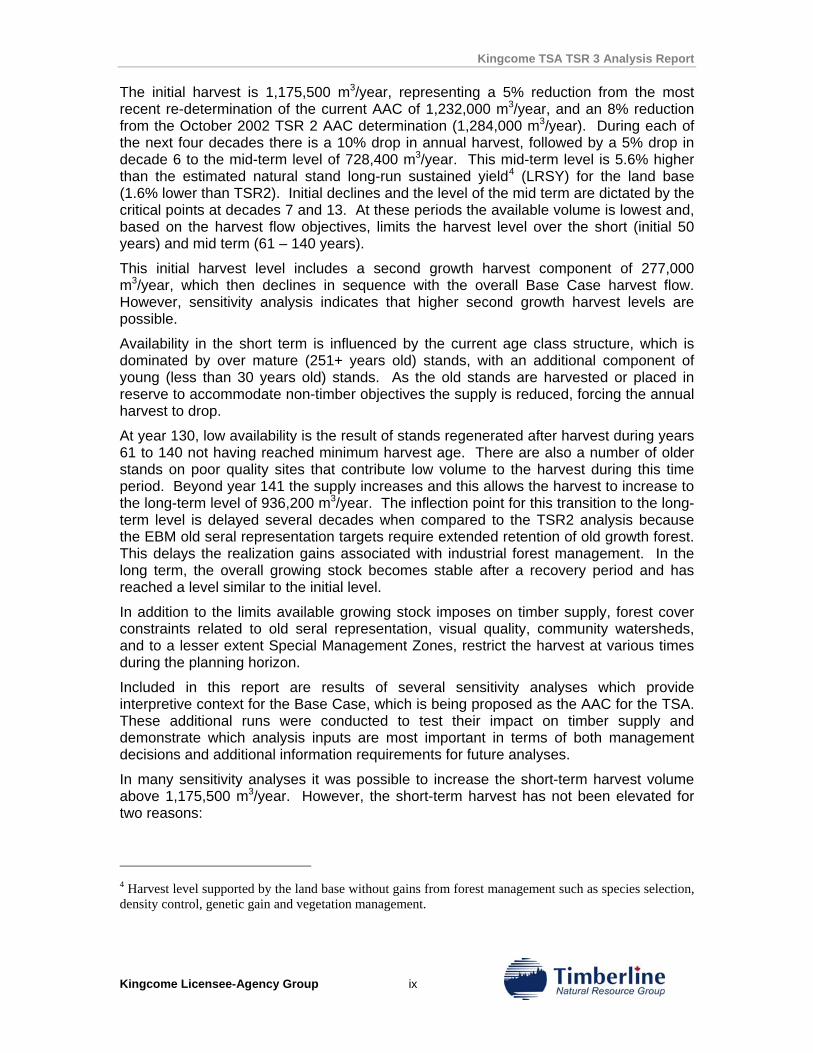
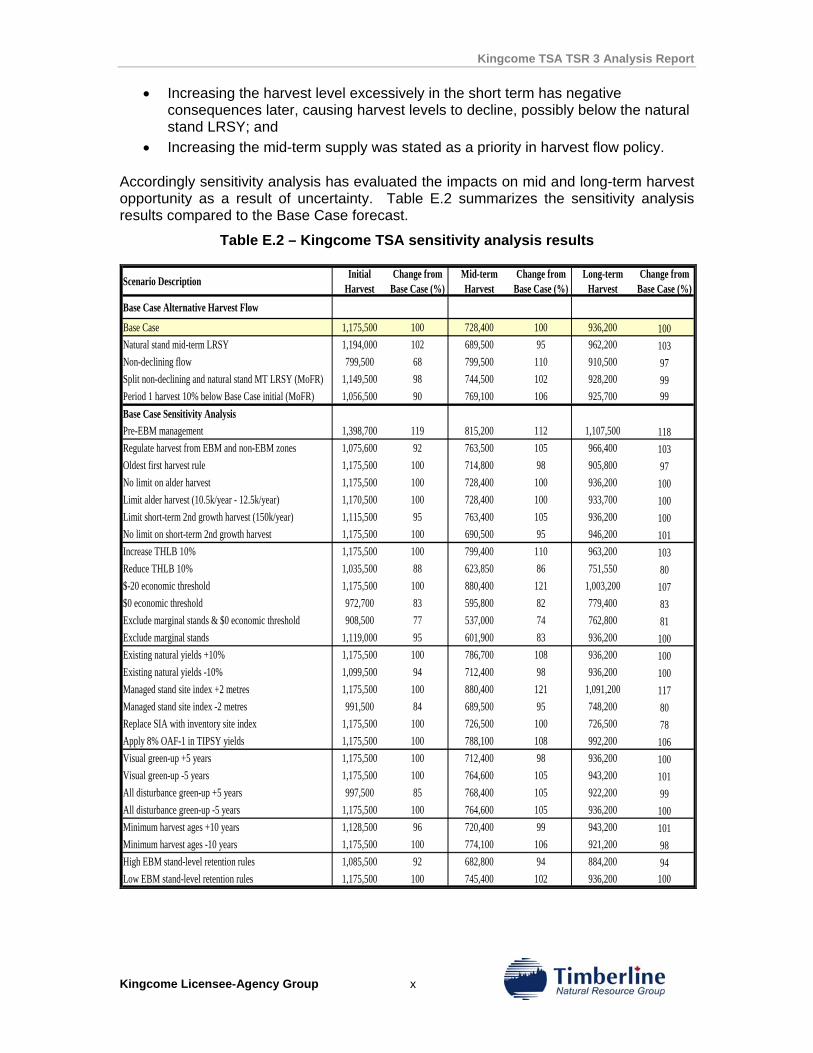
Accordingly sensitivity analysis has evaluated the impacts on mid and long-term harvest opportunity as a result of uncertainty. Table E.2 summarizes the sensitivity analysis results compared to the Base Case forecast.
Table E.2 – Kingcome TSA sensitivity analysis results
Scenario Description Initial Harvest
Change from Base Case (%)
Mid-term Harvest
Change from Base Case (%)
Long-term Harvest
Change from Base Case (%)
Base Case Alternative Harvest Flow
Base Case 1,175,500 100 728,400 100 936,200 100Natural stand mid-term LRSY 1,194,000 102 689,500 95 962,200 103Non-declining flow 799,500 68 799,500 110 910,500 97Split non-declining and natural stand MT LRSY (MoFR) 1,149,500 98 744,500 102 928,200 99Period 1 harvest 10% below Base Case initial (MoFR) 1,056,500 90 769,100 106 925,700 99Base Case Sensitivity AnalysisPre-EBM management 1,398,700 119 815,200 112 1,107,500 118Regulate harvest from EBM and non-EBM zones 1,075,600 92 763,500 105 966,400 103Oldest first harvest rule 1,175,500 100 714,800 98 905,800 97No limit on alder harvest 1,175,500 100 728,400 100 936,200 100Limit alder harvest (10.5k/year - 12.5k/year) 1,170,500 100 728,400 100 933,700 100Limit short-term 2nd growth harvest (150k/year) 1,115,500 95 763,400 105 936,200 100No limit on short-term 2nd growth harvest 1,175,500 100 690,500 95 946,200 101Increase THLB 10% 1,175,500 100 799,400 110 963,200 103Reduce THLB 10% 1,035,500 88 623,850 86 751,550 80$-20 economic threshold 1,175,500 100 880,400 121 1,003,200 107$0 economic threshold 972,700 83 595,800 82 779,400 83Exclude marginal stands & $0 economic threshold 908,500 77 537,000 74 762,800 81Exclude marginal stands 1,119,000 95 601,900 83 936,200 100Existing natural yields +10% 1,175,500 100 786,700 108 936,200 100Existing natural yields -10% 1,099,500 94 712,400 98 936,200 100Managed stand site index +2 metres 1,175,500 100 880,400 121 1,091,200 117Managed stand site index -2 metres 991,500 84 689,500 95 748,200 80Replace SIA with inventory site index 1,175,500 100 726,500 100 726,500 78Apply 8% OAF-1 in TIPSY yields 1,175,500 100 788,100 108 992,200 106Visual green-up +5 years 1,175,500 100 712,400 98 936,200 100Visual green-up -5 years 1,175,500 100 764,600 105 943,200 101All disturbance green-up +5 years 997,500 85 768,400 105 922,200 99All disturbance green-up -5 years 1,175,500 100 764,600 105 936,200 100Minimum harvest ages +10 years 1,128,500 96 720,400 99 943,200 101Minimum harvest ages -10 years 1,175,500 100 774,100 106 921,200 98High EBM stand-level retention rules 1,085,500 92 682,800 94 884,200 94Low EBM stand-level retention rules 1,175,500 100 745,400 102 936,200 100
Kingcome TSA TSR 3 Analysis Report
Kingcome Licensee-Agency Group xi
The results presented in this table confirm that the 1,175,500 m3/year forecast is a reasonable target for the TSA for the following reasons:
1. The forecast does not fall below the long-term natural stand LRSY; 2. It incorporates and satisfies all land use objectives associated with EBM; and 3. It captures the productive capacity of the land base by utilizing available harvest
volume by making the most of gains associated with forest management. Many sensitivity runs report back with a long-term harvest level that is the same or higher, as much as 17% higher, than reported for the Base Case, while only those with significant land base implication or site productivity reductions return lower anticipated results.
Many of the sensitivity analyses affect the harvest level at various times during the planning horizon. However, it is important to note that the timing of the changes to the mid and long-term harvest levels does not change dramatically with the various sensitivity analyses. This indicates the availability of timber is dictated by the existing inventory structure and the timing of harvesting future stands.
Two additional baseline harvest flow alternatives have been included to address harvest flow dynamics requested by Ministry of Forests and Range regional staff. These two scenarios are included at the top of this table just below the Base Case. Both of these runs also indicate that 1,175,500 m3/year is a reasonable forecast; by illustrating that substantial impacts today have marginal impact on the mid term and a negative impact on the long-term harvest potential.
Alternative harvest flow patterns do not provide significant benefit in the mid or long term, and in fact do not fully capture the productive capacity of the land base. EBM has introduced a number of new issues to address in terms of timber supply. It will be important to monitor how management decisions affect the targets for the issues, and to update resource inventory data to ensure that future timber supply analysis incorporates the best possible information.
Deciduous harvest in the Base Case is below the current harvest levels for this inventory group. However, given that hardwood tenures are exempt from EBM requirements, it is more realistic to determine the timber supply based on the Pre-EBM scenario, in which alder harvest is maintained at 25,000 m3/year for the next 40 years and cottonwood maintains 5,000 m3/year for the next 70 years. Consistent with the Coastal Forest Action Plan the analysis presented here included management of 6,211 hectares of alder and 653 hectares of cottonwood stands.
Presently in the Base Case harvest forecast operational adjustment factors (OAFs) are set at the provincial defaults and the economic operability threshold is set at $-10 profit. Both of these Base Case assumptions represent potential opportunities to significantly increase timber supply from the TSA. Reducing OAFs in sensitivity analysis permits the harvest to increase considerably. Research in other TSAs suggests that default OAFs are set too high. Combine this with the good and medium site hemlock presently excluded by the $-10 threshold and a there is a clear indication that the land base contributing to timber supply could be increased in future timber supply studies and improve the timber supply forecasts for the Kingcome TSA. It will therefore be important to continue gathering inventory data for these and other analysis inputs to improve the quality of timber supply estimates for the TSA.

Kingcome TSA TSR 3 Analysis Report
Kingcome Licensee-Agency Group xii
Kingcome TSA TSR 3 Analysis Report
Kingcome Licensee-Agency Group xiii
TABLE OF CONTENTS
1.0 INTRODUCTION .............................................................................................................. 1 1.1 BACKGROUND..........................................................................................................2 1.2 CENTRAL COAST LAND-USE DECISION PROCESS......................................................3 2.0 DESCRIPTION OF KINGCOME TSA ........................................................................... 5
3.0 TIMBER FLOW OBJECTIVES ...................................................................................... 7 3.1 ANALYSIS SCENARIOS..............................................................................................7
3.1.1 Pre-EBM.................................................................................................................. 7 3.1.2 EBM......................................................................................................................... 7 3.1.3 Harvest Flow Considerations.................................................................................. 8
4.0 LAND BASE INFORMATION ...................................................................................... 10 4.1 DATA SOURCES .....................................................................................................10 4.2 LAND BASE CLASSIFICATION...................................................................................10
4.2.1 Revisions to Land Base Classification................................................................... 10 4.2.2 Land Base Classification....................................................................................... 12
4.3 ECOSYSTEM AND FOREST INVENTORIES .................................................................17 4.4 INVENTORY AGGREGATION.....................................................................................19
4.4.1 Landscape Units .................................................................................................... 19 4.4.2 Resource Emphasis Areas ..................................................................................... 19 4.4.3 EBM Management Zones ...................................................................................... 21 4.4.4 Analysis Units........................................................................................................ 21
4.5 GROWTH AND YIELD...............................................................................................21 4.5.1 Natural Stands ....................................................................................................... 22 4.5.2 Managed Stands .................................................................................................... 22 4.5.3 Harvest System ...................................................................................................... 22 4.5.4 Minimum Harvest Age........................................................................................... 22 4.5.5 Productivity ........................................................................................................... 22
5.0 TIMBER SUPPLY ANALYSIS METHODS ................................................................ 25
6.0 BASE CASE TIMBER SUPPLY ANALYSIS RESULTS ......................................... 26 6.1 BASE CASE ALTERNATIVE HARVEST FLOW .............................................................26
6.1.1 Natural Stand Mid-Term LRSY ............................................................................. 27 6.1.2 Non-Declining ....................................................................................................... 27 6.1.3 Split Non-Declining (ND) & Natural Stand LRSY ................................................ 27 6.1.4 Period 1, 10% Below Base Case ........................................................................... 28
6.2 HARVEST CHARACTERISTICS..................................................................................29 6.3 STATUS OF NON-TIMBER RESOURCES....................................................................39 7.0 SENSITIVITY ANALYSIS RESULTS.......................................................................... 51 7.1 PRE-EBM MANAGEMENT .......................................................................................52 7.2 REGULATE HARVEST FROM EBM AND NON-EBM AREAS.........................................53 7.3 HARVEST RULES....................................................................................................55
7.3.1 Oldest First Harvest Rule ...................................................................................... 55
Kingcome TSA TSR 3 Analysis Report
Kingcome Licensee-Agency Group xiv
7.3.2 Alternative Deciduous Harvest Limits................................................................... 56 7.3.3 Alternative Second Growth Harvest Limits ........................................................... 59
7.4 LAND BASE ............................................................................................................62 7.4.1 Increase and Decrease THLB by 10% .................................................................. 62 7.4.2 Alternative Economic Operability Thresholds ...................................................... 63 7.4.3 Exclude Marginal Stands & $0 Economic Threshold ........................................... 65
7.5 GROWTH AND YIELD...............................................................................................66 7.5.1 Increase & Decrease Existing Natural Yields by 10%.......................................... 66 7.5.2 Increase & decrease Managed Stand Site Index ................................................... 67 7.5.3 Replace Managed Stand Adjusted Site Index with Inventory Site Index ............... 69 7.5.4 Apply 8% OAF-1 in TIPSY Yields ......................................................................... 70
7.6 FOREST COVER CONSTRAINTS...............................................................................72 7.6.1 Increase & decrease Green-up Ages in Visually Sensitive Areas ......................... 72 7.6.2 Increase & Decrease All Green-up Ages .............................................................. 73
7.7 MANAGEMENT ASSUMPTIONS .................................................................................74 7.7.1 Increase & Decrease Minimum Harvest Age ........................................................ 74
7.8 APPLY ALTERNATIVE EBM STAND-LEVEL RETENTION .............................................76 8.0 DISCUSSION .................................................................................................................. 78 8.1 PROPOSED AAC ....................................................................................................78 8.2 ECONOMIC OPERABILITY ........................................................................................79 8.3 SECOND GROWTH VOLUMES..................................................................................79 8.4 DECIDUOUS VOLUME..............................................................................................79 8.5 OPERATIONAL ADJUSTMENT FACTORS (OAFS) .......................................................79 8.6 TERRESTRIAL ECOSYSTEM MAPPING (TEM) ...........................................................80 8.7 OPERATIONAL ISSUES ............................................................................................80 8.8 CONCLUSIONS .......................................................................................................81 9.0 REFERENCES................................................................................................................ 82
LIST OF FIGURES
Figure 2.1 – Kingcome TSA overview ...................................................................................................... 5
Figure 4.1 – Productive and non-productive land ................................................................................. 15
Figure 4.2 – Land base classification – Pre-EBM and EBM ............................................................... 16
Figure 4.3 – Productive area by BEC sub zone and variant ............................................................... 17
Figure 4.4 – THLB by leading species and age class .......................................................................... 18
Figure 4.5 – Inventory site index distribution ......................................................................................... 23
Figure 4.6 – Adjusted site index distribution .......................................................................................... 24
Figure 6.1 – Base Case alternative harvest flow .................................................................................. 28
Figure 6.2 – Base Case growing stock................................................................................................... 29
Figure 6.3 – Age class distribution at selected periods........................................................................ 30
Figure 6.4 – Average harvest volume..................................................................................................... 31
Figure 6.5 – Average harvest area.......................................................................................................... 32
Kingcome TSA TSR 3 Analysis Report
Kingcome Licensee-Agency Group xv
Figure 6.6 – Average harvest age ........................................................................................................... 33
Figure 6.7 – Annual harvest diameter..................................................................................................... 34
Figure 6.8 – Harvest by stand type ......................................................................................................... 35
Figure 6.9 – Harvest by species composition and leading species.................................................... 36
Figure 6.10 – Harvest by site class ......................................................................................................... 37
Figure 6.11 – Annual harvest by target groups ..................................................................................... 38
Figure 6.12 – Harvest by TSA region ..................................................................................................... 39
Figure 6.13 – Community watershed status .......................................................................................... 40
Figure 6.14 – Enhanced Forestry Zone and IRM status ...................................................................... 41
Figure 6.15 – Visually sensitive areas status ........................................................................................ 43
Figure 6.16 – EBM objectives 8 and 12 status...................................................................................... 44
Figure 6.17 – VILUP Special RMZ retention status .............................................................................. 45
Figure 6.18 – Annual harvest within marbled murrelet habitat ........................................................... 46
Figure 7.1 – Pre-EBM management annual harvest ............................................................................ 53
Figure 7.2 – Regulate harvest from EBM and non-EBM zones annual harvest............................... 54
Figure 7.3 – Oldest first harvest rule annual harvest............................................................................ 56
Figure 7.4 – Limited alder contribution annual harvest ........................................................................ 58
Figure 7.5 – No-limit alder contribution annual harvest ....................................................................... 59
Figure 7.6 – Limit second growth harvest annual harvest ................................................................... 61
Figure 7.7 – No-limit second growth harvest annual harvest .............................................................. 62
Figure 7.8 – Adjusted THLB annual harvest.......................................................................................... 63
Figure 7.9 – Alternative economic thresholds annual harvest ............................................................ 64
Figure 7.10 – Exclude marginal stands & $0 economic threshold annual harvest .......................... 66
Figure 7.11 – Increase & decrease natural yields 10% annual harvest ............................................ 67
Figure 7.12 – Increase & decrease managed stand site index 2m annual harvest ......................... 69
Figure 7.13 – Replace managed stand SIA with inventory site index annual harvest .................... 70
Figure 7.14 – Apply 8% OAF-1 in TIPSY yields annual harvest......................................................... 71
Figure 7.15– Increase & decrease green-up ages in visually sensitive areas annual harvest ...... 73
Figure 7.16– Increase & decrease green-up ages in all management zones annual harvest ....... 74
Figure 7.17– Increase & decrease minimum harvest ages annual harvest ...................................... 76
Figure 7.18– Apply alternative EBM stand-level retention annual harvest ....................................... 77
LIST OF TABLES
Table 1.1 – Roles and responsibilities ...................................................................................................... 2
Table 1.2 – History of Kingcome TSA AAC ............................................................................................. 3
Kingcome TSA TSR 3 Analysis Report
Kingcome Licensee-Agency Group xvi
Table 4.1 – EBM blue-listed plant community reductions.................................................................... 11
Table 4.2 – Timber harvesting land base (THLB) determination........................................................ 13
Table 4.3 – Areas by REA Type .............................................................................................................. 19
Table 6.1 – Base Case alternative harvest flow scenarios.................................................................. 26
Table 6.2 – VILUP LU-BEC old forest status......................................................................................... 47
Table 6.3 – EBM site series surrogate old forest status by Landscape Unit .................................... 48
Table 7.1 – Sensitivity analysis scenarios ............................................................................................. 51
Table 7.2 – Pre-EBM management annual harvest ............................................................................. 52
Table 7.3 – Regulate harvest from EBM and non-EBM zones annual harvest ................................ 54
Table 7.4 – Oldest first harvest rule annual harvest ............................................................................. 55
Table 7.5 – Alternative deciduous harvest limits annual harvest........................................................ 57
Table 7.6 – Alternative second growth harvest limits annual harvest................................................ 60
Table 7.7 – Increase and decrease THLB 10% annual harvest ......................................................... 62
Table 7.8 – Alternative economic thresholds annual harvest ............................................................. 64
Table 7.9 – Exclude marginal stands and $0 economic threshold annual harvest.......................... 65
Table 7.10 – Increase & decrease natural yields 10% annual harvest.............................................. 66
Table 7.11 – Increase & decrease managed stand site index 2m annual harvest .......................... 68
Table 7.12 – Replace managed stand SIA with inventory site index annual harvest...................... 69
Table 7.13 – Apply 8% OAF-1 in TIPSY yields annual harvest .......................................................... 71
Table 7.14 – Increase & decrease green-up ages in visually sensitive areas annual harvest....... 72
Table 7.15 – Increase & decrease green-up ages in all management zones annual harvest ....... 73
Table 7.16 – Increase & decrease minimum harvest ages annual harvest ...................................... 75
Table 7.17 – Apply alternative EBM stand-level retention annual harvest........................................ 76
LIST OF APPENDICES
APPENDIX I – KINGCOME TIMBER SUPPLY AREA TSR3 BASE CASE EBM LANDSCAPE UNIT-SITE SERIES SURROGATE OLD FOREST RETENTION STATUS APPENDIX II – KINGCOME TIMBER SUPPLY AREA TSR3 OPERATIONAL PERFORMANCE IN THE INOPERABLE LAND BASE APPENDIX III – KINGCOME TIMBER SUPPLY AREA TSR3 SOCIO-ECONOMIC ANALYSIS APPENDIX IV – KINGCOME TIMBER SUPPLY AREA TSR3 DATA PACKAGE ADDENDUM APPENDIX V – KINGCOME TIMBER SUPPLY AREA TSR3 DATA PACKAGE
Kingcome TSA TSR 3 Analysis Report
Kingcome Licensee-Agency Group 1
1.0 INTRODUCTION
Timberline Natural Resource Group Ltd. (Timberline), on behalf of the Kingcome Timber Supply Area (TSA) Licensee Group (the Group) is preparing timber supply information for the Provincial timber supply review. The Group is composed of forest companies and British Columbia Timber Sales (BCTS) with participation by First Nations and the Ministry of Forests and Range (MFR). It was originally formed under the Defined Forest Area Management (DFAM) concept, developed by the MFR as a policy framework to identify the obligations and opportunities for collaborative forest management within the province’s TSAs. While the DFAM concept has since been terminated by the Chief Forester, the Group continues to exist and will assume collective responsibility for timber supply analysis within the TSA.
Timber supply reviews (TSRs) are usually conducted every five years to assist the B.C. Forest Service’s Chief Forester in re-determining the allowable annual cut (AAC). For the Kingcome TSA, the Chief Forester will determine a new AAC following acceptance of this report by the MFR.
Timberline is completing the steps leading up to, and including the delivery of, timber supply analyses as follows:
• Collecting data and preparation of a Data Package which summarizes the data assumptions—land base, growth and yield, forest management practices, statement of management strategies, and analysis methods—that will be used, and the critical issues that will be examined in the timber supply analysis;
• Completing the timber supply analysis and report; • Completing a socio-economic analysis; and • Providing the necessary information for public and First Nations reviews at
selected milestones during the process. This Kingcome Timber Supply Area TSR3 Data Package, the initial document published in support of the current TSR process, was released in May 2008. This document and an addendum are included as Appendices IV and V to this report. It was submitted at that time to the MFR and was also made available for a public and First Nations review over a period of two months5. The Chief Forester will consider the Timber Supply Analysis Report and other sources of information in order to make a new AAC determination. This determination will be published in a report entitled ‘Kingcome Timber Supply Area – Rationale for AAC Determination’.
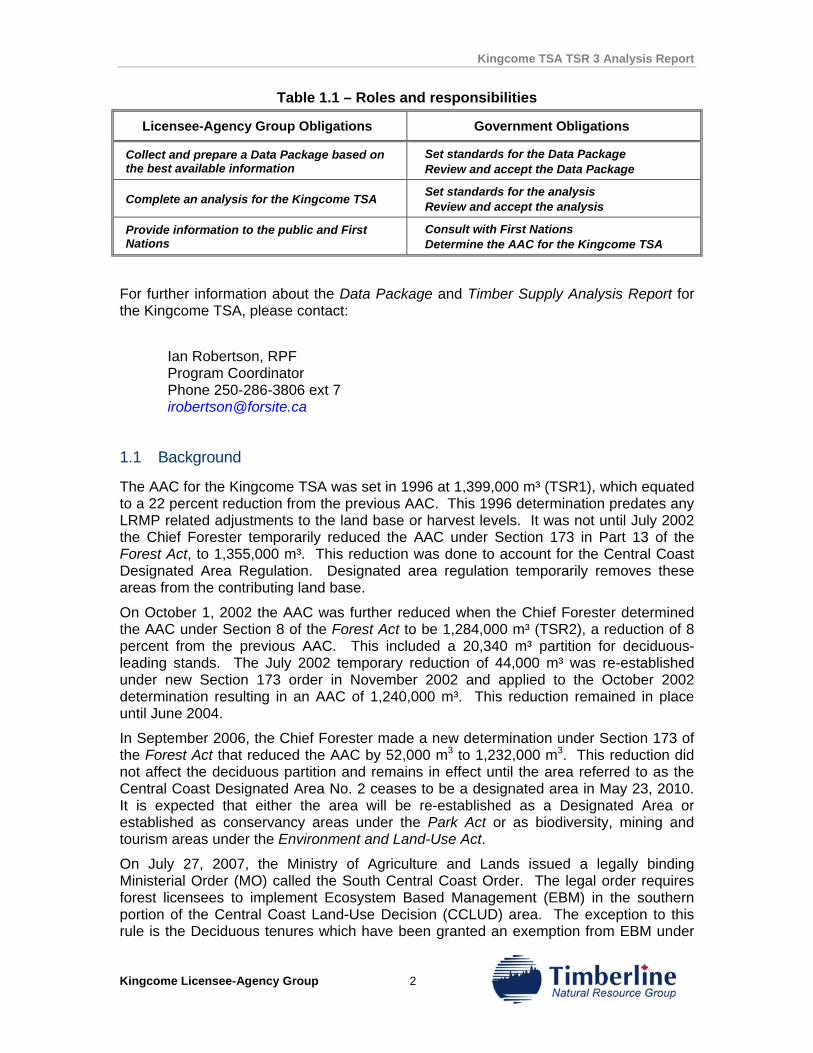
MFR staff plays a key role in reviewing and accepting both the Data Package and the subsequent timber supply analysis. They have provided technical support, facilitated resolution of issues, and validated technical information. Table 1.1 shows the general roles and responsibilities associated with the timber supply analysis leading to an AAC determination. Once the public and First Nations review of this report has been completed the Chief Forester will determine a new AAC for the TSA.
5 Public review and comment of the data package was completed and accepted on July 11, 2008
Kingcome TSA TSR 3 Analysis Report
Kingcome Licensee-Agency Group 2
Table 1.1 – Roles and responsibilities
Licensee-Agency Group Obligations Government Obligations
Collect and prepare a Data Package based on the best available information
Set standards for the Data Package Review and accept the Data Package
Complete an analysis for the Kingcome TSA Set standards for the analysis Review and accept the analysis
Provide information to the public and First Nations
Consult with First Nations Determine the AAC for the Kingcome TSA
For further information about the Data Package and Timber Supply Analysis Report for the Kingcome TSA, please contact:
Ian Robertson, RPF Program Coordinator Phone 250-286-3806 ext 7 [email protected]
1.1 Background
The AAC for the Kingcome TSA was set in 1996 at 1,399,000 m³ (TSR1), which equated to a 22 percent reduction from the previous AAC. This 1996 determination predates any LRMP related adjustments to the land base or harvest levels. It was not until July 2002 the Chief Forester temporarily reduced the AAC under Section 173 in Part 13 of the Forest Act, to 1,355,000 m³. This reduction was done to account for the Central Coast Designated Area Regulation. Designated area regulation temporarily removes these areas from the contributing land base.
On October 1, 2002 the AAC was further reduced when the Chief Forester determined the AAC under Section 8 of the Forest Act to be 1,284,000 m³ (TSR2), a reduction of 8 percent from the previous AAC. This included a 20,340 m³ partition for deciduous-leading stands. The July 2002 temporary reduction of 44,000 m³ was re-established under new Section 173 order in November 2002 and applied to the October 2002 determination resulting in an AAC of 1,240,000 m³. This reduction remained in place until June 2004.
In September 2006, the Chief Forester made a new determination under Section 173 of the Forest Act that reduced the AAC by 52,000 m3 to 1,232,000 m3. This reduction did not affect the deciduous partition and remains in effect until the area referred to as the Central Coast Designated Area No. 2 ceases to be a designated area in May 23, 2010. It is expected that either the area will be re-established as a Designated Area or established as conservancy areas under the Park Act or as biodiversity, mining and tourism areas under the Environment and Land-Use Act.
On July 27, 2007, the Ministry of Agriculture and Lands issued a legally binding Ministerial Order (MO) called the South Central Coast Order. The legal order requires forest licensees to implement Ecosystem Based Management (EBM) in the southern portion of the Central Coast Land-Use Decision (CCLUD) area. The exception to this rule is the Deciduous tenures which have been granted an exemption from EBM under
Kingcome TSA TSR 3 Analysis Report
Kingcome Licensee-Agency Group 3
Part 1 Section 4 of the MO for the South Central Coast. This includes only the mainland portion of the Kingcome TSA.
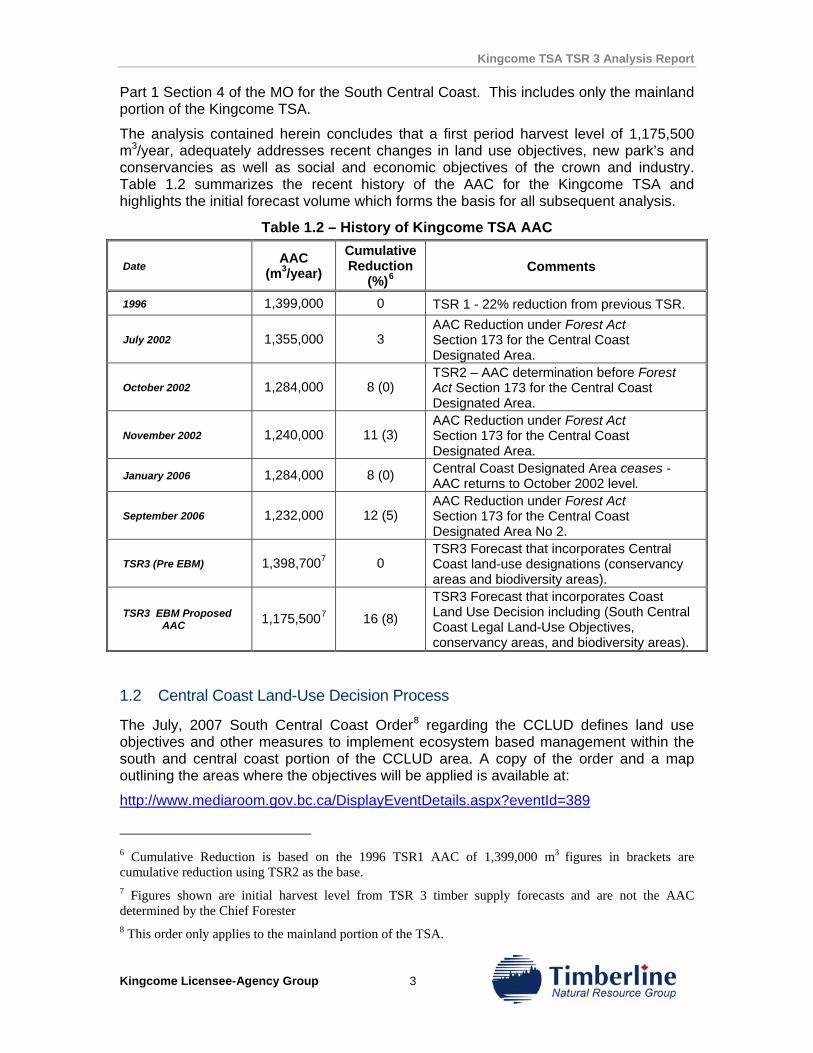
The analysis contained herein concludes that a first period harvest level of 1,175,500 m3/year, adequately addresses recent changes in land use objectives, new park’s and conservancies as well as social and economic objectives of the crown and industry. Table 1.2 summarizes the recent history of the AAC for the Kingcome TSA and highlights the initial forecast volume which forms the basis for all subsequent analysis.
Table 1.2 – History of Kingcome TSA AAC
Date AAC (m3/year)
Cumulative Reduction
(%)6 Comments
1996 1,399,000 0 TSR 1 - 22% reduction from previous TSR.
July 2002 1,355,000 3 AAC Reduction under Forest Act Section 173 for the Central Coast Designated Area.
October 2002 1,284,000 8 (0) TSR2 – AAC determination before Forest Act Section 173 for the Central Coast Designated Area.
November 2002 1,240,000 11 (3) AAC Reduction under Forest Act Section 173 for the Central Coast Designated Area.
January 2006 1,284,000 8 (0) Central Coast Designated Area ceases -AAC returns to October 2002 level.
September 2006 1,232,000 12 (5) AAC Reduction under Forest Act Section 173 for the Central Coast Designated Area No 2.
TSR3 (Pre EBM) 1,398,7007 0 TSR3 Forecast that incorporates Central Coast land-use designations (conservancy areas and biodiversity areas).
TSR3 EBM Proposed AAC 1,175,5007 16 (8)
TSR3 Forecast that incorporates Coast Land Use Decision including (South Central Coast Legal Land-Use Objectives, conservancy areas, and biodiversity areas).
1.2 Central Coast Land-Use Decision Process
The July, 2007 South Central Coast Order8 regarding the CCLUD defines land use objectives and other measures to implement ecosystem based management within the south and central coast portion of the CCLUD area. A copy of the order and a map outlining the areas where the objectives will be applied is available at:
http://www.mediaroom.gov.bc.ca/DisplayEventDetails.aspx?eventId=389
6 Cumulative Reduction is based on the 1996 TSR1 AAC of 1,399,000 m3 figures in brackets are cumulative reduction using TSR2 as the base. 7 Figures shown are initial harvest level from TSR 3 timber supply forecasts and are not the AAC determined by the Chief Forester 8 This order only applies to the mainland portion of the TSA.
Kingcome TSA TSR 3 Analysis Report
Kingcome Licensee-Agency Group 4
There are two key components that will be recognized when addressing the CCLUD, specifically:
• Protection / exclusion of new Conservancy areas and Biodiversity areas; and • Ecosystem-Based Management (EBM) objectives and targets.
Kingcome TSA TSR 3 Analysis Report
Kingcome Licensee-Agency Group 5
2.0 DESCRIPTION OF KINGCOME TSA
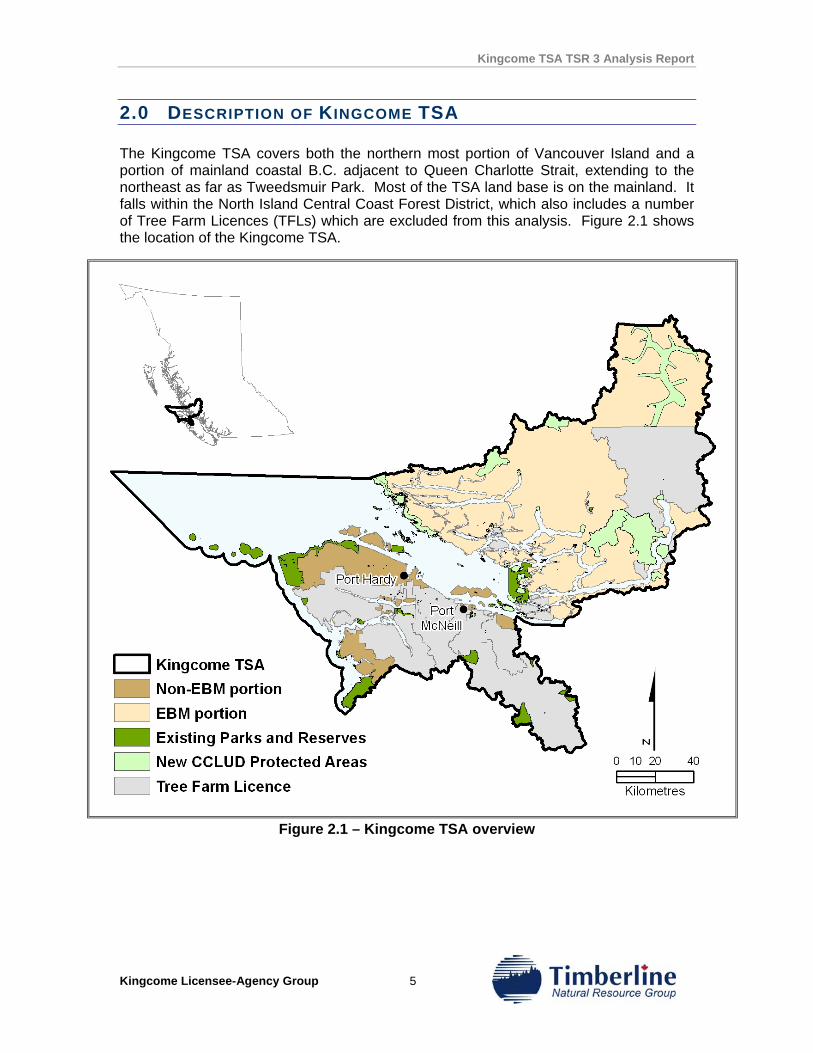
The Kingcome TSA covers both the northern most portion of Vancouver Island and a portion of mainland coastal B.C. adjacent to Queen Charlotte Strait, extending to the northeast as far as Tweedsmuir Park. Most of the TSA land base is on the mainland. It falls within the North Island Central Coast Forest District, which also includes a number of Tree Farm Licences (TFLs) which are excluded from this analysis. Figure 2.1 shows the location of the Kingcome TSA.
Figure 2.1 – Kingcome TSA overview
Kingcome TSA TSR 3 Analysis Report
Kingcome Licensee-Agency Group 6
A variety of terrain conditions are found on the TSA including poorly drained lowlands on northern Vancouver Island, the rugged Coast Mountains and some drier interior areas in the upper Klinaklini drainage. Major tree species include western hemlock, western redcedar, amabilis (true) fir, and minor components of Douglas-fir, yellow cedar, spruce and deciduous species.
Most of the productive land within the TSA is classified as Coastal Western Hemlock (CWH) biogeoclimatic (BEC) zone. CWH, characterized by wet, mild weather is found between sea level and 1,000 meters of elevation. Most of the timber harvesting land base (THLB) is located in this zone. Above 1,000 meters the other forested BEC zone present on the TSA is Mountain Hemlock (MH) noted for long, cold, wet winters, short cool, moist summers and the dominance of mountain hemlock, western hemlock and true firs. At high elevations is the Coastal Mountain-heather Alpine (CMA) BEC zone, which is characterized by cold, snowy winters and a landform covered with ice, snow, rock mixed with tundra and flowering meadows. Trees, where they exist in this zone are sparse and stunted.
Kingcome TSA TSR 3 Analysis Report
Kingcome Licensee-Agency Group 7
3.0 TIMBER FLOW OBJECTIVES
The objective of the analysis is to determine the capacity of the land base to sustain a timber flow, and any risks to this flow resulting from uncertainty in assumptions. A number of different harvest flows will be explored, based on tradeoffs between short and mid-term harvest levels. The forest cover constraints and biological capacity of the THLB will dictate timber availability and harvest level options.
The overall strategy employed in the TSA is to gradually adjust harvest levels towards the best estimate of the long-term harvest level (LTHL) for the forest. In all timber supply scenarios, the choice(s) of harvest flow will reflect the following objectives:
• Achieve an acceptable short-term harvest level; • Decrease the periodic harvest level in acceptable steps (<= 10%) when declines
are required to meet all objectives associated with the various resources on the land base;
• Do not permit the mid-term harvest level to fall below a level reflecting the natural productive capacity of the TSA – 689,500 m3/year in this case (based on VDYP natural stand yield estimates); and
• Achieve a stable long-term harvest level over a 250-year time horizon reflecting the productive capacity of the TSA under current forest management practices (based on TIPSY managed stand yield estimates).
In addition, a portion of the annual harvest will be directed to second growth stands to reflect current practice. This harvest target will incorporate an initial level of 277,000 m3/year and will be in place for the first 70 years of simulation. Sensitivity analysis will explore the implications of much higher and lower second growth harvest rates.
3.1 Analysis Scenarios
Two initial scenarios have been modeled for the Kingcome TSR3 timber supply analysis: • Pre-EBM; and • EBM.
3.1.1 Pre-EBM
The Pre-EBM analysis is based on the TSR2 analysis completed in October 2002, the details of which are documented in TSR2 analysis report (MFR, 2001). However, current data sources and inventories (forest cover, operability, land base removals etc.) were used to develop the Pre-EBM data set as outlined in Section 4.2.2.
While this analysis does not address EBM as described in law, and articulated in the South Central Coast order of July 2007 the analysis does address land base removals occurring in the plan area as a consequence of new Conservancy, Biodiversity, Mining & Tourism Areas and Central Coast Designated Area No. 2 which were established as a result of the Central Coast Land Use Decision and preceding process.
3.1.2 EBM The South Central Coast Ministerial Order (MO) is now legally established, formalizing into law the Land Use Objectives for the South Central Coast Area under the Land Act.
Kingcome TSA TSR 3 Analysis Report
Kingcome Licensee-Agency Group 8
The order establishes 15 land use objectives for the following topics, among others: cultural heritage resources, freshwater ecosystem habitats, landscape and stand level biodiversity and grizzly bear habitat. These objectives provide direction for implementing ecosystem based management on the south coast in a manner that maintains ecosystem integrity and improves human well-being as supported by a viable forest industry. This analysis is based on the corrected version of the original order from July 27, 2007. In November 2006, the Kingcome TSA Timber Supply Review stakeholders composed a letter to the Provincial Chief Forester seeking direction on the role that EBM should have in TSR. The TSR process is intended to model “current practice” on a management unit yet at that time the final EBM parameters had not yet been set by the MFR.
In his January 16, 2007 letter in response, the Chief Forester acknowledged that while the exact EBM framework had not yet been formalized, the development of the actual EBM components should be left to the discretion of the Kingcome TSA stakeholder group. On February 19, 2007, a sub-group of the Kingcome TSA stakeholders met to define the timber supply analysis framework for the Kingcome TSR and finalize the parameters proposed for modelling the key components of EBM. The sub-group included Ted Stevens and Gary Ardron representing First Nations interests, David Mackay, Gerry Sommers, and Warren Warttig of International Forest Products Ltd., Peter Kofoed of Western Forest Products Ltd., Jim Brown, Jennifer Barolet and Christina Mardell of the MFR, and Tara McCormick, Dave Coster, Laszlo Kardos, and Hamish Robertson of Timberline Natural Resource Group Ltd.
Data sources and assumptions needed to address Ecosystem-Based Management objectives were defined by the group. Since that time, these approaches have been refined as the specifics of each objective have been clarified. For each objective, the specific approach is documented in the appropriate section of the Data Package, depending upon whether it is a netdown factor (Section 5.2), a management zone (Sections 6.2, 9.2) a stand growth and yield adjustment (Section 8.5), or a timber flow consideration (Section 10.9).
These objectives will be modeled within the EBM zone (see Figure 2.1) of the TSA and include the land base removals associated with the CCLUD.
3.1.3 Harvest Flow Considerations
MFR has circulated a draft working paper: Harvest Flow Considerations for the Timber Supply Review (March 2004). This draft working paper provides guidance on developing base case harvest forecasts by describing the primary objectives of the Crown related to timber supply.
Key points highlighted on this document are:
1. The continued availability of good forest jobs and the long term stability of communities that rely on forest jobs (Direction provided by the Minister of Forests to the Chief Forester),
2. An initial harvest level as close to the current AAC as possible,
3. The need to have a smooth transition to second growth,
4. A mid-term harvest level that does not fall below the natural stand LRSY,
5. Short-term harvest rates are not increased at the expense of lowering the mid-term level.
Kingcome TSA TSR 3 Analysis Report
Kingcome Licensee-Agency Group 9
The Base Case harvest forecast developed for this analysis meets all of these objectives. Points one and two above are linked to the social and economic objectives of the Crown. The base case described in this analysis reports on an initial harvest volume is 6 percent below that of TSR2 and 14 percent below that of TSR1. This reduction is necessary to accommodate land use and land management decisions arrived at during the land use planning process and captured in the Central Coast Land Use Decision (CCLUD).
Second growth harvest is also modeled in a manner consistent with operational practice requirements that substantiate and support the investment necessary in harvesting and processing equipment and facilities to provide a stable and orderly transition to a harvest profile that will be predominantly second growth in the near future.
The mid term harvest level objectives have been met by developing a forecast that does not fall below the natural stand long run sustainable yield. The natural stand productivity is evaluated as it represents the productive capacity of the land base without forest management intervention. Forest management practices (such as density control, use of select seed and fertilization) change the managed stand long run sustainable yield. If the long term harvest level was the primary objective a much more rapid conversion of unmanaged stands to managed stands (articulated by a very high short term harvest level) would be required to realize forest management benefits earlier in the harvest forecast. The dynamics and impacts of different initial harvest rates on future harvest levels are illustrated in this analysis in the scenarios modeled that vary the initial harvest level.
Kingcome TSA TSR 3 Analysis Report
Kingcome Licensee-Agency Group 10
4.0 LAND BASE INFORMATION
This section describes factors that influence management of the Kingcome TSA land base and the methodology used to determine the way in which land contributes to timber supply. Some portions of the productive land base, while not contributing to harvest, may be available to meet other resource needs.
4.1 Data Sources
A complete description of the data sources and assumptions used as the basis for this analysis is contained in the Kingcome TSA TSR3 Data Package. This document is included as part of this analysis report in Appendix V. The following key data sources were employed in this analysis:
• VRI coverage for the entire TSA; • VRI phase II attribute adjustments; • Improved site productivity estimates for managed stands; • Genetic gain estimates for tree improvement program; • Updated spatially explicit road buffers; • Updated spatially explicit stream buffers; • Community watersheds; • Updated cultural heritage and archaeological sites; • Updated wildlife habitat information including grizzly bear and marbled murrelet; • New economic operability assessment; • New Conservancy Area • New Biodiversity, Mining and Tourism Areas; • EBM boundaries; and • Allowance for disturbances in the non-timber harvesting land base.
All inventory data was assembled using spatially explicit methods and stored in a GIS database.
4.2 Land Base Classification
The Data Package includes a description of issues, information sources, assumptions, and criteria used to estimate the land base available for timber harvesting, including any relevant data processing or adjustments.
4.2.1 Revisions to Land Base Classification
Since the acceptance of the Data Package, a revision to the reductions for blue-listed plant communities has been made. The new methodology ensures that 70% of the productive forest within each blue-listed plant community is preserved. Originally a 70% reduction was assigned to each plant community regardless of how much had been excluded for other land base reductions (inoperable, riparian, wildlife habitat, etc.).
The new reductions were based on blue-listed plant communities within each landscape unit and BEC combination. An area target of 70% was determined for the productive forest within each LU-BEC combination. After all other land base netdowns were completed, the remaining net area within each LU-BEC was compared to the 70% target
Kingcome TSA TSR 3 Analysis Report
Kingcome Licensee-Agency Group 11
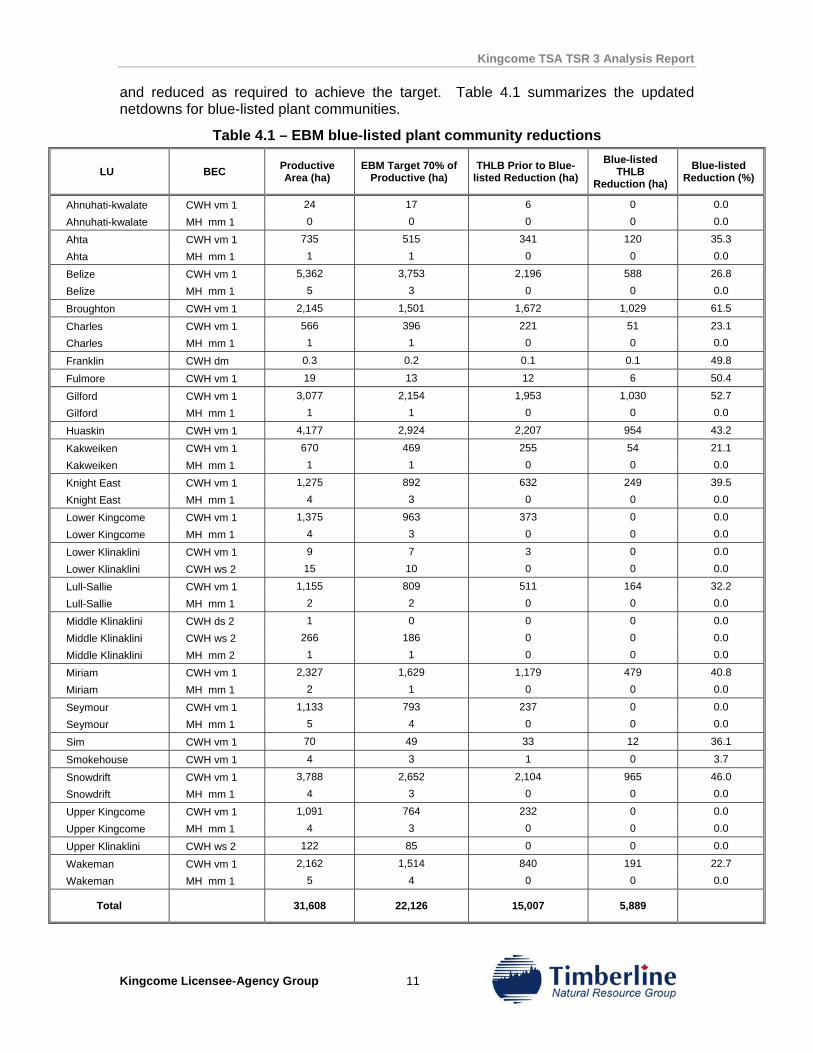
and reduced as required to achieve the target. Table 4.1 summarizes the updated netdowns for blue-listed plant communities.
Table 4.1 – EBM blue-listed plant community reductions
LU BEC Productive Area (ha)
EBM Target 70% of Productive (ha)
THLB Prior to Blue-listed Reduction (ha)
Blue-listed THLB
Reduction (ha)
Blue-listed Reduction (%)
Ahnuhati-kwalate CWH vm 1 24 17 6 0 0.0 Ahnuhati-kwalate MH mm 1 0 0 0 0 0.0
Ahta CWH vm 1 735 515 341 120 35.3 Ahta MH mm 1 1 1 0 0 0.0
Belize CWH vm 1 5,362 3,753 2,196 588 26.8 Belize MH mm 1 5 3 0 0 0.0
Broughton CWH vm 1 2,145 1,501 1,672 1,029 61.5
Charles CWH vm 1 566 396 221 51 23.1 Charles MH mm 1 1 1 0 0 0.0
Franklin CWH dm 0.3 0.2 0.1 0.1 49.8
Fulmore CWH vm 1 19 13 12 6 50.4
Gilford CWH vm 1 3,077 2,154 1,953 1,030 52.7 Gilford MH mm 1 1 1 0 0 0.0
Huaskin CWH vm 1 4,177 2,924 2,207 954 43.2
Kakweiken CWH vm 1 670 469 255 54 21.1 Kakweiken MH mm 1 1 1 0 0 0.0
Knight East CWH vm 1 1,275 892 632 249 39.5 Knight East MH mm 1 4 3 0 0 0.0
Lower Kingcome CWH vm 1 1,375 963 373 0 0.0 Lower Kingcome MH mm 1 4 3 0 0 0.0
Lower Klinaklini CWH vm 1 9 7 3 0 0.0 Lower Klinaklini CWH ws 2 15 10 0 0 0.0
Lull-Sallie CWH vm 1 1,155 809 511 164 32.2 Lull-Sallie MH mm 1 2 2 0 0 0.0
Middle Klinaklini CWH ds 2 1 0 0 0 0.0 Middle Klinaklini CWH ws 2 266 186 0 0 0.0 Middle Klinaklini MH mm 2 1 1 0 0 0.0
Miriam CWH vm 1 2,327 1,629 1,179 479 40.8 Miriam MH mm 1 2 1 0 0 0.0
Seymour CWH vm 1 1,133 793 237 0 0.0 Seymour MH mm 1 5 4 0 0 0.0
Sim CWH vm 1 70 49 33 12 36.1
Smokehouse CWH vm 1 4 3 1 0 3.7
Snowdrift CWH vm 1 3,788 2,652 2,104 965 46.0 Snowdrift MH mm 1 4 3 0 0 0.0
Upper Kingcome CWH vm 1 1,091 764 232 0 0.0 Upper Kingcome MH mm 1 4 3 0 0 0.0
Upper Klinaklini CWH ws 2 122 85 0 0 0.0
Wakeman CWH vm 1 2,162 1,514 840 191 22.7 Wakeman MH mm 1 5 4 0 0 0.0
Total 31,608 22,126 15,007 5,889
Kingcome TSA TSR 3 Analysis Report
Kingcome Licensee-Agency Group 12
In addition, the grizzly bear habitat removal was applied before the blue-listed reductions noted above. This made a minor change to the grizzly withdrawal, which remained as a 100% exclusion. As a result of this change to the land base classification the net THLB increases by 7,128 ha for the EBM scenario, compared to the net THLB figures reported in the Data Package.
Subsequent to preparing the Data Package it was also discovered that several polygons were identified as having a harvest history based on change detection analysis when, in fact, they should not have been included in the THLB. While it was not possible to directly address this issue, the size of the THLB used in modelling has been reduced from what is reported in the land base definition as a result of removing sliver polygons from the modelling input files. This reduction more than offsets the additional land included and addresses any concerns about excessive area in the THLB. Furthermore, it is not expected that this area would have any short term implications since it is currently identified as logged and has no volume associated with it.
4.2.2 Land Base Classification
All of the land base classification steps performed during TSR2 remain in the current classification. However, the following additions or modifications have been made since TSR2:
• Existing road losses are now explicitly (spatially) identified and removed from the land base contributing to timber supply;
• Riparian reserve and management zones are now explicitly (spatially) identified and removed from the land base contributing to timber supply;
• Old growth management areas, established within some landscape units, are now identified and removed from the land base contributing to timber supply;
• Landscape units outside the South Central Coast Order plan area with no old growth management areas are now managed to retention levels set by the Order Establishing Provincial Non-spatial Old Growth Objectives (June 30, 2004);
• Wildlife habitat areas (WHAs) and Ungulate Winter Ranges (UWRs) are now identified and removed from the land base contributing to timber supply;
• Revised marginal site exclusion thresholds based on current and past performance; • Existing forest inventory age and height values were adjusted, and the forest inventory
has been updated for disturbance to 2004; • New operability based on economic operability assessment for TSA completed in 2006
incorporated into analysis; • Archaeological sites have been explicitly identified and the land base contributing to
timber supply has been adjusted to account for these areas; • Karst terrain features are now identified and removed from the THLB; • Biodiversity Areas and Conservancy Areas either proposed or established as result of the
CCLUD are now removed from the land base contributing to timber supply; and • EBM objectives requiring areas to be removed from the THLB are incorporated into the
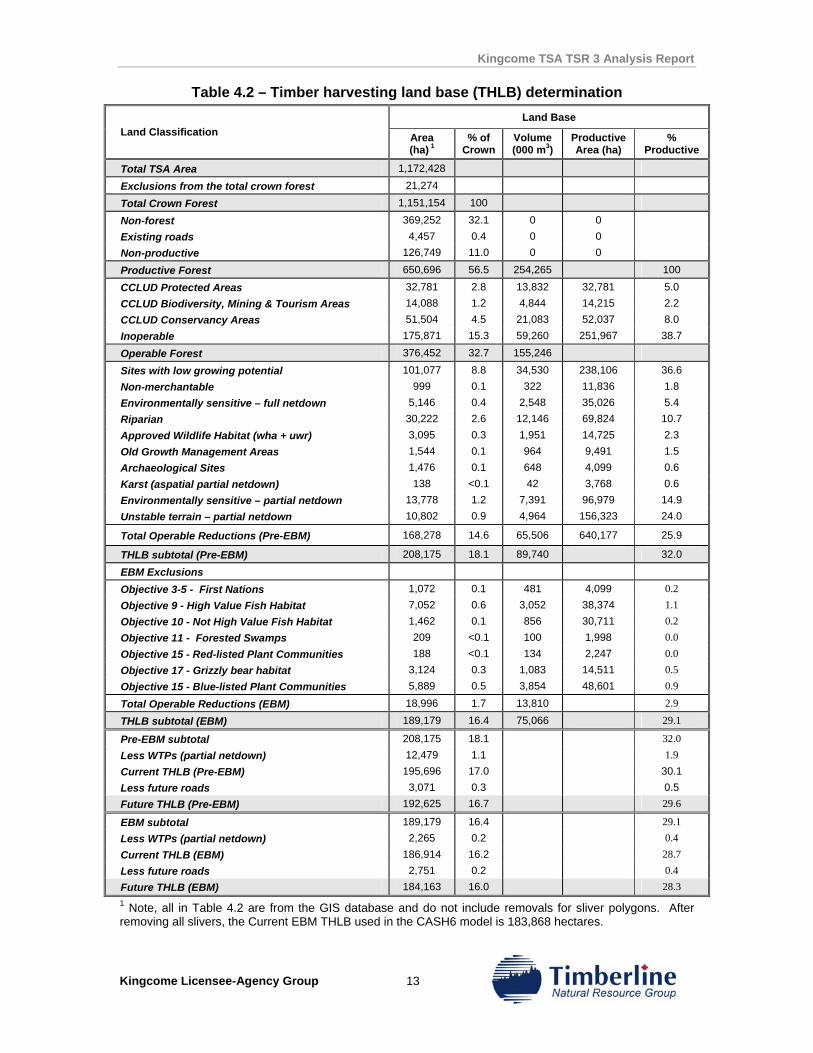
netdown process. Table 4.2 presents the updated results of the land base classification process to identify the timber harvesting land base. Individual areas may have several classification attributes. For example, stands within riparian reserve boundaries might also be classified as non-commercial. These areas would have been classified on the basis of this latter attribute, prior to the riparian classification. Therefore, in most cases the net reduction will be less than the total area in the classification. The order of the entries in Table 4.2 corresponds to the sequence of land base classification assignments.
Kingcome TSA TSR 3 Analysis Report
Kingcome Licensee-Agency Group 13
Table 4.2 – Timber harvesting land base (THLB) determination Land Base
Land Classification Area (ha) 1
% of Crown
Volume (000 m3)
Productive Area (ha)
% Productive
Total TSA Area 1,172,428
Exclusions from the total crown forest 21,274
Total Crown Forest 1,151,154 100
Non-forest 369,252 32.1 0 0 Existing roads 4,457 0.4 0 0 Non-productive 126,749 11.0 0 0
Productive Forest 650,696 56.5 254,265 100
CCLUD Protected Areas 32,781 2.8 13,832 32,781 5.0 CCLUD Biodiversity, Mining & Tourism Areas 14,088 1.2 4,844 14,215 2.2 CCLUD Conservancy Areas 51,504 4.5 21,083 52,037 8.0 Inoperable 175,871 15.3 59,260 251,967 38.7
Operable Forest 376,452 32.7 155,246
Sites with low growing potential 101,077 8.8 34,530 238,106 36.6 Non-merchantable 999 0.1 322 11,836 1.8 Environmentally sensitive – full netdown 5,146 0.4 2,548 35,026 5.4 Riparian 30,222 2.6 12,146 69,824 10.7 Approved Wildlife Habitat (wha + uwr) 3,095 0.3 1,951 14,725 2.3 Old Growth Management Areas 1,544 0.1 964 9,491 1.5 Archaeological Sites 1,476 0.1 648 4,099 0.6 Karst (aspatial partial netdown) 138 <0.1 42 3,768 0.6 Environmentally sensitive – partial netdown 13,778 1.2 7,391 96,979 14.9 Unstable terrain – partial netdown 10,802 0.9 4,964 156,323 24.0
Total Operable Reductions (Pre-EBM) 168,278 14.6 65,506 640,177 25.9
THLB subtotal (Pre-EBM) 208,175 18.1 89,740 32.0
EBM Exclusions
Objective 3-5 - First Nations 1,072 0.1 481 4,099 0.2 Objective 9 - High Value Fish Habitat 7,052 0.6 3,052 38,374 1.1 Objective 10 - Not High Value Fish Habitat 1,462 0.1 856 30,711 0.2 Objective 11 - Forested Swamps 209 <0.1 100 1,998 0.0 Objective 15 - Red-listed Plant Communities 188 <0.1 134 2,247 0.0 Objective 17 - Grizzly bear habitat 3,124 0.3 1,083 14,511 0.5 Objective 15 - Blue-listed Plant Communities 5,889 0.5 3,854 48,601 0.9
Total Operable Reductions (EBM) 18,996 1.7 13,810 2.9
THLB subtotal (EBM) 189,179 16.4 75,066 29.1
Pre-EBM subtotal 208,175 18.1 32.0 Less WTPs (partial netdown) 12,479 1.1 1.9 Current THLB (Pre-EBM) 195,696 17.0 30.1 Less future roads 3,071 0.3 0.5 Future THLB (Pre-EBM) 192,625 16.7 29.6
EBM subtotal 189,179 16.4 29.1 Less WTPs (partial netdown) 2,265 0.2 0.4 Current THLB (EBM) 186,914 16.2 28.7 Less future roads 2,751 0.2 0.4 Future THLB (EBM) 184,163 16.0 28.3 1 Note, all in Table 4.2 are from the GIS database and do not include removals for sliver polygons. After removing all slivers, the Current EBM THLB used in the CASH6 model is 183,868 hectares.
Kingcome TSA TSR 3 Analysis Report
Kingcome Licensee-Agency Group 14
The final land base classification results in a Pre-EBM current THLB of 195,696 hectares and an EBM THLB of 186,914 hectares, compared to the TSR2 current timber harvesting land base (168,726 ha) documented in the Kingcome TSA TSR2 Analysis Report. While reductions to address new Central Coast biodiversity, conservancy and EBM objectives removed significant areas from timber production, these were offset by additions based on a new economic operability assessment, and revised low site criteria.
The total TSA area of 1,172,428 hectares represents the Kingcome TSA without any TFL or ocean area within the boundary of the TSA. Note that the WTP reductions were the final step of the netdown process but were different for the Pre-EBM and EBM land bases, so they are not listed with the other productive netdown steps.
Additional area in the THLB, as estimated by MFR due to satellite change detection errors, is approximately 2,450 hectares (1.3%) whereas the sliver polygons removed from the modelling inputs total 3,025 hectares (1.6%). Slivers were defined as any resultant polygon less than 0.1 ha in size. These polygons are excluded from the modelling process to improve efficiency and to allow more meaningful analysis results.
This resulted in a modelling THLB of 183,868 hectares. This figure remains conservative as a result of harvested area being excluded from the model. During marginal site performance measurements it was noted that 1,030 hectares of harvested blocks from recent harvest history data were excluded from the model. Many of these omissions are attributed to missing VRI attributes.
The THLB area includes 5,549 hectares of unreverted timber license areas which do not contribute to the TSA timber supply until after they are harvested and regenerated. Also, 12,937 hectares of not satisfactorily regenerated areas (NSR) are included in the THLB, and are scheduled to be regenerated successfully in the first planning period. Land classified as NSR includes areas confirmed as recent harvesting, but also includes areas with no stand attribute data (8,851 hectares) and areas with questionable VRI attribute data (277 hectares). Therefore actual NSR area is approximately 3,500 hectares. It is important to note that no land is classified as backlog NSR.
Some parks and protected areas not administered as part of the Kingcome TSA are included in the land base for analysis, as they contribute to non-timber objectives such as old-growth seral requirements to maintain landscape-level biodiversity.
Kingcome TSA TSR 3 Analysis Report
Kingcome Licensee-Agency Group 15
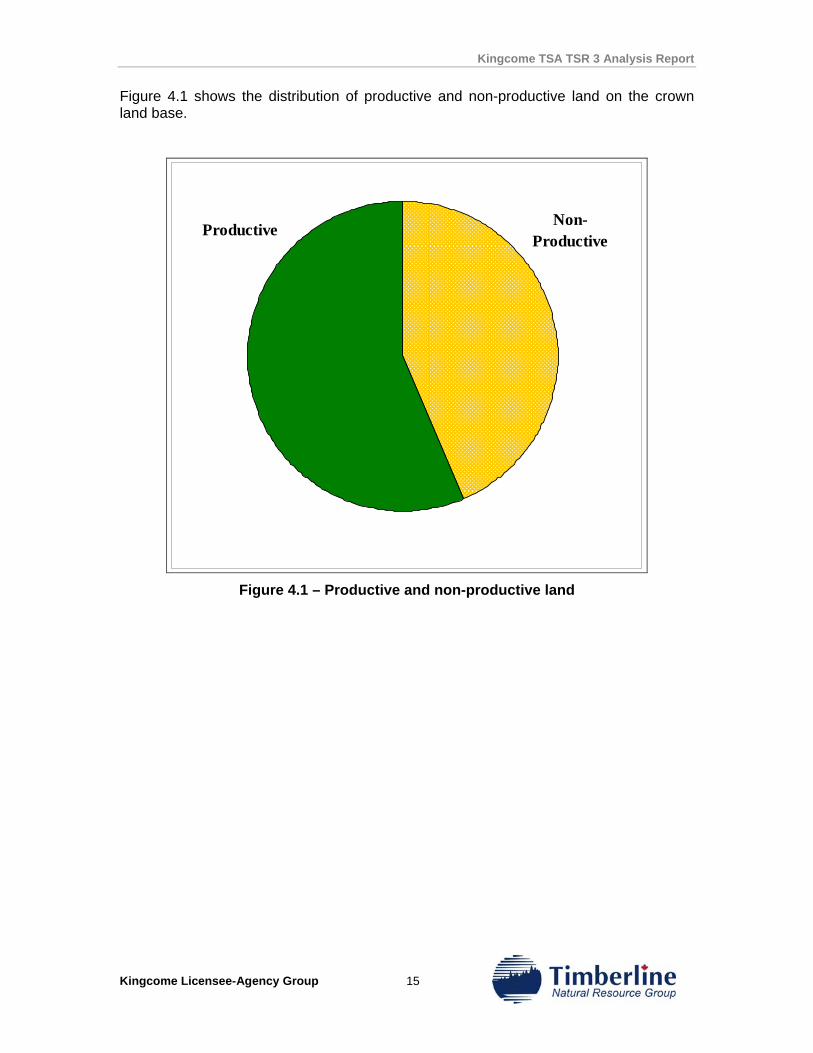
Figure 4.1 shows the distribution of productive and non-productive land on the crown land base.
Productive Non-Productive
Figure 4.1 – Productive and non-productive land
Kingcome TSA TSR 3 Analysis Report
Kingcome Licensee-Agency Group 16
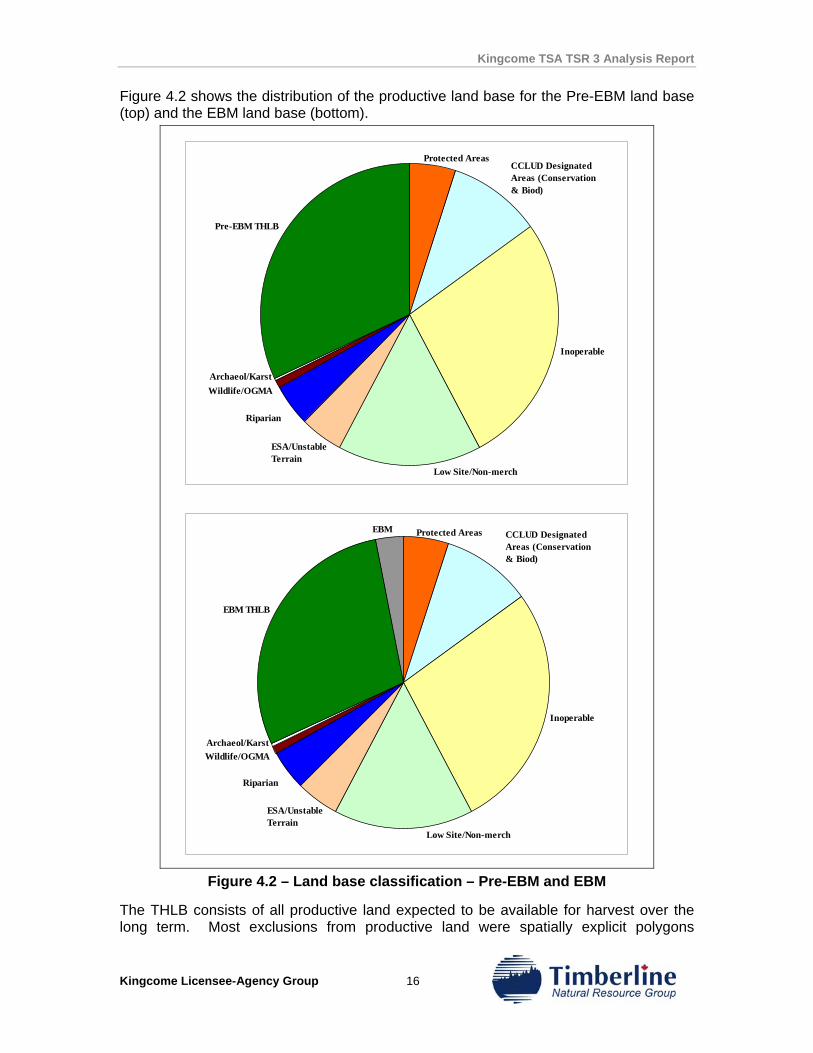
Figure 4.2 shows the distribution of the productive land base for the Pre-EBM land base (top) and the EBM land base (bottom).
Inoperable
Pre-EBM THLB
Protected Areas
Archaeol/KarstWildlife/OGMA
Riparian
ESA/Unstable Terrain
Low Site/Non-merch
CCLUD Designated Areas (Conservation & Biod)
Inoperable
EBM THLB
EBM Protected Areas
Archaeol/KarstWildlife/OGMA
Riparian
ESA/Unstable Terrain
Low Site/Non-merch
CCLUD Designated Areas (Conservation & Biod)
Figure 4.2 – Land base classification – Pre-EBM and EBM
The THLB consists of all productive land expected to be available for harvest over the long term. Most exclusions from productive land were spatially explicit polygons
Kingcome TSA TSR 3 Analysis Report
Kingcome Licensee-Agency Group 17
identified from the various inventories. However, some reductions were assigned to the land base as small percentage removals (netdowns) including unstable terrain, some ESAs, archaeological sites and karst features.
4.3 Ecosystem and Forest Inventories
The productive forested area of the Kingcome TSA is 650,696 ha. The following land categories are excluded from the productive land base:
• All salt and fresh water; • Private and federal lands; • Provincial crown land that is administered as part of the Kingcome TSA for timber
supply; and • Non-productive types.
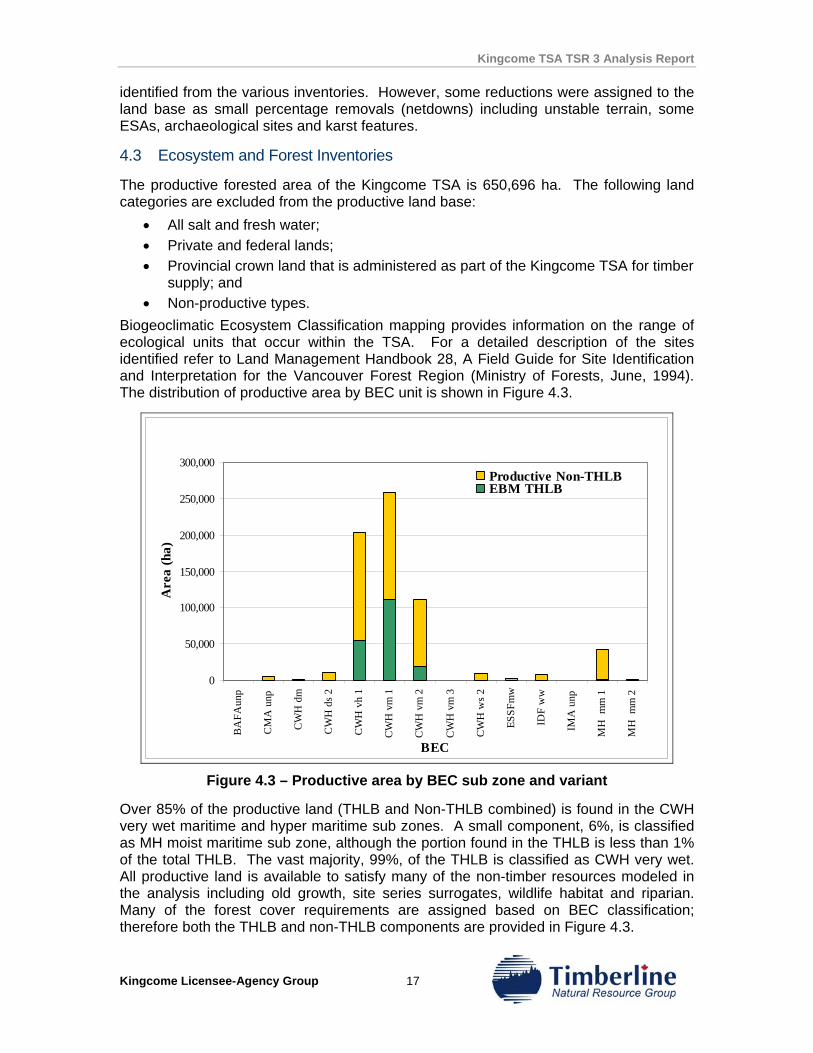
Biogeoclimatic Ecosystem Classification mapping provides information on the range of ecological units that occur within the TSA. For a detailed description of the sites identified refer to Land Management Handbook 28, A Field Guide for Site Identification and Interpretation for the Vancouver Forest Region (Ministry of Forests, June, 1994). The distribution of productive area by BEC unit is shown in Figure 4.3.
0
50,000
100,000
150,000
200,000
250,000
300,000
BA
FAun
p
CM
A u
np
CW
H d
m
CW
H d
s 2
CW
H v
h 1
CW
H v
m 1
CW
H v
m 2
CW
H v
m 3
CW
H w
s 2
ESSF
mw
IDF
ww
IMA
unp
MH
mm
1
MH
mm
2
BEC
Are
a (h
a)
Productive Non-THLBEBM THLB
Figure 4.3 – Productive area by BEC sub zone and variant
Over 85% of the productive land (THLB and Non-THLB combined) is found in the CWH very wet maritime and hyper maritime sub zones. A small component, 6%, is classified as MH moist maritime sub zone, although the portion found in the THLB is less than 1% of the total THLB. The vast majority, 99%, of the THLB is classified as CWH very wet. All productive land is available to satisfy many of the non-timber resources modeled in the analysis including old growth, site series surrogates, wildlife habitat and riparian. Many of the forest cover requirements are assigned based on BEC classification; therefore both the THLB and non-THLB components are provided in Figure 4.3.
Kingcome TSA TSR 3 Analysis Report
Kingcome Licensee-Agency Group 18
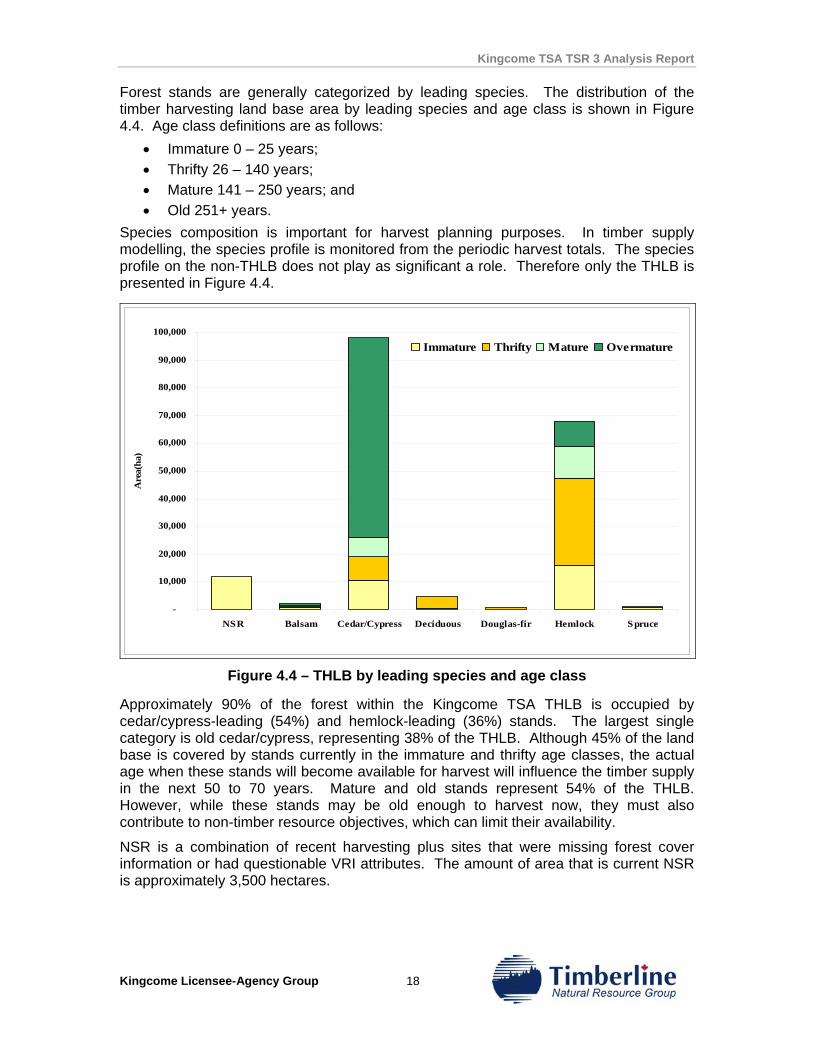
Forest stands are generally categorized by leading species. The distribution of the timber harvesting land base area by leading species and age class is shown in Figure 4.4. Age class definitions are as follows:
• Immature 0 – 25 years; • Thrifty 26 – 140 years; • Mature 141 – 250 years; and • Old 251+ years.
Species composition is important for harvest planning purposes. In timber supply modelling, the species profile is monitored from the periodic harvest totals. The species profile on the non-THLB does not play as significant a role. Therefore only the THLB is presented in Figure 4.4.
-
10,000
20,000
30,000
40,000
50,000
60,000
70,000
80,000
90,000
100,000
NSR Balsam Cedar/Cypress Deciduous Douglas-fir Hemlock Spruce
Are
a(ha
)
Immature Thrifty Mature Overmature
Figure 4.4 – THLB by leading species and age class
Approximately 90% of the forest within the Kingcome TSA THLB is occupied by cedar/cypress-leading (54%) and hemlock-leading (36%) stands. The largest single category is old cedar/cypress, representing 38% of the THLB. Although 45% of the land base is covered by stands currently in the immature and thrifty age classes, the actual age when these stands will become available for harvest will influence the timber supply in the next 50 to 70 years. Mature and old stands represent 54% of the THLB. However, while these stands may be old enough to harvest now, they must also contribute to non-timber resource objectives, which can limit their availability.
NSR is a combination of recent harvesting plus sites that were missing forest cover information or had questionable VRI attributes. The amount of area that is current NSR is approximately 3,500 hectares.
Kingcome TSA TSR 3 Analysis Report
Kingcome Licensee-Agency Group 19
4.4 Inventory Aggregation
As part of the modelling process stands are aggregated for many purposes. They are grouped in order to represent areas designated for special management considerations and they are also aggregated to model stands with similar growth patterns.
4.4.1 Landscape Units
For planning purposes, the Kingcome TSA has been subdivided into 46 landscape units. For the CCLUD region of the TSA these are used to model landscape level biodiversity objectives described in the South Central Coast Order. Within a single landscape unit there are dozens of old seral forest targets that must be met to address the objective. For the Vancouver Island component of the TSA the non spatial old growth order targets are applied. The Data Package has a full list of all landscape unit-BEC and landscape unit-site series surrogates modeled in the analysis.
4.4.2 Resource Emphasis Areas
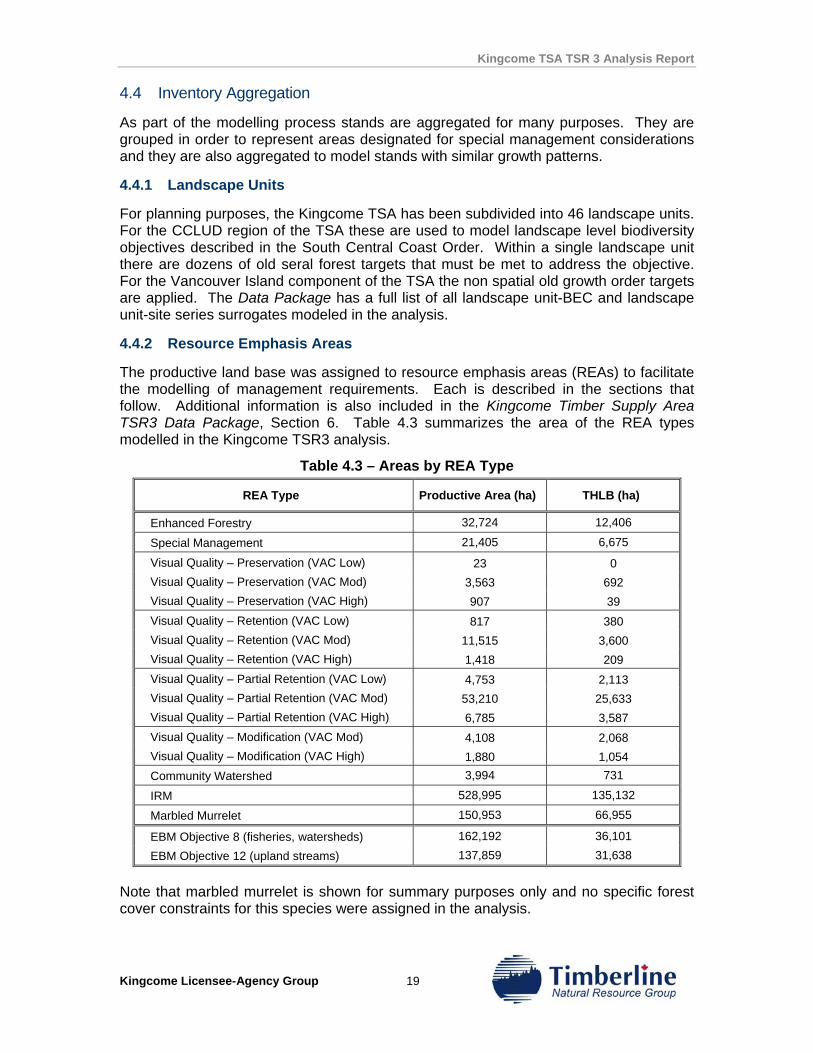
The productive land base was assigned to resource emphasis areas (REAs) to facilitate the modelling of management requirements. Each is described in the sections that follow. Additional information is also included in the Kingcome Timber Supply Area TSR3 Data Package, Section 6. Table 4.3 summarizes the area of the REA types modelled in the Kingcome TSR3 analysis.
Table 4.3 – Areas by REA Type
REA Type Productive Area (ha) THLB (ha)
Enhanced Forestry 32,724 12,406
Special Management 21,405 6,675
Visual Quality – Preservation (VAC Low) 23 0 Visual Quality – Preservation (VAC Mod) 3,563 692 Visual Quality – Preservation (VAC High) 907 39 Visual Quality – Retention (VAC Low) 817 380 Visual Quality – Retention (VAC Mod) 11,515 3,600 Visual Quality – Retention (VAC High) 1,418 209 Visual Quality – Partial Retention (VAC Low) 4,753 2,113 Visual Quality – Partial Retention (VAC Mod) 53,210 25,633 Visual Quality – Partial Retention (VAC High) 6,785 3,587 Visual Quality – Modification (VAC Mod) 4,108 2,068 Visual Quality – Modification (VAC High) 1,880 1,054 Community Watershed 3,994 731
IRM 528,995 135,132
Marbled Murrelet 150,953 66,955
EBM Objective 8 (fisheries, watersheds) 162,192 36,101 EBM Objective 12 (upland streams) 137,859 31,638
Note that marbled murrelet is shown for summary purposes only and no specific forest cover constraints for this species were assigned in the analysis.
Kingcome TSA TSR 3 Analysis Report
Kingcome Licensee-Agency Group 20
4.4.2.1 Visual Quality and Integrated Resource Management In the Kingcome TSA, polygonal-based visual quality objective (VQO) zones9 are incorporated into the analysis as REAs. VQOs comprise 88,977 productive hectares, of which 39,376 ha fall within the THLB. Both THLB and productive non-contributing land contribute to the management requirements within the VQO polygon. For modelling purposes, visual polygons are assessed for both VQO and visual absorption capacity (VAC).
Twenty-five percent of the productive land base falls within VQO REAs. However, a large proportion of each REA is found in the non-THLB. This is relevant because the non-THLB can contribute to fulfilling the management requirements for each VQO REA, thereby reducing the pressure on the THLB.
Any area within the THLB that is not classified as visually sensitive was assigned to the integrated resource management (IRM) REA. These areas may be non-visible or visible but are not considered to be visually significant, and therefore have fewer restrictions on harvesting. For modelling purposes the IRM areas were aggregated within each landscape unit, resulting in 46 discreet units. Within this area a general 3-meter green-up requirement was applied to the mainland portion of the land base.
4.4.2.2 Vancouver Island Land Use Plan The Vancouver Island Land Use Plan (VILUP) includes five Enhanced Forestry Zones (EFZ) and four special management zone designations in the Kingcome TSA. EFZ’s are designed to increase the short term availability of timber by applying a 1.3-meter green-up constraint, down from 3 meters. Special Management Zones (SMZ) are designed to maintain mature and old forest conditions to zone specific targets. For green-up in SMZs the 3-meter green up constraint is applied.
4.4.2.3 Community Watersheds REAs have also been defined for community watersheds Three community watersheds are present within the Kingcome TSA, although only one has any THLB, 760 ha, within its boundary. In community watersheds with a THLB component a maximum of 1% of the area is permitted to be below the green up height each year. To model this constraint a 5% per 5-year period is applied.
4.4.2.4 Marbled Murrelet Nesting Habitat In order to evaluate how much suitable habitat remains in the non-contributing land base the TSR 3 analysis incorporates coarse scale mapping of potential suitable marbled murrelet nesting habitat. Habitat mapping data was based on application of the BC Coast Marbled Murrelet Suitability Model (Chatwin and Mather, 2007). The model was used in that study to estimate the distribution of existing habitat. It was considered a strategic level assessment, and was not supplemented with any photo mapping or low level reconnaissance. The mapping did not consider classes of habitat quality, and stand attributes such as canopy structure and site productivity were not considered. Further, the data used was only current to TSR 2, and therefore the results are somewhat dated.
9 VQO polygons used are those identified in the Visual Quality Objective Order issued by Charles van Hemmen, District Manager, North Island Central Coast Forest District – August 19, 2005
Kingcome TSA TSR 3 Analysis Report
Kingcome Licensee-Agency Group 21
The March 2006 Notice under Section 7(2) of the FPPR for the North Island Central Coast Forest District requires that the total amount of currently suitable nesting habitat for marbled murrelet in the non-contributing land base (as of March 2006) be maintained. This amounts to 83,998 ha of productive non-THLB.
4.4.3 EBM Management Zones
In addition to the Pre-EBM management zones described in Section 4.4.2, the following management zones have been applied to address EBM Objectives:
• Objective 8 – important fisheries watersheds; • Objective 12 – upland streams; and • Objective 14 – landscape level biodiversity using landscape units and site series
surrogates (a complete list is provided in Appendices I and IV). These management constraints are in addition to the land base reductions and additional yield tables modeled to address EBM objectives.
4.4.4 Analysis Units
The inventory was aggregated into analysis units (AU) to capture biological and productivity similarities for modelling purposes. The definition of analysis units originated from the Kingcome TSA TSR2 analysis, with modifications after a series of TSA licensee and MFR regional and district reviews. Changes from TSR2 include:
• New aspen/cottonwood (Act) analysis unit, to incorporate all Act leading stands in the inventory.
• New Fdc planted zone, used to convert existing analysis units to a future regime planted to Fdc.
• New marginal cedar and hemlock analysis units added to separate low site conditions.
• Analysis units divided by EBM management zone, to provide for subsequent flexibility with different yield table generation parameters under EBM management scenarios.
(1)Fdc is being planted as a leading component in the southern most part of the TSA and on south facing slopes, warranting its inclusion as part of the analysis unit definition. Interfor spatially identified these areas on a map to define the Fdc planted zone. Modelling assumptions within this Fdc planted zone were subsequently clarified with MFR and Interfor, and it was agreed that all existing non-Fdc leading stands inside the Fdc planted zone would be directed to a future planted Fdc managed stand yield table (MSYT).
4.5 Growth and Yield
Forest growth and yield refers to the prediction of the growth and development of individual stands over time. Stand growth in terms of height, diameter, and volume is projected over time through the use of yield models. Yield tables were categorized as either natural stands or managed stands because of distinct management regimes and growth pattern differences between the two types of stands. Existing natural and managed stands were also differentiated based on stand age. The parameters used to define the yield table inputs were identified in the accepted Kingcome Timber Supply Analysis Data Package.
Kingcome TSA TSR 3 Analysis Report
Kingcome Licensee-Agency Group 22
4.5.1 Natural Stands
Natural stand yield tables (NSYTs) were developed for those analysis units which were established naturally and have not been influenced by management (improved seedlings, stocking control, fertilization, etc.) since establishment. Inputs into the yield tables included inventory site index, species composition, stocking class, and crown closure. Phase 2 adjusted age and height attributes were used as inputs to the natural stand yield tables, and the volume adjustment factor (also included in the inventory) was used as a multiplier to all natural stand yield tables.
Individual NSYTs were generated for all existing natural stands by forest cover polygon, and then aggregated by analysis unit. For the Cottonwood leading (Act) analysis unit, VDYP version 7 for the NSYT was approved by the MFR. 10
4.5.2 Managed Stands
Managed stand yield tables (MSYTs) were developed for existing and future managed stands as outlined in the Data Package. Inputs included species composition from the inventory (compiled by analysis unit), silviculture regimes by analysis unit, and adjusted site index estimates from the inventory. The yield tables were developed using the MFR BatchTIPSY (version 4.1c) program for managed stands.
4.5.3 Harvest System
Clearcutting with retention was assumed to be the predominant harvesting system. Reductions were applied to yield curves to account for trees left to meet wildlife tree requirements. Additional reductions were applied to both the land base and yield curves for those stands growing in the EBM areas to account for the higher retention levels that are required to meet various EBM objectives.
4.5.4 Minimum Harvest Age
A minimum harvest age (MHA) is developed for each analysis unit based on the criteria described below. An AU is first harvestable when it meets the greater of either of the following criteria:
• Minimum volume of 350 m3/hectare for cedar-leading, 500 m3/hectare for other coniferous-leading or 250 m3/hectare for deciduous-leading; or
• 95% of culmination mean annual increment (CMAI). In most cases the minimum volume threshold was the limiting factor in setting minimum harvest age.
4.5.5 Productivity The rate at which a stand grows is determined by the underlying site productivity, and the chosen stand management regime. The productivity of a stand is measured based on site index. The inventory site index from the forest cover database was used to develop yield tables for all existing stands. Figure 4.5 shows the distribution of inventory stand site index classes for the THLB by leading species group. 10 VDYP version 7 was used for the cottonwood (Act) analysis unit with the approval of J. Brown, MFR. This same NSYT was used for both current and future analysis units.
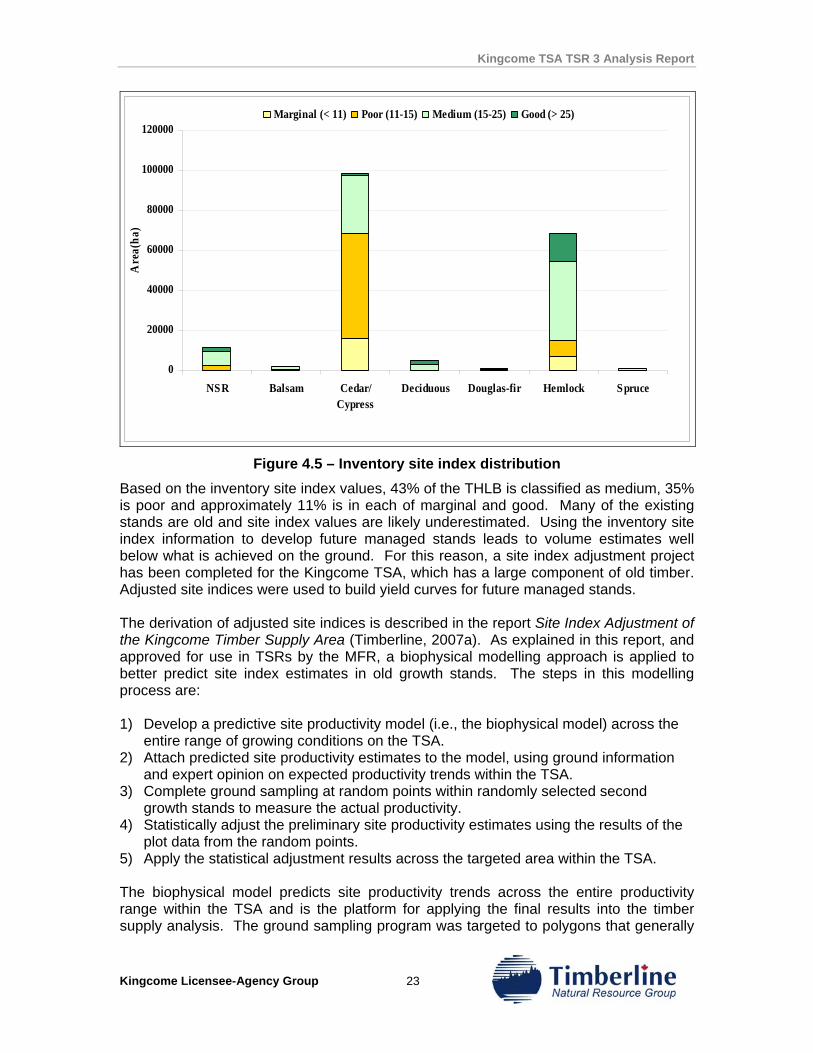
Kingcome TSA TSR 3 Analysis Report
Kingcome Licensee-Agency Group 23
0
20000
40000
60000
80000
100000
120000
NSR Balsam Cedar/Cypress
Deciduous Douglas-fir Hemlock Spruce
Are
a(ha
)
Marginal (< 11) Poor (11-15) Medium (15-25) Good (> 25)
Figure 4.5 – Inventory site index distribution
Based on the inventory site index values, 43% of the THLB is classified as medium, 35% is poor and approximately 11% is in each of marginal and good. Many of the existing stands are old and site index values are likely underestimated. Using the inventory site index information to develop future managed stands leads to volume estimates well below what is achieved on the ground. For this reason, a site index adjustment project has been completed for the Kingcome TSA, which has a large component of old timber. Adjusted site indices were used to build yield curves for future managed stands. The derivation of adjusted site indices is described in the report Site Index Adjustment of the Kingcome Timber Supply Area (Timberline, 2007a). As explained in this report, and approved for use in TSRs by the MFR, a biophysical modelling approach is applied to better predict site index estimates in old growth stands. The steps in this modelling process are: 1) Develop a predictive site productivity model (i.e., the biophysical model) across the
entire range of growing conditions on the TSA. 2) Attach predicted site productivity estimates to the model, using ground information
and expert opinion on expected productivity trends within the TSA. 3) Complete ground sampling at random points within randomly selected second
growth stands to measure the actual productivity. 4) Statistically adjust the preliminary site productivity estimates using the results of the
plot data from the random points. 5) Apply the statistical adjustment results across the targeted area within the TSA. The biophysical model predicts site productivity trends across the entire productivity range within the TSA and is the platform for applying the final results into the timber supply analysis. The ground sampling program was targeted to polygons that generally
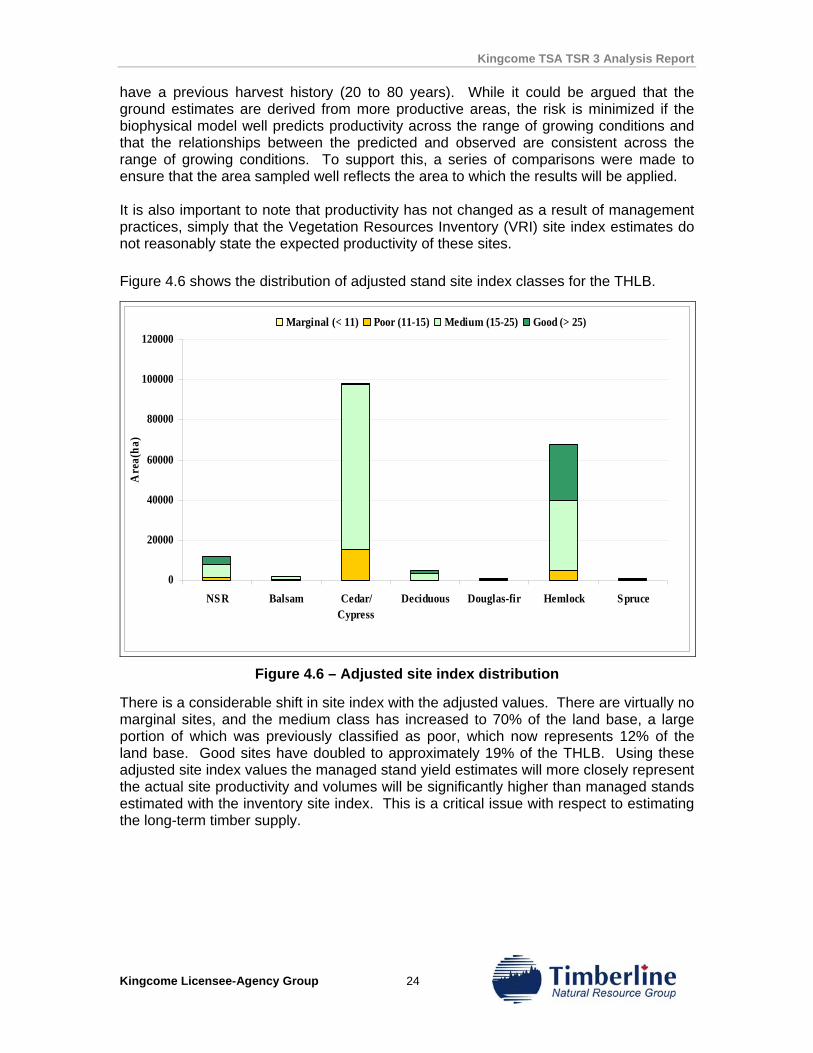
Kingcome TSA TSR 3 Analysis Report
Kingcome Licensee-Agency Group 24
have a previous harvest history (20 to 80 years). While it could be argued that the ground estimates are derived from more productive areas, the risk is minimized if the biophysical model well predicts productivity across the range of growing conditions and that the relationships between the predicted and observed are consistent across the range of growing conditions. To support this, a series of comparisons were made to ensure that the area sampled well reflects the area to which the results will be applied. It is also important to note that productivity has not changed as a result of management practices, simply that the Vegetation Resources Inventory (VRI) site index estimates do not reasonably state the expected productivity of these sites. Figure 4.6 shows the distribution of adjusted stand site index classes for the THLB.
0
20000
40000
60000
80000
100000
120000
NSR Balsam Cedar/Cypress
Deciduous Douglas-fir Hemlock Spruce
Are
a(ha
)
Marginal (< 11) Poor (11-15) Medium (15-25) Good (> 25)
Figure 4.6 – Adjusted site index distribution
There is a considerable shift in site index with the adjusted values. There are virtually no marginal sites, and the medium class has increased to 70% of the land base, a large portion of which was previously classified as poor, which now represents 12% of the land base. Good sites have doubled to approximately 19% of the THLB. Using these adjusted site index values the managed stand yield estimates will more closely represent the actual site productivity and volumes will be significantly higher than managed stands estimated with the inventory site index. This is a critical issue with respect to estimating the long-term timber supply.
Kingcome TSA TSR 3 Analysis Report
Kingcome Licensee-Agency Group 25
5.0 TIMBER SUPPLY ANALYSIS METHODS
Timberline’s simulation model CASH6 (Critical Analysis by Simulation of Harvesting) has been used to develop harvest schedules integrating all resource management considerations. The model, which has been used for numerous timber supply reviews, Innovative Forest Practices Agreement, and land use planning analyses, has been accepted for use in timber supply by the MFR. The model uses a geographic approach to land base and inventory in order to adhere as closely as possible to the intent of forest cover constraints on harvesting. Maximum disturbance and minimum forest cover retention requirements are explicitly implemented.
A variable degree of spatial resolution is available including block-to-block adjacency, depending on inventory formulation and resource emphasis area definitions. Forest stands in refuges such as environmentally sensitive and inoperable areas that do not contribute to the periodic harvest are nonetheless included for their contribution to forest structure at both the stand and landscape levels.
In their current implementation, forest cover objectives require a control area over which to operate. The control area for a constraint set should correspond to a realistic element in the landscape. For example, the requirements associated with visual quality objectives are designed to operate on the scene visible from discrete sets of viewpoints. In aspatial mode, pseudo-geography may be employed to translate spatial constraints on harvesting into forest cover and static access constraints. The objective is to identify the “natural” constituency for forest cover constraints. Numerous levels of land aggregation are used to define both geographically separate areas and areas of similar management regime.
The use of forest cover objectives improves forest management modelling by ensuring that non-timber resources are given appropriate consideration. Cover constraints are applied at different levels of spatial resolution depending on the management zone, or resource emphasis area, in question.
Forest cover objectives place maximum and/or minimum limits on the amount of young, mature and/or old growth found in land base aggregates such as combinations of landscape units and ecosystem units or resource emphasis areas. CASH6 defines the following three classes of forest cover constraints for modelling management objectives within each land base aggregate.
1. Disturbance: the maximum area that can be younger than a specified age or shorter than a specified height. This is intended to model cutblock adjacency and green-up requirements.
2. Old-growth Retention: the minimum area that must be older than, or as old as, a specified age. This is intended to model both retention of cover and retention of old growth.
3. Mature Retention: the minimum proportion of area that must be retained over a lower retention age. This is intended to model thermal cover for wildlife or mature biodiversity requirements. Mature and old growth retention forest cover objectives may overlap and area that qualifies for both is counted in both.
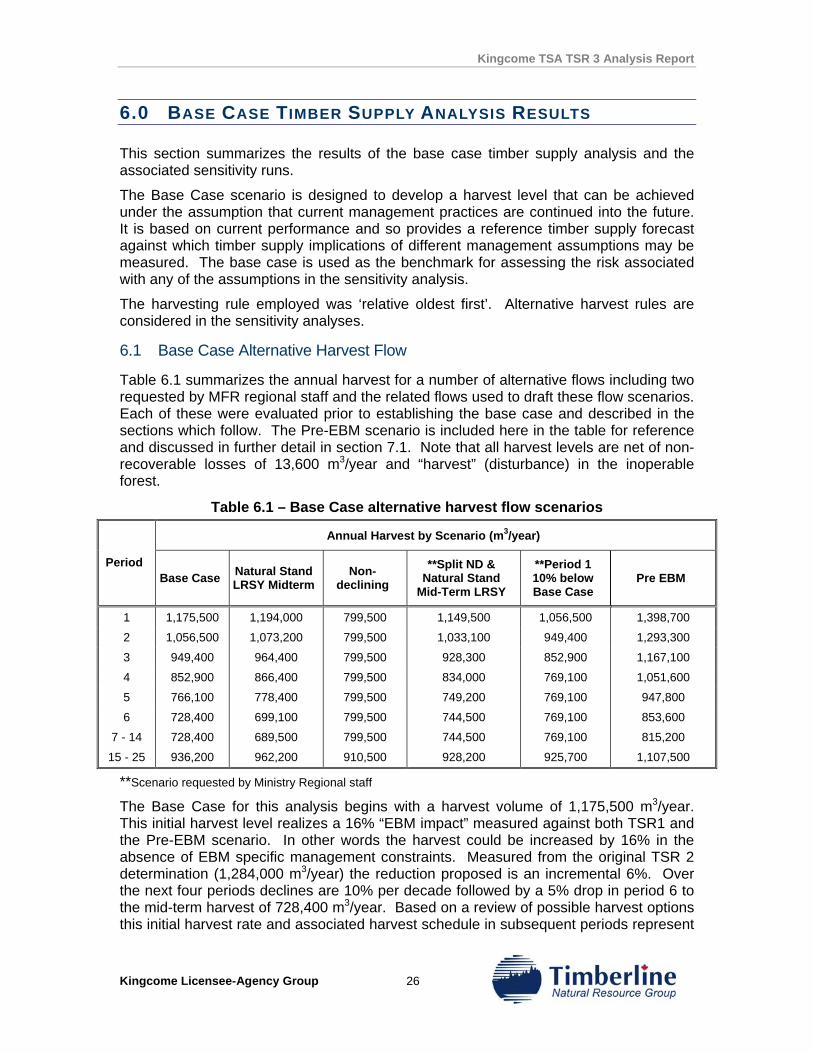
Kingcome TSA TSR 3 Analysis Report
Kingcome Licensee-Agency Group 26
6.0 BASE CASE TIMBER SUPPLY ANALYSIS RESULTS
This section summarizes the results of the base case timber supply analysis and the associated sensitivity runs.
The Base Case scenario is designed to develop a harvest level that can be achieved under the assumption that current management practices are continued into the future. It is based on current performance and so provides a reference timber supply forecast against which timber supply implications of different management assumptions may be measured. The base case is used as the benchmark for assessing the risk associated with any of the assumptions in the sensitivity analysis.
The harvesting rule employed was ‘relative oldest first’. Alternative harvest rules are considered in the sensitivity analyses.
6.1 Base Case Alternative Harvest Flow
Table 6.1 summarizes the annual harvest for a number of alternative flows including two requested by MFR regional staff and the related flows used to draft these flow scenarios. Each of these were evaluated prior to establishing the base case and described in the sections which follow. The Pre-EBM scenario is included here in the table for reference and discussed in further detail in section 7.1. Note that all harvest levels are net of non-recoverable losses of 13,600 m3/year and “harvest” (disturbance) in the inoperable forest.
Table 6.1 – Base Case alternative harvest flow scenarios
Annual Harvest by Scenario (m3/year)
Period Base Case Natural Stand
LRSY Midterm Non-
declining **Split ND &
Natural Stand Mid-Term LRSY
**Period 1 10% below Base Case
Pre EBM
1 1,175,500 1,194,000 799,500 1,149,500 1,056,500 1,398,700
2 1,056,500 1,073,200 799,500 1,033,100 949,400 1,293,300
3 949,400 964,400 799,500 928,300 852,900 1,167,100
4 852,900 866,400 799,500 834,000 769,100 1,051,600
5 766,100 778,400 799,500 749,200 769,100 947,800
6 728,400 699,100 799,500 744,500 769,100 853,600
7 - 14 728,400 689,500 799,500 744,500 769,100 815,200
15 - 25 936,200 962,200 910,500 928,200 925,700 1,107,500
**Scenario requested by Ministry Regional staff
The Base Case for this analysis begins with a harvest volume of 1,175,500 m3/year. This initial harvest level realizes a 16% “EBM impact” measured against both TSR1 and the Pre-EBM scenario. In other words the harvest could be increased by 16% in the absence of EBM specific management constraints. Measured from the original TSR 2 determination (1,284,000 m3/year) the reduction proposed is an incremental 6%. Over the next four periods declines are 10% per decade followed by a 5% drop in period 6 to the mid-term harvest of 728,400 m3/year. Based on a review of possible harvest options this initial harvest rate and associated harvest schedule in subsequent periods represent
Kingcome TSA TSR 3 Analysis Report
Kingcome Licensee-Agency Group 27
a good balance between short, mid and long-term harvest objectives. Other scenarios will demonstrate that constraining the harvest can limit the productive capacity of the land base.
The base case forecast illustrates the incremental impact of incorporating all the elements of EBM since the 1996 determination of 1,399,000 m3/year, representing a 16% impact overall. More conservative approaches carry with them substantial declines in short-term harvest levels while offering little gain in the mid term and result in poorer overall performance in the long term. The most notable distinction between these scenarios is that the Base Case, which represents a small incremental decrease from the current AAC of 1,232,000 m3/year, continues to provide volume to meet harvesting requirements while simultaneously addressing the ecological objectives described in the Order.
The following sections summarize the results of the alternative harvest flow scenarios modeled using the base case assumptions.
6.1.1 Natural Stand Mid-Term LRSY
In this scenario the natural stand long-run sustained yield (LRSY) is used as the lower bound on the mid term harvest level. Setting the first decade harvest at the proposed AAC for the TSA the cut is held as high as possible while not breaking the lower bound at any point. It is possible to increase the decade one harvest level in this scenario, but in order to best evaluate the implications on the mid and long term this approach was not pursued. With this scenario it is necessary to harvest at the natural stand LRSY for seven decades, after which the harvest climbs to sustainable long-term level of 962,200 m3/year. This scenario posts the highest long-term harvest rate because it is the most aggressive scenario over the short term, converting unmanaged stands to managed stands much faster in the first six decades. This in turn allows the full benefit of forest management on timber supply to be realized.
6.1.2 Non-Declining
The non-declining scenario establishes the maximum sustainable even flow harvest rate possible prior to increasing to the long-term level. In the short and mid term this harvest level is 799,500 m3/year. During this time there is no additional volume elsewhere that can be harvested without resulting in a drop below this even flow harvest level at some other point in time. The long-term harvest rate achieved in decade 15 is 912,000 m3/year, 3% lower than the Base Case long-term level. However, in this situation the harvest of unmanaged forest is constrained, and therefore the conversion to managed stands is significantly delayed reducing the full benefit of forest management on growth and yield.
6.1.3 Split Non-Declining (ND) & Natural Stand LRSY
To explore harvest flow dynamics this scenario was conducted to evaluate the impact of increasing the mid-term harvest level. In this case the mid-term lower bound was set at the midpoint between the natural stand LRSY and the non-declining level established in the scenario above. This results in a mid-term harvest level of 744,500 m3/year which is 2.2% higher than the lowest harvest level in the Base Case. This 2.2% improvement is achieved at a cost. The short-term harvest must be decreased in all periods to accommodate this shift. The first period reduction required to accommodate this approach is 2.3%. In addition to this early decline, the long-term harvest level is also
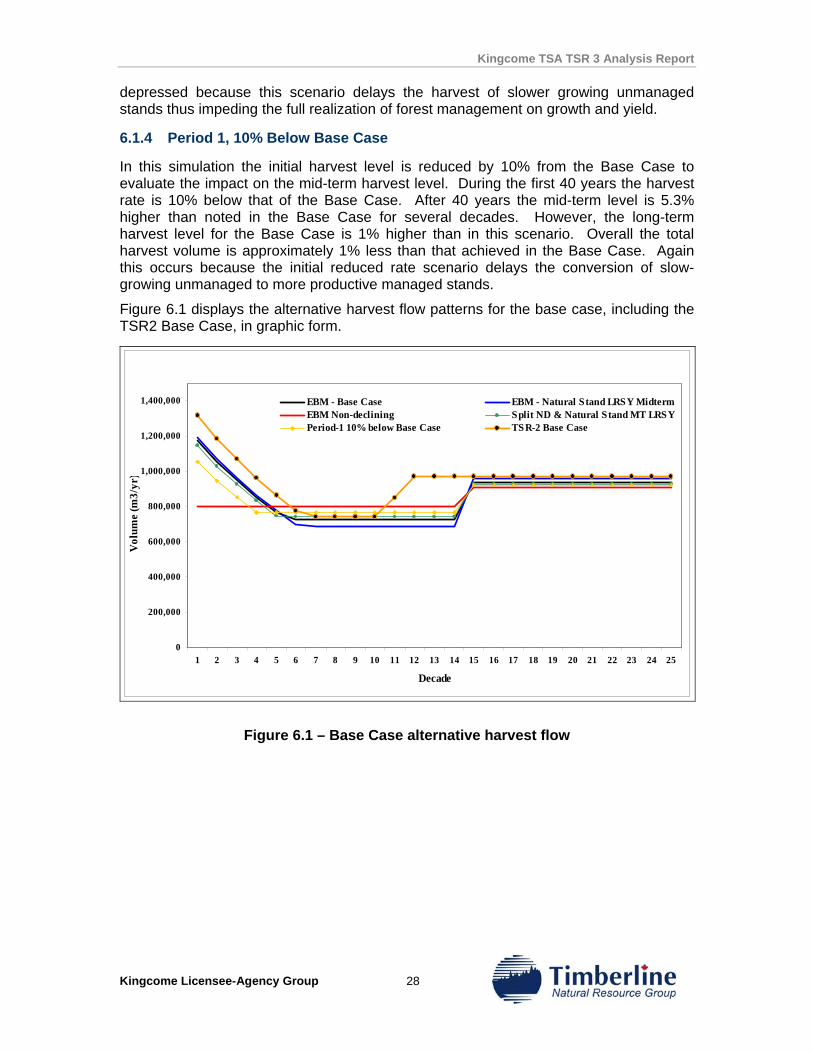
Kingcome TSA TSR 3 Analysis Report
Kingcome Licensee-Agency Group 28
depressed because this scenario delays the harvest of slower growing unmanaged stands thus impeding the full realization of forest management on growth and yield.
6.1.4 Period 1, 10% Below Base Case
In this simulation the initial harvest level is reduced by 10% from the Base Case to evaluate the impact on the mid-term harvest level. During the first 40 years the harvest rate is 10% below that of the Base Case. After 40 years the mid-term level is 5.3% higher than noted in the Base Case for several decades. However, the long-term harvest level for the Base Case is 1% higher than in this scenario. Overall the total harvest volume is approximately 1% less than that achieved in the Base Case. Again this occurs because the initial reduced rate scenario delays the conversion of slow-growing unmanaged to more productive managed stands.
Figure 6.1 displays the alternative harvest flow patterns for the base case, including the TSR2 Base Case, in graphic form.
0
200,000
400,000
600,000
800,000
1,000,000
1,200,000
1,400,000
1 2 3 4 5 6 7 8 9 10 11 12 13 14 15 16 17 18 19 20 21 22 23 24 25
Decade
Vol
ume
(m3/
yr)
EBM - Base Case EBM - Natural Stand LRSY MidtermEBM Non-declining Split ND & Natural Stand MT LRSYPeriod-1 10% below Base Case TSR-2 Base Case
Figure 6.1 – Base Case alternative harvest flow
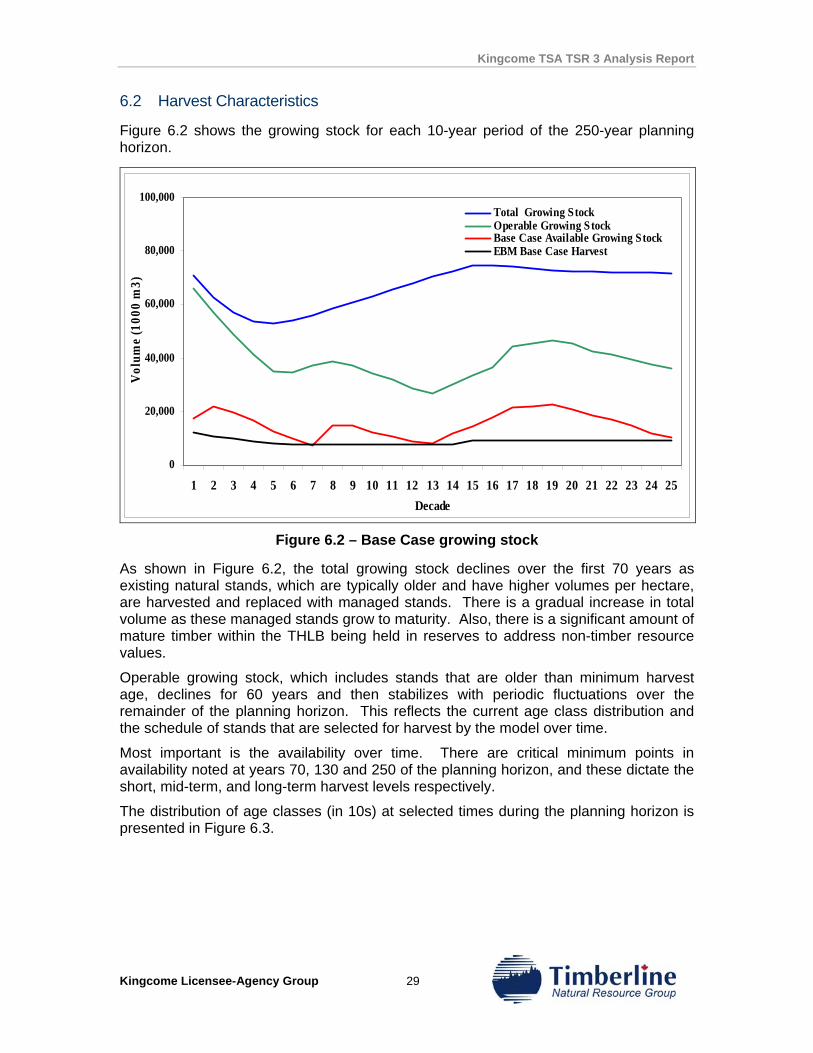
Kingcome TSA TSR 3 Analysis Report
Kingcome Licensee-Agency Group 29
6.2 Harvest Characteristics
Figure 6.2 shows the growing stock for each 10-year period of the 250-year planning horizon.
0
20,000
40,000
60,000
80,000
100,000
1 2 3 4 5 6 7 8 9 10 11 12 13 14 15 16 17 18 19 20 21 22 23 24 25Decade
Vol
ume
(100
0 m
3)
Total Growing StockOperable Growing StockBase Case Available Growing StockEBM Base Case Harvest
Figure 6.2 – Base Case growing stock
As shown in Figure 6.2, the total growing stock declines over the first 70 years as existing natural stands, which are typically older and have higher volumes per hectare, are harvested and replaced with managed stands. There is a gradual increase in total volume as these managed stands grow to maturity. Also, there is a significant amount of mature timber within the THLB being held in reserves to address non-timber resource values.
Operable growing stock, which includes stands that are older than minimum harvest age, declines for 60 years and then stabilizes with periodic fluctuations over the remainder of the planning horizon. This reflects the current age class distribution and the schedule of stands that are selected for harvest by the model over time.
Most important is the availability over time. There are critical minimum points in availability noted at years 70, 130 and 250 of the planning horizon, and these dictate the short, mid-term, and long-term harvest levels respectively.
The distribution of age classes (in 10s) at selected times during the planning horizon is presented in Figure 6.3.
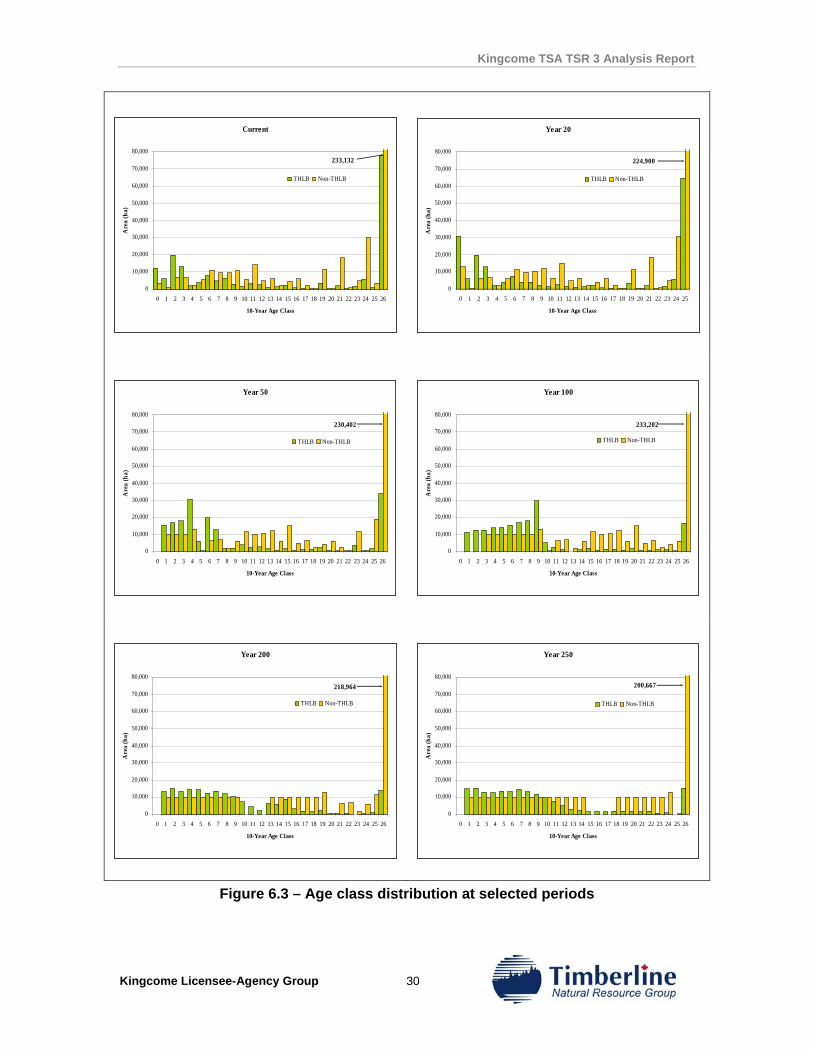
Kingcome TSA TSR 3 Analysis Report
Kingcome Licensee-Agency Group 30
Figure 6.3 – Age class distribution at selected periods
Current
0
10,000
20,000
30,000
40,000
50,000
60,000
70,000
80,000
0 1 2 3 4 5 6 7 8 9 10 11 12 13 14 15 16 17 18 19 20 21 22 23 24 25 26
10-Year Age Class
Are
a (h
a)
THLB Non-THLB
233,132
Year 20
0
10,000
20,000
30,000
40,000
50,000
60,000
70,000
80,000
0 1 2 3 4 5 6 7 8 9 10 11 12 13 14 15 16 17 18 19 20 21 22 23 24 25
10-Year Age Class
Are
a (h
a)
THLB Non-THLB
224,900
Year 50
0
10,000
20,000
30,000
40,000
50,000
60,000
70,000
80,000
0 1 2 3 4 5 6 7 8 9 10 11 12 13 14 15 16 17 18 19 20 21 22 23 24 25 26
10-Year Age Class
Are
a (h
a)
THLB Non-THLB
230,402
Year 100
0
10,000
20,000
30,000
40,000
50,000
60,000
70,000
80,000
0 1 2 3 4 5 6 7 8 9 10 11 12 13 14 15 16 17 18 19 20 21 22 23 24 25 26
10-Year Age Class
Are
a (h
a)
THLB Non-THLB
233,202
Year 200
0
10,000
20,000
30,000
40,000
50,000
60,000
70,000
80,000
0 1 2 3 4 5 6 7 8 9 10 11 12 13 14 15 16 17 18 19 20 21 22 23 24 25 26
10-Year Age Class
Are
a (h
a)
THLB Non-THLB
218,964
Year 250
0
10,000
20,000
30,000
40,000
50,000
60,000
70,000
80,000
0 1 2 3 4 5 6 7 8 9 10 11 12 13 14 15 16 17 18 19 20 21 22 23 24 25 26
10-Year Age Class
Are
a (h
a)
THLB Non-THLB
200,667
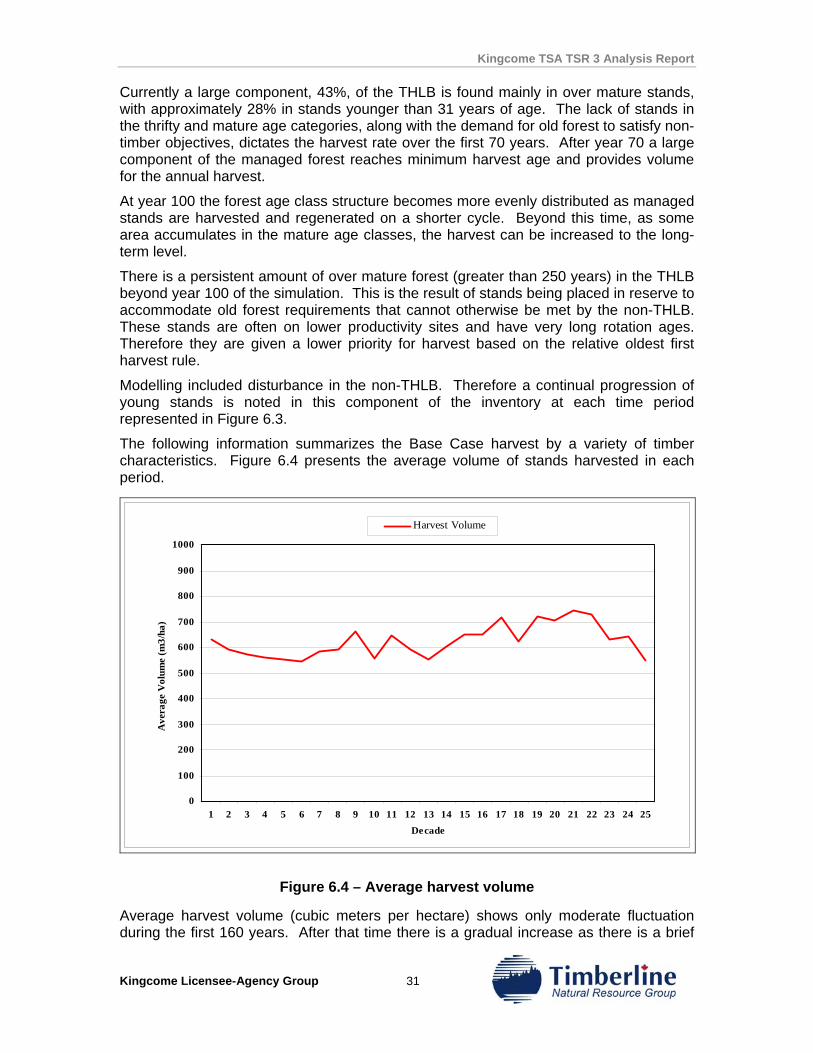
Kingcome TSA TSR 3 Analysis Report
Kingcome Licensee-Agency Group 31
Currently a large component, 43%, of the THLB is found mainly in over mature stands, with approximately 28% in stands younger than 31 years of age. The lack of stands in the thrifty and mature age categories, along with the demand for old forest to satisfy non-timber objectives, dictates the harvest rate over the first 70 years. After year 70 a large component of the managed forest reaches minimum harvest age and provides volume for the annual harvest.
At year 100 the forest age class structure becomes more evenly distributed as managed stands are harvested and regenerated on a shorter cycle. Beyond this time, as some area accumulates in the mature age classes, the harvest can be increased to the long-term level.
There is a persistent amount of over mature forest (greater than 250 years) in the THLB beyond year 100 of the simulation. This is the result of stands being placed in reserve to accommodate old forest requirements that cannot otherwise be met by the non-THLB. These stands are often on lower productivity sites and have very long rotation ages. Therefore they are given a lower priority for harvest based on the relative oldest first harvest rule.
Modelling included disturbance in the non-THLB. Therefore a continual progression of young stands is noted in this component of the inventory at each time period represented in Figure 6.3.
The following information summarizes the Base Case harvest by a variety of timber characteristics. Figure 6.4 presents the average volume of stands harvested in each period.
0
100
200
300
400
500
600
700
800
900
1000
1 2 3 4 5 6 7 8 9 10 11 12 13 14 15 16 17 18 19 20 21 22 23 24 25Decade
Ave
rage
Vol
ume
(m3/
ha)
Harvest Volume
Figure 6.4 – Average harvest volume
Average harvest volume (cubic meters per hectare) shows only moderate fluctuation during the first 160 years. After that time there is a gradual increase as there is a brief
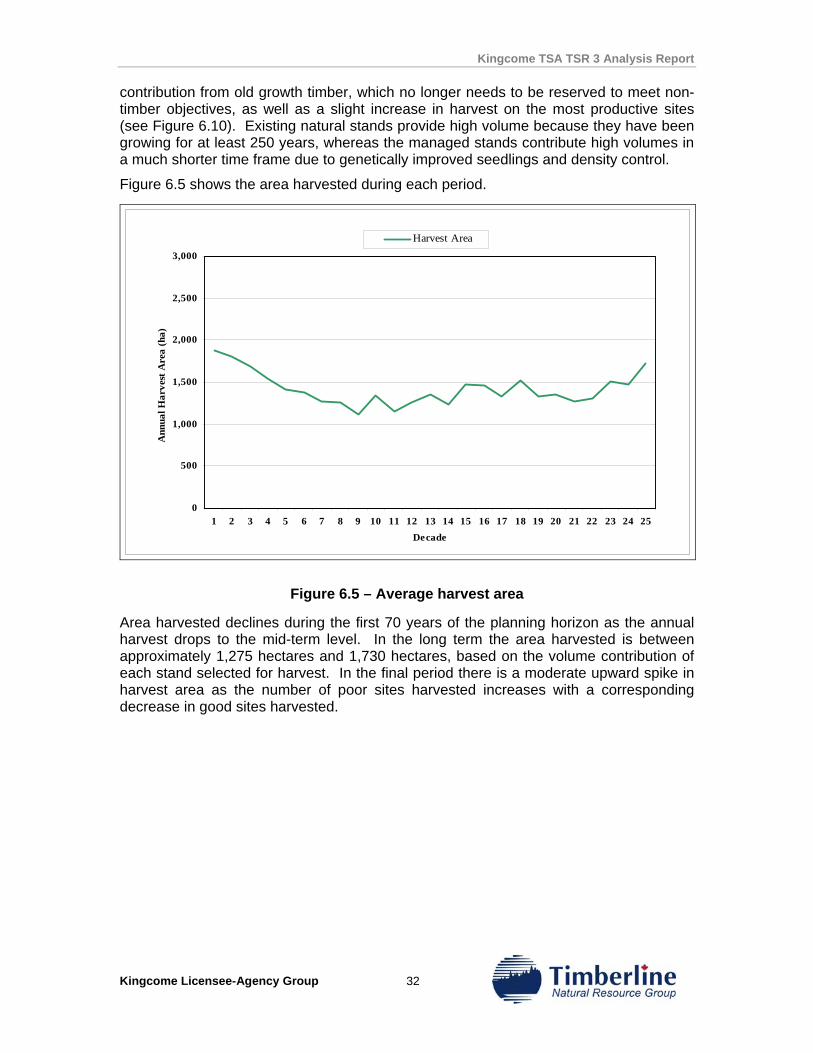
Kingcome TSA TSR 3 Analysis Report
Kingcome Licensee-Agency Group 32
contribution from old growth timber, which no longer needs to be reserved to meet non-timber objectives, as well as a slight increase in harvest on the most productive sites (see Figure 6.10). Existing natural stands provide high volume because they have been growing for at least 250 years, whereas the managed stands contribute high volumes in a much shorter time frame due to genetically improved seedlings and density control.
Figure 6.5 shows the area harvested during each period.
0
500
1,000
1,500
2,000
2,500
3,000
1 2 3 4 5 6 7 8 9 10 11 12 13 14 15 16 17 18 19 20 21 22 23 24 25Decade
Ann
ual H
arve
st A
rea
(ha)
Harvest Area
Figure 6.5 – Average harvest area
Area harvested declines during the first 70 years of the planning horizon as the annual harvest drops to the mid-term level. In the long term the area harvested is between approximately 1,275 hectares and 1,730 hectares, based on the volume contribution of each stand selected for harvest. In the final period there is a moderate upward spike in harvest area as the number of poor sites harvested increases with a corresponding decrease in good sites harvested.
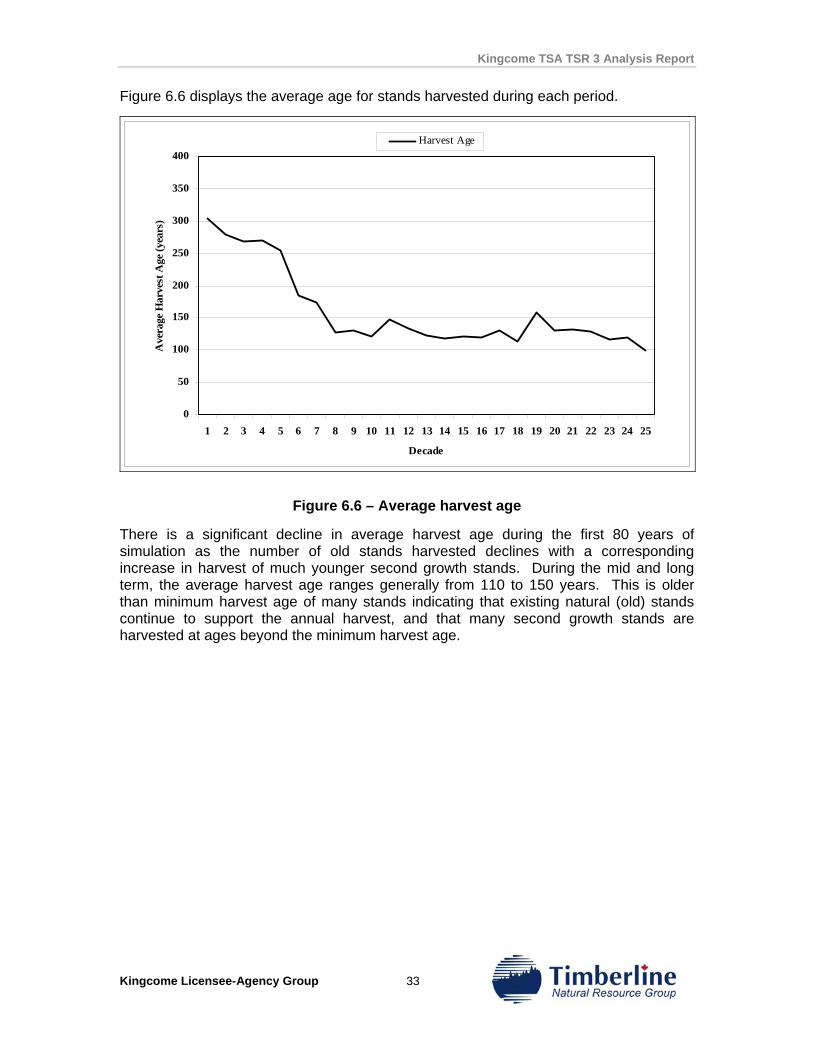
Kingcome TSA TSR 3 Analysis Report
Kingcome Licensee-Agency Group 33
Figure 6.6 displays the average age for stands harvested during each period.
0
50
100
150
200
250
300
350
400
1 2 3 4 5 6 7 8 9 10 11 12 13 14 15 16 17 18 19 20 21 22 23 24 25
Decade
Ave
rage
Har
vest
Age
(yea
rs)
Harvest Age
Figure 6.6 – Average harvest age
There is a significant decline in average harvest age during the first 80 years of simulation as the number of old stands harvested declines with a corresponding increase in harvest of much younger second growth stands. During the mid and long term, the average harvest age ranges generally from 110 to 150 years. This is older than minimum harvest age of many stands indicating that existing natural (old) stands continue to support the annual harvest, and that many second growth stands are harvested at ages beyond the minimum harvest age.
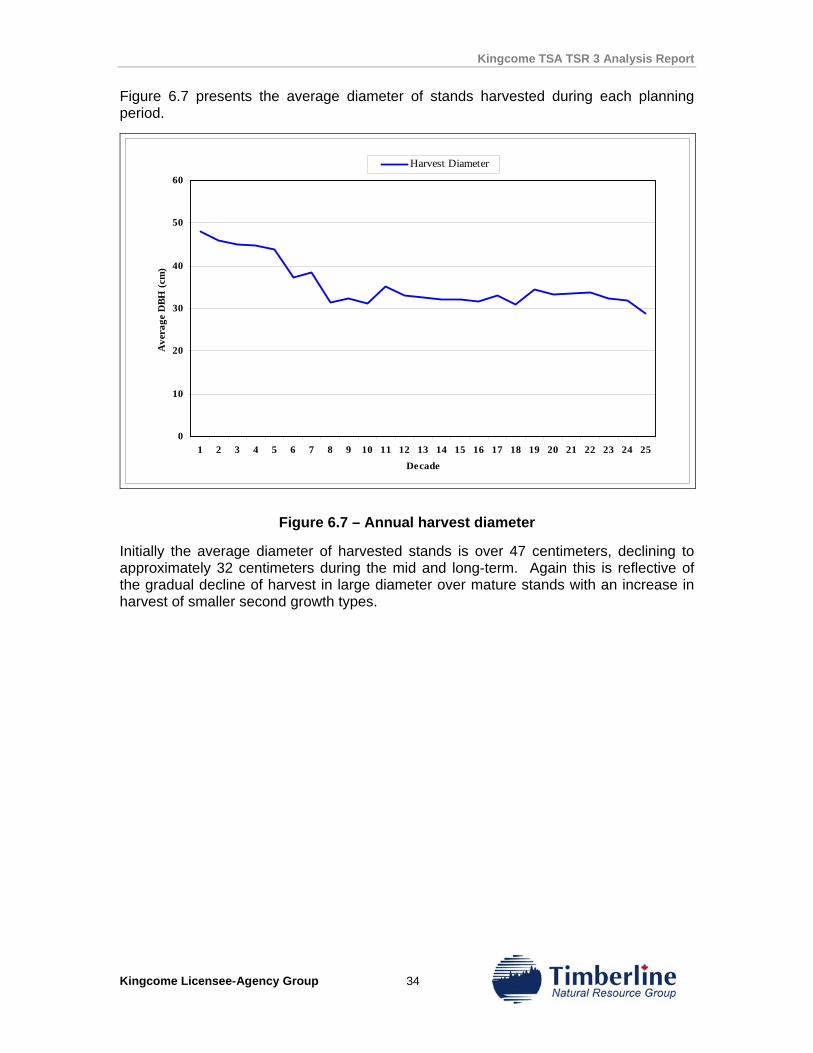
Kingcome TSA TSR 3 Analysis Report
Kingcome Licensee-Agency Group 34
Figure 6.7 presents the average diameter of stands harvested during each planning period.
0
10
20
30
40
50
60
1 2 3 4 5 6 7 8 9 10 11 12 13 14 15 16 17 18 19 20 21 22 23 24 25Decade
Ave
rage
DBH
(cm
)Harvest Diameter
Figure 6.7 – Annual harvest diameter
Initially the average diameter of harvested stands is over 47 centimeters, declining to approximately 32 centimeters during the mid and long-term. Again this is reflective of the gradual decline of harvest in large diameter over mature stands with an increase in harvest of smaller second growth types.
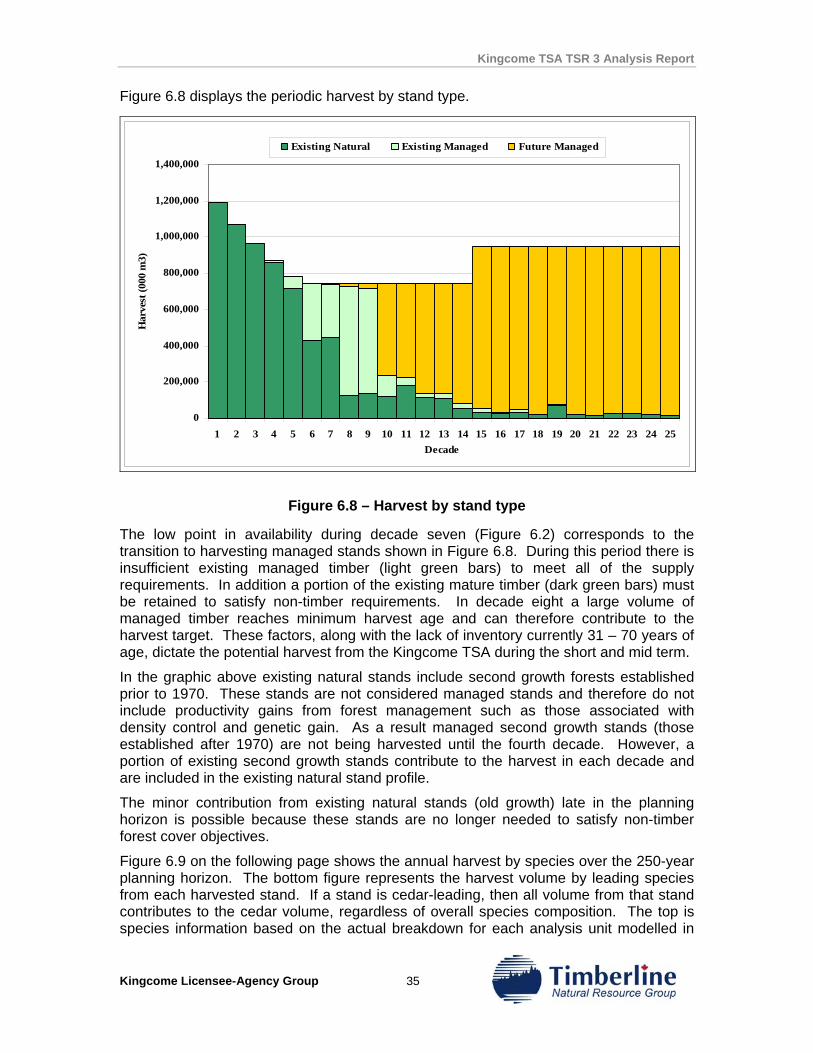
Kingcome TSA TSR 3 Analysis Report
Kingcome Licensee-Agency Group 35
Figure 6.8 displays the periodic harvest by stand type.
0
200,000
400,000
600,000
800,000
1,000,000
1,200,000
1,400,000
1 2 3 4 5 6 7 8 9 10 11 12 13 14 15 16 17 18 19 20 21 22 23 24 25Decade
Har
vest
(000
m3)
Existing Natural Existing Managed Future Managed
Figure 6.8 – Harvest by stand type
The low point in availability during decade seven (Figure 6.2) corresponds to the transition to harvesting managed stands shown in Figure 6.8. During this period there is insufficient existing managed timber (light green bars) to meet all of the supply requirements. In addition a portion of the existing mature timber (dark green bars) must be retained to satisfy non-timber requirements. In decade eight a large volume of managed timber reaches minimum harvest age and can therefore contribute to the harvest target. These factors, along with the lack of inventory currently 31 – 70 years of age, dictate the potential harvest from the Kingcome TSA during the short and mid term.
In the graphic above existing natural stands include second growth forests established prior to 1970. These stands are not considered managed stands and therefore do not include productivity gains from forest management such as those associated with density control and genetic gain. As a result managed second growth stands (those established after 1970) are not being harvested until the fourth decade. However, a portion of existing second growth stands contribute to the harvest in each decade and are included in the existing natural stand profile.
The minor contribution from existing natural stands (old growth) late in the planning horizon is possible because these stands are no longer needed to satisfy non-timber forest cover objectives.
Figure 6.9 on the following page shows the annual harvest by species over the 250-year planning horizon. The bottom figure represents the harvest volume by leading species from each harvested stand. If a stand is cedar-leading, then all volume from that stand contributes to the cedar volume, regardless of overall species composition. The top is species information based on the actual breakdown for each analysis unit modelled in
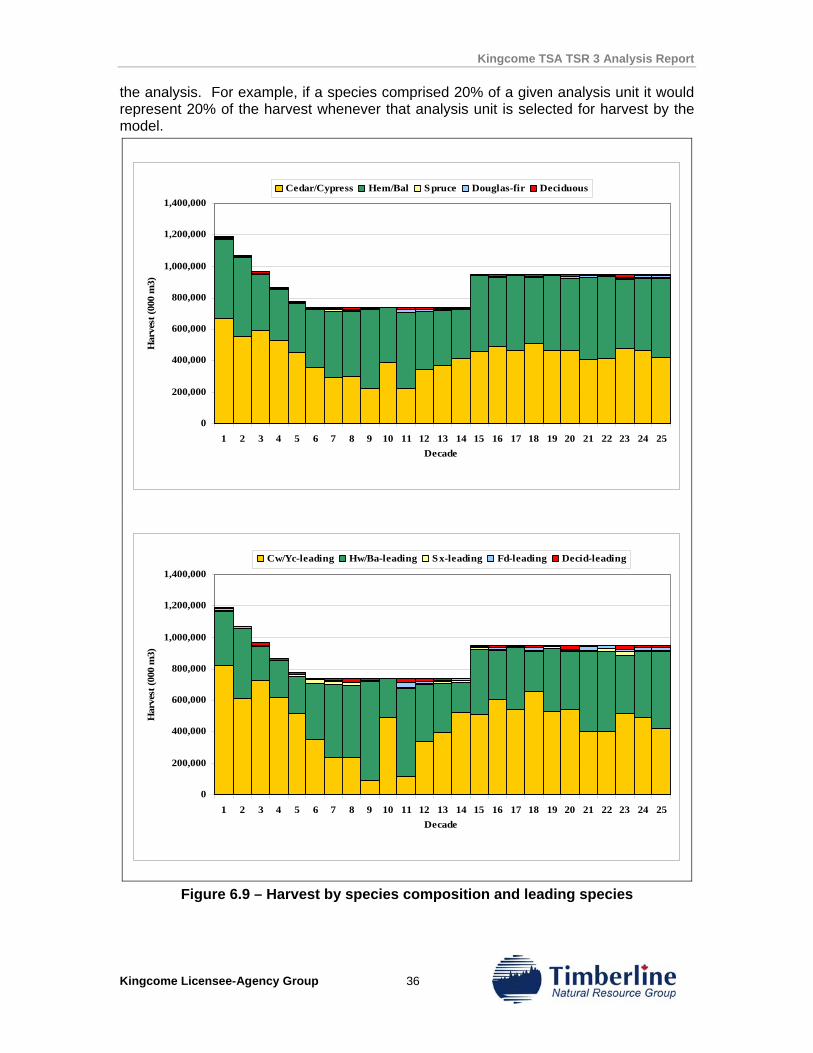
Kingcome TSA TSR 3 Analysis Report
Kingcome Licensee-Agency Group 36
the analysis. For example, if a species comprised 20% of a given analysis unit it would represent 20% of the harvest whenever that analysis unit is selected for harvest by the model.
0
200,000
400,000
600,000
800,000
1,000,000
1,200,000
1,400,000
1 2 3 4 5 6 7 8 9 10 11 12 13 14 15 16 17 18 19 20 21 22 23 24 25Decade
Har
vest
(000
m3)
Cedar/Cypress Hem/Bal Spruce Douglas-fir Deciduous
0
200,000
400,000
600,000
800,000
1,000,000
1,200,000
1,400,000
1 2 3 4 5 6 7 8 9 10 11 12 13 14 15 16 17 18 19 20 21 22 23 24 25Decade
Har
vest
(000
m3)
Cw/Yc-leading Hw/Ba-leading Sx-leading Fd-leading Decid-leading
Figure 6.9 – Harvest by species composition and leading species
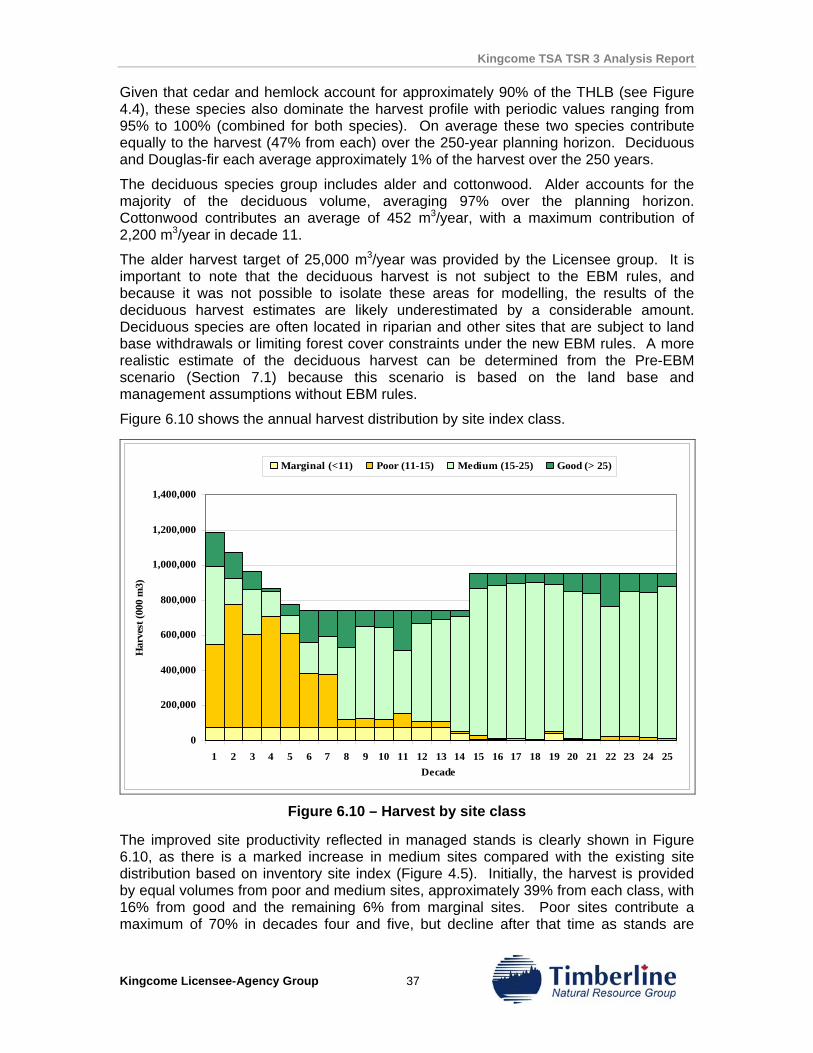
Kingcome TSA TSR 3 Analysis Report
Kingcome Licensee-Agency Group 37
Given that cedar and hemlock account for approximately 90% of the THLB (see Figure 4.4), these species also dominate the harvest profile with periodic values ranging from 95% to 100% (combined for both species). On average these two species contribute equally to the harvest (47% from each) over the 250-year planning horizon. Deciduous and Douglas-fir each average approximately 1% of the harvest over the 250 years.
The deciduous species group includes alder and cottonwood. Alder accounts for the majority of the deciduous volume, averaging 97% over the planning horizon. Cottonwood contributes an average of 452 m3/year, with a maximum contribution of 2,200 m3/year in decade 11.
The alder harvest target of 25,000 m3/year was provided by the Licensee group. It is important to note that the deciduous harvest is not subject to the EBM rules, and because it was not possible to isolate these areas for modelling, the results of the deciduous harvest estimates are likely underestimated by a considerable amount. Deciduous species are often located in riparian and other sites that are subject to land base withdrawals or limiting forest cover constraints under the new EBM rules. A more realistic estimate of the deciduous harvest can be determined from the Pre-EBM scenario (Section 7.1) because this scenario is based on the land base and management assumptions without EBM rules.
Figure 6.10 shows the annual harvest distribution by site index class.
0
200,000
400,000
600,000
800,000
1,000,000
1,200,000
1,400,000
1 2 3 4 5 6 7 8 9 10 11 12 13 14 15 16 17 18 19 20 21 22 23 24 25Decade
Har
vest
(000
m3)
Marginal (<11) Poor (11-15) Medium (15-25) Good (> 25)
Figure 6.10 – Harvest by site class
The improved site productivity reflected in managed stands is clearly shown in Figure 6.10, as there is a marked increase in medium sites compared with the existing site distribution based on inventory site index (Figure 4.5). Initially, the harvest is provided by equal volumes from poor and medium sites, approximately 39% from each class, with 16% from good and the remaining 6% from marginal sites. Poor sites contribute a maximum of 70% in decades four and five, but decline after that time as stands are
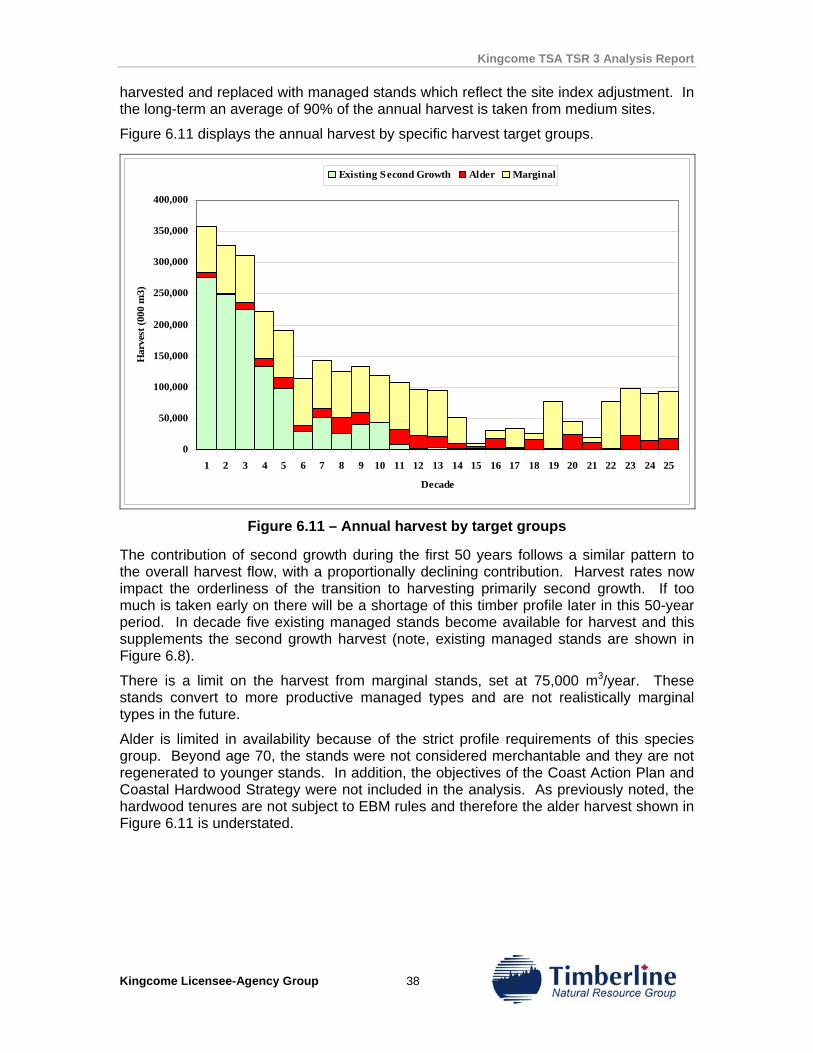
Kingcome TSA TSR 3 Analysis Report
Kingcome Licensee-Agency Group 38
harvested and replaced with managed stands which reflect the site index adjustment. In the long-term an average of 90% of the annual harvest is taken from medium sites.
Figure 6.11 displays the annual harvest by specific harvest target groups.
0
50,000
100,000
150,000
200,000
250,000
300,000
350,000
400,000
1 2 3 4 5 6 7 8 9 10 11 12 13 14 15 16 17 18 19 20 21 22 23 24 25
Decade
Har
vest
(000
m3)
Existing Second Growth Alder Marginal
Figure 6.11 – Annual harvest by target groups
The contribution of second growth during the first 50 years follows a similar pattern to the overall harvest flow, with a proportionally declining contribution. Harvest rates now impact the orderliness of the transition to harvesting primarily second growth. If too much is taken early on there will be a shortage of this timber profile later in this 50-year period. In decade five existing managed stands become available for harvest and this supplements the second growth harvest (note, existing managed stands are shown in Figure 6.8).
There is a limit on the harvest from marginal stands, set at 75,000 m3/year. These stands convert to more productive managed types and are not realistically marginal types in the future.
Alder is limited in availability because of the strict profile requirements of this species group. Beyond age 70, the stands were not considered merchantable and they are not regenerated to younger stands. In addition, the objectives of the Coast Action Plan and Coastal Hardwood Strategy were not included in the analysis. As previously noted, the hardwood tenures are not subject to EBM rules and therefore the alder harvest shown in Figure 6.11 is understated.
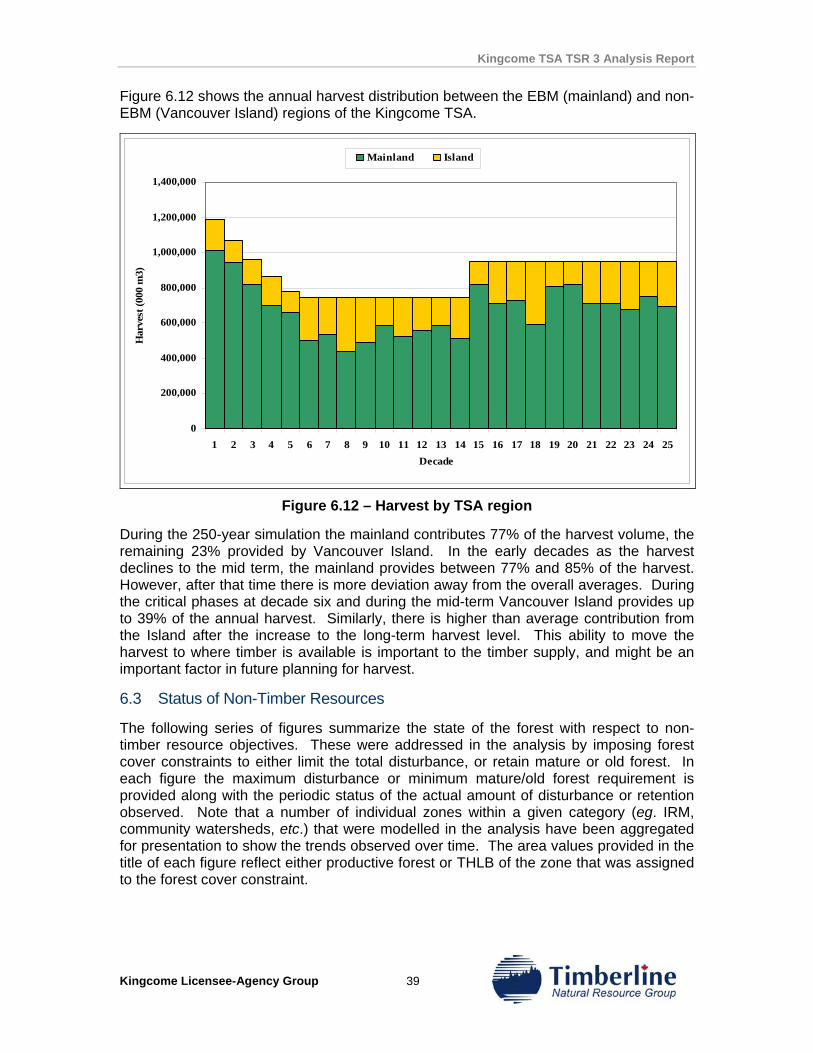
Kingcome TSA TSR 3 Analysis Report
Kingcome Licensee-Agency Group 39
Figure 6.12 shows the annual harvest distribution between the EBM (mainland) and non-EBM (Vancouver Island) regions of the Kingcome TSA.
0
200,000
400,000
600,000
800,000
1,000,000
1,200,000
1,400,000
1 2 3 4 5 6 7 8 9 10 11 12 13 14 15 16 17 18 19 20 21 22 23 24 25Decade
Har
vest
(000
m3)
Mainland Island
Figure 6.12 – Harvest by TSA region
During the 250-year simulation the mainland contributes 77% of the harvest volume, the remaining 23% provided by Vancouver Island. In the early decades as the harvest declines to the mid term, the mainland provides between 77% and 85% of the harvest. However, after that time there is more deviation away from the overall averages. During the critical phases at decade six and during the mid-term Vancouver Island provides up to 39% of the annual harvest. Similarly, there is higher than average contribution from the Island after the increase to the long-term harvest level. This ability to move the harvest to where timber is available is important to the timber supply, and might be an important factor in future planning for harvest.
6.3 Status of Non-Timber Resources
The following series of figures summarize the state of the forest with respect to non-timber resource objectives. These were addressed in the analysis by imposing forest cover constraints to either limit the total disturbance, or retain mature or old forest. In each figure the maximum disturbance or minimum mature/old forest requirement is provided along with the periodic status of the actual amount of disturbance or retention observed. Note that a number of individual zones within a given category (eg. IRM, community watersheds, etc.) that were modelled in the analysis have been aggregated for presentation to show the trends observed over time. The area values provided in the title of each figure reflect either productive forest or THLB of the zone that was assigned to the forest cover constraint.
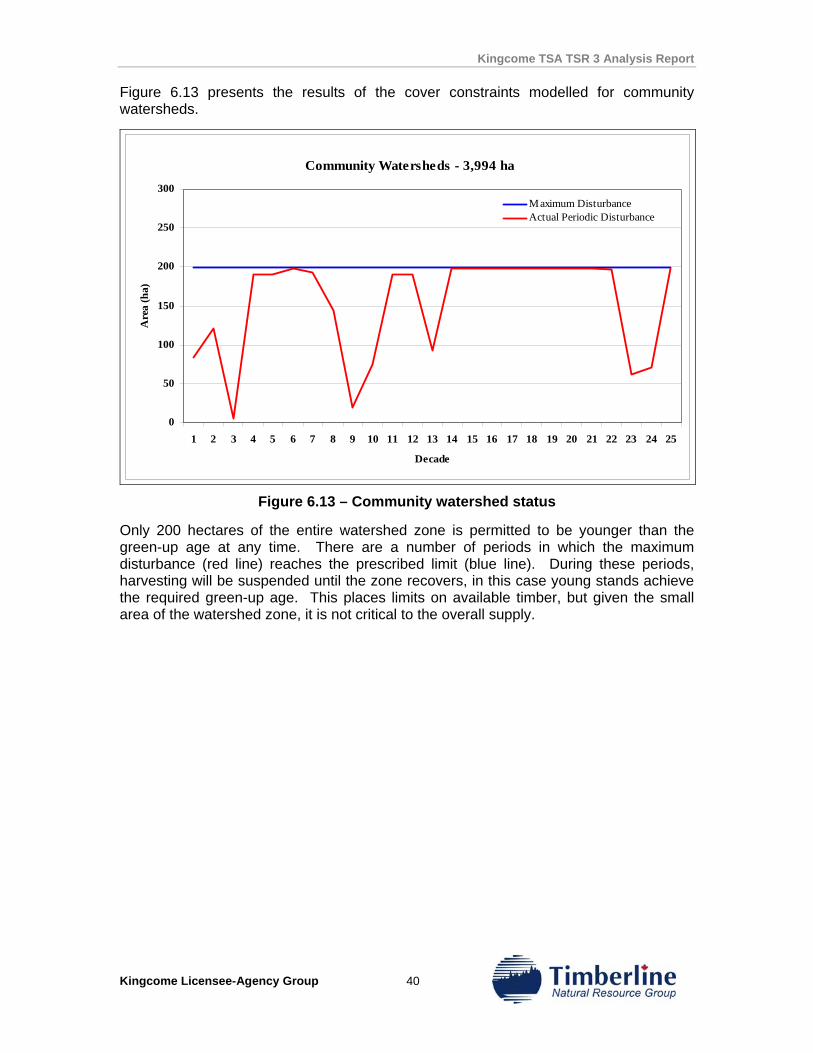
Kingcome TSA TSR 3 Analysis Report
Kingcome Licensee-Agency Group 40
Figure 6.13 presents the results of the cover constraints modelled for community watersheds.
Community Watersheds - 3,994 ha
0
50
100
150
200
250
300
1 2 3 4 5 6 7 8 9 10 11 12 13 14 15 16 17 18 19 20 21 22 23 24 25
Decade
Are
a (h
a)
Maximum DisturbanceActual Periodic Disturbance
Figure 6.13 – Community watershed status
Only 200 hectares of the entire watershed zone is permitted to be younger than the green-up age at any time. There are a number of periods in which the maximum disturbance (red line) reaches the prescribed limit (blue line). During these periods, harvesting will be suspended until the zone recovers, in this case young stands achieve the required green-up age. This places limits on available timber, but given the small area of the watershed zone, it is not critical to the overall supply.
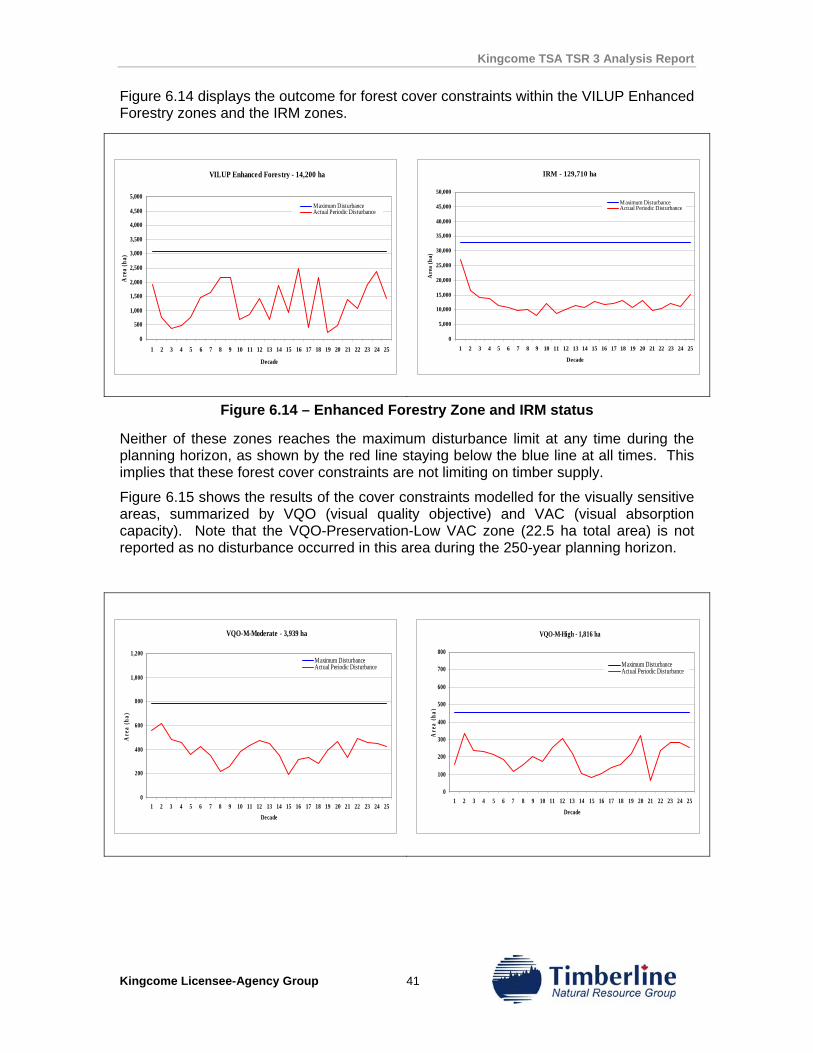
Kingcome TSA TSR 3 Analysis Report
Kingcome Licensee-Agency Group 41
Figure 6.14 displays the outcome for forest cover constraints within the VILUP Enhanced Forestry zones and the IRM zones.
Figure 6.14 – Enhanced Forestry Zone and IRM status
Neither of these zones reaches the maximum disturbance limit at any time during the planning horizon, as shown by the red line staying below the blue line at all times. This implies that these forest cover constraints are not limiting on timber supply.
Figure 6.15 shows the results of the cover constraints modelled for the visually sensitive areas, summarized by VQO (visual quality objective) and VAC (visual absorption capacity). Note that the VQO-Preservation-Low VAC zone (22.5 ha total area) is not reported as no disturbance occurred in this area during the 250-year planning horizon.
VILUP Enhanced Forestry - 14,200 ha
0
500
1,000
1,500
2,000
2,500
3,000
3,500
4,000
4,500
5,000
1 2 3 4 5 6 7 8 9 10 11 12 13 14 15 16 17 18 19 20 21 22 23 24 25
Decade
Are
a (h
a)
Maximum DisturbanceActual Periodic Disturbance
IRM - 129,710 ha
0
5,000
10,000
15,000
20,000
25,000
30,000
35,000
40,000
45,000
50,000
1 2 3 4 5 6 7 8 9 10 11 12 13 14 15 16 17 18 19 20 21 22 23 24 25
Decade
Are
a (h
a)
Maximum DisturbanceActual Periodic Disturbance
VQO-M-Moderate - 3,939 ha
0
200
400
600
800
1,000
1,200
1 2 3 4 5 6 7 8 9 10 11 12 13 14 15 16 17 18 19 20 21 22 23 24 25
Decade
Are
a (h
a)
Maximum DisturbanceActual Periodic Disturbance
VQO-M-High - 1,816 ha
0
100
200
300
400
500
600
700
800
1 2 3 4 5 6 7 8 9 10 11 12 13 14 15 16 17 18 19 20 21 22 23 24 25Decade
Are
a (h
a)
Maximum DisturbanceActual Periodic Disturbance
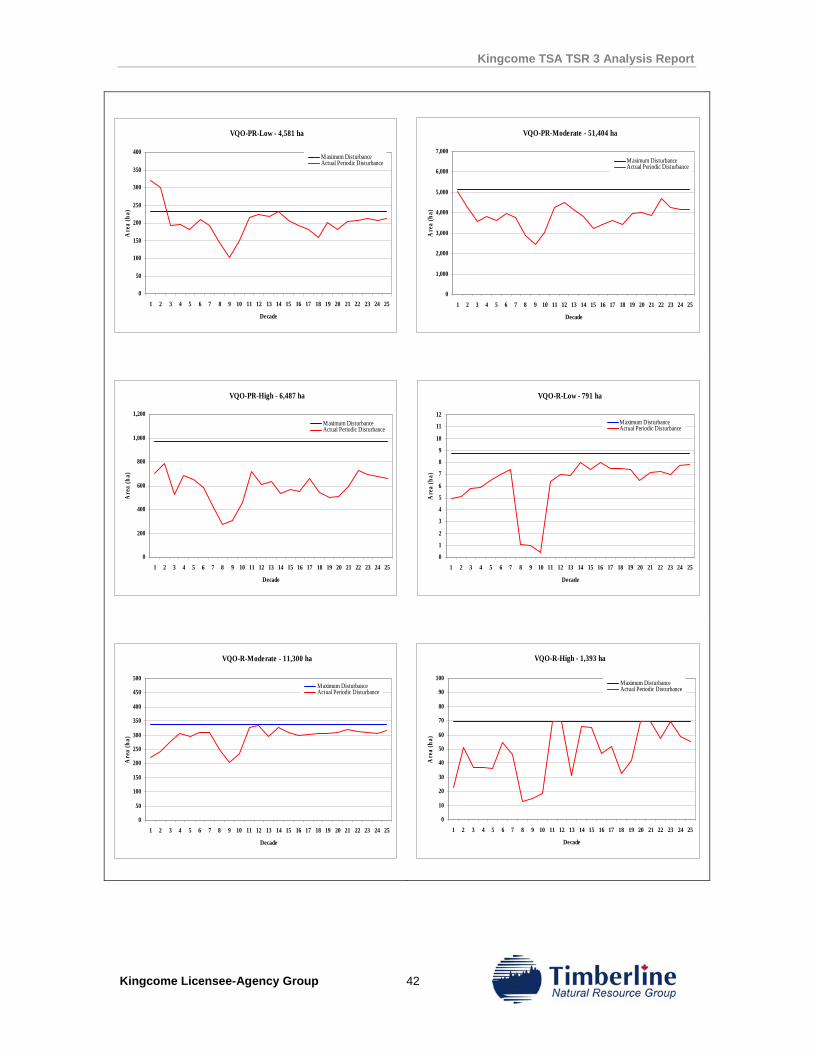
Kingcome TSA TSR 3 Analysis Report
Kingcome Licensee-Agency Group 42
VQO-PR-Low - 4,581 ha
0
50
100
150
200
250
300
350
400
1 2 3 4 5 6 7 8 9 10 11 12 13 14 15 16 17 18 19 20 21 22 23 24 25
Decade
Are
a (h
a)
Maximum DisturbanceActual Periodic Disturbance
VQO-PR-Moderate - 51,404 ha
0
1,000
2,000
3,000
4,000
5,000
6,000
7,000
1 2 3 4 5 6 7 8 9 10 11 12 13 14 15 16 17 18 19 20 21 22 23 24 25
Decade
Are
a (h
a)
Maximum DisturbanceActual Periodic Disturbance
VQO-PR-High - 6,487 ha
0
200
400
600
800
1,000
1,200
1 2 3 4 5 6 7 8 9 10 11 12 13 14 15 16 17 18 19 20 21 22 23 24 25
Decade
Are
a (h
a)
Maximum DisturbanceActual Periodic Disturbance
VQO-R-Low - 791 ha
0
1
2
3
4
5
6
7
8
9
10
11
12
1 2 3 4 5 6 7 8 9 10 11 12 13 14 15 16 17 18 19 20 21 22 23 24 25
Decade
Are
a (h
a)Maximum DisturbanceActual Periodic Disturbance
VQO-R-Moderate - 11,300 ha
0
50
100
150
200
250
300
350
400
450
500
1 2 3 4 5 6 7 8 9 10 11 12 13 14 15 16 17 18 19 20 21 22 23 24 25
Decade
Are
a (h
a)
Maximum DisturbanceActual Periodic Disturbance
VQO-R-High - 1,393 ha
0
10
20
30
40
50
60
70
80
90
100
1 2 3 4 5 6 7 8 9 10 11 12 13 14 15 16 17 18 19 20 21 22 23 24 25
Decade
Are
a (h
a)
Maximum DisturbanceActual Periodic Disturbance
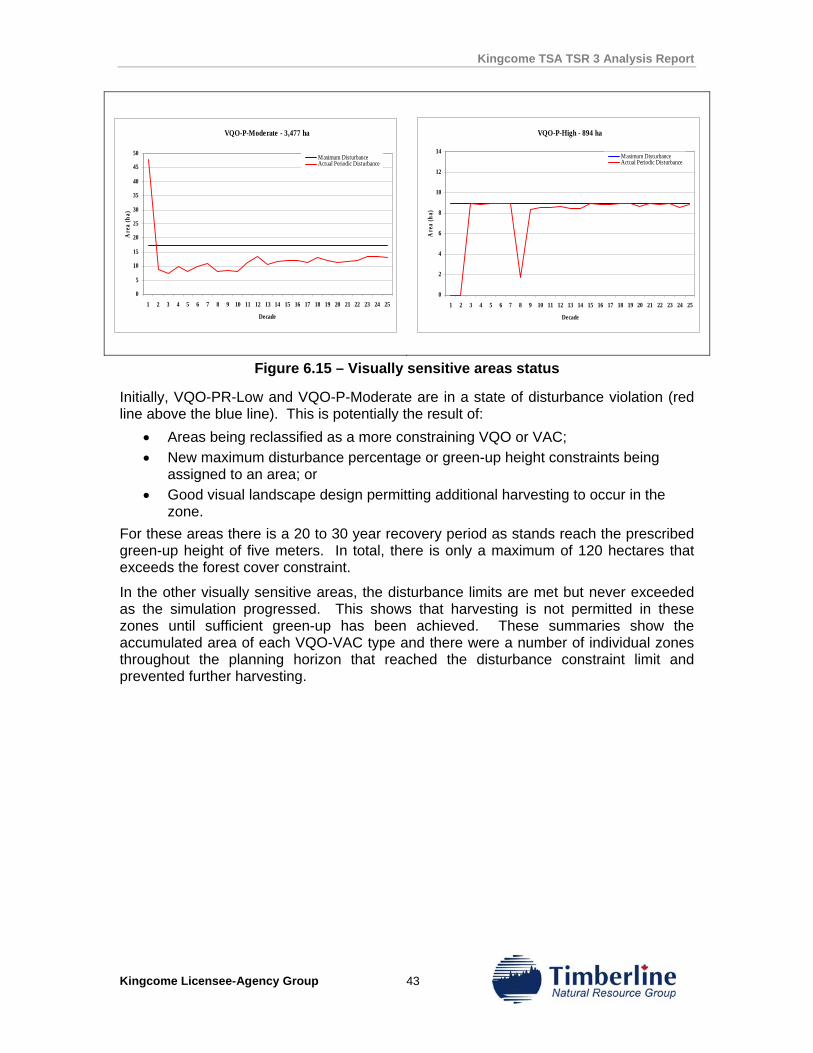
Kingcome TSA TSR 3 Analysis Report
Kingcome Licensee-Agency Group 43
Figure 6.15 – Visually sensitive areas status
Initially, VQO-PR-Low and VQO-P-Moderate are in a state of disturbance violation (red line above the blue line). This is potentially the result of:
• Areas being reclassified as a more constraining VQO or VAC; • New maximum disturbance percentage or green-up height constraints being
assigned to an area; or • Good visual landscape design permitting additional harvesting to occur in the
zone. For these areas there is a 20 to 30 year recovery period as stands reach the prescribed green-up height of five meters. In total, there is only a maximum of 120 hectares that exceeds the forest cover constraint.
In the other visually sensitive areas, the disturbance limits are met but never exceeded as the simulation progressed. This shows that harvesting is not permitted in these zones until sufficient green-up has been achieved. These summaries show the accumulated area of each VQO-VAC type and there were a number of individual zones throughout the planning horizon that reached the disturbance constraint limit and prevented further harvesting.
VQO-P-Moderate - 3,477 ha
0
5
10
15
20
25
30
35
40
45
50
1 2 3 4 5 6 7 8 9 10 11 12 13 14 15 16 17 18 19 20 21 22 23 24 25
Decade
Are
a (h
a)
Maximum DisturbanceActual Periodic Disturbance
VQO-P-High - 894 ha
0
2
4
6
8
10
12
14
1 2 3 4 5 6 7 8 9 10 11 12 13 14 15 16 17 18 19 20 21 22 23 24 25
Decade
Are
a (h
a)
Maximum DisturbanceActual Periodic Disturbance
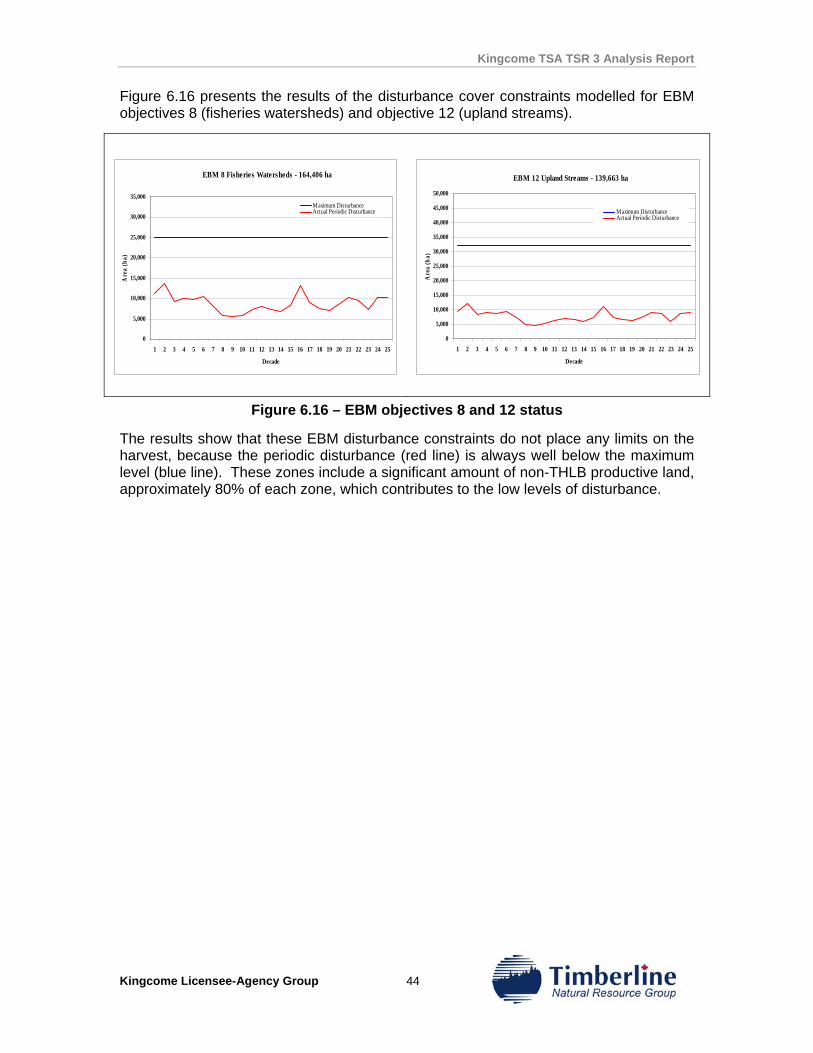
Kingcome TSA TSR 3 Analysis Report
Kingcome Licensee-Agency Group 44
Figure 6.16 presents the results of the disturbance cover constraints modelled for EBM objectives 8 (fisheries watersheds) and objective 12 (upland streams).
Figure 6.16 – EBM objectives 8 and 12 status
The results show that these EBM disturbance constraints do not place any limits on the harvest, because the periodic disturbance (red line) is always well below the maximum level (blue line). These zones include a significant amount of non-THLB productive land, approximately 80% of each zone, which contributes to the low levels of disturbance.
EBM 8 Fisheries Watersheds - 164,406 ha
0
5,000
10,000
15,000
20,000
25,000
30,000
35,000
1 2 3 4 5 6 7 8 9 10 11 12 13 14 15 16 17 18 19 20 21 22 23 24 25
Decade
Are
a (h
a)
Maximum DisturbanceActual Periodic Disturbance
EBM 12 Upland Streams - 139,663 ha
0
5,000
10,000
15,000
20,000
25,000
30,000
35,000
40,000
45,000
50,000
1 2 3 4 5 6 7 8 9 10 11 12 13 14 15 16 17 18 19 20 21 22 23 24 25
Decade
Are
a (h
a)
Maximum DisturbanceActual Periodic Disturbance
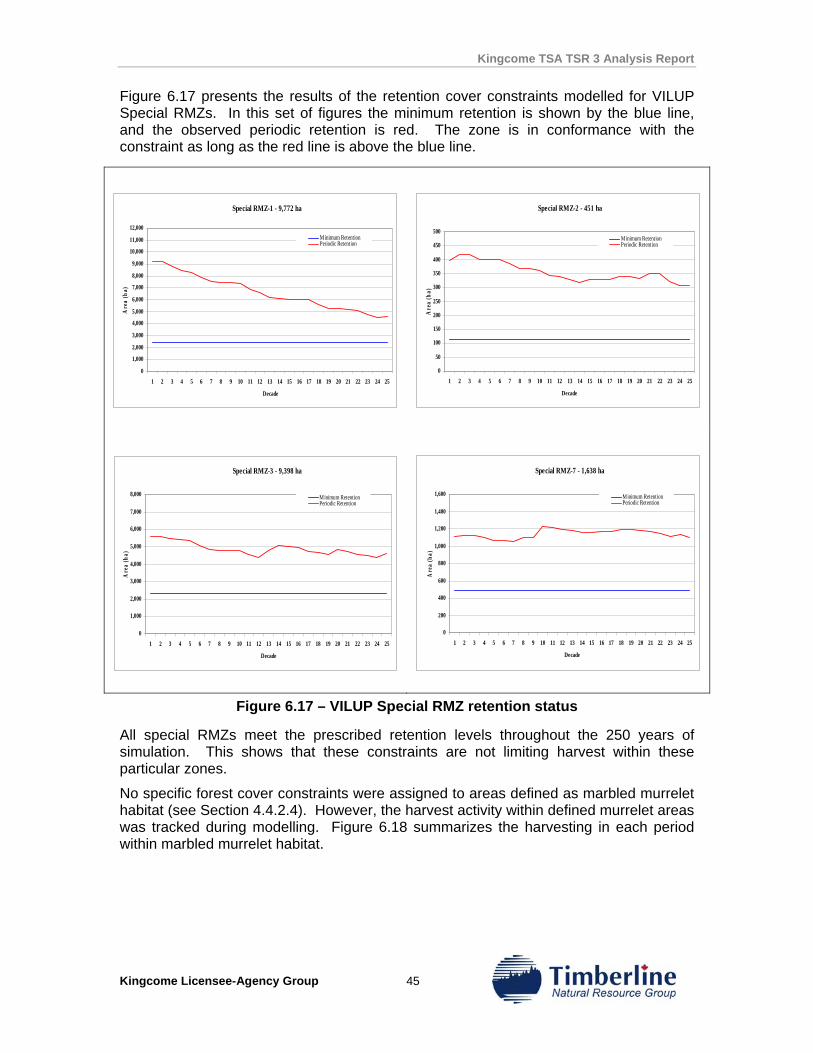
Kingcome TSA TSR 3 Analysis Report
Kingcome Licensee-Agency Group 45
Figure 6.17 presents the results of the retention cover constraints modelled for VILUP Special RMZs. In this set of figures the minimum retention is shown by the blue line, and the observed periodic retention is red. The zone is in conformance with the constraint as long as the red line is above the blue line.
Figure 6.17 – VILUP Special RMZ retention status
All special RMZs meet the prescribed retention levels throughout the 250 years of simulation. This shows that these constraints are not limiting harvest within these particular zones.
No specific forest cover constraints were assigned to areas defined as marbled murrelet habitat (see Section 4.4.2.4). However, the harvest activity within defined murrelet areas was tracked during modelling. Figure 6.18 summarizes the harvesting in each period within marbled murrelet habitat.
Special RMZ-1 - 9,772 ha
0
1,000
2,000
3,000
4,000
5,000
6,000
7,000
8,000
9,000
10,000
11,000
12,000
1 2 3 4 5 6 7 8 9 10 11 12 13 14 15 16 17 18 19 20 21 22 23 24 25
Decade
Are
a (h
a)
Minimum RetentionPeriodic Retention
Special RMZ-2 - 451 ha
0
50
100
150
200
250
300
350
400
450
500
1 2 3 4 5 6 7 8 9 10 11 12 13 14 15 16 17 18 19 20 21 22 23 24 25
Decade
Are
a (h
a)
Minimum RetentionPeriodic Retention
Special RMZ-3 - 9,398 ha
0
1,000
2,000
3,000
4,000
5,000
6,000
7,000
8,000
1 2 3 4 5 6 7 8 9 10 11 12 13 14 15 16 17 18 19 20 21 22 23 24 25
Decade
Are
a (h
a)
Minimum RetentionPeriodic Retention
Special RMZ-7 - 1,638 ha
0
200
400
600
800
1,000
1,200
1,400
1,600
1 2 3 4 5 6 7 8 9 10 11 12 13 14 15 16 17 18 19 20 21 22 23 24 25
Decade
Are
a (h
a)
Minimum RetentionPeriodic Retention
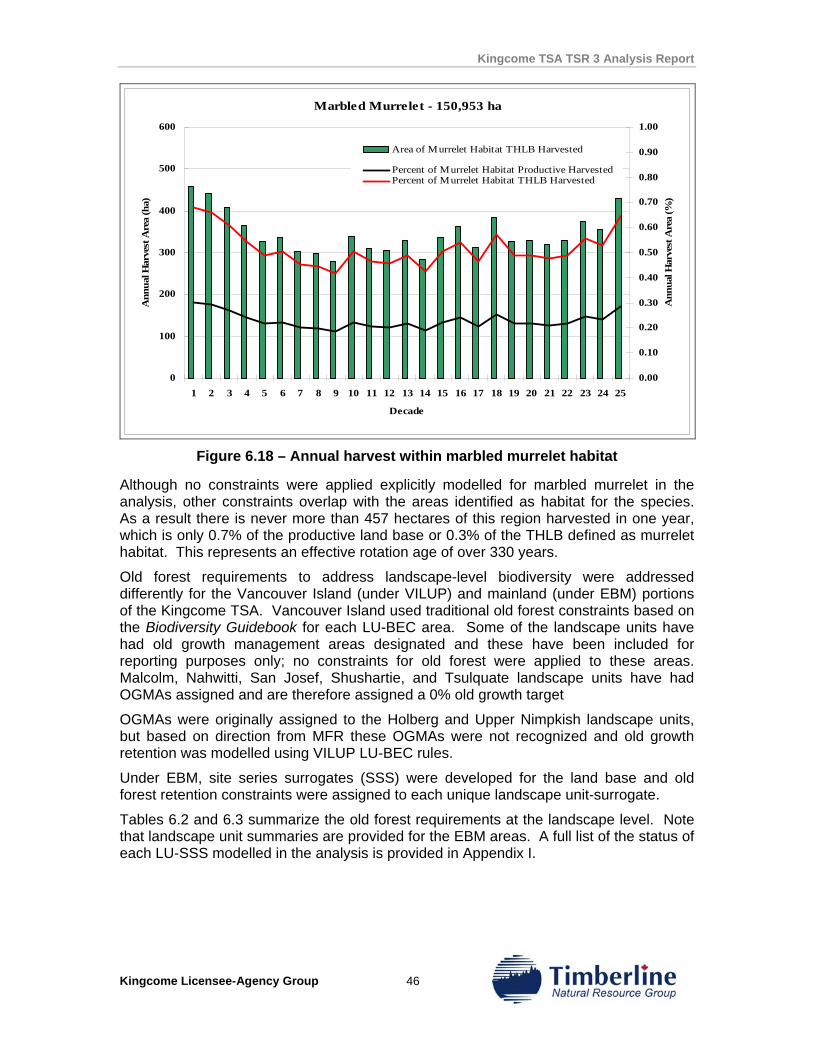
Kingcome TSA TSR 3 Analysis Report
Kingcome Licensee-Agency Group 46
Marbled Murrelet - 150,953 ha
0
100
200
300
400
500
600
1 2 3 4 5 6 7 8 9 10 11 12 13 14 15 16 17 18 19 20 21 22 23 24 25
Decade
Ann
ual H
arve
st A
rea
(ha)
0.00
0.10
0.20
0.30
0.40
0.50
0.60
0.70
0.80
0.90
1.00
Ann
ual H
arve
st A
rea
(%)
Area of Murrelet Habitat THLB Harvested
Percent of Murrelet Habitat Productive HarvestedPercent of Murrelet Habitat THLB Harvested
Figure 6.18 – Annual harvest within marbled murrelet habitat
Although no constraints were applied explicitly modelled for marbled murrelet in the analysis, other constraints overlap with the areas identified as habitat for the species. As a result there is never more than 457 hectares of this region harvested in one year, which is only 0.7% of the productive land base or 0.3% of the THLB defined as murrelet habitat. This represents an effective rotation age of over 330 years.
Old forest requirements to address landscape-level biodiversity were addressed differently for the Vancouver Island (under VILUP) and mainland (under EBM) portions of the Kingcome TSA. Vancouver Island used traditional old forest constraints based on the Biodiversity Guidebook for each LU-BEC area. Some of the landscape units have had old growth management areas designated and these have been included for reporting purposes only; no constraints for old forest were applied to these areas. Malcolm, Nahwitti, San Josef, Shushartie, and Tsulquate landscape units have had OGMAs assigned and are therefore assigned a 0% old growth target
OGMAs were originally assigned to the Holberg and Upper Nimpkish landscape units, but based on direction from MFR these OGMAs were not recognized and old growth retention was modelled using VILUP LU-BEC rules.
Under EBM, site series surrogates (SSS) were developed for the land base and old forest retention constraints were assigned to each unique landscape unit-surrogate.
Tables 6.2 and 6.3 summarize the old forest requirements at the landscape level. Note that landscape unit summaries are provided for the EBM areas. A full list of the status of each LU-SSS modelled in the analysis is provided in Appendix I.
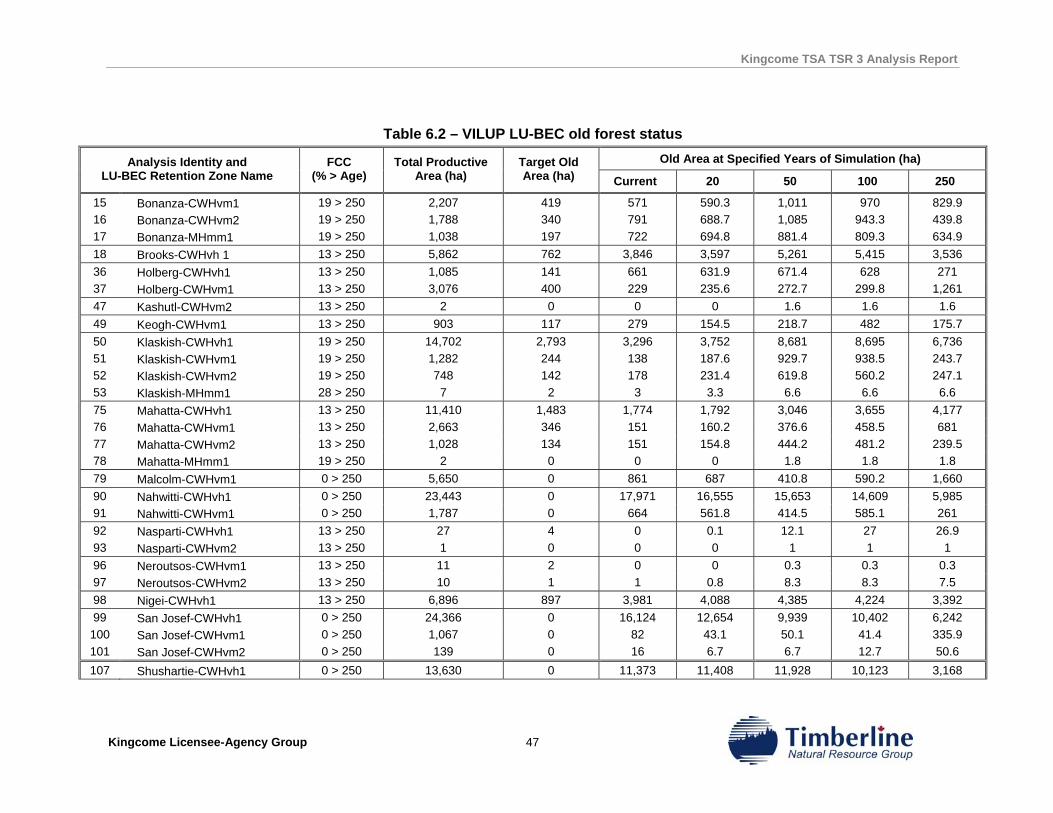
Kingcome TSA TSR 3 Analysis Report
Kingcome Licensee-Agency Group 47
Table 6.2 – VILUP LU-BEC old forest status Old Area at Specified Years of Simulation (ha) Analysis Identity and
LU-BEC Retention Zone Name FCC
(% > Age) Total Productive
Area (ha) Target Old Area (ha) Current 20 50 100 250
15 Bonanza-CWHvm1 19 > 250 2,207 419 571 590.3 1,011 970 829.9 16 Bonanza-CWHvm2 19 > 250 1,788 340 791 688.7 1,085 943.3 439.8 17 Bonanza-MHmm1 19 > 250 1,038 197 722 694.8 881.4 809.3 634.9 18 Brooks-CWHvh 1 13 > 250 5,862 762 3,846 3,597 5,261 5,415 3,536 36 Holberg-CWHvh1 13 > 250 1,085 141 661 631.9 671.4 628 271 37 Holberg-CWHvm1 13 > 250 3,076 400 229 235.6 272.7 299.8 1,261 47 Kashutl-CWHvm2 13 > 250 2 0 0 0 1.6 1.6 1.6 49 Keogh-CWHvm1 13 > 250 903 117 279 154.5 218.7 482 175.7 50 Klaskish-CWHvh1 19 > 250 14,702 2,793 3,296 3,752 8,681 8,695 6,736 51 Klaskish-CWHvm1 19 > 250 1,282 244 138 187.6 929.7 938.5 243.7 52 Klaskish-CWHvm2 19 > 250 748 142 178 231.4 619.8 560.2 247.1 53 Klaskish-MHmm1 28 > 250 7 2 3 3.3 6.6 6.6 6.6 75 Mahatta-CWHvh1 13 > 250 11,410 1,483 1,774 1,792 3,046 3,655 4,177 76 Mahatta-CWHvm1 13 > 250 2,663 346 151 160.2 376.6 458.5 681 77 Mahatta-CWHvm2 13 > 250 1,028 134 151 154.8 444.2 481.2 239.5 78 Mahatta-MHmm1 19 > 250 2 0 0 0 1.8 1.8 1.8 79 Malcolm-CWHvm1 0 > 250 5,650 0 861 687 410.8 590.2 1,660 90 Nahwitti-CWHvh1 0 > 250 23,443 0 17,971 16,555 15,653 14,609 5,985 91 Nahwitti-CWHvm1 0 > 250 1,787 0 664 561.8 414.5 585.1 261 92 Nasparti-CWHvh1 13 > 250 27 4 0 0.1 12.1 27 26.9 93 Nasparti-CWHvm2 13 > 250 1 0 0 0 1 1 1 96 Neroutsos-CWHvm1 13 > 250 11 2 0 0 0.3 0.3 0.3 97 Neroutsos-CWHvm2 13 > 250 10 1 1 0.8 8.3 8.3 7.5 98 Nigei-CWHvh1 13 > 250 6,896 897 3,981 4,088 4,385 4,224 3,392 99 San Josef-CWHvh1 0 > 250 24,366 0 16,124 12,654 9,939 10,402 6,242 100 San Josef-CWHvm1 0 > 250 1,067 0 82 43.1 50.1 41.4 335.9 101 San Josef-CWHvm2 0 > 250 139 0 16 6.7 6.7 12.7 50.6 107 Shushartie-CWHvh1 0 > 250 13,630 0 11,373 11,408 11,928 10,123 3,168
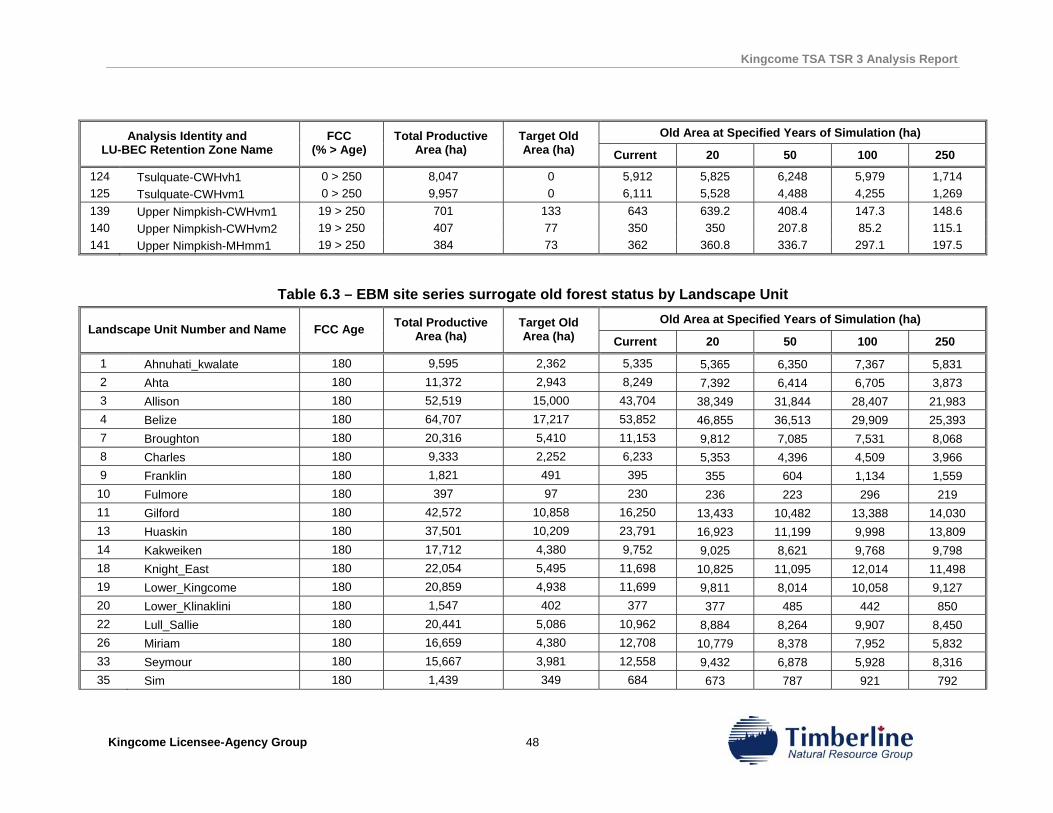
Kingcome TSA TSR 3 Analysis Report
Kingcome Licensee-Agency Group 48
Old Area at Specified Years of Simulation (ha) Analysis Identity and LU-BEC Retention Zone Name
FCC (% > Age)
Total Productive Area (ha)
Target Old Area (ha) Current 20 50 100 250
124 Tsulquate-CWHvh1 0 > 250 8,047 0 5,912 5,825 6,248 5,979 1,714 125 Tsulquate-CWHvm1 0 > 250 9,957 0 6,111 5,528 4,488 4,255 1,269 139 Upper Nimpkish-CWHvm1 19 > 250 701 133 643 639.2 408.4 147.3 148.6 140 Upper Nimpkish-CWHvm2 19 > 250 407 77 350 350 207.8 85.2 115.1 141 Upper Nimpkish-MHmm1 19 > 250 384 73 362 360.8 336.7 297.1 197.5
Table 6.3 – EBM site series surrogate old forest status by Landscape Unit Old Area at Specified Years of Simulation (ha)
Landscape Unit Number and Name FCC Age Total Productive Area (ha)
Target Old Area (ha) Current 20 50 100 250
1 Ahnuhati_kwalate 180 9,595 2,362 5,335 5,365 6,350 7,367 5,831 2 Ahta 180 11,372 2,943 8,249 7,392 6,414 6,705 3,873 3 Allison 180 52,519 15,000 43,704 38,349 31,844 28,407 21,983 4 Belize 180 64,707 17,217 53,852 46,855 36,513 29,909 25,393 7 Broughton 180 20,316 5,410 11,153 9,812 7,085 7,531 8,068 8 Charles 180 9,333 2,252 6,233 5,353 4,396 4,509 3,966 9 Franklin 180 1,821 491 395 355 604 1,134 1,559 10 Fulmore 180 397 97 230 236 223 296 219 11 Gilford 180 42,572 10,858 16,250 13,433 10,482 13,388 14,030 13 Huaskin 180 37,501 10,209 23,791 16,923 11,199 9,998 13,809 14 Kakweiken 180 17,712 4,380 9,752 9,025 8,621 9,768 9,798 18 Knight_East 180 22,054 5,495 11,698 10,825 11,095 12,014 11,498 19 Lower_Kingcome 180 20,859 4,938 11,699 9,811 8,014 10,058 9,127 20 Lower_Klinaklini 180 1,547 402 377 377 485 442 850 22 Lull_Sallie 180 20,441 5,086 10,962 8,884 8,264 9,907 8,450 26 Miriam 180 16,659 4,380 12,708 10,779 8,378 7,952 5,832 33 Seymour 180 15,667 3,981 12,558 9,432 6,878 5,928 8,316 35 Sim 180 1,439 349 684 673 787 921 792
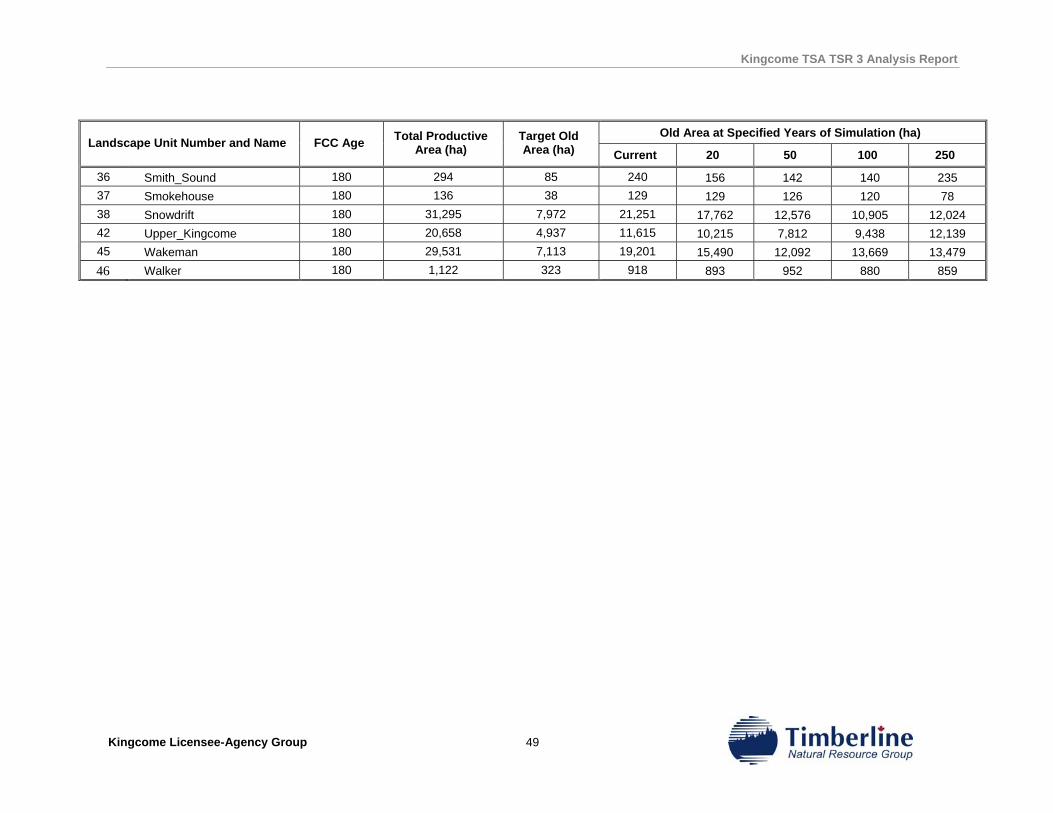
Kingcome TSA TSR 3 Analysis Report
Kingcome Licensee-Agency Group 49
Old Area at Specified Years of Simulation (ha) Landscape Unit Number and Name FCC Age Total Productive
Area (ha) Target Old Area (ha) Current 20 50 100 250
36 Smith_Sound 180 294 85 240 156 142 140 235 37 Smokehouse 180 136 38 129 129 126 120 78 38 Snowdrift 180 31,295 7,972 21,251 17,762 12,576 10,905 12,024 42 Upper_Kingcome 180 20,658 4,937 11,615 10,215 7,812 9,438 12,139 45 Wakeman 180 29,531 7,113 19,201 15,490 12,092 13,669 13,479 46 Walker 180 1,122 323 918 893 952 880 859
Kingcome TSA TSR 3 Analysis Report
Kingcome Licensee-Agency Group 50
As shown in Table 6.2 only six old forest zones are in deficit at the beginning of the simulation. These zones represent less than five percent of the forested land base, 7,137 ha, which is modelled with old forest constraints at the LU-BEC level. By year 150 of the simulation all zones have achieved the old forest target.
Retention objectives in the site series surrogates are currently satisfied across most of the land base managed under EBM. Only 12 percent of the region is below the target retention level at the outset of the simulation. Based on the current age distribution of the stands in some of the areas in old forest deficit, it takes up to 150 years to achieve the target.
It is important to note that harvesting does not occur in any of the zones, either LU-BEC or SSS, that are currently in deficit until the old forest requirement has been satisfied.
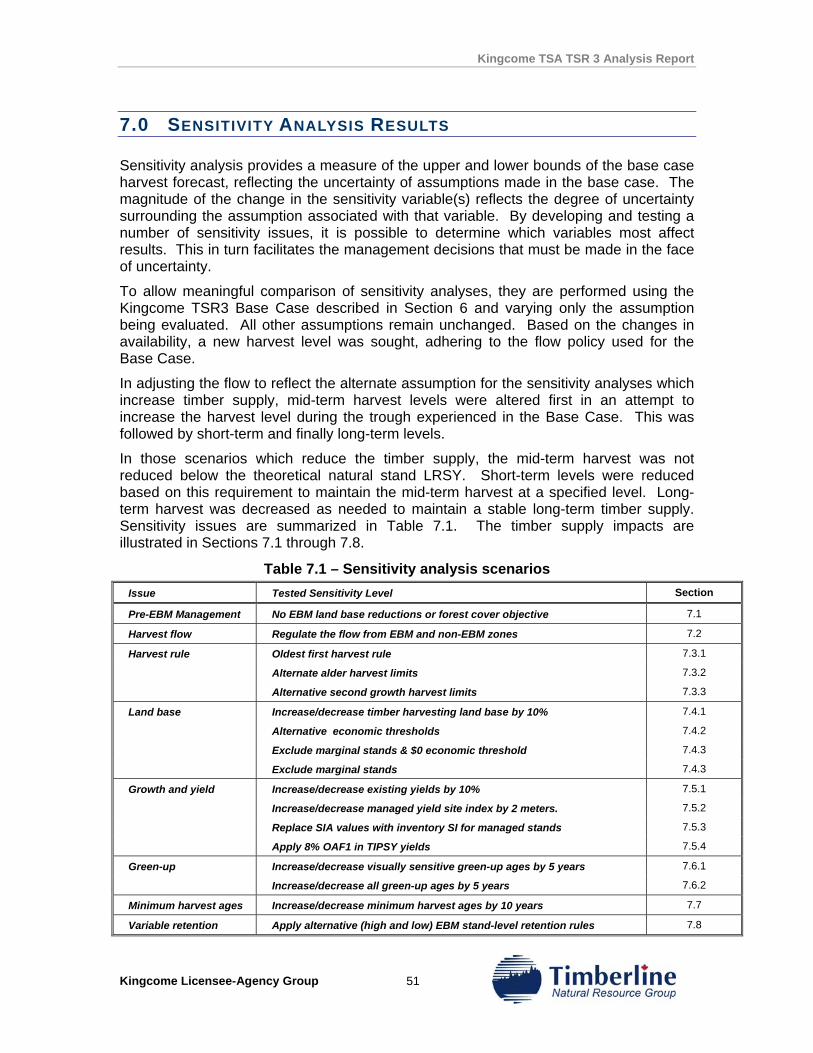
Kingcome TSA TSR 3 Analysis Report
Kingcome Licensee-Agency Group 51
7.0 SENSITIVITY ANALYSIS RESULTS
Sensitivity analysis provides a measure of the upper and lower bounds of the base case harvest forecast, reflecting the uncertainty of assumptions made in the base case. The magnitude of the change in the sensitivity variable(s) reflects the degree of uncertainty surrounding the assumption associated with that variable. By developing and testing a number of sensitivity issues, it is possible to determine which variables most affect results. This in turn facilitates the management decisions that must be made in the face of uncertainty.
To allow meaningful comparison of sensitivity analyses, they are performed using the Kingcome TSR3 Base Case described in Section 6 and varying only the assumption being evaluated. All other assumptions remain unchanged. Based on the changes in availability, a new harvest level was sought, adhering to the flow policy used for the Base Case.
In adjusting the flow to reflect the alternate assumption for the sensitivity analyses which increase timber supply, mid-term harvest levels were altered first in an attempt to increase the harvest level during the trough experienced in the Base Case. This was followed by short-term and finally long-term levels.
In those scenarios which reduce the timber supply, the mid-term harvest was not reduced below the theoretical natural stand LRSY. Short-term levels were reduced based on this requirement to maintain the mid-term harvest at a specified level. Long-term harvest was decreased as needed to maintain a stable long-term timber supply. Sensitivity issues are summarized in Table 7.1. The timber supply impacts are illustrated in Sections 7.1 through 7.8.
Table 7.1 – Sensitivity analysis scenarios Issue Tested Sensitivity Level Section
Pre-EBM Management No EBM land base reductions or forest cover objective 7.1
Harvest flow Regulate the flow from EBM and non-EBM zones 7.2
Harvest rule Oldest first harvest rule 7.3.1
Alternate alder harvest limits 7.3.2
Alternative second growth harvest limits 7.3.3
Land base Increase/decrease timber harvesting land base by 10% 7.4.1
Alternative economic thresholds 7.4.2
Exclude marginal stands & $0 economic threshold 7.4.3
Exclude marginal stands 7.4.3
Growth and yield Increase/decrease existing yields by 10% 7.5.1
Increase/decrease managed yield site index by 2 meters. 7.5.2
Replace SIA values with inventory SI for managed stands 7.5.3
Apply 8% OAF1 in TIPSY yields 7.5.4
Green-up Increase/decrease visually sensitive green-up ages by 5 years 7.6.1
Increase/decrease all green-up ages by 5 years 7.6.2
Minimum harvest ages Increase/decrease minimum harvest ages by 10 years 7.7
Variable retention Apply alternative (high and low) EBM stand-level retention rules 7.8
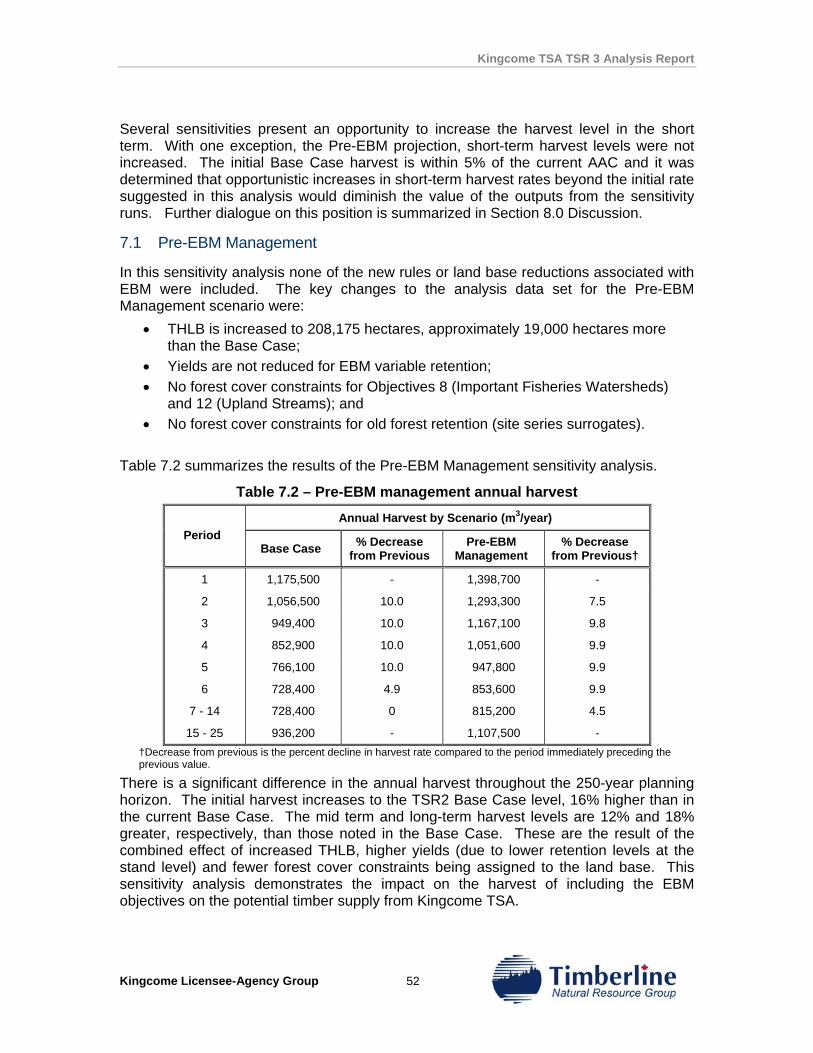
Kingcome TSA TSR 3 Analysis Report
Kingcome Licensee-Agency Group 52
Several sensitivities present an opportunity to increase the harvest level in the short term. With one exception, the Pre-EBM projection, short-term harvest levels were not increased. The initial Base Case harvest is within 5% of the current AAC and it was determined that opportunistic increases in short-term harvest rates beyond the initial rate suggested in this analysis would diminish the value of the outputs from the sensitivity runs. Further dialogue on this position is summarized in Section 8.0 Discussion.
7.1 Pre-EBM Management
In this sensitivity analysis none of the new rules or land base reductions associated with EBM were included. The key changes to the analysis data set for the Pre-EBM Management scenario were:
• THLB is increased to 208,175 hectares, approximately 19,000 hectares more than the Base Case;
• Yields are not reduced for EBM variable retention; • No forest cover constraints for Objectives 8 (Important Fisheries Watersheds)
and 12 (Upland Streams); and • No forest cover constraints for old forest retention (site series surrogates).
Table 7.2 summarizes the results of the Pre-EBM Management sensitivity analysis.
Table 7.2 – Pre-EBM management annual harvest Annual Harvest by Scenario (m3/year)
Period Base Case % Decrease
from Previous Pre-EBM
Management % Decrease
from Previous†
1 1,175,500 - 1,398,700 -
2 1,056,500 10.0 1,293,300 7.5
3 949,400 10.0 1,167,100 9.8
4 852,900 10.0 1,051,600 9.9
5 766,100 10.0 947,800 9.9
6 728,400 4.9 853,600 9.9
7 - 14 728,400 0 815,200 4.5
15 - 25 936,200 - 1,107,500 - †Decrease from previous is the percent decline in harvest rate compared to the period immediately preceding the previous value.
There is a significant difference in the annual harvest throughout the 250-year planning horizon. The initial harvest increases to the TSR2 Base Case level, 16% higher than in the current Base Case. The mid term and long-term harvest levels are 12% and 18% greater, respectively, than those noted in the Base Case. These are the result of the combined effect of increased THLB, higher yields (due to lower retention levels at the stand level) and fewer forest cover constraints being assigned to the land base. This sensitivity analysis demonstrates the impact on the harvest of including the EBM objectives on the potential timber supply from Kingcome TSA.
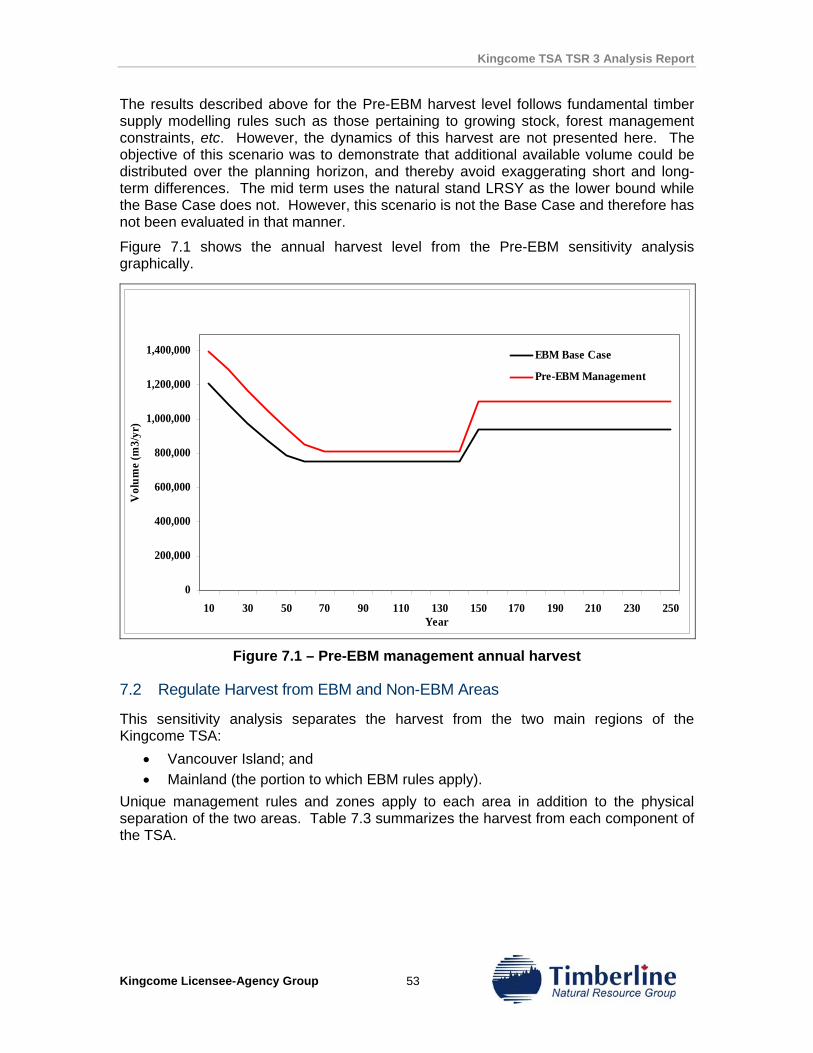
Kingcome TSA TSR 3 Analysis Report
Kingcome Licensee-Agency Group 53
The results described above for the Pre-EBM harvest level follows fundamental timber supply modelling rules such as those pertaining to growing stock, forest management constraints, etc. However, the dynamics of this harvest are not presented here. The objective of this scenario was to demonstrate that additional available volume could be distributed over the planning horizon, and thereby avoid exaggerating short and long-term differences. The mid term uses the natural stand LRSY as the lower bound while the Base Case does not. However, this scenario is not the Base Case and therefore has not been evaluated in that manner.
Figure 7.1 shows the annual harvest level from the Pre-EBM sensitivity analysis graphically.
0
200,000
400,000
600,000
800,000
1,000,000
1,200,000
1,400,000
10 30 50 70 90 110 130 150 170 190 210 230 250Year
Vol
ume
(m3/
yr)
EBM Base Case
Pre-EBM Management
Figure 7.1 – Pre-EBM management annual harvest
7.2 Regulate Harvest from EBM and Non-EBM Areas
This sensitivity analysis separates the harvest from the two main regions of the Kingcome TSA:
• Vancouver Island; and • Mainland (the portion to which EBM rules apply).
Unique management rules and zones apply to each area in addition to the physical separation of the two areas. Table 7.3 summarizes the harvest from each component of the TSA.
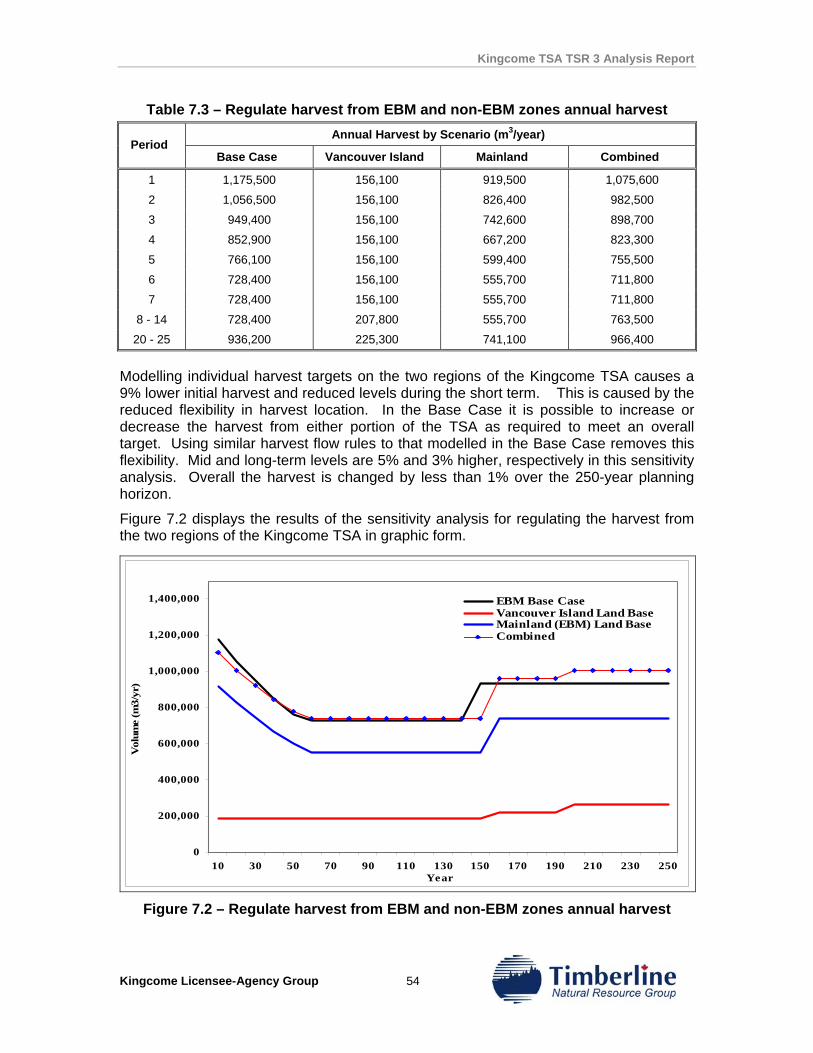
Kingcome TSA TSR 3 Analysis Report
Kingcome Licensee-Agency Group 54
Table 7.3 – Regulate harvest from EBM and non-EBM zones annual harvest Annual Harvest by Scenario (m3/year)
Period Base Case Vancouver Island Mainland Combined
1 1,175,500 156,100 919,500 1,075,600
2 1,056,500 156,100 826,400 982,500
3 949,400 156,100 742,600 898,700
4 852,900 156,100 667,200 823,300
5 766,100 156,100 599,400 755,500
6 728,400 156,100 555,700 711,800
7 728,400 156,100 555,700 711,800
8 - 14 728,400 207,800 555,700 763,500
20 - 25 936,200 225,300 741,100 966,400
Modelling individual harvest targets on the two regions of the Kingcome TSA causes a 9% lower initial harvest and reduced levels during the short term. This is caused by the reduced flexibility in harvest location. In the Base Case it is possible to increase or decrease the harvest from either portion of the TSA as required to meet an overall target. Using similar harvest flow rules to that modelled in the Base Case removes this flexibility. Mid and long-term levels are 5% and 3% higher, respectively in this sensitivity analysis. Overall the harvest is changed by less than 1% over the 250-year planning horizon.
Figure 7.2 displays the results of the sensitivity analysis for regulating the harvest from the two regions of the Kingcome TSA in graphic form.
0
200,000
400,000
600,000
800,000
1,000,000
1,200,000
1,400,000
10 30 50 70 90 110 130 150 170 190 210 230 250Year
Vol
ume
(m3/
yr)
EBM Base CaseVancouver Island Land BaseMainland (EBM) Land BaseCombined
Figure 7.2 – Regulate harvest from EBM and non-EBM zones annual harvest
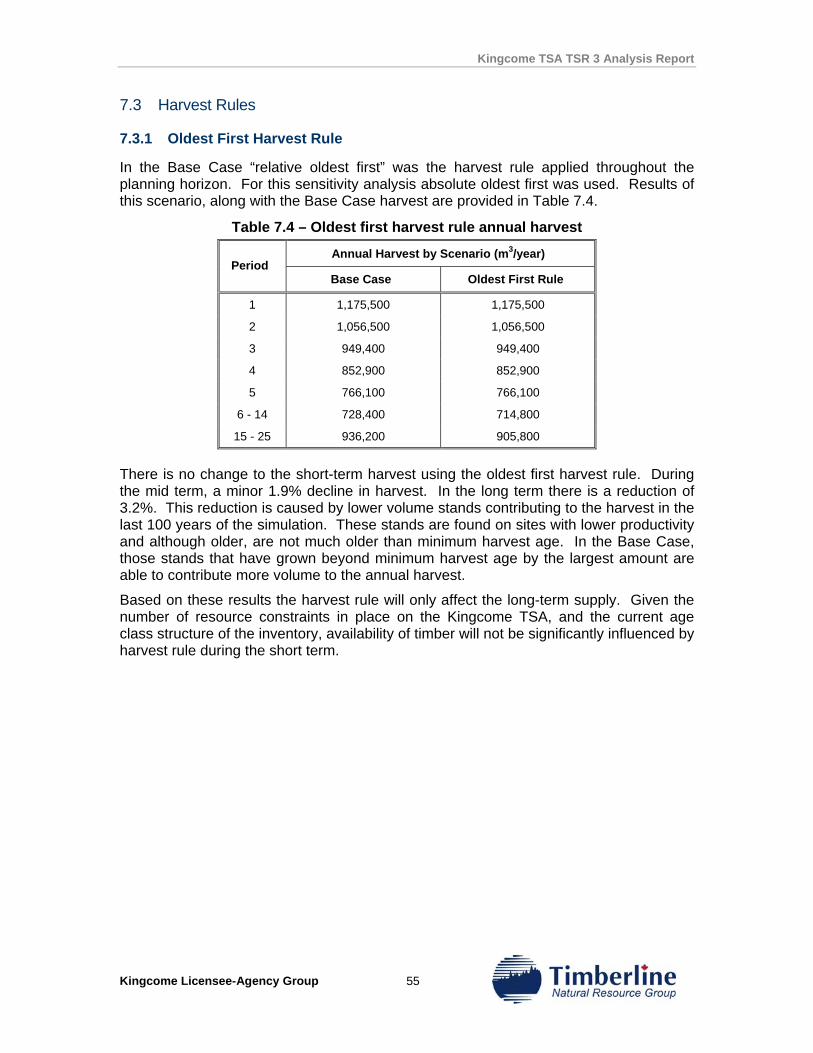
Kingcome TSA TSR 3 Analysis Report
Kingcome Licensee-Agency Group 55
7.3 Harvest Rules
7.3.1 Oldest First Harvest Rule
In the Base Case “relative oldest first” was the harvest rule applied throughout the planning horizon. For this sensitivity analysis absolute oldest first was used. Results of this scenario, along with the Base Case harvest are provided in Table 7.4.
Table 7.4 – Oldest first harvest rule annual harvest
Annual Harvest by Scenario (m3/year) Period
Base Case Oldest First Rule
1 1,175,500 1,175,500
2 1,056,500 1,056,500
3 949,400 949,400
4 852,900 852,900
5 766,100 766,100
6 - 14 728,400 714,800
15 - 25 936,200 905,800
There is no change to the short-term harvest using the oldest first harvest rule. During the mid term, a minor 1.9% decline in harvest. In the long term there is a reduction of 3.2%. This reduction is caused by lower volume stands contributing to the harvest in the last 100 years of the simulation. These stands are found on sites with lower productivity and although older, are not much older than minimum harvest age. In the Base Case, those stands that have grown beyond minimum harvest age by the largest amount are able to contribute more volume to the annual harvest.
Based on these results the harvest rule will only affect the long-term supply. Given the number of resource constraints in place on the Kingcome TSA, and the current age class structure of the inventory, availability of timber will not be significantly influenced by harvest rule during the short term.
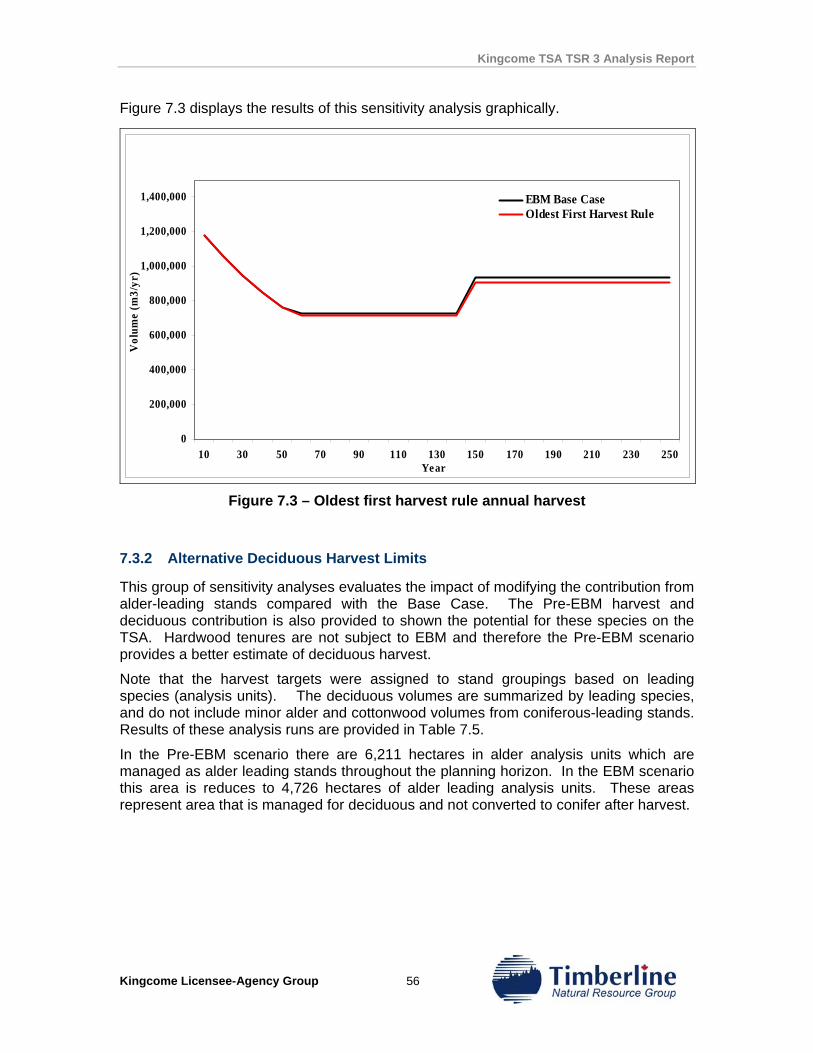
Kingcome TSA TSR 3 Analysis Report
Kingcome Licensee-Agency Group 56
Figure 7.3 displays the results of this sensitivity analysis graphically.
0
200,000
400,000
600,000
800,000
1,000,000
1,200,000
1,400,000
10 30 50 70 90 110 130 150 170 190 210 230 250Year
Vol
ume
(m3/
yr)
EBM Base CaseOldest First Harvest Rule
Figure 7.3 – Oldest first harvest rule annual harvest
7.3.2 Alternative Deciduous Harvest Limits
This group of sensitivity analyses evaluates the impact of modifying the contribution from alder-leading stands compared with the Base Case. The Pre-EBM harvest and deciduous contribution is also provided to shown the potential for these species on the TSA. Hardwood tenures are not subject to EBM and therefore the Pre-EBM scenario provides a better estimate of deciduous harvest.
Note that the harvest targets were assigned to stand groupings based on leading species (analysis units). The deciduous volumes are summarized by leading species, and do not include minor alder and cottonwood volumes from coniferous-leading stands. Results of these analysis runs are provided in Table 7.5.
In the Pre-EBM scenario there are 6,211 hectares in alder analysis units which are managed as alder leading stands throughout the planning horizon. In the EBM scenario this area is reduces to 4,726 hectares of alder leading analysis units. These areas represent area that is managed for deciduous and not converted to conifer after harvest.
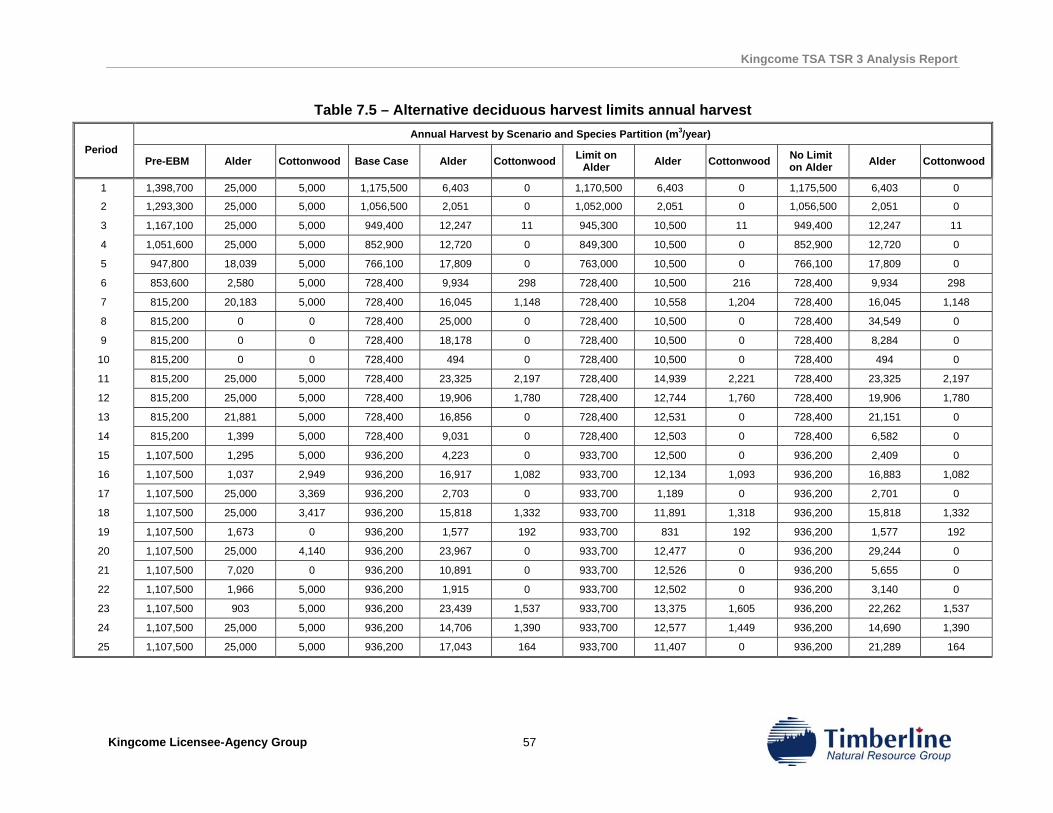
Kingcome TSA TSR 3 Analysis Report
Kingcome Licensee-Agency Group 57
Table 7.5 – Alternative deciduous harvest limits annual harvest Annual Harvest by Scenario and Species Partition (m3/year)
Period Pre-EBM Alder Cottonwood Base Case Alder Cottonwood Limit on
Alder Alder Cottonwood No Limit on Alder Alder Cottonwood
1 1,398,700 25,000 5,000 1,175,500 6,403 0 1,170,500 6,403 0 1,175,500 6,403 0
2 1,293,300 25,000 5,000 1,056,500 2,051 0 1,052,000 2,051 0 1,056,500 2,051 0
3 1,167,100 25,000 5,000 949,400 12,247 11 945,300 10,500 11 949,400 12,247 11
4 1,051,600 25,000 5,000 852,900 12,720 0 849,300 10,500 0 852,900 12,720 0
5 947,800 18,039 5,000 766,100 17,809 0 763,000 10,500 0 766,100 17,809 0
6 853,600 2,580 5,000 728,400 9,934 298 728,400 10,500 216 728,400 9,934 298
7 815,200 20,183 5,000 728,400 16,045 1,148 728,400 10,558 1,204 728,400 16,045 1,148
8 815,200 0 0 728,400 25,000 0 728,400 10,500 0 728,400 34,549 0
9 815,200 0 0 728,400 18,178 0 728,400 10,500 0 728,400 8,284 0
10 815,200 0 0 728,400 494 0 728,400 10,500 0 728,400 494 0
11 815,200 25,000 5,000 728,400 23,325 2,197 728,400 14,939 2,221 728,400 23,325 2,197
12 815,200 25,000 5,000 728,400 19,906 1,780 728,400 12,744 1,760 728,400 19,906 1,780
13 815,200 21,881 5,000 728,400 16,856 0 728,400 12,531 0 728,400 21,151 0
14 815,200 1,399 5,000 728,400 9,031 0 728,400 12,503 0 728,400 6,582 0
15 1,107,500 1,295 5,000 936,200 4,223 0 933,700 12,500 0 936,200 2,409 0
16 1,107,500 1,037 2,949 936,200 16,917 1,082 933,700 12,134 1,093 936,200 16,883 1,082
17 1,107,500 25,000 3,369 936,200 2,703 0 933,700 1,189 0 936,200 2,701 0
18 1,107,500 25,000 3,417 936,200 15,818 1,332 933,700 11,891 1,318 936,200 15,818 1,332
19 1,107,500 1,673 0 936,200 1,577 192 933,700 831 192 936,200 1,577 192
20 1,107,500 25,000 4,140 936,200 23,967 0 933,700 12,477 0 936,200 29,244 0
21 1,107,500 7,020 0 936,200 10,891 0 933,700 12,526 0 936,200 5,655 0
22 1,107,500 1,966 5,000 936,200 1,915 0 933,700 12,502 0 936,200 3,140 0
23 1,107,500 903 5,000 936,200 23,439 1,537 933,700 13,375 1,605 936,200 22,262 1,537
24 1,107,500 25,000 5,000 936,200 14,706 1,390 933,700 12,577 1,449 936,200 14,690 1,390
25 1,107,500 25,000 5,000 936,200 17,043 164 933,700 11,407 0 936,200 21,289 164
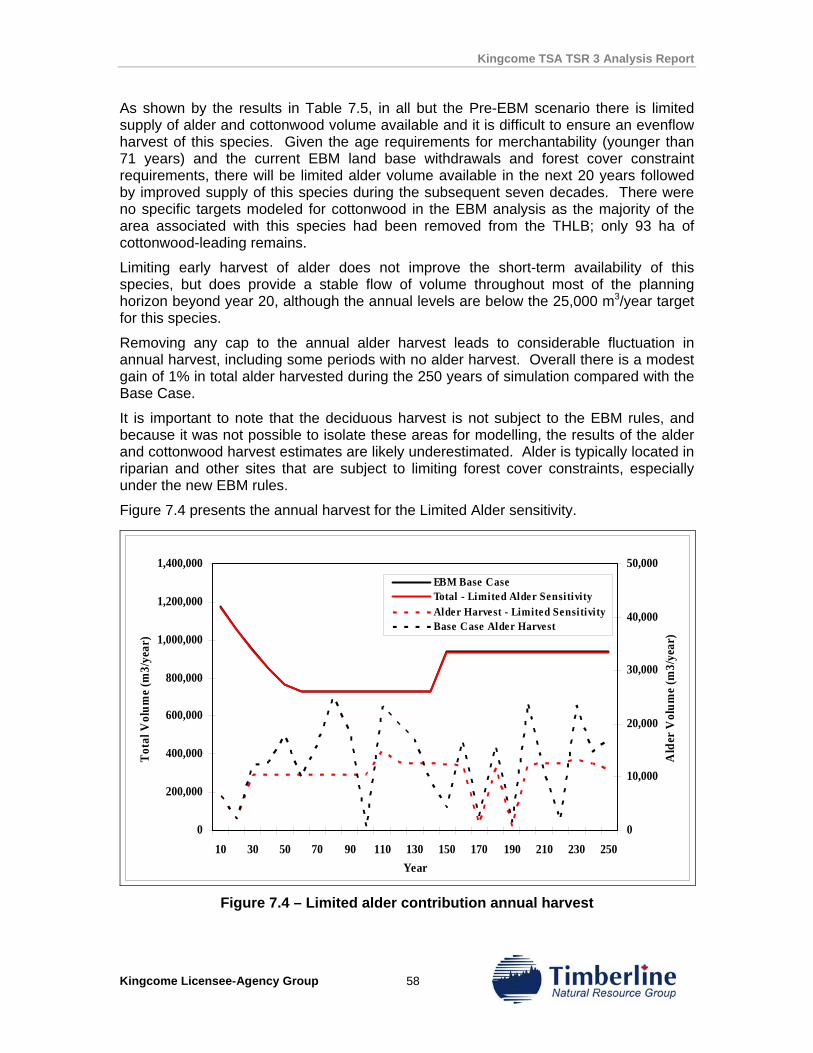
Kingcome TSA TSR 3 Analysis Report
Kingcome Licensee-Agency Group 58
As shown by the results in Table 7.5, in all but the Pre-EBM scenario there is limited supply of alder and cottonwood volume available and it is difficult to ensure an evenflow harvest of this species. Given the age requirements for merchantability (younger than 71 years) and the current EBM land base withdrawals and forest cover constraint requirements, there will be limited alder volume available in the next 20 years followed by improved supply of this species during the subsequent seven decades. There were no specific targets modeled for cottonwood in the EBM analysis as the majority of the area associated with this species had been removed from the THLB; only 93 ha of cottonwood-leading remains.
Limiting early harvest of alder does not improve the short-term availability of this species, but does provide a stable flow of volume throughout most of the planning horizon beyond year 20, although the annual levels are below the 25,000 m3/year target for this species.
Removing any cap to the annual alder harvest leads to considerable fluctuation in annual harvest, including some periods with no alder harvest. Overall there is a modest gain of 1% in total alder harvested during the 250 years of simulation compared with the Base Case.
It is important to note that the deciduous harvest is not subject to the EBM rules, and because it was not possible to isolate these areas for modelling, the results of the alder and cottonwood harvest estimates are likely underestimated. Alder is typically located in riparian and other sites that are subject to limiting forest cover constraints, especially under the new EBM rules.
Figure 7.4 presents the annual harvest for the Limited Alder sensitivity.
0
200,000
400,000
600,000
800,000
1,000,000
1,200,000
1,400,000
10 30 50 70 90 110 130 150 170 190 210 230 250Year
Tot
al V
olum
e (m
3/ye
ar)
0
10,000
20,000
30,000
40,000
50,000
Ald
er V
olum
e (m
3/ye
ar)
EBM Base CaseTotal - Limited Alder SensitivityAlder Harvest - Limited SensitivityBase Case Alder Harvest
Figure 7.4 – Limited alder contribution annual harvest
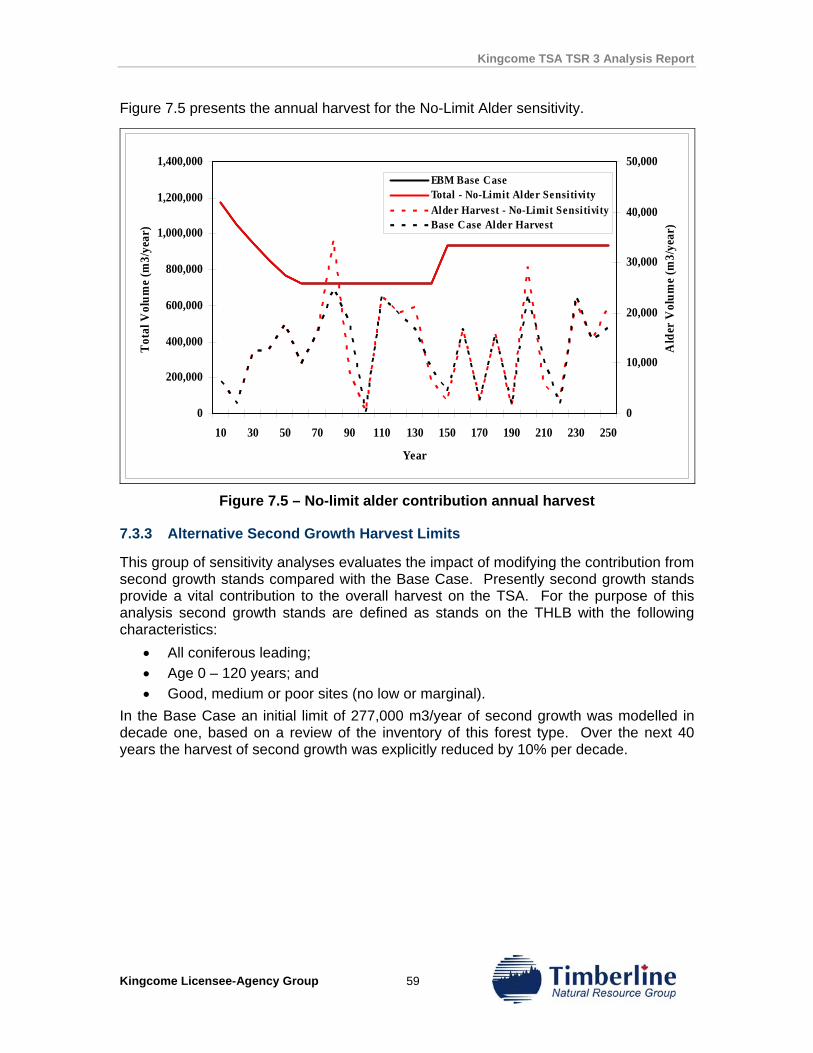
Kingcome TSA TSR 3 Analysis Report
Kingcome Licensee-Agency Group 59
Figure 7.5 presents the annual harvest for the No-Limit Alder sensitivity.
0
200,000
400,000
600,000
800,000
1,000,000
1,200,000
1,400,000
10 30 50 70 90 110 130 150 170 190 210 230 250
Year
Tot
al V
olum
e (m
3/ye
ar)
0
10,000
20,000
30,000
40,000
50,000
Ald
er V
olum
e (m
3/ye
ar)
EBM Base CaseTotal - No-Limit Alder SensitivityAlder Harvest - No-Limit SensitivityBase Case Alder Harvest
Figure 7.5 – No-limit alder contribution annual harvest
7.3.3 Alternative Second Growth Harvest Limits
This group of sensitivity analyses evaluates the impact of modifying the contribution from second growth stands compared with the Base Case. Presently second growth stands provide a vital contribution to the overall harvest on the TSA. For the purpose of this analysis second growth stands are defined as stands on the THLB with the following characteristics:
• All coniferous leading; • Age 0 – 120 years; and • Good, medium or poor sites (no low or marginal).
In the Base Case an initial limit of 277,000 m3/year of second growth was modelled in decade one, based on a review of the inventory of this forest type. Over the next 40 years the harvest of second growth was explicitly reduced by 10% per decade.
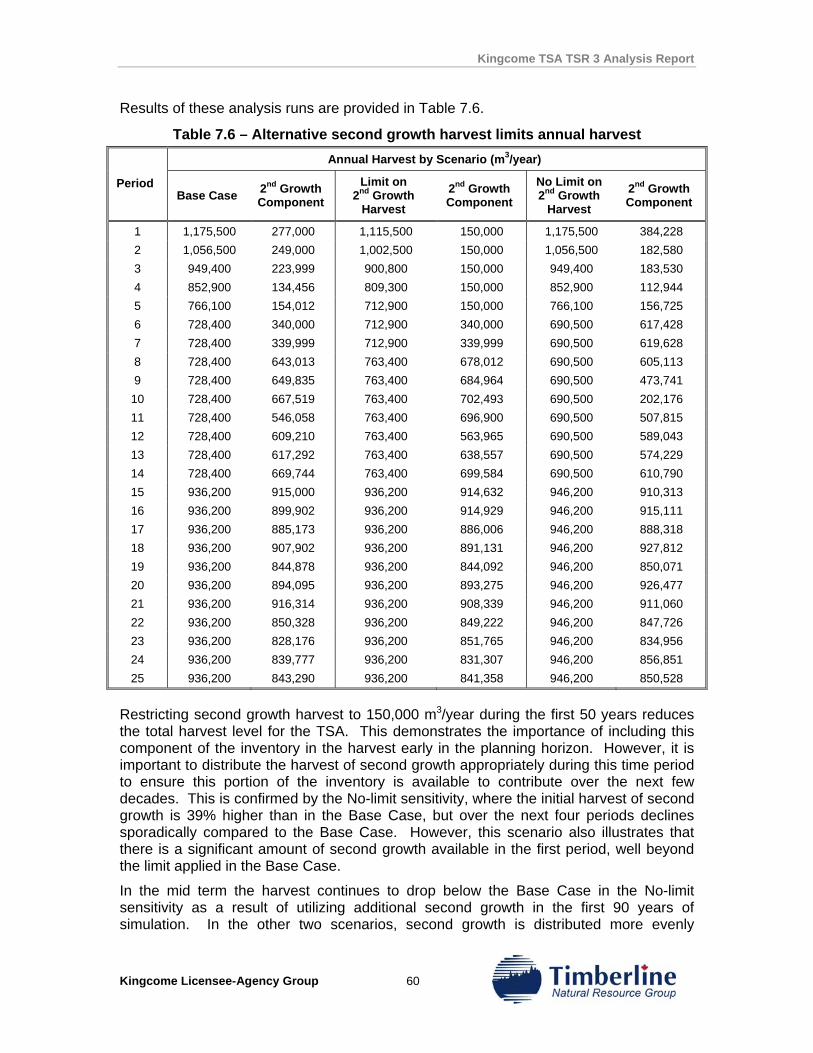
Kingcome TSA TSR 3 Analysis Report
Kingcome Licensee-Agency Group 60
Results of these analysis runs are provided in Table 7.6.
Table 7.6 – Alternative second growth harvest limits annual harvest Annual Harvest by Scenario (m3/year)
Period Base Case 2nd Growth
Component Limit on
2nd Growth Harvest
2nd Growth Component
No Limit on 2nd Growth
Harvest 2nd Growth Component
1 1,175,500 277,000 1,115,500 150,000 1,175,500 384,228 2 1,056,500 249,000 1,002,500 150,000 1,056,500 182,580 3 949,400 223,999 900,800 150,000 949,400 183,530 4 852,900 134,456 809,300 150,000 852,900 112,944 5 766,100 154,012 712,900 150,000 766,100 156,725 6 728,400 340,000 712,900 340,000 690,500 617,428 7 728,400 339,999 712,900 339,999 690,500 619,628 8 728,400 643,013 763,400 678,012 690,500 605,113 9 728,400 649,835 763,400 684,964 690,500 473,741
10 728,400 667,519 763,400 702,493 690,500 202,176 11 728,400 546,058 763,400 696,900 690,500 507,815 12 728,400 609,210 763,400 563,965 690,500 589,043 13 728,400 617,292 763,400 638,557 690,500 574,229 14 728,400 669,744 763,400 699,584 690,500 610,790 15 936,200 915,000 936,200 914,632 946,200 910,313 16 936,200 899,902 936,200 914,929 946,200 915,111 17 936,200 885,173 936,200 886,006 946,200 888,318 18 936,200 907,902 936,200 891,131 946,200 927,812 19 936,200 844,878 936,200 844,092 946,200 850,071 20 936,200 894,095 936,200 893,275 946,200 926,477 21 936,200 916,314 936,200 908,339 946,200 911,060 22 936,200 850,328 936,200 849,222 946,200 847,726 23 936,200 828,176 936,200 851,765 946,200 834,956 24 936,200 839,777 936,200 831,307 946,200 856,851 25 936,200 843,290 936,200 841,358 946,200 850,528
Restricting second growth harvest to 150,000 m3/year during the first 50 years reduces the total harvest level for the TSA. This demonstrates the importance of including this component of the inventory in the harvest early in the planning horizon. However, it is important to distribute the harvest of second growth appropriately during this time period to ensure this portion of the inventory is available to contribute over the next few decades. This is confirmed by the No-limit sensitivity, where the initial harvest of second growth is 39% higher than in the Base Case, but over the next four periods declines sporadically compared to the Base Case. However, this scenario also illustrates that there is a significant amount of second growth available in the first period, well beyond the limit applied in the Base Case.
In the mid term the harvest continues to drop below the Base Case in the No-limit sensitivity as a result of utilizing additional second growth in the first 90 years of simulation. In the other two scenarios, second growth is distributed more evenly
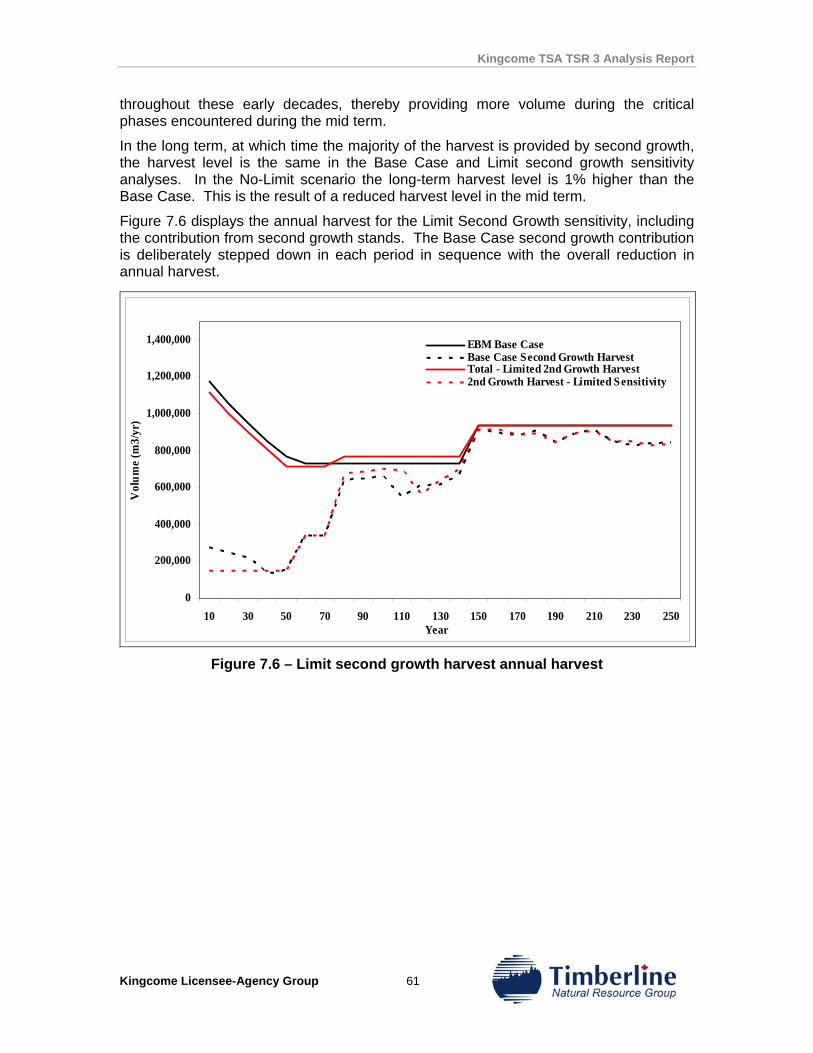
Kingcome TSA TSR 3 Analysis Report
Kingcome Licensee-Agency Group 61
throughout these early decades, thereby providing more volume during the critical phases encountered during the mid term.
In the long term, at which time the majority of the harvest is provided by second growth, the harvest level is the same in the Base Case and Limit second growth sensitivity analyses. In the No-Limit scenario the long-term harvest level is 1% higher than the Base Case. This is the result of a reduced harvest level in the mid term.
Figure 7.6 displays the annual harvest for the Limit Second Growth sensitivity, including the contribution from second growth stands. The Base Case second growth contribution is deliberately stepped down in each period in sequence with the overall reduction in annual harvest.
0
200,000
400,000
600,000
800,000
1,000,000
1,200,000
1,400,000
10 30 50 70 90 110 130 150 170 190 210 230 250Year
Vol
ume
(m3/
yr)
EBM Base CaseBase Case Second Growth HarvestTotal - Limited 2nd Growth Harvest2nd Growth Harvest - Limited Sensitivity
Figure 7.6 – Limit second growth harvest annual harvest
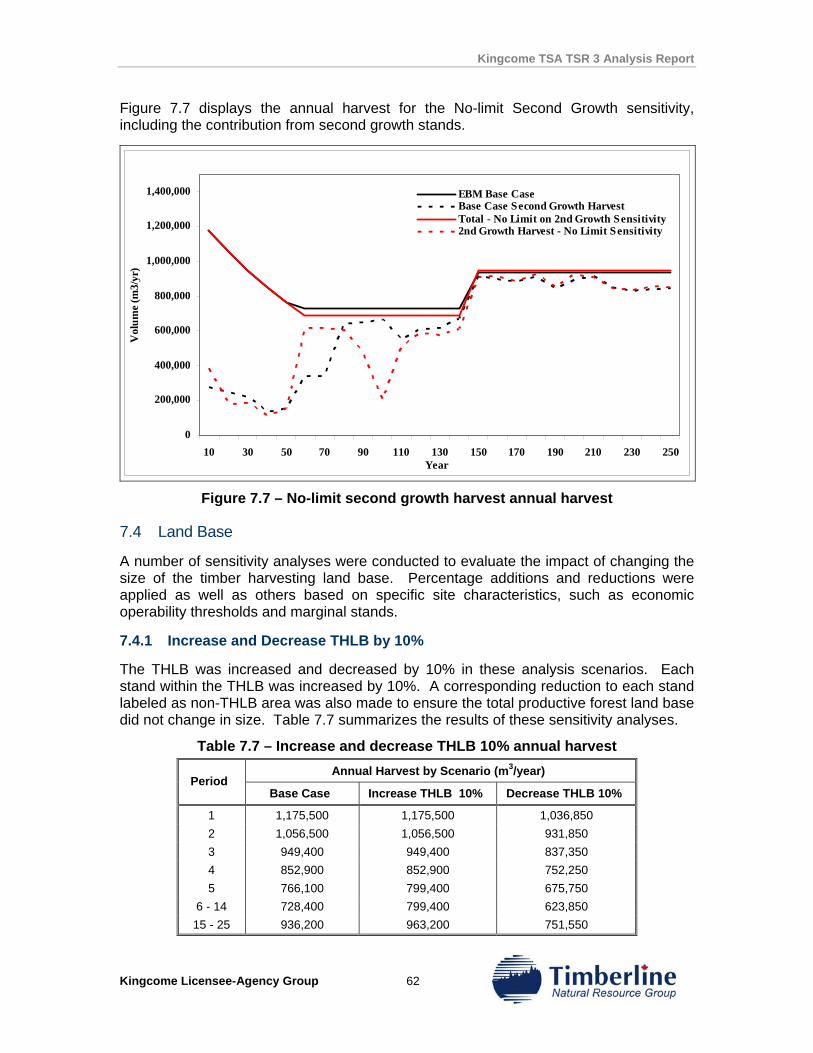
Kingcome TSA TSR 3 Analysis Report
Kingcome Licensee-Agency Group 62
Figure 7.7 displays the annual harvest for the No-limit Second Growth sensitivity, including the contribution from second growth stands.
0
200,000
400,000
600,000
800,000
1,000,000
1,200,000
1,400,000
10 30 50 70 90 110 130 150 170 190 210 230 250Year
Vol
ume
(m3/
yr)
EBM Base CaseBase Case Second Growth HarvestTotal - No Limit on 2nd Growth Sensitivity2nd Growth Harvest - No Limit Sensitivity
Figure 7.7 – No-limit second growth harvest annual harvest
7.4 Land Base
A number of sensitivity analyses were conducted to evaluate the impact of changing the size of the timber harvesting land base. Percentage additions and reductions were applied as well as others based on specific site characteristics, such as economic operability thresholds and marginal stands.
7.4.1 Increase and Decrease THLB by 10%
The THLB was increased and decreased by 10% in these analysis scenarios. Each stand within the THLB was increased by 10%. A corresponding reduction to each stand labeled as non-THLB area was also made to ensure the total productive forest land base did not change in size. Table 7.7 summarizes the results of these sensitivity analyses.
Table 7.7 – Increase and decrease THLB 10% annual harvest Annual Harvest by Scenario (m3/year)
Period Base Case Increase THLB 10% Decrease THLB 10%
1 1,175,500 1,175,500 1,036,850 2 1,056,500 1,056,500 931,850 3 949,400 949,400 837,350 4 852,900 852,900 752,250 5 766,100 799,400 675,750
6 - 14 728,400 799,400 623,850 15 - 25 936,200 963,200 751,550
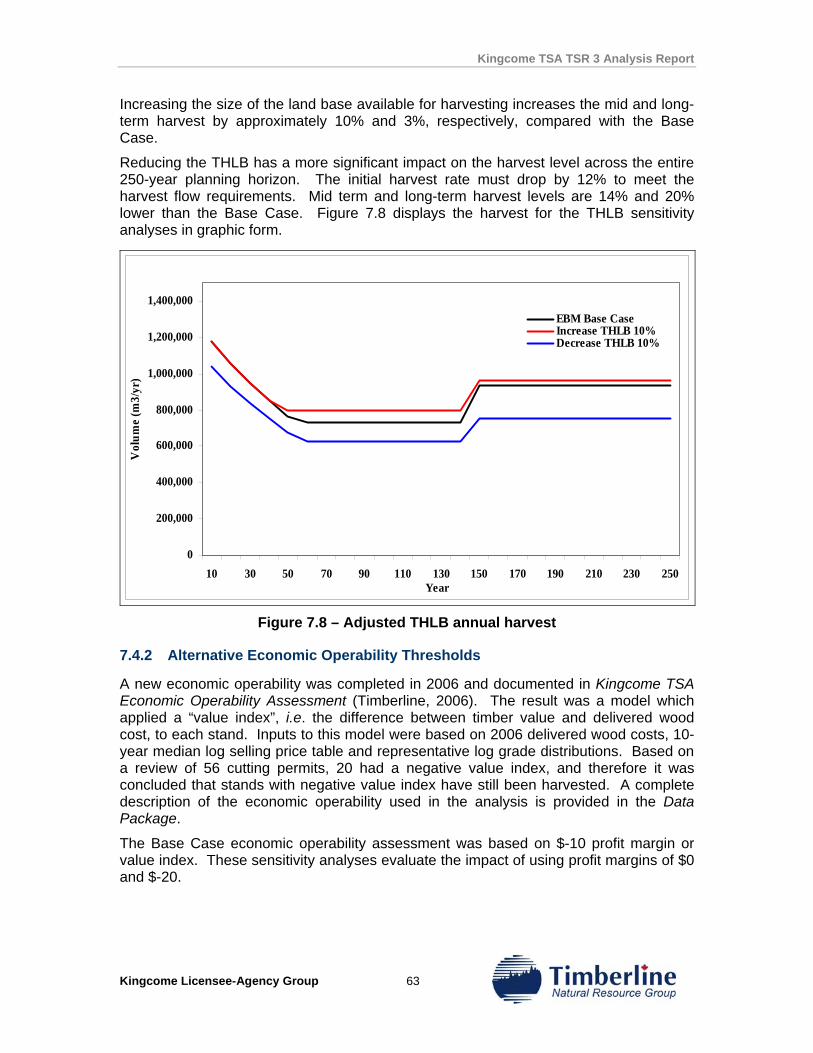
Kingcome TSA TSR 3 Analysis Report
Kingcome Licensee-Agency Group 63
Increasing the size of the land base available for harvesting increases the mid and long-term harvest by approximately 10% and 3%, respectively, compared with the Base Case.
Reducing the THLB has a more significant impact on the harvest level across the entire 250-year planning horizon. The initial harvest rate must drop by 12% to meet the harvest flow requirements. Mid term and long-term harvest levels are 14% and 20% lower than the Base Case. Figure 7.8 displays the harvest for the THLB sensitivity analyses in graphic form.
0
200,000
400,000
600,000
800,000
1,000,000
1,200,000
1,400,000
10 30 50 70 90 110 130 150 170 190 210 230 250Year
Vol
ume
(m3/
yr)
EBM Base CaseIncrease THLB 10%Decrease THLB 10%
Figure 7.8 – Adjusted THLB annual harvest
7.4.2 Alternative Economic Operability Thresholds
A new economic operability was completed in 2006 and documented in Kingcome TSA Economic Operability Assessment (Timberline, 2006). The result was a model which applied a “value index”, i.e. the difference between timber value and delivered wood cost, to each stand. Inputs to this model were based on 2006 delivered wood costs, 10-year median log selling price table and representative log grade distributions. Based on a review of 56 cutting permits, 20 had a negative value index, and therefore it was concluded that stands with negative value index have still been harvested. A complete description of the economic operability used in the analysis is provided in the Data Package.
The Base Case economic operability assessment was based on $-10 profit margin or value index. These sensitivity analyses evaluate the impact of using profit margins of $0 and $-20.
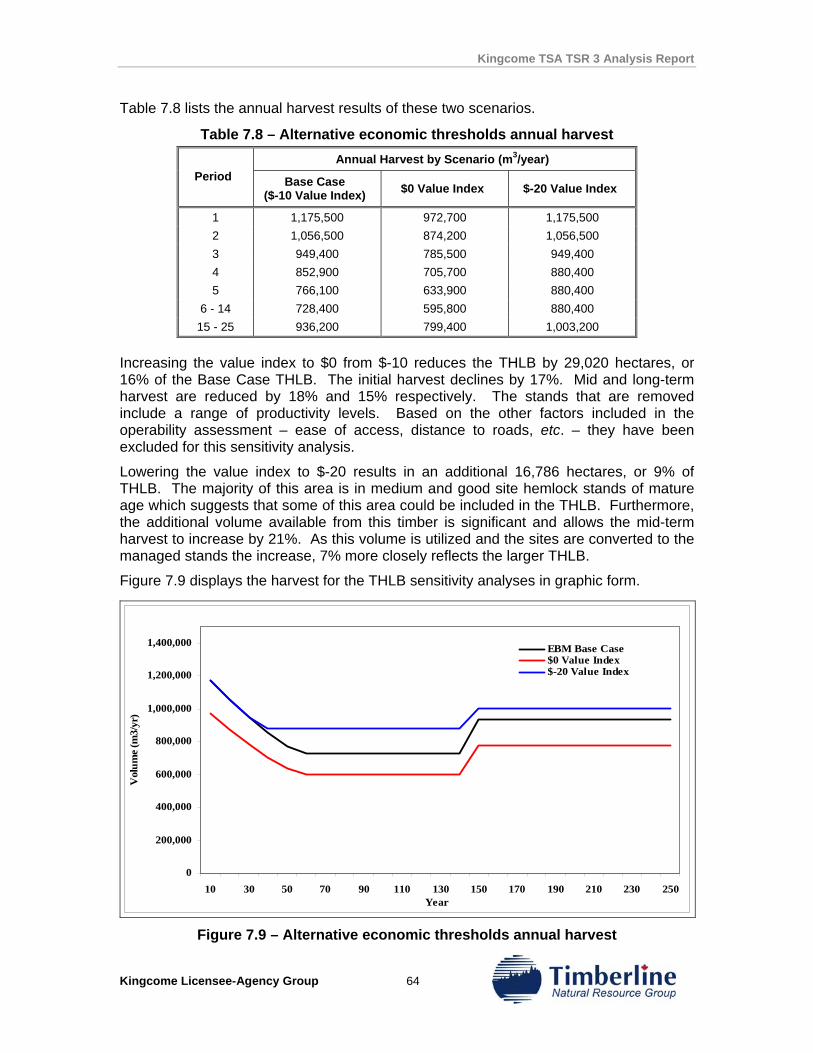
Kingcome TSA TSR 3 Analysis Report
Kingcome Licensee-Agency Group 64
Table 7.8 lists the annual harvest results of these two scenarios.
Table 7.8 – Alternative economic thresholds annual harvest Annual Harvest by Scenario (m3/year)
Period Base Case ($-10 Value Index) $0 Value Index $-20 Value Index
1 1,175,500 972,700 1,175,500 2 1,056,500 874,200 1,056,500 3 949,400 785,500 949,400 4 852,900 705,700 880,400 5 766,100 633,900 880,400
6 - 14 728,400 595,800 880,400 15 - 25 936,200 799,400 1,003,200
Increasing the value index to $0 from $-10 reduces the THLB by 29,020 hectares, or 16% of the Base Case THLB. The initial harvest declines by 17%. Mid and long-term harvest are reduced by 18% and 15% respectively. The stands that are removed include a range of productivity levels. Based on the other factors included in the operability assessment – ease of access, distance to roads, etc. – they have been excluded for this sensitivity analysis.
Lowering the value index to $-20 results in an additional 16,786 hectares, or 9% of THLB. The majority of this area is in medium and good site hemlock stands of mature age which suggests that some of this area could be included in the THLB. Furthermore, the additional volume available from this timber is significant and allows the mid-term harvest to increase by 21%. As this volume is utilized and the sites are converted to the managed stands the increase, 7% more closely reflects the larger THLB.
Figure 7.9 displays the harvest for the THLB sensitivity analyses in graphic form.
0
200,000
400,000
600,000
800,000
1,000,000
1,200,000
1,400,000
10 30 50 70 90 110 130 150 170 190 210 230 250Year
Vol
ume
(m3/
yr)
EBM Base Case$0 Value Index$-20 Value Index
Figure 7.9 – Alternative economic thresholds annual harvest
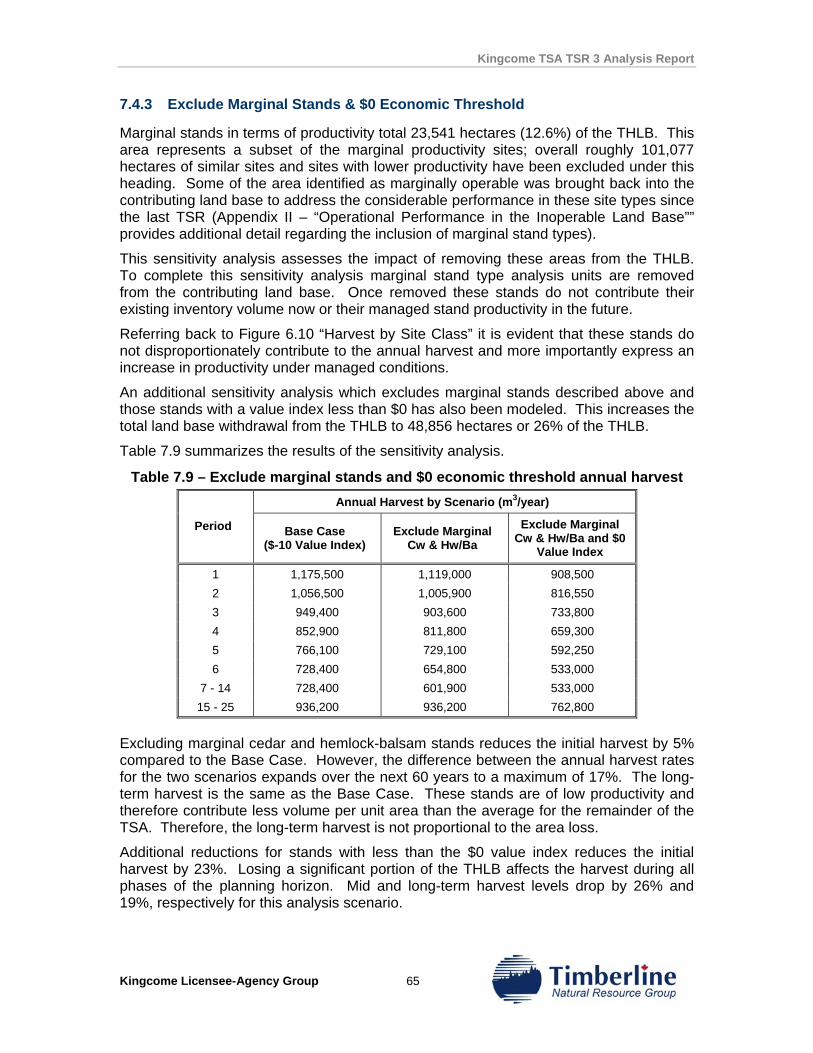
Kingcome TSA TSR 3 Analysis Report
Kingcome Licensee-Agency Group 65
7.4.3 Exclude Marginal Stands & $0 Economic Threshold
Marginal stands in terms of productivity total 23,541 hectares (12.6%) of the THLB. This area represents a subset of the marginal productivity sites; overall roughly 101,077 hectares of similar sites and sites with lower productivity have been excluded under this heading. Some of the area identified as marginally operable was brought back into the contributing land base to address the considerable performance in these site types since the last TSR (Appendix II – “Operational Performance in the Inoperable Land Base”” provides additional detail regarding the inclusion of marginal stand types).
This sensitivity analysis assesses the impact of removing these areas from the THLB. To complete this sensitivity analysis marginal stand type analysis units are removed from the contributing land base. Once removed these stands do not contribute their existing inventory volume now or their managed stand productivity in the future.
Referring back to Figure 6.10 “Harvest by Site Class” it is evident that these stands do not disproportionately contribute to the annual harvest and more importantly express an increase in productivity under managed conditions.
An additional sensitivity analysis which excludes marginal stands described above and those stands with a value index less than $0 has also been modeled. This increases the total land base withdrawal from the THLB to 48,856 hectares or 26% of the THLB.
Table 7.9 summarizes the results of the sensitivity analysis.
Table 7.9 – Exclude marginal stands and $0 economic threshold annual harvest Annual Harvest by Scenario (m3/year)
Period Base Case ($-10 Value Index)
Exclude Marginal Cw & Hw/Ba
Exclude Marginal Cw & Hw/Ba and $0
Value Index
1 1,175,500 1,119,000 908,500 2 1,056,500 1,005,900 816,550 3 949,400 903,600 733,800 4 852,900 811,800 659,300 5 766,100 729,100 592,250 6 728,400 654,800 533,000
7 - 14 728,400 601,900 533,000 15 - 25 936,200 936,200 762,800
Excluding marginal cedar and hemlock-balsam stands reduces the initial harvest by 5% compared to the Base Case. However, the difference between the annual harvest rates for the two scenarios expands over the next 60 years to a maximum of 17%. The long-term harvest is the same as the Base Case. These stands are of low productivity and therefore contribute less volume per unit area than the average for the remainder of the TSA. Therefore, the long-term harvest is not proportional to the area loss.
Additional reductions for stands with less than the $0 value index reduces the initial harvest by 23%. Losing a significant portion of the THLB affects the harvest during all phases of the planning horizon. Mid and long-term harvest levels drop by 26% and 19%, respectively for this analysis scenario.
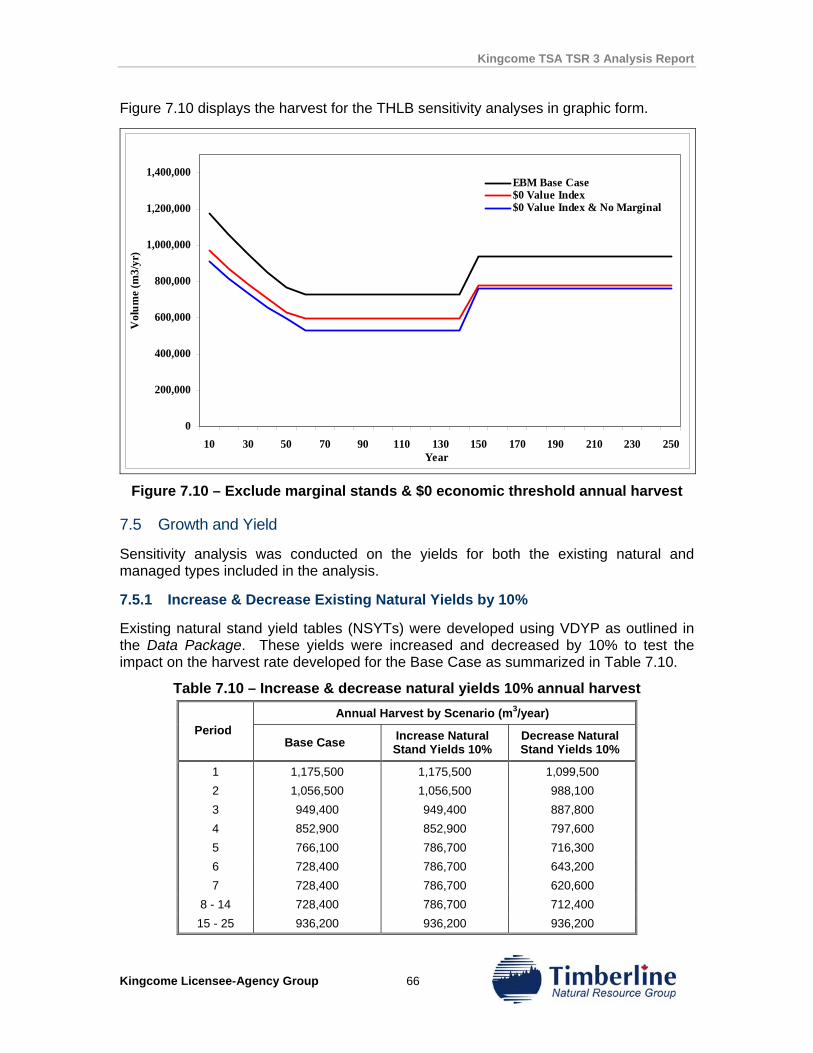
Kingcome TSA TSR 3 Analysis Report
Kingcome Licensee-Agency Group 66
Figure 7.10 displays the harvest for the THLB sensitivity analyses in graphic form.
0
200,000
400,000
600,000
800,000
1,000,000
1,200,000
1,400,000
10 30 50 70 90 110 130 150 170 190 210 230 250Year
Vol
ume
(m3/
yr)
EBM Base Case$0 Value Index$0 Value Index & No Marginal
Figure 7.10 – Exclude marginal stands & $0 economic threshold annual harvest
7.5 Growth and Yield
Sensitivity analysis was conducted on the yields for both the existing natural and managed types included in the analysis.
7.5.1 Increase & Decrease Existing Natural Yields by 10%
Existing natural stand yield tables (NSYTs) were developed using VDYP as outlined in the Data Package. These yields were increased and decreased by 10% to test the impact on the harvest rate developed for the Base Case as summarized in Table 7.10.
Table 7.10 – Increase & decrease natural yields 10% annual harvest Annual Harvest by Scenario (m3/year)
Period Base Case Increase Natural
Stand Yields 10% Decrease Natural Stand Yields 10%
1 1,175,500 1,175,500 1,099,500 2 1,056,500 1,056,500 988,100 3 949,400 949,400 887,800 4 852,900 852,900 797,600 5 766,100 786,700 716,300 6 728,400 786,700 643,200 7 728,400 786,700 620,600
8 - 14 728,400 786,700 712,400 15 - 25 936,200 936,200 936,200
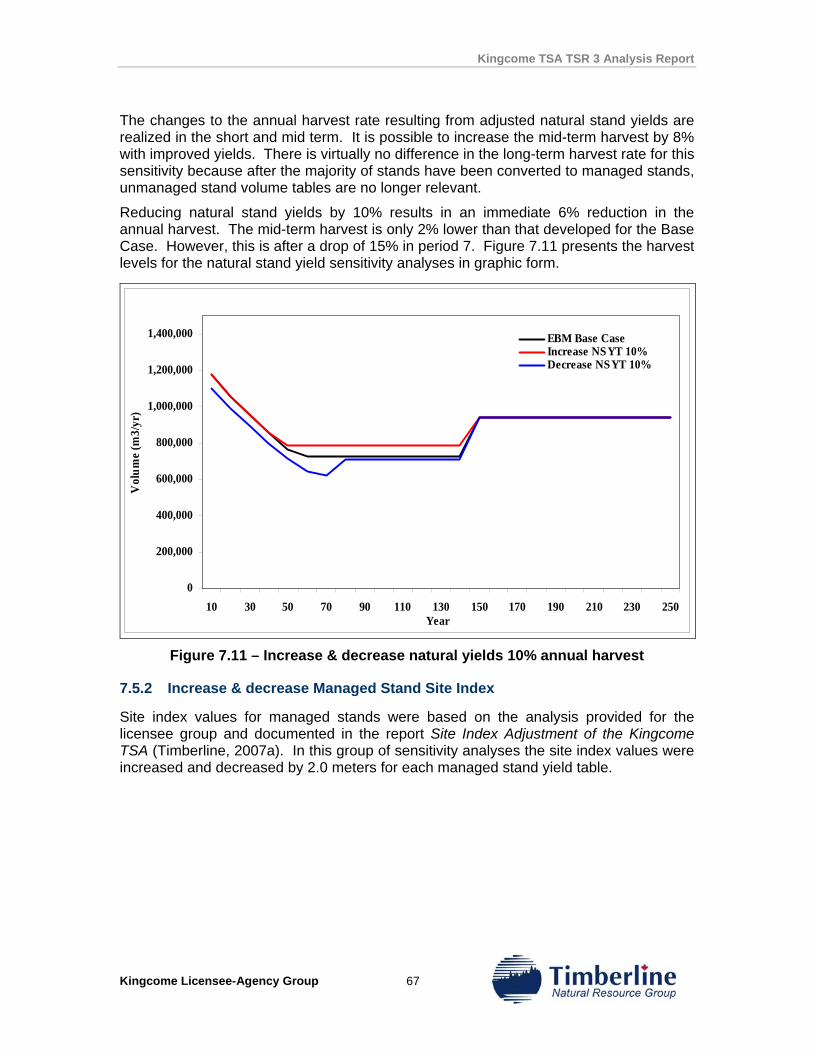
Kingcome TSA TSR 3 Analysis Report
Kingcome Licensee-Agency Group 67
The changes to the annual harvest rate resulting from adjusted natural stand yields are realized in the short and mid term. It is possible to increase the mid-term harvest by 8% with improved yields. There is virtually no difference in the long-term harvest rate for this sensitivity because after the majority of stands have been converted to managed stands, unmanaged stand volume tables are no longer relevant.
Reducing natural stand yields by 10% results in an immediate 6% reduction in the annual harvest. The mid-term harvest is only 2% lower than that developed for the Base Case. However, this is after a drop of 15% in period 7. Figure 7.11 presents the harvest levels for the natural stand yield sensitivity analyses in graphic form.
0
200,000
400,000
600,000
800,000
1,000,000
1,200,000
1,400,000
10 30 50 70 90 110 130 150 170 190 210 230 250Year
Vol
ume
(m3/
yr)
EBM Base CaseIncrease NSYT 10%Decrease NSYT 10%
Figure 7.11 – Increase & decrease natural yields 10% annual harvest
7.5.2 Increase & decrease Managed Stand Site Index
Site index values for managed stands were based on the analysis provided for the licensee group and documented in the report Site Index Adjustment of the Kingcome TSA (Timberline, 2007a). In this group of sensitivity analyses the site index values were increased and decreased by 2.0 meters for each managed stand yield table.
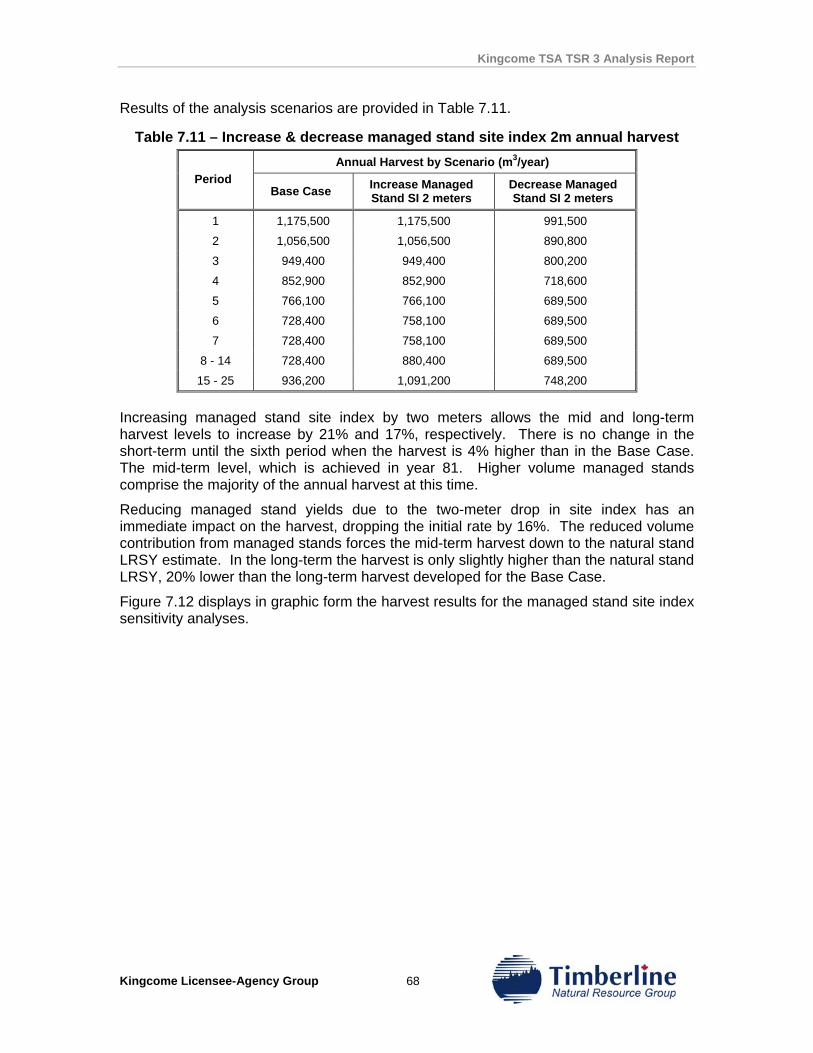
Kingcome TSA TSR 3 Analysis Report
Kingcome Licensee-Agency Group 68
Results of the analysis scenarios are provided in Table 7.11.
Table 7.11 – Increase & decrease managed stand site index 2m annual harvest Annual Harvest by Scenario (m3/year)
Period Base Case Increase Managed
Stand SI 2 meters Decrease Managed Stand SI 2 meters
1 1,175,500 1,175,500 991,500
2 1,056,500 1,056,500 890,800
3 949,400 949,400 800,200
4 852,900 852,900 718,600
5 766,100 766,100 689,500
6 728,400 758,100 689,500
7 728,400 758,100 689,500
8 - 14 728,400 880,400 689,500
15 - 25 936,200 1,091,200 748,200
Increasing managed stand site index by two meters allows the mid and long-term harvest levels to increase by 21% and 17%, respectively. There is no change in the short-term until the sixth period when the harvest is 4% higher than in the Base Case. The mid-term level, which is achieved in year 81. Higher volume managed stands comprise the majority of the annual harvest at this time.
Reducing managed stand yields due to the two-meter drop in site index has an immediate impact on the harvest, dropping the initial rate by 16%. The reduced volume contribution from managed stands forces the mid-term harvest down to the natural stand LRSY estimate. In the long-term the harvest is only slightly higher than the natural stand LRSY, 20% lower than the long-term harvest developed for the Base Case.
Figure 7.12 displays in graphic form the harvest results for the managed stand site index sensitivity analyses.
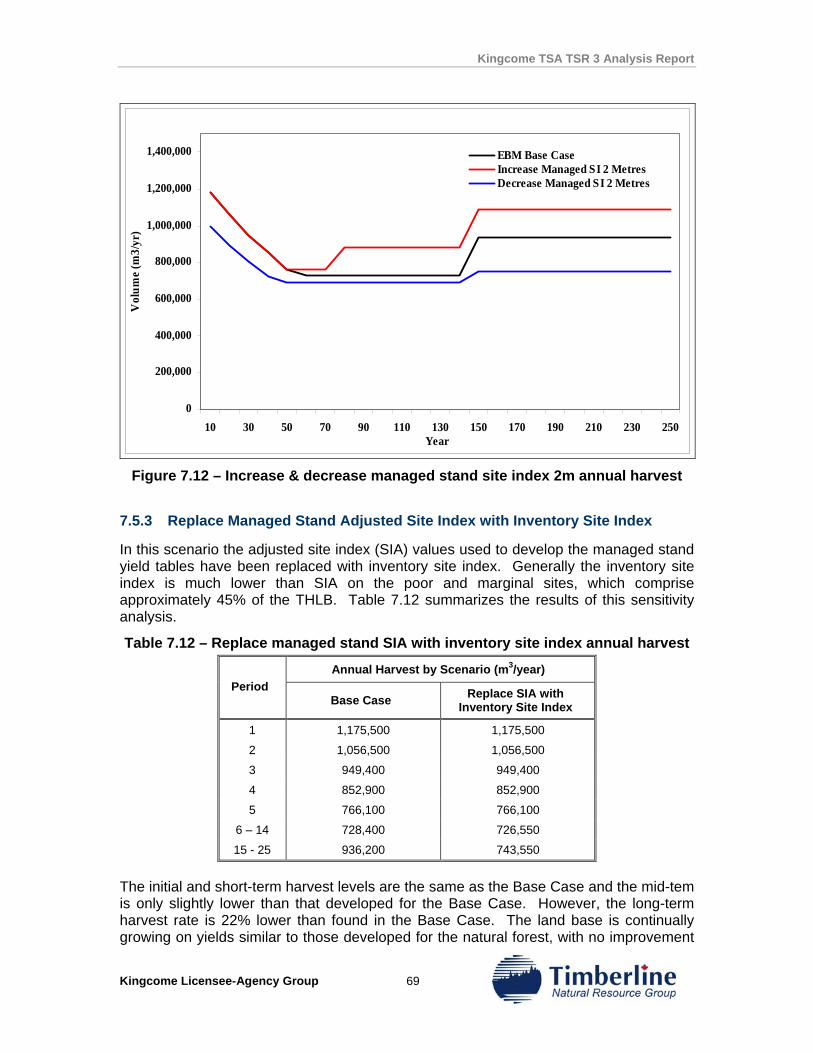
Kingcome TSA TSR 3 Analysis Report
Kingcome Licensee-Agency Group 69
0
200,000
400,000
600,000
800,000
1,000,000
1,200,000
1,400,000
10 30 50 70 90 110 130 150 170 190 210 230 250Year
Vol
ume
(m3/
yr)
EBM Base CaseIncrease Managed SI 2 MetresDecrease Managed SI 2 Metres
Figure 7.12 – Increase & decrease managed stand site index 2m annual harvest
7.5.3 Replace Managed Stand Adjusted Site Index with Inventory Site Index
In this scenario the adjusted site index (SIA) values used to develop the managed stand yield tables have been replaced with inventory site index. Generally the inventory site index is much lower than SIA on the poor and marginal sites, which comprise approximately 45% of the THLB. Table 7.12 summarizes the results of this sensitivity analysis.
Table 7.12 – Replace managed stand SIA with inventory site index annual harvest
Annual Harvest by Scenario (m3/year) Period
Base Case Replace SIA with Inventory Site Index
1 1,175,500 1,175,500
2 1,056,500 1,056,500
3 949,400 949,400
4 852,900 852,900
5 766,100 766,100
6 – 14 728,400 726,550
15 - 25 936,200 743,550
The initial and short-term harvest levels are the same as the Base Case and the mid-tem is only slightly lower than that developed for the Base Case. However, the long-term harvest rate is 22% lower than found in the Base Case. The land base is continually growing on yields similar to those developed for the natural forest, with no improvement
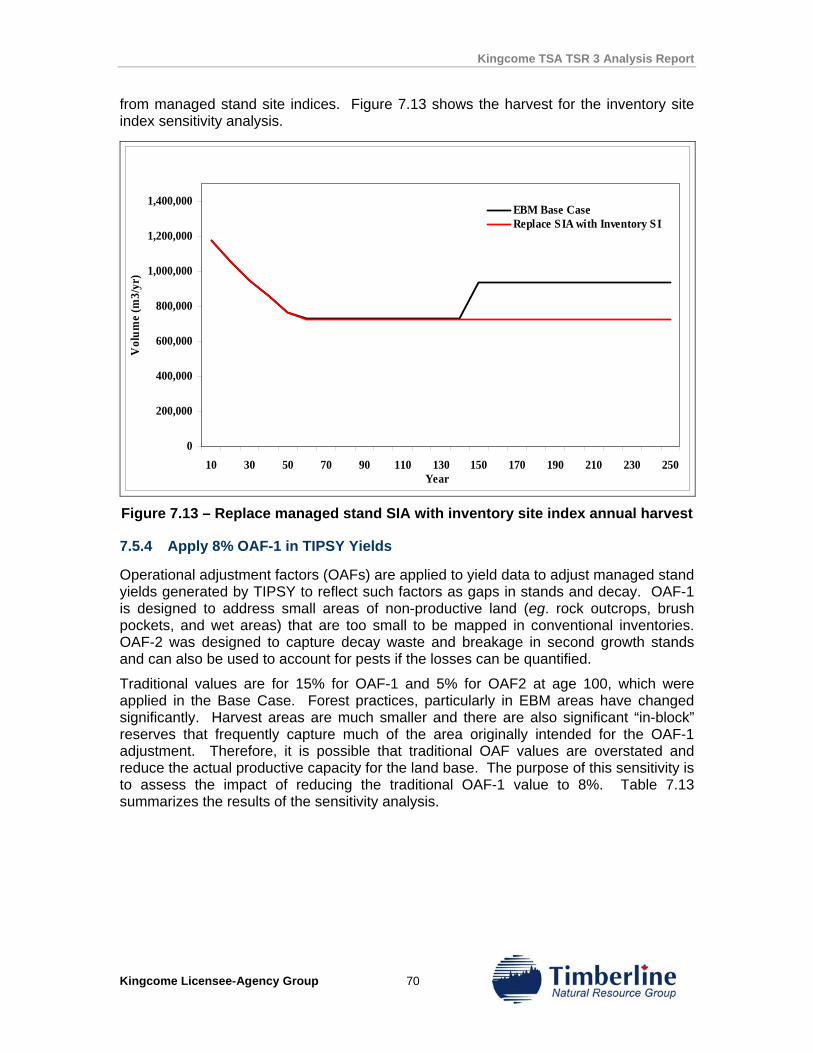
Kingcome TSA TSR 3 Analysis Report
Kingcome Licensee-Agency Group 70
from managed stand site indices. Figure 7.13 shows the harvest for the inventory site index sensitivity analysis.
0
200,000
400,000
600,000
800,000
1,000,000
1,200,000
1,400,000
10 30 50 70 90 110 130 150 170 190 210 230 250Year
Vol
ume
(m3/
yr)
EBM Base CaseReplace SIA with Inventory SI
Figure 7.13 – Replace managed stand SIA with inventory site index annual harvest
7.5.4 Apply 8% OAF-1 in TIPSY Yields
Operational adjustment factors (OAFs) are applied to yield data to adjust managed stand yields generated by TIPSY to reflect such factors as gaps in stands and decay. OAF-1 is designed to address small areas of non-productive land (eg. rock outcrops, brush pockets, and wet areas) that are too small to be mapped in conventional inventories. OAF-2 was designed to capture decay waste and breakage in second growth stands and can also be used to account for pests if the losses can be quantified.
Traditional values are for 15% for OAF-1 and 5% for OAF2 at age 100, which were applied in the Base Case. Forest practices, particularly in EBM areas have changed significantly. Harvest areas are much smaller and there are also significant “in-block” reserves that frequently capture much of the area originally intended for the OAF-1 adjustment. Therefore, it is possible that traditional OAF values are overstated and reduce the actual productive capacity for the land base. The purpose of this sensitivity is to assess the impact of reducing the traditional OAF-1 value to 8%. Table 7.13 summarizes the results of the sensitivity analysis.
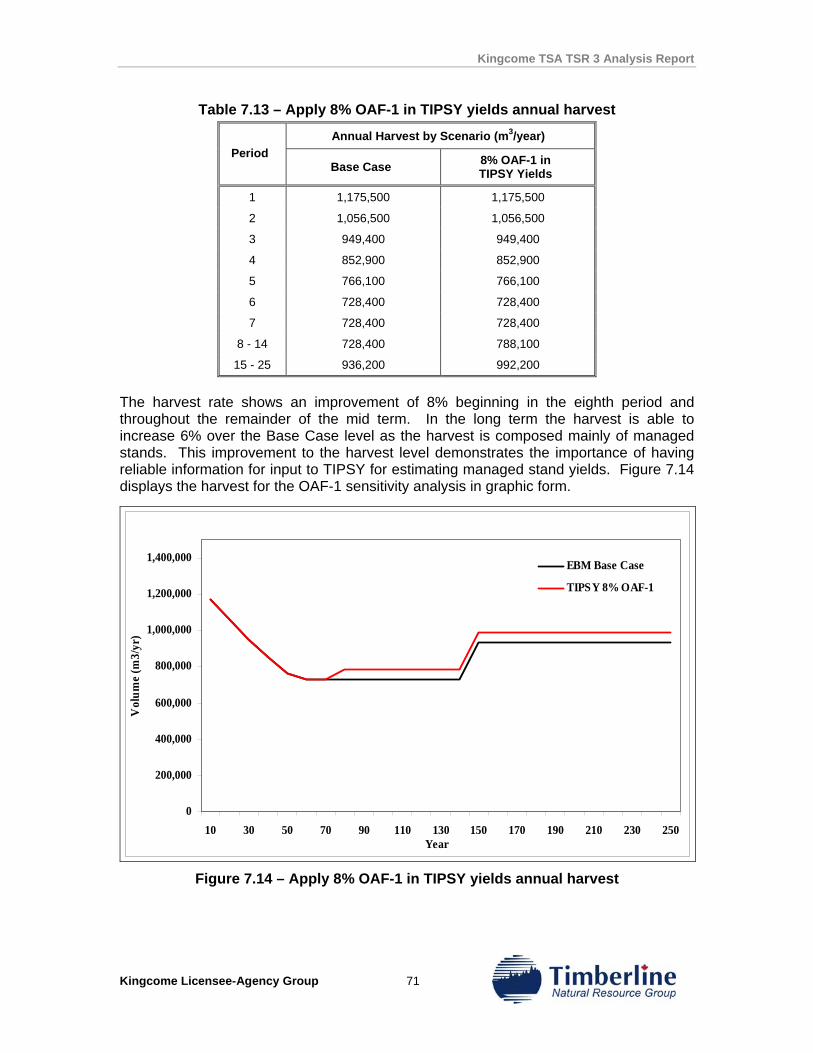
Kingcome TSA TSR 3 Analysis Report
Kingcome Licensee-Agency Group 71
Table 7.13 – Apply 8% OAF-1 in TIPSY yields annual harvest
Annual Harvest by Scenario (m3/year) Period
Base Case 8% OAF-1 in TIPSY Yields
1 1,175,500 1,175,500
2 1,056,500 1,056,500
3 949,400 949,400
4 852,900 852,900
5 766,100 766,100
6 728,400 728,400
7 728,400 728,400
8 - 14 728,400 788,100
15 - 25 936,200 992,200
The harvest rate shows an improvement of 8% beginning in the eighth period and throughout the remainder of the mid term. In the long term the harvest is able to increase 6% over the Base Case level as the harvest is composed mainly of managed stands. This improvement to the harvest level demonstrates the importance of having reliable information for input to TIPSY for estimating managed stand yields. Figure 7.14 displays the harvest for the OAF-1 sensitivity analysis in graphic form.
0
200,000
400,000
600,000
800,000
1,000,000
1,200,000
1,400,000
10 30 50 70 90 110 130 150 170 190 210 230 250Year
Vol
ume
(m3/
yr)
EBM Base Case
TIPSY 8% OAF-1
Figure 7.14 – Apply 8% OAF-1 in TIPSY yields annual harvest
Kingcome TSA TSR 3 Analysis Report
Kingcome Licensee-Agency Group 72
7.6 Forest Cover Constraints
A number of sensitivity analyses were completed to evaluate the impact of forest cover constraints on the timber supply. Green-up in both visually sensitive areas and other disturbance zones were reviewed. In the analysis, green-up is modelled based on height for the majority of the zones. Therefore the height increase or decrease over a five-year period, based on average stand growth, was applied to the zones being evaluated in the sensitivity analysis.
7.6.1 Increase & decrease Green-up Ages in Visually Sensitive Areas
Green-up ages were adjusted five years from the Base Case assumptions for visually sensitive areas in these sensitivity analyses. Table 7.14 summarizes the harvest schedule results.
Table 7.14 – Increase & decrease green-up ages in visually sensitive areas annual harvest
Annual Harvest by Scenario (m3/year) Period
Base Case Decrease Visual Green-up 5 Years
Increase Visual Green-up 5 Years
1 1,175,500 1,175,500 1,175,500
2 1,056,500 1,056,500 1,056,500
3 949,400 949,400 949,400
4 852,900 852,900 852,900
5 766,100 764,600 766,100
6 - 14 728,400 764,600 712,400
15 - 25 936,200 943,200 936,200
Results show that there is no change in the short-term annual harvest with sensitivity analyses for green-up in visually sensitive areas. The short-term harvest is the same as that developed for the Base Case. Reducing green-up by five years allows the mid-term harvest to increase by approximately 5%, with a minor 1% increase in the long term. Increasing green-up by five years reduces the mid-term harvest by less than approximately 2%, with no change in the long-term level
It is important to note that at various times throughout the planning horizon, a number of visually sensitive areas reach the disturbance limit and restrict harvesting. The five-year adjustment does not show a significant impact because many of the managed stands are achieving rapid height increment and these stands are reaching minimum green-up height within the same modelling period as the Base Case. In addition, visually sensitive areas represent only about 21% of the THLB.
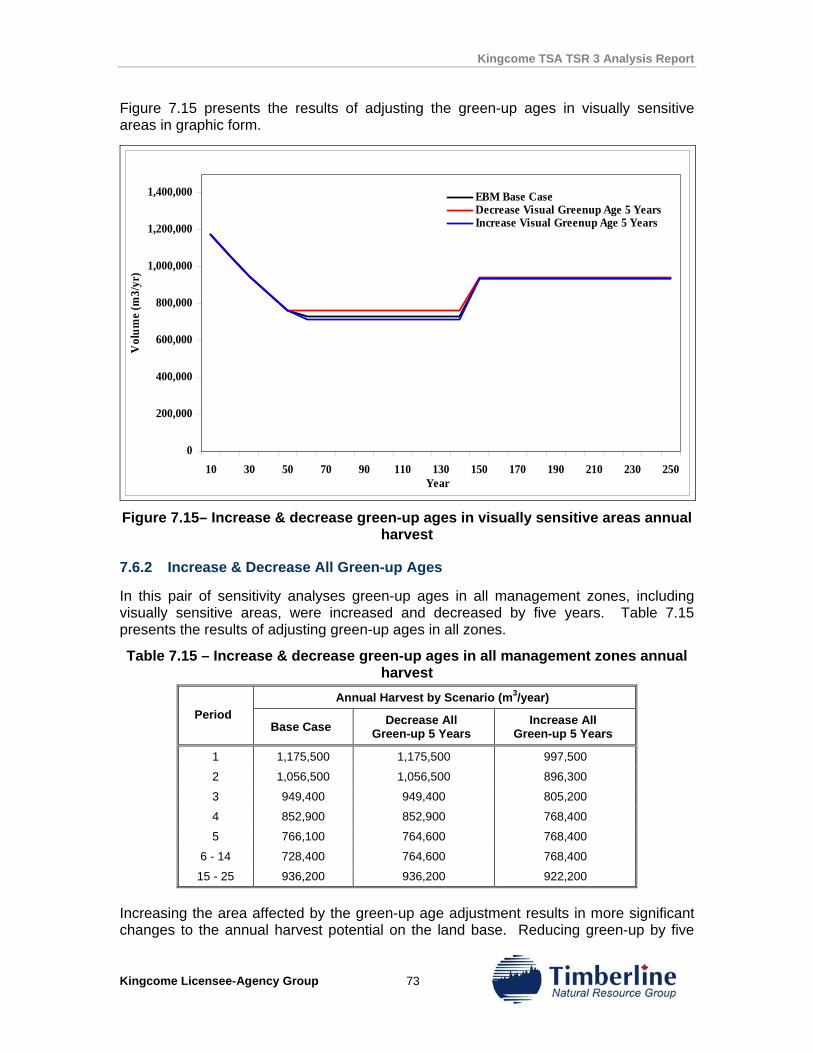
Kingcome TSA TSR 3 Analysis Report
Kingcome Licensee-Agency Group 73
Figure 7.15 presents the results of adjusting the green-up ages in visually sensitive areas in graphic form.
0
200,000
400,000
600,000
800,000
1,000,000
1,200,000
1,400,000
10 30 50 70 90 110 130 150 170 190 210 230 250Year
Vol
ume
(m3/
yr)
EBM Base CaseDecrease Visual Greenup Age 5 YearsIncrease Visual Greenup Age 5 Years
Figure 7.15– Increase & decrease green-up ages in visually sensitive areas annual
harvest
7.6.2 Increase & Decrease All Green-up Ages
In this pair of sensitivity analyses green-up ages in all management zones, including visually sensitive areas, were increased and decreased by five years. Table 7.15 presents the results of adjusting green-up ages in all zones.
Table 7.15 – Increase & decrease green-up ages in all management zones annual harvest
Annual Harvest by Scenario (m3/year) Period
Base Case Decrease All Green-up 5 Years
Increase All Green-up 5 Years
1 1,175,500 1,175,500 997,500
2 1,056,500 1,056,500 896,300
3 949,400 949,400 805,200
4 852,900 852,900 768,400
5 766,100 764,600 768,400
6 - 14 728,400 764,600 768,400
15 - 25 936,200 936,200 922,200
Increasing the area affected by the green-up age adjustment results in more significant changes to the annual harvest potential on the land base. Reducing green-up by five
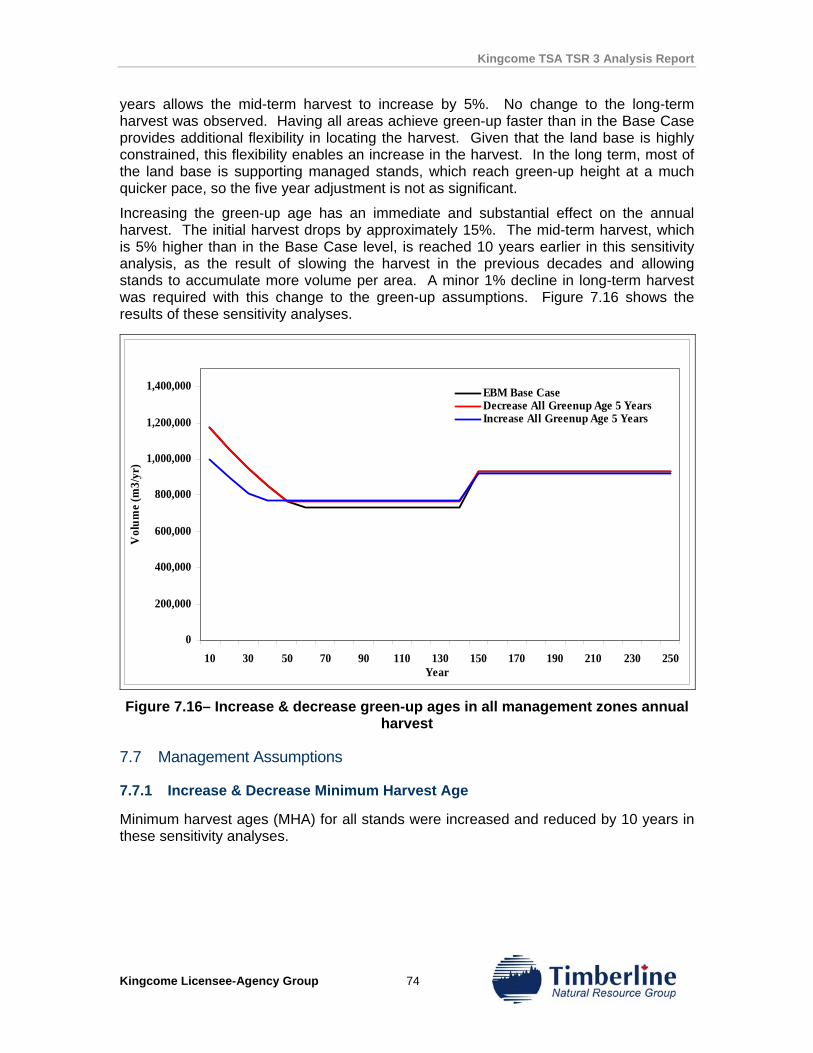
Kingcome TSA TSR 3 Analysis Report
Kingcome Licensee-Agency Group 74
years allows the mid-term harvest to increase by 5%. No change to the long-term harvest was observed. Having all areas achieve green-up faster than in the Base Case provides additional flexibility in locating the harvest. Given that the land base is highly constrained, this flexibility enables an increase in the harvest. In the long term, most of the land base is supporting managed stands, which reach green-up height at a much quicker pace, so the five year adjustment is not as significant.
Increasing the green-up age has an immediate and substantial effect on the annual harvest. The initial harvest drops by approximately 15%. The mid-term harvest, which is 5% higher than in the Base Case level, is reached 10 years earlier in this sensitivity analysis, as the result of slowing the harvest in the previous decades and allowing stands to accumulate more volume per area. A minor 1% decline in long-term harvest was required with this change to the green-up assumptions. Figure 7.16 shows the results of these sensitivity analyses.
0
200,000
400,000
600,000
800,000
1,000,000
1,200,000
1,400,000
10 30 50 70 90 110 130 150 170 190 210 230 250Year
Vol
ume
(m3/
yr)
EBM Base CaseDecrease All Greenup Age 5 YearsIncrease All Greenup Age 5 Years
Figure 7.16– Increase & decrease green-up ages in all management zones annual
harvest
7.7 Management Assumptions
7.7.1 Increase & Decrease Minimum Harvest Age
Minimum harvest ages (MHA) for all stands were increased and reduced by 10 years in these sensitivity analyses.
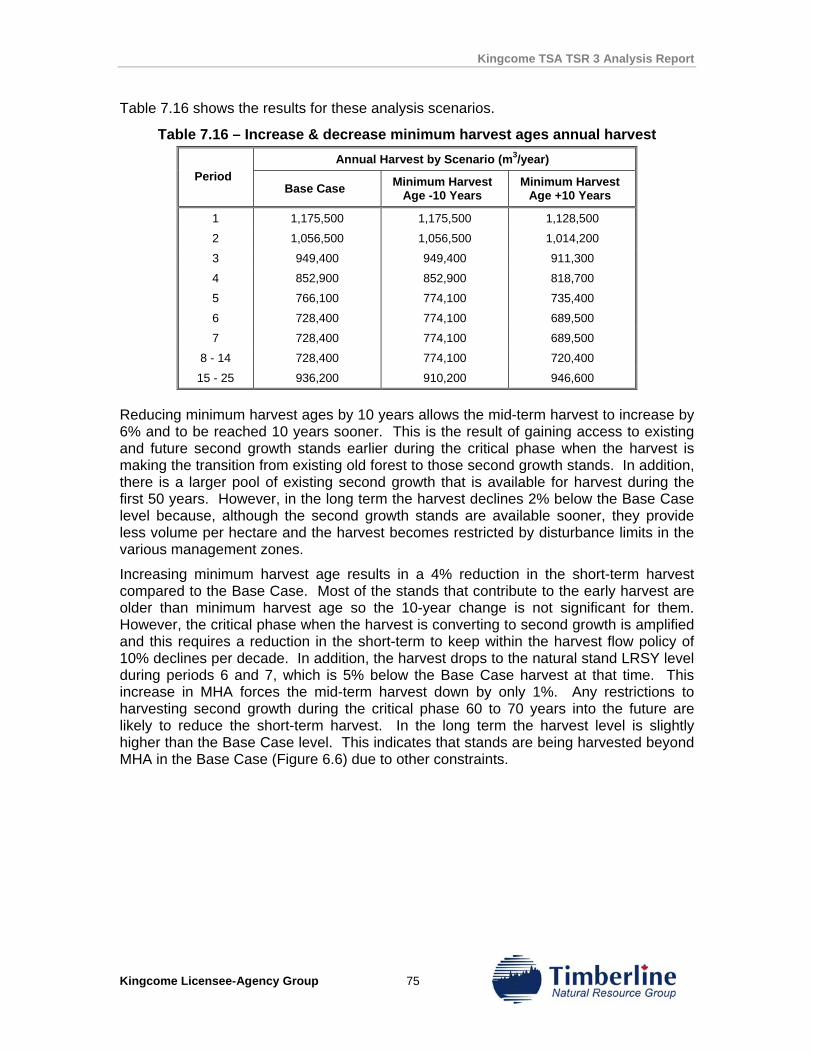
Kingcome TSA TSR 3 Analysis Report
Kingcome Licensee-Agency Group 75
Table 7.16 shows the results for these analysis scenarios.
Table 7.16 – Increase & decrease minimum harvest ages annual harvest Annual Harvest by Scenario (m3/year)
Period Base Case Minimum Harvest
Age -10 Years Minimum Harvest
Age +10 Years
1 1,175,500 1,175,500 1,128,500
2 1,056,500 1,056,500 1,014,200
3 949,400 949,400 911,300
4 852,900 852,900 818,700
5 766,100 774,100 735,400
6 728,400 774,100 689,500
7 728,400 774,100 689,500
8 - 14 728,400 774,100 720,400
15 - 25 936,200 910,200 946,600
Reducing minimum harvest ages by 10 years allows the mid-term harvest to increase by 6% and to be reached 10 years sooner. This is the result of gaining access to existing and future second growth stands earlier during the critical phase when the harvest is making the transition from existing old forest to those second growth stands. In addition, there is a larger pool of existing second growth that is available for harvest during the first 50 years. However, in the long term the harvest declines 2% below the Base Case level because, although the second growth stands are available sooner, they provide less volume per hectare and the harvest becomes restricted by disturbance limits in the various management zones.
Increasing minimum harvest age results in a 4% reduction in the short-term harvest compared to the Base Case. Most of the stands that contribute to the early harvest are older than minimum harvest age so the 10-year change is not significant for them. However, the critical phase when the harvest is converting to second growth is amplified and this requires a reduction in the short-term to keep within the harvest flow policy of 10% declines per decade. In addition, the harvest drops to the natural stand LRSY level during periods 6 and 7, which is 5% below the Base Case harvest at that time. This increase in MHA forces the mid-term harvest down by only 1%. Any restrictions to harvesting second growth during the critical phase 60 to 70 years into the future are likely to reduce the short-term harvest. In the long term the harvest level is slightly higher than the Base Case level. This indicates that stands are being harvested beyond MHA in the Base Case (Figure 6.6) due to other constraints.
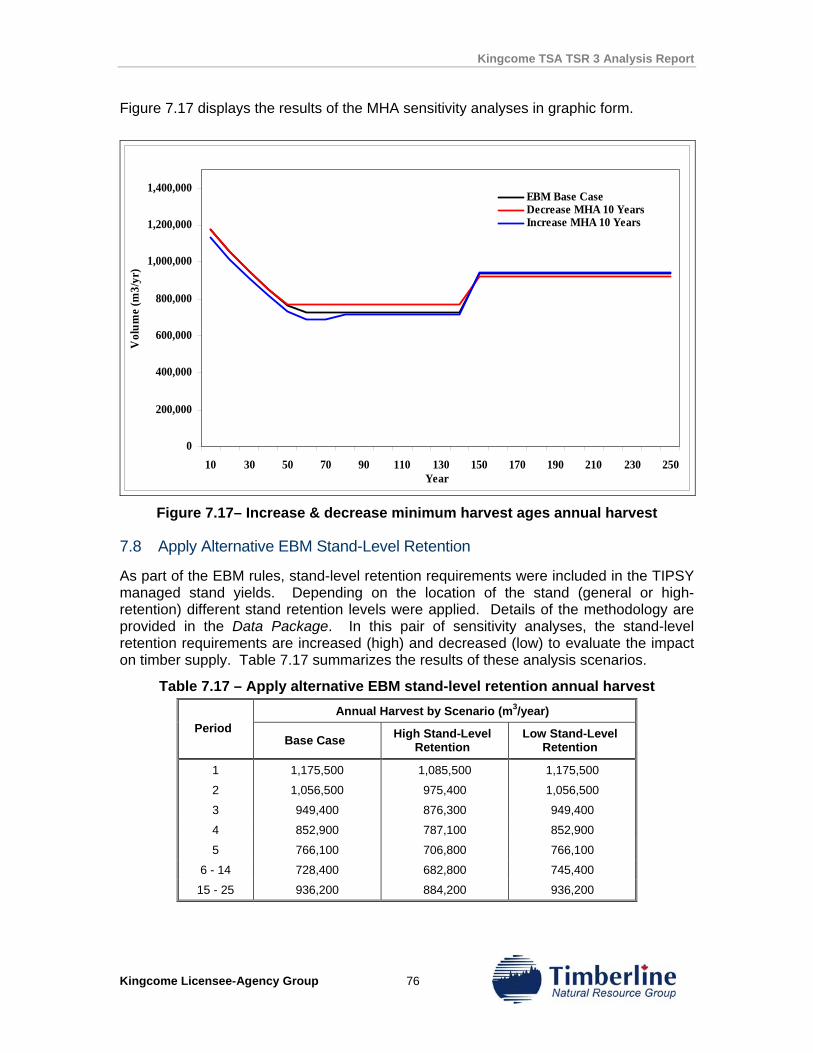
Kingcome TSA TSR 3 Analysis Report
Kingcome Licensee-Agency Group 76
Figure 7.17 displays the results of the MHA sensitivity analyses in graphic form.
0
200,000
400,000
600,000
800,000
1,000,000
1,200,000
1,400,000
10 30 50 70 90 110 130 150 170 190 210 230 250Year
Vol
ume
(m3/
yr)
EBM Base CaseDecrease MHA 10 YearsIncrease MHA 10 Years
Figure 7.17– Increase & decrease minimum harvest ages annual harvest
7.8 Apply Alternative EBM Stand-Level Retention
As part of the EBM rules, stand-level retention requirements were included in the TIPSY managed stand yields. Depending on the location of the stand (general or high-retention) different stand retention levels were applied. Details of the methodology are provided in the Data Package. In this pair of sensitivity analyses, the stand-level retention requirements are increased (high) and decreased (low) to evaluate the impact on timber supply. Table 7.17 summarizes the results of these analysis scenarios.
Table 7.17 – Apply alternative EBM stand-level retention annual harvest Annual Harvest by Scenario (m3/year)
Period Base Case High Stand-Level
Retention Low Stand-Level
Retention
1 1,175,500 1,085,500 1,175,500
2 1,056,500 975,400 1,056,500
3 949,400 876,300 949,400
4 852,900 787,100 852,900
5 766,100 706,800 766,100
6 - 14 728,400 682,800 745,400
15 - 25 936,200 884,200 936,200
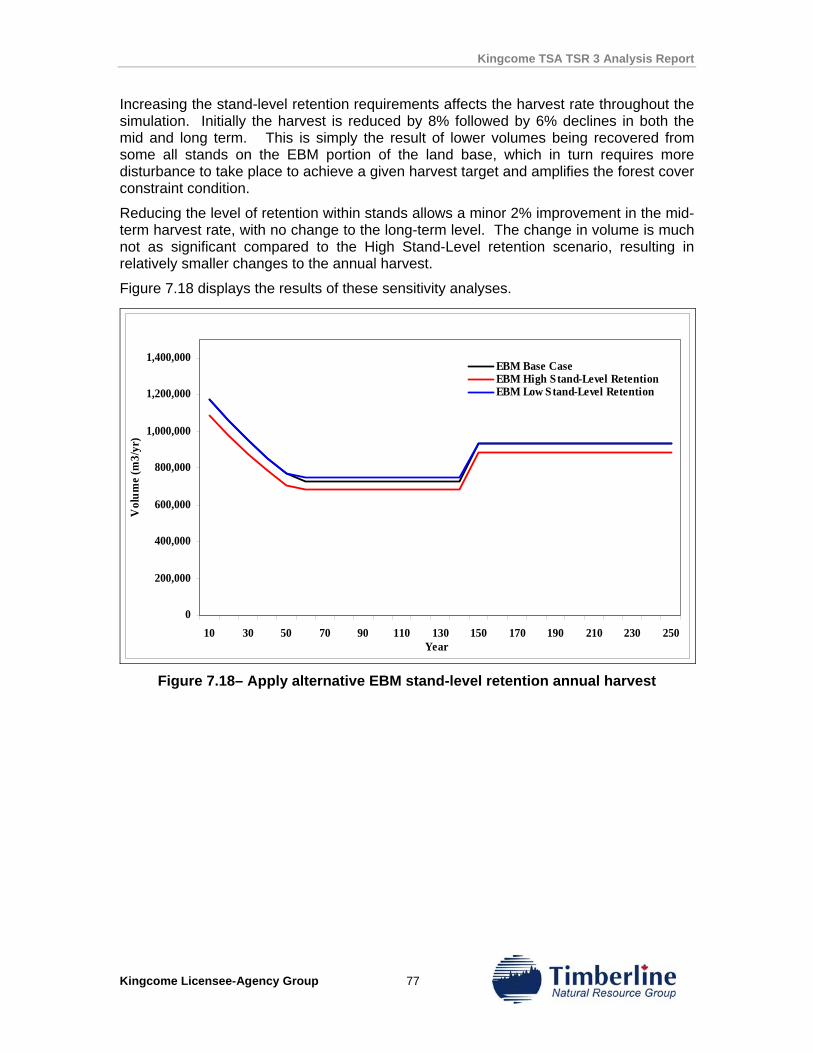
Kingcome TSA TSR 3 Analysis Report
Kingcome Licensee-Agency Group 77
Increasing the stand-level retention requirements affects the harvest rate throughout the simulation. Initially the harvest is reduced by 8% followed by 6% declines in both the mid and long term. This is simply the result of lower volumes being recovered from some all stands on the EBM portion of the land base, which in turn requires more disturbance to take place to achieve a given harvest target and amplifies the forest cover constraint condition.
Reducing the level of retention within stands allows a minor 2% improvement in the mid-term harvest rate, with no change to the long-term level. The change in volume is much not as significant compared to the High Stand-Level retention scenario, resulting in relatively smaller changes to the annual harvest.
Figure 7.18 displays the results of these sensitivity analyses.
0
200,000
400,000
600,000
800,000
1,000,000
1,200,000
1,400,000
10 30 50 70 90 110 130 150 170 190 210 230 250Year
Vol
ume
(m3/
yr)
EBM Base CaseEBM High Stand-Level RetentionEBM Low Stand-Level Retention
Figure 7.18– Apply alternative EBM stand-level retention annual harvest
Kingcome TSA TSR 3 Analysis Report
Kingcome Licensee-Agency Group 78
8.0 DISCUSSION
The initial harvest developed for the Base Case is within 5% of the current AAC. Earlier in this document it was noted that several opportunities to increase the short-term harvest rate in sensitivity analysis were not exercised. The discussion that follows highlights several areas where there are likely downward pressures on both short and longer-term harvest rates. Once these issues have been explored in more detail increased harvest opportunity should be evaluated.
8.1 Proposed AAC
Results of the timber supply analysis for the Kingcome TSA indicate that a harvest level of 1,175,500 m3/year can be maintained over the next 10 years. Included in the annual harvest is some contribution of volume from second growth stands (277,000 m3/year), deciduous stands (6,400 m3/year)11, and marginal forest types (75,000 m3/year). Additional deciduous volume is present in the TSA, however, much of this volume is unavailable due to EBM specific constraints (land base withdrawal, and forest cover constraints). Beyond 10 years, there are declines of approximately 10% per decade until the mid-term harvest of 728,400 m3/year is reached at year 61 of the planning horizon. The long-term harvest level of 936,200 m3/year begins in the 15th decade after the majority of natural forest have been converted into managed stands and is maintained for the remainder of the 250-years modelled in the analysis.
Relative to TSR2 the AAC proposed in this analysis suggests that EBM, the land base removals associated with EBM and the land base removals for new parks, conservancies, and biodiversity areas have reduced the initial harvest by 6%. Conversely, the Pre-EBM forecast included in this report, which incorporates the revised operability, suggests that the impact from EBM specific management objectives is 16%. The impact since TSR1, which predates the LRMP and EBM is the same, 16%. Preliminary analysis of the productive land base now unavailable for harvesting12 suggests that the cumulative impact of EBM and the land base removals likely exceeds the 16% reported here.
Collectively most sensitivities indicate that 1,175,500 m3/year is an acceptable harvest rate for the first decade. Sensitivities that reduce the land base or roll back yield expectations realize obvious and expected results; harvest levels decline. However, since the last TSR considerable effort has been invested in collecting new data sets to increase the level of confidence in modelling inputs and analysis results. Since the last TSR considerable operational data has also been collected which supports the assumptions modelled in the analysis.
11 A deciduous volume of 6,400 m3/yr (primarily alder) is supported by the “EBM” contributing land base. Additional deciduous volume is estimated in the Pre-EBM scenario. The pre-EBM scenario should be used to , evaluate deciduous harvest volumes based on exceptions for deciduous licenses. 12 Table 4.2 identifies 99,033 hectares of productive forest in parks, conservancies and biodiversity areas. Remaining land base statistics suggest that approximately 40% of this area is THLB which, based on a managed forest MAI of 5.3 m3/yr would support and additional 210,000 m3/yr harvest. This volume is not measured or reported on in this analysis.
Kingcome TSA TSR 3 Analysis Report
Kingcome Licensee-Agency Group 79
8.2 Economic Operability
A specific example of where base information has been greatly improved upon is the economic operability data overlay. Presently in the Base Case the economic operability profit threshold is set at $-10. While this may seem counter intuitive it is in fact conservative; permit blending, reduced logging costs and incidental development of stands make the single stand economic model difficult to intuitively calibrate. In future a THLB classification system that does not report on dollars may resolve this idiosyncrasy. Even at this threshold many good and medium site hemlock sands are still excluded. This is a market/species specific pressure and should be monitored between now and the next TSR to ensure that the size of the contributing land base and associated harvest level has not been underestimated. The exclusion of good and medium sites suggests that there may in fact be an underestimation.
8.3 Second Growth Volumes
The Base Case harvest forecast for this analysis includes a conservative harvest rate of second growth timber harvest, a harvest rate which is based on minimum harvest rates and an upper limit which steps down in conjunction with the total harvest. Unconstrained sensitivity runs indicate that the volume of second growth that meets the minimum harvest age criterion in the first decade far exceeds that which is harvested. In period one the harvest is constrained to 277,000 m3/year, unconstrained this increases to 384,228 m3/year. As expected this unconstrained harvest does have consequences in other periods. However, the sensitivity analysis demonstrates that additional harvest opportunities in second growth exist and may provide important volume over the next few decades. In addition, the long-term harvest level is improved slightly by an increase in second growth harvest in the short term.
When second growth harvesting is constrained to 150,000 m3/year the cut during decades one through five is negatively impacted and the long term is unaffected. This confirms that second growth is a critical part of the short-term harvest and requires thorough evaluation. Both economics of scale with respect to operational capacity and Ministerial direction indicate that the volume of second growth available now should be significant. Modelling suggests that in as little as 60 years second growth will dominate the harvest profile in the TSA.
8.4 Deciduous Volume
Deciduous harvest in the Base Case is well below the current harvest levels for this inventory group. However, given that hardwood tenures are exempt from EBM rules, it is more realistic to estimate the timber supply from the Pre-EBM scenario, in which alder harvest is maintained at 25,000 m3/year for the next 40 years and cottonwood maintains 5,000 m3/year for the next 70 years. Consistent with the Coastal Forest Action Plan the analysis presented here included management of 6,211 hectares of alder and 653 hectares of cottonwood stands.
8.5 Operational Adjustment Factors (OAFs)
Sensitivities run on OAF-1 conclude the obvious; reducing OAF-1 increases managed stand yields, and subsequently increases the harvest over the entire planning horizon, especially in the mid and long term.
Kingcome TSA TSR 3 Analysis Report
Kingcome Licensee-Agency Group 80
There are two types of OAFs used in TIPSY. Historically the values used have been 15% for OAF-1 and 5% for OAF-2. OAF-1 is intended to address stocking gaps that traditionally have been unmappable such as rock outcrops, non commercial cover, and other small non-productive areas. OAF-2 is meant to address decay, waste and breakage, losses due to forest health and random risk factors.
The combination is a net down of 20% on managed stand yields. The actual reduction necessary to approximate the yield of the averaged managed stand is not measured and current defaults are conservative in order to account for unknowns that are difficult to quantify. The Morice & Lakes Innovative Forest Practices Agreement (IFPA) OAF1 analysis (McCulloch and Bance, 200313) showed that none of the site series surveyed exceeded an OAF1 of 14% and that in most cases OAF-1 was less than 5%. Therefore, the recommendations of the study suggested 5% value for OAF-1. Where the OAF-1 values were above 5%, the site series associated with these trends were the wetter poorer sites at the bottom of the edatopic grid. In the Kingcome TSA these sites are associated with red listed ecosystems that are now removed from the timber harvesting land base due to the South Central Coast Ministerial Order.
Consequently, it is possible that traditional OAF values are excessive and therefore represent a downward pressure on the potential harvest volume. Additional research in the TSA is required to confirm this hypothesis and this issue should be investigated prior to the next TSR. Reducing OAF-1 from 15% to 8% results in a long-term harvest increase of 6%.
8.6 Terrestrial Ecosystem Mapping (TEM)
Full implementation of EBM requires specific inventories to accurately and meaningfully manage ecosystems. TEM is a cornerstone inventory required for full implementation of EBM. Until such time as TEM is available, management and analysis is limited to using Site Series Surrogates (SSS) that were developed during the LRMP to quantify the land base. These surrogates are productivity class based and do not mimic ecosystems mapping well. Furthermore, these surrogates create administrative rarity based on abundance of the species site class groupings in the Plan area. Consequently, it is likely that the old seral requirements based on SSS are overstated and result in a depressed timber supply.
TEM mapping will also greatly improve management of red and blue listed ecosystems; however, the CDC Blue List will also have to be updated to accurately address rare ecosystems listed in the intent of the South Central Coast Order. Presently there are Blue Listed ecosystems in the CDC list that are actually abundant on the coast.
A concerted effort is immediately required to marshal energy and resources towards acquiring this pivotal management data set. This effort should be implemented prior to any additional analysis on the land base to aid in establishing baselines, objectives and thresholds related to EBM.
8.7 Operational Issues
Road width assumptions used in this analysis are based on a uniform 14-meter disturbance and, consequently form a non-contributing land base netdown for future 13 Operational adjustment factor (1) analysis for the Bulkley, Morice and Lakes Timber Supply Areas / Larry McCulloch and Bryan Bance. (http://www.for.gov.bc.ca/hfd/library/FIA/2003/FIA-03-04-0121.pdf)
Kingcome TSA TSR 3 Analysis Report
Kingcome Licensee-Agency Group 81
stands. There is concern from operational practitioners that the road widths utilized in the analysis may be too high. Thus the assumptions regarding existing and future roads could possibly overstate the impact on the productive land base placing downward pressure on harvest rates. It is recommended by the licensee group that this topic be thoroughly researched prior to the next TSR.
Additional concerns have been raised from operational staff regarding riparian management area (RMA) netdowns. Since RMA management is prescriptive in nature and no current data exists to assess impacts of RMA activities, netdown estimates were used. In this analysis there was the added advantage of additional spatial data for streams. As a result, it was possible to identify riparian management zones with greater certainly. However, concern has been raised over the assumptions used in the analysis. Consequently, this reduction may not be accurate and should be investigated to determine if that is the case.
8.8 Conclusions
The discussion above highlights several areas where improvement in measurement and inventories is required to continue improving the reliability of the timber supply prediction for the TSA. A number of uncertainties related to inventory and managed stand productivity have been addressed through additional studies since the completion of TSR2. These increase confidence in the results and confirm the results of sensitivity analysis in conducted in previous analyses.
The analysis data set excluded a number of sliver polygons, reducing the THLB by 3,025 hectares (1.6%). This indicates that the harvest estimates provided in this report may be conservative. It also demonstrates the importance of developing reliable inventories and data sets for use in timber supply analysis. The uncertainty around harvested lands and missing information in the VRI point to examples of areas where information can be improved for future analyses on the Kingcome TSA.
The analysis has recognized the current implementation of EBM for the TSA, and has accounted for the non-timber objectives associated with this initiative. Based on the results of the Base Case and sensitivity analyses conducted, the results of the analysis support a harvest of 1,175,500 m3/year for the next five years on the Kingcome TSA.
Kingcome TSA TSR 3 Analysis Report
Kingcome Licensee-Agency Group 82
9.0 REFERENCES
B.C. Ministry of Agriculture and Lands. 2007. South Central Coast Order.
B.C. Ministry of Forests. 1995. Riparian Management Area Guidebook.
B.C. Ministry of Forests. 1999. Landscape Unit Planning Guide.
B.C. Ministry of Forests. 2001. Timber supply review, Kingcome Timber Supply Area Analysis Report. Timber Supply Branch.
B.C. Ministry of Forests. 2002. Kingcome Timber Supply Area, Rationale for Allowable Annual Cut (AAC) determination.
B.C. Ministry of Forests. 2003a. DFAM interim standards for Data Package preparation and timber supply analysis. Timber Supply Branch.
B.C. Ministry of Forests. 2003b. Modelling options for disturbance of areas outside the timber harvesting land base. Draft working paper. Forest Analysis Branch.
B.C. Ministry of Forests. 2003c. Supplemental guide for preparing the timber supply analysis package. Forest Analysis Branch.
B.C. Ministry of Forests. 2003d Harvest flow considerations for the timber supply review. Draft working paper. Forest Analysis Branch.
B.C. Ministry of Forests. 2004. Vegetation Resources Inventory, Procedures and Standards for Data Analysis Attribute Adjustment and Implementation of Adjustment in a Corporate Database, Unpublished Report.
Chatwin, T and M. Mather. 2007. Background document to accompany BC coastal marbled murrelet habitat suitability maps. Marbled murrelet habitat recovery implementation group.
Coast Region FRPA Implementation Team (CRIT) Silviculture Committee. 2008. Hardwood management in the Coast Forest Region, Unpublished Draft Report.
J.S. Thrower & Associates. 2005. Kingcome Timber Supply Area, Vegetation Resources Inventory, Statistical Adjustment.
Timberline Forest Inventory Consultants. 2006. Kingcome TSA Economic Operability Assessment.
Timberline Natural Resource Group. 2007a. Site Index Adjustment of the Kingcome TSA. Report prepared for I.Robertson on behalf of TSA licensees, by TNRG.
Timberline Natural Resource Group. 2007b. Methods Used to Model Ecosystem Based Management in the Kingcome TSA for Timber Supply Review 3.
Kingcome TSA TSR 3 Analysis Report
Kingcome Licensee-Agency Group 83
GLOSSARY
Allowable annual cut (AAC) The rate of timber harvest permitted each year from a specified area of land, usually expressed as cubic meters of wood per year.
Analysis unit A grouping of types of forest — for example, by species, site productivity, silvicultural treatment, age, and or location — done to simplify analysis and generation of timber yield tables.
Base case harvest forecast The timber supply forecast which illustrates the effect of current forest management practices on the timber supply using the best available information, and which forms the reference point for sensitivity analysis.
Basic sector Sectors of the economy, such as forestry, tourism and mining, which create flows of income into the region and are assumed to be drivers of the local economy. Non-basic sectors, such as retail outlets, are supported by basic sectors.
Biodiversity (biological diversity) The diversity of plants, animals and other living organisms in all their forms and levels of organization, including the diversity of genes, species and ecosystems, as well as the evolutionary and functional processes that link them.
Biogeoclimatic (BEC) variant A subdivision of a biogeoclimatic subzone. Variants reflect further differences in regional climate and are generally recognized for areas slightly drier, wetter, snowier, warmer or colder than other areas in the subzone.
Biogeoclimatic zones A large geographic area with broadly homogeneous climate and similar dominant tree species.
Coniferous Coniferous trees have needles or scale-like leaves and are usually 'evergreen'.
Cutblock A specific area, with defined boundaries, authorized for harvest.
Cutblock adjacency The desired spatial relationship among cutblocks. Most adjacency restrictions require that recently harvested areas must achieve a desired condition (green-up) before nearby or adjacent areas can be harvested. Specifications for the maximum allowable proportion of a forested landscape that does not meet green-up requirements are used to approximate the timber supply impacts of adjacency restrictions.
Kingcome TSA TSR 3 Analysis Report
Kingcome Licensee-Agency Group 84
Deciduous Deciduous trees shed their leaves annually and commonly have broad-leaves.
Ecosystem Based Management (EBM) An adaptive approach to managing human
activities that seeks to ensure the coexistence of healthy, fully functioning ecosystems and human communities. The intent is to maintain those spatial and temporal characteristics of ecosystems such that component species and ecological processes can be sustained, and human wellbeing supported and improved.
Employment coefficient The number of person-years of employment supported by every 1,000 cubic meters of timber harvested; for example, a coefficient of 1.0 indicates that every 1,000 cubic meters harvested supports one person-year, or 500,000 cubic meters supports 500 person-years.
Employment multiplier An estimate of the total employment supported by each direct job, for example a multiplier of 2.0 means that one direct job supports one additional indirect and induced job.
Environmentally sensitive areas Areas with significant non-timber values, fragile or (ESA) unstable soils, impediments to establishing a new
tree crop, or high risk of avalanches.
Forest cover objectives Specify desired distributions of areas by age or size class groupings. These objectives can be used to reflect desired conditions for wildlife, watershed protection, visual quality and other integrated resource management objectives. General adjacency and green-up guidelines are also specified using forest cover objectives (see Cutblock adjacency and Green–up).
Forest inventory An assessment of British Columbia's timber resources. It includes computerized maps, a database describing the location and nature of forest cover, including size, age, timber volume, and species composition, and a description of other forest values such as recreation and visual quality.
Forest Practices Code Legislation, standards and guidebooks that govern forest practices and planning, with a focus on ensuring management for all forest values.
Forest type The classification or label given to a forest stand, usually based on its tree species composition. Pure spruce stands and spruce-balsam mixed stands are two examples.
Kingcome TSA TSR 3 Analysis Report
Kingcome Licensee-Agency Group 85
Free-growing An established seedling of an acceptable commercial species that is free from growth-inhibiting brush, weed and excessive tree competition.
Green-up The time needed after harvesting for a stand of trees to reach a desired condition (usually a specific height) — to ensure maintenance of water quality, wildlife habitat, soil stability or aesthetics — before harvesting is permitted in adjacent areas.
Growing stock The volume estimate for all standing timber at a particular time.
Harvest forecast The flow of potential timber harvests over time. A harvest forecast is usually a measure of the maximum timber supply that can be realized over time for a specified land base and set of management practices. It is a result of forest planning models and is affected by the size and productivity of the land base, the current growing stock, and management objectives, constraints and assumptions.
Higher level plans Higher level plans establish the broader, strategic context for operational plans, providing objectives that determine the mix of forest resources to be managed in a given area.
Indirect and induced jobs Indirect jobs are supported by direct business purchases of goods and services. Induced jobs are supported by employee purchases of goods and services; for example, at retail outlets.
Inoperable areas Areas defined as unavailable for harvest for terrain-related or economic reasons. Operability can change over time as a function of changing harvesting technology and economics.
Integrated resource management (IRM) The identification and consideration of all resource
values, including social, economic and environmental needs, in resource planning and decision-making.
Landscape-level biodiversity The Landscape Unit Planning Guide provides objectives for maintaining biodiversity at both the landscape level and the stand level. At the landscape level, guidelines are provided for the maintenance of seral stage distribution, patch size distribution and landscape connectivity.
Kingcome TSA TSR 3 Analysis Report
Kingcome Licensee-Agency Group 86
Landscape unit A planning area based on topographic or geographic features, that is appropriately sized (up to 100 000 hectares), and designed for application of landscape-level biodiversity objectives.
Long-term harvest level A harvest level that can be maintained indefinitely given a particular forest management regime (which defines the timber harvesting land base, and objectives and guidelines for non-timber values) and estimates of timber growth and yield.
Mature seral Forest stands with trees between 80 and 120 years old, depending on species, site conditions and biogeoclimatic zone.
Management assumptions Approximations of management objectives, priorities, constraints and other conditions needed to represent forest management actions in a forest planning model. These include, for example, the criteria for determining the timber harvesting land base, the specification of minimum harvestable ages, utilization levels, integrated resource guidelines and silviculture and pest management programs.
Mean annual increment (MAI) Stand volume divided by stand age. The age at which average stand growth, or MAI, reaches its maximum is called the culmination age (CMAI). Harvesting all stands at this age results in a maximum average harvest over the long term.
Minimum harvestable age (MHA) The age at which a stand of trees is expected to achieve a merchantable condition. The minimum harvestable age could be defined based on maximize average productivity (culmination of mean annual increment), minimum stand volume, or product objectives (usually related to average tree diameter).
Model An abstraction and simplification of reality constructed to help understand an actual system or problem. Forest managers and planners have made extensive use of models, such as maps, classification systems and yield projections, to help direct management activities.
Natural disturbance type (NDT) An area that is characterized by a natural disturbance regime, such as wildfires, which affects the natural distribution of seral stages. For example areas subject to less frequent stand-initiating disturbances usually have more older forests.
Kingcome TSA TSR 3 Analysis Report
Kingcome Licensee-Agency Group 87
Not satisfactorily restocked (NSR) An area not covered by a sufficient number of
well-spaced trees of desirable species. Stocking standards are set by the B.C. Forest Service. Areas harvested prior to October 1987 and not yet sufficiently stocked according to standards are classified as backlog NSR. Areas harvested or otherwise disturbed since October 1987 are classified as current NSR.
Operational Adjustment Factor (OAF) OAF1 and OAF2 are TIPSY input parameters that
reduce predicted yield to account for factors such as non-productive areas within stands, disease and insects, non-commercial cover, stocking gaps, decay, waste, and breakage.
Operability Classification of an area considered available for timber harvesting. Operability is determined using the terrain characteristics of the area as well as the quality and quantity of timber on the area.
Person-year(s) One person working the equivalent of one full year, defined as at least 180 days of work. Someone working full-time for 90 days accounts for 0.5 person-years.
Protected area A designation for areas of land and water set aside to protect natural heritage, cultural heritage or recreational values (may include national park, provincial park, or ecological reserve designations).
Riparian area Areas of land adjacent to wetlands or bodies of water such as swamps, streams, rivers or lakes.
Scenic area Any visually sensitive area or scenic landscape identified through a visual landscape inventory or planning process carried out or approved by a district manager.
Sensitivity analysis A process used to examine how uncertainties about data and management practices could affect timber supply. Inputs to an analysis are changed, and the results are compared to a baseline or base case.
Seral stages Sequential stages in the development of plant communities that successively occupy a site and replace each other over time.
Kingcome TSA TSR 3 Analysis Report
Kingcome Licensee-Agency Group 88
Site index A measure of site productivity. The indices are reported as the average height, in meters, that the tallest trees in a stand are expected to achieve at 50 years (age is measured at 1.3 meters above the ground). Site index curves have been developed for British Columbia's major commercial tree species.
Stand-level biodiversity A stand is a relatively localized and homogeneous land unit that can be managed using a single set of treatments. In stands, objectives for biodiversity are met by maintaining specified stand structure (wildlife trees or patches), vegetation species composition and coarse woody debris levels.
Stocking The proportion of an area occupied by trees, measured by the degree to which the crowns of adjacent trees touch, and the number of trees per hectare.
Table Interpolation Program for Stand Yields (TIPSY) A B.C. Forest Service computer program used to
generate yield projections for managed stands based on interpolating from yield tables of a model (TASS) that simulates the growth of individual trees based on internal growth processes, crown competition, environmental factors and silvicultural practices.
Timber harvesting land base Crown forest land within the timber supply area where timber harvesting is considered both acceptable and economically feasible, given objectives for all relevant forest values, existing timber quality, market values and applicable technology.
Timber supply The amount of timber that is forecast to be available for harvesting over a specified time period, under a particular management regime.
Timber supply area (TSA) An integrated resource management unit established in accordance with Section 7 of the Forest Act.
Tree farm license (TFL) Provides rights to harvest timber, and outlines responsibilities for forest management, in a particular area.
Ungulate A hoofed herbivore, such as deer.
Unsalvaged losses The volume of timber killed or damaged annually by natural causes (e.g., fire, wind, insects and disease) that is not harvested.
Kingcome TSA TSR 3 Analysis Report
Kingcome Licensee-Agency Group 89
Variable Density Yield Prediction Model (VDYP) An empirical yield prediction system supported by
the Ministry of Sustainable Resource Management, designed to predict average yields and provide forest inventory updates over large areas (i.e., Timber Supply Areas). It is intended for use in unmanaged natural stands of pure or mixed species composition.
Vegetation Resources Inventory (VRI) An assessment of British Columbia's vegetation
resources. It includes computerized maps, a database describing the location and nature of forest information, including timber size, stand age, timber volume, tree species composition, and shrub, herb, and bryoid information. It replaces the older forest inventory.
Visual quality objective (VQO) Defines a level of acceptable landscape alteration resulting from timber harvesting and other activities. A number of visual quality classes have been defined on the basis of the maximum amount of alteration permitted.
Volume estimates Estimates of yields from forest stands over time. Yield projections can be developed for stand volume, stand diameter or specific products, and for empirical (average stocking), normal (optimal stocking) or managed stands.
Yield projections See volume estimates
Watershed An area drained by a stream or river. A large watershed may contain several smaller watersheds.
Wildlife tree A standing live or dead tree with special characteristics that provide valuable habitat for conservation or enhancement of wildlife.
Woodlot licence An agreement entered into under the Forest Act. It allows for small-scale forestry to be practised in a described area (Crown and private) on a sustained yield basis.
Kingcome TSA TSR 3 Analysis Report
Kingcome Licensee-Agency Group 90
ACRONYMS
AAC Allowable Annual Cut
Analysis Timber Supply Analysis
AU Analysis Unit
BCTS British Columbia Timber Sales
BEC Biogeoclimatic Ecosystem Classification
BEO Biodiversity Emphasis Option
BGB Biodiversity Guidebook
CF Chief Forester
CASH6 Critical Analysis by Simulation of Harvesting (version 6)
CWAP Coastal Watershed Assessment Procedure
DFO Department of Fisheries and Oceans
DM District Manager
EBM Ecosystem-Based Management
ESA Environmentally Sensitive Area
FES Forest Ecosystem Specialist
FIZ Forest Inventory Zone
FPC Forest Practices Code
FPPR Forest Planning and Practices Regulation
FSP Forest Stewardship Plan
FSSIM Forest Service Simulation Model
GIS Geographic Information System
HLP Higher Level Plan
ILMB Integrated Land Management Bureau (Ministry of Agriculture and Lands)
IP Information Package
IRM Integrated Resource Management
LRMP Local Resource Management Plan
LU Landscape Unit
MHA Minimum Harvestable Age
MFR Ministry of Forests and Range
MO Ministerial Order
MSYT Managed Stand Yield Table
Kingcome TSA TSR 3 Analysis Report
Kingcome Licensee-Agency Group 91
NCC Non-Commercial Cover
NDT Natural Disturbance Type
NRL Non-Recoverable Losses
NSR Not Satisfactorily Restocked
NSYT Natural Stand Yield Table
OAF Operational Adjustment Factor
OGMA Old Growth Management Area
PSP Permanent Sample Plot
PSYU Public Sustained Yield Unit
QMD Quadratic Mean Diameter
RFI Recreation Features Inventory
RMZ Riparian Management Zone
ROS Recreation Opportunity Spectrum
RRZ Riparian Reserve Zone
RVQC Recommended Visual Quality Class
SI Site Index
SRMZ Special Resource Management Zone
TFL Tree Farm License
THLB Timber harvesting land base
WHA Wildlife habitat area
UWR Ungulate winter range
Kingcome TSA TSR 3 Analysis Report
Kingcome Licensee-Agency Group
APPENDIX I KINGCOME TIMBER SUPPLY AREA TSR3
BASE CASE EBM LANDSCAPE UNIT-SITE SERIES SURROGATE
OLD FOREST RETENTION STATUS

Kingcome TSA TSR 3 Analysis Report
Kingcome Licensee-Agency Group
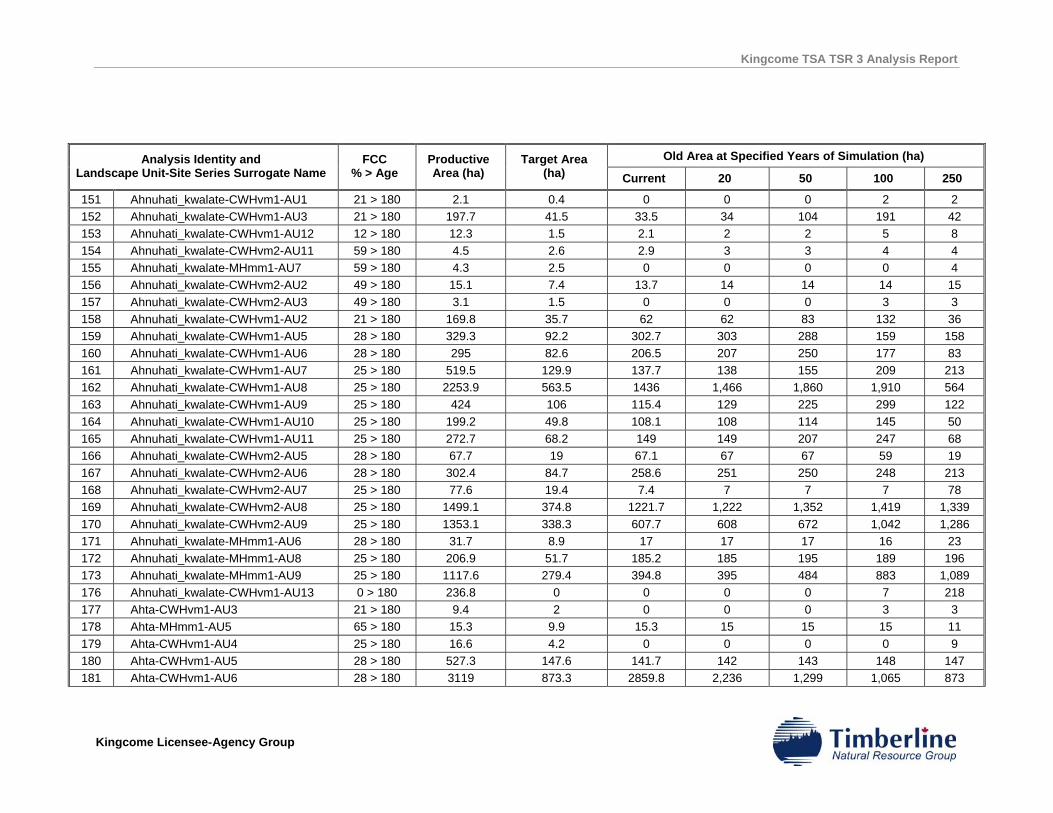
Kingcome TSA TSR 3 Analysis Report
Kingcome Licensee-Agency Group
Old Area at Specified Years of Simulation (ha) Analysis Identity and Landscape Unit-Site Series Surrogate Name
FCC % > Age
Productive Area (ha)
Target Area (ha) Current 20 50 100 250
151 Ahnuhati_kwalate-CWHvm1-AU1 21 > 180 2.1 0.4 0 0 0 2 2 152 Ahnuhati_kwalate-CWHvm1-AU3 21 > 180 197.7 41.5 33.5 34 104 191 42 153 Ahnuhati_kwalate-CWHvm1-AU12 12 > 180 12.3 1.5 2.1 2 2 5 8 154 Ahnuhati_kwalate-CWHvm2-AU11 59 > 180 4.5 2.6 2.9 3 3 4 4 155 Ahnuhati_kwalate-MHmm1-AU7 59 > 180 4.3 2.5 0 0 0 0 4 156 Ahnuhati_kwalate-CWHvm2-AU2 49 > 180 15.1 7.4 13.7 14 14 14 15 157 Ahnuhati_kwalate-CWHvm2-AU3 49 > 180 3.1 1.5 0 0 0 3 3 158 Ahnuhati_kwalate-CWHvm1-AU2 21 > 180 169.8 35.7 62 62 83 132 36 159 Ahnuhati_kwalate-CWHvm1-AU5 28 > 180 329.3 92.2 302.7 303 288 159 158 160 Ahnuhati_kwalate-CWHvm1-AU6 28 > 180 295 82.6 206.5 207 250 177 83 161 Ahnuhati_kwalate-CWHvm1-AU7 25 > 180 519.5 129.9 137.7 138 155 209 213 162 Ahnuhati_kwalate-CWHvm1-AU8 25 > 180 2253.9 563.5 1436 1,466 1,860 1,910 564 163 Ahnuhati_kwalate-CWHvm1-AU9 25 > 180 424 106 115.4 129 225 299 122 164 Ahnuhati_kwalate-CWHvm1-AU10 25 > 180 199.2 49.8 108.1 108 114 145 50 165 Ahnuhati_kwalate-CWHvm1-AU11 25 > 180 272.7 68.2 149 149 207 247 68 166 Ahnuhati_kwalate-CWHvm2-AU5 28 > 180 67.7 19 67.1 67 67 59 19 167 Ahnuhati_kwalate-CWHvm2-AU6 28 > 180 302.4 84.7 258.6 251 250 248 213 168 Ahnuhati_kwalate-CWHvm2-AU7 25 > 180 77.6 19.4 7.4 7 7 7 78 169 Ahnuhati_kwalate-CWHvm2-AU8 25 > 180 1499.1 374.8 1221.7 1,222 1,352 1,419 1,339 170 Ahnuhati_kwalate-CWHvm2-AU9 25 > 180 1353.1 338.3 607.7 608 672 1,042 1,286 171 Ahnuhati_kwalate-MHmm1-AU6 28 > 180 31.7 8.9 17 17 17 16 23 172 Ahnuhati_kwalate-MHmm1-AU8 25 > 180 206.9 51.7 185.2 185 195 189 196 173 Ahnuhati_kwalate-MHmm1-AU9 25 > 180 1117.6 279.4 394.8 395 484 883 1,089 176 Ahnuhati_kwalate-CWHvm1-AU13 0 > 180 236.8 0 0 0 0 7 218 177 Ahta-CWHvm1-AU3 21 > 180 9.4 2 0 0 0 3 3 178 Ahta-MHmm1-AU5 65 > 180 15.3 9.9 15.3 15 15 15 11 179 Ahta-CWHvm1-AU4 25 > 180 16.6 4.2 0 0 0 0 9 180 Ahta-CWHvm1-AU5 28 > 180 527.3 147.6 141.7 142 143 148 147 181 Ahta-CWHvm1-AU6 28 > 180 3119 873.3 2859.8 2,236 1,299 1,065 873
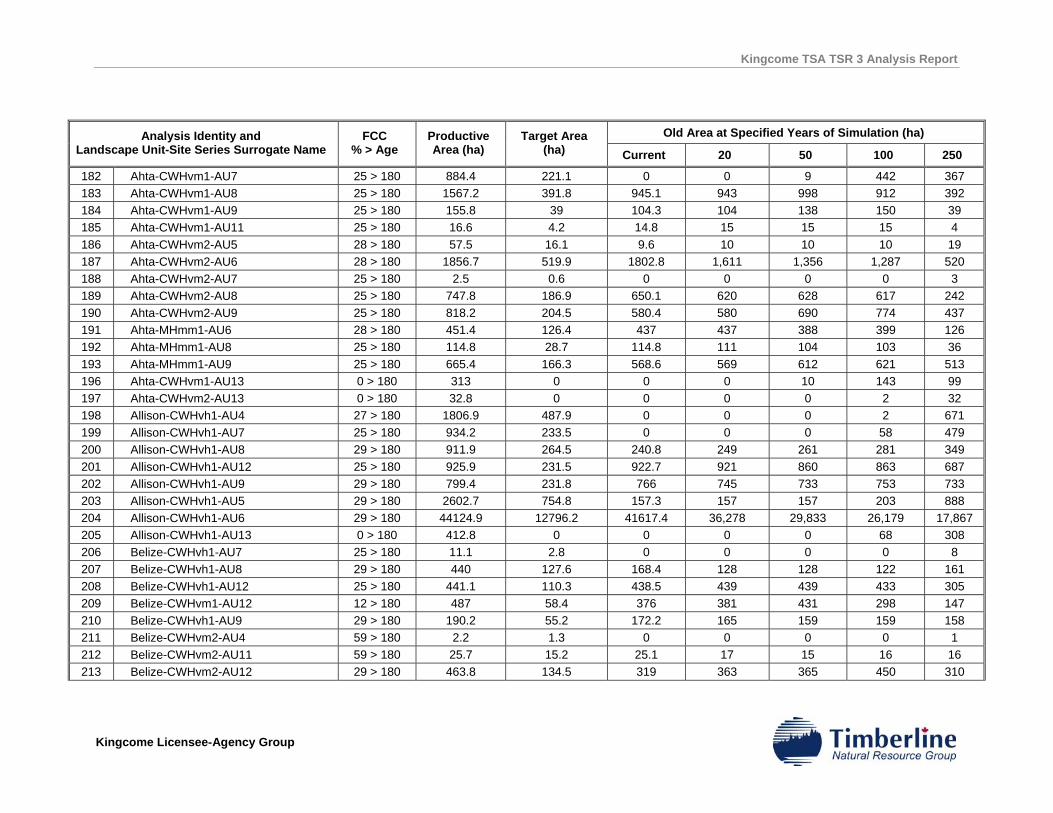
Kingcome TSA TSR 3 Analysis Report
Kingcome Licensee-Agency Group
Old Area at Specified Years of Simulation (ha) Analysis Identity and Landscape Unit-Site Series Surrogate Name
FCC % > Age
Productive Area (ha)
Target Area (ha) Current 20 50 100 250
182 Ahta-CWHvm1-AU7 25 > 180 884.4 221.1 0 0 9 442 367 183 Ahta-CWHvm1-AU8 25 > 180 1567.2 391.8 945.1 943 998 912 392 184 Ahta-CWHvm1-AU9 25 > 180 155.8 39 104.3 104 138 150 39 185 Ahta-CWHvm1-AU11 25 > 180 16.6 4.2 14.8 15 15 15 4 186 Ahta-CWHvm2-AU5 28 > 180 57.5 16.1 9.6 10 10 10 19 187 Ahta-CWHvm2-AU6 28 > 180 1856.7 519.9 1802.8 1,611 1,356 1,287 520 188 Ahta-CWHvm2-AU7 25 > 180 2.5 0.6 0 0 0 0 3 189 Ahta-CWHvm2-AU8 25 > 180 747.8 186.9 650.1 620 628 617 242 190 Ahta-CWHvm2-AU9 25 > 180 818.2 204.5 580.4 580 690 774 437 191 Ahta-MHmm1-AU6 28 > 180 451.4 126.4 437 437 388 399 126 192 Ahta-MHmm1-AU8 25 > 180 114.8 28.7 114.8 111 104 103 36 193 Ahta-MHmm1-AU9 25 > 180 665.4 166.3 568.6 569 612 621 513 196 Ahta-CWHvm1-AU13 0 > 180 313 0 0 0 10 143 99 197 Ahta-CWHvm2-AU13 0 > 180 32.8 0 0 0 0 2 32 198 Allison-CWHvh1-AU4 27 > 180 1806.9 487.9 0 0 0 2 671 199 Allison-CWHvh1-AU7 25 > 180 934.2 233.5 0 0 0 58 479 200 Allison-CWHvh1-AU8 29 > 180 911.9 264.5 240.8 249 261 281 349 201 Allison-CWHvh1-AU12 25 > 180 925.9 231.5 922.7 921 860 863 687 202 Allison-CWHvh1-AU9 29 > 180 799.4 231.8 766 745 733 753 733 203 Allison-CWHvh1-AU5 29 > 180 2602.7 754.8 157.3 157 157 203 888 204 Allison-CWHvh1-AU6 29 > 180 44124.9 12796.2 41617.4 36,278 29,833 26,179 17,867 205 Allison-CWHvh1-AU13 0 > 180 412.8 0 0 0 0 68 308 206 Belize-CWHvh1-AU7 25 > 180 11.1 2.8 0 0 0 0 8 207 Belize-CWHvh1-AU8 29 > 180 440 127.6 168.4 128 128 122 161 208 Belize-CWHvh1-AU12 25 > 180 441.1 110.3 438.5 439 439 433 305 209 Belize-CWHvm1-AU12 12 > 180 487 58.4 376 381 431 298 147 210 Belize-CWHvh1-AU9 29 > 180 190.2 55.2 172.2 165 159 159 158 211 Belize-CWHvm2-AU4 59 > 180 2.2 1.3 0 0 0 0 1 212 Belize-CWHvm2-AU11 59 > 180 25.7 15.2 25.1 17 15 16 16 213 Belize-CWHvm2-AU12 29 > 180 463.8 134.5 319 363 365 450 310
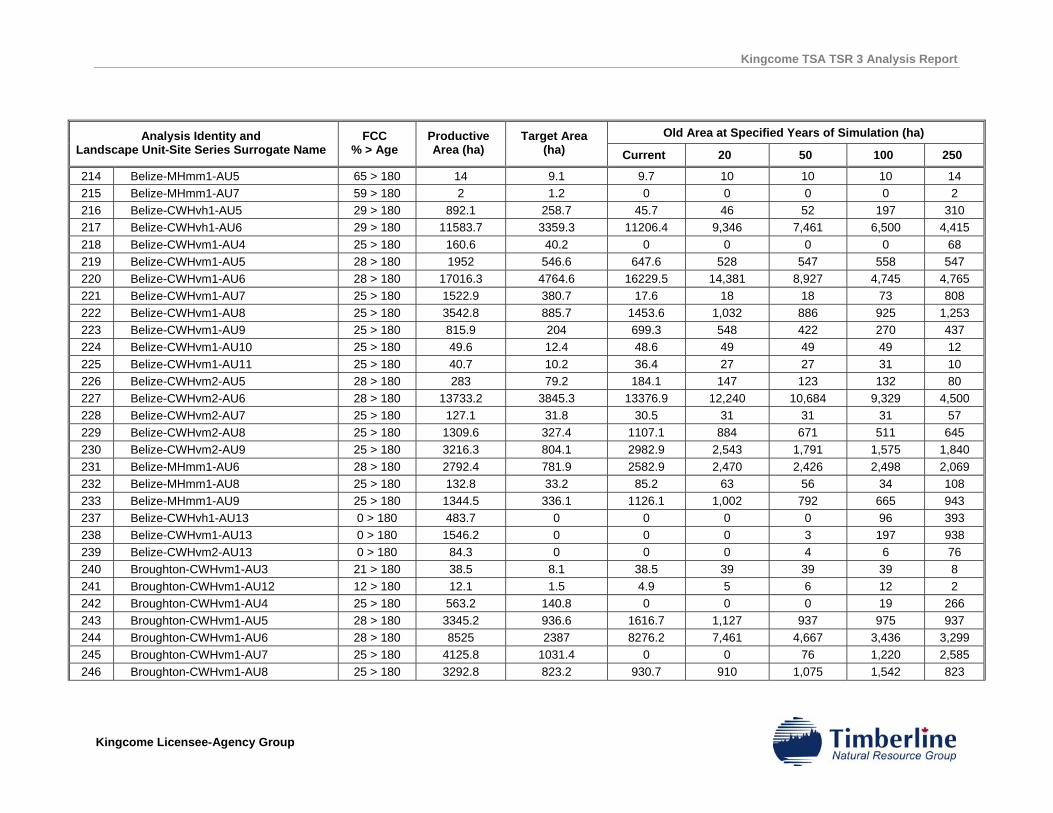
Kingcome TSA TSR 3 Analysis Report
Kingcome Licensee-Agency Group
Old Area at Specified Years of Simulation (ha) Analysis Identity and Landscape Unit-Site Series Surrogate Name
FCC % > Age
Productive Area (ha)
Target Area (ha) Current 20 50 100 250
214 Belize-MHmm1-AU5 65 > 180 14 9.1 9.7 10 10 10 14 215 Belize-MHmm1-AU7 59 > 180 2 1.2 0 0 0 0 2 216 Belize-CWHvh1-AU5 29 > 180 892.1 258.7 45.7 46 52 197 310 217 Belize-CWHvh1-AU6 29 > 180 11583.7 3359.3 11206.4 9,346 7,461 6,500 4,415 218 Belize-CWHvm1-AU4 25 > 180 160.6 40.2 0 0 0 0 68 219 Belize-CWHvm1-AU5 28 > 180 1952 546.6 647.6 528 547 558 547 220 Belize-CWHvm1-AU6 28 > 180 17016.3 4764.6 16229.5 14,381 8,927 4,745 4,765 221 Belize-CWHvm1-AU7 25 > 180 1522.9 380.7 17.6 18 18 73 808 222 Belize-CWHvm1-AU8 25 > 180 3542.8 885.7 1453.6 1,032 886 925 1,253 223 Belize-CWHvm1-AU9 25 > 180 815.9 204 699.3 548 422 270 437 224 Belize-CWHvm1-AU10 25 > 180 49.6 12.4 48.6 49 49 49 12 225 Belize-CWHvm1-AU11 25 > 180 40.7 10.2 36.4 27 27 31 10 226 Belize-CWHvm2-AU5 28 > 180 283 79.2 184.1 147 123 132 80 227 Belize-CWHvm2-AU6 28 > 180 13733.2 3845.3 13376.9 12,240 10,684 9,329 4,500 228 Belize-CWHvm2-AU7 25 > 180 127.1 31.8 30.5 31 31 31 57 229 Belize-CWHvm2-AU8 25 > 180 1309.6 327.4 1107.1 884 671 511 645 230 Belize-CWHvm2-AU9 25 > 180 3216.3 804.1 2982.9 2,543 1,791 1,575 1,840 231 Belize-MHmm1-AU6 28 > 180 2792.4 781.9 2582.9 2,470 2,426 2,498 2,069 232 Belize-MHmm1-AU8 25 > 180 132.8 33.2 85.2 63 56 34 108 233 Belize-MHmm1-AU9 25 > 180 1344.5 336.1 1126.1 1,002 792 665 943 237 Belize-CWHvh1-AU13 0 > 180 483.7 0 0 0 0 96 393 238 Belize-CWHvm1-AU13 0 > 180 1546.2 0 0 0 3 197 938 239 Belize-CWHvm2-AU13 0 > 180 84.3 0 0 0 4 6 76 240 Broughton-CWHvm1-AU3 21 > 180 38.5 8.1 38.5 39 39 39 8 241 Broughton-CWHvm1-AU12 12 > 180 12.1 1.5 4.9 5 6 12 2 242 Broughton-CWHvm1-AU4 25 > 180 563.2 140.8 0 0 0 19 266 243 Broughton-CWHvm1-AU5 28 > 180 3345.2 936.6 1616.7 1,127 937 975 937 244 Broughton-CWHvm1-AU6 28 > 180 8525 2387 8276.2 7,461 4,667 3,436 3,299 245 Broughton-CWHvm1-AU7 25 > 180 4125.8 1031.4 0 0 76 1,220 2,585 246 Broughton-CWHvm1-AU8 25 > 180 3292.8 823.2 930.7 910 1,075 1,542 823
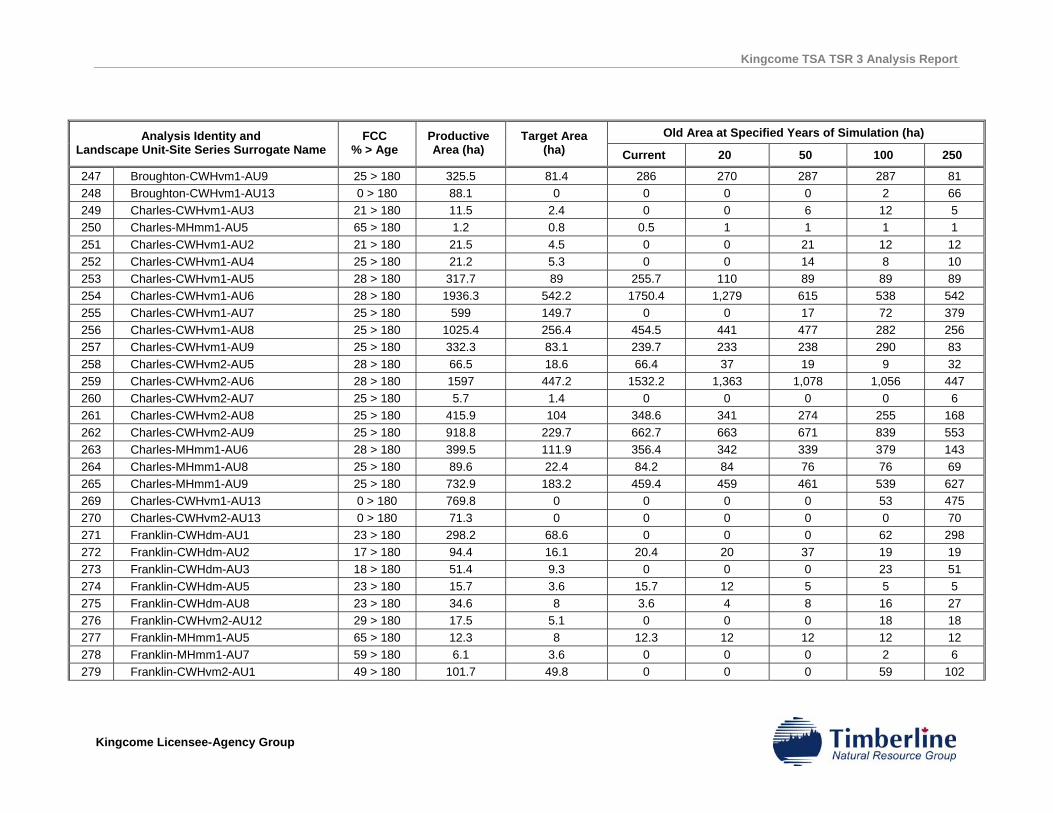
Kingcome TSA TSR 3 Analysis Report
Kingcome Licensee-Agency Group
Old Area at Specified Years of Simulation (ha) Analysis Identity and Landscape Unit-Site Series Surrogate Name
FCC % > Age
Productive Area (ha)
Target Area (ha) Current 20 50 100 250
247 Broughton-CWHvm1-AU9 25 > 180 325.5 81.4 286 270 287 287 81 248 Broughton-CWHvm1-AU13 0 > 180 88.1 0 0 0 0 2 66 249 Charles-CWHvm1-AU3 21 > 180 11.5 2.4 0 0 6 12 5 250 Charles-MHmm1-AU5 65 > 180 1.2 0.8 0.5 1 1 1 1 251 Charles-CWHvm1-AU2 21 > 180 21.5 4.5 0 0 21 12 12 252 Charles-CWHvm1-AU4 25 > 180 21.2 5.3 0 0 14 8 10 253 Charles-CWHvm1-AU5 28 > 180 317.7 89 255.7 110 89 89 89 254 Charles-CWHvm1-AU6 28 > 180 1936.3 542.2 1750.4 1,279 615 538 542 255 Charles-CWHvm1-AU7 25 > 180 599 149.7 0 0 17 72 379 256 Charles-CWHvm1-AU8 25 > 180 1025.4 256.4 454.5 441 477 282 256 257 Charles-CWHvm1-AU9 25 > 180 332.3 83.1 239.7 233 238 290 83 258 Charles-CWHvm2-AU5 28 > 180 66.5 18.6 66.4 37 19 9 32 259 Charles-CWHvm2-AU6 28 > 180 1597 447.2 1532.2 1,363 1,078 1,056 447 260 Charles-CWHvm2-AU7 25 > 180 5.7 1.4 0 0 0 0 6 261 Charles-CWHvm2-AU8 25 > 180 415.9 104 348.6 341 274 255 168 262 Charles-CWHvm2-AU9 25 > 180 918.8 229.7 662.7 663 671 839 553 263 Charles-MHmm1-AU6 28 > 180 399.5 111.9 356.4 342 339 379 143 264 Charles-MHmm1-AU8 25 > 180 89.6 22.4 84.2 84 76 76 69 265 Charles-MHmm1-AU9 25 > 180 732.9 183.2 459.4 459 461 539 627 269 Charles-CWHvm1-AU13 0 > 180 769.8 0 0 0 0 53 475 270 Charles-CWHvm2-AU13 0 > 180 71.3 0 0 0 0 0 70 271 Franklin-CWHdm-AU1 23 > 180 298.2 68.6 0 0 0 62 298 272 Franklin-CWHdm-AU2 17 > 180 94.4 16.1 20.4 20 37 19 19 273 Franklin-CWHdm-AU3 18 > 180 51.4 9.3 0 0 0 23 51 274 Franklin-CWHdm-AU5 23 > 180 15.7 3.6 15.7 12 5 5 5 275 Franklin-CWHdm-AU8 23 > 180 34.6 8 3.6 4 8 16 27 276 Franklin-CWHvm2-AU12 29 > 180 17.5 5.1 0 0 0 18 18 277 Franklin-MHmm1-AU5 65 > 180 12.3 8 12.3 12 12 12 12 278 Franklin-MHmm1-AU7 59 > 180 6.1 3.6 0 0 0 2 6 279 Franklin-CWHvm2-AU1 49 > 180 101.7 49.8 0 0 0 59 102
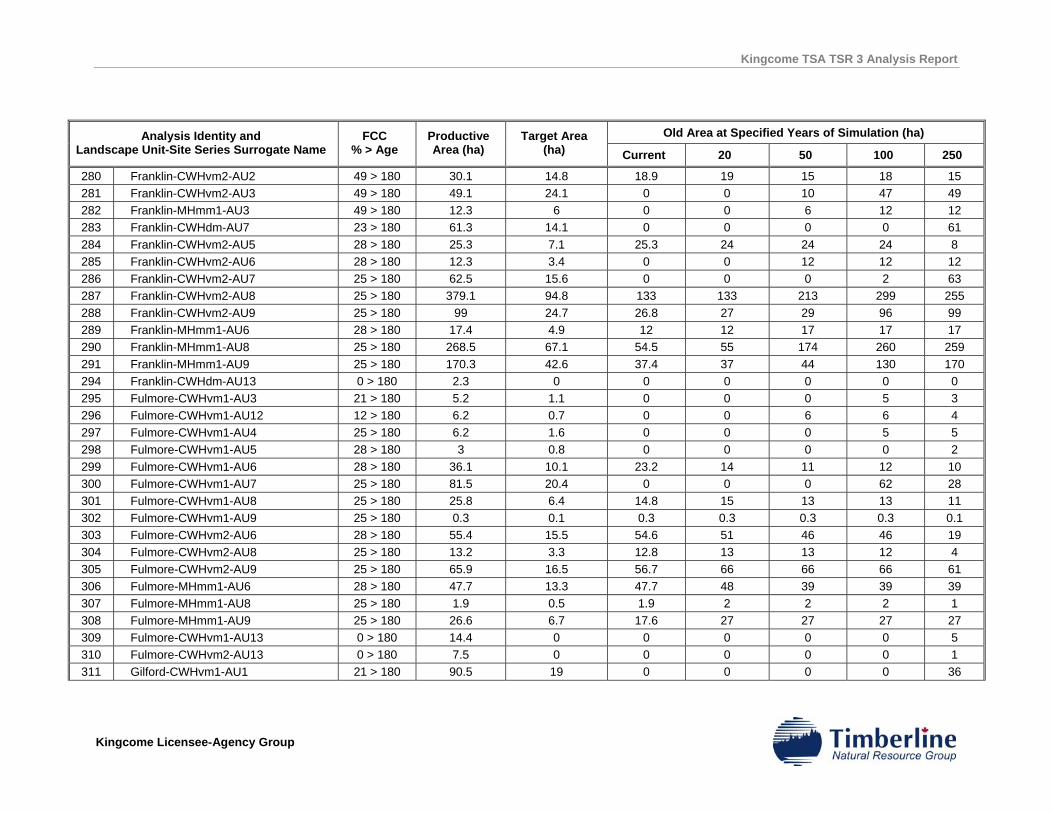
Kingcome TSA TSR 3 Analysis Report
Kingcome Licensee-Agency Group
Old Area at Specified Years of Simulation (ha) Analysis Identity and Landscape Unit-Site Series Surrogate Name
FCC % > Age
Productive Area (ha)
Target Area (ha) Current 20 50 100 250
280 Franklin-CWHvm2-AU2 49 > 180 30.1 14.8 18.9 19 15 18 15 281 Franklin-CWHvm2-AU3 49 > 180 49.1 24.1 0 0 10 47 49 282 Franklin-MHmm1-AU3 49 > 180 12.3 6 0 0 6 12 12 283 Franklin-CWHdm-AU7 23 > 180 61.3 14.1 0 0 0 0 61 284 Franklin-CWHvm2-AU5 28 > 180 25.3 7.1 25.3 24 24 24 8 285 Franklin-CWHvm2-AU6 28 > 180 12.3 3.4 0 0 12 12 12 286 Franklin-CWHvm2-AU7 25 > 180 62.5 15.6 0 0 0 2 63 287 Franklin-CWHvm2-AU8 25 > 180 379.1 94.8 133 133 213 299 255 288 Franklin-CWHvm2-AU9 25 > 180 99 24.7 26.8 27 29 96 99 289 Franklin-MHmm1-AU6 28 > 180 17.4 4.9 12 12 17 17 17 290 Franklin-MHmm1-AU8 25 > 180 268.5 67.1 54.5 55 174 260 259 291 Franklin-MHmm1-AU9 25 > 180 170.3 42.6 37.4 37 44 130 170 294 Franklin-CWHdm-AU13 0 > 180 2.3 0 0 0 0 0 0 295 Fulmore-CWHvm1-AU3 21 > 180 5.2 1.1 0 0 0 5 3 296 Fulmore-CWHvm1-AU12 12 > 180 6.2 0.7 0 0 6 6 4 297 Fulmore-CWHvm1-AU4 25 > 180 6.2 1.6 0 0 0 5 5 298 Fulmore-CWHvm1-AU5 28 > 180 3 0.8 0 0 0 0 2 299 Fulmore-CWHvm1-AU6 28 > 180 36.1 10.1 23.2 14 11 12 10 300 Fulmore-CWHvm1-AU7 25 > 180 81.5 20.4 0 0 0 62 28 301 Fulmore-CWHvm1-AU8 25 > 180 25.8 6.4 14.8 15 13 13 11 302 Fulmore-CWHvm1-AU9 25 > 180 0.3 0.1 0.3 0.3 0.3 0.3 0.1 303 Fulmore-CWHvm2-AU6 28 > 180 55.4 15.5 54.6 51 46 46 19 304 Fulmore-CWHvm2-AU8 25 > 180 13.2 3.3 12.8 13 13 12 4 305 Fulmore-CWHvm2-AU9 25 > 180 65.9 16.5 56.7 66 66 66 61 306 Fulmore-MHmm1-AU6 28 > 180 47.7 13.3 47.7 48 39 39 39 307 Fulmore-MHmm1-AU8 25 > 180 1.9 0.5 1.9 2 2 2 1 308 Fulmore-MHmm1-AU9 25 > 180 26.6 6.7 17.6 27 27 27 27 309 Fulmore-CWHvm1-AU13 0 > 180 14.4 0 0 0 0 0 5 310 Fulmore-CWHvm2-AU13 0 > 180 7.5 0 0 0 0 0 1 311 Gilford-CWHvm1-AU1 21 > 180 90.5 19 0 0 0 0 36
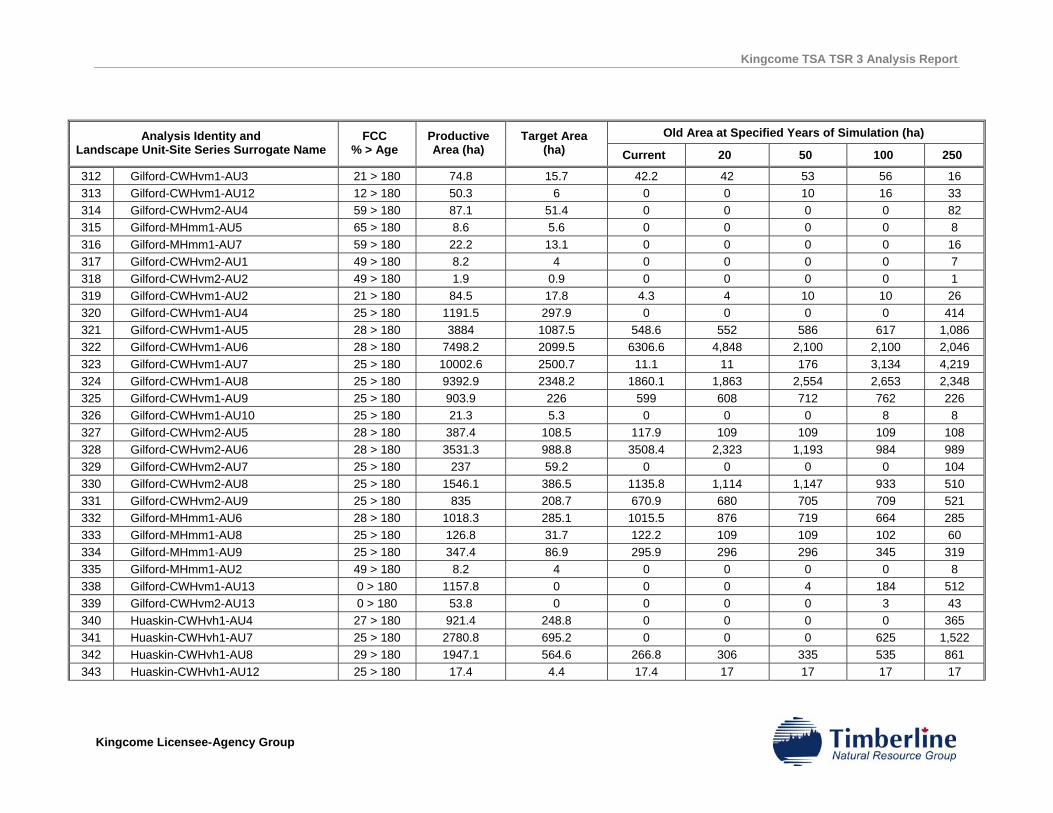
Kingcome TSA TSR 3 Analysis Report
Kingcome Licensee-Agency Group
Old Area at Specified Years of Simulation (ha) Analysis Identity and Landscape Unit-Site Series Surrogate Name
FCC % > Age
Productive Area (ha)
Target Area (ha) Current 20 50 100 250
312 Gilford-CWHvm1-AU3 21 > 180 74.8 15.7 42.2 42 53 56 16 313 Gilford-CWHvm1-AU12 12 > 180 50.3 6 0 0 10 16 33 314 Gilford-CWHvm2-AU4 59 > 180 87.1 51.4 0 0 0 0 82 315 Gilford-MHmm1-AU5 65 > 180 8.6 5.6 0 0 0 0 8 316 Gilford-MHmm1-AU7 59 > 180 22.2 13.1 0 0 0 0 16 317 Gilford-CWHvm2-AU1 49 > 180 8.2 4 0 0 0 0 7 318 Gilford-CWHvm2-AU2 49 > 180 1.9 0.9 0 0 0 0 1 319 Gilford-CWHvm1-AU2 21 > 180 84.5 17.8 4.3 4 10 10 26 320 Gilford-CWHvm1-AU4 25 > 180 1191.5 297.9 0 0 0 0 414 321 Gilford-CWHvm1-AU5 28 > 180 3884 1087.5 548.6 552 586 617 1,086 322 Gilford-CWHvm1-AU6 28 > 180 7498.2 2099.5 6306.6 4,848 2,100 2,100 2,046 323 Gilford-CWHvm1-AU7 25 > 180 10002.6 2500.7 11.1 11 176 3,134 4,219 324 Gilford-CWHvm1-AU8 25 > 180 9392.9 2348.2 1860.1 1,863 2,554 2,653 2,348 325 Gilford-CWHvm1-AU9 25 > 180 903.9 226 599 608 712 762 226 326 Gilford-CWHvm1-AU10 25 > 180 21.3 5.3 0 0 0 8 8 327 Gilford-CWHvm2-AU5 28 > 180 387.4 108.5 117.9 109 109 109 108 328 Gilford-CWHvm2-AU6 28 > 180 3531.3 988.8 3508.4 2,323 1,193 984 989 329 Gilford-CWHvm2-AU7 25 > 180 237 59.2 0 0 0 0 104 330 Gilford-CWHvm2-AU8 25 > 180 1546.1 386.5 1135.8 1,114 1,147 933 510 331 Gilford-CWHvm2-AU9 25 > 180 835 208.7 670.9 680 705 709 521 332 Gilford-MHmm1-AU6 28 > 180 1018.3 285.1 1015.5 876 719 664 285 333 Gilford-MHmm1-AU8 25 > 180 126.8 31.7 122.2 109 109 102 60 334 Gilford-MHmm1-AU9 25 > 180 347.4 86.9 295.9 296 296 345 319 335 Gilford-MHmm1-AU2 49 > 180 8.2 4 0 0 0 0 8 338 Gilford-CWHvm1-AU13 0 > 180 1157.8 0 0 0 4 184 512 339 Gilford-CWHvm2-AU13 0 > 180 53.8 0 0 0 0 3 43 340 Huaskin-CWHvh1-AU4 27 > 180 921.4 248.8 0 0 0 0 365 341 Huaskin-CWHvh1-AU7 25 > 180 2780.8 695.2 0 0 0 625 1,522 342 Huaskin-CWHvh1-AU8 29 > 180 1947.1 564.6 266.8 306 335 535 861 343 Huaskin-CWHvh1-AU12 25 > 180 17.4 4.4 17.4 17 17 17 17
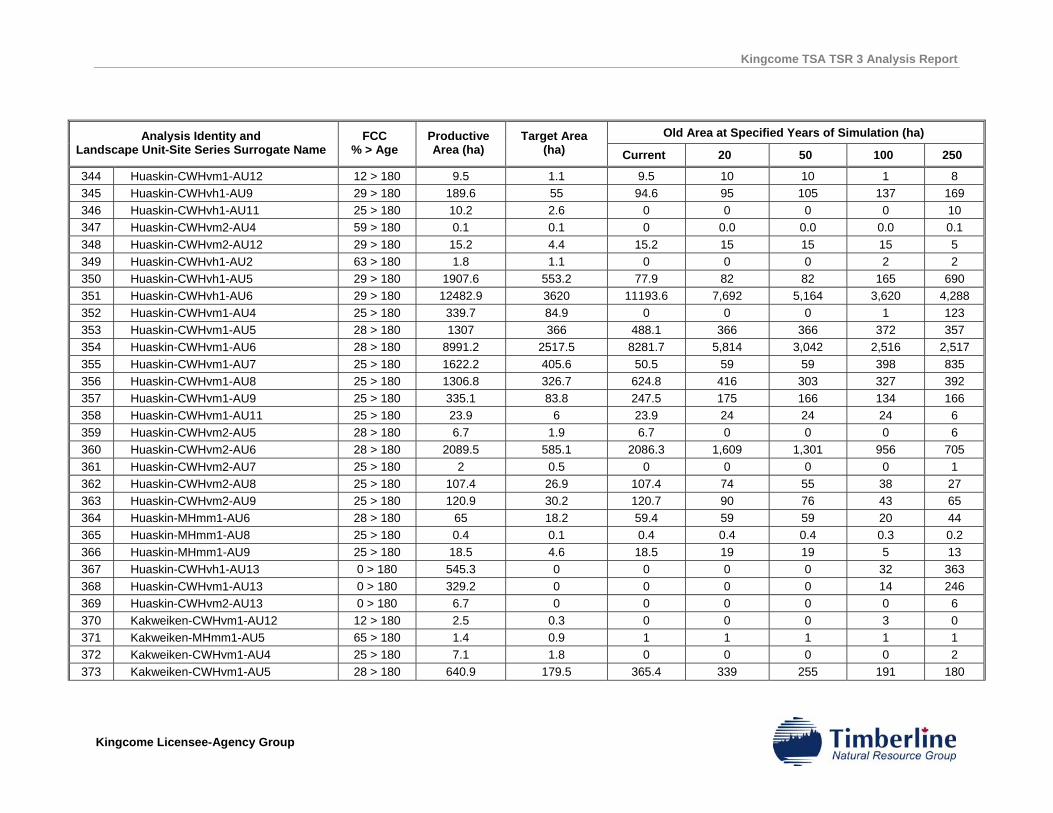
Kingcome TSA TSR 3 Analysis Report
Kingcome Licensee-Agency Group
Old Area at Specified Years of Simulation (ha) Analysis Identity and Landscape Unit-Site Series Surrogate Name
FCC % > Age
Productive Area (ha)
Target Area (ha) Current 20 50 100 250
344 Huaskin-CWHvm1-AU12 12 > 180 9.5 1.1 9.5 10 10 1 8 345 Huaskin-CWHvh1-AU9 29 > 180 189.6 55 94.6 95 105 137 169 346 Huaskin-CWHvh1-AU11 25 > 180 10.2 2.6 0 0 0 0 10 347 Huaskin-CWHvm2-AU4 59 > 180 0.1 0.1 0 0.0 0.0 0.0 0.1 348 Huaskin-CWHvm2-AU12 29 > 180 15.2 4.4 15.2 15 15 15 5 349 Huaskin-CWHvh1-AU2 63 > 180 1.8 1.1 0 0 0 2 2 350 Huaskin-CWHvh1-AU5 29 > 180 1907.6 553.2 77.9 82 82 165 690 351 Huaskin-CWHvh1-AU6 29 > 180 12482.9 3620 11193.6 7,692 5,164 3,620 4,288 352 Huaskin-CWHvm1-AU4 25 > 180 339.7 84.9 0 0 0 1 123 353 Huaskin-CWHvm1-AU5 28 > 180 1307 366 488.1 366 366 372 357 354 Huaskin-CWHvm1-AU6 28 > 180 8991.2 2517.5 8281.7 5,814 3,042 2,516 2,517 355 Huaskin-CWHvm1-AU7 25 > 180 1622.2 405.6 50.5 59 59 398 835 356 Huaskin-CWHvm1-AU8 25 > 180 1306.8 326.7 624.8 416 303 327 392 357 Huaskin-CWHvm1-AU9 25 > 180 335.1 83.8 247.5 175 166 134 166 358 Huaskin-CWHvm1-AU11 25 > 180 23.9 6 23.9 24 24 24 6 359 Huaskin-CWHvm2-AU5 28 > 180 6.7 1.9 6.7 0 0 0 6 360 Huaskin-CWHvm2-AU6 28 > 180 2089.5 585.1 2086.3 1,609 1,301 956 705 361 Huaskin-CWHvm2-AU7 25 > 180 2 0.5 0 0 0 0 1 362 Huaskin-CWHvm2-AU8 25 > 180 107.4 26.9 107.4 74 55 38 27 363 Huaskin-CWHvm2-AU9 25 > 180 120.9 30.2 120.7 90 76 43 65 364 Huaskin-MHmm1-AU6 28 > 180 65 18.2 59.4 59 59 20 44 365 Huaskin-MHmm1-AU8 25 > 180 0.4 0.1 0.4 0.4 0.4 0.3 0.2 366 Huaskin-MHmm1-AU9 25 > 180 18.5 4.6 18.5 19 19 5 13 367 Huaskin-CWHvh1-AU13 0 > 180 545.3 0 0 0 0 32 363 368 Huaskin-CWHvm1-AU13 0 > 180 329.2 0 0 0 0 14 246 369 Huaskin-CWHvm2-AU13 0 > 180 6.7 0 0 0 0 0 6 370 Kakweiken-CWHvm1-AU12 12 > 180 2.5 0.3 0 0 0 3 0 371 Kakweiken-MHmm1-AU5 65 > 180 1.4 0.9 1 1 1 1 1 372 Kakweiken-CWHvm1-AU4 25 > 180 7.1 1.8 0 0 0 0 2 373 Kakweiken-CWHvm1-AU5 28 > 180 640.9 179.5 365.4 339 255 191 180
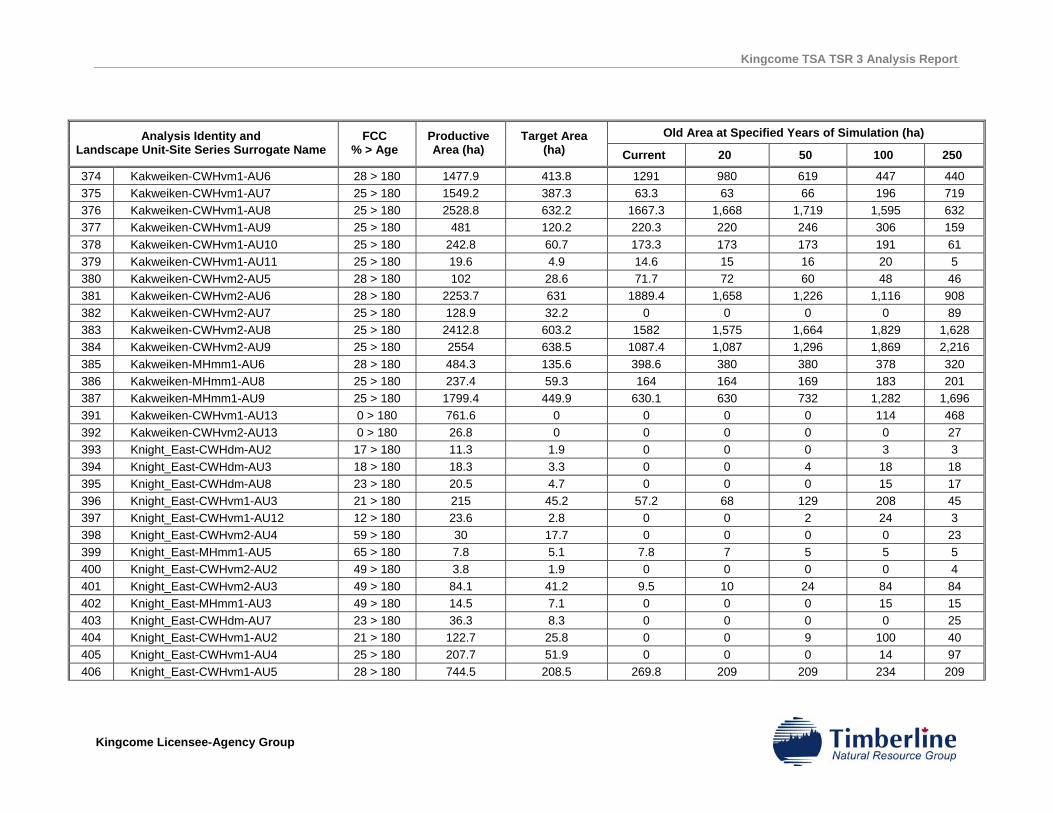
Kingcome TSA TSR 3 Analysis Report
Kingcome Licensee-Agency Group
Old Area at Specified Years of Simulation (ha) Analysis Identity and Landscape Unit-Site Series Surrogate Name
FCC % > Age
Productive Area (ha)
Target Area (ha) Current 20 50 100 250
374 Kakweiken-CWHvm1-AU6 28 > 180 1477.9 413.8 1291 980 619 447 440 375 Kakweiken-CWHvm1-AU7 25 > 180 1549.2 387.3 63.3 63 66 196 719 376 Kakweiken-CWHvm1-AU8 25 > 180 2528.8 632.2 1667.3 1,668 1,719 1,595 632 377 Kakweiken-CWHvm1-AU9 25 > 180 481 120.2 220.3 220 246 306 159 378 Kakweiken-CWHvm1-AU10 25 > 180 242.8 60.7 173.3 173 173 191 61 379 Kakweiken-CWHvm1-AU11 25 > 180 19.6 4.9 14.6 15 16 20 5 380 Kakweiken-CWHvm2-AU5 28 > 180 102 28.6 71.7 72 60 48 46 381 Kakweiken-CWHvm2-AU6 28 > 180 2253.7 631 1889.4 1,658 1,226 1,116 908 382 Kakweiken-CWHvm2-AU7 25 > 180 128.9 32.2 0 0 0 0 89 383 Kakweiken-CWHvm2-AU8 25 > 180 2412.8 603.2 1582 1,575 1,664 1,829 1,628 384 Kakweiken-CWHvm2-AU9 25 > 180 2554 638.5 1087.4 1,087 1,296 1,869 2,216 385 Kakweiken-MHmm1-AU6 28 > 180 484.3 135.6 398.6 380 380 378 320 386 Kakweiken-MHmm1-AU8 25 > 180 237.4 59.3 164 164 169 183 201 387 Kakweiken-MHmm1-AU9 25 > 180 1799.4 449.9 630.1 630 732 1,282 1,696 391 Kakweiken-CWHvm1-AU13 0 > 180 761.6 0 0 0 0 114 468 392 Kakweiken-CWHvm2-AU13 0 > 180 26.8 0 0 0 0 0 27 393 Knight_East-CWHdm-AU2 17 > 180 11.3 1.9 0 0 0 3 3 394 Knight_East-CWHdm-AU3 18 > 180 18.3 3.3 0 0 4 18 18 395 Knight_East-CWHdm-AU8 23 > 180 20.5 4.7 0 0 0 15 17 396 Knight_East-CWHvm1-AU3 21 > 180 215 45.2 57.2 68 129 208 45 397 Knight_East-CWHvm1-AU12 12 > 180 23.6 2.8 0 0 2 24 3 398 Knight_East-CWHvm2-AU4 59 > 180 30 17.7 0 0 0 0 23 399 Knight_East-MHmm1-AU5 65 > 180 7.8 5.1 7.8 7 5 5 5 400 Knight_East-CWHvm2-AU2 49 > 180 3.8 1.9 0 0 0 0 4 401 Knight_East-CWHvm2-AU3 49 > 180 84.1 41.2 9.5 10 24 84 84 402 Knight_East-MHmm1-AU3 49 > 180 14.5 7.1 0 0 0 15 15 403 Knight_East-CWHdm-AU7 23 > 180 36.3 8.3 0 0 0 0 25 404 Knight_East-CWHvm1-AU2 21 > 180 122.7 25.8 0 0 9 100 40 405 Knight_East-CWHvm1-AU4 25 > 180 207.7 51.9 0 0 0 14 97 406 Knight_East-CWHvm1-AU5 28 > 180 744.5 208.5 269.8 209 209 234 209
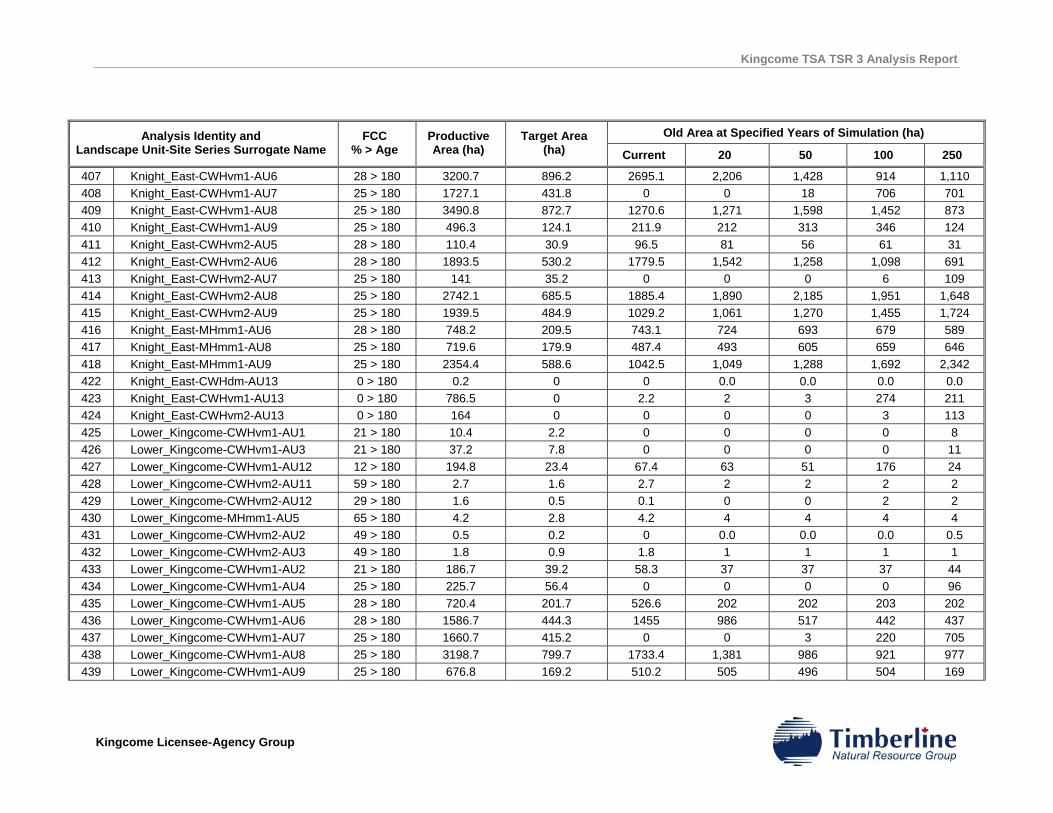
Kingcome TSA TSR 3 Analysis Report
Kingcome Licensee-Agency Group
Old Area at Specified Years of Simulation (ha) Analysis Identity and Landscape Unit-Site Series Surrogate Name
FCC % > Age
Productive Area (ha)
Target Area (ha) Current 20 50 100 250
407 Knight_East-CWHvm1-AU6 28 > 180 3200.7 896.2 2695.1 2,206 1,428 914 1,110 408 Knight_East-CWHvm1-AU7 25 > 180 1727.1 431.8 0 0 18 706 701 409 Knight_East-CWHvm1-AU8 25 > 180 3490.8 872.7 1270.6 1,271 1,598 1,452 873 410 Knight_East-CWHvm1-AU9 25 > 180 496.3 124.1 211.9 212 313 346 124 411 Knight_East-CWHvm2-AU5 28 > 180 110.4 30.9 96.5 81 56 61 31 412 Knight_East-CWHvm2-AU6 28 > 180 1893.5 530.2 1779.5 1,542 1,258 1,098 691 413 Knight_East-CWHvm2-AU7 25 > 180 141 35.2 0 0 0 6 109 414 Knight_East-CWHvm2-AU8 25 > 180 2742.1 685.5 1885.4 1,890 2,185 1,951 1,648 415 Knight_East-CWHvm2-AU9 25 > 180 1939.5 484.9 1029.2 1,061 1,270 1,455 1,724 416 Knight_East-MHmm1-AU6 28 > 180 748.2 209.5 743.1 724 693 679 589 417 Knight_East-MHmm1-AU8 25 > 180 719.6 179.9 487.4 493 605 659 646 418 Knight_East-MHmm1-AU9 25 > 180 2354.4 588.6 1042.5 1,049 1,288 1,692 2,342 422 Knight_East-CWHdm-AU13 0 > 180 0.2 0 0 0.0 0.0 0.0 0.0 423 Knight_East-CWHvm1-AU13 0 > 180 786.5 0 2.2 2 3 274 211 424 Knight_East-CWHvm2-AU13 0 > 180 164 0 0 0 0 3 113 425 Lower_Kingcome-CWHvm1-AU1 21 > 180 10.4 2.2 0 0 0 0 8 426 Lower_Kingcome-CWHvm1-AU3 21 > 180 37.2 7.8 0 0 0 0 11 427 Lower_Kingcome-CWHvm1-AU12 12 > 180 194.8 23.4 67.4 63 51 176 24 428 Lower_Kingcome-CWHvm2-AU11 59 > 180 2.7 1.6 2.7 2 2 2 2 429 Lower_Kingcome-CWHvm2-AU12 29 > 180 1.6 0.5 0.1 0 0 2 2 430 Lower_Kingcome-MHmm1-AU5 65 > 180 4.2 2.8 4.2 4 4 4 4 431 Lower_Kingcome-CWHvm2-AU2 49 > 180 0.5 0.2 0 0.0 0.0 0.0 0.5 432 Lower_Kingcome-CWHvm2-AU3 49 > 180 1.8 0.9 1.8 1 1 1 1 433 Lower_Kingcome-CWHvm1-AU2 21 > 180 186.7 39.2 58.3 37 37 37 44 434 Lower_Kingcome-CWHvm1-AU4 25 > 180 225.7 56.4 0 0 0 0 96 435 Lower_Kingcome-CWHvm1-AU5 28 > 180 720.4 201.7 526.6 202 202 203 202 436 Lower_Kingcome-CWHvm1-AU6 28 > 180 1586.7 444.3 1455 986 517 442 437 437 Lower_Kingcome-CWHvm1-AU7 25 > 180 1660.7 415.2 0 0 3 220 705 438 Lower_Kingcome-CWHvm1-AU8 25 > 180 3198.7 799.7 1733.4 1,381 986 921 977 439 Lower_Kingcome-CWHvm1-AU9 25 > 180 676.8 169.2 510.2 505 496 504 169
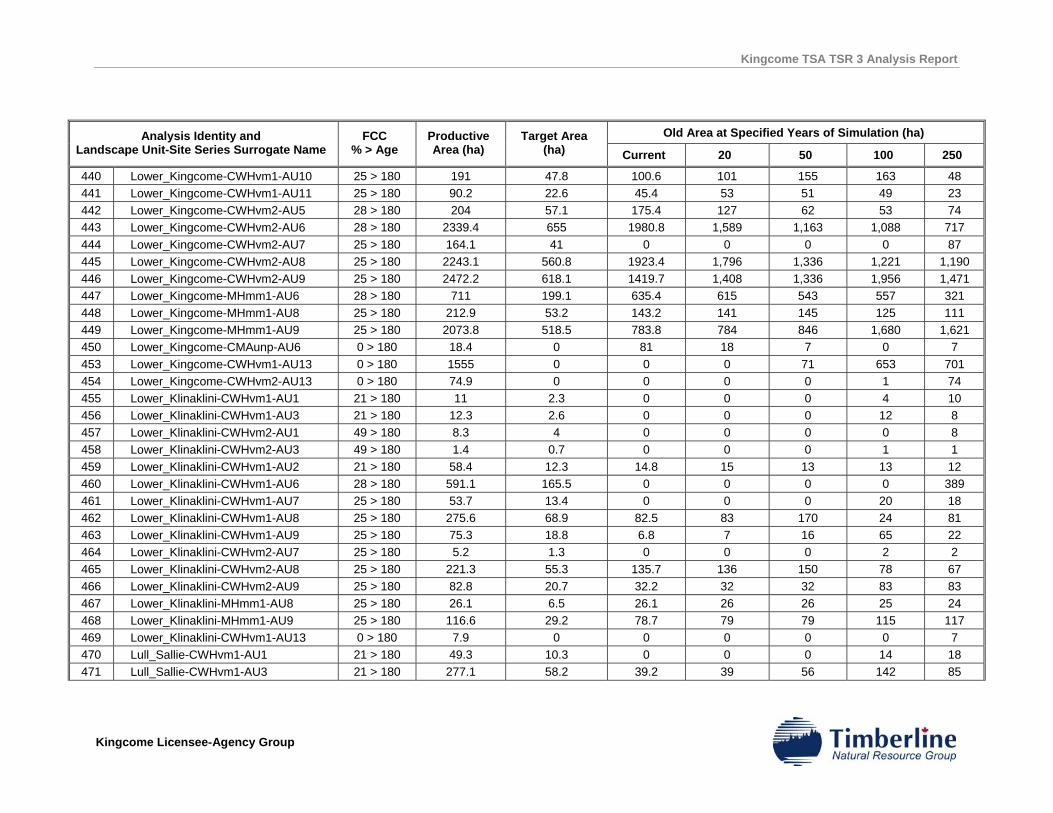
Kingcome TSA TSR 3 Analysis Report
Kingcome Licensee-Agency Group
Old Area at Specified Years of Simulation (ha) Analysis Identity and Landscape Unit-Site Series Surrogate Name
FCC % > Age
Productive Area (ha)
Target Area (ha) Current 20 50 100 250
440 Lower_Kingcome-CWHvm1-AU10 25 > 180 191 47.8 100.6 101 155 163 48 441 Lower_Kingcome-CWHvm1-AU11 25 > 180 90.2 22.6 45.4 53 51 49 23 442 Lower_Kingcome-CWHvm2-AU5 28 > 180 204 57.1 175.4 127 62 53 74 443 Lower_Kingcome-CWHvm2-AU6 28 > 180 2339.4 655 1980.8 1,589 1,163 1,088 717 444 Lower_Kingcome-CWHvm2-AU7 25 > 180 164.1 41 0 0 0 0 87 445 Lower_Kingcome-CWHvm2-AU8 25 > 180 2243.1 560.8 1923.4 1,796 1,336 1,221 1,190 446 Lower_Kingcome-CWHvm2-AU9 25 > 180 2472.2 618.1 1419.7 1,408 1,336 1,956 1,471 447 Lower_Kingcome-MHmm1-AU6 28 > 180 711 199.1 635.4 615 543 557 321 448 Lower_Kingcome-MHmm1-AU8 25 > 180 212.9 53.2 143.2 141 145 125 111 449 Lower_Kingcome-MHmm1-AU9 25 > 180 2073.8 518.5 783.8 784 846 1,680 1,621 450 Lower_Kingcome-CMAunp-AU6 0 > 180 18.4 0 81 18 7 0 7 453 Lower_Kingcome-CWHvm1-AU13 0 > 180 1555 0 0 0 71 653 701 454 Lower_Kingcome-CWHvm2-AU13 0 > 180 74.9 0 0 0 0 1 74 455 Lower_Klinaklini-CWHvm1-AU1 21 > 180 11 2.3 0 0 0 4 10 456 Lower_Klinaklini-CWHvm1-AU3 21 > 180 12.3 2.6 0 0 0 12 8 457 Lower_Klinaklini-CWHvm2-AU1 49 > 180 8.3 4 0 0 0 0 8 458 Lower_Klinaklini-CWHvm2-AU3 49 > 180 1.4 0.7 0 0 0 1 1 459 Lower_Klinaklini-CWHvm1-AU2 21 > 180 58.4 12.3 14.8 15 13 13 12 460 Lower_Klinaklini-CWHvm1-AU6 28 > 180 591.1 165.5 0 0 0 0 389 461 Lower_Klinaklini-CWHvm1-AU7 25 > 180 53.7 13.4 0 0 0 20 18 462 Lower_Klinaklini-CWHvm1-AU8 25 > 180 275.6 68.9 82.5 83 170 24 81 463 Lower_Klinaklini-CWHvm1-AU9 25 > 180 75.3 18.8 6.8 7 16 65 22 464 Lower_Klinaklini-CWHvm2-AU7 25 > 180 5.2 1.3 0 0 0 2 2 465 Lower_Klinaklini-CWHvm2-AU8 25 > 180 221.3 55.3 135.7 136 150 78 67 466 Lower_Klinaklini-CWHvm2-AU9 25 > 180 82.8 20.7 32.2 32 32 83 83 467 Lower_Klinaklini-MHmm1-AU8 25 > 180 26.1 6.5 26.1 26 26 25 24 468 Lower_Klinaklini-MHmm1-AU9 25 > 180 116.6 29.2 78.7 79 79 115 117 469 Lower_Klinaklini-CWHvm1-AU13 0 > 180 7.9 0 0 0 0 0 7 470 Lull_Sallie-CWHvm1-AU1 21 > 180 49.3 10.3 0 0 0 14 18 471 Lull_Sallie-CWHvm1-AU3 21 > 180 277.1 58.2 39.2 39 56 142 85
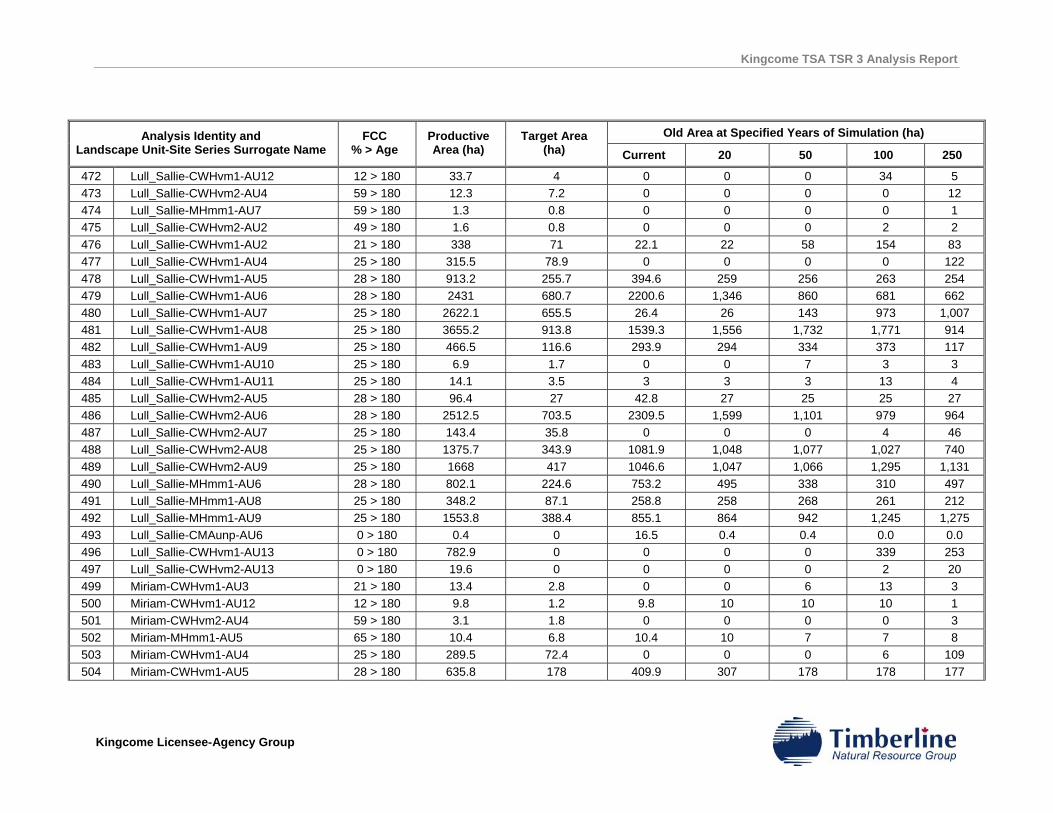
Kingcome TSA TSR 3 Analysis Report
Kingcome Licensee-Agency Group
Old Area at Specified Years of Simulation (ha) Analysis Identity and Landscape Unit-Site Series Surrogate Name
FCC % > Age
Productive Area (ha)
Target Area (ha) Current 20 50 100 250
472 Lull_Sallie-CWHvm1-AU12 12 > 180 33.7 4 0 0 0 34 5 473 Lull_Sallie-CWHvm2-AU4 59 > 180 12.3 7.2 0 0 0 0 12 474 Lull_Sallie-MHmm1-AU7 59 > 180 1.3 0.8 0 0 0 0 1 475 Lull_Sallie-CWHvm2-AU2 49 > 180 1.6 0.8 0 0 0 2 2 476 Lull_Sallie-CWHvm1-AU2 21 > 180 338 71 22.1 22 58 154 83 477 Lull_Sallie-CWHvm1-AU4 25 > 180 315.5 78.9 0 0 0 0 122 478 Lull_Sallie-CWHvm1-AU5 28 > 180 913.2 255.7 394.6 259 256 263 254 479 Lull_Sallie-CWHvm1-AU6 28 > 180 2431 680.7 2200.6 1,346 860 681 662 480 Lull_Sallie-CWHvm1-AU7 25 > 180 2622.1 655.5 26.4 26 143 973 1,007 481 Lull_Sallie-CWHvm1-AU8 25 > 180 3655.2 913.8 1539.3 1,556 1,732 1,771 914 482 Lull_Sallie-CWHvm1-AU9 25 > 180 466.5 116.6 293.9 294 334 373 117 483 Lull_Sallie-CWHvm1-AU10 25 > 180 6.9 1.7 0 0 7 3 3 484 Lull_Sallie-CWHvm1-AU11 25 > 180 14.1 3.5 3 3 3 13 4 485 Lull_Sallie-CWHvm2-AU5 28 > 180 96.4 27 42.8 27 25 25 27 486 Lull_Sallie-CWHvm2-AU6 28 > 180 2512.5 703.5 2309.5 1,599 1,101 979 964 487 Lull_Sallie-CWHvm2-AU7 25 > 180 143.4 35.8 0 0 0 4 46 488 Lull_Sallie-CWHvm2-AU8 25 > 180 1375.7 343.9 1081.9 1,048 1,077 1,027 740 489 Lull_Sallie-CWHvm2-AU9 25 > 180 1668 417 1046.6 1,047 1,066 1,295 1,131 490 Lull_Sallie-MHmm1-AU6 28 > 180 802.1 224.6 753.2 495 338 310 497 491 Lull_Sallie-MHmm1-AU8 25 > 180 348.2 87.1 258.8 258 268 261 212 492 Lull_Sallie-MHmm1-AU9 25 > 180 1553.8 388.4 855.1 864 942 1,245 1,275 493 Lull_Sallie-CMAunp-AU6 0 > 180 0.4 0 16.5 0.4 0.4 0.0 0.0 496 Lull_Sallie-CWHvm1-AU13 0 > 180 782.9 0 0 0 0 339 253 497 Lull_Sallie-CWHvm2-AU13 0 > 180 19.6 0 0 0 0 2 20 499 Miriam-CWHvm1-AU3 21 > 180 13.4 2.8 0 0 6 13 3 500 Miriam-CWHvm1-AU12 12 > 180 9.8 1.2 9.8 10 10 10 1 501 Miriam-CWHvm2-AU4 59 > 180 3.1 1.8 0 0 0 0 3 502 Miriam-MHmm1-AU5 65 > 180 10.4 6.8 10.4 10 7 7 8 503 Miriam-CWHvm1-AU4 25 > 180 289.5 72.4 0 0 0 6 109 504 Miriam-CWHvm1-AU5 28 > 180 635.8 178 409.9 307 178 178 177
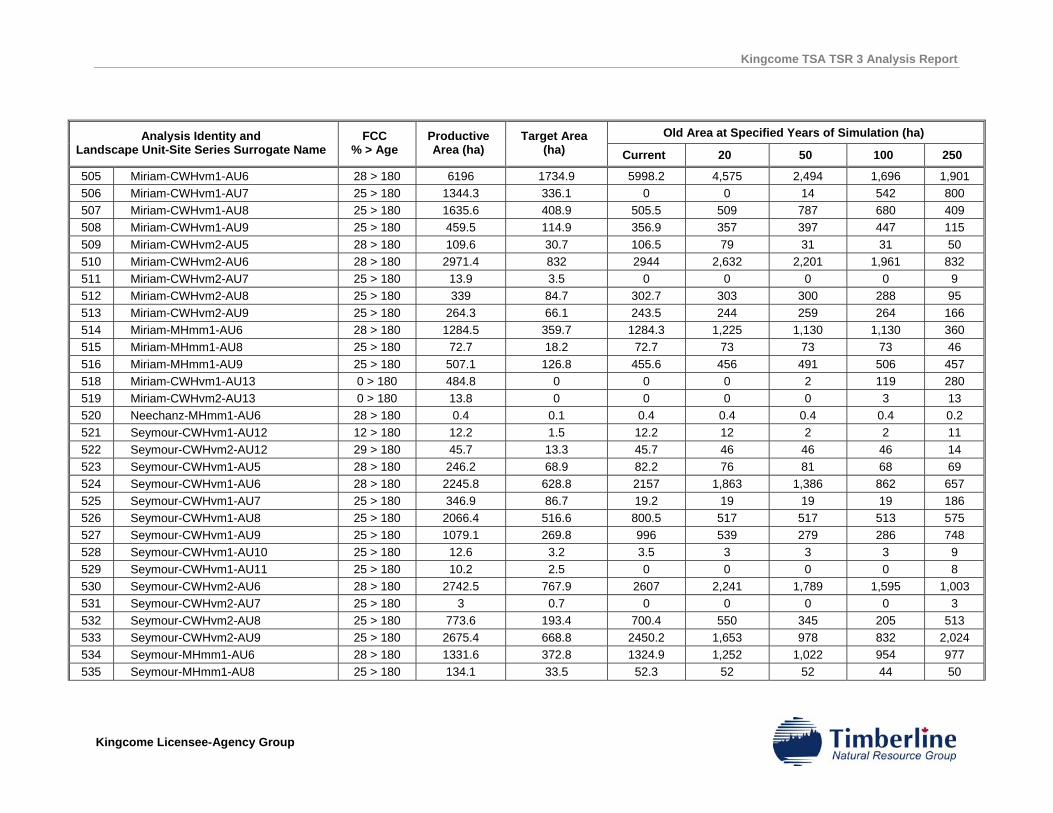
Kingcome TSA TSR 3 Analysis Report
Kingcome Licensee-Agency Group
Old Area at Specified Years of Simulation (ha) Analysis Identity and Landscape Unit-Site Series Surrogate Name
FCC % > Age
Productive Area (ha)
Target Area (ha) Current 20 50 100 250
505 Miriam-CWHvm1-AU6 28 > 180 6196 1734.9 5998.2 4,575 2,494 1,696 1,901 506 Miriam-CWHvm1-AU7 25 > 180 1344.3 336.1 0 0 14 542 800 507 Miriam-CWHvm1-AU8 25 > 180 1635.6 408.9 505.5 509 787 680 409 508 Miriam-CWHvm1-AU9 25 > 180 459.5 114.9 356.9 357 397 447 115 509 Miriam-CWHvm2-AU5 28 > 180 109.6 30.7 106.5 79 31 31 50 510 Miriam-CWHvm2-AU6 28 > 180 2971.4 832 2944 2,632 2,201 1,961 832 511 Miriam-CWHvm2-AU7 25 > 180 13.9 3.5 0 0 0 0 9 512 Miriam-CWHvm2-AU8 25 > 180 339 84.7 302.7 303 300 288 95 513 Miriam-CWHvm2-AU9 25 > 180 264.3 66.1 243.5 244 259 264 166 514 Miriam-MHmm1-AU6 28 > 180 1284.5 359.7 1284.3 1,225 1,130 1,130 360 515 Miriam-MHmm1-AU8 25 > 180 72.7 18.2 72.7 73 73 73 46 516 Miriam-MHmm1-AU9 25 > 180 507.1 126.8 455.6 456 491 506 457 518 Miriam-CWHvm1-AU13 0 > 180 484.8 0 0 0 2 119 280 519 Miriam-CWHvm2-AU13 0 > 180 13.8 0 0 0 0 3 13 520 Neechanz-MHmm1-AU6 28 > 180 0.4 0.1 0.4 0.4 0.4 0.4 0.2 521 Seymour-CWHvm1-AU12 12 > 180 12.2 1.5 12.2 12 2 2 11 522 Seymour-CWHvm2-AU12 29 > 180 45.7 13.3 45.7 46 46 46 14 523 Seymour-CWHvm1-AU5 28 > 180 246.2 68.9 82.2 76 81 68 69 524 Seymour-CWHvm1-AU6 28 > 180 2245.8 628.8 2157 1,863 1,386 862 657 525 Seymour-CWHvm1-AU7 25 > 180 346.9 86.7 19.2 19 19 19 186 526 Seymour-CWHvm1-AU8 25 > 180 2066.4 516.6 800.5 517 517 513 575 527 Seymour-CWHvm1-AU9 25 > 180 1079.1 269.8 996 539 279 286 748 528 Seymour-CWHvm1-AU10 25 > 180 12.6 3.2 3.5 3 3 3 9 529 Seymour-CWHvm1-AU11 25 > 180 10.2 2.5 0 0 0 0 8 530 Seymour-CWHvm2-AU6 28 > 180 2742.5 767.9 2607 2,241 1,789 1,595 1,003 531 Seymour-CWHvm2-AU7 25 > 180 3 0.7 0 0 0 0 3 532 Seymour-CWHvm2-AU8 25 > 180 773.6 193.4 700.4 550 345 205 513 533 Seymour-CWHvm2-AU9 25 > 180 2675.4 668.8 2450.2 1,653 978 832 2,024 534 Seymour-MHmm1-AU6 28 > 180 1331.6 372.8 1324.9 1,252 1,022 954 977 535 Seymour-MHmm1-AU8 25 > 180 134.1 33.5 52.3 52 52 44 50
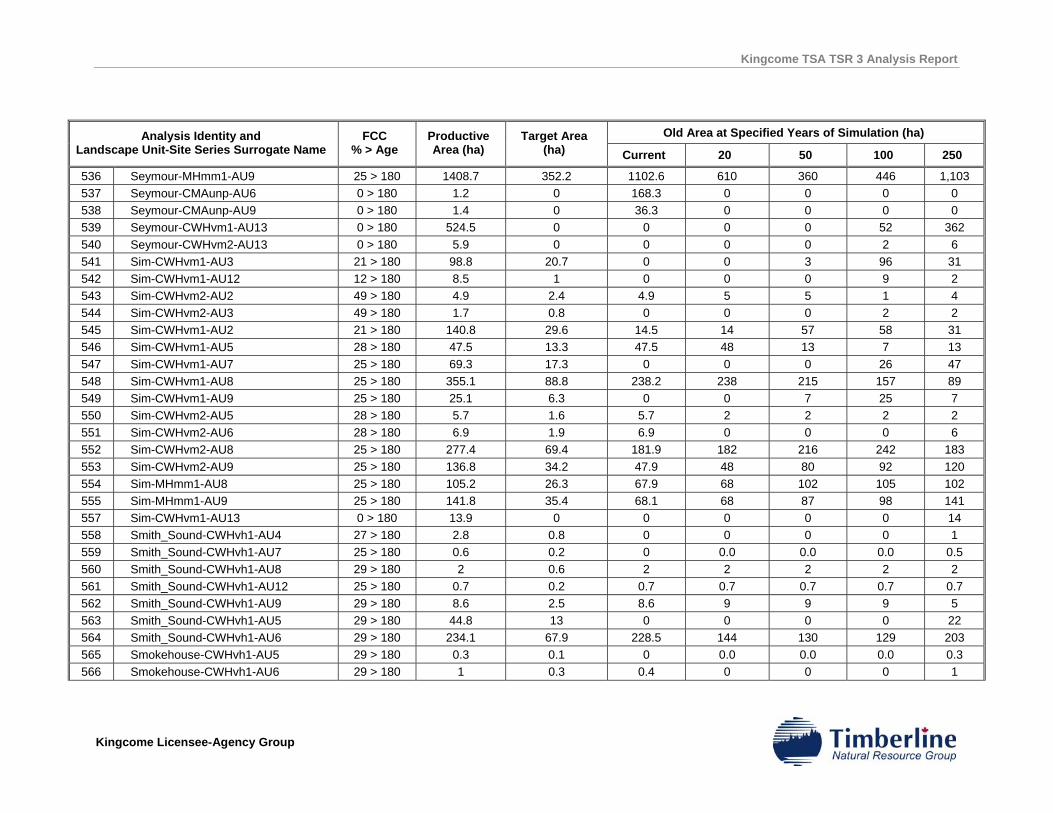
Kingcome TSA TSR 3 Analysis Report
Kingcome Licensee-Agency Group
Old Area at Specified Years of Simulation (ha) Analysis Identity and Landscape Unit-Site Series Surrogate Name
FCC % > Age
Productive Area (ha)
Target Area (ha) Current 20 50 100 250
536 Seymour-MHmm1-AU9 25 > 180 1408.7 352.2 1102.6 610 360 446 1,103 537 Seymour-CMAunp-AU6 0 > 180 1.2 0 168.3 0 0 0 0 538 Seymour-CMAunp-AU9 0 > 180 1.4 0 36.3 0 0 0 0 539 Seymour-CWHvm1-AU13 0 > 180 524.5 0 0 0 0 52 362 540 Seymour-CWHvm2-AU13 0 > 180 5.9 0 0 0 0 2 6 541 Sim-CWHvm1-AU3 21 > 180 98.8 20.7 0 0 3 96 31 542 Sim-CWHvm1-AU12 12 > 180 8.5 1 0 0 0 9 2 543 Sim-CWHvm2-AU2 49 > 180 4.9 2.4 4.9 5 5 1 4 544 Sim-CWHvm2-AU3 49 > 180 1.7 0.8 0 0 0 2 2 545 Sim-CWHvm1-AU2 21 > 180 140.8 29.6 14.5 14 57 58 31 546 Sim-CWHvm1-AU5 28 > 180 47.5 13.3 47.5 48 13 7 13 547 Sim-CWHvm1-AU7 25 > 180 69.3 17.3 0 0 0 26 47 548 Sim-CWHvm1-AU8 25 > 180 355.1 88.8 238.2 238 215 157 89 549 Sim-CWHvm1-AU9 25 > 180 25.1 6.3 0 0 7 25 7 550 Sim-CWHvm2-AU5 28 > 180 5.7 1.6 5.7 2 2 2 2 551 Sim-CWHvm2-AU6 28 > 180 6.9 1.9 6.9 0 0 0 6 552 Sim-CWHvm2-AU8 25 > 180 277.4 69.4 181.9 182 216 242 183 553 Sim-CWHvm2-AU9 25 > 180 136.8 34.2 47.9 48 80 92 120 554 Sim-MHmm1-AU8 25 > 180 105.2 26.3 67.9 68 102 105 102 555 Sim-MHmm1-AU9 25 > 180 141.8 35.4 68.1 68 87 98 141 557 Sim-CWHvm1-AU13 0 > 180 13.9 0 0 0 0 0 14 558 Smith_Sound-CWHvh1-AU4 27 > 180 2.8 0.8 0 0 0 0 1 559 Smith_Sound-CWHvh1-AU7 25 > 180 0.6 0.2 0 0.0 0.0 0.0 0.5 560 Smith_Sound-CWHvh1-AU8 29 > 180 2 0.6 2 2 2 2 2 561 Smith_Sound-CWHvh1-AU12 25 > 180 0.7 0.2 0.7 0.7 0.7 0.7 0.7 562 Smith_Sound-CWHvh1-AU9 29 > 180 8.6 2.5 8.6 9 9 9 5 563 Smith_Sound-CWHvh1-AU5 29 > 180 44.8 13 0 0 0 0 22 564 Smith_Sound-CWHvh1-AU6 29 > 180 234.1 67.9 228.5 144 130 129 203 565 Smokehouse-CWHvh1-AU5 29 > 180 0.3 0.1 0 0.0 0.0 0.0 0.3 566 Smokehouse-CWHvh1-AU6 29 > 180 1 0.3 0.4 0 0 0 1
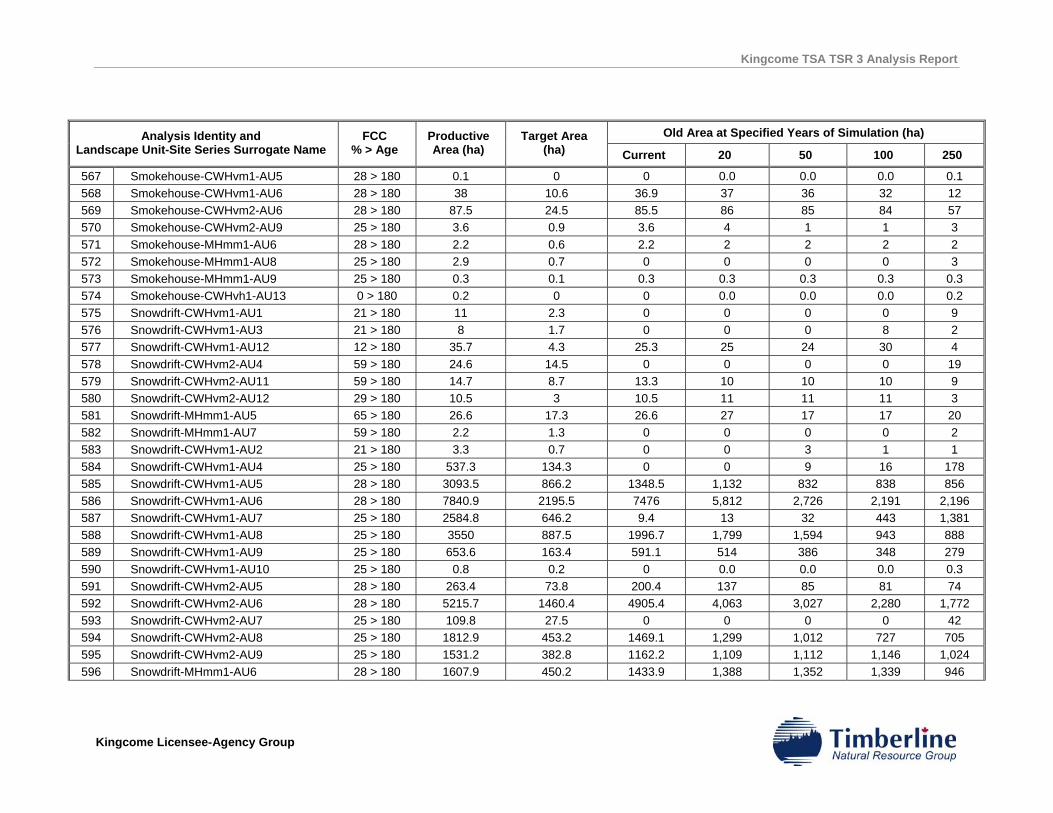
Kingcome TSA TSR 3 Analysis Report
Kingcome Licensee-Agency Group
Old Area at Specified Years of Simulation (ha) Analysis Identity and Landscape Unit-Site Series Surrogate Name
FCC % > Age
Productive Area (ha)
Target Area (ha) Current 20 50 100 250
567 Smokehouse-CWHvm1-AU5 28 > 180 0.1 0 0 0.0 0.0 0.0 0.1 568 Smokehouse-CWHvm1-AU6 28 > 180 38 10.6 36.9 37 36 32 12 569 Smokehouse-CWHvm2-AU6 28 > 180 87.5 24.5 85.5 86 85 84 57 570 Smokehouse-CWHvm2-AU9 25 > 180 3.6 0.9 3.6 4 1 1 3 571 Smokehouse-MHmm1-AU6 28 > 180 2.2 0.6 2.2 2 2 2 2 572 Smokehouse-MHmm1-AU8 25 > 180 2.9 0.7 0 0 0 0 3 573 Smokehouse-MHmm1-AU9 25 > 180 0.3 0.1 0.3 0.3 0.3 0.3 0.3 574 Smokehouse-CWHvh1-AU13 0 > 180 0.2 0 0 0.0 0.0 0.0 0.2 575 Snowdrift-CWHvm1-AU1 21 > 180 11 2.3 0 0 0 0 9 576 Snowdrift-CWHvm1-AU3 21 > 180 8 1.7 0 0 0 8 2 577 Snowdrift-CWHvm1-AU12 12 > 180 35.7 4.3 25.3 25 24 30 4 578 Snowdrift-CWHvm2-AU4 59 > 180 24.6 14.5 0 0 0 0 19 579 Snowdrift-CWHvm2-AU11 59 > 180 14.7 8.7 13.3 10 10 10 9 580 Snowdrift-CWHvm2-AU12 29 > 180 10.5 3 10.5 11 11 11 3 581 Snowdrift-MHmm1-AU5 65 > 180 26.6 17.3 26.6 27 17 17 20 582 Snowdrift-MHmm1-AU7 59 > 180 2.2 1.3 0 0 0 0 2 583 Snowdrift-CWHvm1-AU2 21 > 180 3.3 0.7 0 0 3 1 1 584 Snowdrift-CWHvm1-AU4 25 > 180 537.3 134.3 0 0 9 16 178 585 Snowdrift-CWHvm1-AU5 28 > 180 3093.5 866.2 1348.5 1,132 832 838 856 586 Snowdrift-CWHvm1-AU6 28 > 180 7840.9 2195.5 7476 5,812 2,726 2,191 2,196 587 Snowdrift-CWHvm1-AU7 25 > 180 2584.8 646.2 9.4 13 32 443 1,381 588 Snowdrift-CWHvm1-AU8 25 > 180 3550 887.5 1996.7 1,799 1,594 943 888 589 Snowdrift-CWHvm1-AU9 25 > 180 653.6 163.4 591.1 514 386 348 279 590 Snowdrift-CWHvm1-AU10 25 > 180 0.8 0.2 0 0.0 0.0 0.0 0.3 591 Snowdrift-CWHvm2-AU5 28 > 180 263.4 73.8 200.4 137 85 81 74 592 Snowdrift-CWHvm2-AU6 28 > 180 5215.7 1460.4 4905.4 4,063 3,027 2,280 1,772 593 Snowdrift-CWHvm2-AU7 25 > 180 109.8 27.5 0 0 0 0 42 594 Snowdrift-CWHvm2-AU8 25 > 180 1812.9 453.2 1469.1 1,299 1,012 727 705 595 Snowdrift-CWHvm2-AU9 25 > 180 1531.2 382.8 1162.2 1,109 1,112 1,146 1,024 596 Snowdrift-MHmm1-AU6 28 > 180 1607.9 450.2 1433.9 1,388 1,352 1,339 946
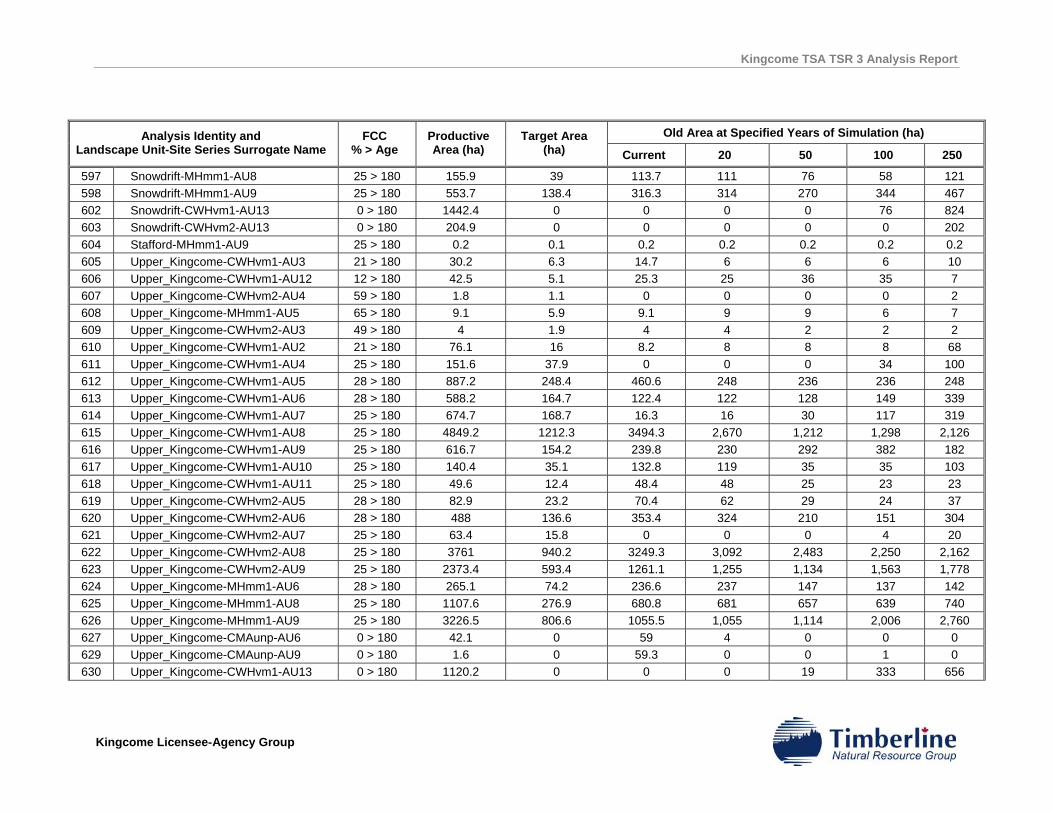
Kingcome TSA TSR 3 Analysis Report
Kingcome Licensee-Agency Group
Old Area at Specified Years of Simulation (ha) Analysis Identity and Landscape Unit-Site Series Surrogate Name
FCC % > Age
Productive Area (ha)
Target Area (ha) Current 20 50 100 250
597 Snowdrift-MHmm1-AU8 25 > 180 155.9 39 113.7 111 76 58 121 598 Snowdrift-MHmm1-AU9 25 > 180 553.7 138.4 316.3 314 270 344 467 602 Snowdrift-CWHvm1-AU13 0 > 180 1442.4 0 0 0 0 76 824 603 Snowdrift-CWHvm2-AU13 0 > 180 204.9 0 0 0 0 0 202 604 Stafford-MHmm1-AU9 25 > 180 0.2 0.1 0.2 0.2 0.2 0.2 0.2 605 Upper_Kingcome-CWHvm1-AU3 21 > 180 30.2 6.3 14.7 6 6 6 10 606 Upper_Kingcome-CWHvm1-AU12 12 > 180 42.5 5.1 25.3 25 36 35 7 607 Upper_Kingcome-CWHvm2-AU4 59 > 180 1.8 1.1 0 0 0 0 2 608 Upper_Kingcome-MHmm1-AU5 65 > 180 9.1 5.9 9.1 9 9 6 7 609 Upper_Kingcome-CWHvm2-AU3 49 > 180 4 1.9 4 4 2 2 2 610 Upper_Kingcome-CWHvm1-AU2 21 > 180 76.1 16 8.2 8 8 8 68 611 Upper_Kingcome-CWHvm1-AU4 25 > 180 151.6 37.9 0 0 0 34 100 612 Upper_Kingcome-CWHvm1-AU5 28 > 180 887.2 248.4 460.6 248 236 236 248 613 Upper_Kingcome-CWHvm1-AU6 28 > 180 588.2 164.7 122.4 122 128 149 339 614 Upper_Kingcome-CWHvm1-AU7 25 > 180 674.7 168.7 16.3 16 30 117 319 615 Upper_Kingcome-CWHvm1-AU8 25 > 180 4849.2 1212.3 3494.3 2,670 1,212 1,298 2,126 616 Upper_Kingcome-CWHvm1-AU9 25 > 180 616.7 154.2 239.8 230 292 382 182 617 Upper_Kingcome-CWHvm1-AU10 25 > 180 140.4 35.1 132.8 119 35 35 103 618 Upper_Kingcome-CWHvm1-AU11 25 > 180 49.6 12.4 48.4 48 25 23 23 619 Upper_Kingcome-CWHvm2-AU5 28 > 180 82.9 23.2 70.4 62 29 24 37 620 Upper_Kingcome-CWHvm2-AU6 28 > 180 488 136.6 353.4 324 210 151 304 621 Upper_Kingcome-CWHvm2-AU7 25 > 180 63.4 15.8 0 0 0 4 20 622 Upper_Kingcome-CWHvm2-AU8 25 > 180 3761 940.2 3249.3 3,092 2,483 2,250 2,162 623 Upper_Kingcome-CWHvm2-AU9 25 > 180 2373.4 593.4 1261.1 1,255 1,134 1,563 1,778 624 Upper_Kingcome-MHmm1-AU6 28 > 180 265.1 74.2 236.6 237 147 137 142 625 Upper_Kingcome-MHmm1-AU8 25 > 180 1107.6 276.9 680.8 681 657 639 740 626 Upper_Kingcome-MHmm1-AU9 25 > 180 3226.5 806.6 1055.5 1,055 1,114 2,006 2,760 627 Upper_Kingcome-CMAunp-AU6 0 > 180 42.1 0 59 4 0 0 0 629 Upper_Kingcome-CMAunp-AU9 0 > 180 1.6 0 59.3 0 0 1 0 630 Upper_Kingcome-CWHvm1-AU13 0 > 180 1120.2 0 0 0 19 333 656
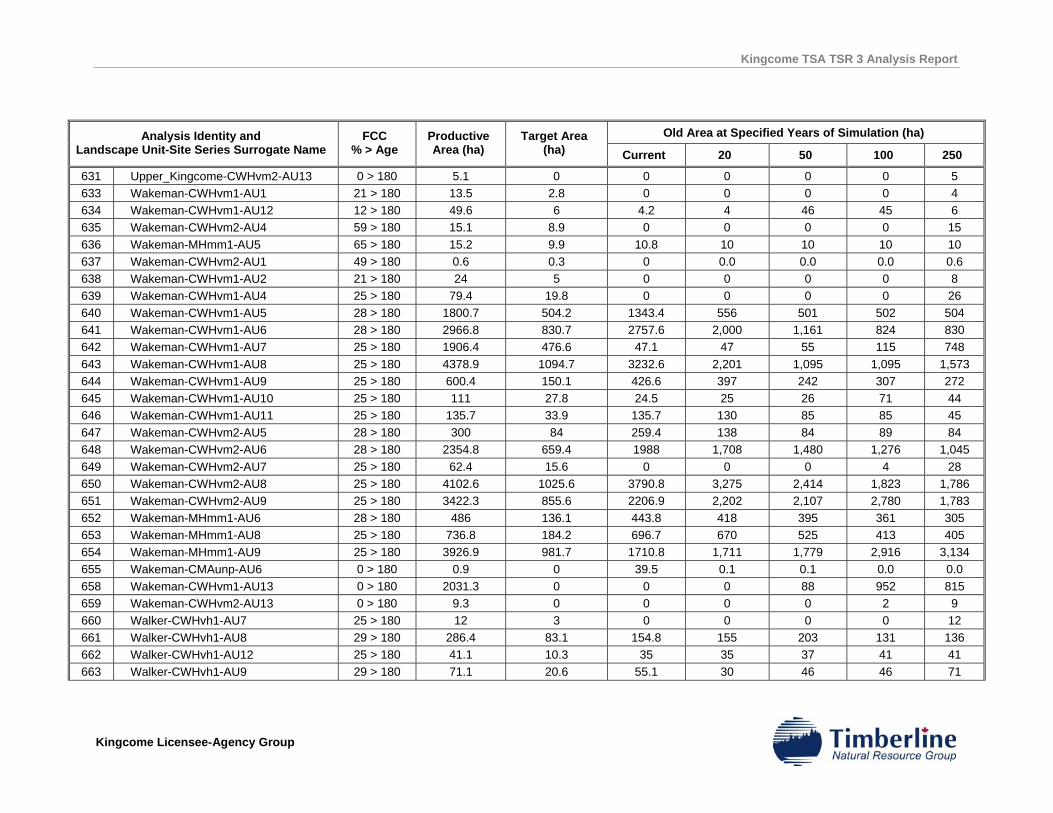
Kingcome TSA TSR 3 Analysis Report
Kingcome Licensee-Agency Group
Old Area at Specified Years of Simulation (ha) Analysis Identity and Landscape Unit-Site Series Surrogate Name
FCC % > Age
Productive Area (ha)
Target Area (ha) Current 20 50 100 250
631 Upper_Kingcome-CWHvm2-AU13 0 > 180 5.1 0 0 0 0 0 5 633 Wakeman-CWHvm1-AU1 21 > 180 13.5 2.8 0 0 0 0 4 634 Wakeman-CWHvm1-AU12 12 > 180 49.6 6 4.2 4 46 45 6 635 Wakeman-CWHvm2-AU4 59 > 180 15.1 8.9 0 0 0 0 15 636 Wakeman-MHmm1-AU5 65 > 180 15.2 9.9 10.8 10 10 10 10 637 Wakeman-CWHvm2-AU1 49 > 180 0.6 0.3 0 0.0 0.0 0.0 0.6 638 Wakeman-CWHvm1-AU2 21 > 180 24 5 0 0 0 0 8 639 Wakeman-CWHvm1-AU4 25 > 180 79.4 19.8 0 0 0 0 26 640 Wakeman-CWHvm1-AU5 28 > 180 1800.7 504.2 1343.4 556 501 502 504 641 Wakeman-CWHvm1-AU6 28 > 180 2966.8 830.7 2757.6 2,000 1,161 824 830 642 Wakeman-CWHvm1-AU7 25 > 180 1906.4 476.6 47.1 47 55 115 748 643 Wakeman-CWHvm1-AU8 25 > 180 4378.9 1094.7 3232.6 2,201 1,095 1,095 1,573 644 Wakeman-CWHvm1-AU9 25 > 180 600.4 150.1 426.6 397 242 307 272 645 Wakeman-CWHvm1-AU10 25 > 180 111 27.8 24.5 25 26 71 44 646 Wakeman-CWHvm1-AU11 25 > 180 135.7 33.9 135.7 130 85 85 45 647 Wakeman-CWHvm2-AU5 28 > 180 300 84 259.4 138 84 89 84 648 Wakeman-CWHvm2-AU6 28 > 180 2354.8 659.4 1988 1,708 1,480 1,276 1,045 649 Wakeman-CWHvm2-AU7 25 > 180 62.4 15.6 0 0 0 4 28 650 Wakeman-CWHvm2-AU8 25 > 180 4102.6 1025.6 3790.8 3,275 2,414 1,823 1,786 651 Wakeman-CWHvm2-AU9 25 > 180 3422.3 855.6 2206.9 2,202 2,107 2,780 1,783 652 Wakeman-MHmm1-AU6 28 > 180 486 136.1 443.8 418 395 361 305 653 Wakeman-MHmm1-AU8 25 > 180 736.8 184.2 696.7 670 525 413 405 654 Wakeman-MHmm1-AU9 25 > 180 3926.9 981.7 1710.8 1,711 1,779 2,916 3,134 655 Wakeman-CMAunp-AU6 0 > 180 0.9 0 39.5 0.1 0.1 0.0 0.0 658 Wakeman-CWHvm1-AU13 0 > 180 2031.3 0 0 0 88 952 815 659 Wakeman-CWHvm2-AU13 0 > 180 9.3 0 0 0 0 2 9 660 Walker-CWHvh1-AU7 25 > 180 12 3 0 0 0 0 12 661 Walker-CWHvh1-AU8 29 > 180 286.4 83.1 154.8 155 203 131 136 662 Walker-CWHvh1-AU12 25 > 180 41.1 10.3 35 35 37 41 41 663 Walker-CWHvh1-AU9 29 > 180 71.1 20.6 55.1 30 46 46 71
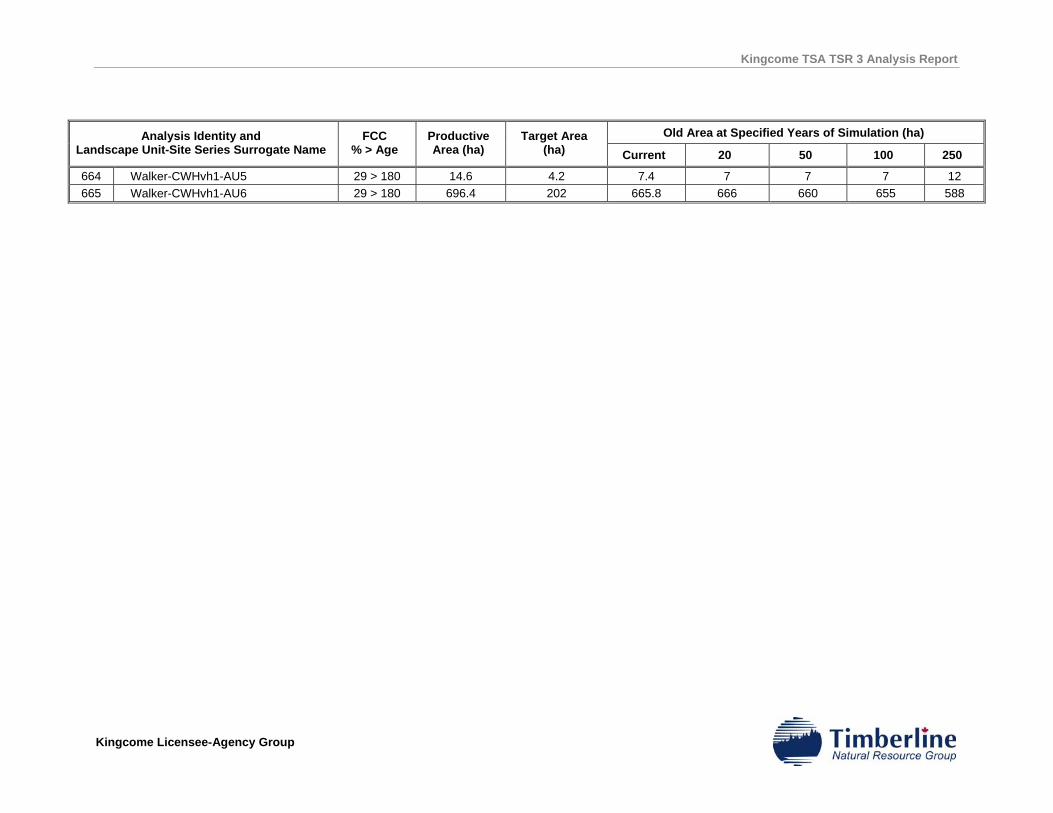
Kingcome TSA TSR 3 Analysis Report
Kingcome Licensee-Agency Group
Old Area at Specified Years of Simulation (ha) Analysis Identity and Landscape Unit-Site Series Surrogate Name
FCC % > Age
Productive Area (ha)
Target Area (ha) Current 20 50 100 250
664 Walker-CWHvh1-AU5 29 > 180 14.6 4.2 7.4 7 7 7 12 665 Walker-CWHvh1-AU6 29 > 180 696.4 202 665.8 666 660 655 588

Kingcome TSA TSR 3 Analysis Report
Kingcome Licensee-Agency Group
Kingcome TSA TSR 3 Analysis Report
Kingcome Licensee-Agency Group
APPENDIX II KINGCOME TIMBER SUPPLY AREA TSR3
OPERATIONAL PERFORMANCE IN THE INOPERABLE LAND BASE
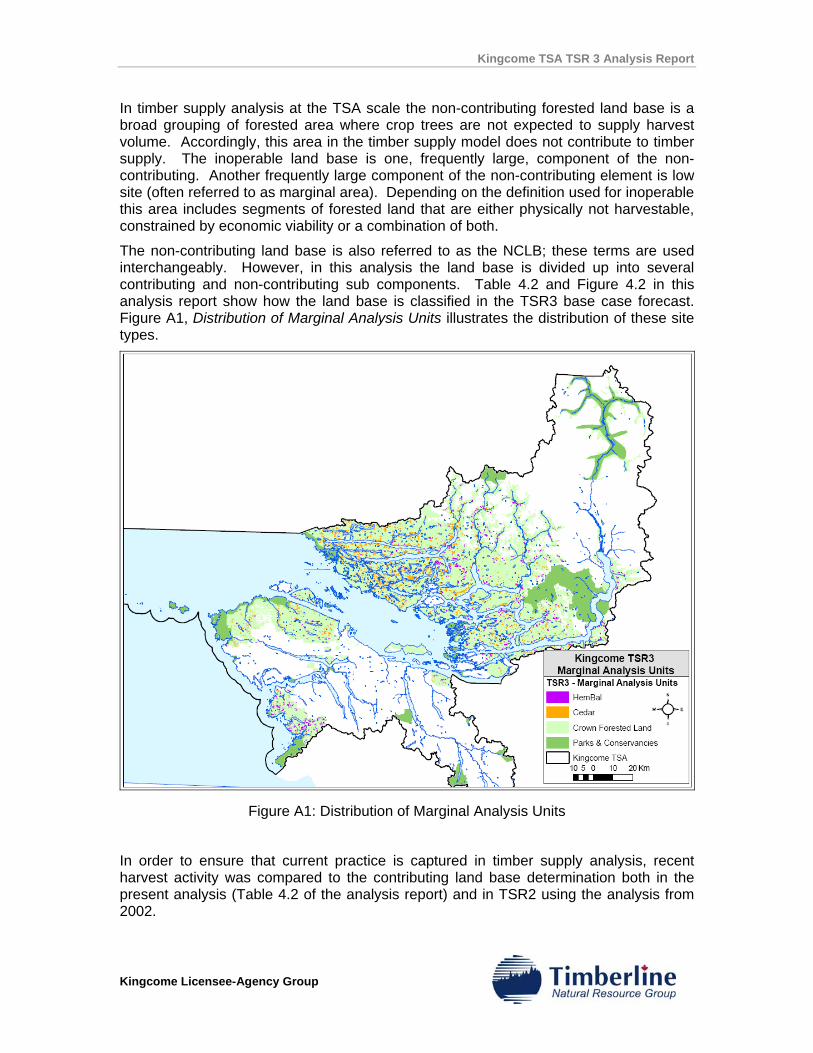
Kingcome TSA TSR 3 Analysis Report
Kingcome Licensee-Agency Group
In timber supply analysis at the TSA scale the non-contributing forested land base is a broad grouping of forested area where crop trees are not expected to supply harvest volume. Accordingly, this area in the timber supply model does not contribute to timber supply. The inoperable land base is one, frequently large, component of the non-contributing. Another frequently large component of the non-contributing element is low site (often referred to as marginal area). Depending on the definition used for inoperable this area includes segments of forested land that are either physically not harvestable, constrained by economic viability or a combination of both.
The non-contributing land base is also referred to as the NCLB; these terms are used interchangeably. However, in this analysis the land base is divided up into several contributing and non-contributing sub components. Table 4.2 and Figure 4.2 in this analysis report show how the land base is classified in the TSR3 base case forecast. Figure A1, Distribution of Marginal Analysis Units illustrates the distribution of these site types.
Figure A1: Distribution of Marginal Analysis Units
In order to ensure that current practice is captured in timber supply analysis, recent harvest activity was compared to the contributing land base determination both in the present analysis (Table 4.2 of the analysis report) and in TSR2 using the analysis from 2002.
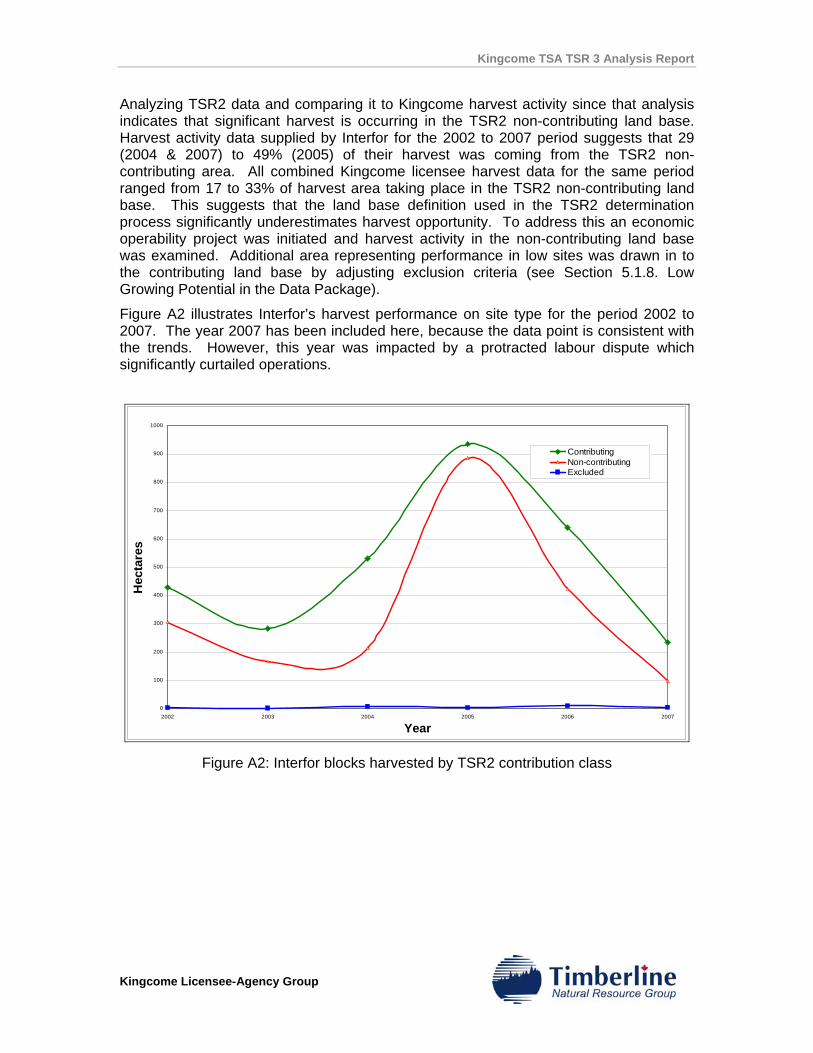
Kingcome TSA TSR 3 Analysis Report
Kingcome Licensee-Agency Group
Analyzing TSR2 data and comparing it to Kingcome harvest activity since that analysis indicates that significant harvest is occurring in the TSR2 non-contributing land base. Harvest activity data supplied by Interfor for the 2002 to 2007 period suggests that 29 (2004 & 2007) to 49% (2005) of their harvest was coming from the TSR2 non-contributing area. All combined Kingcome licensee harvest data for the same period ranged from 17 to 33% of harvest area taking place in the TSR2 non-contributing land base. This suggests that the land base definition used in the TSR2 determination process significantly underestimates harvest opportunity. To address this an economic operability project was initiated and harvest activity in the non-contributing land base was examined. Additional area representing performance in low sites was drawn in to the contributing land base by adjusting exclusion criteria (see Section 5.1.8. Low Growing Potential in the Data Package).
Figure A2 illustrates Interfor’s harvest performance on site type for the period 2002 to 2007. The year 2007 has been included here, because the data point is consistent with the trends. However, this year was impacted by a protracted labour dispute which significantly curtailed operations.
0
100
200
300
400
500
600
700
800
900
1000
2002 2003 2004 2005 2006 2007
Year
Hec
tare
s
ContributingNon-contributingExcluded
Figure A2: Interfor blocks harvested by TSR2 contribution class
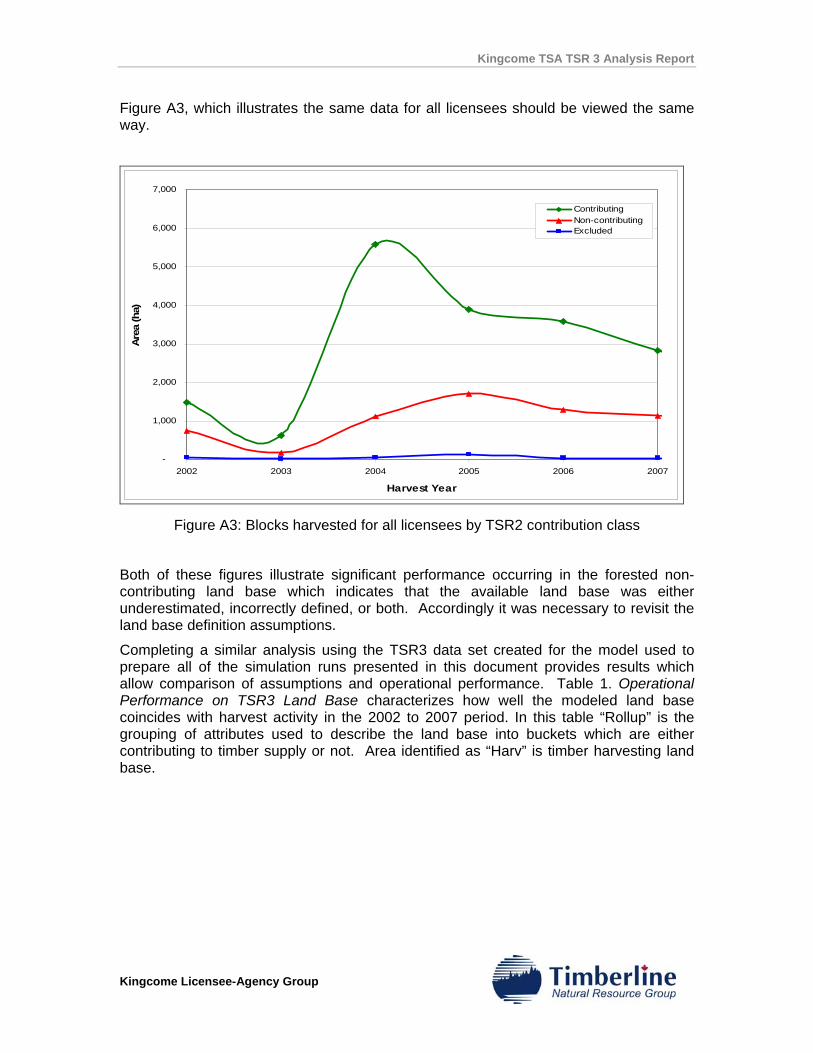
Kingcome TSA TSR 3 Analysis Report
Kingcome Licensee-Agency Group
Figure A3, which illustrates the same data for all licensees should be viewed the same way.
-
1,000
2,000
3,000
4,000
5,000
6,000
7,000
2002 2003 2004 2005 2006 2007
Harvest Year
Are
a (h
a)
ContributingNon-contributingExcluded
Figure A3: Blocks harvested for all licensees by TSR2 contribution class
Both of these figures illustrate significant performance occurring in the forested non-contributing land base which indicates that the available land base was either underestimated, incorrectly defined, or both. Accordingly it was necessary to revisit the land base definition assumptions.
Completing a similar analysis using the TSR3 data set created for the model used to prepare all of the simulation runs presented in this document provides results which allow comparison of assumptions and operational performance. Table 1. Operational Performance on TSR3 Land Base characterizes how well the modeled land base coincides with harvest activity in the 2002 to 2007 period. In this table “Rollup” is the grouping of attributes used to describe the land base into buckets which are either contributing to timber supply or not. Area identified as “Harv” is timber harvesting land base.
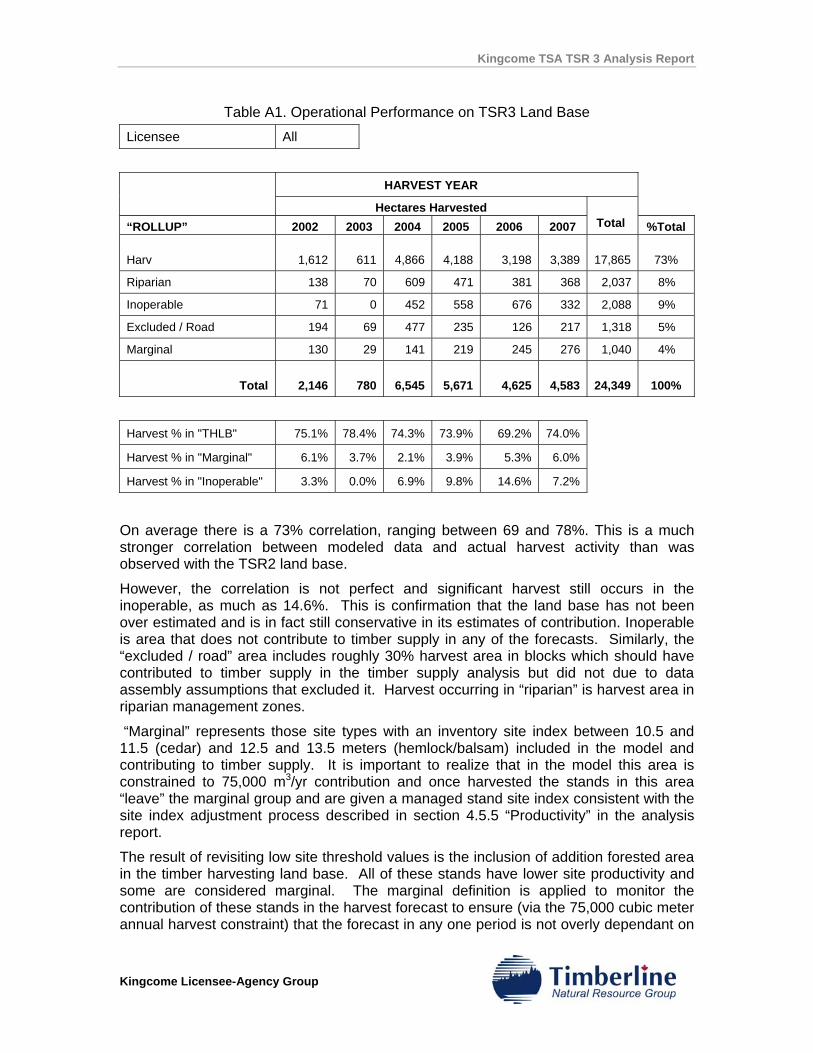
Kingcome TSA TSR 3 Analysis Report
Kingcome Licensee-Agency Group
Table A1. Operational Performance on TSR3 Land Base Licensee All
HARVEST YEAR
Hectares Harvested “ROLLUP” 2002 2003 2004 2005 2006 2007 Total %Total
Harv 1,612 611
4,866 4,188 3,198 3,389
17,865 73%
Riparian 138 70 609 471 381 368 2,037 8%
Inoperable 71 0 452 558 676 332 2,088 9%
Excluded / Road 194 69 477 235 126 217 1,318 5%
Marginal 130 29 141 219 245 276 1,040 4%
Total 2,146 780
6,545
5,671 4,625
4,583
24,349 100%
Harvest % in "THLB" 75.1% 78.4% 74.3% 73.9% 69.2% 74.0%
Harvest % in "Marginal" 6.1% 3.7% 2.1% 3.9% 5.3% 6.0%
Harvest % in "Inoperable" 3.3% 0.0% 6.9% 9.8% 14.6% 7.2%
On average there is a 73% correlation, ranging between 69 and 78%. This is a much stronger correlation between modeled data and actual harvest activity than was observed with the TSR2 land base.
However, the correlation is not perfect and significant harvest still occurs in the inoperable, as much as 14.6%. This is confirmation that the land base has not been over estimated and is in fact still conservative in its estimates of contribution. Inoperable is area that does not contribute to timber supply in any of the forecasts. Similarly, the “excluded / road” area includes roughly 30% harvest area in blocks which should have contributed to timber supply in the timber supply analysis but did not due to data assembly assumptions that excluded it. Harvest occurring in “riparian” is harvest area in riparian management zones.
“Marginal” represents those site types with an inventory site index between 10.5 and 11.5 (cedar) and 12.5 and 13.5 meters (hemlock/balsam) included in the model and contributing to timber supply. It is important to realize that in the model this area is constrained to 75,000 m3/yr contribution and once harvested the stands in this area “leave” the marginal group and are given a managed stand site index consistent with the site index adjustment process described in section 4.5.5 “Productivity” in the analysis report.
The result of revisiting low site threshold values is the inclusion of addition forested area in the timber harvesting land base. All of these stands have lower site productivity and some are considered marginal. The marginal definition is applied to monitor the contribution of these stands in the harvest forecast to ensure (via the 75,000 cubic meter annual harvest constraint) that the forecast in any one period is not overly dependant on
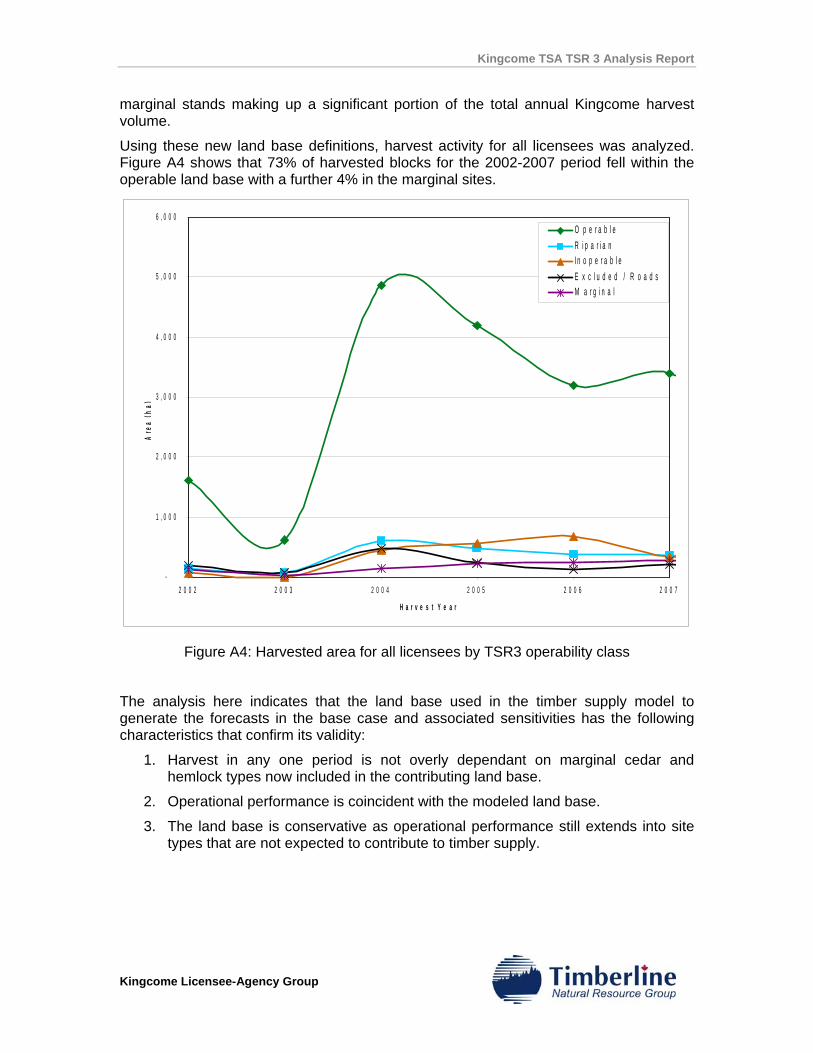
Kingcome TSA TSR 3 Analysis Report
Kingcome Licensee-Agency Group
marginal stands making up a significant portion of the total annual Kingcome harvest volume.
Using these new land base definitions, harvest activity for all licensees was analyzed. Figure A4 shows that 73% of harvested blocks for the 2002-2007 period fell within the operable land base with a further 4% in the marginal sites.
-
1 , 0 0 0
2 , 0 0 0
3 , 0 0 0
4 , 0 0 0
5 , 0 0 0
6 , 0 0 0
2 0 0 2 2 0 0 3 2 0 0 4 2 0 0 5 2 0 0 6 2 0 0 7
H a r v e s t Y e a r
Are
a(h
a)
O p e r a b l e R i p a r i a nI n o p e r a b l eE x c l u d e d / R o a d sM a r g i n a l
Figure A4: Harvested area for all licensees by TSR3 operability class
The analysis here indicates that the land base used in the timber supply model to generate the forecasts in the base case and associated sensitivities has the following characteristics that confirm its validity:
1. Harvest in any one period is not overly dependant on marginal cedar and hemlock types now included in the contributing land base.
2. Operational performance is coincident with the modeled land base.
3. The land base is conservative as operational performance still extends into site types that are not expected to contribute to timber supply.
Kingcome TSA TSR 3 Analysis Report
Kingcome Licensee-Agency Group
APPENDIX III KINGCOME TIMBER SUPPLY AREA TSR3
SOCIO-ECONOMIC ANALYSIS

Kingcome TSA TSR 3 Analysis Report
Kingcome Licensee-Agency Group
Robinson Consulting and
Associates Ltd.
KINGCOME TIMBER SUPPLY AREA TSR 3 SOCIO-ECONOMIC ASSESSMENT
Prepared for:
Kingcome TSA Licensee-Agency Group
Prepared by:
Robinson Consulting and Associates Ltd.
Victoria, B.C.
and
Timberline Natural Resource Group Ltd.
Victoria, B.C.
Project: 4061921
September 2008

Kingcome TSA TSR 3 Socio-Economic Assessment
Kingcome Licensee-Agency Group
Robinson Consulting andAssociates Ltd.
Kingcome TSA TSR 3 Socio-Economic Assessment
TABLE OF CONTENTS
1.0 INTRODUCTION ............................................................................................................. 1 1.1 OVERVIEW ........................................................................................................................... 1 1.2 POPULATION ........................................................................................................................ 2
1.2.1 Historical Population .............................................................................................. 2 1.2.2 Population Characteristics...................................................................................... 3 1.2.3 Population Forecast ................................................................................................ 3 1.2.4 First Nation Communities ....................................................................................... 4
1.3 SOCIO-ECONOMIC INDICATORS........................................................................................... 4 1.4 ECONOMIC PROFILE............................................................................................................. 5
1.4.1 Labour Force........................................................................................................... 5 1.4.2 Employment Income ................................................................................................ 7
1.5 ECONOMIC DEPENDENCY AND TRENDS .............................................................................. 8 2.0 FOREST INDUSTRY PROFILE .................................................................................. 10 2.1 KINGCOME TSA ALLOWABLE ANNUAL CUT AND HARVEST HISTORY ............................ 10 2.2 KINGCOME TSA MAJOR LICENSEES.................................................................................. 13 3.0 SOCIO-ECONOMIC IMPLICATIONS OF THE BASE CASE TIMBER SUPPLY FORECAST ................................................................................................................................. 17 3.1 EMPLOYMENT AND INCOME IMPLICATIONS IN THE KINGCOME TSA ............................... 17 3.2 PROVINCIAL EMPLOYMENT AND INCOME IMPLICATIONS ................................................. 20 3.3 GOVERNMENT REVENUE IMPLICATIONS ........................................................................... 20 3.4 COMMUNITY IMPLICATIONS.............................................................................................. 20 4.0 REFERENCES ................................................................................................................ 21
LIST OF FIGURES
Figure 2.1 – Harvest billing history............................................................................................... 10
LIST OF TABLES
Table 1.1 – Population trends in the Kingcome TSA, 1986 to 2007............................................... 3 Table 1.2 - Age Characteristics, 2006. ............................................................................................ 3 Table 1.3 - Forecast and comparison of the Mt. Waddington Regional District population........... 4 Table 1.4 - Index of Social Conditions, 2006.................................................................................. 4 Table 1.5 – Mount Waddington labour force and change in labour force compared to British
Columbia, 2001 and 2006........................................................................................................ 6 Table 1.6 - Share of employment income and median employment income, 2006 ........................ 7 Table 1.7 - Average income by basic industry in North Island Forest District, 2000 ..................... 7
Kingcome Licensee-Agency Group iii
Robinson Consulting andAssociates Ltd.
Kingcome TSA TSR 3 Socio-Economic Assessment
Kingcome Licensee-Agency Group iv
Robinson Consulting andAssociates Ltd.
Table 1.8 - Average change wage rates in B.C. by key sectors between 2000 and 2007................ 8 Table 1.9 - Trend in economic dependency by basic sectors (% of total area’s income)................ 9 Table 1.10 – Indirect and induced employment per 100 direct basic industry jobs ........................ 9 Table 2.1 - Kingcome TSA apportionment table1 ......................................................................... 11 Table 2.2 – Volume harvested by type of license (m3/year).......................................................... 11 Table 2.3 – Timber processing facilities in North Island-Central Coast Forest District ............... 13 Table 2.4 - Mill & Timber Products Ltd harvest and direct employment statistics ...................... 14 Table 2.5 - Comparison of forest sector contributions .................................................................. 16 Table 3.1 - Socio-economic impacts of the base case harvest forecast ......................................... 18 Table 3.2 - Socio-economic impacts of the base case harvest forecast compared to Pre-EBM.... 19
LIST OF APPENDICES
APPENDIX I – VALUES AND ASSUMPTIONS FOR ESTIMATING ECONOMIC IMPACTS
Kingcome TSA TSR 3 Socio-Economic Assessment
Kingcome Licensee-Agency Group 1
Robinson Consulting andAssociates Ltd.
1.0 INTRODUCTION
The impact of timber supply adjustments on local communities and the provincial economy is an important consideration in the Chief Forester’s allowable annual cut (AAC) determination. This socio-economic assessment identifies the employment and economic activity presently supported by the Kingcome Timber Supply Area (TSA) harvest, which provides the basis for projecting future levels of economic activity given the base case timber supply forecast.
This report includes: • An overview of the Kingcome TSAs demographic and social characteristics, a
description of its main communities and its primary economic drivers; • A survey of the forest industry active in the Kingcome TSA forest industry, recent trends,
and the contribution of the TSA’s timber supply to local and provincial economies; and • An analysis of the socio-economic implications of the base case timber supply forecast.
TSA Profile
1.1 Overview
The Kingcome TSA covers an area of about 1.14 million hectares, mostly on the mainland from Knight Inlet in the south, northwest to Cape Caution and northeast to Tweedsmuir Park. Smaller portions of the TSA are on northern Vancouver Island. The TSA is also bounded, or close to tree farm licenses (TFLs) 6, 37, 39, 45 and 47. The TSA is within the North Island-Central Coast Forest District, with its main office located in Port McNeill and a field office in Hagensborg (Bella Coola Valley)1 (Figure 2.1 in the Analysis Report).
The topography of the TSA is diverse, ranging from the coastal lowlands to the rugged Coast Range Mountains. Five biogeoclimatic zones cover the area, reflecting this diversity. Productive forest land is primarily found in two zones, the Coastal Western Hemlock (CWH) and the Mountain Hemlock (MH) zones. The former zone occurs from sea level to 1000 meters elevation. It experiences high precipitation, and is characterized by cool summers and mild winters. Western hemlock is the dominate tree species, with other species such as amabilis fir, Douglas-fir, western redcedar, Sitka spruce, maple and alder occurring depending on local conditions. The MH zone is above the CWH zone. It has a sub-alpine climate, with short cool summers and long, cool, wet winters. The deep snow pack is slow to disappear, resulting in a short growing season. Mountain hemlock is the most prevalent tree species, with amabilis fir and yellow cedar also common. While timber harvesting has a long history in the TSA, most of it has occurred in the past thirty years. (MoF, 2001).
In addition to supporting industrial timber harvesting activities, the TSA land base provides tourism and recreation opportunities, community water supply, habitats for wildlife and fish. Most of the recreation is marine oriented (e.g. boating, fishing, whale watching, kayaking) and is growing in popularity. The management of the various uses of the TSA’s land base is addressed by the two strategic land use plans. The Vancouver Island Land Use Plan pertains to the Island portion of the TSA, and the recently announced Central Coast LRMP provides direction for the 1 In 2003 the Port McNeill and Mid-Coast forest districts were combined to become the North Island-Central Coast Forest District. Where the information is available, it is reported at the Port McNeill District boundaries this more closely corresponds to the TSA geography.
Kingcome TSA TSR 3 Socio-Economic Assessment
Kingcome Licensee-Agency Group 2
Robinson Consulting andAssociates Ltd.
mainland portion and the islands between Vancouver Island and the mainland. These strategic land use plans affect timber supply by the creation of protected areas over land that had been available for harvest, and by modifying timber management to address non-timber objectives.
The productive forest land base covers about 650,696 ha, or about 57 percent of the TSA’s total land base when parks, protected areas and inoperable area is included. However, much less land is available for harvest. Removing, parks protected areas and the inoperable the productive land base is reduced to 376,452 ha or about 33% of the TSA’s total land base. The operable forest is further reduced by 101,077 ha to address sites with low growing potential which are not considered economically operable. The remaining productive forest area is then reduced by an additional 67,201 ha to address forest management objectives and 18,996 ha to address EBM specific objectives which require land base removals.
The TSA is sparsely settled. The larger communities are Port Hardy, Port McNeill and Port Alice are on Vancouver Island. Smaller communities include Alert Bay and Sointula. There are 15 First Nations bands that have traditional territories in the TSA. The traditional territories are on Vancouver Island and the mainland, but most of the First Nations people reside on Vancouver Island due to historic relocations. The larger settlements include Fort Rupert, Tsulquate reserve, Quatsino, and Namgis.
In the following section, various statistics are used to profile the plan area social and economic trends and conditions. This includes trends in population and various social statistics relating to measures of crime, health, education. This provides the context for understanding the role the forest industry presently plays in the TSA’s communities, and a basis for considering the implications of future timber supply scenarios.
1.2 Population
1.2.1 Historical Population In 2007, the total population of the Mount Waddington Regional District was approximately 12,300 persons.2 The population in the regional district peaked at approximately 16,000 in 1984 and has trended downward since 1993, when it stabilized at 14,350. Population recovered slightly in the mid-1990’s but has once again slipped into a period of negative growth (Table 1.1). Port Alice and Port Hardy were particularly hard hit. A contributing factor to this decline is the out-migration of persons seeking better economic prospects. The economic challenges in the region will be discussed in the economic profile that follows.
2 The Mount Waddington Regional District is used here as proxy for the Kingcome TSA. The geographical boundaries are similar. Census data is readily available for regional districts but not for the TSA geography.
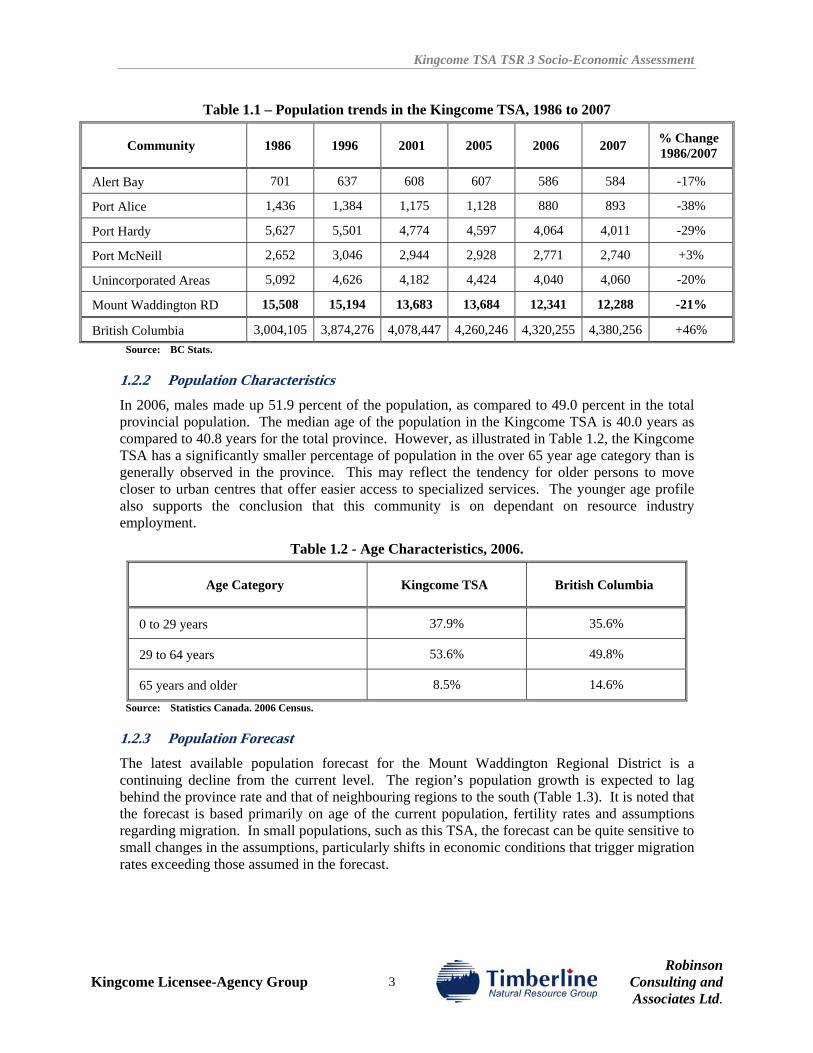
Kingcome TSA TSR 3 Socio-Economic Assessment
Table 1.1 – Population trends in the Kingcome TSA, 1986 to 2007
Community 1986 1996 2001 2005 2006 2007 % Change 1986/2007
Alert Bay 701 637 608 607 586 584 -17%
Port Alice 1,436 1,384 1,175 1,128 880 893 -38%
Port Hardy 5,627 5,501 4,774 4,597 4,064 4,011 -29%
Port McNeill 2,652 3,046 2,944 2,928 2,771 2,740 +3%
Unincorporated Areas 5,092 4,626 4,182 4,424 4,040 4,060 -20%
Mount Waddington RD 15,508 15,194 13,683 13,684 12,341 12,288 -21%
British Columbia 3,004,105 3,874,276 4,078,447 4,260,246 4,320,255 4,380,256 +46% Source: BC Stats.
1.2.2 Population Characteristics In 2006, males made up 51.9 percent of the population, as compared to 49.0 percent in the total provincial population. The median age of the population in the Kingcome TSA is 40.0 years as compared to 40.8 years for the total province. However, as illustrated in Table 1.2, the Kingcome TSA has a significantly smaller percentage of population in the over 65 year age category than is generally observed in the province. This may reflect the tendency for older persons to move closer to urban centres that offer easier access to specialized services. The younger age profile also supports the conclusion that this community is on dependant on resource industry employment.
Table 1.2 - Age Characteristics, 2006.
Age Category Kingcome TSA British Columbia
0 to 29 years 37.9% 35.6%
29 to 64 years 53.6% 49.8%
65 years and older 8.5% 14.6%
Source: Statistics Canada. 2006 Census.
1.2.3 Population Forecast The latest available population forecast for the Mount Waddington Regional District is a continuing decline from the current level. The region’s population growth is expected to lag behind the province rate and that of neighbouring regions to the south (Table 1.3). It is noted that the forecast is based primarily on age of the current population, fertility rates and assumptions regarding migration. In small populations, such as this TSA, the forecast can be quite sensitive to small changes in the assumptions, particularly shifts in economic conditions that trigger migration rates exceeding those assumed in the forecast.
Kingcome Licensee-Agency Group 3
Robinson Consulting andAssociates Ltd.
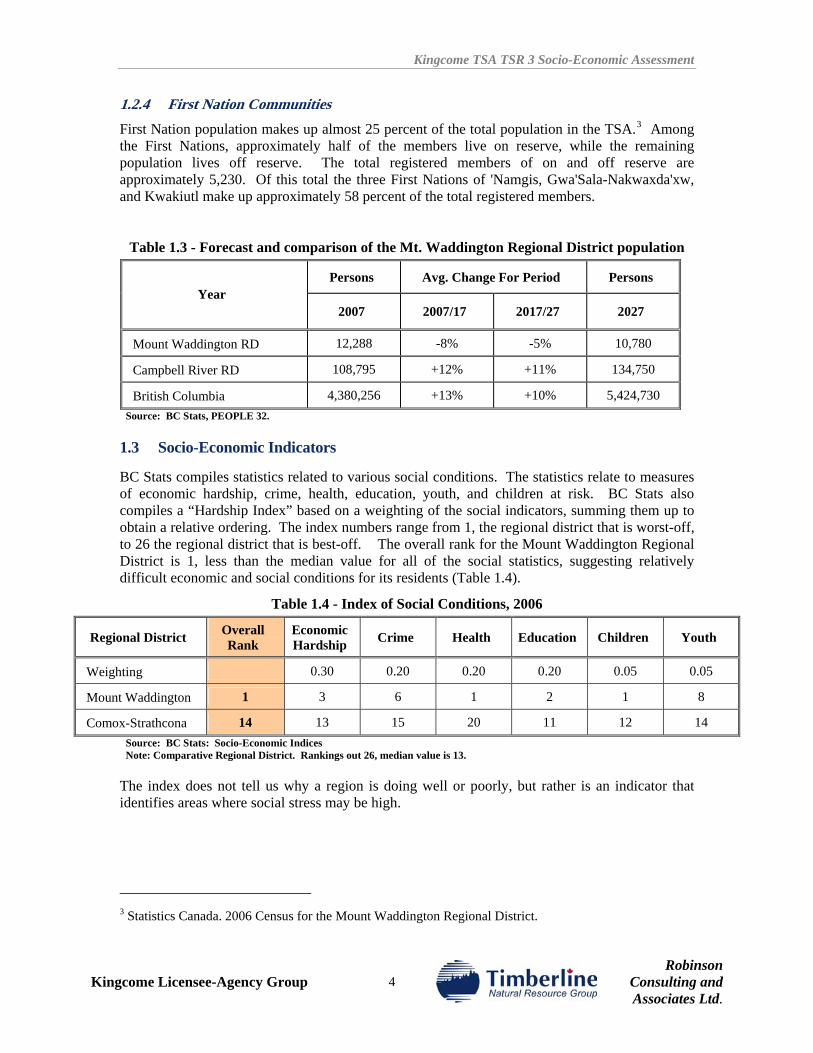
Kingcome TSA TSR 3 Socio-Economic Assessment
Kingcome Licensee-Agency Group 4
Robinson Consulting andAssociates Ltd.
1.2.4 First Nation Communities First Nation population makes up almost 25 percent of the total population in the TSA.3 Among the First Nations, approximately half of the members live on reserve, while the remaining population lives off reserve. The total registered members of on and off reserve are approximately 5,230. Of this total the three First Nations of 'Namgis, Gwa'Sala-Nakwaxda'xw, and Kwakiutl make up approximately 58 percent of the total registered members.
Table 1.3 - Forecast and comparison of the Mt. Waddington Regional District population
Persons Avg. Change For Period Persons Year
2007 2007/17 2017/27 2027
Mount Waddington RD 12,288 -8% -5% 10,780
Campbell River RD 108,795 +12% +11% 134,750
British Columbia 4,380,256 +13% +10% 5,424,730 Source: BC Stats, PEOPLE 32.
1.3 Socio-Economic Indicators
BC Stats compiles statistics related to various social conditions. The statistics relate to measures of economic hardship, crime, health, education, youth, and children at risk. BC Stats also compiles a “Hardship Index” based on a weighting of the social indicators, summing them up to obtain a relative ordering. The index numbers range from 1, the regional district that is worst-off, to 26 the regional district that is best-off. The overall rank for the Mount Waddington Regional District is 1, less than the median value for all of the social statistics, suggesting relatively difficult economic and social conditions for its residents (Table 1.4).
Table 1.4 - Index of Social Conditions, 2006
Regional District Overall Rank
Economic Hardship Crime Health Education Children Youth
Weighting 0.30 0.20 0.20 0.20 0.05 0.05
Mount Waddington 1 3 6 1 2 1 8
Comox-Strathcona 14 13 15 20 11 12 14 Source: BC Stats: Socio-Economic Indices Note: Comparative Regional District. Rankings out 26, median value is 13.
The index does not tell us why a region is doing well or poorly, but rather is an indicator that identifies areas where social stress may be high.
3 Statistics Canada. 2006 Census for the Mount Waddington Regional District.
Kingcome TSA TSR 3 Socio-Economic Assessment
Kingcome Licensee-Agency Group 5
Robinson Consulting andAssociates Ltd.
1.4 Economic Profile
The economic profile begins by considering the size, change and make up of the local labour force. This is followed by the sources of income earned by local residents. It then proceeds to identify the basic industries that underpin the TSA economy, the relative importance of the sectors, and the trend in the sector’s contribution in recent years.
1.4.1 Labour Force Table 1.5 summarizes labour force by industry for the last two census periods for the TSA’s main communities and the Mount Waddington Regional District. The table also compares the change in the Regional District labour force to that of British Columbia.
The labour force in the Mount Waddington Regional District declined by 12 percent between 2001 and 2006, losing 935 persons to 6,610 persons at the last census. Over the same period, the labour force in the province grew by eight percent.
This decline was particularly evident in the TSA’s goods producing sector, which was down net 22 percent over the five year period. Again, over the same period, the provincial goods producing labour force increased by 11 percent. The forestry sector’s labour force is mostly found in the primary industries (i.e. logging, reported in NASICS #11) and manufacturing (e.g. sawmilling and pulp and paper in NASICS #31-33) industry classifications. The labour forces in both industry classifications were down sharply in 2006 from their respective 2001 levels. The reduction in the primary industry work force (i.e. fishing and logging) was most evident in Port McNeill while the decline in manufacturing labour force was concentrated in Port Alice and Port Hardy likely reflecting the closure of the pulp mill in Port Alice.
There were bright spots in the region’s economy over the period with Port McNeill seeing its service related labour force increase by 11 percent. Since the Census, Neucel has reopened the sulphite pulp mill in Port Alice (March 2006), renewing the operation’s substantial economic contribution to the community and the North Island. It employs close to 400 workers. Currently the second growth pulp content of the TSA is directed to Neucel which is a very positive synergy providing low cost fiber.
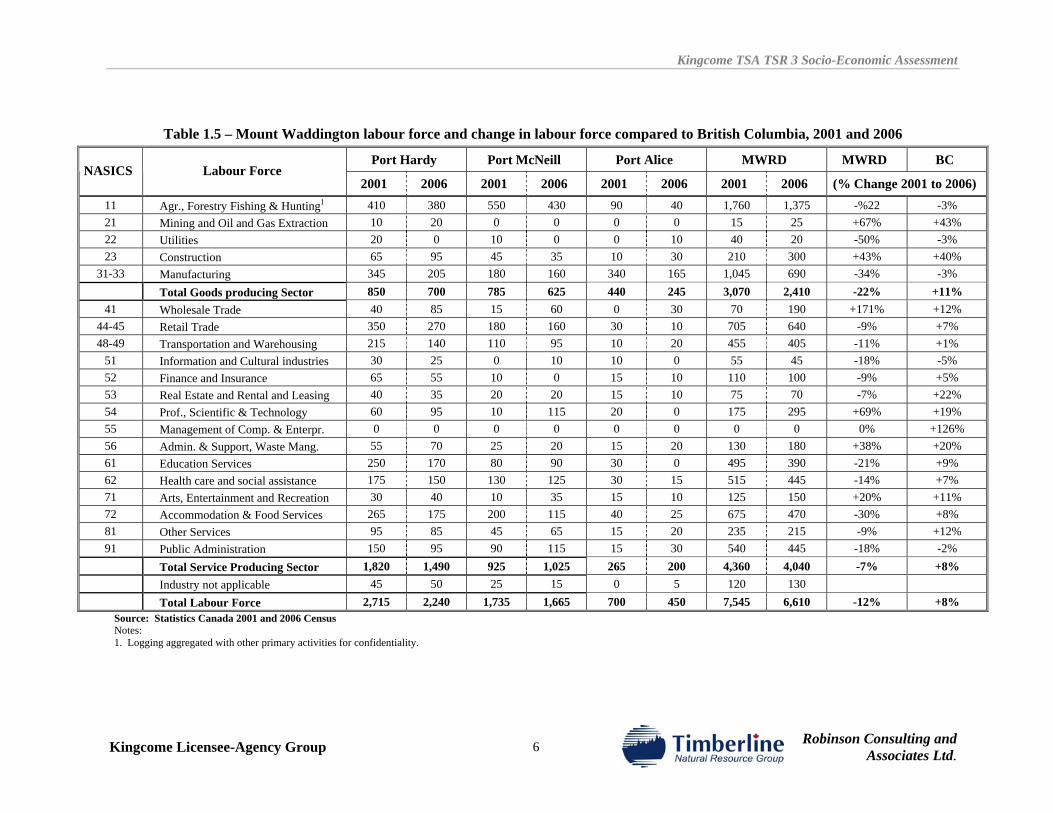
Kingcome TSA TSR 3 Socio-Economic Assessment
Table 1.5 – Mount Waddington labour force and change in labour force compared to British Columbia, 2001 and 2006
Port Hardy Port McNeill Port Alice MWRD MWRD BC NASICS Labour Force
2001 2006 2001 2006 2001 2006 2001 2006 (% Change 2001 to 2006) 11 Agr., Forestry Fishing & Hunting1 410 380 550 430 90 40 1,760 1,375 -%22 -3% 21 Mining and Oil and Gas Extraction 10 20 0 0 0 0 15 25 +67% +43% 22 Utilities 20 0 10 0 0 10 40 20 -50% -3% 23 Construction 65 95 45 35 10 30 210 300 +43% +40%
31-33 Manufacturing 345 205 180 160 340 165 1,045 690 -34% -3% Total Goods producing Sector 850 700 785 625 440 245 3,070 2,410 -22% +11%
41 Wholesale Trade 40 85 15 60 0 30 70 190 +171% +12% 44-45 Retail Trade 350 270 180 160 30 10 705 640 -9% +7% 48-49 Transportation and Warehousing 215 140 110 95 10 20 455 405 -11% +1%
51 Information and Cultural industries 30 25 0 10 10 0 55 45 -18% -5% 52 Finance and Insurance 65 55 10 0 15 10 110 100 -9% +5% 53 Real Estate and Rental and Leasing 40 35 20 20 15 10 75 70 -7% +22% 54 Prof., Scientific & Technology 60 95 10 115 20 0 175 295 +69% +19% 55 Management of Comp. & Enterpr. 0 0 0 0 0 0 0 0 0% +126% 56 Admin. & Support, Waste Mang. 55 70 25 20 15 20 130 180 +38% +20% 61 Education Services 250 170 80 90 30 0 495 390 -21% +9% 62 Health care and social assistance 175 150 130 125 30 15 515 445 -14% +7% 71 Arts, Entertainment and Recreation 30 40 10 35 15 10 125 150 +20% +11% 72 Accommodation & Food Services 265 175 200 115 40 25 675 470 -30% +8% 81 Other Services 95 85 45 65 15 20 235 215 -9% +12% 91 Public Administration 150 95 90 115 15 30 540 445 -18% -2% Total Service Producing Sector 1,820 1,490 925 1,025 265 200 4,360 4,040 -7% +8% Industry not applicable 45 50 25 15 0 5 120 130 Total Labour Force 2,715 2,240 1,735 1,665 700 450 7,545 6,610 -12% +8% Source: Statistics Canada 2001 and 2006 Census Notes: 1. Logging aggregated with other primary activities for confidentiality.
Kingcome Licensee-Agency Group 6 Robinson Consulting andAssociates Ltd.
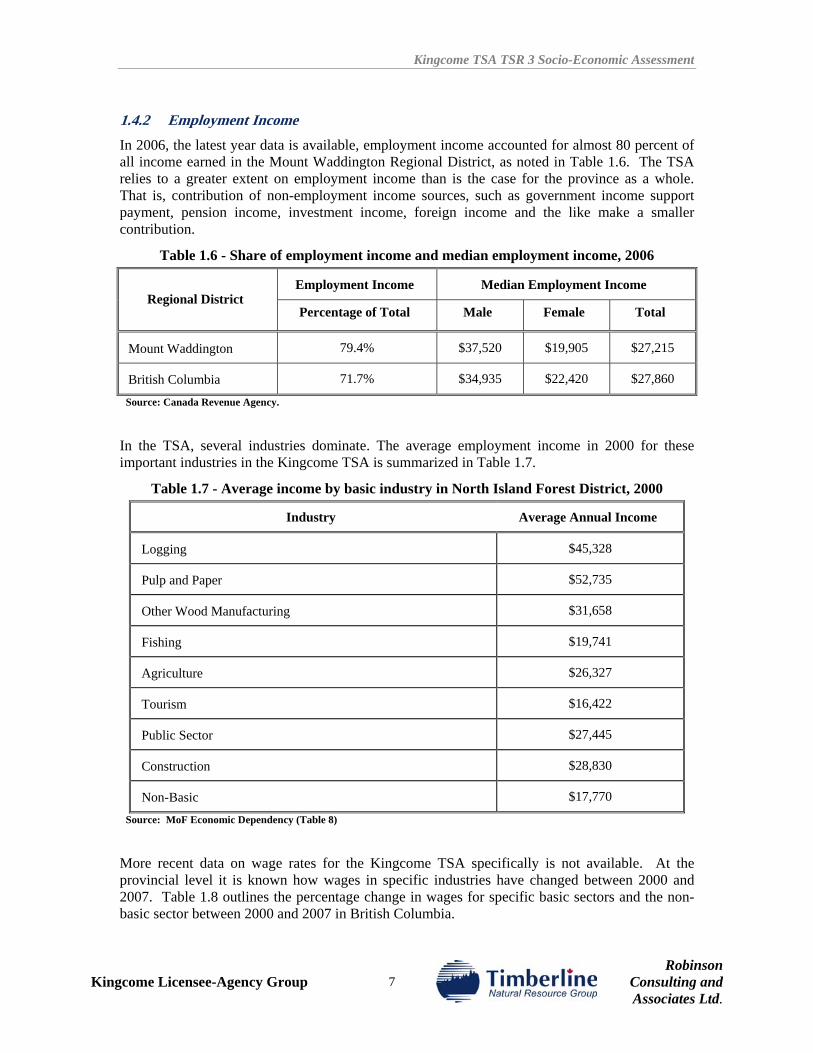
Kingcome TSA TSR 3 Socio-Economic Assessment
1.4.2 Employment Income In 2006, the latest year data is available, employment income accounted for almost 80 percent of all income earned in the Mount Waddington Regional District, as noted in Table 1.6. The TSA relies to a greater extent on employment income than is the case for the province as a whole. That is, contribution of non-employment income sources, such as government income support payment, pension income, investment income, foreign income and the like make a smaller contribution.
Table 1.6 - Share of employment income and median employment income, 2006
Employment Income Median Employment Income Regional District
Percentage of Total Male Female Total
Mount Waddington 79.4% $37,520 $19,905 $27,215
British Columbia 71.7% $34,935 $22,420 $27,860
Source: Canada Revenue Agency.
In the TSA, several industries dominate. The average employment income in 2000 for these important industries in the Kingcome TSA is summarized in Table 1.7.
Table 1.7 - Average income by basic industry in North Island Forest District, 2000
Industry Average Annual Income
Logging $45,328
Pulp and Paper $52,735
Other Wood Manufacturing $31,658
Fishing $19,741
Agriculture $26,327
Tourism $16,422
Public Sector $27,445
Construction $28,830
Non-Basic $17,770
Source: MoF Economic Dependency (Table 8)
More recent data on wage rates for the Kingcome TSA specifically is not available. At the provincial level it is known how wages in specific industries have changed between 2000 and 2007. Table 1.8 outlines the percentage change in wages for specific basic sectors and the non-basic sector between 2000 and 2007 in British Columbia.
Kingcome Licensee-Agency Group 7
Robinson Consulting andAssociates Ltd.
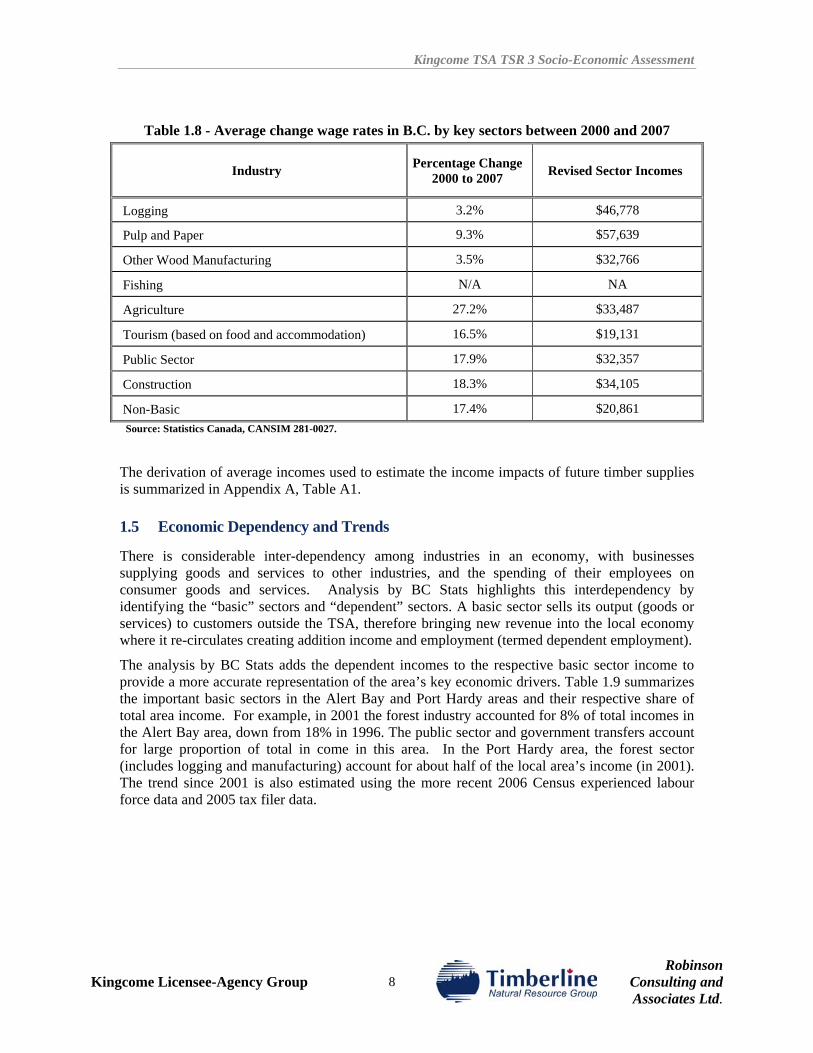
Kingcome TSA TSR 3 Socio-Economic Assessment
Table 1.8 - Average change wage rates in B.C. by key sectors between 2000 and 2007
Industry Percentage Change 2000 to 2007 Revised Sector Incomes
Logging 3.2% $46,778
Pulp and Paper 9.3% $57,639
Other Wood Manufacturing 3.5% $32,766
Fishing N/A NA
Agriculture 27.2% $33,487
Tourism (based on food and accommodation) 16.5% $19,131
Public Sector 17.9% $32,357
Construction 18.3% $34,105
Non-Basic 17.4% $20,861 Source: Statistics Canada, CANSIM 281-0027.
The derivation of average incomes used to estimate the income impacts of future timber supplies is summarized in Appendix A, Table A1.
1.5 Economic Dependency and Trends
There is considerable inter-dependency among industries in an economy, with businesses supplying goods and services to other industries, and the spending of their employees on consumer goods and services. Analysis by BC Stats highlights this interdependency by identifying the “basic” sectors and “dependent” sectors. A basic sector sells its output (goods or services) to customers outside the TSA, therefore bringing new revenue into the local economy where it re-circulates creating addition income and employment (termed dependent employment).
The analysis by BC Stats adds the dependent incomes to the respective basic sector income to provide a more accurate representation of the area’s key economic drivers. Table 1.9 summarizes the important basic sectors in the Alert Bay and Port Hardy areas and their respective share of total area income. For example, in 2001 the forest industry accounted for 8% of total incomes in the Alert Bay area, down from 18% in 1996. The public sector and government transfers account for large proportion of total in come in this area. In the Port Hardy area, the forest sector (includes logging and manufacturing) account for about half of the local area’s income (in 2001). The trend since 2001 is also estimated using the more recent 2006 Census experienced labour force data and 2005 tax filer data.
Kingcome Licensee-Agency Group 8
Robinson Consulting andAssociates Ltd.
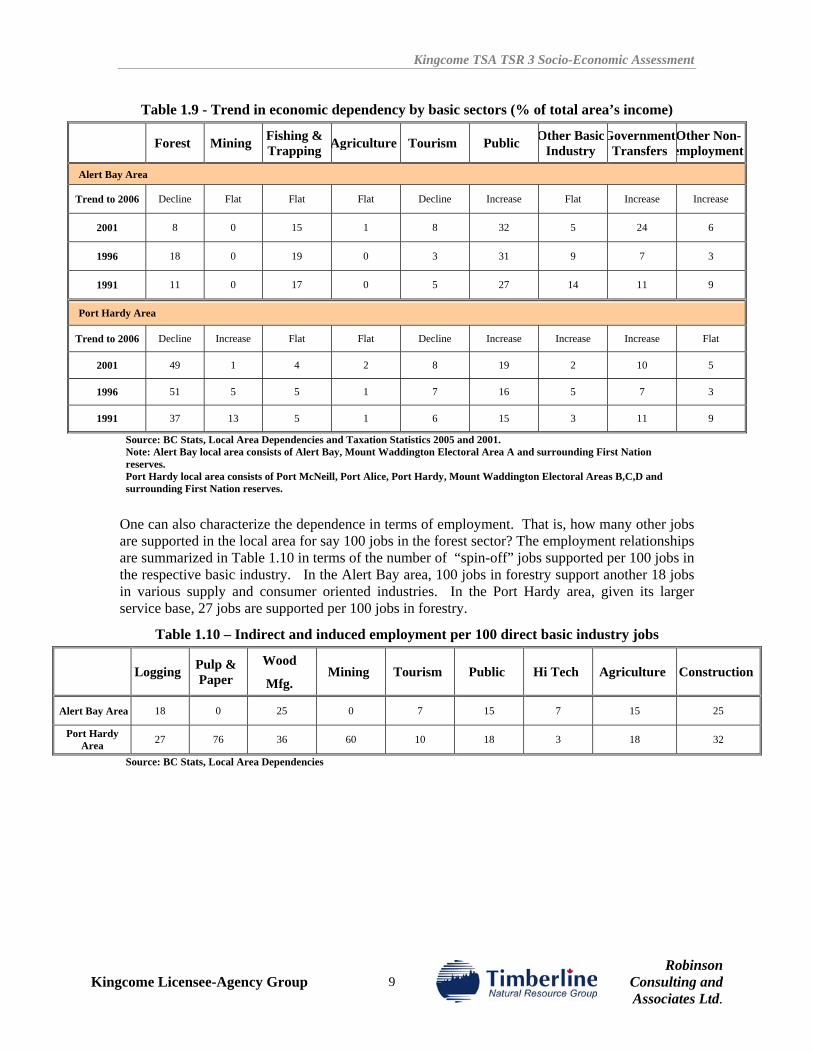
Kingcome TSA TSR 3 Socio-Economic Assessment
Table 1.9 - Trend in economic dependency by basic sectors (% of total area’s income)
Forest Mining Fishing & Trapping Agriculture Tourism Public Other Basic
Industry Government
Transfers Other Non-employment
Alert Bay Area
Trend to 2006 Decline Flat Flat Flat Decline Increase Flat Increase Increase
2001 8 0 15 1 8 32 5 24 6
1996 18 0 19 0 3 31 9 7 3
1991 11 0 17 0 5 27 14 11 9
Port Hardy Area
Trend to 2006 Decline Increase Flat Flat Decline Increase Increase Increase Flat
2001 49 1 4 2 8 19 2 10 5
1996 51 5 5 1 7 16 5 7 3
1991 37 13 5 1 6 15 3 11 9
Source: BC Stats, Local Area Dependencies and Taxation Statistics 2005 and 2001. Note: Alert Bay local area consists of Alert Bay, Mount Waddington Electoral Area A and surrounding First Nation reserves. Port Hardy local area consists of Port McNeill, Port Alice, Port Hardy, Mount Waddington Electoral Areas B,C,D and surrounding First Nation reserves.
One can also characterize the dependence in terms of employment. That is, how many other jobs are supported in the local area for say 100 jobs in the forest sector? The employment relationships are summarized in Table 1.10 in terms of the number of “spin-off” jobs supported per 100 jobs in the respective basic industry. In the Alert Bay area, 100 jobs in forestry support another 18 jobs in various supply and consumer oriented industries. In the Port Hardy area, given its larger service base, 27 jobs are supported per 100 jobs in forestry.
Table 1.10 – Indirect and induced employment per 100 direct basic industry jobs
Logging Pulp & Paper
Wood
Mfg. Mining Tourism Public Hi Tech Agriculture Construction
Alert Bay Area 18 0 25 0 7 15 7 15 25
Port Hardy Area 27 76 36 60 10 18 3 18 32
Source: BC Stats, Local Area Dependencies
Kingcome Licensee-Agency Group 9
Robinson Consulting andAssociates Ltd.
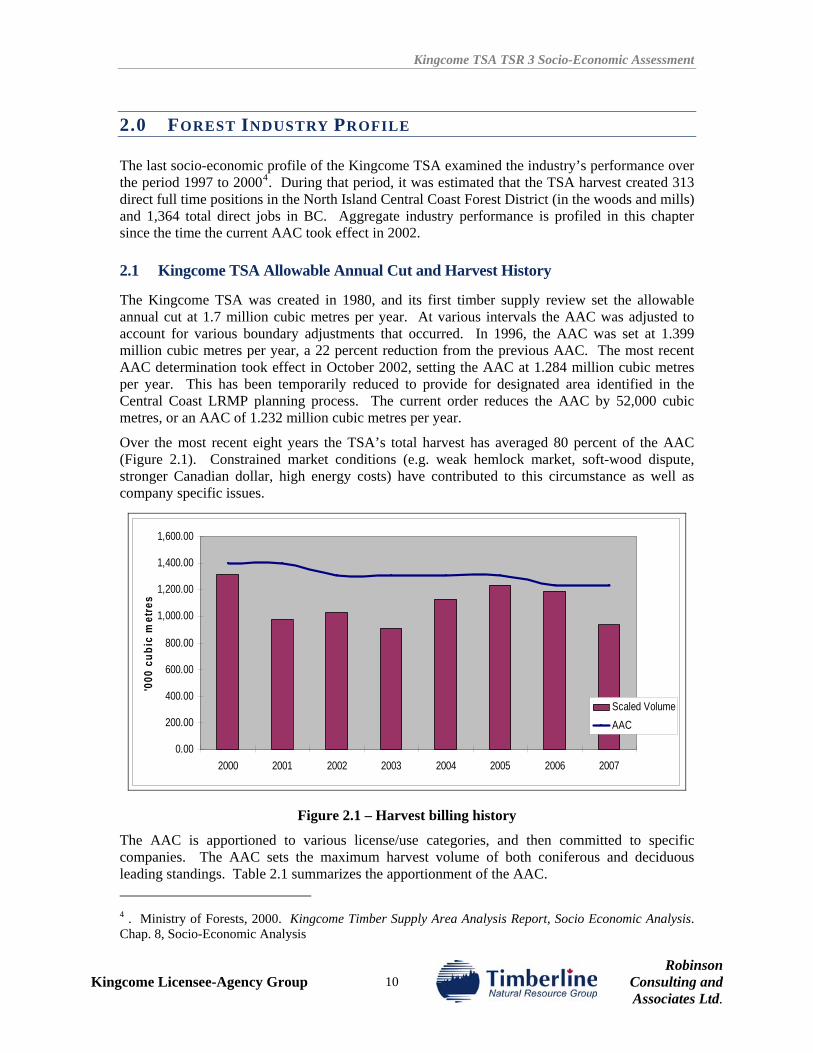
Kingcome TSA TSR 3 Socio-Economic Assessment
Kingcome Licensee-Agency Group 10
Robinson Consulting andAssociates Ltd.
2.0 FOREST INDUSTRY PROFILE
The last socio-economic profile of the Kingcome TSA examined the industry’s performance over the period 1997 to 20004. During that period, it was estimated that the TSA harvest created 313 direct full time positions in the North Island Central Coast Forest District (in the woods and mills) and 1,364 total direct jobs in BC. Aggregate industry performance is profiled in this chapter since the time the current AAC took effect in 2002.
2.1 Kingcome TSA Allowable Annual Cut and Harvest History
The Kingcome TSA was created in 1980, and its first timber supply review set the allowable annual cut at 1.7 million cubic metres per year. At various intervals the AAC was adjusted to account for various boundary adjustments that occurred. In 1996, the AAC was set at 1.399 million cubic metres per year, a 22 percent reduction from the previous AAC. The most recent AAC determination took effect in October 2002, setting the AAC at 1.284 million cubic metres per year. This has been temporarily reduced to provide for designated area identified in the Central Coast LRMP planning process. The current order reduces the AAC by 52,000 cubic metres, or an AAC of 1.232 million cubic metres per year.
Over the most recent eight years the TSA’s total harvest has averaged 80 percent of the AAC (Figure 2.1). Constrained market conditions (e.g. weak hemlock market, soft-wood dispute, stronger Canadian dollar, high energy costs) have contributed to this circumstance as well as company specific issues.
0.00
200.00
400.00
600.00
800.00
1,000.00
1,200.00
1,400.00
1,600.00
2000 2001 2002 2003 2004 2005 2006 2007
'000
cub
ic m
etre
s
Scaled VolumeAAC
Figure 2.1 – Harvest billing history
The AAC is apportioned to various license/use categories, and then committed to specific companies. The AAC sets the maximum harvest volume of both coniferous and deciduous leading standings. Table 2.1 summarizes the apportionment of the AAC. 4 . Ministry of Forests, 2000. Kingcome Timber Supply Area Analysis Report, Socio Economic Analysis. Chap. 8, Socio-Economic Analysis
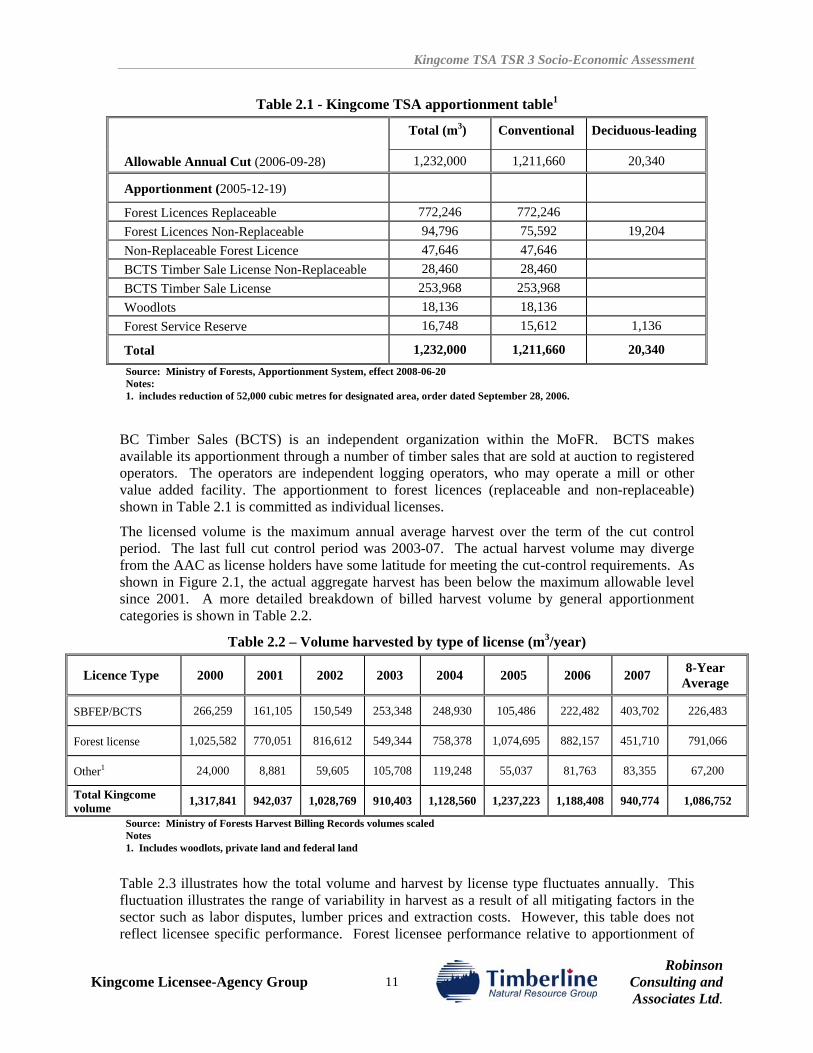
Kingcome TSA TSR 3 Socio-Economic Assessment
Table 2.1 - Kingcome TSA apportionment table1
Total (m3) Conventional Deciduous-leading
Allowable Annual Cut (2006-09-28) 1,232,000 1,211,660 20,340
Apportionment (2005-12-19)
Forest Licences Replaceable 772,246 772,246 Forest Licences Non-Replaceable 94,796 75,592 19,204 Non-Replaceable Forest Licence 47,646 47,646 BCTS Timber Sale License Non-Replaceable 28,460 28,460 BCTS Timber Sale License 253,968 253,968 Woodlots 18,136 18,136 Forest Service Reserve 16,748 15,612 1,136
Total 1,232,000 1,211,660 20,340 Source: Ministry of Forests, Apportionment System, effect 2008-06-20 Notes: 1. includes reduction of 52,000 cubic metres for designated area, order dated September 28, 2006.
BC Timber Sales (BCTS) is an independent organization within the MoFR. BCTS makes available its apportionment through a number of timber sales that are sold at auction to registered operators. The operators are independent logging operators, who may operate a mill or other value added facility. The apportionment to forest licences (replaceable and non-replaceable) shown in Table 2.1 is committed as individual licenses.
The licensed volume is the maximum annual average harvest over the term of the cut control period. The last full cut control period was 2003-07. The actual harvest volume may diverge from the AAC as license holders have some latitude for meeting the cut-control requirements. As shown in Figure 2.1, the actual aggregate harvest has been below the maximum allowable level since 2001. A more detailed breakdown of billed harvest volume by general apportionment categories is shown in Table 2.2.
Table 2.2 – Volume harvested by type of license (m3/year)
Licence Type 2000 2001 2002 2003 2004 2005 2006 2007 8-Year Average
SBFEP/BCTS 266,259 161,105 150,549 253,348 248,930 105,486 222,482 403,702 226,483
Forest license 1,025,582 770,051 816,612 549,344 758,378 1,074,695 882,157 451,710 791,066
Other1 24,000 8,881 59,605 105,708 119,248 55,037 81,763 83,355 67,200
Total Kingcome volume 1,317,841 942,037 1,028,769 910,403 1,128,560 1,237,223 1,188,408 940,774 1,086,752
Source: Ministry of Forests Harvest Billing Records volumes scaled Notes 1. Includes woodlots, private land and federal land
Table 2.3 illustrates how the total volume and harvest by license type fluctuates annually. This fluctuation illustrates the range of variability in harvest as a result of all mitigating factors in the sector such as labor disputes, lumber prices and extraction costs. However, this table does not reflect licensee specific performance. Forest licensee performance relative to apportionment of
Kingcome Licensee-Agency Group 11
Robinson Consulting andAssociates Ltd.
Kingcome TSA TSR 3 Socio-Economic Assessment
harvest volume is also highly variable with some meeting or exceeding harvest allotment targets and some underperforming.
In 2005 (the most recent year the mill survey was completed by MoFR) several mills were reported operating in the North Island-Central Coast Forest District. Several mills utilize harvest from the Kingcome TSA, as well as wood from the other nearby management units (TFLs and TSAs). Both of Interfor’s sawmills, Hammond and Acron, are economically dependant on volume received from the Kingcome TSA. The name and locations of the mill are summarized in Table 2.4.
Kingcome Licensee-Agency Group 12
Robinson Consulting andAssociates Ltd.
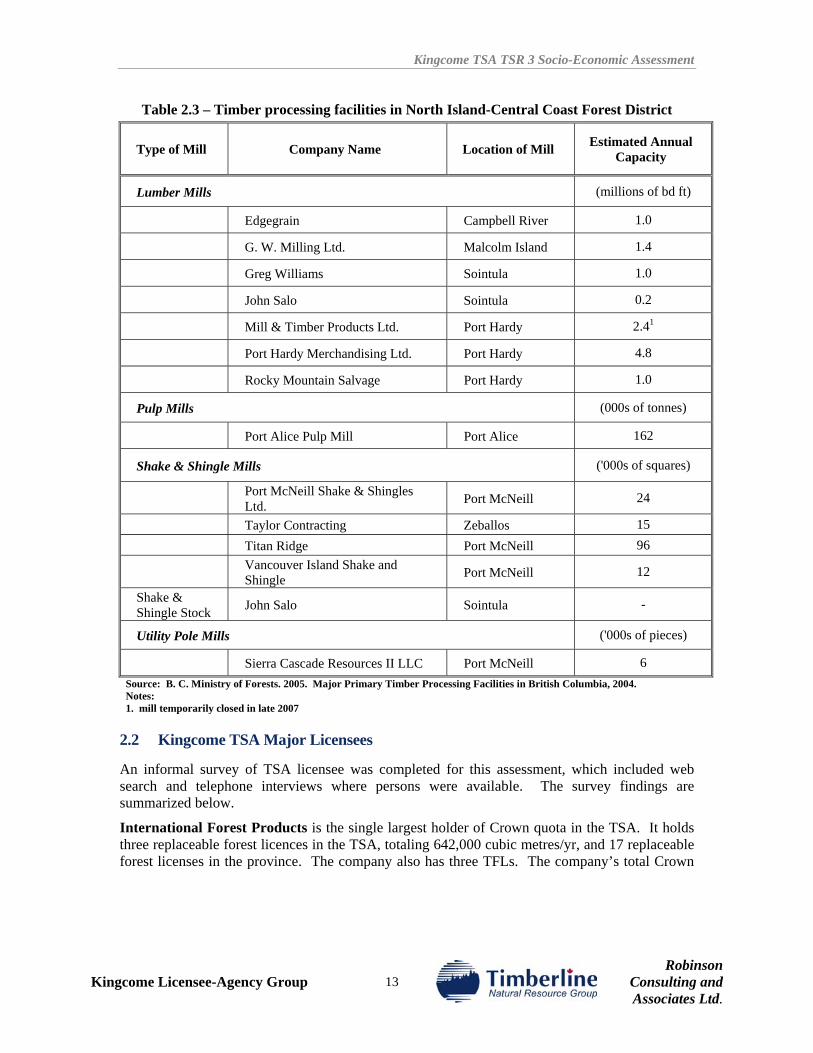
Kingcome TSA TSR 3 Socio-Economic Assessment
Table 2.3 – Timber processing facilities in North Island-Central Coast Forest District
Type of Mill Company Name Location of Mill Estimated Annual Capacity
Lumber Mills (millions of bd ft)
Edgegrain Campbell River 1.0 G. W. Milling Ltd. Malcolm Island 1.4 Greg Williams Sointula 1.0 John Salo Sointula 0.2 Mill & Timber Products Ltd. Port Hardy 2.41
Port Hardy Merchandising Ltd. Port Hardy 4.8 Rocky Mountain Salvage Port Hardy 1.0
Pulp Mills (000s of tonnes)
Port Alice Pulp Mill Port Alice 162
Shake & Shingle Mills ('000s of squares)
Port McNeill Shake & Shingles Ltd. Port McNeill 24
Taylor Contracting Zeballos 15 Titan Ridge Port McNeill 96
Vancouver Island Shake and Shingle Port McNeill 12
Shake & Shingle Stock John Salo Sointula -
Utility Pole Mills ('000s of pieces)
Sierra Cascade Resources II LLC Port McNeill 6 Source: B. C. Ministry of Forests. 2005. Major Primary Timber Processing Facilities in British Columbia, 2004. Notes: 1. mill temporarily closed in late 2007
2.2 Kingcome TSA Major Licensees
An informal survey of TSA licensee was completed for this assessment, which included web search and telephone interviews where persons were available. The survey findings are summarized below.
International Forest Products is the single largest holder of Crown quota in the TSA. It holds three replaceable forest licences in the TSA, totaling 642,000 cubic metres/yr, and 17 replaceable forest licenses in the province. The company also has three TFLs. The company’s total Crown
Kingcome Licensee-Agency Group 13
Robinson Consulting andAssociates Ltd.
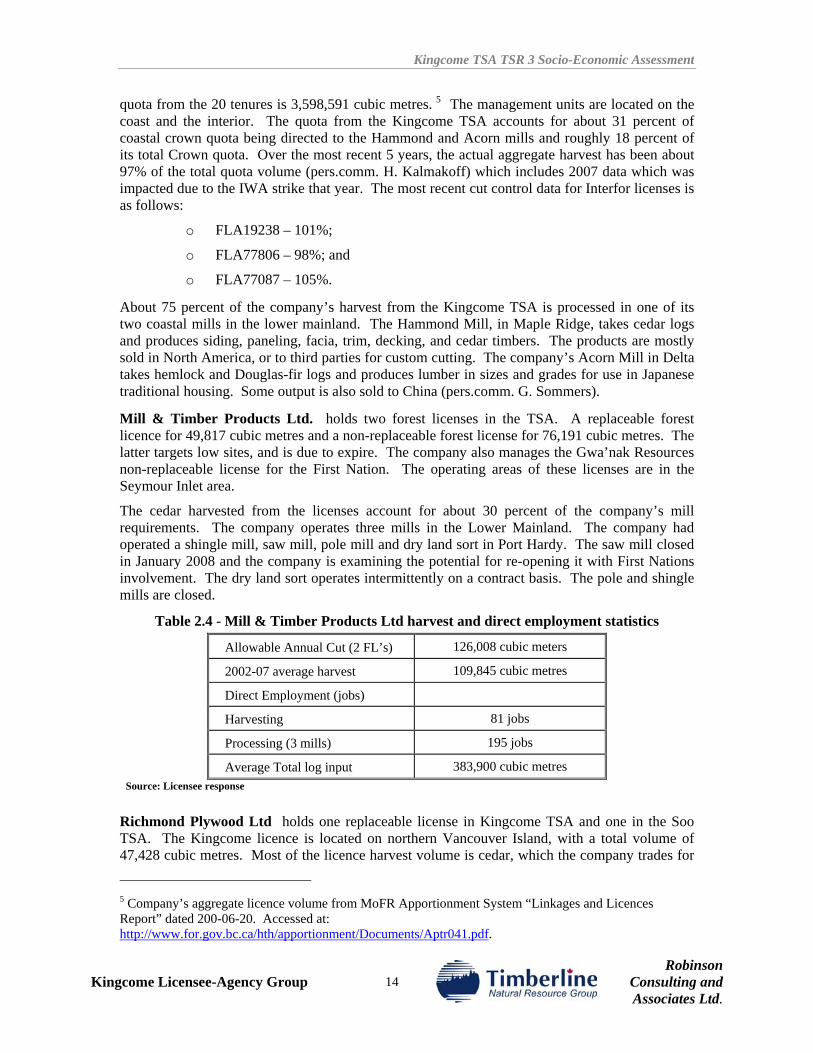
Kingcome TSA TSR 3 Socio-Economic Assessment
Kingcome Licensee-Agency Group 14
Robinson Consulting andAssociates Ltd.
quota from the 20 tenures is 3,598,591 cubic metres. 5 The management units are located on the coast and the interior. The quota from the Kingcome TSA accounts for about 31 percent of coastal crown quota being directed to the Hammond and Acorn mills and roughly 18 percent of its total Crown quota. Over the most recent 5 years, the actual aggregate harvest has been about 97% of the total quota volume (pers.comm. H. Kalmakoff) which includes 2007 data which was impacted due to the IWA strike that year. The most recent cut control data for Interfor licenses is as follows:
o FLA19238 – 101%;
o FLA77806 – 98%; and
o FLA77087 – 105%.
About 75 percent of the company’s harvest from the Kingcome TSA is processed in one of its two coastal mills in the lower mainland. The Hammond Mill, in Maple Ridge, takes cedar logs and produces siding, paneling, facia, trim, decking, and cedar timbers. The products are mostly sold in North America, or to third parties for custom cutting. The company’s Acorn Mill in Delta takes hemlock and Douglas-fir logs and produces lumber in sizes and grades for use in Japanese traditional housing. Some output is also sold to China (pers.comm. G. Sommers).
Mill & Timber Products Ltd. holds two forest licenses in the TSA. A replaceable forest licence for 49,817 cubic metres and a non-replaceable forest license for 76,191 cubic metres. The latter targets low sites, and is due to expire. The company also manages the Gwa’nak Resources non-replaceable license for the First Nation. The operating areas of these licenses are in the Seymour Inlet area.
The cedar harvested from the licenses account for about 30 percent of the company’s mill requirements. The company operates three mills in the Lower Mainland. The company had operated a shingle mill, saw mill, pole mill and dry land sort in Port Hardy. The saw mill closed in January 2008 and the company is examining the potential for re-opening it with First Nations involvement. The dry land sort operates intermittently on a contract basis. The pole and shingle mills are closed.
Table 2.4 - Mill & Timber Products Ltd harvest and direct employment statistics
Allowable Annual Cut (2 FL’s) 126,008 cubic meters
2002-07 average harvest 109,845 cubic metres
Direct Employment (jobs)
Harvesting 81 jobs
Processing (3 mills) 195 jobs
Average Total log input 383,900 cubic metres Source: Licensee response
Richmond Plywood Ltd holds one replaceable license in Kingcome TSA and one in the Soo TSA. The Kingcome licence is located on northern Vancouver Island, with a total volume of 47,428 cubic metres. Most of the licence harvest volume is cedar, which the company trades for
5 Company’s aggregate licence volume from MoFR Apportionment System “Linkages and Licences Report” dated 200-06-20. Accessed at: http://www.for.gov.bc.ca/hth/apportionment/Documents/Aptr041.pdf.
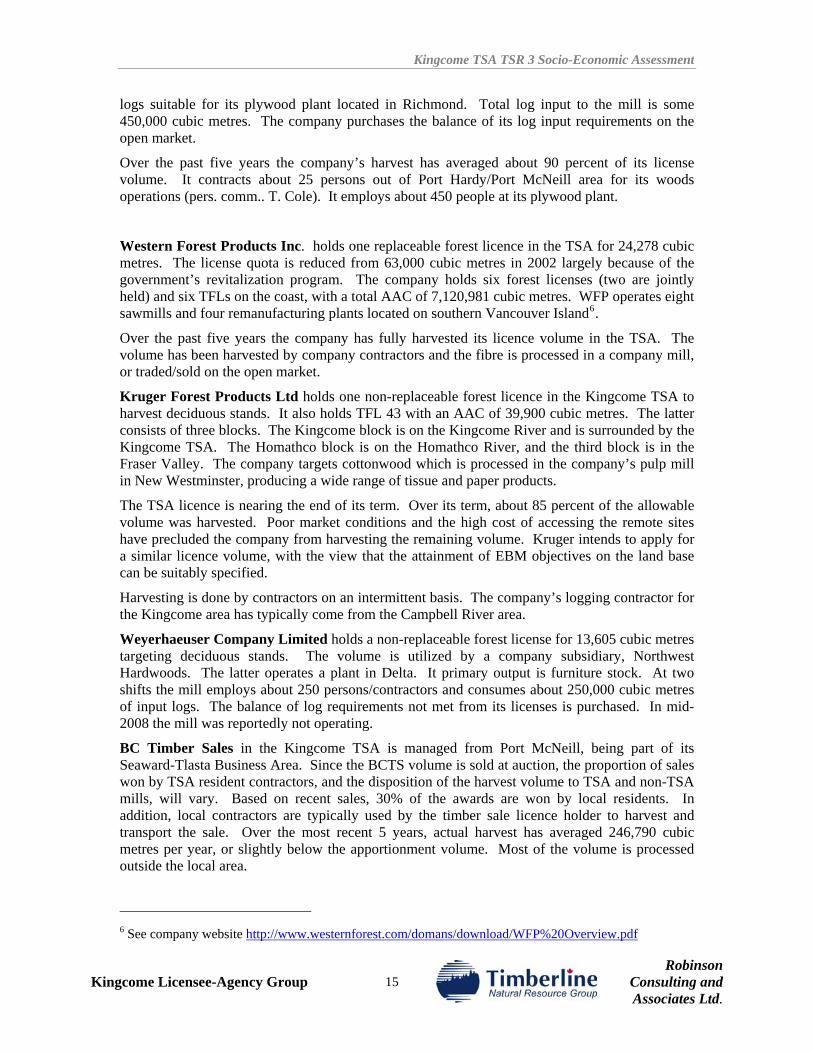
Kingcome TSA TSR 3 Socio-Economic Assessment
Kingcome Licensee-Agency Group 15
Robinson Consulting andAssociates Ltd.
logs suitable for its plywood plant located in Richmond. Total log input to the mill is some 450,000 cubic metres. The company purchases the balance of its log input requirements on the open market.
Over the past five years the company’s harvest has averaged about 90 percent of its license volume. It contracts about 25 persons out of Port Hardy/Port McNeill area for its woods operations (pers. comm.. T. Cole). It employs about 450 people at its plywood plant.
Western Forest Products Inc. holds one replaceable forest licence in the TSA for 24,278 cubic metres. The license quota is reduced from 63,000 cubic metres in 2002 largely because of the government’s revitalization program. The company holds six forest licenses (two are jointly held) and six TFLs on the coast, with a total AAC of 7,120,981 cubic metres. WFP operates eight sawmills and four remanufacturing plants located on southern Vancouver Island6.
Over the past five years the company has fully harvested its licence volume in the TSA. The volume has been harvested by company contractors and the fibre is processed in a company mill, or traded/sold on the open market.
Kruger Forest Products Ltd holds one non-replaceable forest licence in the Kingcome TSA to harvest deciduous stands. It also holds TFL 43 with an AAC of 39,900 cubic metres. The latter consists of three blocks. The Kingcome block is on the Kingcome River and is surrounded by the Kingcome TSA. The Homathco block is on the Homathco River, and the third block is in the Fraser Valley. The company targets cottonwood which is processed in the company’s pulp mill in New Westminster, producing a wide range of tissue and paper products.
The TSA licence is nearing the end of its term. Over its term, about 85 percent of the allowable volume was harvested. Poor market conditions and the high cost of accessing the remote sites have precluded the company from harvesting the remaining volume. Kruger intends to apply for a similar licence volume, with the view that the attainment of EBM objectives on the land base can be suitably specified.
Harvesting is done by contractors on an intermittent basis. The company’s logging contractor for the Kingcome area has typically come from the Campbell River area.
Weyerhaeuser Company Limited holds a non-replaceable forest license for 13,605 cubic metres targeting deciduous stands. The volume is utilized by a company subsidiary, Northwest Hardwoods. The latter operates a plant in Delta. It primary output is furniture stock. At two shifts the mill employs about 250 persons/contractors and consumes about 250,000 cubic metres of input logs. The balance of log requirements not met from its licenses is purchased. In mid-2008 the mill was reportedly not operating.
BC Timber Sales in the Kingcome TSA is managed from Port McNeill, being part of its Seaward-Tlasta Business Area. Since the BCTS volume is sold at auction, the proportion of sales won by TSA resident contractors, and the disposition of the harvest volume to TSA and non-TSA mills, will vary. Based on recent sales, 30% of the awards are won by local residents. In addition, local contractors are typically used by the timber sale licence holder to harvest and transport the sale. Over the most recent 5 years, actual harvest has averaged 246,790 cubic metres per year, or slightly below the apportionment volume. Most of the volume is processed outside the local area.
6 See company website http://www.westernforest.com/domans/download/WFP%20Overview.pdf
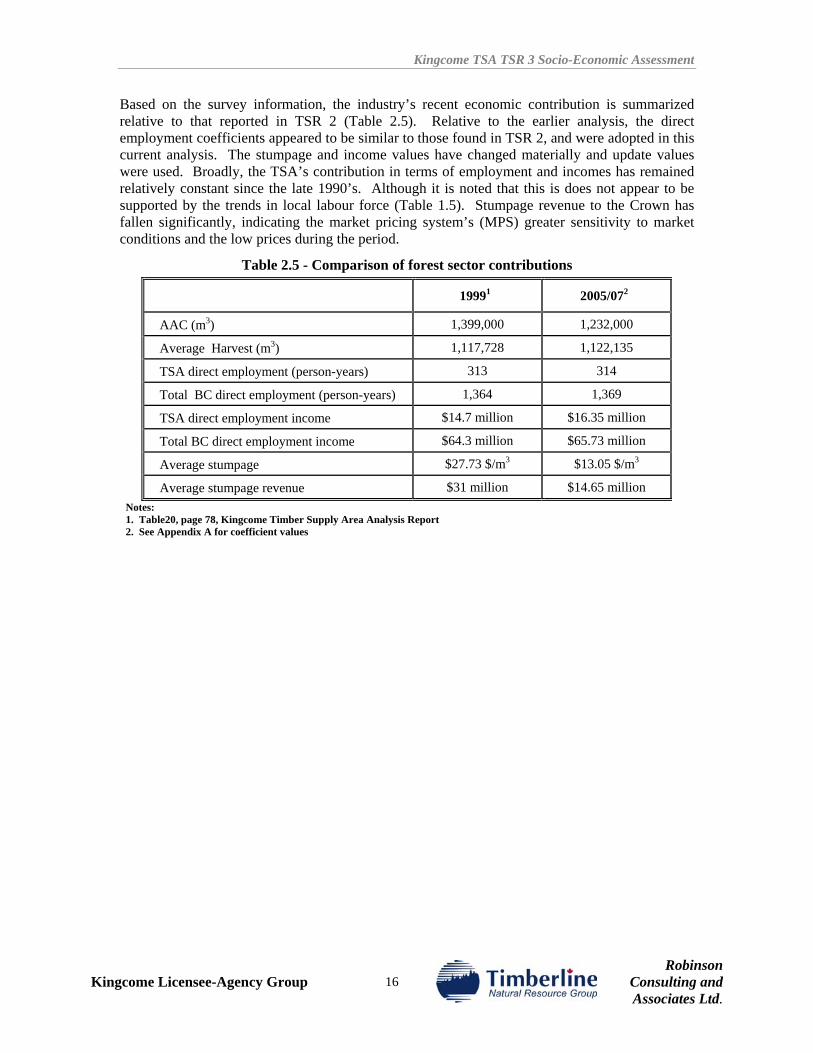
Kingcome TSA TSR 3 Socio-Economic Assessment
Based on the survey information, the industry’s recent economic contribution is summarized relative to that reported in TSR 2 (Table 2.5). Relative to the earlier analysis, the direct employment coefficients appeared to be similar to those found in TSR 2, and were adopted in this current analysis. The stumpage and income values have changed materially and update values were used. Broadly, the TSA’s contribution in terms of employment and incomes has remained relatively constant since the late 1990’s. Although it is noted that this is does not appear to be supported by the trends in local labour force (Table 1.5). Stumpage revenue to the Crown has fallen significantly, indicating the market pricing system’s (MPS) greater sensitivity to market conditions and the low prices during the period.
Table 2.5 - Comparison of forest sector contributions
19991 2005/072
AAC (m3) 1,399,000 1,232,000
Average Harvest (m3) 1,117,728 1,122,135
TSA direct employment (person-years) 313 314
Total BC direct employment (person-years) 1,364 1,369
TSA direct employment income $14.7 million $16.35 million
Total BC direct employment income $64.3 million $65.73 million
Average stumpage $27.73 $/m3 $13.05 $/m3
Average stumpage revenue $31 million $14.65 million Notes: 1. Table20, page 78, Kingcome Timber Supply Area Analysis Report 2. See Appendix A for coefficient values
Kingcome Licensee-Agency Group 16
Robinson Consulting andAssociates Ltd.
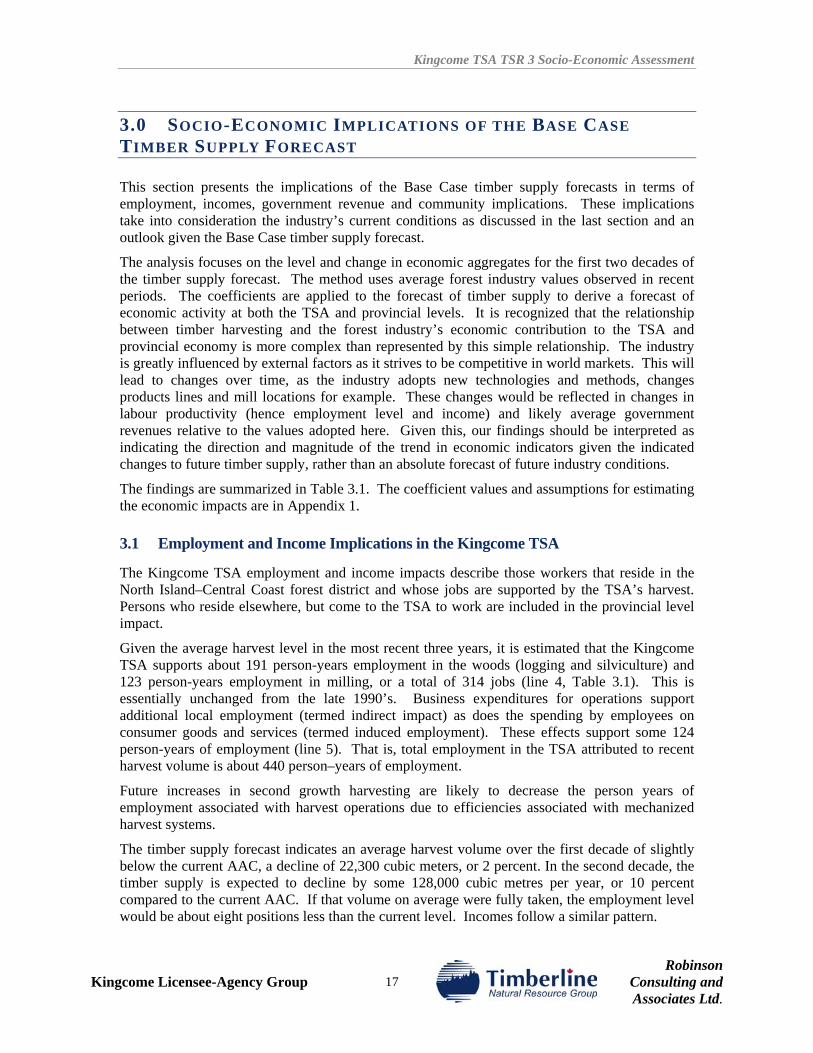
Kingcome TSA TSR 3 Socio-Economic Assessment
3.0 SOCIO-ECONOMIC IMPLICATIONS OF THE BASE CASE TIMBER SUPPLY FORECAST
This section presents the implications of the Base Case timber supply forecasts in terms of employment, incomes, government revenue and community implications. These implications take into consideration the industry’s current conditions as discussed in the last section and an outlook given the Base Case timber supply forecast.
The analysis focuses on the level and change in economic aggregates for the first two decades of the timber supply forecast. The method uses average forest industry values observed in recent periods. The coefficients are applied to the forecast of timber supply to derive a forecast of economic activity at both the TSA and provincial levels. It is recognized that the relationship between timber harvesting and the forest industry’s economic contribution to the TSA and provincial economy is more complex than represented by this simple relationship. The industry is greatly influenced by external factors as it strives to be competitive in world markets. This will lead to changes over time, as the industry adopts new technologies and methods, changes products lines and mill locations for example. These changes would be reflected in changes in labour productivity (hence employment level and income) and likely average government revenues relative to the values adopted here. Given this, our findings should be interpreted as indicating the direction and magnitude of the trend in economic indicators given the indicated changes to future timber supply, rather than an absolute forecast of future industry conditions.
The findings are summarized in Table 3.1. The coefficient values and assumptions for estimating the economic impacts are in Appendix 1.
3.1 Employment and Income Implications in the Kingcome TSA
The Kingcome TSA employment and income impacts describe those workers that reside in the North Island–Central Coast forest district and whose jobs are supported by the TSA’s harvest. Persons who reside elsewhere, but come to the TSA to work are included in the provincial level impact.
Given the average harvest level in the most recent three years, it is estimated that the Kingcome TSA supports about 191 person-years employment in the woods (logging and silviculture) and 123 person-years employment in milling, or a total of 314 jobs (line 4, Table 3.1). This is essentially unchanged from the late 1990’s. Business expenditures for operations support additional local employment (termed indirect impact) as does the spending by employees on consumer goods and services (termed induced employment). These effects support some 124 person-years of employment (line 5). That is, total employment in the TSA attributed to recent harvest volume is about 440 person–years of employment.
Future increases in second growth harvesting are likely to decrease the person years of employment associated with harvest operations due to efficiencies associated with mechanized harvest systems.
The timber supply forecast indicates an average harvest volume over the first decade of slightly below the current AAC, a decline of 22,300 cubic meters, or 2 percent. In the second decade, the timber supply is expected to decline by some 128,000 cubic metres per year, or 10 percent compared to the current AAC. If that volume on average were fully taken, the employment level would be about eight positions less than the current level. Incomes follow a similar pattern.
Kingcome Licensee-Agency Group 17
Robinson Consulting andAssociates Ltd.
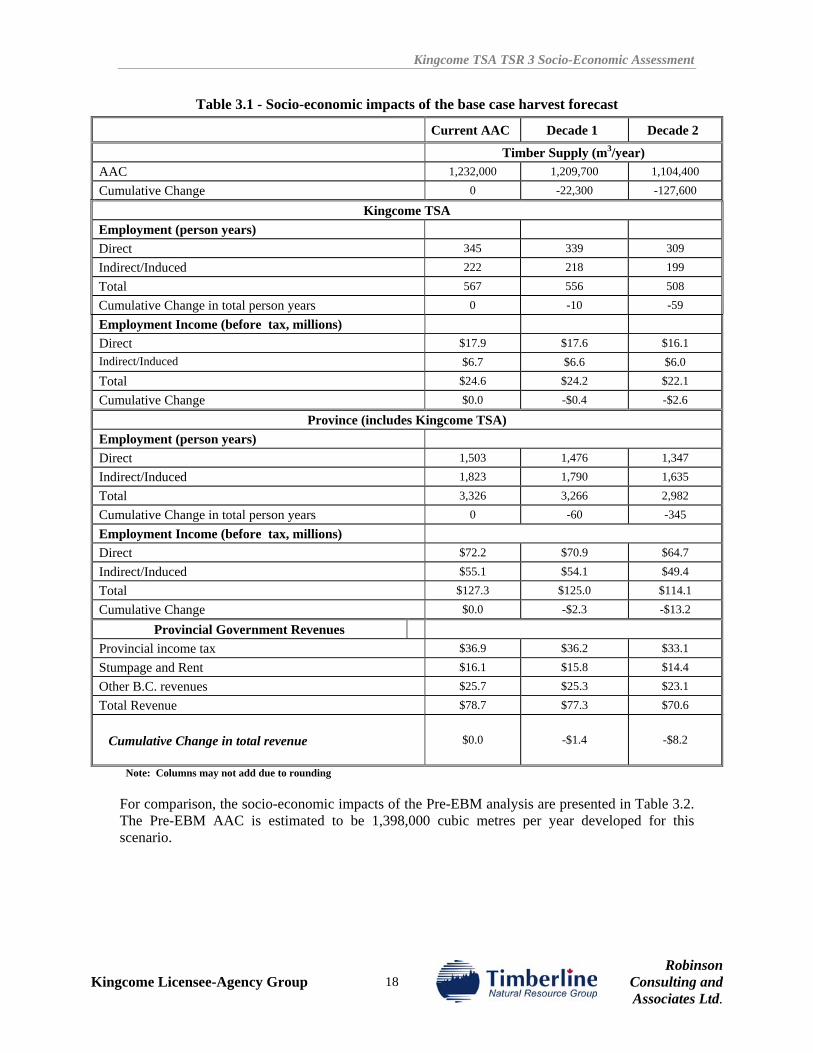
Kingcome TSA TSR 3 Socio-Economic Assessment
Table 3.1 - Socio-economic impacts of the base case harvest forecast
Current AAC Decade 1 Decade 2
Timber Supply (m3/year) AAC 1,232,000 1,209,700 1,104,400
Cumulative Change 0 -22,300 -127,600
Kingcome TSA Employment (person years) Direct 345 339 309 Indirect/Induced 222 218 199 Total 567 556 508 Cumulative Change in total person years 0 -10 -59
Employment Income (before tax, millions) Direct $17.9 $17.6 $16.1 Indirect/Induced $6.7 $6.6 $6.0 Total $24.6 $24.2 $22.1 Cumulative Change $0.0 -$0.4 -$2.6
Province (includes Kingcome TSA) Employment (person years)
Direct 1,503 1,476 1,347 Indirect/Induced 1,823 1,790 1,635 Total 3,326 3,266 2,982 Cumulative Change in total person years 0 -60 -345
Employment Income (before tax, millions) Direct $72.2 $70.9 $64.7 Indirect/Induced $55.1 $54.1 $49.4 Total $127.3 $125.0 $114.1 Cumulative Change $0.0 -$2.3 -$13.2
Provincial Government Revenues Provincial income tax $36.9 $36.2 $33.1 Stumpage and Rent $16.1 $15.8 $14.4 Other B.C. revenues $25.7 $25.3 $23.1 Total Revenue $78.7 $77.3 $70.6
Cumulative Change in total revenue
$0.0 -$1.4 -$8.2
Note: Columns may not add due to rounding
For comparison, the socio-economic impacts of the Pre-EBM analysis are presented in Table 3.2. The Pre-EBM AAC is estimated to be 1,398,000 cubic metres per year developed for this scenario.
Kingcome Licensee-Agency Group 18
Robinson Consulting andAssociates Ltd.
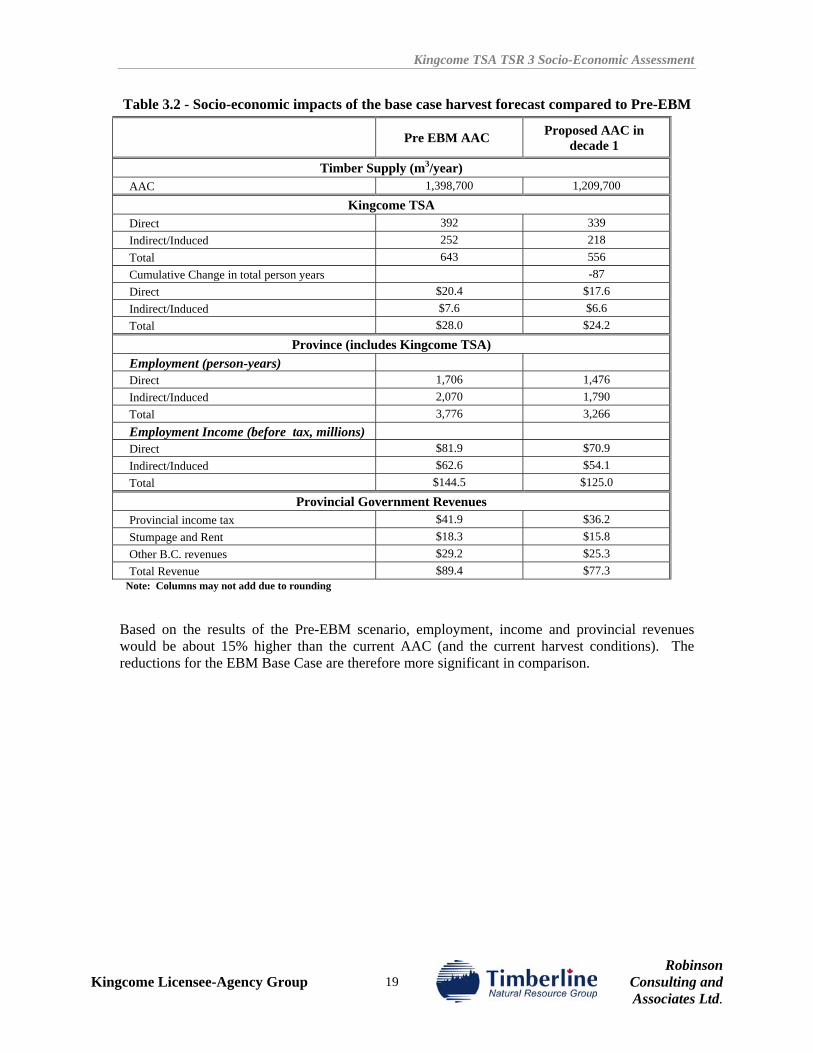
Kingcome TSA TSR 3 Socio-Economic Assessment
Table 3.2 - Socio-economic impacts of the base case harvest forecast compared to Pre-EBM
Pre EBM AAC Proposed AAC in decade 1
Timber Supply (m3/year) AAC 1,398,700 1,209,700
Kingcome TSA Direct 392 339 Indirect/Induced 252 218 Total 643 556 Cumulative Change in total person years -87 Direct $20.4 $17.6 Indirect/Induced $7.6 $6.6 Total $28.0 $24.2
Province (includes Kingcome TSA) Employment (person-years) Direct 1,706 1,476 Indirect/Induced 2,070 1,790 Total 3,776 3,266 Employment Income (before tax, millions) Direct $81.9 $70.9 Indirect/Induced $62.6 $54.1 Total $144.5 $125.0
Provincial Government Revenues Provincial income tax $41.9 $36.2 Stumpage and Rent $18.3 $15.8 Other B.C. revenues $29.2 $25.3 Total Revenue $89.4 $77.3
Note: Columns may not add due to rounding
Based on the results of the Pre-EBM scenario, employment, income and provincial revenues would be about 15% higher than the current AAC (and the current harvest conditions). The reductions for the EBM Base Case are therefore more significant in comparison.
Kingcome Licensee-Agency Group 19
Robinson Consulting andAssociates Ltd.
Kingcome TSA TSR 3 Socio-Economic Assessment
3.2 Provincial Employment and Income Implications
A large proportion of the economic impacts associated with the Kingcome TSA harvest occur outside the immediate area, either because persons living outside the North Island travel to work in the TSA (in the remote camps) and because most of the wood is manufactured in plants located on the South Island (e.g. Nanaimo, Ladysmith, Chemanius) or the Lower Mainland. For instance, direct employment in the TSA as noted above is around 314 person-years, or 22 percent of the total provincial direct employment of 1,369 person years (line 12, Table 3.1). Also, the relatively small local economy, and remote location of operations imply that a relatively large share of the indirect and induced economic activity occurs away from the TSA. For instance, the TSA’s share of the indirect and induced employment is only about 7.5 percent of total impact .
It is estimated that the average harvest from the Kingcome TSA in recent years has supported a total of some 3,000 person-years of employment (line14) and generate an annual wage bill of some $116 million provincially (line 18).
In the first decade, if the full timber supply is harvested on average, provincial employment attributed to the TSA could increase from its current level of 3,030 person-years to 3,266, or a gain of 236 person-years of employment. In the second decade, if the available timber supply is harvested on average, the reduced volume would support total employment of about 344 jobs less than the current AAC, and 48 person-years less than the Current Conditions.
3.3 Government Revenue Implications Government revenue is derived from all levels of economic activity stimulated by harvesting activity. Direct revenue to government includes income taxes paid by those directly and indirectly employed by the TSA harvest, stumpage paid on the harvest volume and other miscellaneous taxes (e.g. sales tax, corporate taxes, rental/lease and royalties).
At the average harvest volume experienced over the past three years, total government revenues associated with the TSA harvest is roughly $72 million per year. A major uncertainty in this projection is future market prices, hence the average stumpage rate. Stronger market conditions would probably support an average stumpage rate greater than the $13.05 per cubic metre assumed here. In that case government stumpage revenues might be higher than recent experience even if the harvest level is less; however, overall revenue would decline due to reduced employment.
3.4 Community Implications The timber supply forecasts indicate the Kingcome TSA has the potential to continue contributing to the North Island economy at a level at least as great recent experience. Whether in fact that is the case will depend on the availability of skilled labour in the local labour force and company decisions with respect to its hiring of contractors and the disposition of logs. Presently a relatively large proportion of the TSA’s economic impacts accrue outside of the North Island. If the communities on the North Island were able to attract a greater proportion of the associated employment (direct, indirect, or induced), then the TSA’s local contribution could increase even with a reduction in total timber supply. However, workers elsewhere would be displaced if this occurred. Whereas a reduction in harvest rates is certain to exacerbate decline in the immediate areas such as Mt Waddington RD and other areas already experiencing decline as the harvest rates fall.
Kingcome Licensee-Agency Group 20
Robinson Consulting andAssociates Ltd.
Kingcome TSA TSR 3 Socio-Economic Assessment
Kingcome Licensee-Agency Group 21
Robinson Consulting andAssociates Ltd.
4.0 REFERENCES
B.C. Stats. April 2007. South Central Coast Order.
BC Stats. April 2008. 2006 Neighborhood Income and Demographics for BC Development Regions, Regional Districts, Municipalities and Sub-Areas. Data from Canada Revenue Agency.
________. October 2007. British Columbia Taxation Statistics 2005 – Income Groups, Source of Income, and Taxes Paid. Data from Canada Revenue Agency.
________. March 2004. British Columbia Taxation Statistics 2001 – Income Groups, Source of Income, and Taxes Paid. Data from Canada Revenue Agency.
B.C. Ministry of Forests. November 2001. Kingcome Timber Supply Area Analysis Report.
_____________________, Undated. Interim Guidelines for the Preparation of Socio-Economic Assessments for Timber Supply Reviews.
B.C. Ministry of Management Services. 2004. British Columbia’s Heartland at the Dawn of the 21st Century
__________________________________. 2004. 2001 Economic Dependency Tables for Forest Districts.
Persons Contacted (in alphabetical order): Brown, Ione. Mill & Timber Products Ltd
Cole, Tom. Richmond Plywood Corporation
Davis, Steve. Reporting Analyst, Revenue Branch, Ministry of Forests and Range
Haight, Deidre. Planning Officer, BC Timber Sales
Hunchuk, Dean. First Nations Liaison Officer, North Island–Central Coast Forest District, Ministry of Forests and Range
Kalmakoff, Heidi. International Forest Products Ltd.
Kofoed, Peter. Western Forest Products Ltd.
Mardell, Christina. Stewardship Forester, Port McNeill Forest District, Ministry of Forests and Range
Sommers, Gerry. International Forest Products Ltd.
Kingcome TSA TSR 3 Socio-Economic Assessment
APPENDIX 1
Kingcome Licensee-Agency Group
Robinson Consulting andAssociates Ltd.

Kingcome TSA TSR 3 Socio-Economic Assessment
Kingcome Licensee-Agency Group
Robinson Consulting andAssociates Ltd.
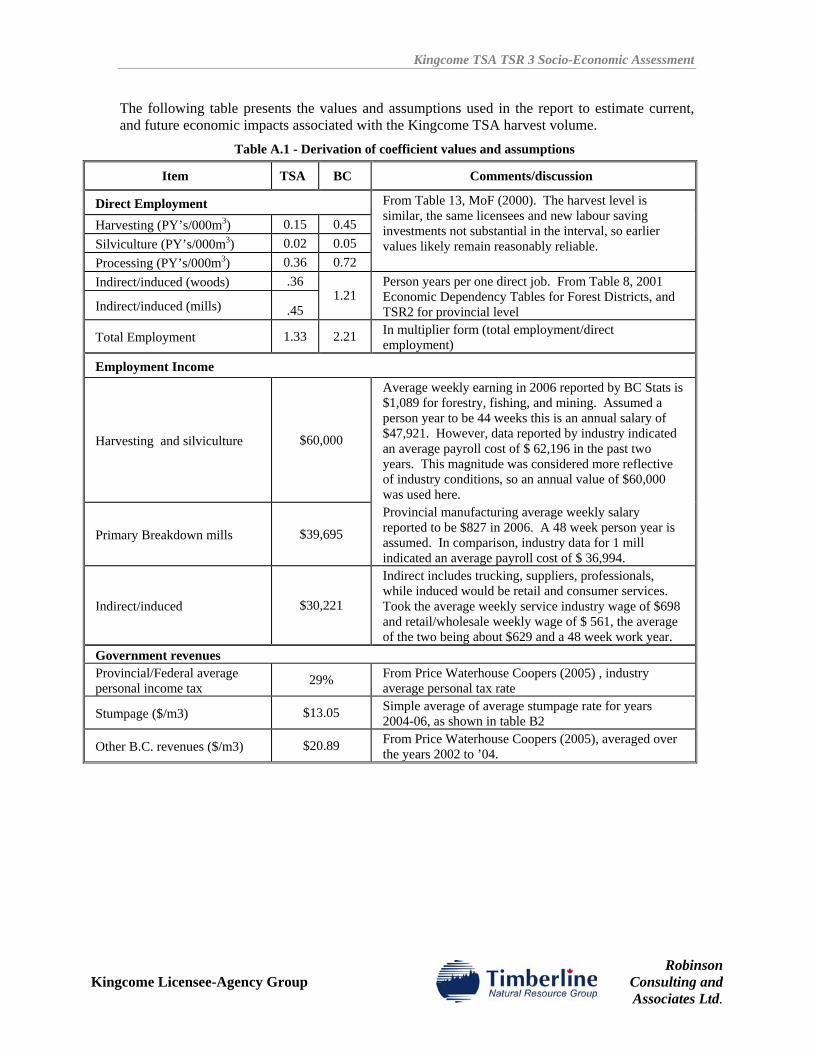
Kingcome TSA TSR 3 Socio-Economic Assessment
The following table presents the values and assumptions used in the report to estimate current, and future economic impacts associated with the Kingcome TSA harvest volume.
Table A.1 - Derivation of coefficient values and assumptions
Item TSA BC Comments/discussion
Direct Employment Harvesting (PY’s/000m3) 0.15 0.45 Silviculture (PY’s/000m3) 0.02 0.05 Processing (PY’s/000m3) 0.36 0.72
From Table 13, MoF (2000). The harvest level is similar, the same licensees and new labour saving investments not substantial in the interval, so earlier values likely remain reasonably reliable.
Indirect/induced (woods) .36
Indirect/induced (mills) .45 1.21
Person years per one direct job. From Table 8, 2001 Economic Dependency Tables for Forest Districts, and TSR2 for provincial level
Total Employment 1.33 2.21 In multiplier form (total employment/direct employment)
Employment Income
Harvesting and silviculture $60,000
Average weekly earning in 2006 reported by BC Stats is $1,089 for forestry, fishing, and mining. Assumed a person year to be 44 weeks this is an annual salary of $47,921. However, data reported by industry indicated an average payroll cost of $ 62,196 in the past two years. This magnitude was considered more reflective of industry conditions, so an annual value of $60,000 was used here.
Primary Breakdown mills $39,695
Provincial manufacturing average weekly salary reported to be $827 in 2006. A 48 week person year is assumed. In comparison, industry data for 1 mill indicated an average payroll cost of $ 36,994.
Indirect/induced $30,221
Indirect includes trucking, suppliers, professionals, while induced would be retail and consumer services. Took the average weekly service industry wage of $698 and retail/wholesale weekly wage of $ 561, the average of the two being about $629 and a 48 week work year.
Government revenues Provincial/Federal average personal income tax 29% From Price Waterhouse Coopers (2005) , industry
average personal tax rate
Stumpage ($/m3) $13.05 Simple average of average stumpage rate for years 2004-06, as shown in table B2
Other B.C. revenues ($/m3) $20.89 From Price Waterhouse Coopers (2005), averaged over the years 2002 to ’04.
Kingcome Licensee-Agency Group
Robinson Consulting andAssociates Ltd.
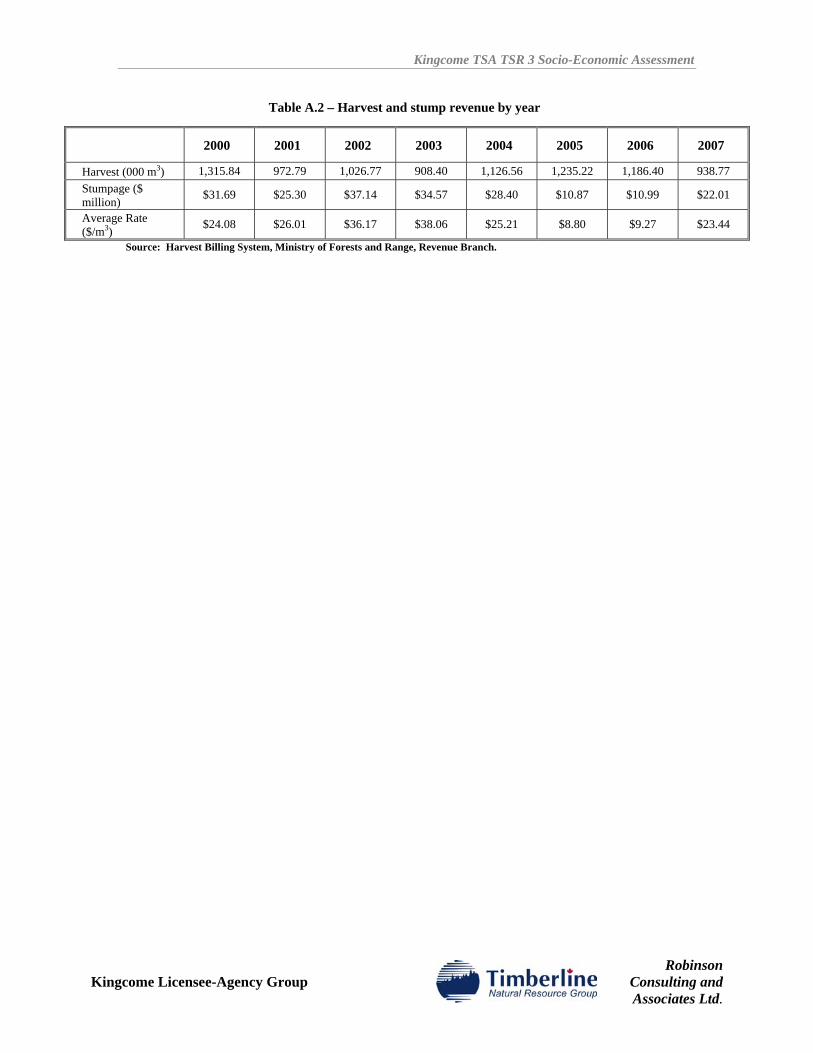
Kingcome TSA TSR 3 Socio-Economic Assessment
Table A.2 – Harvest and stump revenue by year
Source: Harvest Billing System, Ministry of Forests and Range, Revenue Branch.
2000 2001 2002 2003 2004 2005 2006 2007
Harvest (000 m3) 1,315.84 972.79 1,026.77 908.40 1,126.56 1,235.22 1,186.40 938.77 Stumpage ($ million) $31.69 $25.30 $37.14 $34.57 $28.40 $10.87 $10.99 $22.01
Average Rate ($/m3) $24.08 $26.01 $36.17 $38.06 $25.21 $8.80 $9.27 $23.44
Kingcome Licensee-Agency Group
Robinson Consulting andAssociates Ltd.
Kingcome TSA TSR 3 Analysis Report
Kingcome Licensee-Agency Group
APPENDIX IV KINGCOME TIMBER SUPPLY AREA TSR3
DATA PACKAGE ADDENDUM

Kingcome TSA TSR 3 Analysis Report
Kingcome Licensee-Agency Group
KINGCOME TIMBER SUPPLY AREA TSR 3 DATA PACKAGE
ADDENDUM
Prepared for:
Kingcome TSA Licensee-Agency Group
Prepared by:
Timberline Natural Resource Group Ltd.
Victoria, B.C.
Project: 4061921
November 2008

Kingcome TSA TSR 3 Data Package Addendum
Kingcome Licensee-Agency Group
Kingcome TSA TSR 3 Data Package Addendum
Kingcome Licensee-Agency Group iii
TABLE OF CONTENTS
1.0 INTRODUCTION ............................................................................................................. 5
5.0 LAND BASE DESCRIPTION (PAGE 13)...................................................................... 6 5.2 EBM THLB DETERMINATION (PAGE 30) ............................................................................ 8
5.2.6 Objective 15. Red-listed and blue-listed plant communities (page 34) ................... 8 5.2.7 Objective 17. Sensitive grizzly bear habitat (page 35) .......................................... 10
6.0 INVENTORY AGGREGATION................................................................................... 11 6.2 LANDSCAPE UNITS (PAGE 36)............................................................................................ 11
6.2.2 Visually Sensitive Areas (page 40) ........................................................................ 14 6.2.3 Community Watersheds (page 41)......................................................................... 15 6.2.4 Marbled Murrelet Nesting Habitat (page 41) ....................................................... 15
6.3 EBM MANAGEMENT ZONES (PAGE 42)............................................................................. 16 6.3.1 Objective 8. Important fisheries watersheds (page 42) ......................................... 16 6.3.2 Objective 12. Upland streams (page 42) ............................................................... 16 6.3.3 Objective 14. Landscape-level biodiversity (page 43) .......................................... 17
LIST OF TABLES
Table 3 – Timber harvesting land base (THLB) determination ...................................................... 7 Table 31 – Land base reductions for EBM Objective 15 ................................................................ 9 Table 32 – Land base reductions for EBM Objective 17 .............................................................. 10 Table 33 – Area by landscape unit and BEC................................................................................. 11 Table 35 – Visually sensitive areas ............................................................................................... 15 Table 36 – Community watersheds ............................................................................................... 15 Table 37 – Marbled murrelet nesting habitat................................................................................. 16 Table 38 – Important fisheries watersheds area summary – Objective 8 ...................................... 16 Table 39 – Upland streams – Objective 12.................................................................................... 17 Table 40 – AU definitions for site series surrogate (SSS) definitions – Objective 12 .................. 18 Table 40.A – Area by EBM landscape unit-site series surrogate .................................................. 18

Kingcome TSA TSR 3 Data Package Addendum
Kingcome Licensee-Agency Group iv
Kingcome TSA TSR 3 Data Package Addendum
Kingcome Licensee-Agency Group A-5
1.0 INTRODUCTION
This summary is an addendum to the report Kingcome Timber Supply Area TSR3 Data Package (Data Package) submitted by Timberline Natural Resource Group Ltd. (Timberline), on behalf of the Kingcome Timber Supply Area (TSA) Licensee-Agency Group (the Group) on September 26, 2008. Some information provided in that document has been updated based on revised assumptions for the analysis, or information that was not initially provided.
The primary change to the analysis assumptions was a revised land base netdown for blue-listed species needed to meet the requirements for Ecosystem-Based Management (EBM). Although the final timber harvesting land base (THLB) defined for the EBM scenario has changed, only a subset of the summary tables provided in the original Data Package are included in this addendum.
Throughout this addendum, original section and table references are used to aide with direct comparison to the original Data Package.
Kingcome TSA TSR 3 Data Package Addendum
Kingcome Licensee-Agency Group A-6
5.0 LAND BASE DESCRIPTION (PAGE 13)
The final classification results in a current THLB of 208,175 hectares (Pre-EBM) and 186,914 hectares (EBM), compared to the TSR 2 current timber harvesting land base (168,726 ha) documented in the previous timber supply review analysis report. While reductions to address new Central Coast biodiversity, conservancy and EBM objectives removed significant areas from timber production, these were more than offset by additions based on a new economic operability assessment, and revised low site criteria. The THLB area includes 5,549 hectares of unreverted timber licence areas which do not contribute to the TSA timber supply until after they are harvested and regenerated.
The netdown results are summarized in Table 3.
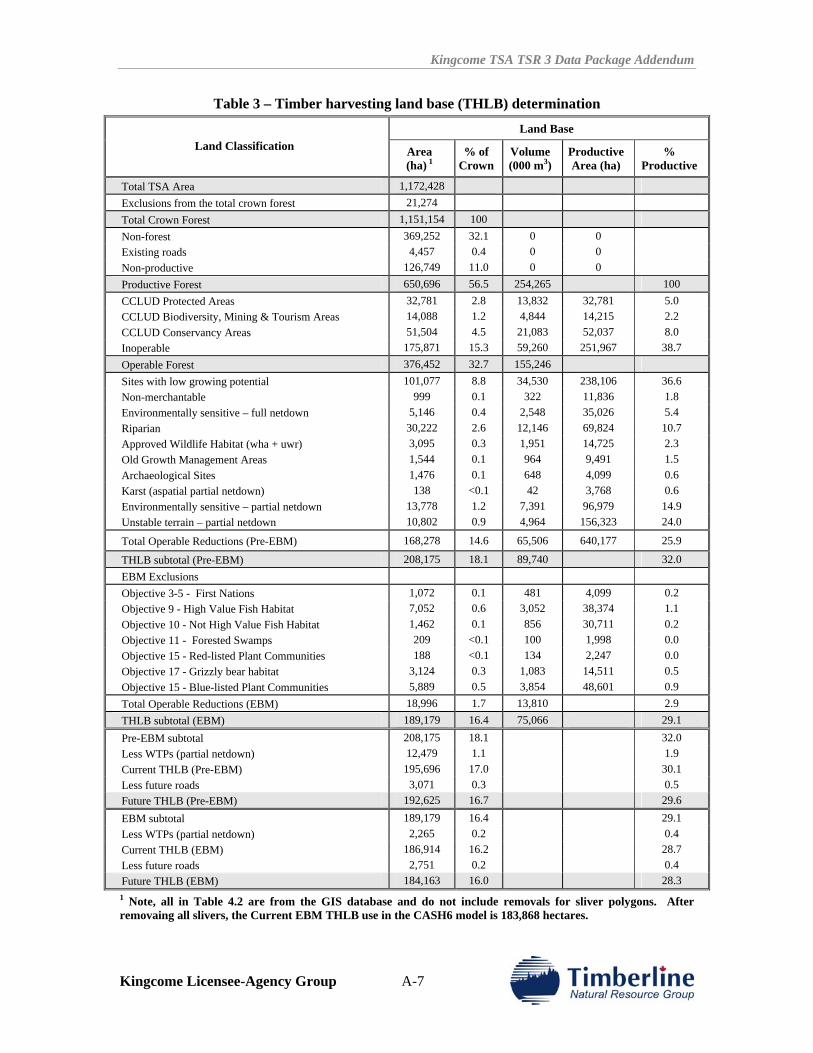
Kingcome TSA TSR 3 Data Package Addendum
Kingcome Licensee-Agency Group A-7
Table 3 – Timber harvesting land base (THLB) determination
Land Base Land Classification Area
(ha) 1 % of
Crown Volume (000 m3)
Productive Area (ha)
% Productive
Total TSA Area 1,172,428 Exclusions from the total crown forest 21,274 Total Crown Forest 1,151,154 100 Non-forest 369,252 32.1 0 0 Existing roads 4,457 0.4 0 0 Non-productive 126,749 11.0 0 0 Productive Forest 650,696 56.5 254,265 100 CCLUD Protected Areas 32,781 2.8 13,832 32,781 5.0 CCLUD Biodiversity, Mining & Tourism Areas 14,088 1.2 4,844 14,215 2.2 CCLUD Conservancy Areas 51,504 4.5 21,083 52,037 8.0 Inoperable 175,871 15.3 59,260 251,967 38.7 Operable Forest 376,452 32.7 155,246 Sites with low growing potential 101,077 8.8 34,530 238,106 36.6 Non-merchantable 999 0.1 322 11,836 1.8 Environmentally sensitive – full netdown 5,146 0.4 2,548 35,026 5.4 Riparian 30,222 2.6 12,146 69,824 10.7 Approved Wildlife Habitat (wha + uwr) 3,095 0.3 1,951 14,725 2.3 Old Growth Management Areas 1,544 0.1 964 9,491 1.5 Archaeological Sites 1,476 0.1 648 4,099 0.6 Karst (aspatial partial netdown) 138 <0.1 42 3,768 0.6 Environmentally sensitive – partial netdown 13,778 1.2 7,391 96,979 14.9 Unstable terrain – partial netdown 10,802 0.9 4,964 156,323 24.0
Total Operable Reductions (Pre-EBM) 168,278 14.6 65,506 640,177 25.9
THLB subtotal (Pre-EBM) 208,175 18.1 89,740 32.0 EBM Exclusions Objective 3-5 - First Nations 1,072 0.1 481 4,099 0.2 Objective 9 - High Value Fish Habitat 7,052 0.6 3,052 38,374 1.1 Objective 10 - Not High Value Fish Habitat 1,462 0.1 856 30,711 0.2 Objective 11 - Forested Swamps 209 <0.1 100 1,998 0.0 Objective 15 - Red-listed Plant Communities 188 <0.1 134 2,247 0.0 Objective 17 - Grizzly bear habitat 3,124 0.3 1,083 14,511 0.5 Objective 15 - Blue-listed Plant Communities 5,889 0.5 3,854 48,601 0.9 Total Operable Reductions (EBM) 18,996 1.7 13,810 2.9 THLB subtotal (EBM) 189,179 16.4 75,066 29.1 Pre-EBM subtotal 208,175 18.1 32.0 Less WTPs (partial netdown) 12,479 1.1 1.9 Current THLB (Pre-EBM) 195,696 17.0 30.1 Less future roads 3,071 0.3 0.5 Future THLB (Pre-EBM) 192,625 16.7 29.6 EBM subtotal 189,179 16.4 29.1 Less WTPs (partial netdown) 2,265 0.2 0.4 Current THLB (EBM) 186,914 16.2 28.7 Less future roads 2,751 0.2 0.4 Future THLB (EBM) 184,163 16.0 28.3 1 Note, all in Table 4.2 are from the GIS database and do not include removals for sliver polygons. After removaing all slivers, the Current EBM THLB use in the CASH6 model is 183,868 hectares.
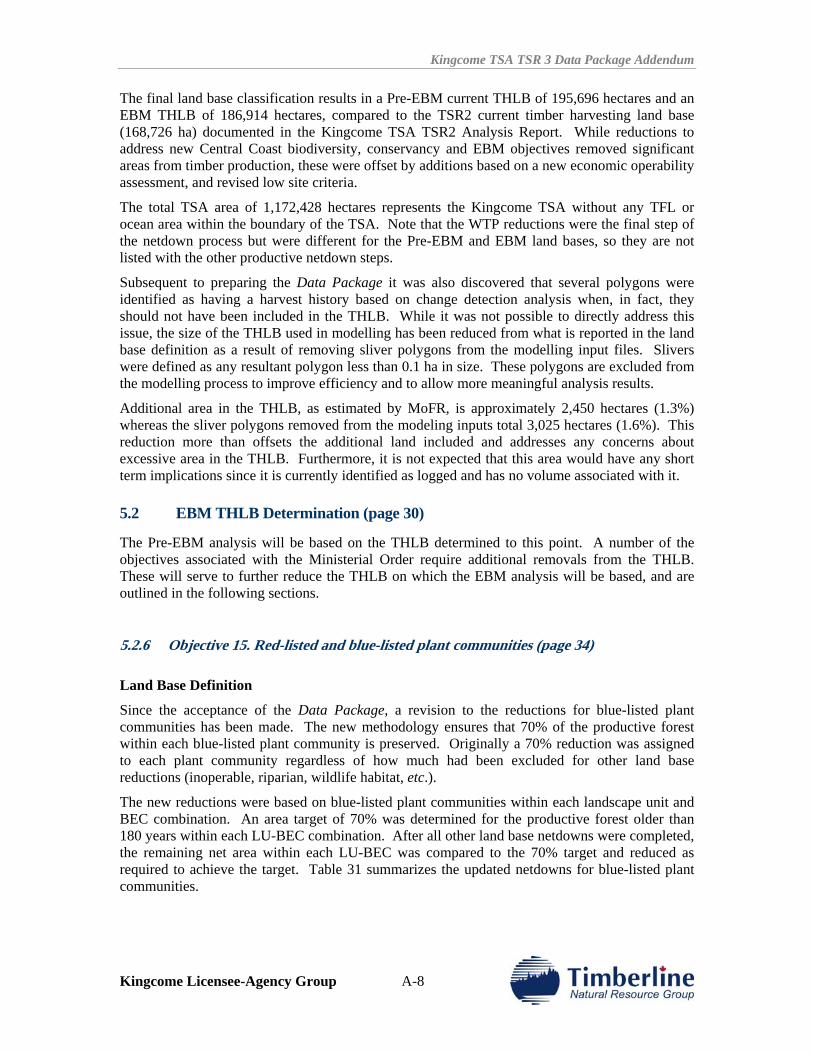
Kingcome TSA TSR 3 Data Package Addendum
Kingcome Licensee-Agency Group A-8
The final land base classification results in a Pre-EBM current THLB of 195,696 hectares and an EBM THLB of 186,914 hectares, compared to the TSR2 current timber harvesting land base (168,726 ha) documented in the Kingcome TSA TSR2 Analysis Report. While reductions to address new Central Coast biodiversity, conservancy and EBM objectives removed significant areas from timber production, these were offset by additions based on a new economic operability assessment, and revised low site criteria.
The total TSA area of 1,172,428 hectares represents the Kingcome TSA without any TFL or ocean area within the boundary of the TSA. Note that the WTP reductions were the final step of the netdown process but were different for the Pre-EBM and EBM land bases, so they are not listed with the other productive netdown steps.
Subsequent to preparing the Data Package it was also discovered that several polygons were identified as having a harvest history based on change detection analysis when, in fact, they should not have been included in the THLB. While it was not possible to directly address this issue, the size of the THLB used in modelling has been reduced from what is reported in the land base definition as a result of removing sliver polygons from the modelling input files. Slivers were defined as any resultant polygon less than 0.1 ha in size. These polygons are excluded from the modelling process to improve efficiency and to allow more meaningful analysis results.
Additional area in the THLB, as estimated by MoFR, is approximately 2,450 hectares (1.3%) whereas the sliver polygons removed from the modeling inputs total 3,025 hectares (1.6%). This reduction more than offsets the additional land included and addresses any concerns about excessive area in the THLB. Furthermore, it is not expected that this area would have any short term implications since it is currently identified as logged and has no volume associated with it.
5.2 EBM THLB Determination (page 30)
The Pre-EBM analysis will be based on the THLB determined to this point. A number of the objectives associated with the Ministerial Order require additional removals from the THLB. These will serve to further reduce the THLB on which the EBM analysis will be based, and are outlined in the following sections.
5.2.6 Objective 15. Red-listed and blue-listed plant communities (page 34) Land Base Definition
Since the acceptance of the Data Package, a revision to the reductions for blue-listed plant communities has been made. The new methodology ensures that 70% of the productive forest within each blue-listed plant community is preserved. Originally a 70% reduction was assigned to each plant community regardless of how much had been excluded for other land base reductions (inoperable, riparian, wildlife habitat, etc.).
The new reductions were based on blue-listed plant communities within each landscape unit and BEC combination. An area target of 70% was determined for the productive forest older than 180 years within each LU-BEC combination. After all other land base netdowns were completed, the remaining net area within each LU-BEC was compared to the 70% target and reduced as required to achieve the target. Table 31 summarizes the updated netdowns for blue-listed plant communities.
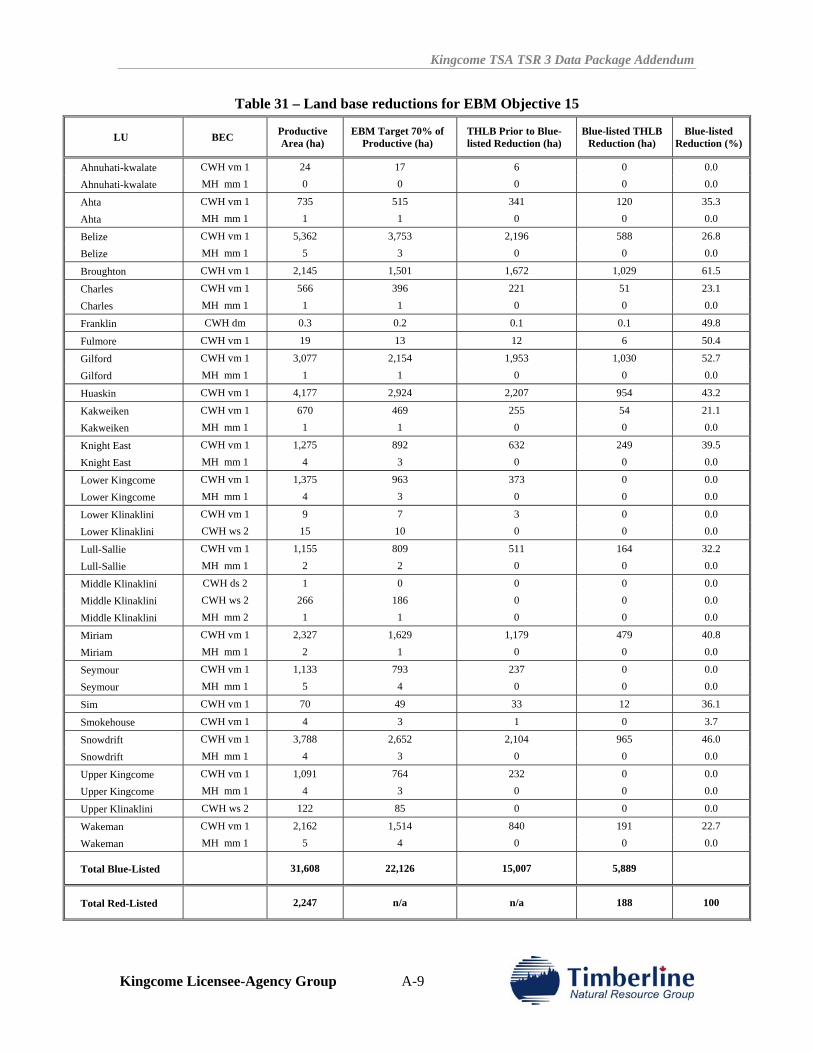
Kingcome TSA TSR 3 Data Package Addendum
Kingcome Licensee-Agency Group A-9
Table 31 – Land base reductions for EBM Objective 15
LU BEC Productive Area (ha)
EBM Target 70% of Productive (ha)
THLB Prior to Blue-listed Reduction (ha)
Blue-listed THLB Reduction (ha)
Blue-listed Reduction (%)
Ahnuhati-kwalate CWH vm 1 24 17 6 0 0.0
Ahnuhati-kwalate MH mm 1 0 0 0 0 0.0
Ahta CWH vm 1 735 515 341 120 35.3
Ahta MH mm 1 1 1 0 0 0.0
Belize CWH vm 1 5,362 3,753 2,196 588 26.8
Belize MH mm 1 5 3 0 0 0.0
Broughton CWH vm 1 2,145 1,501 1,672 1,029 61.5
Charles CWH vm 1 566 396 221 51 23.1
Charles MH mm 1 1 1 0 0 0.0
Franklin CWH dm 0.3 0.2 0.1 0.1 49.8
Fulmore CWH vm 1 19 13 12 6 50.4
Gilford CWH vm 1 3,077 2,154 1,953 1,030 52.7
Gilford MH mm 1 1 1 0 0 0.0
Huaskin CWH vm 1 4,177 2,924 2,207 954 43.2
Kakweiken CWH vm 1 670 469 255 54 21.1
Kakweiken MH mm 1 1 1 0 0 0.0
Knight East CWH vm 1 1,275 892 632 249 39.5
Knight East MH mm 1 4 3 0 0 0.0
Lower Kingcome CWH vm 1 1,375 963 373 0 0.0
Lower Kingcome MH mm 1 4 3 0 0 0.0
Lower Klinaklini CWH vm 1 9 7 3 0 0.0
Lower Klinaklini CWH ws 2 15 10 0 0 0.0
Lull-Sallie CWH vm 1 1,155 809 511 164 32.2
Lull-Sallie MH mm 1 2 2 0 0 0.0
Middle Klinaklini CWH ds 2 1 0 0 0 0.0
Middle Klinaklini CWH ws 2 266 186 0 0 0.0
Middle Klinaklini MH mm 2 1 1 0 0 0.0
Miriam CWH vm 1 2,327 1,629 1,179 479 40.8
Miriam MH mm 1 2 1 0 0 0.0
Seymour CWH vm 1 1,133 793 237 0 0.0
Seymour MH mm 1 5 4 0 0 0.0
Sim CWH vm 1 70 49 33 12 36.1
Smokehouse CWH vm 1 4 3 1 0 3.7
Snowdrift CWH vm 1 3,788 2,652 2,104 965 46.0
Snowdrift MH mm 1 4 3 0 0 0.0
Upper Kingcome CWH vm 1 1,091 764 232 0 0.0
Upper Kingcome MH mm 1 4 3 0 0 0.0
Upper Klinaklini CWH ws 2 122 85 0 0 0.0
Wakeman CWH vm 1 2,162 1,514 840 191 22.7
Wakeman MH mm 1 5 4 0 0 0.0
Total Blue-Listed 31,608 22,126 15,007 5,889
Total Red-Listed 2,247 n/a n/a 188 100
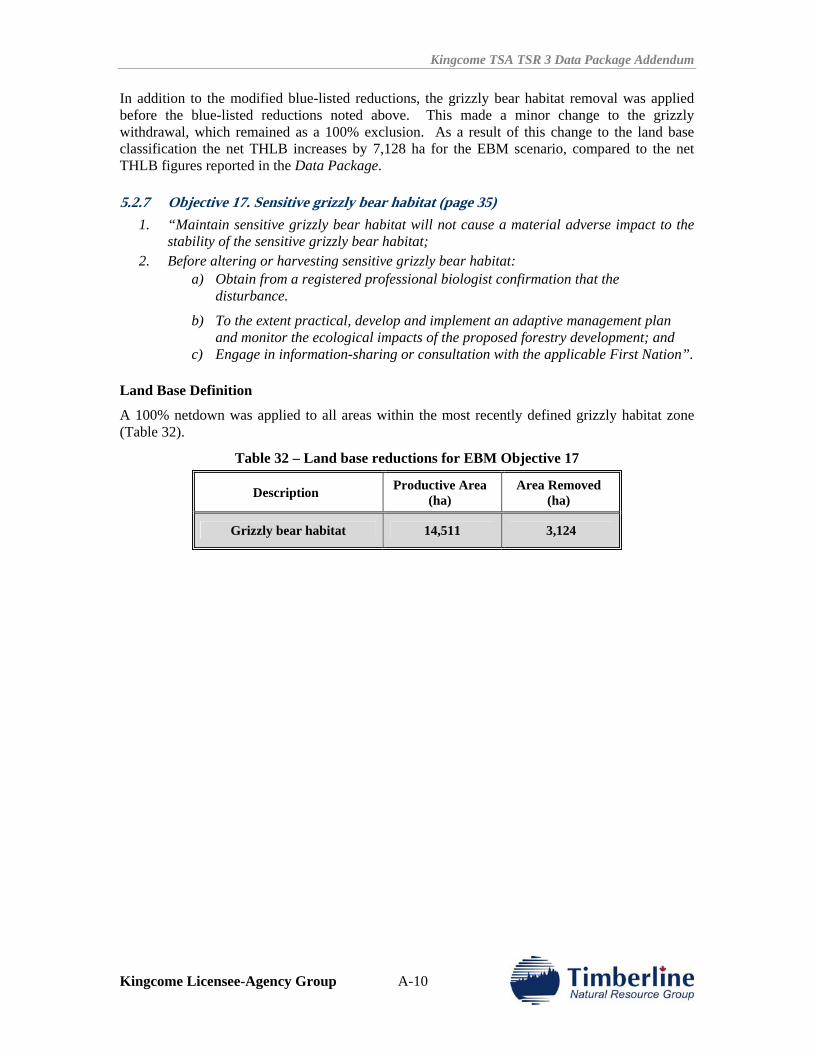
Kingcome TSA TSR 3 Data Package Addendum
Kingcome Licensee-Agency Group A-10
In addition to the modified blue-listed reductions, the grizzly bear habitat removal was applied before the blue-listed reductions noted above. This made a minor change to the grizzly withdrawal, which remained as a 100% exclusion. As a result of this change to the land base classification the net THLB increases by 7,128 ha for the EBM scenario, compared to the net THLB figures reported in the Data Package.
5.2.7 Objective 17. Sensitive grizzly bear habitat (page 35) 1. “Maintain sensitive grizzly bear habitat will not cause a material adverse impact to the
stability of the sensitive grizzly bear habitat; 2. Before altering or harvesting sensitive grizzly bear habitat:
a) Obtain from a registered professional biologist confirmation that the disturbance.
b) To the extent practical, develop and implement an adaptive management plan and monitor the ecological impacts of the proposed forestry development; and
c) Engage in information-sharing or consultation with the applicable First Nation”. Land Base Definition
A 100% netdown was applied to all areas within the most recently defined grizzly habitat zone (Table 32).
Table 32 – Land base reductions for EBM Objective 17
Description Productive Area (ha)
Area Removed (ha)
Grizzly bear habitat 14,511 3,124
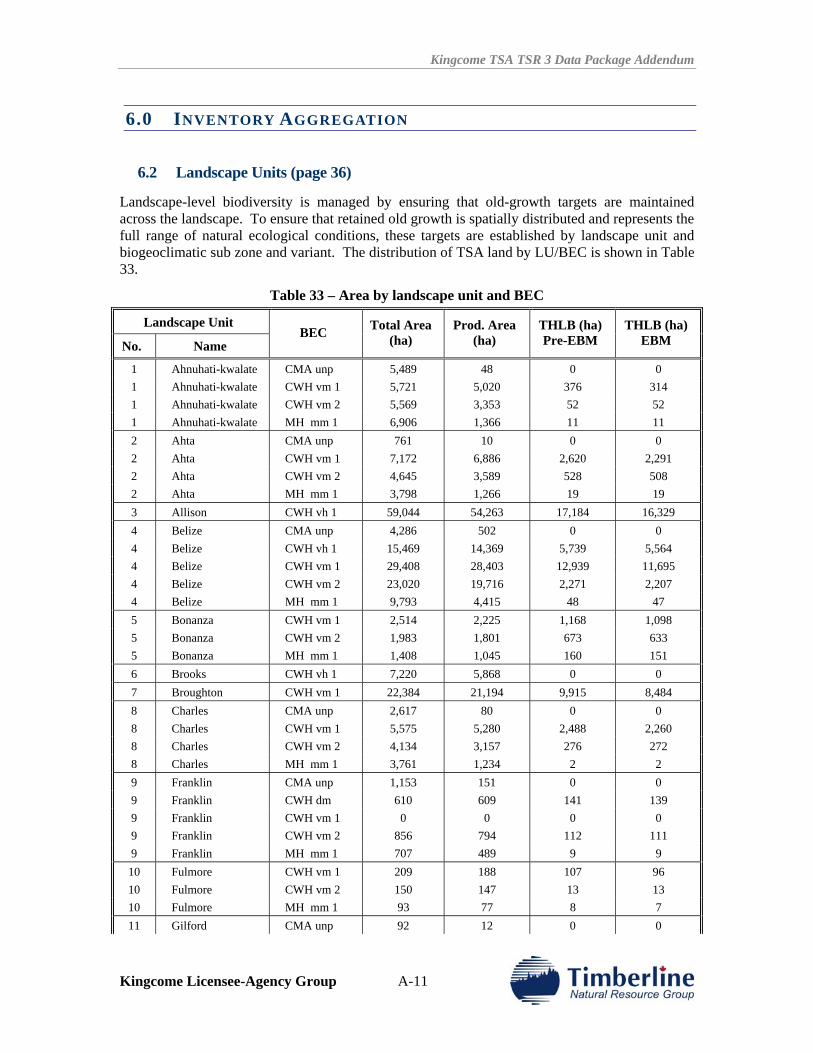
Kingcome TSA TSR 3 Data Package Addendum
Kingcome Licensee-Agency Group A-11
6.0 INVENTORY AGGREGATION
6.2 Landscape Units (page 36)
Landscape-level biodiversity is managed by ensuring that old-growth targets are maintained across the landscape. To ensure that retained old growth is spatially distributed and represents the full range of natural ecological conditions, these targets are established by landscape unit and biogeoclimatic sub zone and variant. The distribution of TSA land by LU/BEC is shown in Table 33.
Table 33 – Area by landscape unit and BEC
Landscape Unit
No. Name BEC Total Area
(ha) Prod. Area
(ha) THLB (ha) Pre-EBM
THLB (ha) EBM
1 Ahnuhati-kwalate CMA unp 5,489 48 0 0 1 Ahnuhati-kwalate CWH vm 1 5,721 5,020 376 314 1 Ahnuhati-kwalate CWH vm 2 5,569 3,353 52 52 1 Ahnuhati-kwalate MH mm 1 6,906 1,366 11 11 2 Ahta CMA unp 761 10 0 0 2 Ahta CWH vm 1 7,172 6,886 2,620 2,291 2 Ahta CWH vm 2 4,645 3,589 528 508 2 Ahta MH mm 1 3,798 1,266 19 19 3 Allison CWH vh 1 59,044 54,263 17,184 16,329 4 Belize CMA unp 4,286 502 0 0 4 Belize CWH vh 1 15,469 14,369 5,739 5,564 4 Belize CWH vm 1 29,408 28,403 12,939 11,695 4 Belize CWH vm 2 23,020 19,716 2,271 2,207 4 Belize MH mm 1 9,793 4,415 48 47 5 Bonanza CWH vm 1 2,514 2,225 1,168 1,098 5 Bonanza CWH vm 2 1,983 1,801 673 633 5 Bonanza MH mm 1 1,408 1,045 160 151 6 Brooks CWH vh 1 7,220 5,868 0 0 7 Broughton CWH vm 1 22,384 21,194 9,915 8,484 8 Charles CMA unp 2,617 80 0 0 8 Charles CWH vm 1 5,575 5,280 2,488 2,260 8 Charles CWH vm 2 4,134 3,157 276 272 8 Charles MH mm 1 3,761 1,234 2 2 9 Franklin CMA unp 1,153 151 0 0 9 Franklin CWH dm 610 609 141 139 9 Franklin CWH vm 1 0 0 0 0 9 Franklin CWH vm 2 856 794 112 111 9 Franklin MH mm 1 707 489 9 9 10 Fulmore CWH vm 1 209 188 107 96 10 Fulmore CWH vm 2 150 147 13 13 10 Fulmore MH mm 1 93 77 8 7 11 Gilford CMA unp 92 12 0 0
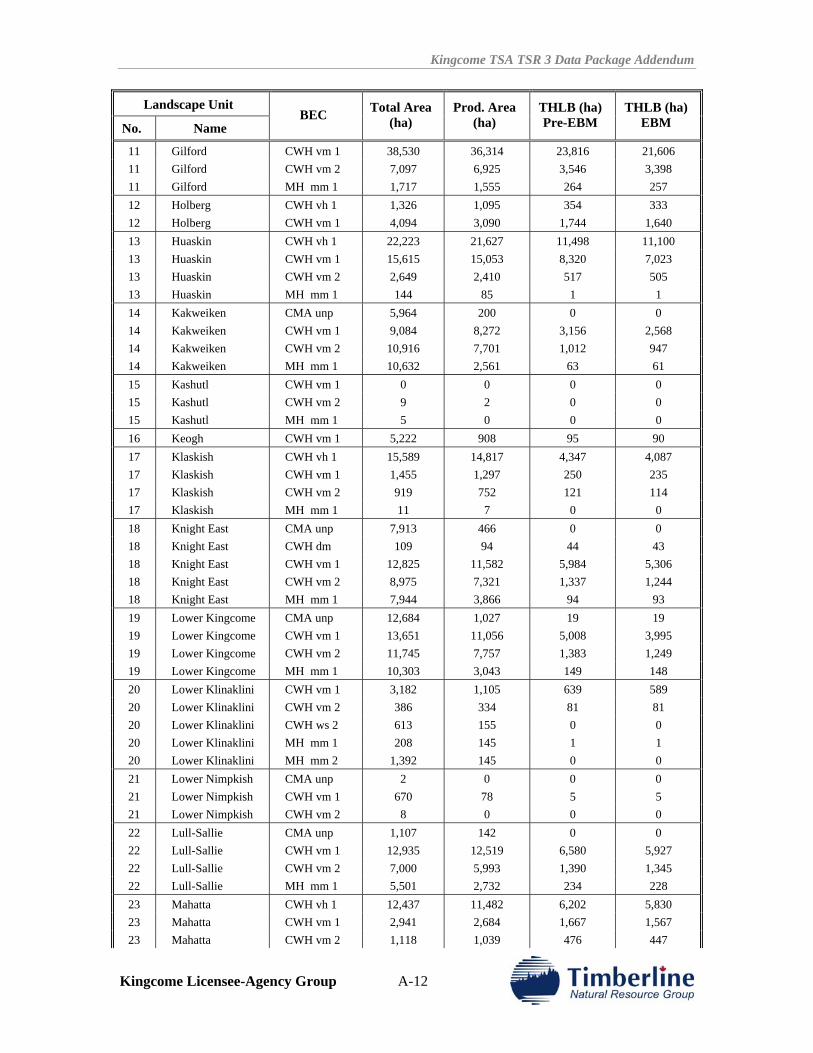
Kingcome TSA TSR 3 Data Package Addendum
Kingcome Licensee-Agency Group A-12
Landscape Unit
No. Name BEC Total Area
(ha) Prod. Area
(ha) THLB (ha) Pre-EBM
THLB (ha) EBM
11 Gilford CWH vm 1 38,530 36,314 23,816 21,606 11 Gilford CWH vm 2 7,097 6,925 3,546 3,398 11 Gilford MH mm 1 1,717 1,555 264 257 12 Holberg CWH vh 1 1,326 1,095 354 333 12 Holberg CWH vm 1 4,094 3,090 1,744 1,640 13 Huaskin CWH vh 1 22,223 21,627 11,498 11,100 13 Huaskin CWH vm 1 15,615 15,053 8,320 7,023 13 Huaskin CWH vm 2 2,649 2,410 517 505 13 Huaskin MH mm 1 144 85 1 1 14 Kakweiken CMA unp 5,964 200 0 0 14 Kakweiken CWH vm 1 9,084 8,272 3,156 2,568 14 Kakweiken CWH vm 2 10,916 7,701 1,012 947 14 Kakweiken MH mm 1 10,632 2,561 63 61 15 Kashutl CWH vm 1 0 0 0 0 15 Kashutl CWH vm 2 9 2 0 0 15 Kashutl MH mm 1 5 0 0 0 16 Keogh CWH vm 1 5,222 908 95 90 17 Klaskish CWH vh 1 15,589 14,817 4,347 4,087 17 Klaskish CWH vm 1 1,455 1,297 250 235 17 Klaskish CWH vm 2 919 752 121 114 17 Klaskish MH mm 1 11 7 0 0 18 Knight East CMA unp 7,913 466 0 0 18 Knight East CWH dm 109 94 44 43 18 Knight East CWH vm 1 12,825 11,582 5,984 5,306 18 Knight East CWH vm 2 8,975 7,321 1,337 1,244 18 Knight East MH mm 1 7,944 3,866 94 93 19 Lower Kingcome CMA unp 12,684 1,027 19 19 19 Lower Kingcome CWH vm 1 13,651 11,056 5,008 3,995 19 Lower Kingcome CWH vm 2 11,745 7,757 1,383 1,249 19 Lower Kingcome MH mm 1 10,303 3,043 149 148 20 Lower Klinaklini CWH vm 1 3,182 1,105 639 589 20 Lower Klinaklini CWH vm 2 386 334 81 81 20 Lower Klinaklini CWH ws 2 613 155 0 0 20 Lower Klinaklini MH mm 1 208 145 1 1 20 Lower Klinaklini MH mm 2 1,392 145 0 0 21 Lower Nimpkish CMA unp 2 0 0 0 21 Lower Nimpkish CWH vm 1 670 78 5 5 21 Lower Nimpkish CWH vm 2 8 0 0 0 22 Lull-Sallie CMA unp 1,107 142 0 0 22 Lull-Sallie CWH vm 1 12,935 12,519 6,580 5,927 22 Lull-Sallie CWH vm 2 7,000 5,993 1,390 1,345 22 Lull-Sallie MH mm 1 5,501 2,732 234 228 23 Mahatta CWH vh 1 12,437 11,482 6,202 5,830 23 Mahatta CWH vm 1 2,941 2,684 1,667 1,567 23 Mahatta CWH vm 2 1,118 1,039 476 447
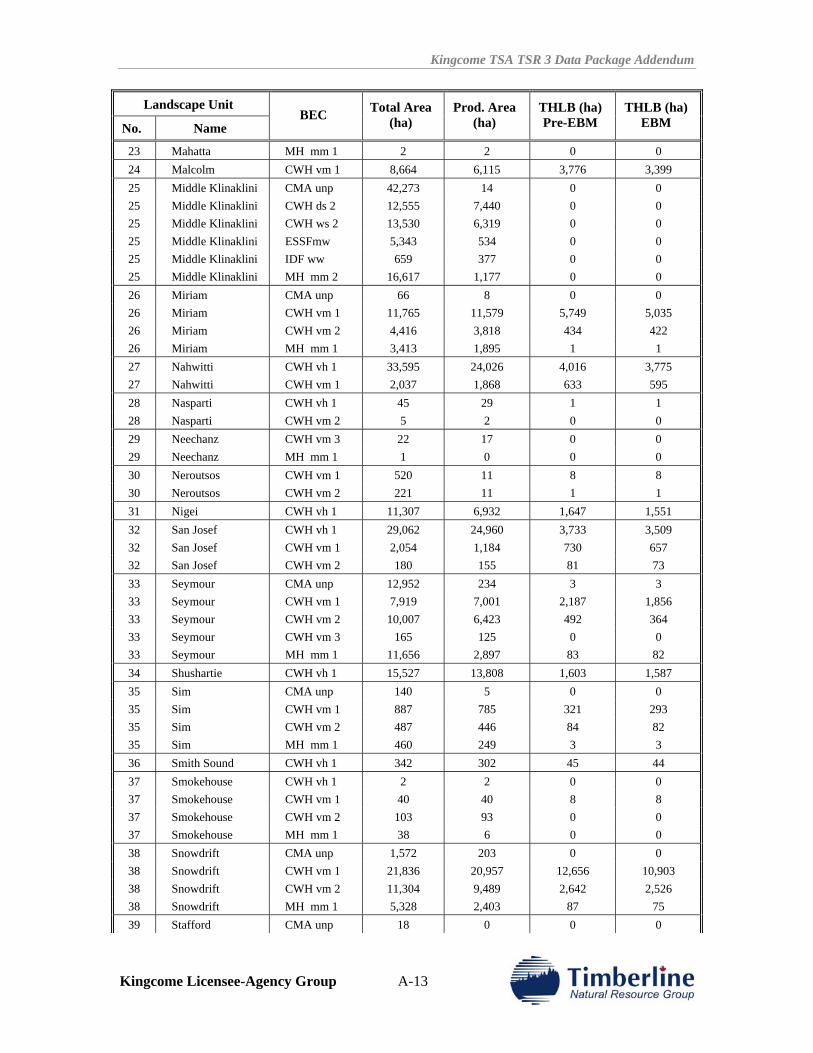
Kingcome TSA TSR 3 Data Package Addendum
Kingcome Licensee-Agency Group A-13
Landscape Unit
No. Name BEC Total Area
(ha) Prod. Area
(ha) THLB (ha) Pre-EBM
THLB (ha) EBM
23 Mahatta MH mm 1 2 2 0 0 24 Malcolm CWH vm 1 8,664 6,115 3,776 3,399 25 Middle Klinaklini CMA unp 42,273 14 0 0 25 Middle Klinaklini CWH ds 2 12,555 7,440 0 0 25 Middle Klinaklini CWH ws 2 13,530 6,319 0 0 25 Middle Klinaklini ESSFmw 5,343 534 0 0 25 Middle Klinaklini IDF ww 659 377 0 0 25 Middle Klinaklini MH mm 2 16,617 1,177 0 0 26 Miriam CMA unp 66 8 0 0 26 Miriam CWH vm 1 11,765 11,579 5,749 5,035 26 Miriam CWH vm 2 4,416 3,818 434 422 26 Miriam MH mm 1 3,413 1,895 1 1 27 Nahwitti CWH vh 1 33,595 24,026 4,016 3,775 27 Nahwitti CWH vm 1 2,037 1,868 633 595 28 Nasparti CWH vh 1 45 29 1 1 28 Nasparti CWH vm 2 5 2 0 0 29 Neechanz CWH vm 3 22 17 0 0 29 Neechanz MH mm 1 1 0 0 0 30 Neroutsos CWH vm 1 520 11 8 8 30 Neroutsos CWH vm 2 221 11 1 1 31 Nigei CWH vh 1 11,307 6,932 1,647 1,551 32 San Josef CWH vh 1 29,062 24,960 3,733 3,509 32 San Josef CWH vm 1 2,054 1,184 730 657 32 San Josef CWH vm 2 180 155 81 73 33 Seymour CMA unp 12,952 234 3 3 33 Seymour CWH vm 1 7,919 7,001 2,187 1,856 33 Seymour CWH vm 2 10,007 6,423 492 364 33 Seymour CWH vm 3 165 125 0 0 33 Seymour MH mm 1 11,656 2,897 83 82 34 Shushartie CWH vh 1 15,527 13,808 1,603 1,587 35 Sim CMA unp 140 5 0 0 35 Sim CWH vm 1 887 785 321 293 35 Sim CWH vm 2 487 446 84 82 35 Sim MH mm 1 460 249 3 3 36 Smith Sound CWH vh 1 342 302 45 44 37 Smokehouse CWH vh 1 2 2 0 0 37 Smokehouse CWH vm 1 40 40 8 8 37 Smokehouse CWH vm 2 103 93 0 0 37 Smokehouse MH mm 1 38 6 0 0 38 Snowdrift CMA unp 1,572 203 0 0 38 Snowdrift CWH vm 1 21,836 20,957 12,656 10,903 38 Snowdrift CWH vm 2 11,304 9,489 2,642 2,526 38 Snowdrift MH mm 1 5,328 2,403 87 75 39 Stafford CMA unp 18 0 0 0
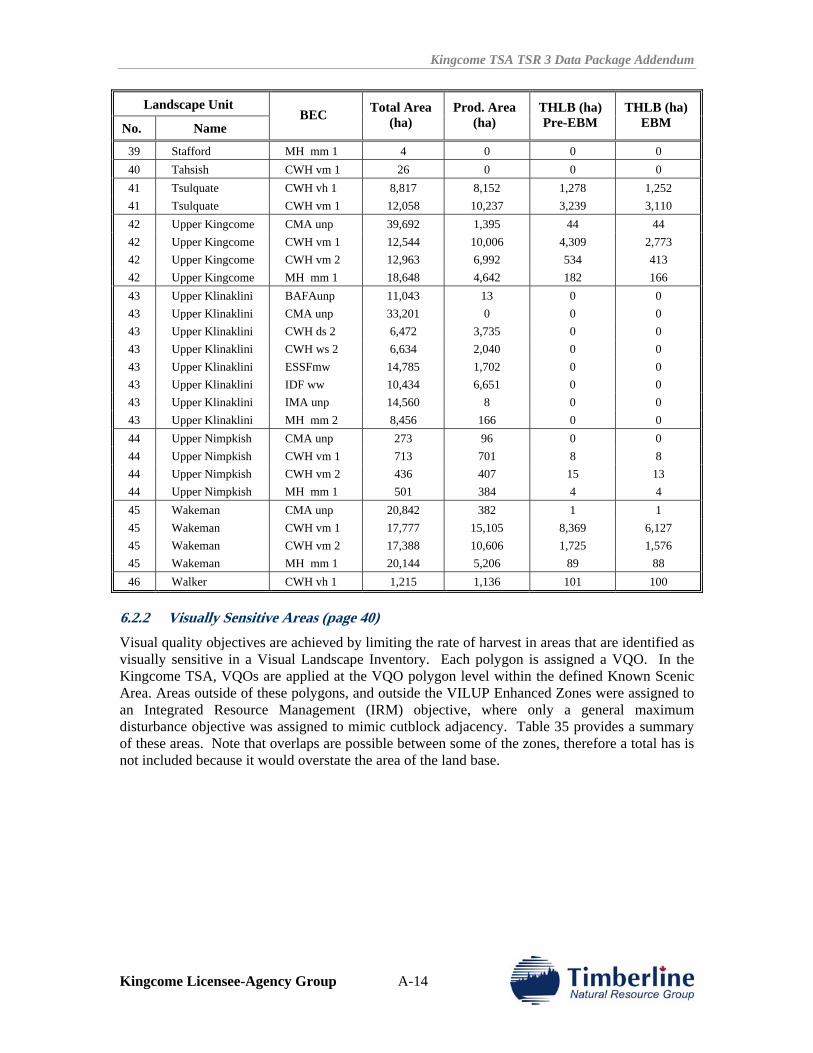
Kingcome TSA TSR 3 Data Package Addendum
Kingcome Licensee-Agency Group A-14
Landscape Unit
No. Name BEC Total Area
(ha) Prod. Area
(ha) THLB (ha) Pre-EBM
THLB (ha) EBM
39 Stafford MH mm 1 4 0 0 0 40 Tahsish CWH vm 1 26 0 0 0 41 Tsulquate CWH vh 1 8,817 8,152 1,278 1,252 41 Tsulquate CWH vm 1 12,058 10,237 3,239 3,110 42 Upper Kingcome CMA unp 39,692 1,395 44 44 42 Upper Kingcome CWH vm 1 12,544 10,006 4,309 2,773 42 Upper Kingcome CWH vm 2 12,963 6,992 534 413 42 Upper Kingcome MH mm 1 18,648 4,642 182 166 43 Upper Klinaklini BAFAunp 11,043 13 0 0 43 Upper Klinaklini CMA unp 33,201 0 0 0 43 Upper Klinaklini CWH ds 2 6,472 3,735 0 0 43 Upper Klinaklini CWH ws 2 6,634 2,040 0 0 43 Upper Klinaklini ESSFmw 14,785 1,702 0 0 43 Upper Klinaklini IDF ww 10,434 6,651 0 0 43 Upper Klinaklini IMA unp 14,560 8 0 0 43 Upper Klinaklini MH mm 2 8,456 166 0 0 44 Upper Nimpkish CMA unp 273 96 0 0 44 Upper Nimpkish CWH vm 1 713 701 8 8 44 Upper Nimpkish CWH vm 2 436 407 15 13 44 Upper Nimpkish MH mm 1 501 384 4 4 45 Wakeman CMA unp 20,842 382 1 1 45 Wakeman CWH vm 1 17,777 15,105 8,369 6,127 45 Wakeman CWH vm 2 17,388 10,606 1,725 1,576 45 Wakeman MH mm 1 20,144 5,206 89 88 46 Walker CWH vh 1 1,215 1,136 101 100
6.2.2 Visually Sensitive Areas (page 40) Visual quality objectives are achieved by limiting the rate of harvest in areas that are identified as visually sensitive in a Visual Landscape Inventory. Each polygon is assigned a VQO. In the Kingcome TSA, VQOs are applied at the VQO polygon level within the defined Known Scenic Area. Areas outside of these polygons, and outside the VILUP Enhanced Zones were assigned to an Integrated Resource Management (IRM) objective, where only a general maximum disturbance objective was assigned to mimic cutblock adjacency. Table 35 provides a summary of these areas. Note that overlaps are possible between some of the zones, therefore a total has is not included because it would overstate the area of the land base.
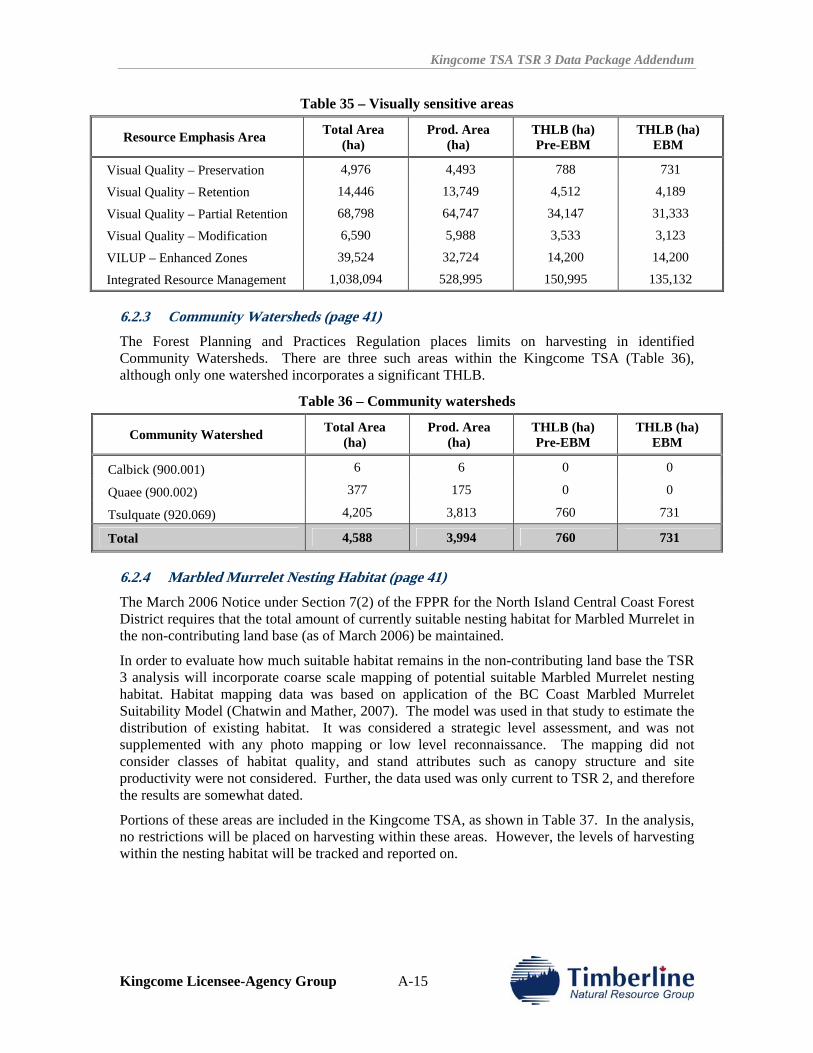
Kingcome TSA TSR 3 Data Package Addendum
Kingcome Licensee-Agency Group A-15
Table 35 – Visually sensitive areas
Resource Emphasis Area Total Area (ha)
Prod. Area (ha)
THLB (ha) Pre-EBM
THLB (ha) EBM
Visual Quality – Preservation 4,976 4,493 788 731
Visual Quality – Retention 14,446 13,749 4,512 4,189
Visual Quality – Partial Retention 68,798 64,747 34,147 31,333
Visual Quality – Modification 6,590 5,988 3,533 3,123
VILUP – Enhanced Zones 39,524 32,724 14,200 14,200
Integrated Resource Management 1,038,094 528,995 150,995 135,132
6.2.3 Community Watersheds (page 41) The Forest Planning and Practices Regulation places limits on harvesting in identified Community Watersheds. There are three such areas within the Kingcome TSA (Table 36), although only one watershed incorporates a significant THLB.
Table 36 – Community watersheds
Community Watershed Total Area (ha)
Prod. Area (ha)
THLB (ha) Pre-EBM
THLB (ha) EBM
Calbick (900.001) 6 6 0 0
Quaee (900.002) 377 175 0 0
Tsulquate (920.069) 4,205 3,813 760 731
Total 4,588 3,994 760 731
6.2.4 Marbled Murrelet Nesting Habitat (page 41) The March 2006 Notice under Section 7(2) of the FPPR for the North Island Central Coast Forest District requires that the total amount of currently suitable nesting habitat for Marbled Murrelet in the non-contributing land base (as of March 2006) be maintained.
In order to evaluate how much suitable habitat remains in the non-contributing land base the TSR 3 analysis will incorporate coarse scale mapping of potential suitable Marbled Murrelet nesting habitat. Habitat mapping data was based on application of the BC Coast Marbled Murrelet Suitability Model (Chatwin and Mather, 2007). The model was used in that study to estimate the distribution of existing habitat. It was considered a strategic level assessment, and was not supplemented with any photo mapping or low level reconnaissance. The mapping did not consider classes of habitat quality, and stand attributes such as canopy structure and site productivity were not considered. Further, the data used was only current to TSR 2, and therefore the results are somewhat dated.
Portions of these areas are included in the Kingcome TSA, as shown in Table 37. In the analysis, no restrictions will be placed on harvesting within these areas. However, the levels of harvesting within the nesting habitat will be tracked and reported on.
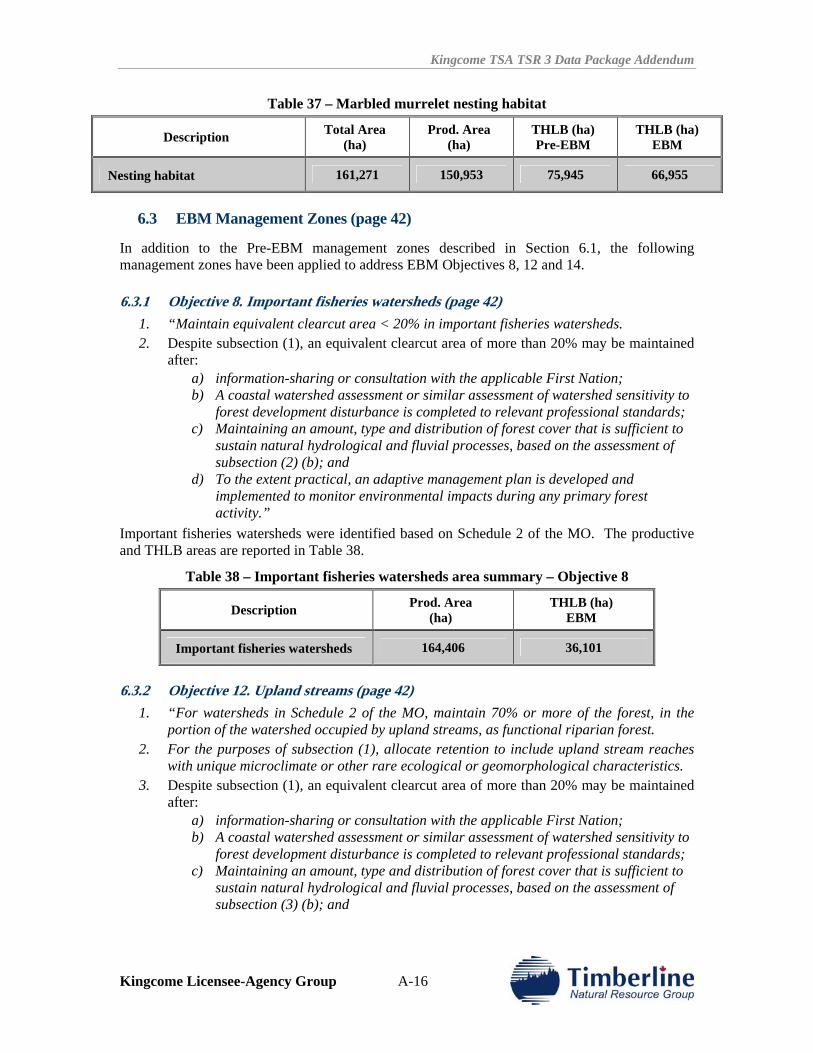
Kingcome TSA TSR 3 Data Package Addendum
Kingcome Licensee-Agency Group A-16
Table 37 – Marbled murrelet nesting habitat
Description Total Area (ha)
Prod. Area (ha)
THLB (ha) Pre-EBM
THLB (ha) EBM
Nesting habitat 161,271 150,953 75,945 66,955
6.3 EBM Management Zones (page 42)
In addition to the Pre-EBM management zones described in Section 6.1, the following management zones have been applied to address EBM Objectives 8, 12 and 14.
6.3.1 Objective 8. Important fisheries watersheds (page 42) 1. “Maintain equivalent clearcut area < 20% in important fisheries watersheds. 2. Despite subsection (1), an equivalent clearcut area of more than 20% may be maintained
after: a) information-sharing or consultation with the applicable First Nation; b) A coastal watershed assessment or similar assessment of watershed sensitivity to
forest development disturbance is completed to relevant professional standards; c) Maintaining an amount, type and distribution of forest cover that is sufficient to
sustain natural hydrological and fluvial processes, based on the assessment of subsection (2) (b); and
d) To the extent practical, an adaptive management plan is developed and implemented to monitor environmental impacts during any primary forest activity.”
Important fisheries watersheds were identified based on Schedule 2 of the MO. The productive and THLB areas are reported in Table 38.
Table 38 – Important fisheries watersheds area summary – Objective 8
Description Prod. Area (ha)
THLB (ha) EBM
Important fisheries watersheds 164,406 36,101
6.3.2 Objective 12. Upland streams (page 42) 1. “For watersheds in Schedule 2 of the MO, maintain 70% or more of the forest, in the
portion of the watershed occupied by upland streams, as functional riparian forest. 2. For the purposes of subsection (1), allocate retention to include upland stream reaches
with unique microclimate or other rare ecological or geomorphological characteristics. 3. Despite subsection (1), an equivalent clearcut area of more than 20% may be maintained
after: a) information-sharing or consultation with the applicable First Nation; b) A coastal watershed assessment or similar assessment of watershed sensitivity to
forest development disturbance is completed to relevant professional standards; c) Maintaining an amount, type and distribution of forest cover that is sufficient to
sustain natural hydrological and fluvial processes, based on the assessment of subsection (3) (b); and
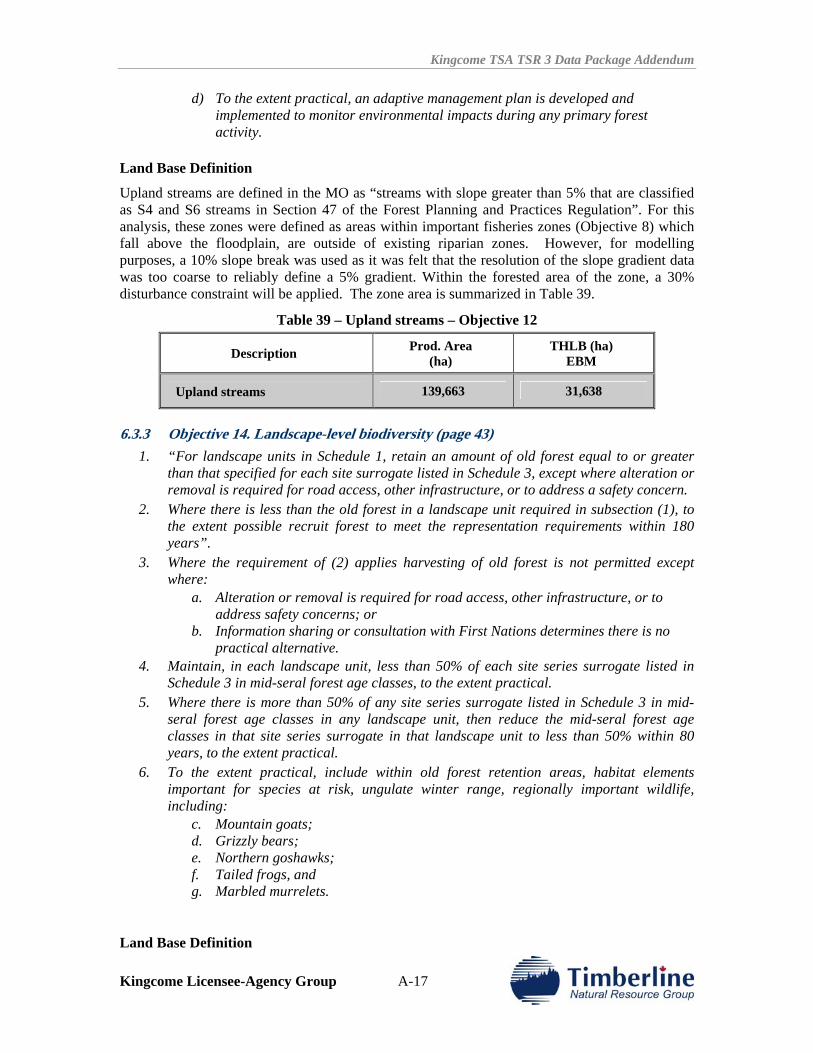
Kingcome TSA TSR 3 Data Package Addendum
Kingcome Licensee-Agency Group A-17
d) To the extent practical, an adaptive management plan is developed and implemented to monitor environmental impacts during any primary forest activity.
Land Base Definition
Upland streams are defined in the MO as “streams with slope greater than 5% that are classified as S4 and S6 streams in Section 47 of the Forest Planning and Practices Regulation”. For this analysis, these zones were defined as areas within important fisheries zones (Objective 8) which fall above the floodplain, are outside of existing riparian zones. However, for modelling purposes, a 10% slope break was used as it was felt that the resolution of the slope gradient data was too coarse to reliably define a 5% gradient. Within the forested area of the zone, a 30% disturbance constraint will be applied. The zone area is summarized in Table 39.
Table 39 – Upland streams – Objective 12
Description Prod. Area (ha)
THLB (ha) EBM
Upland streams 139,663 31,638
6.3.3 Objective 14. Landscape-level biodiversity (page 43) 1. “For landscape units in Schedule 1, retain an amount of old forest equal to or greater
than that specified for each site surrogate listed in Schedule 3, except where alteration or removal is required for road access, other infrastructure, or to address a safety concern.
2. Where there is less than the old forest in a landscape unit required in subsection (1), to the extent possible recruit forest to meet the representation requirements within 180 years”.
3. Where the requirement of (2) applies harvesting of old forest is not permitted except where:
a. Alteration or removal is required for road access, other infrastructure, or to address safety concerns; or
b. Information sharing or consultation with First Nations determines there is no practical alternative.
4. Maintain, in each landscape unit, less than 50% of each site series surrogate listed in Schedule 3 in mid-seral forest age classes, to the extent practical.
5. Where there is more than 50% of any site series surrogate listed in Schedule 3 in mid-seral forest age classes in any landscape unit, then reduce the mid-seral forest age classes in that site series surrogate in that landscape unit to less than 50% within 80 years, to the extent practical.
6. To the extent practical, include within old forest retention areas, habitat elements important for species at risk, ungulate winter range, regionally important wildlife, including:
c. Mountain goats; d. Grizzly bears; e. Northern goshawks; f. Tailed frogs, and g. Marbled murrelets.
Land Base Definition
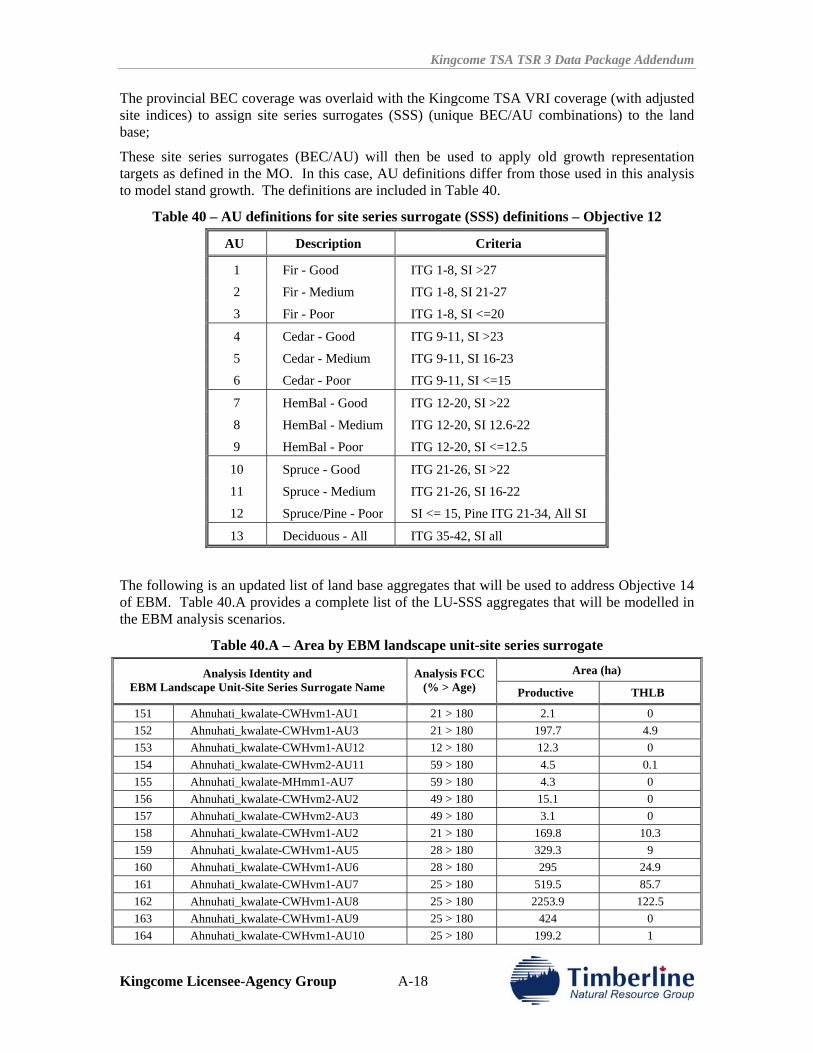
Kingcome TSA TSR 3 Data Package Addendum
Kingcome Licensee-Agency Group A-18
The provincial BEC coverage was overlaid with the Kingcome TSA VRI coverage (with adjusted site indices) to assign site series surrogates (SSS) (unique BEC/AU combinations) to the land base;
These site series surrogates (BEC/AU) will then be used to apply old growth representation targets as defined in the MO. In this case, AU definitions differ from those used in this analysis to model stand growth. The definitions are included in Table 40.
Table 40 – AU definitions for site series surrogate (SSS) definitions – Objective 12
AU Description Criteria
1 Fir - Good ITG 1-8, SI >27
2 Fir - Medium ITG 1-8, SI 21-27
3 Fir - Poor ITG 1-8, SI <=20
4 Cedar - Good ITG 9-11, SI >23
5 Cedar - Medium ITG 9-11, SI 16-23
6 Cedar - Poor ITG 9-11, SI <=15
7 HemBal - Good ITG 12-20, SI >22
8 HemBal - Medium ITG 12-20, SI 12.6-22
9 HemBal - Poor ITG 12-20, SI <=12.5
10 Spruce - Good ITG 21-26, SI >22
11 Spruce - Medium ITG 21-26, SI 16-22
12 Spruce/Pine - Poor SI <= 15, Pine ITG 21-34, All SI
13 Deciduous - All ITG 35-42, SI all
The following is an updated list of land base aggregates that will be used to address Objective 14 of EBM. Table 40.A provides a complete list of the LU-SSS aggregates that will be modelled in the EBM analysis scenarios.
Table 40.A – Area by EBM landscape unit-site series surrogate
Area (ha) Analysis Identity and EBM Landscape Unit-Site Series Surrogate Name
Analysis FCC (% > Age) Productive THLB
151 Ahnuhati_kwalate-CWHvm1-AU1 21 > 180 2.1 0 152 Ahnuhati_kwalate-CWHvm1-AU3 21 > 180 197.7 4.9 153 Ahnuhati_kwalate-CWHvm1-AU12 12 > 180 12.3 0 154 Ahnuhati_kwalate-CWHvm2-AU11 59 > 180 4.5 0.1 155 Ahnuhati_kwalate-MHmm1-AU7 59 > 180 4.3 0 156 Ahnuhati_kwalate-CWHvm2-AU2 49 > 180 15.1 0 157 Ahnuhati_kwalate-CWHvm2-AU3 49 > 180 3.1 0 158 Ahnuhati_kwalate-CWHvm1-AU2 21 > 180 169.8 10.3 159 Ahnuhati_kwalate-CWHvm1-AU5 28 > 180 329.3 9 160 Ahnuhati_kwalate-CWHvm1-AU6 28 > 180 295 24.9 161 Ahnuhati_kwalate-CWHvm1-AU7 25 > 180 519.5 85.7 162 Ahnuhati_kwalate-CWHvm1-AU8 25 > 180 2253.9 122.5 163 Ahnuhati_kwalate-CWHvm1-AU9 25 > 180 424 0 164 Ahnuhati_kwalate-CWHvm1-AU10 25 > 180 199.2 1
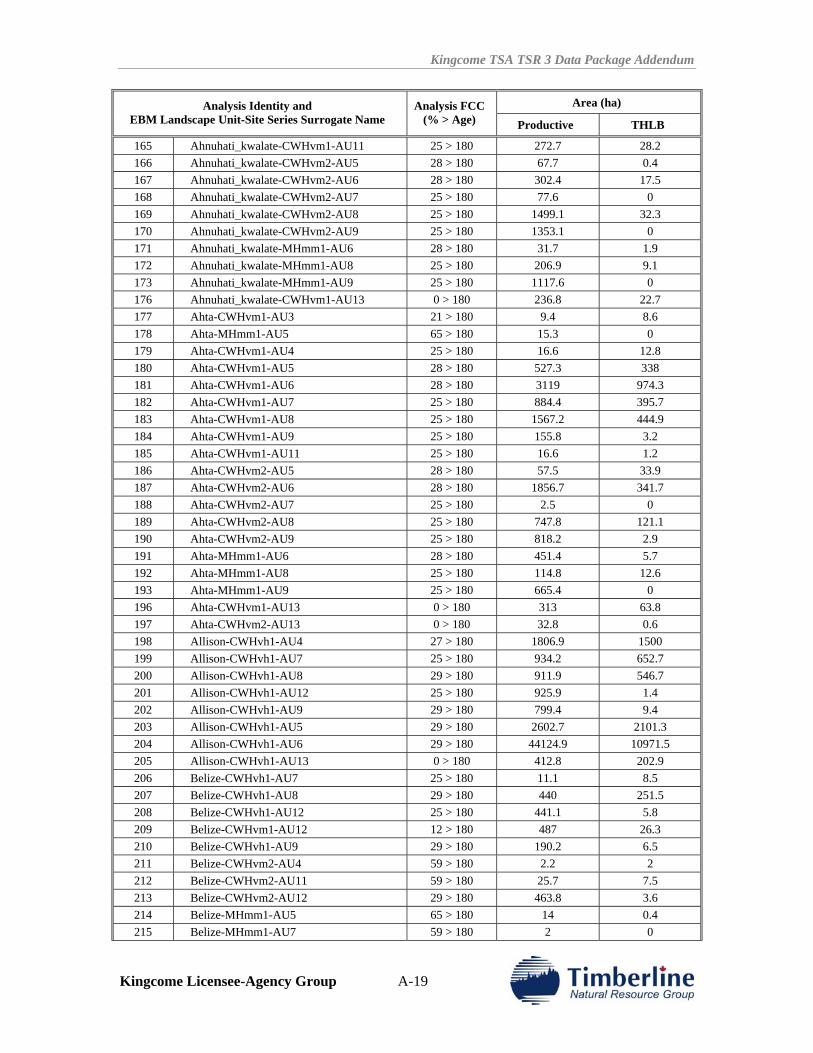
Kingcome TSA TSR 3 Data Package Addendum
Kingcome Licensee-Agency Group A-19
Area (ha) Analysis Identity and EBM Landscape Unit-Site Series Surrogate Name
Analysis FCC (% > Age) Productive THLB
165 Ahnuhati_kwalate-CWHvm1-AU11 25 > 180 272.7 28.2 166 Ahnuhati_kwalate-CWHvm2-AU5 28 > 180 67.7 0.4 167 Ahnuhati_kwalate-CWHvm2-AU6 28 > 180 302.4 17.5 168 Ahnuhati_kwalate-CWHvm2-AU7 25 > 180 77.6 0 169 Ahnuhati_kwalate-CWHvm2-AU8 25 > 180 1499.1 32.3 170 Ahnuhati_kwalate-CWHvm2-AU9 25 > 180 1353.1 0 171 Ahnuhati_kwalate-MHmm1-AU6 28 > 180 31.7 1.9 172 Ahnuhati_kwalate-MHmm1-AU8 25 > 180 206.9 9.1 173 Ahnuhati_kwalate-MHmm1-AU9 25 > 180 1117.6 0 176 Ahnuhati_kwalate-CWHvm1-AU13 0 > 180 236.8 22.7 177 Ahta-CWHvm1-AU3 21 > 180 9.4 8.6 178 Ahta-MHmm1-AU5 65 > 180 15.3 0 179 Ahta-CWHvm1-AU4 25 > 180 16.6 12.8 180 Ahta-CWHvm1-AU5 28 > 180 527.3 338 181 Ahta-CWHvm1-AU6 28 > 180 3119 974.3 182 Ahta-CWHvm1-AU7 25 > 180 884.4 395.7 183 Ahta-CWHvm1-AU8 25 > 180 1567.2 444.9 184 Ahta-CWHvm1-AU9 25 > 180 155.8 3.2 185 Ahta-CWHvm1-AU11 25 > 180 16.6 1.2 186 Ahta-CWHvm2-AU5 28 > 180 57.5 33.9 187 Ahta-CWHvm2-AU6 28 > 180 1856.7 341.7 188 Ahta-CWHvm2-AU7 25 > 180 2.5 0 189 Ahta-CWHvm2-AU8 25 > 180 747.8 121.1 190 Ahta-CWHvm2-AU9 25 > 180 818.2 2.9 191 Ahta-MHmm1-AU6 28 > 180 451.4 5.7 192 Ahta-MHmm1-AU8 25 > 180 114.8 12.6 193 Ahta-MHmm1-AU9 25 > 180 665.4 0 196 Ahta-CWHvm1-AU13 0 > 180 313 63.8 197 Ahta-CWHvm2-AU13 0 > 180 32.8 0.6 198 Allison-CWHvh1-AU4 27 > 180 1806.9 1500 199 Allison-CWHvh1-AU7 25 > 180 934.2 652.7 200 Allison-CWHvh1-AU8 29 > 180 911.9 546.7 201 Allison-CWHvh1-AU12 25 > 180 925.9 1.4 202 Allison-CWHvh1-AU9 29 > 180 799.4 9.4 203 Allison-CWHvh1-AU5 29 > 180 2602.7 2101.3 204 Allison-CWHvh1-AU6 29 > 180 44124.9 10971.5 205 Allison-CWHvh1-AU13 0 > 180 412.8 202.9 206 Belize-CWHvh1-AU7 25 > 180 11.1 8.5 207 Belize-CWHvh1-AU8 29 > 180 440 251.5 208 Belize-CWHvh1-AU12 25 > 180 441.1 5.8 209 Belize-CWHvm1-AU12 12 > 180 487 26.3 210 Belize-CWHvh1-AU9 29 > 180 190.2 6.5 211 Belize-CWHvm2-AU4 59 > 180 2.2 2 212 Belize-CWHvm2-AU11 59 > 180 25.7 7.5 213 Belize-CWHvm2-AU12 29 > 180 463.8 3.6 214 Belize-MHmm1-AU5 65 > 180 14 0.4 215 Belize-MHmm1-AU7 59 > 180 2 0
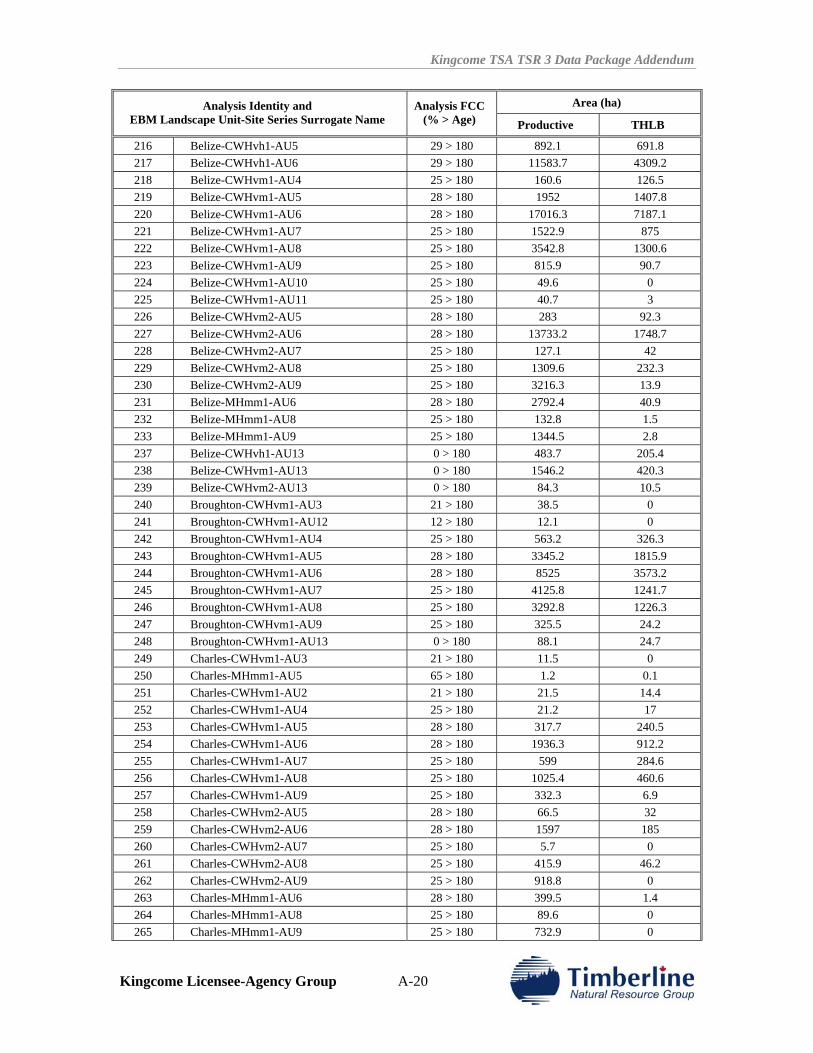
Kingcome TSA TSR 3 Data Package Addendum
Kingcome Licensee-Agency Group A-20
Area (ha) Analysis Identity and EBM Landscape Unit-Site Series Surrogate Name
Analysis FCC (% > Age) Productive THLB
216 Belize-CWHvh1-AU5 29 > 180 892.1 691.8 217 Belize-CWHvh1-AU6 29 > 180 11583.7 4309.2 218 Belize-CWHvm1-AU4 25 > 180 160.6 126.5 219 Belize-CWHvm1-AU5 28 > 180 1952 1407.8 220 Belize-CWHvm1-AU6 28 > 180 17016.3 7187.1 221 Belize-CWHvm1-AU7 25 > 180 1522.9 875 222 Belize-CWHvm1-AU8 25 > 180 3542.8 1300.6 223 Belize-CWHvm1-AU9 25 > 180 815.9 90.7 224 Belize-CWHvm1-AU10 25 > 180 49.6 0 225 Belize-CWHvm1-AU11 25 > 180 40.7 3 226 Belize-CWHvm2-AU5 28 > 180 283 92.3 227 Belize-CWHvm2-AU6 28 > 180 13733.2 1748.7 228 Belize-CWHvm2-AU7 25 > 180 127.1 42 229 Belize-CWHvm2-AU8 25 > 180 1309.6 232.3 230 Belize-CWHvm2-AU9 25 > 180 3216.3 13.9 231 Belize-MHmm1-AU6 28 > 180 2792.4 40.9 232 Belize-MHmm1-AU8 25 > 180 132.8 1.5 233 Belize-MHmm1-AU9 25 > 180 1344.5 2.8 237 Belize-CWHvh1-AU13 0 > 180 483.7 205.4 238 Belize-CWHvm1-AU13 0 > 180 1546.2 420.3 239 Belize-CWHvm2-AU13 0 > 180 84.3 10.5 240 Broughton-CWHvm1-AU3 21 > 180 38.5 0 241 Broughton-CWHvm1-AU12 12 > 180 12.1 0 242 Broughton-CWHvm1-AU4 25 > 180 563.2 326.3 243 Broughton-CWHvm1-AU5 28 > 180 3345.2 1815.9 244 Broughton-CWHvm1-AU6 28 > 180 8525 3573.2 245 Broughton-CWHvm1-AU7 25 > 180 4125.8 1241.7 246 Broughton-CWHvm1-AU8 25 > 180 3292.8 1226.3 247 Broughton-CWHvm1-AU9 25 > 180 325.5 24.2 248 Broughton-CWHvm1-AU13 0 > 180 88.1 24.7 249 Charles-CWHvm1-AU3 21 > 180 11.5 0 250 Charles-MHmm1-AU5 65 > 180 1.2 0.1 251 Charles-CWHvm1-AU2 21 > 180 21.5 14.4 252 Charles-CWHvm1-AU4 25 > 180 21.2 17 253 Charles-CWHvm1-AU5 28 > 180 317.7 240.5 254 Charles-CWHvm1-AU6 28 > 180 1936.3 912.2 255 Charles-CWHvm1-AU7 25 > 180 599 284.6 256 Charles-CWHvm1-AU8 25 > 180 1025.4 460.6 257 Charles-CWHvm1-AU9 25 > 180 332.3 6.9 258 Charles-CWHvm2-AU5 28 > 180 66.5 32 259 Charles-CWHvm2-AU6 28 > 180 1597 185 260 Charles-CWHvm2-AU7 25 > 180 5.7 0 261 Charles-CWHvm2-AU8 25 > 180 415.9 46.2 262 Charles-CWHvm2-AU9 25 > 180 918.8 0 263 Charles-MHmm1-AU6 28 > 180 399.5 1.4 264 Charles-MHmm1-AU8 25 > 180 89.6 0 265 Charles-MHmm1-AU9 25 > 180 732.9 0
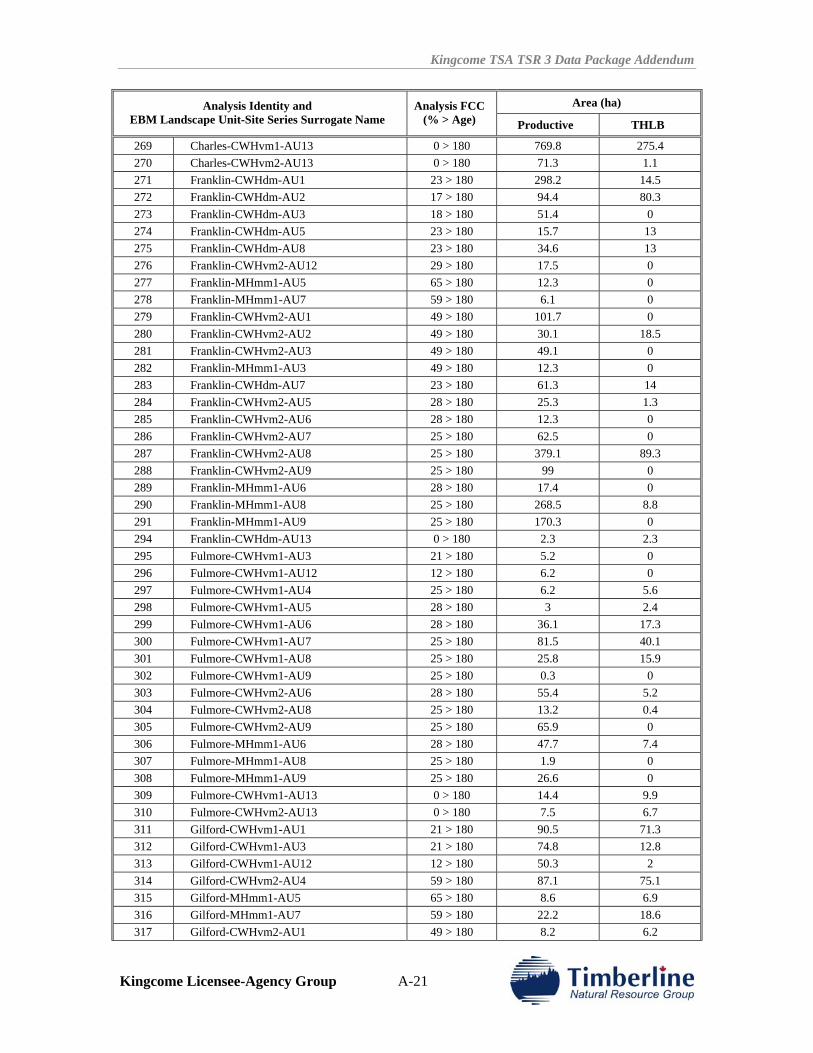
Kingcome TSA TSR 3 Data Package Addendum
Kingcome Licensee-Agency Group A-21
Area (ha) Analysis Identity and EBM Landscape Unit-Site Series Surrogate Name
Analysis FCC (% > Age) Productive THLB
269 Charles-CWHvm1-AU13 0 > 180 769.8 275.4 270 Charles-CWHvm2-AU13 0 > 180 71.3 1.1 271 Franklin-CWHdm-AU1 23 > 180 298.2 14.5 272 Franklin-CWHdm-AU2 17 > 180 94.4 80.3 273 Franklin-CWHdm-AU3 18 > 180 51.4 0 274 Franklin-CWHdm-AU5 23 > 180 15.7 13 275 Franklin-CWHdm-AU8 23 > 180 34.6 13 276 Franklin-CWHvm2-AU12 29 > 180 17.5 0 277 Franklin-MHmm1-AU5 65 > 180 12.3 0 278 Franklin-MHmm1-AU7 59 > 180 6.1 0 279 Franklin-CWHvm2-AU1 49 > 180 101.7 0 280 Franklin-CWHvm2-AU2 49 > 180 30.1 18.5 281 Franklin-CWHvm2-AU3 49 > 180 49.1 0 282 Franklin-MHmm1-AU3 49 > 180 12.3 0 283 Franklin-CWHdm-AU7 23 > 180 61.3 14 284 Franklin-CWHvm2-AU5 28 > 180 25.3 1.3 285 Franklin-CWHvm2-AU6 28 > 180 12.3 0 286 Franklin-CWHvm2-AU7 25 > 180 62.5 0 287 Franklin-CWHvm2-AU8 25 > 180 379.1 89.3 288 Franklin-CWHvm2-AU9 25 > 180 99 0 289 Franklin-MHmm1-AU6 28 > 180 17.4 0 290 Franklin-MHmm1-AU8 25 > 180 268.5 8.8 291 Franklin-MHmm1-AU9 25 > 180 170.3 0 294 Franklin-CWHdm-AU13 0 > 180 2.3 2.3 295 Fulmore-CWHvm1-AU3 21 > 180 5.2 0 296 Fulmore-CWHvm1-AU12 12 > 180 6.2 0 297 Fulmore-CWHvm1-AU4 25 > 180 6.2 5.6 298 Fulmore-CWHvm1-AU5 28 > 180 3 2.4 299 Fulmore-CWHvm1-AU6 28 > 180 36.1 17.3 300 Fulmore-CWHvm1-AU7 25 > 180 81.5 40.1 301 Fulmore-CWHvm1-AU8 25 > 180 25.8 15.9 302 Fulmore-CWHvm1-AU9 25 > 180 0.3 0 303 Fulmore-CWHvm2-AU6 28 > 180 55.4 5.2 304 Fulmore-CWHvm2-AU8 25 > 180 13.2 0.4 305 Fulmore-CWHvm2-AU9 25 > 180 65.9 0 306 Fulmore-MHmm1-AU6 28 > 180 47.7 7.4 307 Fulmore-MHmm1-AU8 25 > 180 1.9 0 308 Fulmore-MHmm1-AU9 25 > 180 26.6 0 309 Fulmore-CWHvm1-AU13 0 > 180 14.4 9.9 310 Fulmore-CWHvm2-AU13 0 > 180 7.5 6.7 311 Gilford-CWHvm1-AU1 21 > 180 90.5 71.3 312 Gilford-CWHvm1-AU3 21 > 180 74.8 12.8 313 Gilford-CWHvm1-AU12 12 > 180 50.3 2 314 Gilford-CWHvm2-AU4 59 > 180 87.1 75.1 315 Gilford-MHmm1-AU5 65 > 180 8.6 6.9 316 Gilford-MHmm1-AU7 59 > 180 22.2 18.6 317 Gilford-CWHvm2-AU1 49 > 180 8.2 6.2
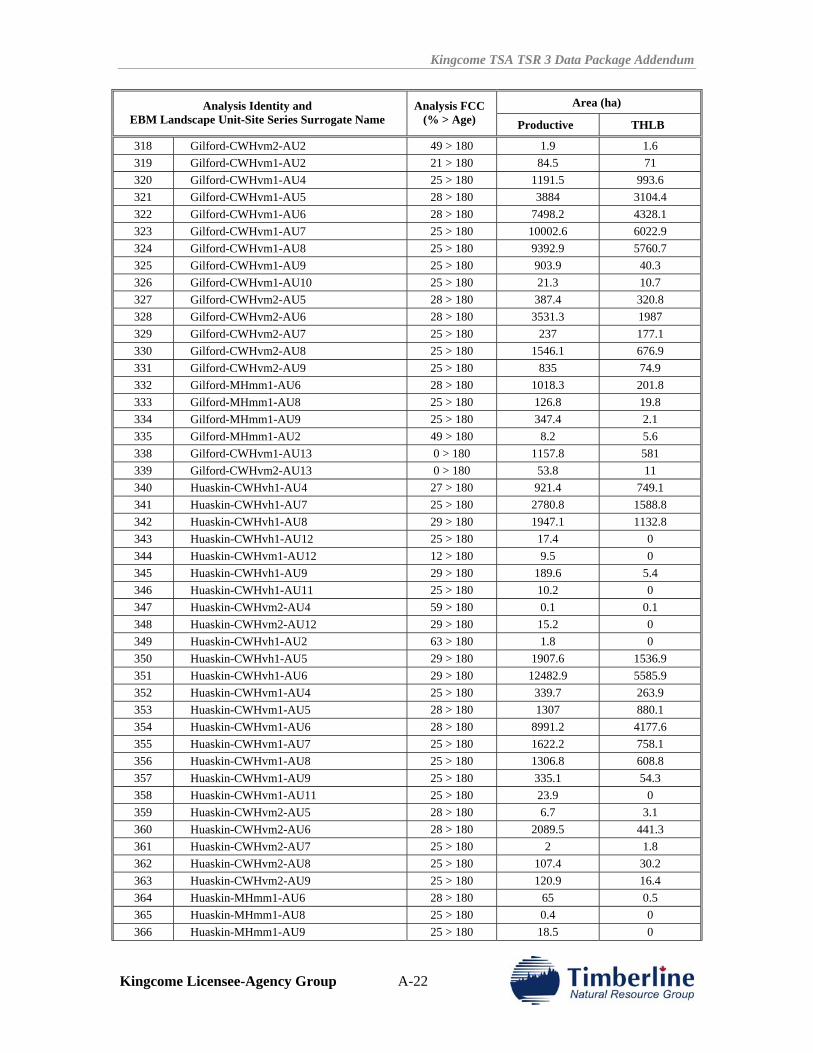
Kingcome TSA TSR 3 Data Package Addendum
Kingcome Licensee-Agency Group A-22
Area (ha) Analysis Identity and EBM Landscape Unit-Site Series Surrogate Name
Analysis FCC (% > Age) Productive THLB
318 Gilford-CWHvm2-AU2 49 > 180 1.9 1.6 319 Gilford-CWHvm1-AU2 21 > 180 84.5 71 320 Gilford-CWHvm1-AU4 25 > 180 1191.5 993.6 321 Gilford-CWHvm1-AU5 28 > 180 3884 3104.4 322 Gilford-CWHvm1-AU6 28 > 180 7498.2 4328.1 323 Gilford-CWHvm1-AU7 25 > 180 10002.6 6022.9 324 Gilford-CWHvm1-AU8 25 > 180 9392.9 5760.7 325 Gilford-CWHvm1-AU9 25 > 180 903.9 40.3 326 Gilford-CWHvm1-AU10 25 > 180 21.3 10.7 327 Gilford-CWHvm2-AU5 28 > 180 387.4 320.8 328 Gilford-CWHvm2-AU6 28 > 180 3531.3 1987 329 Gilford-CWHvm2-AU7 25 > 180 237 177.1 330 Gilford-CWHvm2-AU8 25 > 180 1546.1 676.9 331 Gilford-CWHvm2-AU9 25 > 180 835 74.9 332 Gilford-MHmm1-AU6 28 > 180 1018.3 201.8 333 Gilford-MHmm1-AU8 25 > 180 126.8 19.8 334 Gilford-MHmm1-AU9 25 > 180 347.4 2.1 335 Gilford-MHmm1-AU2 49 > 180 8.2 5.6 338 Gilford-CWHvm1-AU13 0 > 180 1157.8 581 339 Gilford-CWHvm2-AU13 0 > 180 53.8 11 340 Huaskin-CWHvh1-AU4 27 > 180 921.4 749.1 341 Huaskin-CWHvh1-AU7 25 > 180 2780.8 1588.8 342 Huaskin-CWHvh1-AU8 29 > 180 1947.1 1132.8 343 Huaskin-CWHvh1-AU12 25 > 180 17.4 0 344 Huaskin-CWHvm1-AU12 12 > 180 9.5 0 345 Huaskin-CWHvh1-AU9 29 > 180 189.6 5.4 346 Huaskin-CWHvh1-AU11 25 > 180 10.2 0 347 Huaskin-CWHvm2-AU4 59 > 180 0.1 0.1 348 Huaskin-CWHvm2-AU12 29 > 180 15.2 0 349 Huaskin-CWHvh1-AU2 63 > 180 1.8 0 350 Huaskin-CWHvh1-AU5 29 > 180 1907.6 1536.9 351 Huaskin-CWHvh1-AU6 29 > 180 12482.9 5585.9 352 Huaskin-CWHvm1-AU4 25 > 180 339.7 263.9 353 Huaskin-CWHvm1-AU5 28 > 180 1307 880.1 354 Huaskin-CWHvm1-AU6 28 > 180 8991.2 4177.6 355 Huaskin-CWHvm1-AU7 25 > 180 1622.2 758.1 356 Huaskin-CWHvm1-AU8 25 > 180 1306.8 608.8 357 Huaskin-CWHvm1-AU9 25 > 180 335.1 54.3 358 Huaskin-CWHvm1-AU11 25 > 180 23.9 0 359 Huaskin-CWHvm2-AU5 28 > 180 6.7 3.1 360 Huaskin-CWHvm2-AU6 28 > 180 2089.5 441.3 361 Huaskin-CWHvm2-AU7 25 > 180 2 1.8 362 Huaskin-CWHvm2-AU8 25 > 180 107.4 30.2 363 Huaskin-CWHvm2-AU9 25 > 180 120.9 16.4 364 Huaskin-MHmm1-AU6 28 > 180 65 0.5 365 Huaskin-MHmm1-AU8 25 > 180 0.4 0 366 Huaskin-MHmm1-AU9 25 > 180 18.5 0
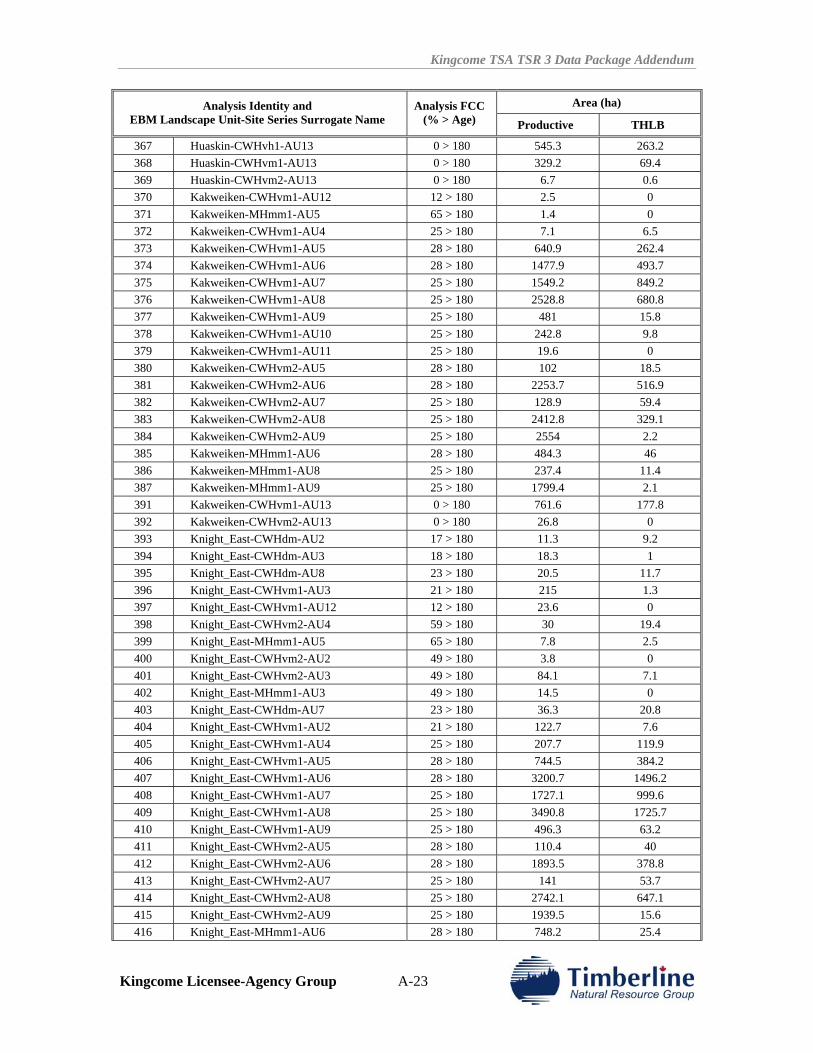
Kingcome TSA TSR 3 Data Package Addendum
Kingcome Licensee-Agency Group A-23
Area (ha) Analysis Identity and EBM Landscape Unit-Site Series Surrogate Name
Analysis FCC (% > Age) Productive THLB
367 Huaskin-CWHvh1-AU13 0 > 180 545.3 263.2 368 Huaskin-CWHvm1-AU13 0 > 180 329.2 69.4 369 Huaskin-CWHvm2-AU13 0 > 180 6.7 0.6 370 Kakweiken-CWHvm1-AU12 12 > 180 2.5 0 371 Kakweiken-MHmm1-AU5 65 > 180 1.4 0 372 Kakweiken-CWHvm1-AU4 25 > 180 7.1 6.5 373 Kakweiken-CWHvm1-AU5 28 > 180 640.9 262.4 374 Kakweiken-CWHvm1-AU6 28 > 180 1477.9 493.7 375 Kakweiken-CWHvm1-AU7 25 > 180 1549.2 849.2 376 Kakweiken-CWHvm1-AU8 25 > 180 2528.8 680.8 377 Kakweiken-CWHvm1-AU9 25 > 180 481 15.8 378 Kakweiken-CWHvm1-AU10 25 > 180 242.8 9.8 379 Kakweiken-CWHvm1-AU11 25 > 180 19.6 0 380 Kakweiken-CWHvm2-AU5 28 > 180 102 18.5 381 Kakweiken-CWHvm2-AU6 28 > 180 2253.7 516.9 382 Kakweiken-CWHvm2-AU7 25 > 180 128.9 59.4 383 Kakweiken-CWHvm2-AU8 25 > 180 2412.8 329.1 384 Kakweiken-CWHvm2-AU9 25 > 180 2554 2.2 385 Kakweiken-MHmm1-AU6 28 > 180 484.3 46 386 Kakweiken-MHmm1-AU8 25 > 180 237.4 11.4 387 Kakweiken-MHmm1-AU9 25 > 180 1799.4 2.1 391 Kakweiken-CWHvm1-AU13 0 > 180 761.6 177.8 392 Kakweiken-CWHvm2-AU13 0 > 180 26.8 0 393 Knight_East-CWHdm-AU2 17 > 180 11.3 9.2 394 Knight_East-CWHdm-AU3 18 > 180 18.3 1 395 Knight_East-CWHdm-AU8 23 > 180 20.5 11.7 396 Knight_East-CWHvm1-AU3 21 > 180 215 1.3 397 Knight_East-CWHvm1-AU12 12 > 180 23.6 0 398 Knight_East-CWHvm2-AU4 59 > 180 30 19.4 399 Knight_East-MHmm1-AU5 65 > 180 7.8 2.5 400 Knight_East-CWHvm2-AU2 49 > 180 3.8 0 401 Knight_East-CWHvm2-AU3 49 > 180 84.1 7.1 402 Knight_East-MHmm1-AU3 49 > 180 14.5 0 403 Knight_East-CWHdm-AU7 23 > 180 36.3 20.8 404 Knight_East-CWHvm1-AU2 21 > 180 122.7 7.6 405 Knight_East-CWHvm1-AU4 25 > 180 207.7 119.9 406 Knight_East-CWHvm1-AU5 28 > 180 744.5 384.2 407 Knight_East-CWHvm1-AU6 28 > 180 3200.7 1496.2 408 Knight_East-CWHvm1-AU7 25 > 180 1727.1 999.6 409 Knight_East-CWHvm1-AU8 25 > 180 3490.8 1725.7 410 Knight_East-CWHvm1-AU9 25 > 180 496.3 63.2 411 Knight_East-CWHvm2-AU5 28 > 180 110.4 40 412 Knight_East-CWHvm2-AU6 28 > 180 1893.5 378.8 413 Knight_East-CWHvm2-AU7 25 > 180 141 53.7 414 Knight_East-CWHvm2-AU8 25 > 180 2742.1 647.1 415 Knight_East-CWHvm2-AU9 25 > 180 1939.5 15.6 416 Knight_East-MHmm1-AU6 28 > 180 748.2 25.4
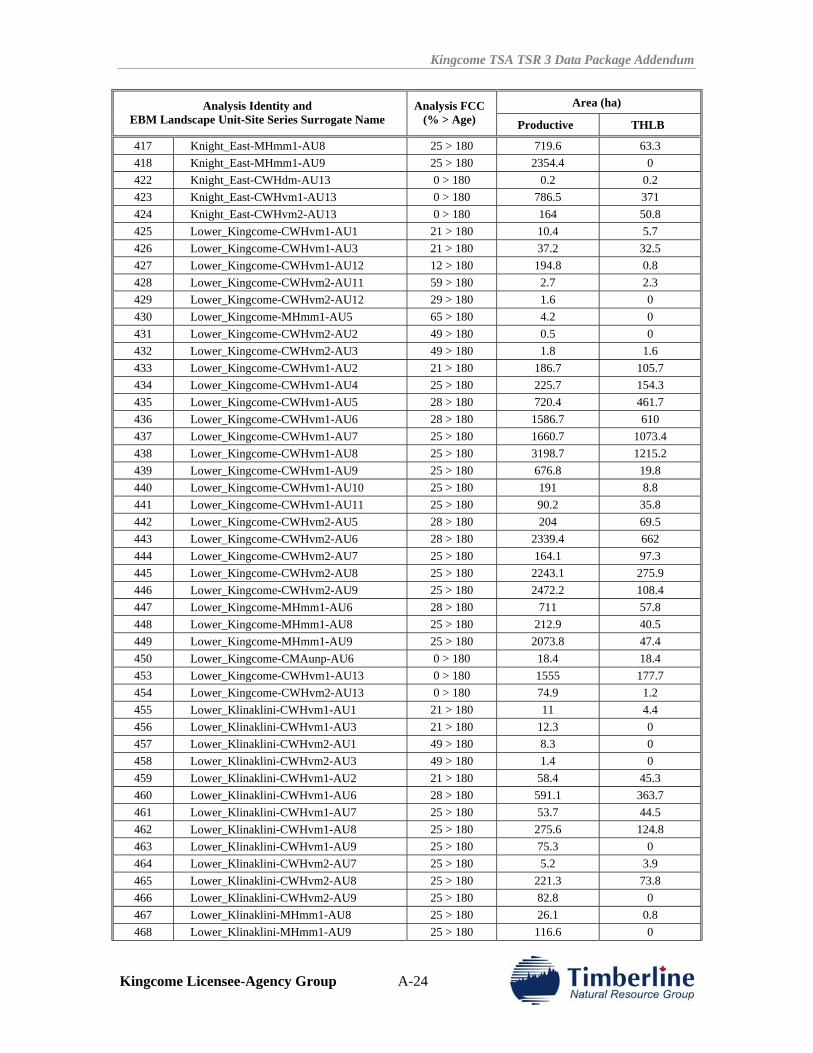
Kingcome TSA TSR 3 Data Package Addendum
Kingcome Licensee-Agency Group A-24
Area (ha) Analysis Identity and EBM Landscape Unit-Site Series Surrogate Name
Analysis FCC (% > Age) Productive THLB
417 Knight_East-MHmm1-AU8 25 > 180 719.6 63.3 418 Knight_East-MHmm1-AU9 25 > 180 2354.4 0 422 Knight_East-CWHdm-AU13 0 > 180 0.2 0.2 423 Knight_East-CWHvm1-AU13 0 > 180 786.5 371 424 Knight_East-CWHvm2-AU13 0 > 180 164 50.8 425 Lower_Kingcome-CWHvm1-AU1 21 > 180 10.4 5.7 426 Lower_Kingcome-CWHvm1-AU3 21 > 180 37.2 32.5 427 Lower_Kingcome-CWHvm1-AU12 12 > 180 194.8 0.8 428 Lower_Kingcome-CWHvm2-AU11 59 > 180 2.7 2.3 429 Lower_Kingcome-CWHvm2-AU12 29 > 180 1.6 0 430 Lower_Kingcome-MHmm1-AU5 65 > 180 4.2 0 431 Lower_Kingcome-CWHvm2-AU2 49 > 180 0.5 0 432 Lower_Kingcome-CWHvm2-AU3 49 > 180 1.8 1.6 433 Lower_Kingcome-CWHvm1-AU2 21 > 180 186.7 105.7 434 Lower_Kingcome-CWHvm1-AU4 25 > 180 225.7 154.3 435 Lower_Kingcome-CWHvm1-AU5 28 > 180 720.4 461.7 436 Lower_Kingcome-CWHvm1-AU6 28 > 180 1586.7 610 437 Lower_Kingcome-CWHvm1-AU7 25 > 180 1660.7 1073.4 438 Lower_Kingcome-CWHvm1-AU8 25 > 180 3198.7 1215.2 439 Lower_Kingcome-CWHvm1-AU9 25 > 180 676.8 19.8 440 Lower_Kingcome-CWHvm1-AU10 25 > 180 191 8.8 441 Lower_Kingcome-CWHvm1-AU11 25 > 180 90.2 35.8 442 Lower_Kingcome-CWHvm2-AU5 28 > 180 204 69.5 443 Lower_Kingcome-CWHvm2-AU6 28 > 180 2339.4 662 444 Lower_Kingcome-CWHvm2-AU7 25 > 180 164.1 97.3 445 Lower_Kingcome-CWHvm2-AU8 25 > 180 2243.1 275.9 446 Lower_Kingcome-CWHvm2-AU9 25 > 180 2472.2 108.4 447 Lower_Kingcome-MHmm1-AU6 28 > 180 711 57.8 448 Lower_Kingcome-MHmm1-AU8 25 > 180 212.9 40.5 449 Lower_Kingcome-MHmm1-AU9 25 > 180 2073.8 47.4 450 Lower_Kingcome-CMAunp-AU6 0 > 180 18.4 18.4 453 Lower_Kingcome-CWHvm1-AU13 0 > 180 1555 177.7 454 Lower_Kingcome-CWHvm2-AU13 0 > 180 74.9 1.2 455 Lower_Klinaklini-CWHvm1-AU1 21 > 180 11 4.4 456 Lower_Klinaklini-CWHvm1-AU3 21 > 180 12.3 0 457 Lower_Klinaklini-CWHvm2-AU1 49 > 180 8.3 0 458 Lower_Klinaklini-CWHvm2-AU3 49 > 180 1.4 0 459 Lower_Klinaklini-CWHvm1-AU2 21 > 180 58.4 45.3 460 Lower_Klinaklini-CWHvm1-AU6 28 > 180 591.1 363.7 461 Lower_Klinaklini-CWHvm1-AU7 25 > 180 53.7 44.5 462 Lower_Klinaklini-CWHvm1-AU8 25 > 180 275.6 124.8 463 Lower_Klinaklini-CWHvm1-AU9 25 > 180 75.3 0 464 Lower_Klinaklini-CWHvm2-AU7 25 > 180 5.2 3.9 465 Lower_Klinaklini-CWHvm2-AU8 25 > 180 221.3 73.8 466 Lower_Klinaklini-CWHvm2-AU9 25 > 180 82.8 0 467 Lower_Klinaklini-MHmm1-AU8 25 > 180 26.1 0.8 468 Lower_Klinaklini-MHmm1-AU9 25 > 180 116.6 0
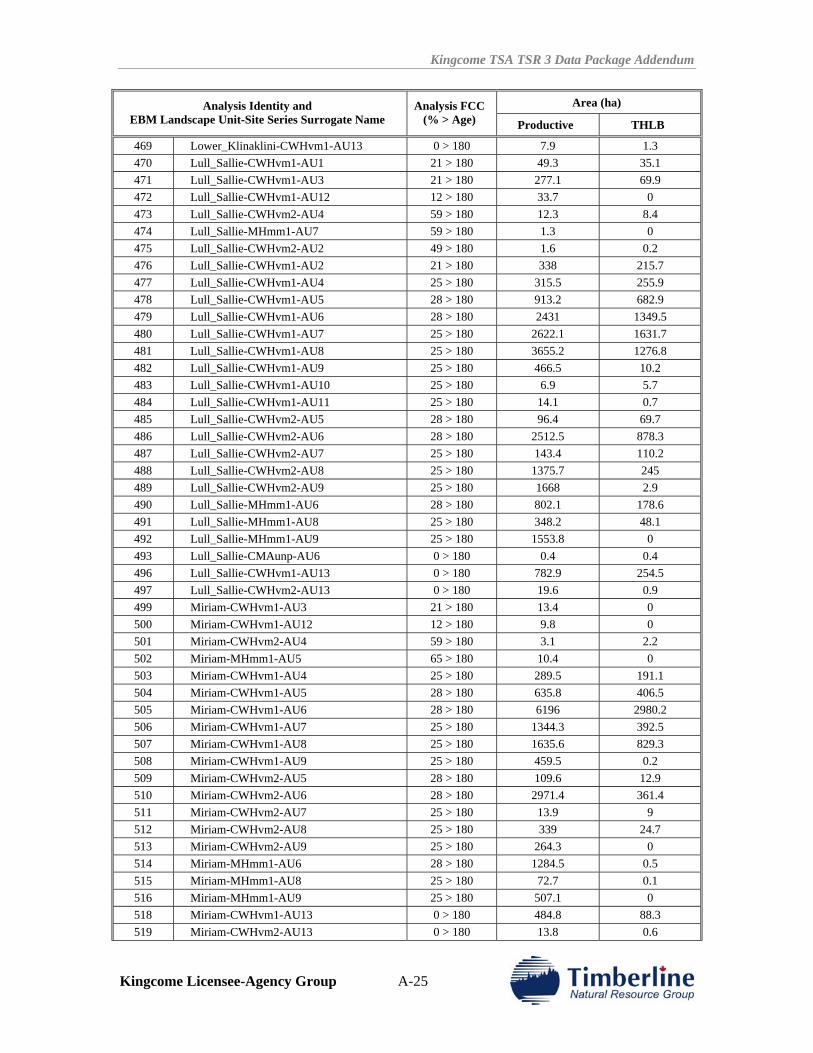
Kingcome TSA TSR 3 Data Package Addendum
Kingcome Licensee-Agency Group A-25
Area (ha) Analysis Identity and EBM Landscape Unit-Site Series Surrogate Name
Analysis FCC (% > Age) Productive THLB
469 Lower_Klinaklini-CWHvm1-AU13 0 > 180 7.9 1.3 470 Lull_Sallie-CWHvm1-AU1 21 > 180 49.3 35.1 471 Lull_Sallie-CWHvm1-AU3 21 > 180 277.1 69.9 472 Lull_Sallie-CWHvm1-AU12 12 > 180 33.7 0 473 Lull_Sallie-CWHvm2-AU4 59 > 180 12.3 8.4 474 Lull_Sallie-MHmm1-AU7 59 > 180 1.3 0 475 Lull_Sallie-CWHvm2-AU2 49 > 180 1.6 0.2 476 Lull_Sallie-CWHvm1-AU2 21 > 180 338 215.7 477 Lull_Sallie-CWHvm1-AU4 25 > 180 315.5 255.9 478 Lull_Sallie-CWHvm1-AU5 28 > 180 913.2 682.9 479 Lull_Sallie-CWHvm1-AU6 28 > 180 2431 1349.5 480 Lull_Sallie-CWHvm1-AU7 25 > 180 2622.1 1631.7 481 Lull_Sallie-CWHvm1-AU8 25 > 180 3655.2 1276.8 482 Lull_Sallie-CWHvm1-AU9 25 > 180 466.5 10.2 483 Lull_Sallie-CWHvm1-AU10 25 > 180 6.9 5.7 484 Lull_Sallie-CWHvm1-AU11 25 > 180 14.1 0.7 485 Lull_Sallie-CWHvm2-AU5 28 > 180 96.4 69.7 486 Lull_Sallie-CWHvm2-AU6 28 > 180 2512.5 878.3 487 Lull_Sallie-CWHvm2-AU7 25 > 180 143.4 110.2 488 Lull_Sallie-CWHvm2-AU8 25 > 180 1375.7 245 489 Lull_Sallie-CWHvm2-AU9 25 > 180 1668 2.9 490 Lull_Sallie-MHmm1-AU6 28 > 180 802.1 178.6 491 Lull_Sallie-MHmm1-AU8 25 > 180 348.2 48.1 492 Lull_Sallie-MHmm1-AU9 25 > 180 1553.8 0 493 Lull_Sallie-CMAunp-AU6 0 > 180 0.4 0.4 496 Lull_Sallie-CWHvm1-AU13 0 > 180 782.9 254.5 497 Lull_Sallie-CWHvm2-AU13 0 > 180 19.6 0.9 499 Miriam-CWHvm1-AU3 21 > 180 13.4 0 500 Miriam-CWHvm1-AU12 12 > 180 9.8 0 501 Miriam-CWHvm2-AU4 59 > 180 3.1 2.2 502 Miriam-MHmm1-AU5 65 > 180 10.4 0 503 Miriam-CWHvm1-AU4 25 > 180 289.5 191.1 504 Miriam-CWHvm1-AU5 28 > 180 635.8 406.5 505 Miriam-CWHvm1-AU6 28 > 180 6196 2980.2 506 Miriam-CWHvm1-AU7 25 > 180 1344.3 392.5 507 Miriam-CWHvm1-AU8 25 > 180 1635.6 829.3 508 Miriam-CWHvm1-AU9 25 > 180 459.5 0.2 509 Miriam-CWHvm2-AU5 28 > 180 109.6 12.9 510 Miriam-CWHvm2-AU6 28 > 180 2971.4 361.4 511 Miriam-CWHvm2-AU7 25 > 180 13.9 9 512 Miriam-CWHvm2-AU8 25 > 180 339 24.7 513 Miriam-CWHvm2-AU9 25 > 180 264.3 0 514 Miriam-MHmm1-AU6 28 > 180 1284.5 0.5 515 Miriam-MHmm1-AU8 25 > 180 72.7 0.1 516 Miriam-MHmm1-AU9 25 > 180 507.1 0 518 Miriam-CWHvm1-AU13 0 > 180 484.8 88.3 519 Miriam-CWHvm2-AU13 0 > 180 13.8 0.6
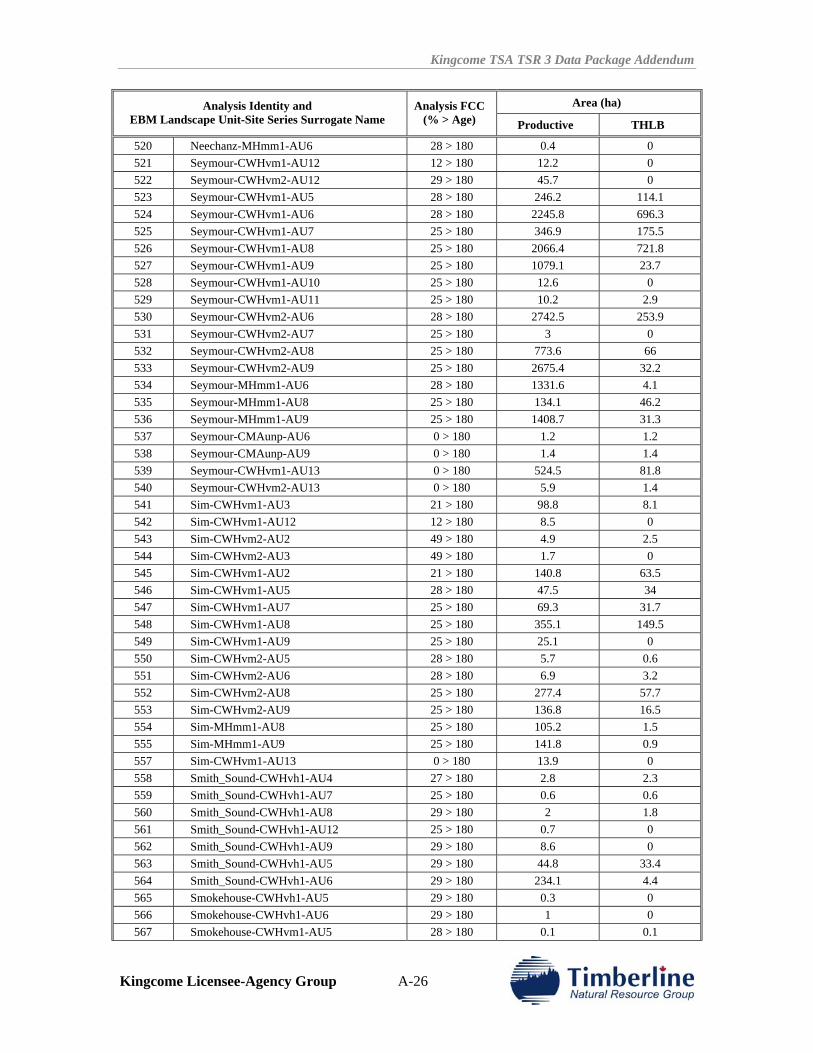
Kingcome TSA TSR 3 Data Package Addendum
Kingcome Licensee-Agency Group A-26
Area (ha) Analysis Identity and EBM Landscape Unit-Site Series Surrogate Name
Analysis FCC (% > Age) Productive THLB
520 Neechanz-MHmm1-AU6 28 > 180 0.4 0 521 Seymour-CWHvm1-AU12 12 > 180 12.2 0 522 Seymour-CWHvm2-AU12 29 > 180 45.7 0 523 Seymour-CWHvm1-AU5 28 > 180 246.2 114.1 524 Seymour-CWHvm1-AU6 28 > 180 2245.8 696.3 525 Seymour-CWHvm1-AU7 25 > 180 346.9 175.5 526 Seymour-CWHvm1-AU8 25 > 180 2066.4 721.8 527 Seymour-CWHvm1-AU9 25 > 180 1079.1 23.7 528 Seymour-CWHvm1-AU10 25 > 180 12.6 0 529 Seymour-CWHvm1-AU11 25 > 180 10.2 2.9 530 Seymour-CWHvm2-AU6 28 > 180 2742.5 253.9 531 Seymour-CWHvm2-AU7 25 > 180 3 0 532 Seymour-CWHvm2-AU8 25 > 180 773.6 66 533 Seymour-CWHvm2-AU9 25 > 180 2675.4 32.2 534 Seymour-MHmm1-AU6 28 > 180 1331.6 4.1 535 Seymour-MHmm1-AU8 25 > 180 134.1 46.2 536 Seymour-MHmm1-AU9 25 > 180 1408.7 31.3 537 Seymour-CMAunp-AU6 0 > 180 1.2 1.2 538 Seymour-CMAunp-AU9 0 > 180 1.4 1.4 539 Seymour-CWHvm1-AU13 0 > 180 524.5 81.8 540 Seymour-CWHvm2-AU13 0 > 180 5.9 1.4 541 Sim-CWHvm1-AU3 21 > 180 98.8 8.1 542 Sim-CWHvm1-AU12 12 > 180 8.5 0 543 Sim-CWHvm2-AU2 49 > 180 4.9 2.5 544 Sim-CWHvm2-AU3 49 > 180 1.7 0 545 Sim-CWHvm1-AU2 21 > 180 140.8 63.5 546 Sim-CWHvm1-AU5 28 > 180 47.5 34 547 Sim-CWHvm1-AU7 25 > 180 69.3 31.7 548 Sim-CWHvm1-AU8 25 > 180 355.1 149.5 549 Sim-CWHvm1-AU9 25 > 180 25.1 0 550 Sim-CWHvm2-AU5 28 > 180 5.7 0.6 551 Sim-CWHvm2-AU6 28 > 180 6.9 3.2 552 Sim-CWHvm2-AU8 25 > 180 277.4 57.7 553 Sim-CWHvm2-AU9 25 > 180 136.8 16.5 554 Sim-MHmm1-AU8 25 > 180 105.2 1.5 555 Sim-MHmm1-AU9 25 > 180 141.8 0.9 557 Sim-CWHvm1-AU13 0 > 180 13.9 0 558 Smith_Sound-CWHvh1-AU4 27 > 180 2.8 2.3 559 Smith_Sound-CWHvh1-AU7 25 > 180 0.6 0.6 560 Smith_Sound-CWHvh1-AU8 29 > 180 2 1.8 561 Smith_Sound-CWHvh1-AU12 25 > 180 0.7 0 562 Smith_Sound-CWHvh1-AU9 29 > 180 8.6 0 563 Smith_Sound-CWHvh1-AU5 29 > 180 44.8 33.4 564 Smith_Sound-CWHvh1-AU6 29 > 180 234.1 4.4 565 Smokehouse-CWHvh1-AU5 29 > 180 0.3 0 566 Smokehouse-CWHvh1-AU6 29 > 180 1 0 567 Smokehouse-CWHvm1-AU5 28 > 180 0.1 0.1
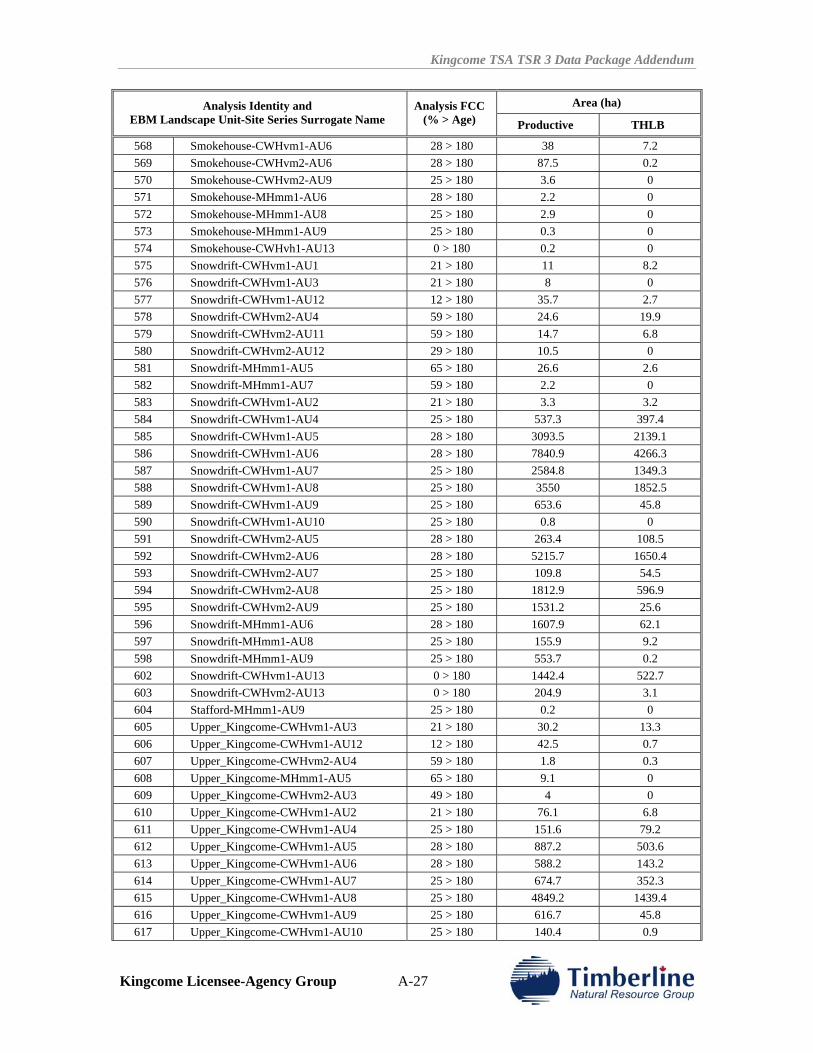
Kingcome TSA TSR 3 Data Package Addendum
Kingcome Licensee-Agency Group A-27
Area (ha) Analysis Identity and EBM Landscape Unit-Site Series Surrogate Name
Analysis FCC (% > Age) Productive THLB
568 Smokehouse-CWHvm1-AU6 28 > 180 38 7.2 569 Smokehouse-CWHvm2-AU6 28 > 180 87.5 0.2 570 Smokehouse-CWHvm2-AU9 25 > 180 3.6 0 571 Smokehouse-MHmm1-AU6 28 > 180 2.2 0 572 Smokehouse-MHmm1-AU8 25 > 180 2.9 0 573 Smokehouse-MHmm1-AU9 25 > 180 0.3 0 574 Smokehouse-CWHvh1-AU13 0 > 180 0.2 0 575 Snowdrift-CWHvm1-AU1 21 > 180 11 8.2 576 Snowdrift-CWHvm1-AU3 21 > 180 8 0 577 Snowdrift-CWHvm1-AU12 12 > 180 35.7 2.7 578 Snowdrift-CWHvm2-AU4 59 > 180 24.6 19.9 579 Snowdrift-CWHvm2-AU11 59 > 180 14.7 6.8 580 Snowdrift-CWHvm2-AU12 29 > 180 10.5 0 581 Snowdrift-MHmm1-AU5 65 > 180 26.6 2.6 582 Snowdrift-MHmm1-AU7 59 > 180 2.2 0 583 Snowdrift-CWHvm1-AU2 21 > 180 3.3 3.2 584 Snowdrift-CWHvm1-AU4 25 > 180 537.3 397.4 585 Snowdrift-CWHvm1-AU5 28 > 180 3093.5 2139.1 586 Snowdrift-CWHvm1-AU6 28 > 180 7840.9 4266.3 587 Snowdrift-CWHvm1-AU7 25 > 180 2584.8 1349.3 588 Snowdrift-CWHvm1-AU8 25 > 180 3550 1852.5 589 Snowdrift-CWHvm1-AU9 25 > 180 653.6 45.8 590 Snowdrift-CWHvm1-AU10 25 > 180 0.8 0 591 Snowdrift-CWHvm2-AU5 28 > 180 263.4 108.5 592 Snowdrift-CWHvm2-AU6 28 > 180 5215.7 1650.4 593 Snowdrift-CWHvm2-AU7 25 > 180 109.8 54.5 594 Snowdrift-CWHvm2-AU8 25 > 180 1812.9 596.9 595 Snowdrift-CWHvm2-AU9 25 > 180 1531.2 25.6 596 Snowdrift-MHmm1-AU6 28 > 180 1607.9 62.1 597 Snowdrift-MHmm1-AU8 25 > 180 155.9 9.2 598 Snowdrift-MHmm1-AU9 25 > 180 553.7 0.2 602 Snowdrift-CWHvm1-AU13 0 > 180 1442.4 522.7 603 Snowdrift-CWHvm2-AU13 0 > 180 204.9 3.1 604 Stafford-MHmm1-AU9 25 > 180 0.2 0 605 Upper_Kingcome-CWHvm1-AU3 21 > 180 30.2 13.3 606 Upper_Kingcome-CWHvm1-AU12 12 > 180 42.5 0.7 607 Upper_Kingcome-CWHvm2-AU4 59 > 180 1.8 0.3 608 Upper_Kingcome-MHmm1-AU5 65 > 180 9.1 0 609 Upper_Kingcome-CWHvm2-AU3 49 > 180 4 0 610 Upper_Kingcome-CWHvm1-AU2 21 > 180 76.1 6.8 611 Upper_Kingcome-CWHvm1-AU4 25 > 180 151.6 79.2 612 Upper_Kingcome-CWHvm1-AU5 28 > 180 887.2 503.6 613 Upper_Kingcome-CWHvm1-AU6 28 > 180 588.2 143.2 614 Upper_Kingcome-CWHvm1-AU7 25 > 180 674.7 352.3 615 Upper_Kingcome-CWHvm1-AU8 25 > 180 4849.2 1439.4 616 Upper_Kingcome-CWHvm1-AU9 25 > 180 616.7 45.8 617 Upper_Kingcome-CWHvm1-AU10 25 > 180 140.4 0.9
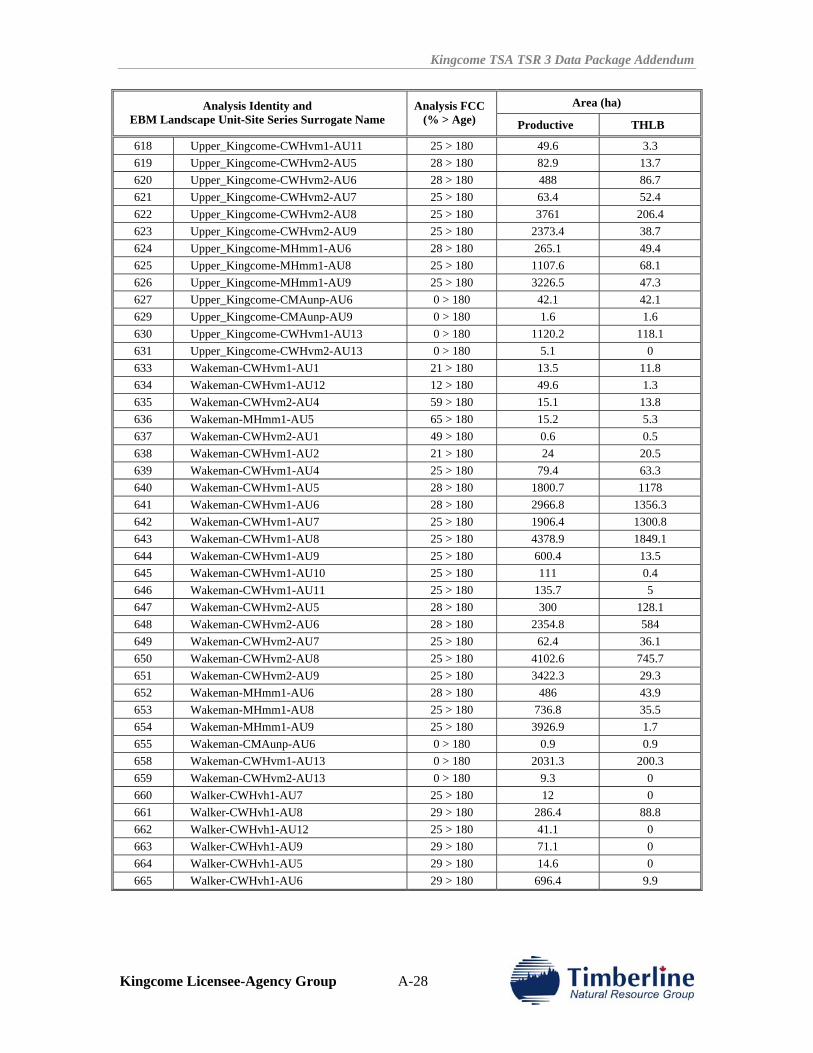
Kingcome TSA TSR 3 Data Package Addendum
Kingcome Licensee-Agency Group A-28
Area (ha) Analysis Identity and EBM Landscape Unit-Site Series Surrogate Name
Analysis FCC (% > Age) Productive THLB
618 Upper_Kingcome-CWHvm1-AU11 25 > 180 49.6 3.3 619 Upper_Kingcome-CWHvm2-AU5 28 > 180 82.9 13.7 620 Upper_Kingcome-CWHvm2-AU6 28 > 180 488 86.7 621 Upper_Kingcome-CWHvm2-AU7 25 > 180 63.4 52.4 622 Upper_Kingcome-CWHvm2-AU8 25 > 180 3761 206.4 623 Upper_Kingcome-CWHvm2-AU9 25 > 180 2373.4 38.7 624 Upper_Kingcome-MHmm1-AU6 28 > 180 265.1 49.4 625 Upper_Kingcome-MHmm1-AU8 25 > 180 1107.6 68.1 626 Upper_Kingcome-MHmm1-AU9 25 > 180 3226.5 47.3 627 Upper_Kingcome-CMAunp-AU6 0 > 180 42.1 42.1 629 Upper_Kingcome-CMAunp-AU9 0 > 180 1.6 1.6 630 Upper_Kingcome-CWHvm1-AU13 0 > 180 1120.2 118.1 631 Upper_Kingcome-CWHvm2-AU13 0 > 180 5.1 0 633 Wakeman-CWHvm1-AU1 21 > 180 13.5 11.8 634 Wakeman-CWHvm1-AU12 12 > 180 49.6 1.3 635 Wakeman-CWHvm2-AU4 59 > 180 15.1 13.8 636 Wakeman-MHmm1-AU5 65 > 180 15.2 5.3 637 Wakeman-CWHvm2-AU1 49 > 180 0.6 0.5 638 Wakeman-CWHvm1-AU2 21 > 180 24 20.5 639 Wakeman-CWHvm1-AU4 25 > 180 79.4 63.3 640 Wakeman-CWHvm1-AU5 28 > 180 1800.7 1178 641 Wakeman-CWHvm1-AU6 28 > 180 2966.8 1356.3 642 Wakeman-CWHvm1-AU7 25 > 180 1906.4 1300.8 643 Wakeman-CWHvm1-AU8 25 > 180 4378.9 1849.1 644 Wakeman-CWHvm1-AU9 25 > 180 600.4 13.5 645 Wakeman-CWHvm1-AU10 25 > 180 111 0.4 646 Wakeman-CWHvm1-AU11 25 > 180 135.7 5 647 Wakeman-CWHvm2-AU5 28 > 180 300 128.1 648 Wakeman-CWHvm2-AU6 28 > 180 2354.8 584 649 Wakeman-CWHvm2-AU7 25 > 180 62.4 36.1 650 Wakeman-CWHvm2-AU8 25 > 180 4102.6 745.7 651 Wakeman-CWHvm2-AU9 25 > 180 3422.3 29.3 652 Wakeman-MHmm1-AU6 28 > 180 486 43.9 653 Wakeman-MHmm1-AU8 25 > 180 736.8 35.5 654 Wakeman-MHmm1-AU9 25 > 180 3926.9 1.7 655 Wakeman-CMAunp-AU6 0 > 180 0.9 0.9 658 Wakeman-CWHvm1-AU13 0 > 180 2031.3 200.3 659 Wakeman-CWHvm2-AU13 0 > 180 9.3 0 660 Walker-CWHvh1-AU7 25 > 180 12 0 661 Walker-CWHvh1-AU8 29 > 180 286.4 88.8 662 Walker-CWHvh1-AU12 25 > 180 41.1 0 663 Walker-CWHvh1-AU9 29 > 180 71.1 0 664 Walker-CWHvh1-AU5 29 > 180 14.6 0 665 Walker-CWHvh1-AU6 29 > 180 696.4 9.9
Kingcome TSA TSR 3 Analysis Report
Kingcome Licensee-Agency Group
APPENDIX V KINGCOME TIMBER SUPPLY AREA TSR3
DATA PACKAGE

Kingcome TSA TSR 3 Analysis Report
Kingcome Licensee-Agency Group
KINGCOME TIMBER SUPPLY AREA TSR 3 DATA PACKAGE
Prepared for:
Kingcome TSA Licensee-Agency Group
Prepared by:
Timberline Natural Resource Group Ltd.
Victoria, B.C.
Contact: Erik Wang, RPF
Senior Resource Analyst
Project: 4061921
September 2008
Kingcome TSA TSR 3 Data Package
Kingcome Licensee-Agency Group ii
ACKNOWLEDGEMENTS
We would like to acknowledge the support and contributions made by the following organizations:
Interfor Gerry Sommers
Mike Landers
Richmond Plywood Tom Cole
Mill & Timber Products Ltd. Ione Brown
Kruger Forest Products Phil O’Connor
Western Forest Products Peter Kofoed
Northwest Hardwoods Neil Hughes
B.C. Timber Sales Deidre Haight
Ministry of Forests – Coastal Forest Region Jim Brown
Ministry of Forests – Port McNeill Forest District Phil Spencer
First Nations Gary Ardron
Ted Stevens
www.timberline.ca
June 9, 2008
File number 4061921
Kingcome TSA Licensee-Agency Group c/o Forsite #213 – 1720 14th Ave. Campbell River BC V9W 8B9 Attention: Ian Robertson, RPF Program Coordinator Reference: Kingcome TSA TSR 3 Data Package Attached please find the Data Package report as part of the Kingcome TSA TSR 3 process. This report outlines the inputs and assumptions that will be used in the timber supply analysis for the TSA. Revisions have been made based on feedback from members of the Licensee Group and MoFR. Thank you for your input and assistance during the preparation of the Data Package. Yours truly, TIMBERLINE NATURAL RESOURCE GROUP LTD.
Erik Wang, RPF Senior Resource Analyst
Main: 250.480.1101 Fax: 250.480.1412
Suite 601
1207 Douglas St Victoria BC
Canada V8W 2E7

Kingcome TSA TSR 3 Data Package
Kingcome Licensee-Agency Group
Kingcome TSA TSR 3 Data Package
Kingcome Licensee-Agency Group v
EXECUTIVE SUMMARY
A timber supply review process has been initiated for the Kingcome Timber Supply Area (TSA). These reviews are conducted every five years and assist the B.C. Forest Service’s Chief Forester in re-determining allowable annual cuts (AACs). For the Kingcome Timber Supply Area the Chief Forester will determine a new AAC by August 2008. Timberline Natural Resource Group Ltd., on behalf of the Kingcome TSA Licensee-Agency Group, is preparing timber supply information for the analysis.
The allowable annual cut (AAC) for the Kingcome TSA was set in 1996 at 1,399,000 m³, which equated to a 22 percent reduction from the previous AAC. In July 2002, the Chief Forester temporarily reduced the AAC under section 173 in Part 13 of the Forest Act, to 1,355,000 m³. This reduction was done to account for the Central Coast Designated Area. On October 1, 2002, the Chief Forester determined the AAC under section 8 of the Forest Act to be 1,284,000 m³, a reduction of 8 percent from the previous AAC. This included a 20,340 m³ partition for deciduous-leading stands. The July 2002 temporary reduction of 44 000 m³, also applied to the October 2002 determination and remained in place until June 2004. In September 2006, the Chief Forester made a new determination under Section 173 of the Forest Act that reduced the AAC by 52,000 m3 to 1,232,000 m3. This reduction did not affect the deciduous partition and remains in effect until the area referred to as the Central Coast Designated Area No. 2 ceases to be a designated area in May 23, 2010. It is expected that either the area will be re-established as a Designated Area or it will have achieved full provincial park status by that date.
On July 27, 2007, the Ministry of Agriculture and Lands issued a legally binding Ministerial Order (MO) called the South Central Coast Order. The legal order requires forest licensees to implement Ecosystem Based Management (EBM) in the southern portion of the Central Coast Land and Resource Management Plan (CCLRMP) area.
This Kingcome TSA Data Package is provided to the public and First Nations for review prior to initiation of the analysis to support allowable cut determination for Timber Supply Review (TSR) 3. Although it is a technical document for a technical audience, every effort has been made to ensure that it is self-explanatory.
The Data Package allows the reader to consider the inputs and assumptions that will be used in the timber supply analysis. These include:
• Documentation of inventory data and sources; • Classification of the land base according to each hectare’s contribution to management
(harvest, resource management for wildlife, etc).; • Land productivity estimates and prediction of stand growth and timber yield; • Silviculture and harvesting regimes; • Action taken to model multi-resource requirements; • Modelling structures to address the Central Coast Land and Resource Management Plan
(CCLRMP); and • Timber supply scenarios and sensitivities to be investigated.
Kingcome TSA TSR 3 Data Package
Kingcome Licensee-Agency Group vi
The TSR process is designed to capture “current practice” on a management unit. However, during the period in which EBM parameters are being established and implemented, current practice is in fact in a stage of transition. To capture this dynamic, two scenarios will be explored.
• Pre-EBM - This scenario will capture current Forest and Range Practices Act (FRPA) management practices and assumptions.
• EBM Ministerial Order – This will capture the objectives as defined in the final South Central Coast Order, which has now been legally established.
The public and First Nations review processes have been completed, and this document has been finalized. It will be published as an appendix to the Timber Supply Analysis Report. There will be another public review opportunity at that time.
Kingcome TSA TSR 3 Data Package
Kingcome Licensee-Agency Group vii
TABLE OF CONTENTS
1.0 INTRODUCTION ............................................................................................................. 1 1.1 PURPOSE .............................................................................................................................. 1 1.2 BACKGROUND ..................................................................................................................... 2 1.3 PROCESSES, ROLES AND RESPONSIBILITIES ........................................................................ 2 1.4 TIMBER SUPPLY REVIEW..................................................................................................... 3 1.5 FOREST AND RANGE PRACTICES ACT ................................................................................. 4 1.6 CENTRAL COAST LAND AND RESOURCE MANAGEMENT PLAN PROCESS........................... 4 1.7 TIMBER SUPPLY SCENARIOS ............................................................................................... 4 2.0 INVENTORY AND GENERATE DATA ....................................................................... 5 2.1 DATA SOURCES ................................................................................................................... 5 2.2 CURRENT FOREST COVER INVENTORY ............................................................................... 6 2.3 FOREST COVER INVENTORY – STATISTICAL ADJUSTMENT................................................. 7 3.0 TIMBER SUPPLY ANALYSIS FORECASTS .............................................................. 9 3.1 PRE-EBM............................................................................................................................. 9 3.2 EBM .................................................................................................................................. 10 4.0 FOREST ESTATE MODEL .......................................................................................... 12 4.1 MODEL DESCRIPTION ........................................................................................................ 12 5.0 LAND BASE DESCRIPTION........................................................................................ 13 5.1 PRE-EBM THLB DETERMINATION ................................................................................... 15
5.1.1 Exclusions from the Total Crown Forest............................................................... 15 5.1.2 Non-forest .............................................................................................................. 15 5.1.3 Roads, Trails and Landings................................................................................... 16 5.1.4 Non-productive ...................................................................................................... 17 5.1.5 Protected Areas ..................................................................................................... 18 5.1.6 G2G Biodiversity and Protected............................................................................ 18 5.1.7 Economically Inoperable....................................................................................... 19 5.1.8 Low Growing Potential ......................................................................................... 20 5.1.9 Non-merchantable ................................................................................................. 22 5.1.10 Deciduous Species ................................................................................................. 22 5.1.11 Environmentally Sensitive Areas ........................................................................... 23 5.1.12 Unstable Terrain ................................................................................................... 24 5.1.13 Riparian Reserves and Management Zones .......................................................... 25 5.1.14 Identified Wildlife Habitat ..................................................................................... 27 5.1.15 Old Growth Management Areas............................................................................ 27 5.1.16 Archaeological Sites.............................................................................................. 28 5.1.17 Karst Features ....................................................................................................... 28 5.1.18 Wildlife Tree Patches ............................................................................................ 29 5.1.19 Timber Licences Reversions .................................................................................. 29
5.2 EBM THLB DETERMINATION........................................................................................... 30 5.2.1 First Nations Objectives 3-5.................................................................................. 30 5.2.2 Objective 9. High value fish habitat ...................................................................... 31 5.2.3 Objective 10. Aquatic habitat that is not high value fish habitat .......................... 32
Kingcome TSA TSR 3 Data Package
Kingcome Licensee-Agency Group viii
5.2.4 Objective 11. Forested swamps ............................................................................. 33 5.2.5 Objective 13. Active fluvial units........................................................................... 34 5.2.6 Objective 15. Red-listed and blue-listed plant communities ................................. 34 5.2.7 Objective 17. Sensitive grizzly bear habitat .......................................................... 35
6.0 INVENTORY AGGREGATION................................................................................... 36 6.1 PRE-EBM MANAGEMENT ZONES...................................................................................... 36 6.2 LANDSCAPE UNITS ............................................................................................................ 36
6.2.1 Vancouver Island Land Use Planning Zones ........................................................ 40 6.2.2 Visually Sensitive Areas ........................................................................................ 40 6.2.3 Community Watersheds ......................................................................................... 41 6.2.4 Marbled Murrelet Nesting Habitat........................................................................ 41
6.3 EBM MANAGEMENT ZONES.............................................................................................. 42 6.3.1 Objective 8. Important fisheries watersheds ......................................................... 42 6.3.2 Objective 12. Upland streams ............................................................................... 42 6.3.3 Objective 14. Landscape-level biodiversity........................................................... 43
6.4 ANALYSIS UNIT DEFINITIONS............................................................................................ 44 6.5 AGE CLASS DISTRIBUTIONS .............................................................................................. 51 7.0 GROWTH AND YIELD................................................................................................. 52 7.1 INVENTORY........................................................................................................................ 52 7.2 NATURAL STAND YIELD TABLES. ..................................................................................... 52 7.3 MANAGED STAND YIELD TABLES..................................................................................... 52 7.4 SITE INDEX ........................................................................................................................ 53 7.5 UTILIZATION LEVELS ........................................................................................................ 57 7.6 DECAY, WASTE AND BREAKAGE FOR NATURAL UNMANAGED STANDS.......................... 57 7.7 OPERATIONAL ADJUSTMENT FACTORS ............................................................................. 57 8.0 SILVICULTURE............................................................................................................. 59 8.1 REGENERATION DELAY..................................................................................................... 59 8.2 CURRENT AND BACKLOG NOT SATISFACTORILY RESTOCKED AREAS ............................. 59 8.3 GENETIC GAIN ................................................................................................................... 59 8.4 PRE-EBM SILVICULTURE .................................................................................................. 60
8.4.1 Silviculture Management Regimes ........................................................................ 60 8.4.2 Existing Natural Stands – Pre-EBM...................................................................... 60 8.4.3 Existing Managed Stands – Pre-EBM................................................................... 61 8.4.4 Future Managed Stands – Pre-EBM ..................................................................... 63
8.5 EBM SILVICULTURE.......................................................................................................... 68 8.5.1 EBM Silviculture Regimes ..................................................................................... 68 8.5.2 Existing Natural Stands - EBM ............................................................................. 70 8.5.3 Existing Managed Stands - EBM........................................................................... 71 8.5.4 Future Managed Stands - EBM............................................................................. 73
9.0 INTEGRATED RESOURCE MANAGEMENT.......................................................... 79 9.1 FOREST COVER OBJECTIVES – RATIONALE....................................................................... 79 9.2 PRE-EBM OBJECTIVES ...................................................................................................... 79
9.2.1 Cut-Block Adjacency , Maximum Disturbance and Minimum Retention .............. 79 9.2.2 Landscape Level Biodiversity................................................................................ 80 9.2.3 Stand Level Biodiversity ........................................................................................ 85 9.2.4 Community Watersheds ......................................................................................... 85
Kingcome TSA TSR 3 Data Package
Kingcome Licensee-Agency Group ix
9.3 EBM OBJECTIVES.............................................................................................................. 85 9.3.1 EBM Objective 8 – Important Fisheries Watersheds ............................................ 85 9.3.2 EBM Objective 12 – Upland Streams.................................................................... 86 9.3.3 EBM Objective 14 – Landscape Level Biodiversity .............................................. 86
10.0 GENERAL MODELLING CONSIDERATIONS........................................................ 89 10.1 MINIMUM HARVEST AGE .................................................................................................. 89 10.2 HARVEST SYSTEMS ........................................................................................................... 92 10.3 HARVEST FLOW OBJECTIVES ............................................................................................ 92 10.4 NON-RECOVERABLE LOSSES ............................................................................................. 92 10.5 INITIAL HARVEST LEVEL................................................................................................... 92 10.6 LONG RUN SUSTAINED YIELD........................................................................................... 93 10.7 HARVEST RULES................................................................................................................ 93 10.8 NATURAL DISTURBANCE MODELLING.............................................................................. 94 10.9 HARVEST REPORTING........................................................................................................ 95 10.10 EBM .............................................................................................................................. 95
10.10.1 Objective 6 – Monumental cedar....................................................................... 95 10.10.2 Objective 7 – Stand level retention of cedar...................................................... 95
11.0 SENSITIVITY ANALYSES ........................................................................................... 96
12.0 REFERENCES ................................................................................................................ 97
LIST OF TABLES
Table 1 – Data sources .................................................................................................................... 5 Table 2 – Inventory statistical adjustment results ........................................................................... 8 Table 3 – Timber harvesting land base (THLB) determination .................................................... 14 Table 4 – Land base reductions for land not administered by MoFR ........................................... 15 Table 5 – Land base reductions for non-forest .............................................................................. 16 Table 6 – Land base reductions for existing roads ........................................................................ 16 Table 7 – Land base reductions for future roads, trails and landings ............................................ 17 Table 8 – Land base reductions for non-productive ...................................................................... 18 Table 9 – Land base reductions for protected areas ...................................................................... 18 Table 10 – Land base reductions for Central Coast Designated Area No. 2 ................................. 19 Table 11 – Land base reductions for inoperable areas .................................................................. 20 Table 12 – Land base reductions for sites with low growing potential ......................................... 21 Table 13 – Land base reductions for non-merchantable forest types ............................................ 22 Table 14 – Supplementary recreation netdown sources ................................................................ 23 Table 15 – Land base reductions for ESAs ................................................................................... 24 Table 16 – Land base reductions for unstable terrain.................................................................... 24
Kingcome TSA TSR 3 Data Package
Kingcome Licensee-Agency Group x
Table 17 – Stream categories ........................................................................................................ 25 Table 18 – Land base reductions for streams ................................................................................ 26 Table 19 – Land base reductions for lakes and wetlands .............................................................. 26 Table 20 – Land base reductions for riparian management areas ................................................. 27 Table 21 – Land base reductions for wildlife habitat areas ........................................................... 27 Table 22 – Land base reductions for old growth management areas ............................................ 28 Table 23 – Land base reductions for archaeological sites ............................................................. 28 Table 24 – Land base reductions for Karst.................................................................................... 28 Table 25 – WTP allowances in existing LUPs .............................................................................. 29 Table 26 – Timber licence reversion schedule and new contributions to the THLB .................... 30 Table 27 – Land base reductions for EBM Objectives 3 - 5 ......................................................... 31 Table 28 – Land base reductions for EBM Objective 9 ................................................................ 32 Table 29 – Land base reductions for EBM Objective 10 .............................................................. 33 Table 30 – Land base reductions for EBM Objective 11 .............................................................. 34 Table 31 – Land base reductions for EBM Objective 15 .............................................................. 35 Table 32 – Land base reductions for EBM Objective 17 .............................................................. 35 Table 33 – Area by landscape unit and BEC................................................................................. 36 Table 34 – VILUP Enhanced and Special Management Zones .................................................... 40 Table 35 – Visually sensitive areas ............................................................................................... 41 Table 36 – Community watersheds ............................................................................................... 41 Table 37 – Marbled murrelet nesting habitat................................................................................. 42 Table 38 – Important fisheries watersheds area summary – Objective 8 ...................................... 42 Table 39 – Upland streams – Objective 12.................................................................................... 43 Table 40 – AU definitions for site series surrogate (SSS) definitions – Objective 12 .................. 44 Table 41 – Analysis unit definitions for existing and regenerated stands ..................................... 46 Table 42 – Area by age class......................................................................................................... 51 Table 43 – Coniferous volume by age class .................................................................................. 51 Table 44 – Site index values for present and future stands ........................................................... 54 Table 45 – Utilization levels.......................................................................................................... 57 Table 46 – Input attributes for existing natural stands .................................................................. 60 Table 47 – Silviculture regimes for existing managed stands ....................................................... 62 Table 48 – Silviculture regimes for future managed stands .......................................................... 64 Table 49 – EBM stand-level retention requirements..................................................................... 69 Table 50 – Input attributes for existing natural stands - EBM ...................................................... 70
Kingcome TSA TSR 3 Data Package
Kingcome Licensee-Agency Group xi
Table 51 – Input attributes for existing managed stands - EBM ................................................... 71 Table 52 – Silviculture regimes for future managed stands - EBM .............................................. 73 Table 53 – Forest cover requirements for disturbance and mature retention ................................ 80 Table 54 – Old growth seral constraint zones ............................................................................... 81 Table 55 – Landscape unit old seral forest cover requirements .................................................... 85 Table 56 – SSS old seral forest cover requirements - EBM.......................................................... 86 Table 57 – Minimum harvest ages ................................................................................................ 89 Table 58 – Initial harvest level ...................................................................................................... 92 Table 59 – LRSY values for natural and managed stands – Pre-EBM analysis............................ 93 Table 60 – Natural disturbance parameters for the non-THLB..................................................... 95 Table 61 – Sensitivity analysis issues ........................................................................................... 96
LIST OF APPENDICES
APPENDIX I – PRE-EBM YIELD TABLES APPENDIX II – EBM YIELD TABLES
Kingcome TSA TSR 3 Data Package
Kingcome Licensee-Agency Group xii
Kingcome TSA TSR 3 Data Package
Kingcome Licensee-Agency Group 1
1.0 INTRODUCTION
Timberline Natural Resource Group Ltd. (Timberline), on behalf of the Kingcome Timber Supply Area (TSA) Licensee-Agency Group (the Group) is preparing timber supply information for the Provincial timber supply review. The Group is composed of forest companies and British Columbia Timber Sales (BCTS) with some participation by First Nations and the Ministry of Forests and Range (MoFR). It was originally formed under the Defined Forest Area Management (DFAM) concept, developed by the MoFR as a policy framework to identify the obligations and opportunities for collaborative forest management within the province’s TSAs. While the DFAM concept has since been terminated by the Chief Forester, the Group continues to exist and will assume collective responsibility for timber supply analysis within the TSA.
Timber supply reviews are conducted every five years to assist the B.C. Forest Service’s Chief Forester in re-determining the allowable annual cut (AAC). For the Kingcome Timber Supply Area (TSA), the Chief Forester will determine a new AAC by August 2008.
Timberline will complete the steps leading up to, and including the delivery of, timber supply analyses as follows:
• Collecting data and preparation of a Data Package which summarizes the data assumptions—land base, growth and yield, forest management practices, statement of management strategies, and analysis methods—that will be used, and the critical issues that will be examined in the timber supply analysis;
• Completing the timber supply analysis and report; and • Providing the necessary information for public and First Nations reviews.
Upon acceptance by the British Columbia MoFR Forest Analysis and Inventory Branch, the assumptions and methodology provided in the Data Package will be used by the Group to prepare and submit a timber supply analysis to the MoFR. These results will be presented in a Timber Supply Analysis Report. First Nations and the public will have an opportunity to review and comment on the timber supply analysis report that has been accepted by the Chief Forester. Finally, the Chief Forester will consider the Timber Supply Analysis Report and other sources of information in order to make a new AAC determination. All results will be presented to the Chief Forester of British Columbia for the determination. This determination will be published in a report entitled ‘Kingcome Timber Supply Area – Rationale for AAC Determination’.
1.1 Purpose
The purpose of the Data Package is to provide information on the forest resource inventory and the practices within the timber supply area (TSA) that will be compiled for the purposes of conducting a timber supply analysis. It includes descriptions of information sources, assumptions, issues, and any relevant data processing or adjustments related to the land base, growth and yield, and management objectives and practices.
The following principles and standards will apply to the data sources and Data Package (MoFR, 2003a):
• The Data Package must describe, and where appropriate summarize, all data and information to be used in the timber supply analysis;
• The Data Package must contain descriptions of how current forest management, or reasonable extrapolations of current management will be modelled;
Kingcome TSA TSR 3 Data Package
Kingcome Licensee-Agency Group 2
• The most current and best available data must be used; • More detailed discussion should be provided in the package for data for which there is a
high degree of uncertainty; • The Data Package must contain a summary of plans for examining the potential impacts
of important uncertainties in information (i.e., planned sensitivity analysis); • The evidentiary basis for information used in analyses must be available on request, and
to the extent possible be included in the Data Package. Evidence could include the following:
• A description of data sources; • A description of sampling and data analysis methods or standards; • Digital or analog maps of the land base (e.g., forest cover, ownership, habitat
areas); • Results of any reviews or audits of source information or inventories; and • Any acceptances by appropriate professionals (e.g., terrain stability mapping).
• When collecting or analyzing data to include in the Data Package, existing standards should be followed, unless justification is provided for diverging from standards. Such justification should demonstrate that although standards were not followed, the information is the best available that could be obtained for the timber supply review;
• Where possible, the implications to the timber supply analysis (e.g., increased uncertainty) of diverging from the standards should be examined and reported; and
• The choice of a particular timber supply model is at the discretion of MoFR.
1.2 Background
The AAC for the Kingcome TSA was set in 1996 at 1,399,000 m³, which equated to a 22 percent reduction from the previous AAC. In July 2002 the Chief Forester temporarily reduced the AAC under Section 173 in Part 13 of the Forest Act, to 1,355,000 m³. This reduction was done to account for the Central Coast Designated Area. On October 1, 2002, the Chief Forester determined the AAC under section 8 of the Forest Act to be 1,284,000 m³, a reduction of 8 percent from the previous AAC. This included a 20,340 m³ partition for deciduous-leading stands. The July 2002 temporary reduction of 44,000 m³, also applied to the October 2002 determination and remained in place until June 2004. In September 2006, the Chief Forester made a new determination under Section 173 of the Forest Act that reduced the AAC by 52,000 m3 to 1,232,000 m3. This reduction did not affect the deciduous partition and remains in effect until the area referred to as the Central Coast Designated Area No. 2 ceases to be a designated area in May 23, 2010. It is expected that either the area will be re-established as a Designated Area or it will have achieved full provincial park status by that date.
On July 27, 2007, the Ministry of Agriculture and Lands issued a legally binding Ministerial Order (MO) called the South Central Coast Order (Ministry of Agriculture and Lands, 2007). This legally established order requires forest licensees to implement Ecosystem Based Management (EBM) in the southern portion of the Central Coast Land and Resource Management Plan (CCLRMP) area. This includes the mainland portion of the Kingcome TSA.
1.3 Processes, Roles and Responsibilities
This Kingcome TSA Data Package fits within a continuum of processes progressing towards the determination of the AAC for the Kingcome TSA. The Data Package outlines the steps to be
Kingcome TSA TSR 3 Data Package
Kingcome Licensee-Agency Group 3
followed from collection of existing information through to completion of the Timber Supply Analysis Reports.
MoFR staff plays a key role in reviewing and accepting both the Data Package and the subsequent timber supply analysis. They have provided technical support, facilitated resolution of issues, and validated technical information. The following summary shows the general roles and responsibilities associated with the timber supply analysis leading to an AAC determination.
Licensee-Agency Group Obligations Government Obligations
Collect and prepare a Data Package based on the best available information
Set standards for the Data Package Review and accept the Data Package
Complete an analysis for the Kingcome TSA Set standards for the analysis Review and accept the analysis
Provide information to the public and First Nations Consult with First Nations Determine the AAC for the Kingcome TSA
When completed, this document will be published as an appendix to the Timber Supply Analysis Report. For further information about the Data Package and timber supply analysis for the Kingcome TSA, please contact:
Copies of this document are available at http://www.timberline.ca/kingcome/.
1.4 Timber Supply Review
The preparation of the Data Package is the first step in the TSR process. The Data Package must go through two revision processes before it is accepted for use. MoFR must review and accept the first draft of the Data Package. It must also be made available for a public and First Nations review. Feedback from this review process must be documented along with records of how comments were incorporated into the revision of the Data Package. After the first revision, the Data Package is then submitted for a second review by the MoFR, public and First Nations. After this review and accompanying revision, the Data Package can be accepted for use in the TSR.
Once the Data Package has achieved approval for use, the timber supply analyses can be performed following all of the criteria outlined in the Data Package. The results of these analyses are documented in the analysis report. This report is then submitted to the Chief Forester for
Mail: Erik Wang, RPF Timberline Natural Resource Group Suite 601, 1207 Douglas Street Victoria, BC V8W 2E7
Fax: (250) 480-1412
Email: [email protected]
Kingcome TSA TSR 3 Data Package
Kingcome Licensee-Agency Group 4
consideration as part of the TSR process. The timber supply analysis report will also be made available for review and comment by First Nations and the public.
To facilitate the Data Package review process, a web site dedicated to the TSR 3 analyses was established at <http://www.timberline.ca/kingcome/index.html>. The draft Data Package and background documents will be placed on this site. This provides individuals with the opportunity to download these materials for review.
1.5 Forest and Range Practices Act
The Forest Practices Code (FPC) was introduced in 1995. The Forest and Range Practices) came into force January 31, 2004 and for the most part, replaced the FPC by December 31, 2005. This move from the FPC to the FRPA represents a transition from a primarily plan and process-based regime under FPC to a results-based regime under FRPA. Prior to December 31, 2005 there was a transition period where licensees worked under either a Forest Development Plan (as per FPC) or a Forest Stewardship Plan (as per FRPA).
Under FRPA, FPC guidelines will no longer be within the legal framework but will move to the non-legal realm. To meet the objectives set by government either through land use, regulation, or enabled by regulation, greater emphasis will be placed upon professional reliance in the preparation of operational plans to ensure such objectives will be met. The licensee may propose results and strategies in their operational plan (i.e., Forest Stewardship Plan) or in some cases may select default results and strategies identified in the Forest Planning and Practices Regulation (FPPR).
1.6 Central Coast Land and Resource Management Plan Process
The July, 2007 South Central Coast Order regarding the CCLRMP defines land use objectives and other measures to implement ecosystem based management within the South and Central Coast area. A copy of the order and a map outlining the areas where the objectives will be applied is available at:
http://www.mediaroom.gov.bc.ca/DisplayEventDetails.aspx?eventId=389
There are two key components that will be recognized when addressing the CCLRMP, specifically:
• Protection of new Conservancy areas and Biodiversity areas; and • Ecosystem-Based Management (EBM) objectives and targets.
1.7 Timber Supply Scenarios
The TSR process is designed to capture “current practice” on a management unit. However, during the period in which EBM parameters are being established and implemented, current practice is in fact in a stage of transition. To capture this dynamic, two scenarios will be explored.
Pre-EBM - This scenario will capture current Forest and Range Practices Act (FRPA) management practices and assumptions.
EBM Ministerial Order – This scenario will capture the objectives as defined in the now legally established South Central Order.
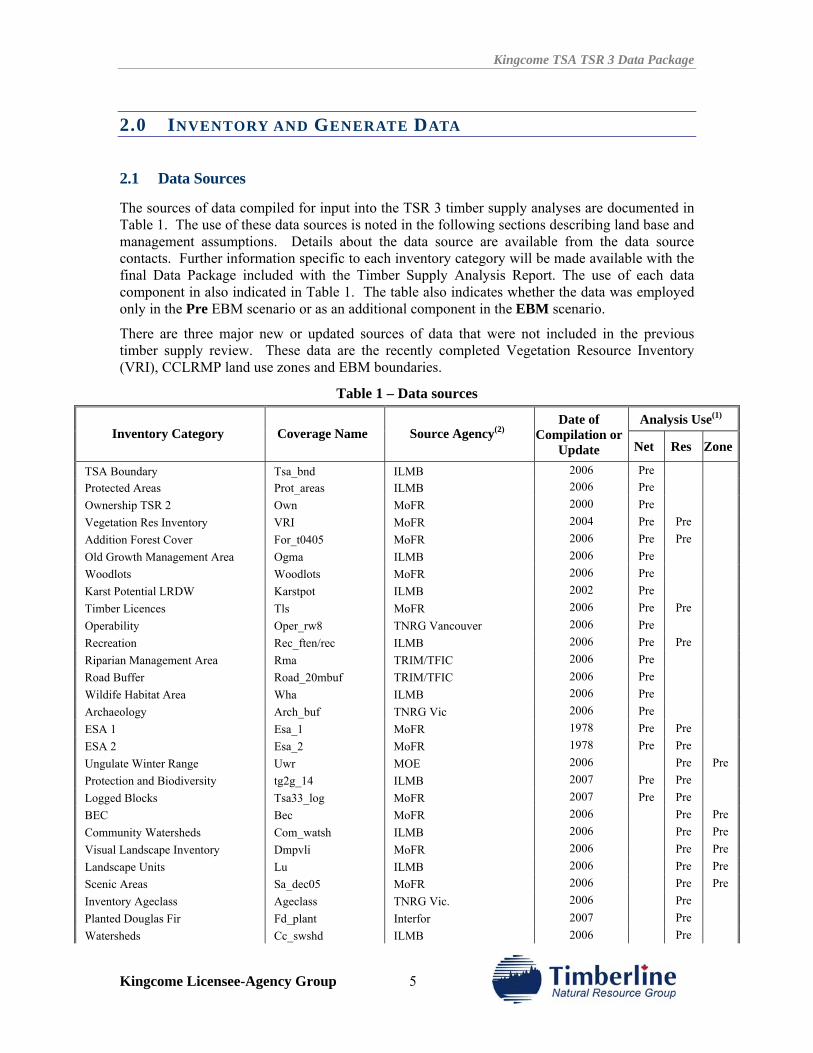
Kingcome TSA TSR 3 Data Package
Kingcome Licensee-Agency Group 5
2.0 INVENTORY AND GENERATE DATA
2.1 Data Sources
The sources of data compiled for input into the TSR 3 timber supply analyses are documented in Table 1. The use of these data sources is noted in the following sections describing land base and management assumptions. Details about the data source are available from the data source contacts. Further information specific to each inventory category will be made available with the final Data Package included with the Timber Supply Analysis Report. The use of each data component in also indicated in Table 1. The table also indicates whether the data was employed only in the Pre EBM scenario or as an additional component in the EBM scenario.
There are three major new or updated sources of data that were not included in the previous timber supply review. These data are the recently completed Vegetation Resource Inventory (VRI), CCLRMP land use zones and EBM boundaries.
Table 1 – Data sources
Analysis Use(1) Inventory Category Coverage Name Source Agency(2)
Date of Compilation or
Update Net Res Zone
TSA Boundary Tsa_bnd ILMB 2006 Pre Protected Areas Prot_areas ILMB 2006 Pre Ownership TSR 2 Own MoFR 2000 Pre Vegetation Res Inventory VRI MoFR 2004 Pre Pre Addition Forest Cover For_t0405 MoFR 2006 Pre Pre Old Growth Management Area Ogma ILMB 2006 Pre Woodlots Woodlots MoFR 2006 Pre Karst Potential LRDW Karstpot ILMB 2002 Pre Timber Licences Tls MoFR 2006 Pre Pre Operability Oper_rw8 TNRG Vancouver 2006 Pre Recreation Rec_ften/rec ILMB 2006 Pre Pre Riparian Management Area Rma TRIM/TFIC 2006 Pre Road Buffer Road_20mbuf TRIM/TFIC 2006 Pre Wildife Habitat Area Wha ILMB 2006 Pre Archaeology Arch_buf TNRG Vic 2006 Pre ESA 1 Esa_1 MoFR 1978 Pre Pre ESA 2 Esa_2 MoFR 1978 Pre Pre Ungulate Winter Range Uwr MOE 2006 Pre Pre Protection and Biodiversity tg2g_14 ILMB 2007 Pre Pre Logged Blocks Tsa33_log MoFR 2007 Pre Pre BEC Bec MoFR 2006 Pre Pre Community Watersheds Com_watsh ILMB 2006 Pre Pre Visual Landscape Inventory Dmpvli MoFR 2006 Pre Pre Landscape Units Lu ILMB 2006 Pre Pre Scenic Areas Sa_dec05 MoFR 2006 Pre Pre Inventory Ageclass Ageclass TNRG Vic. 2006 Pre Planted Douglas Fir Fd_plant Interfor 2007 Pre Watersheds Cc_swshd ILMB 2006 Pre
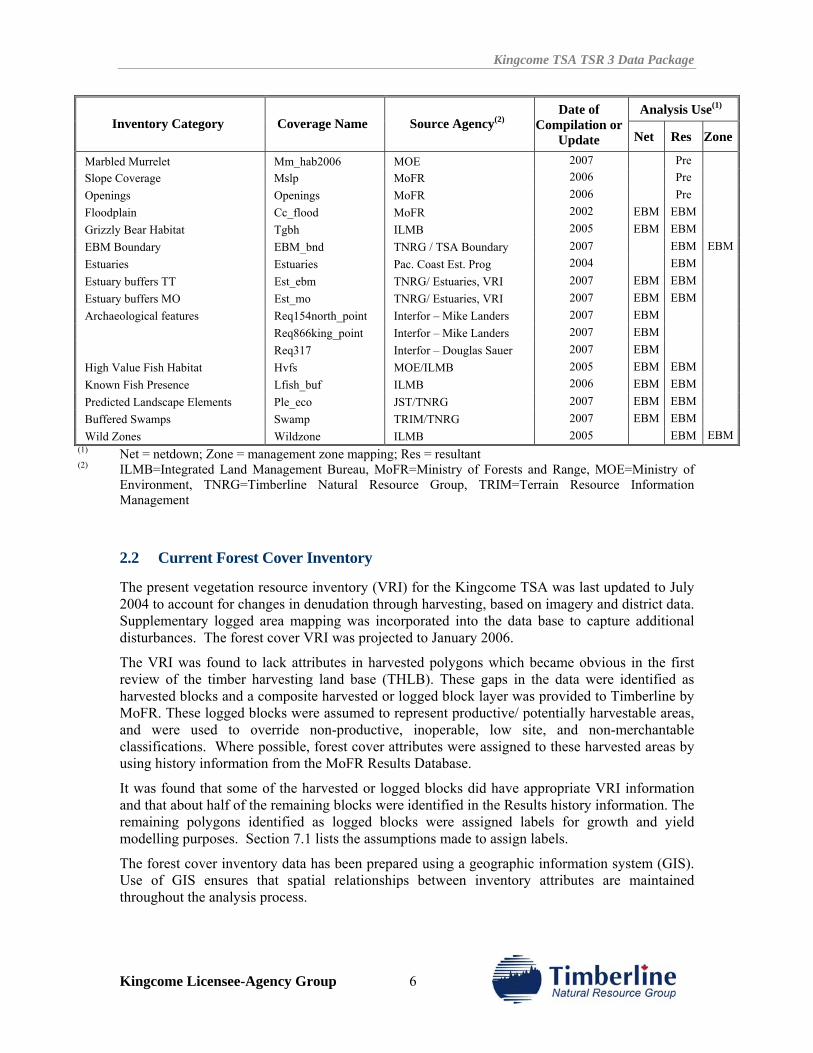
Kingcome TSA TSR 3 Data Package
Kingcome Licensee-Agency Group 6
Analysis Use(1) Inventory Category Coverage Name Source Agency(2)
Date of Compilation or
Update Net Res Zone
Marbled Murrelet Mm_hab2006 MOE 2007 Pre Slope Coverage Mslp MoFR 2006 Pre Openings Openings MoFR 2006 Pre Floodplain Cc_flood MoFR 2002 EBM EBM Grizzly Bear Habitat Tgbh ILMB 2005 EBM EBM EBM Boundary EBM_bnd TNRG / TSA Boundary 2007 EBM EBMEstuaries Estuaries Pac. Coast Est. Prog 2004 EBM Estuary buffers TT Est_ebm TNRG/ Estuaries, VRI 2007 EBM EBM Estuary buffers MO Est_mo TNRG/ Estuaries, VRI 2007 EBM EBM
Req154north_point Interfor – Mike Landers 2007 EBM Req866king_point Interfor – Mike Landers 2007 EBM
Archaeological features
Req317 Interfor – Douglas Sauer 2007 EBM High Value Fish Habitat Hvfs MOE/ILMB 2005 EBM EBM Known Fish Presence Lfish_buf ILMB 2006 EBM EBM Predicted Landscape Elements Ple_eco JST/TNRG 2007 EBM EBM Buffered Swamps Swamp TRIM/TNRG 2007 EBM EBM Wild Zones Wildzone ILMB 2005 EBM EBM
(1) Net = netdown; Zone = management zone mapping; Res = resultant (2) ILMB=Integrated Land Management Bureau, MoFR=Ministry of Forests and Range, MOE=Ministry of
Environment, TNRG=Timberline Natural Resource Group, TRIM=Terrain Resource Information Management
2.2 Current Forest Cover Inventory
The present vegetation resource inventory (VRI) for the Kingcome TSA was last updated to July 2004 to account for changes in denudation through harvesting, based on imagery and district data. Supplementary logged area mapping was incorporated into the data base to capture additional disturbances. The forest cover VRI was projected to January 2006.
The VRI was found to lack attributes in harvested polygons which became obvious in the first review of the timber harvesting land base (THLB). These gaps in the data were identified as harvested blocks and a composite harvested or logged block layer was provided to Timberline by MoFR. These logged blocks were assumed to represent productive/ potentially harvestable areas, and were used to override non-productive, inoperable, low site, and non-merchantable classifications. Where possible, forest cover attributes were assigned to these harvested areas by using history information from the MoFR Results Database.
It was found that some of the harvested or logged blocks did have appropriate VRI information and that about half of the remaining blocks were identified in the Results history information. The remaining polygons identified as logged blocks were assigned labels for growth and yield modelling purposes. Section 7.1 lists the assumptions made to assign labels.
The forest cover inventory data has been prepared using a geographic information system (GIS). Use of GIS ensures that spatial relationships between inventory attributes are maintained throughout the analysis process.
Kingcome TSA TSR 3 Data Package
Kingcome Licensee-Agency Group 7
2.3 Forest Cover Inventory – Statistical Adjustment
The phase 2 VRI statistical attribute adjustment study for the Kingcome TSA was completed by J.S. Thrower & Associates in May 2005 (J.S. Thrower, 2005) for the Kingcome TSA licensees. The attribute adjustment is the process of correcting aerial photo-based inventory data from the estimation phase using ground sample observations. The purpose of the adjustments is to obtain unbiased overall averages and totals for the TSA by major species groups and to adjust the existing estimation data to obtain individual stand values (MoFR, March 2004). This analysis indicated that the volume in the timber harvesting land base was underestimated by approximately 9% with a sampling error (at the 95% probability level) of 12.3%.
Seventy-five (75) Phase II ground samples were installed by crews from Kerley & Associates Ltd. in the 2003 field season and 79 net volume adjustment factor (NVAF) trees were destructively sampled by crews from McColl Forestry during the 2004 field season. The target population for the statistical adjustment included polygons in the operable land base with a stand age of at least 30 years that were likely to be included in the timber harvesting land base (THLB) in TSR 3. The target population covered 251,188 ha. Approximately 26% of the area was located in Immature stands (less tha121 years), 32% was located in Low Land cedar stands (stands leading in western red cedar in the CHWvh1 biogeoclimatic zone), and 42% in Mature stands (120 years and older).
NVAF trees were selected across the Kingcome TSA and Tree Farm Licence (TFL) 45. The objective was to estimate NVAF adjustment ratios that would apply to both management units. Results showed that taper equations and net factoring rules under-estimated the true net merchantable volume for dead potential, live immature, and mature cedar trees by 2-3%. For mature hemlock and other mature trees, taper equations and net factoring rules over-estimated true volume by 1% and 3%, respectively.
The following steps were employed to adjust the inventory attributes: 1. Perform analysis on VRI ground sample inventory data and develop inventory file
adjustment factors for age and height; 2. Using the factors derived in step 1, adjust height and age in the inventory database files; 3. Based on the adjusted inventory file height and age, use Variable Density Yield Predictor
(VDYP Version 6.6d) to compute an “attribute-adjusted” inventory volume; 4. Develop inventory file adjustment factors for volume (using ground sample inventory
volume and “attribute-adjusted” inventory volume); and 5. Using the volume adjustment factors derived in step 4; adjust the “attribute-adjusted”
inventory volume derived in step 3. The adjusted volumes are based on net factoring with the NVAF applied. This volume is referred to as the final adjusted inventory volume.
Results are presented in Table 2. Following adjustment, both the overall average live net merchantable volume (17.5 cm+) and the average mature volume increased 9% to 503 m3/ha and 627 m3/ha, respectively. The overall average increases were +14%, -1% and +12% for the immature, low land, and mature stands, respectively. The increases were similar for all leading species groups within a maturity group.
Inventory site index decreased on average by 10%. The average decrease was slightly more important in the immature (12%) and low land stands (13%) than in the mature ones (6%).
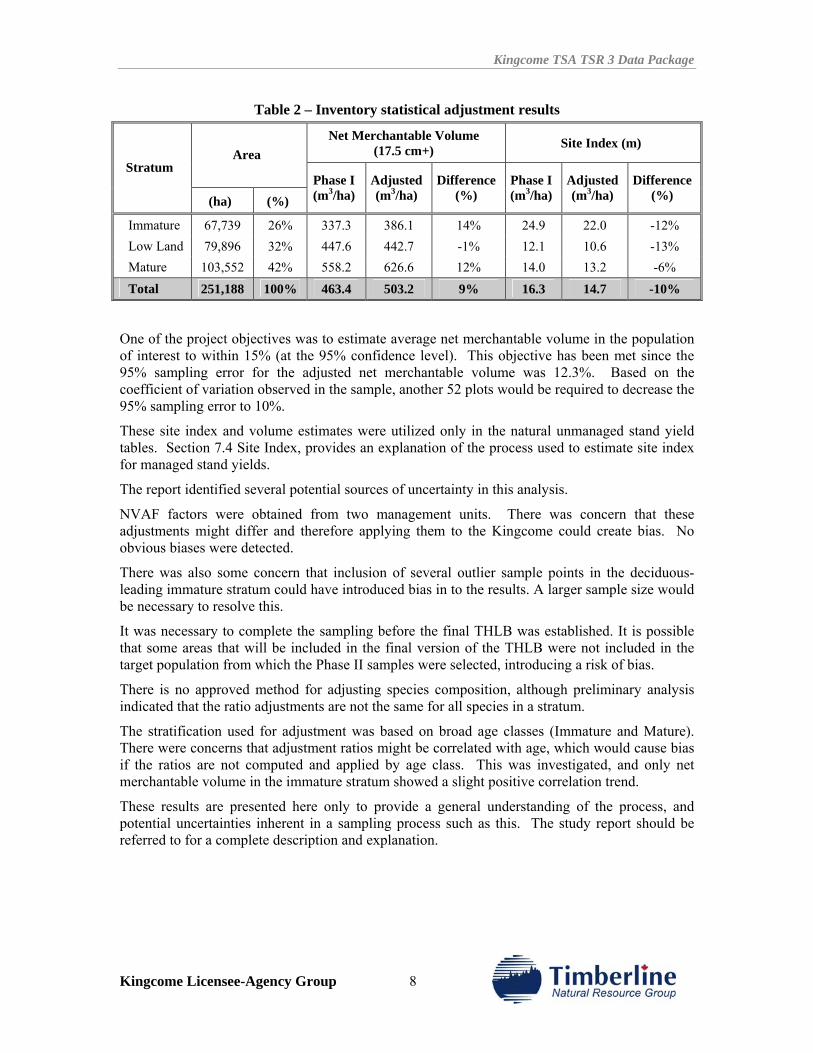
Kingcome TSA TSR 3 Data Package
Kingcome Licensee-Agency Group 8
Table 2 – Inventory statistical adjustment results
Net Merchantable Volume (17.5 cm+) Site Index (m)
Area Stratum
(ha) (%) Phase I(m3/ha)
Adjusted(m3/ha)
Difference(%)
Phase I(m3/ha)
Adjusted (m3/ha)
Difference(%)
Immature 67,739 26% 337.3 386.1 14% 24.9 22.0 -12% Low Land 79,896 32% 447.6 442.7 -1% 12.1 10.6 -13% Mature 103,552 42% 558.2 626.6 12% 14.0 13.2 -6% Total 251,188 100% 463.4 503.2 9% 16.3 14.7 -10%
One of the project objectives was to estimate average net merchantable volume in the population of interest to within 15% (at the 95% confidence level). This objective has been met since the 95% sampling error for the adjusted net merchantable volume was 12.3%. Based on the coefficient of variation observed in the sample, another 52 plots would be required to decrease the 95% sampling error to 10%.
These site index and volume estimates were utilized only in the natural unmanaged stand yield tables. Section 7.4 Site Index, provides an explanation of the process used to estimate site index for managed stand yields.
The report identified several potential sources of uncertainty in this analysis.
NVAF factors were obtained from two management units. There was concern that these adjustments might differ and therefore applying them to the Kingcome could create bias. No obvious biases were detected.
There was also some concern that inclusion of several outlier sample points in the deciduous-leading immature stratum could have introduced bias in to the results. A larger sample size would be necessary to resolve this.
It was necessary to complete the sampling before the final THLB was established. It is possible that some areas that will be included in the final version of the THLB were not included in the target population from which the Phase II samples were selected, introducing a risk of bias.
There is no approved method for adjusting species composition, although preliminary analysis indicated that the ratio adjustments are not the same for all species in a stratum.
The stratification used for adjustment was based on broad age classes (Immature and Mature). There were concerns that adjustment ratios might be correlated with age, which would cause bias if the ratios are not computed and applied by age class. This was investigated, and only net merchantable volume in the immature stratum showed a slight positive correlation trend.
These results are presented here only to provide a general understanding of the process, and potential uncertainties inherent in a sampling process such as this. The study report should be referred to for a complete description and explanation.
Kingcome TSA TSR 3 Data Package
Kingcome Licensee-Agency Group 9
3.0 TIMBER SUPPLY ANALYSIS FORECASTS
The British Columbia Timber Supply Review process utilizes forest estate modelling techniques to forecast timber supply characteristics of major management units. Such models require that the land base be stratified and characterized by management objectives.
Management objectives are described by two methods within the forest estate modelling framework. The first method is by considering that the management objective results in exclusion of area for the purposes of timber harvesting. This is often referred to as defining the timber harvesting land base or the netdown process. The second method is through the use of forest cover or adjacency constraints. An example of a forest cover constraint is requiring a specific percentage of a specified management zone to be above a certain age.
Section 4.0 provides a description of Timberline’s proprietary spatial timber supply model CASH6 (Critical Analysis of Schedules for Harvesting) that is used in the analysis.
Details about the individual factors determining the timber harvesting land base and management zones for the Pre-EBM and EBM scenarios are found in Sections 5 and 6. Details about regeneration and growth and yield assumptions and the attendant silviculture prescriptions are discussed in Sections 7 and 8. Section 9 provides a summary of the Integrated Resource Management objectives that will be modelled. Section 10 provides a summary of modelling rules to be employed in the analysis.
Finally, Section 11 summarizes the analyses that will be performed to test the sensitivity of the forecasted results to changes in one or more assumptions.
The TSR 3 analysis used the ‘best available information’. In this case the best available information includes the information collected by the Kingcome TSA Licensee-Agency Group.
3.1 Pre-EBM
The Pre-EBM analysis is built from the TSR 2 analysis completed in October 2002, the details of which are documented in TSR 2 analysis report (MoFR, 2001). The Pre-EBM analysis also takes direction from the comments made by the Chief Forester in the 2002 AAC Rationale for the Kingcome TSA (MoFR, 2002). Information updates and improvements completed since TSR 2 are listed below:
• VRI coverage for the entire TSA; • VRI phase II attribute adjustments; • Improved site productivity estimates for managed stands; • Use of tree improvement program seed; • Updated spatially explicit road buffers; • Updated spatially explicit stream buffers; • Updated cultural heritage sites; • Updated wildlife habitat information; • New economic operability assessment; • New Conservancy and Biodiversity Areas; and • Allowance for disturbances in the non-timber harvesting land base.
Kingcome TSA TSR 3 Data Package
Kingcome Licensee-Agency Group 10
3.2 EBM
In November 2006, the Kingcome TSA Timber Supply Review stakeholders composed a letter to the Provincial Chief Forester seeking direction on the role that Ecosystem-Based Management (EBM) should have in TSR. The TSR process is intended to model “current practice” on a management unit yet at that time the final EBM parameters had not yet been set by the Ministry of Forests and Range. Currently, for those who have committed to the process, each Kingcome TSA licensee is at a different stage in their implementation process.
In his January 16, 2007 letter in response, the Chief Forester acknowledged that while the exact EBM framework had not yet been formalized, the development of the actual EBM components should be left to the discretion of the Kingcome TSA stakeholder group. On February 19, 2007, a sub-group of the Kingcome TSA stakeholders met to define the timber supply analysis framework for the Kingcome TSR and finalize the parameters proposed for modelling the key components of EBM. The sub-group included Ted Stevens and Gary Ardron representing First Nations interests, Dave McKay, Gerry Sommers, and Warren Wartig of International Forest Products Ltd., Peter Koefed of Western Forest Products Ltd., Jim Brown, Jennifer Barolet and Christina Mardell of the MoFR, and Tara McCormick, Dave Coster, Laszlo Kardos, and Hamish Robertson of Timberline Natural Resource Group Ltd.
Modelling data sources and assumptions needed to address Ecosystem-Based Management objectives were defined by the group. Since that time, these approaches have been refined as the specifics of each objective have been clarified. For each objective, the specific approach is documented in the appropriate section of this report, depending upon whether it is a netdown factor (Section 5.2), a management zone (Sections 6.2, 9.2) a stand growth and yield adjustment (Section 8.5), or a timber flow consideration (Section 10.9).
The South Central Coast Ministerial Order is now legally established, formalizing the Land Use Objectives for the South Central Coast Area. These objectives address protection of the following resources. In each case, the section reference is listed to refer the reader to the appropriate section of this Data Package. The complete MO text describing the objective is included in the referenced section:
First Nations • Objective 3: First Nations’ traditional forest resources (5.2.1); • Objective 4: First Nations’ traditional heritage features (5.2.1); • Objective 5: Culturally modified trees (5.2.1); • Objective 6: Monumental cedar (10.9.1); • Objective 7: Stand-level retention of Western red and Yellow Cedar (10.9.2);
Aquatic Habitats • Objective 8: Important fisheries watersheds (6.2.1); • Objective 9: High value fish habitat (5,2,2); • Objective 10: Aquatic habitat that is not high value fish habitat (5.2.3); • Objective 11: Forested swamps (5.2.4); • Objective 12: Upland streams (6.2.2); • Objective 13: Active fluvial units (5.2.5);
Kingcome TSA TSR 3 Data Package
Kingcome Licensee-Agency Group 11
Biodiversity • Objective 14: Landscape-level biodiversity (6.2.3); • Objective 15: Red-listed and blue-listed plant communities (5.2.6); • Objective 16: Stand-level retention (8.5.1); and • Objective 17: Sensitive grizzly bear habitat (5.2.7).
These objectives will be modelled within the EBM zone, essentially the mainland portion of the TSA.
Kingcome TSA TSR 3 Data Package
Kingcome Licensee-Agency Group 12
4.0 FOREST ESTATE MODEL
4.1 Model Description
Timberline’s simulation model CASH6 (Critical Analysis by Simulation of Harvesting) will be used to develop harvest schedules integrating all resource management considerations. The model, which has been used for numerous timber supply reviews, Innovative Forest Practices Agreement, and land use planning analyses, has been accepted for use in timber supply by the MoFR. The model uses a geographic approach to land base and inventory in order to adhere as closely as possible to the intent of forest cover constraints on harvesting. Maximum disturbance and minimum forest cover retention requirements are explicitly implemented.
A variable degree of spatial resolution is available including block-to-block adjacency, depending on inventory formulation and resource emphasis area definitions. Forest stands in refuges such as environmentally sensitive and inoperable areas that do not contribute to the periodic harvest are nonetheless included for their contribution to forest structure at both the stand and landscape levels.
In their current implementation, forest cover objectives require a control area over which to operate. The control area for a constraint set should correspond to a realistic element in the landscape. For example, the requirements associated with visual quality objectives are designed to operate on the scene visible from discrete sets of viewpoints. In aspatial mode, pseudo-geography may be employed to translate spatial constraints on harvesting into forest cover and static access constraints. The objective is to identify the “natural” constituency for forest cover constraints. Numerous levels of land aggregation are used to define both geographically separate areas and areas of similar management regime.
The use of forest cover objectives improves forest management modelling by ensuring that non-timber resources are given appropriate consideration. Cover constraints are applied at different levels of spatial resolution depending on the management zone, or resource emphasis area, in question.
Forest cover objectives place maximum and/or minimum limits on the amount of young, mature and/or old growth found in land base aggregates such as combinations of landscape units and ecosystem units or resource emphasis areas. CASH6 defines the following three classes of forest cover constraints for modelling management objectives within each land base aggregate.
1. Disturbance: the maximum area that can be younger than a specified age or shorter than a specified height. This is intended to model cutblock adjacency and green-up requirements.
2. Old-growth Retention: the minimum area that must be older than, or as old as, a specified age. This is intended to model both retention of cover and retention of old growth.
3. Mature Retention: the minimum proportion of area that must be retained over a lower retention age. This is intended to model thermal cover for wildlife or mature biodiversity requirements. Mature and old growth retention forest cover objectives may overlap and area that qualifies for both is counted in both.
Kingcome TSA TSR 3 Data Package
Kingcome Licensee-Agency Group 13
5.0 LAND BASE DESCRIPTION
This section describes factors that influence management of the Kingcome TSA land base and the methodology used to determine the way in which land contributes to timber supply. Some portions of the productive land base, while not contributing to harvest, may be available to meet other resource needs.
The section presents the determination of the timber harvesting land base for the Kingcome TSA. Each factor in the table is described in the sections which follow. The order in which these factors are applied to remove areas from the timber harvesting land base is important, as many of the netdown features overlap spatially. In the tables which accompany each of the following sections, productive area represents the total productive area within the feature. Area removed represents the area removal at that step in the netdown process, net of any area overlapping other features previously removed. The classification of land base for contribution to analysis described in this section is based on the procedure outlined in the Supplemental Guide for Preparing Timber Supply Analysis Data Packages (MoFR, 2003c).
All of the land base classification steps performed during TSR 2 remain in the current classification. However, the following additions or modifications have been made since TSR 2:
• Existing road losses are now explicitly (spatially) identified and removed from the land base contributing to timber supply;
• Riparian reserve and management zones are now explicitly (spatially) identified and removed from the land base contributing to timber supply;
• Old growth management areas, established within some landscape units, are now identified and removed from the land base contributing to timber supply;
• Landscape units with no old growth management areas are now managed to retention levels set by the Order Establishing Provincial Non-spatial Old Growth Objectives (June 30, 2004);
• Wildlife habitat areas (WHAs) and Ungulate Winter Ranges (UWRs) are now identified and removed from the land base contributing to timber supply;
• Existing forest inventory age and height values were adjusted, and the forest inventory has been updated for disturbance to 2004;
• Archaeological sites have been explicitly identified and the land base contributing to timber supply has been adjusted to account for these areas;
• Karst terrain features are now identified and removed from the THLB; • Biodiversity Areas and Conservancy Areas either proposed or established as result of the
CCLRMP are now removed from the land base contributing to timber supply; and • EBM objectives requiring areas to be removed from the THLB are incorporated into the
netdown process. The final classification results in a current THLB of 208,175 hectares (Pre-EBM) and 182,052 hectares (EBM), compared to the TSR 2 current timber harvesting land base (168,726 ha) documented in the previous timber supply review analysis report. While reductions to address new Central Coast biodiversity, conservancy and EBM objectives removed significant areas from timber production, these were more than offset by additions based on a new economic operability assessment, and revised low site criteria. The THLB area includes 5,549 hectares of unreverted timber licence areas which do not contribute to the TSA timber supply until after they are harvested and regenerated. Also, 12,937 hectares of recently disturbed areas are included in the
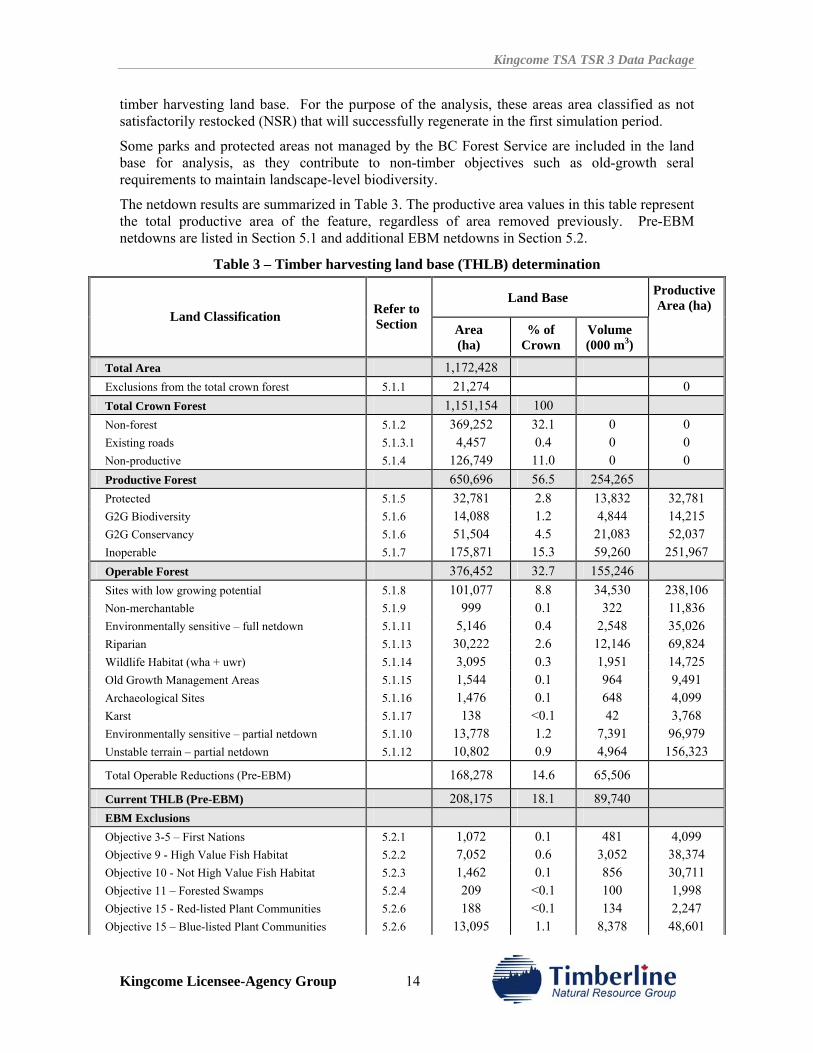
Kingcome TSA TSR 3 Data Package
Kingcome Licensee-Agency Group 14
timber harvesting land base. For the purpose of the analysis, these areas area classified as not satisfactorily restocked (NSR) that will successfully regenerate in the first simulation period.
Some parks and protected areas not managed by the BC Forest Service are included in the land base for analysis, as they contribute to non-timber objectives such as old-growth seral requirements to maintain landscape-level biodiversity.
The netdown results are summarized in Table 3. The productive area values in this table represent the total productive area of the feature, regardless of area removed previously. Pre-EBM netdowns are listed in Section 5.1 and additional EBM netdowns in Section 5.2.
Table 3 – Timber harvesting land base (THLB) determination
Land Base Productive Area (ha)
Land Classification Refer to Section Area
(ha) % of
Crown Volume (000 m3)
Total Area 1,172,428 Exclusions from the total crown forest 5.1.1 21,274 0 Total Crown Forest 1,151,154 100 Non-forest 5.1.2 369,252 32.1 0 0 Existing roads 5.1.3.1 4,457 0.4 0 0 Non-productive 5.1.4 126,749 11.0 0 0 Productive Forest 650,696 56.5 254,265 Protected 5.1.5 32,781 2.8 13,832 32,781 G2G Biodiversity 5.1.6 14,088 1.2 4,844 14,215 G2G Conservancy 5.1.6 51,504 4.5 21,083 52,037 Inoperable 5.1.7 175,871 15.3 59,260 251,967 Operable Forest 376,452 32.7 155,246 Sites with low growing potential 5.1.8 101,077 8.8 34,530 238,106 Non-merchantable 5.1.9 999 0.1 322 11,836 Environmentally sensitive – full netdown 5.1.11 5,146 0.4 2,548 35,026 Riparian 5.1.13 30,222 2.6 12,146 69,824 Wildlife Habitat (wha + uwr) 5.1.14 3,095 0.3 1,951 14,725 Old Growth Management Areas 5.1.15 1,544 0.1 964 9,491 Archaeological Sites 5.1.16 1,476 0.1 648 4,099 Karst 5.1.17 138 <0.1 42 3,768 Environmentally sensitive – partial netdown 5.1.10 13,778 1.2 7,391 96,979 Unstable terrain – partial netdown 5.1.12 10,802 0.9 4,964 156,323
Total Operable Reductions (Pre-EBM) 168,278 14.6 65,506
Current THLB (Pre-EBM) 208,175 18.1 89,740 EBM Exclusions Objective 3-5 – First Nations 5.2.1 1,072 0.1 481 4,099 Objective 9 - High Value Fish Habitat 5.2.2 7,052 0.6 3,052 38,374 Objective 10 - Not High Value Fish Habitat 5.2.3 1,462 0.1 856 30,711 Objective 11 – Forested Swamps 5.2.4 209 <0.1 100 1,998 Objective 15 - Red-listed Plant Communities 5.2.6 188 <0.1 134 2,247 Objective 15 – Blue-listed Plant Communities 5.2.6 13,095 1.1 8,378 48,601
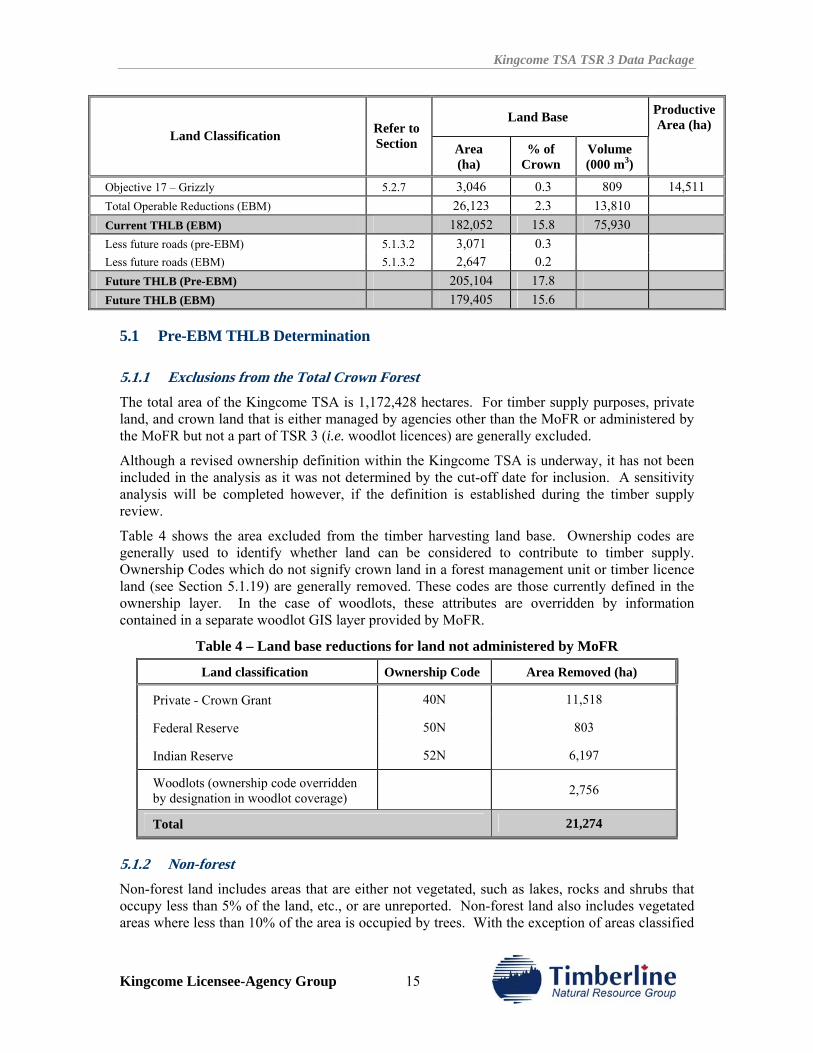
Kingcome TSA TSR 3 Data Package
Kingcome Licensee-Agency Group 15
Land Base Productive Area (ha)
Land Classification Refer to Section Area
(ha) % of
Crown Volume (000 m3)
Objective 17 – Grizzly 5.2.7 3,046 0.3 809 14,511 Total Operable Reductions (EBM) 26,123 2.3 13,810 Current THLB (EBM) 182,052 15.8 75,930 Less future roads (pre-EBM) 5.1.3.2 3,071 0.3 Less future roads (EBM) 5.1.3.2 2,647 0.2 Future THLB (Pre-EBM) 205,104 17.8 Future THLB (EBM) 179,405 15.6
5.1 Pre-EBM THLB Determination
5.1.1 Exclusions from the Total Crown Forest The total area of the Kingcome TSA is 1,172,428 hectares. For timber supply purposes, private land, and crown land that is either managed by agencies other than the MoFR or administered by the MoFR but not a part of TSR 3 (i.e. woodlot licences) are generally excluded.
Although a revised ownership definition within the Kingcome TSA is underway, it has not been included in the analysis as it was not determined by the cut-off date for inclusion. A sensitivity analysis will be completed however, if the definition is established during the timber supply review.
Table 4 shows the area excluded from the timber harvesting land base. Ownership codes are generally used to identify whether land can be considered to contribute to timber supply. Ownership Codes which do not signify crown land in a forest management unit or timber licence land (see Section 5.1.19) are generally removed. These codes are those currently defined in the ownership layer. In the case of woodlots, these attributes are overridden by information contained in a separate woodlot GIS layer provided by MoFR.
Table 4 – Land base reductions for land not administered by MoFR
5.1.2 Non-forest Non-forest land includes areas that are either not vegetated, such as lakes, rocks and shrubs that occupy less than 5% of the land, etc., or are unreported. Non-forest land also includes vegetated areas where less than 10% of the area is occupied by trees. With the exception of areas classified
Land classification Ownership Code Area Removed (ha)
Private - Crown Grant 40N 11,518
Federal Reserve 50N 803
Indian Reserve 52N 6,197
Woodlots (ownership code overridden by designation in woodlot coverage) 2,756
Total 21,274
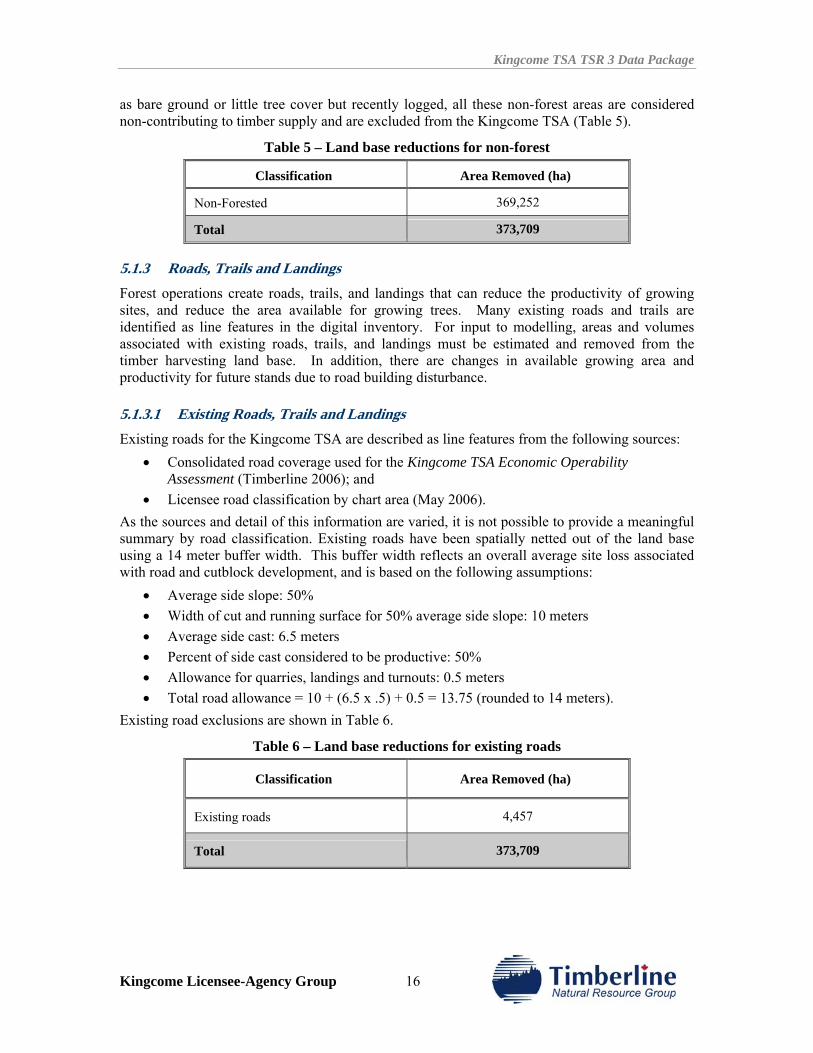
Kingcome TSA TSR 3 Data Package
Kingcome Licensee-Agency Group 16
as bare ground or little tree cover but recently logged, all these non-forest areas are considered non-contributing to timber supply and are excluded from the Kingcome TSA (Table 5).
Table 5 – Land base reductions for non-forest
Classification Area Removed (ha)
Non-Forested 369,252
Total 373,709
5.1.3 Roads, Trails and Landings Forest operations create roads, trails, and landings that can reduce the productivity of growing sites, and reduce the area available for growing trees. Many existing roads and trails are identified as line features in the digital inventory. For input to modelling, areas and volumes associated with existing roads, trails, and landings must be estimated and removed from the timber harvesting land base. In addition, there are changes in available growing area and productivity for future stands due to road building disturbance.
5.1.3.1 Existing Roads, Trails and Landings Existing roads for the Kingcome TSA are described as line features from the following sources:
• Consolidated road coverage used for the Kingcome TSA Economic Operability Assessment (Timberline 2006); and
• Licensee road classification by chart area (May 2006). As the sources and detail of this information are varied, it is not possible to provide a meaningful summary by road classification. Existing roads have been spatially netted out of the land base using a 14 meter buffer width. This buffer width reflects an overall average site loss associated with road and cutblock development, and is based on the following assumptions:
• Average side slope: 50% • Width of cut and running surface for 50% average side slope: 10 meters • Average side cast: 6.5 meters • Percent of side cast considered to be productive: 50% • Allowance for quarries, landings and turnouts: 0.5 meters • Total road allowance = 10 + (6.5 x .5) + 0.5 = 13.75 (rounded to 14 meters).
Existing road exclusions are shown in Table 6.
Table 6 – Land base reductions for existing roads
Classification Area Removed (ha)
Existing roads 4,457
Total 373,709
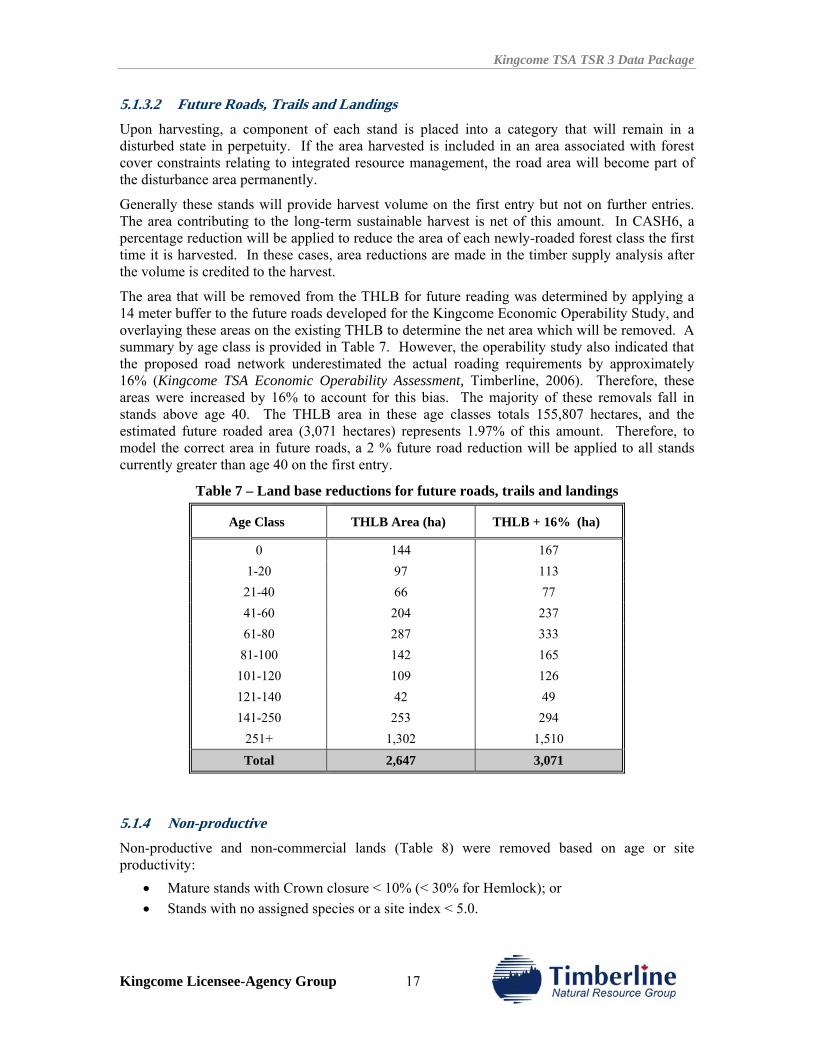
Kingcome TSA TSR 3 Data Package
Kingcome Licensee-Agency Group 17
5.1.3.2 Future Roads, Trails and Landings Upon harvesting, a component of each stand is placed into a category that will remain in a disturbed state in perpetuity. If the area harvested is included in an area associated with forest cover constraints relating to integrated resource management, the road area will become part of the disturbance area permanently.
Generally these stands will provide harvest volume on the first entry but not on further entries. The area contributing to the long-term sustainable harvest is net of this amount. In CASH6, a percentage reduction will be applied to reduce the area of each newly-roaded forest class the first time it is harvested. In these cases, area reductions are made in the timber supply analysis after the volume is credited to the harvest.
The area that will be removed from the THLB for future reading was determined by applying a 14 meter buffer to the future roads developed for the Kingcome Economic Operability Study, and overlaying these areas on the existing THLB to determine the net area which will be removed. A summary by age class is provided in Table 7. However, the operability study also indicated that the proposed road network underestimated the actual roading requirements by approximately 16% (Kingcome TSA Economic Operability Assessment, Timberline, 2006). Therefore, these areas were increased by 16% to account for this bias. The majority of these removals fall in stands above age 40. The THLB area in these age classes totals 155,807 hectares, and the estimated future roaded area (3,071 hectares) represents 1.97% of this amount. Therefore, to model the correct area in future roads, a 2 % future road reduction will be applied to all stands currently greater than age 40 on the first entry.
Table 7 – Land base reductions for future roads, trails and landings
Age Class THLB Area (ha) THLB + 16% (ha)
0 144 167 1-20 97 113
21-40 66 77 41-60 204 237 61-80 287 333 81-100 142 165
101-120 109 126 121-140 42 49 141-250 253 294
251+ 1,302 1,510 Total 2,647 3,071
5.1.4 Non-productive Non-productive and non-commercial lands (Table 8) were removed based on age or site productivity:
• Mature stands with Crown closure < 10% (< 30% for Hemlock); or • Stands with no assigned species or a site index < 5.0.
Kingcome TSA TSR 3 Data Package
Kingcome Licensee-Agency Group 18
Table 8 – Land base reductions for non-productive
Criteria Area Removed (ha)
Crown closure-based 88,579
Productivity-based 38,170
Total 126,749
5.1.5 Protected Areas While protected areas are not managed for timber supply, the forested areas within them contribute to non-timber objectives, and they therefore are included in the land base for analysis. These areas were either identified based on ownership, or by a separate protected area (PA) coverage. Areas are summarized in Table 9.
Table 9 – Land base reductions for protected areas
Criteria Name Productive Area (ha)
Area Removed (ha)
Ownership layer Crown Reserves 3,143 3,142
Beresford Island Ecological Reserve 2 2 Brooks Peninsula Park 6,995 6,995 Broughton Archipelago Marine Park 1,899 1,899 Cape Scott Park 16,022 16,022 Cormorant Channel Marine Park 238 238 Duke of Edinburgh Ecological Reserve 57 57 Echo Bay Marine Park 0 0 God's Pocket Marine Park 538 538 Kingcome River / Atlatzi River Ecological 385 385 Klaskish River Ecological Reserve 126 126 Lanz and Cox Islands Park 1,340 1,340 Lawn Point Park 499 499
PA coverage
Schoen Lake Park 1,537 1,537
Subtotal from PA coverage 29,639 29,639
TSA Total 32,781 32,781
5.1.6 G2G Biodiversity and Protected The April 2006 orders-in-council established Central Coast Designated Area No. 2 for protection from harvesting under Part 13 of the Forest Act. Two categories of protected areas were identified, Conservancy Areas and Biodiversity Areas. More than half of the proposed Conservancy Areas have been legally designated and work is ongoing to designate the remaining Conservancies and the Biodiversity Areas.
Under Section 170 (2) of the Forest Act the Minister of Forests and Range, by written order, has suspended plans, prescriptions, cutting permits, timber sale licences and road permits within the Central Coast Designated Area No.2 (with some specified exemptions) and has directed that any
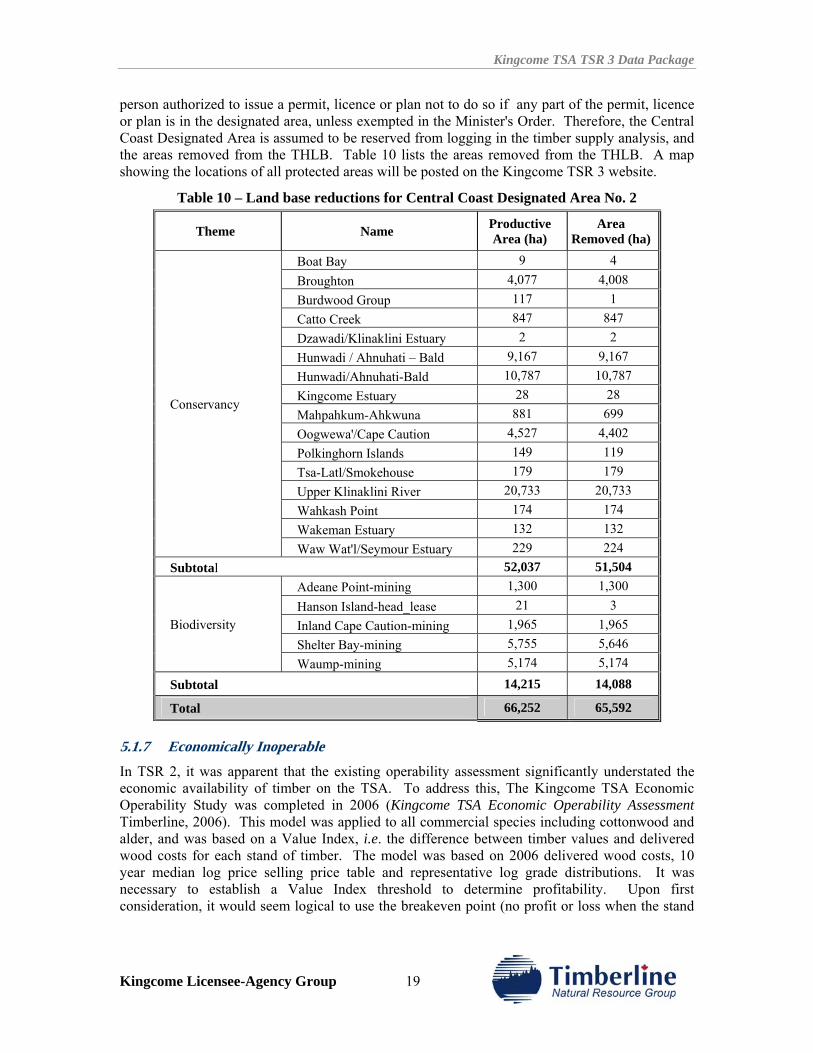
Kingcome TSA TSR 3 Data Package
Kingcome Licensee-Agency Group 19
person authorized to issue a permit, licence or plan not to do so if any part of the permit, licence or plan is in the designated area, unless exempted in the Minister's Order. Therefore, the Central Coast Designated Area is assumed to be reserved from logging in the timber supply analysis, and the areas removed from the THLB. Table 10 lists the areas removed from the THLB. A map showing the locations of all protected areas will be posted on the Kingcome TSR 3 website.
Table 10 – Land base reductions for Central Coast Designated Area No. 2
Theme Name Productive Area (ha)
Area Removed (ha)
Boat Bay 9 4 Broughton 4,077 4,008 Burdwood Group 117 1 Catto Creek 847 847 Dzawadi/Klinaklini Estuary 2 2 Hunwadi / Ahnuhati – Bald 9,167 9,167 Hunwadi/Ahnuhati-Bald 10,787 10,787 Kingcome Estuary 28 28 Mahpahkum-Ahkwuna 881 699 Oogwewa'/Cape Caution 4,527 4,402 Polkinghorn Islands 149 119 Tsa-Latl/Smokehouse 179 179 Upper Klinaklini River 20,733 20,733 Wahkash Point 174 174 Wakeman Estuary 132 132
Conservancy
Waw Wat'l/Seymour Estuary 229 224 Subtotal 52,037 51,504
Adeane Point-mining 1,300 1,300 Hanson Island-head_lease 21 3 Inland Cape Caution-mining 1,965 1,965 Shelter Bay-mining 5,755 5,646
Biodiversity
Waump-mining 5,174 5,174
Subtotal 14,215 14,088
Total 66,252 65,592
5.1.7 Economically Inoperable In TSR 2, it was apparent that the existing operability assessment significantly understated the economic availability of timber on the TSA. To address this, The Kingcome TSA Economic Operability Study was completed in 2006 (Kingcome TSA Economic Operability Assessment Timberline, 2006). This model was applied to all commercial species including cottonwood and alder, and was based on a Value Index, i.e. the difference between timber values and delivered wood costs for each stand of timber. The model was based on 2006 delivered wood costs, 10 year median log price selling price table and representative log grade distributions. It was necessary to establish a Value Index threshold to determine profitability. Upon first consideration, it would seem logical to use the breakeven point (no profit or loss when the stand
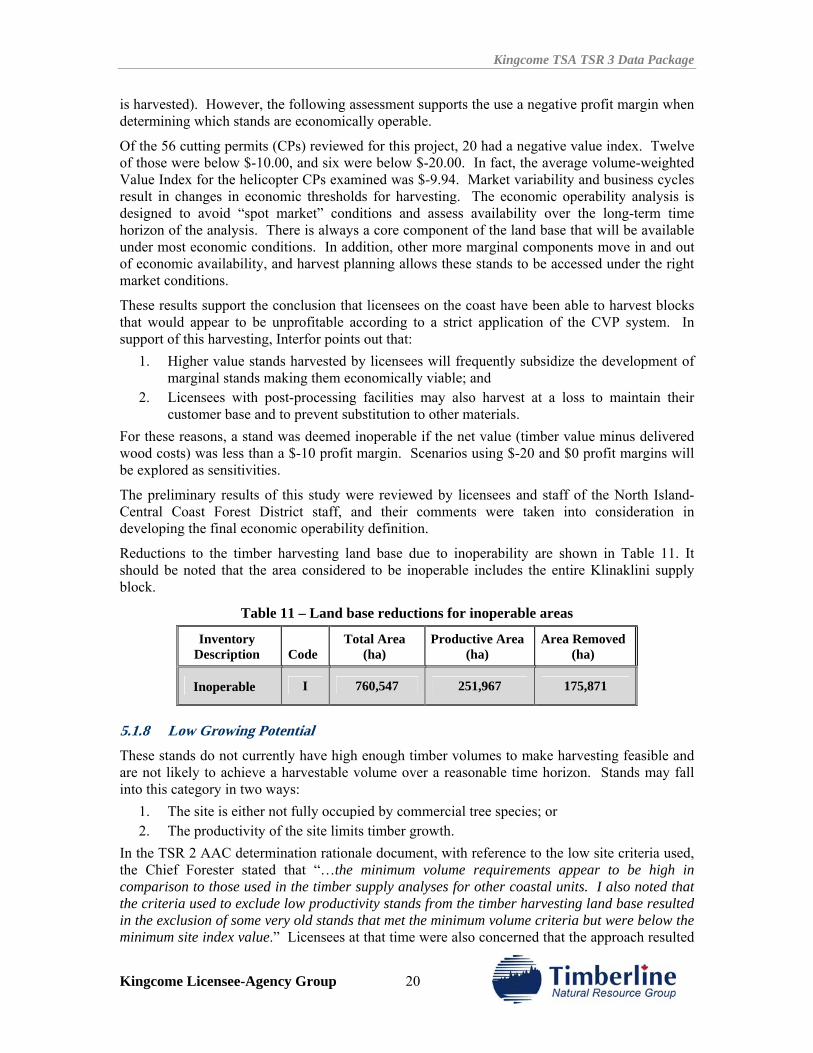
Kingcome TSA TSR 3 Data Package
Kingcome Licensee-Agency Group 20
is harvested). However, the following assessment supports the use a negative profit margin when determining which stands are economically operable.
Of the 56 cutting permits (CPs) reviewed for this project, 20 had a negative value index. Twelve of those were below $-10.00, and six were below $-20.00. In fact, the average volume-weighted Value Index for the helicopter CPs examined was $-9.94. Market variability and business cycles result in changes in economic thresholds for harvesting. The economic operability analysis is designed to avoid “spot market” conditions and assess availability over the long-term time horizon of the analysis. There is always a core component of the land base that will be available under most economic conditions. In addition, other more marginal components move in and out of economic availability, and harvest planning allows these stands to be accessed under the right market conditions.
These results support the conclusion that licensees on the coast have been able to harvest blocks that would appear to be unprofitable according to a strict application of the CVP system. In support of this harvesting, Interfor points out that:
1. Higher value stands harvested by licensees will frequently subsidize the development of marginal stands making them economically viable; and
2. Licensees with post-processing facilities may also harvest at a loss to maintain their customer base and to prevent substitution to other materials.
For these reasons, a stand was deemed inoperable if the net value (timber value minus delivered wood costs) was less than a $-10 profit margin. Scenarios using $-20 and $0 profit margins will be explored as sensitivities.
The preliminary results of this study were reviewed by licensees and staff of the North Island-Central Coast Forest District staff, and their comments were taken into consideration in developing the final economic operability definition.
Reductions to the timber harvesting land base due to inoperability are shown in Table 11. It should be noted that the area considered to be inoperable includes the entire Klinaklini supply block.
Table 11 – Land base reductions for inoperable areas
Inventory Description Code
Total Area (ha)
Productive Area(ha)
Area Removed (ha)
Inoperable I 760,547 251,967 175,871
5.1.8 Low Growing Potential These stands do not currently have high enough timber volumes to make harvesting feasible and are not likely to achieve a harvestable volume over a reasonable time horizon. Stands may fall into this category in two ways:
1. The site is either not fully occupied by commercial tree species; or 2. The productivity of the site limits timber growth.
In the TSR 2 AAC determination rationale document, with reference to the low site criteria used, the Chief Forester stated that “…the minimum volume requirements appear to be high in comparison to those used in the timber supply analyses for other coastal units. I also noted that the criteria used to exclude low productivity stands from the timber harvesting land base resulted in the exclusion of some very old stands that met the minimum volume criteria but were below the minimum site index value.” Licensees at that time were also concerned that the approach resulted
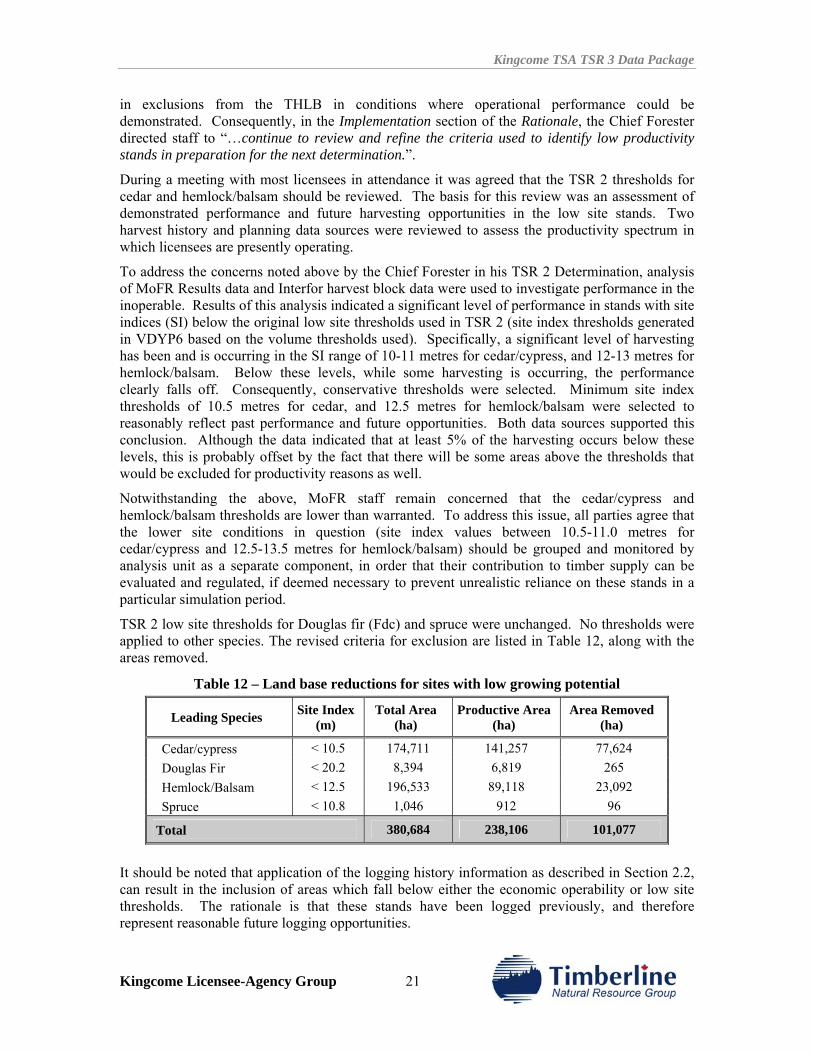
Kingcome TSA TSR 3 Data Package
Kingcome Licensee-Agency Group 21
in exclusions from the THLB in conditions where operational performance could be demonstrated. Consequently, in the Implementation section of the Rationale, the Chief Forester directed staff to “…continue to review and refine the criteria used to identify low productivity stands in preparation for the next determination.”.
During a meeting with most licensees in attendance it was agreed that the TSR 2 thresholds for cedar and hemlock/balsam should be reviewed. The basis for this review was an assessment of demonstrated performance and future harvesting opportunities in the low site stands. Two harvest history and planning data sources were reviewed to assess the productivity spectrum in which licensees are presently operating.
To address the concerns noted above by the Chief Forester in his TSR 2 Determination, analysis of MoFR Results data and Interfor harvest block data were used to investigate performance in the inoperable. Results of this analysis indicated a significant level of performance in stands with site indices (SI) below the original low site thresholds used in TSR 2 (site index thresholds generated in VDYP6 based on the volume thresholds used). Specifically, a significant level of harvesting has been and is occurring in the SI range of 10-11 metres for cedar/cypress, and 12-13 metres for hemlock/balsam. Below these levels, while some harvesting is occurring, the performance clearly falls off. Consequently, conservative thresholds were selected. Minimum site index thresholds of 10.5 metres for cedar, and 12.5 metres for hemlock/balsam were selected to reasonably reflect past performance and future opportunities. Both data sources supported this conclusion. Although the data indicated that at least 5% of the harvesting occurs below these levels, this is probably offset by the fact that there will be some areas above the thresholds that would be excluded for productivity reasons as well.
Notwithstanding the above, MoFR staff remain concerned that the cedar/cypress and hemlock/balsam thresholds are lower than warranted. To address this issue, all parties agree that the lower site conditions in question (site index values between 10.5-11.0 metres for cedar/cypress and 12.5-13.5 metres for hemlock/balsam) should be grouped and monitored by analysis unit as a separate component, in order that their contribution to timber supply can be evaluated and regulated, if deemed necessary to prevent unrealistic reliance on these stands in a particular simulation period.
TSR 2 low site thresholds for Douglas fir (Fdc) and spruce were unchanged. No thresholds were applied to other species. The revised criteria for exclusion are listed in Table 12, along with the areas removed.
Table 12 – Land base reductions for sites with low growing potential
Leading Species Site Index (m)
Total Area (ha)
Productive Area (ha)
Area Removed (ha)
Cedar/cypress < 10.5 174,711 141,257 77,624 Douglas Fir < 20.2 8,394 6,819 265 Hemlock/Balsam < 12.5 196,533 89,118 23,092 Spruce < 10.8 1,046 912 96
Total 380,684 238,106 101,077
It should be noted that application of the logging history information as described in Section 2.2, can result in the inclusion of areas which fall below either the economic operability or low site thresholds. The rationale is that these stands have been logged previously, and therefore represent reasonable future logging opportunities.
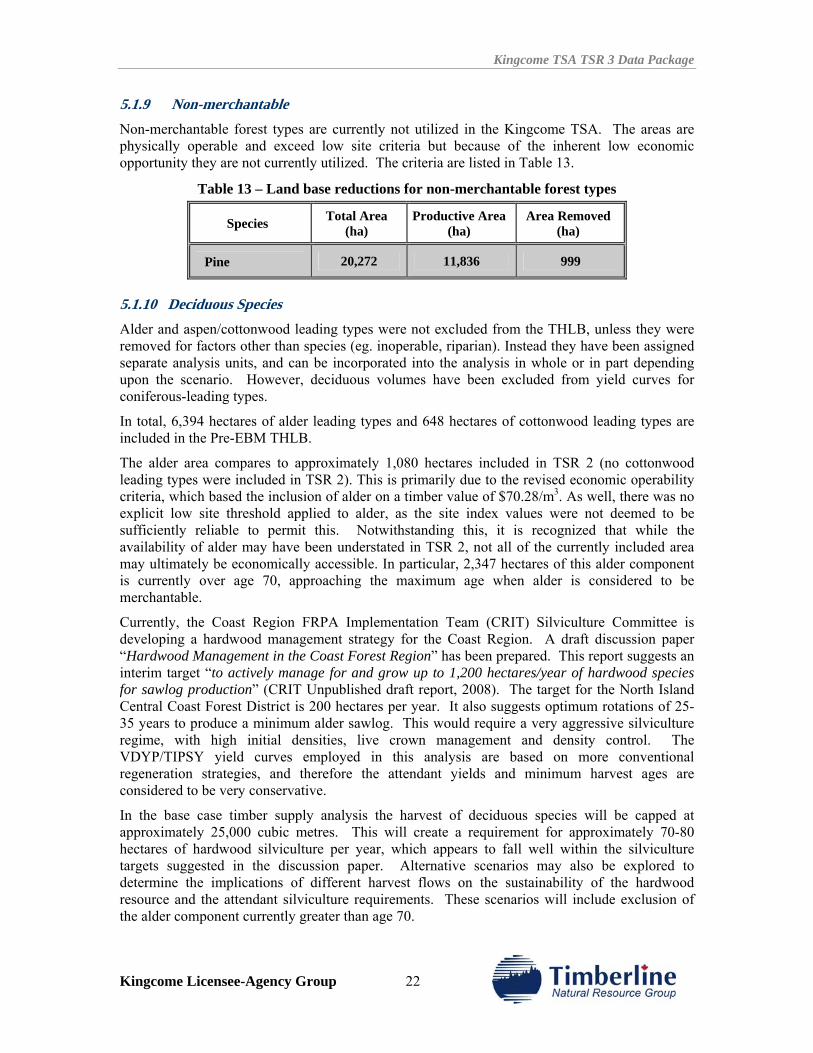
Kingcome TSA TSR 3 Data Package
Kingcome Licensee-Agency Group 22
5.1.9 Non-merchantable Non-merchantable forest types are currently not utilized in the Kingcome TSA. The areas are physically operable and exceed low site criteria but because of the inherent low economic opportunity they are not currently utilized. The criteria are listed in Table 13.
Table 13 – Land base reductions for non-merchantable forest types
Species Total Area (ha)
Productive Area (ha)
Area Removed (ha)
Pine 20,272 11,836 999
5.1.10 Deciduous Species Alder and aspen/cottonwood leading types were not excluded from the THLB, unless they were removed for factors other than species (eg. inoperable, riparian). Instead they have been assigned separate analysis units, and can be incorporated into the analysis in whole or in part depending upon the scenario. However, deciduous volumes have been excluded from yield curves for coniferous-leading types.
In total, 6,394 hectares of alder leading types and 648 hectares of cottonwood leading types are included in the Pre-EBM THLB.
The alder area compares to approximately 1,080 hectares included in TSR 2 (no cottonwood leading types were included in TSR 2). This is primarily due to the revised economic operability criteria, which based the inclusion of alder on a timber value of $70.28/m3. As well, there was no explicit low site threshold applied to alder, as the site index values were not deemed to be sufficiently reliable to permit this. Notwithstanding this, it is recognized that while the availability of alder may have been understated in TSR 2, not all of the currently included area may ultimately be economically accessible. In particular, 2,347 hectares of this alder component is currently over age 70, approaching the maximum age when alder is considered to be merchantable.
Currently, the Coast Region FRPA Implementation Team (CRIT) Silviculture Committee is developing a hardwood management strategy for the Coast Region. A draft discussion paper “Hardwood Management in the Coast Forest Region” has been prepared. This report suggests an interim target “to actively manage for and grow up to 1,200 hectares/year of hardwood species for sawlog production” (CRIT Unpublished draft report, 2008). The target for the North Island Central Coast Forest District is 200 hectares per year. It also suggests optimum rotations of 25-35 years to produce a minimum alder sawlog. This would require a very aggressive silviculture regime, with high initial densities, live crown management and density control. The VDYP/TIPSY yield curves employed in this analysis are based on more conventional regeneration strategies, and therefore the attendant yields and minimum harvest ages are considered to be very conservative.
In the base case timber supply analysis the harvest of deciduous species will be capped at approximately 25,000 cubic metres. This will create a requirement for approximately 70-80 hectares of hardwood silviculture per year, which appears to fall well within the silviculture targets suggested in the discussion paper. Alternative scenarios may also be explored to determine the implications of different harvest flows on the sustainability of the hardwood resource and the attendant silviculture requirements. These scenarios will include exclusion of the alder component currently greater than age 70.
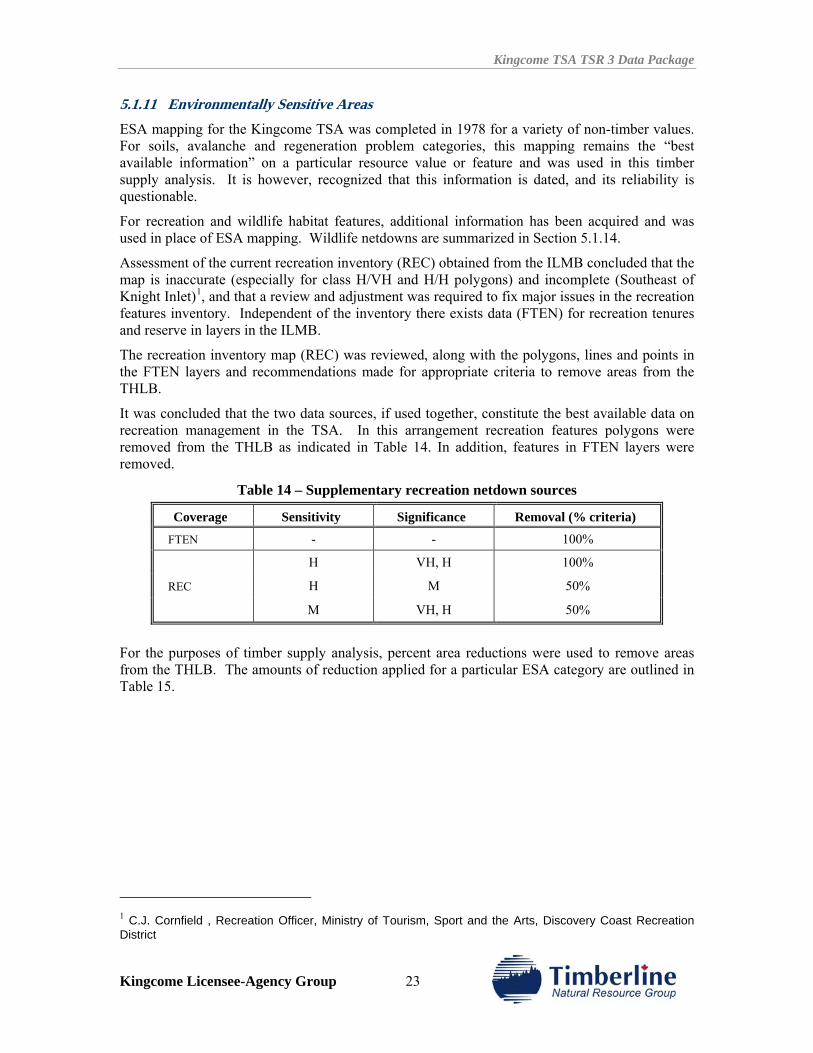
Kingcome TSA TSR 3 Data Package
Kingcome Licensee-Agency Group 23
5.1.11 Environmentally Sensitive Areas ESA mapping for the Kingcome TSA was completed in 1978 for a variety of non-timber values. For soils, avalanche and regeneration problem categories, this mapping remains the “best available information” on a particular resource value or feature and was used in this timber supply analysis. It is however, recognized that this information is dated, and its reliability is questionable.
For recreation and wildlife habitat features, additional information has been acquired and was used in place of ESA mapping. Wildlife netdowns are summarized in Section 5.1.14.
Assessment of the current recreation inventory (REC) obtained from the ILMB concluded that the map is inaccurate (especially for class H/VH and H/H polygons) and incomplete (Southeast of Knight Inlet)1, and that a review and adjustment was required to fix major issues in the recreation features inventory. Independent of the inventory there exists data (FTEN) for recreation tenures and reserve in layers in the ILMB.
The recreation inventory map (REC) was reviewed, along with the polygons, lines and points in the FTEN layers and recommendations made for appropriate criteria to remove areas from the THLB.
It was concluded that the two data sources, if used together, constitute the best available data on recreation management in the TSA. In this arrangement recreation features polygons were removed from the THLB as indicated in Table 14. In addition, features in FTEN layers were removed.
Table 14 – Supplementary recreation netdown sources
Coverage Sensitivity Significance Removal (% criteria)
FTEN - - 100%
H VH, H 100%
REC H M 50%
M VH, H 50%
For the purposes of timber supply analysis, percent area reductions were used to remove areas from the THLB. The amounts of reduction applied for a particular ESA category are outlined in Table 15.
1 C.J. Cornfield , Recreation Officer, Ministry of Tourism, Sport and the Arts, Discovery Coast Recreation District
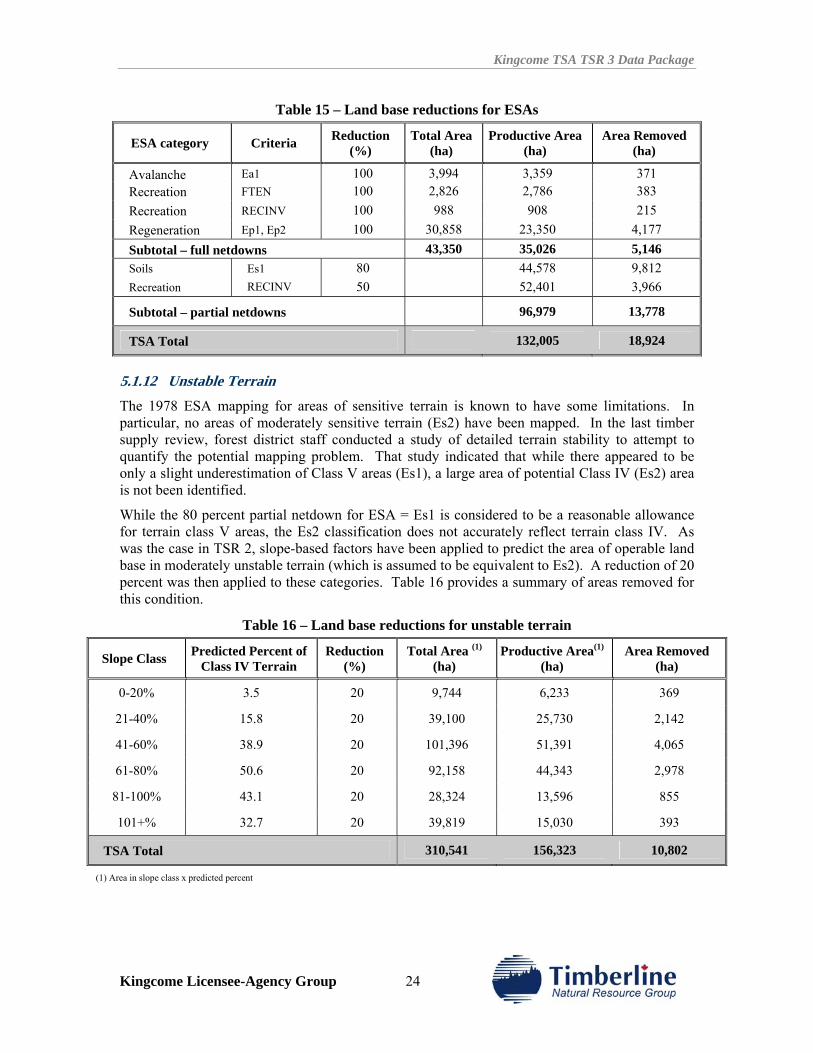
Kingcome TSA TSR 3 Data Package
Kingcome Licensee-Agency Group 24
Table 15 – Land base reductions for ESAs
ESA category Criteria Reduction (%)
Total Area (ha)
Productive Area (ha)
Area Removed (ha)
Avalanche Ea1 100 3,994 3,359 371 Recreation FTEN 100 2,826 2,786 383 Recreation RECINV 100 988 908 215 Regeneration Ep1, Ep2 100 30,858 23,350 4,177 Subtotal – full netdowns 43,350 35,026 5,146 Soils Es1 80 44,578 9,812 Recreation RECINV 50 52,401 3,966
Subtotal – partial netdowns 96,979 13,778
TSA Total 132,005 18,924
5.1.12 Unstable Terrain The 1978 ESA mapping for areas of sensitive terrain is known to have some limitations. In particular, no areas of moderately sensitive terrain (Es2) have been mapped. In the last timber supply review, forest district staff conducted a study of detailed terrain stability to attempt to quantify the potential mapping problem. That study indicated that while there appeared to be only a slight underestimation of Class V areas (Es1), a large area of potential Class IV (Es2) area is not been identified.
While the 80 percent partial netdown for ESA = Es1 is considered to be a reasonable allowance for terrain class V areas, the Es2 classification does not accurately reflect terrain class IV. As was the case in TSR 2, slope-based factors have been applied to predict the area of operable land base in moderately unstable terrain (which is assumed to be equivalent to Es2). A reduction of 20 percent was then applied to these categories. Table 16 provides a summary of areas removed for this condition.
Table 16 – Land base reductions for unstable terrain
Slope Class Predicted Percent of Class IV Terrain
Reduction (%)
Total Area (1)
(ha) Productive Area(1)
(ha) Area Removed
(ha)
0-20% 3.5 20 9,744 6,233 369
21-40% 15.8 20 39,100 25,730 2,142
41-60% 38.9 20 101,396 51,391 4,065
61-80% 50.6 20 92,158 44,343 2,978
81-100% 43.1 20 28,324 13,596 855
101+% 32.7 20 39,819 15,030 393
TSA Total 310,541 156,323 10,802
(1) Area in slope class x predicted percent
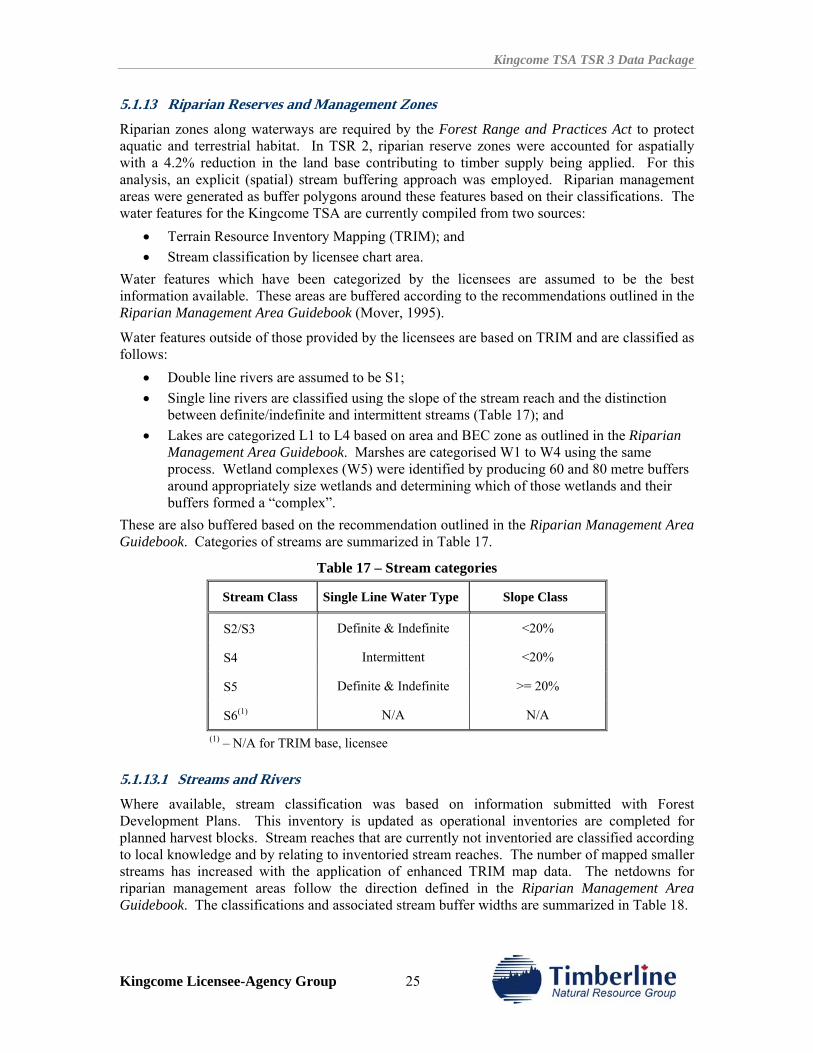
Kingcome TSA TSR 3 Data Package
Kingcome Licensee-Agency Group 25
5.1.13 Riparian Reserves and Management Zones Riparian zones along waterways are required by the Forest Range and Practices Act to protect aquatic and terrestrial habitat. In TSR 2, riparian reserve zones were accounted for aspatially with a 4.2% reduction in the land base contributing to timber supply being applied. For this analysis, an explicit (spatial) stream buffering approach was employed. Riparian management areas were generated as buffer polygons around these features based on their classifications. The water features for the Kingcome TSA are currently compiled from two sources:
• Terrain Resource Inventory Mapping (TRIM); and • Stream classification by licensee chart area.
Water features which have been categorized by the licensees are assumed to be the best information available. These areas are buffered according to the recommendations outlined in the Riparian Management Area Guidebook (Mover, 1995).
Water features outside of those provided by the licensees are based on TRIM and are classified as follows:
• Double line rivers are assumed to be S1; • Single line rivers are classified using the slope of the stream reach and the distinction
between definite/indefinite and intermittent streams (Table 17); and • Lakes are categorized L1 to L4 based on area and BEC zone as outlined in the Riparian
Management Area Guidebook. Marshes are categorised W1 to W4 using the same process. Wetland complexes (W5) were identified by producing 60 and 80 metre buffers around appropriately size wetlands and determining which of those wetlands and their buffers formed a “complex”.
These are also buffered based on the recommendation outlined in the Riparian Management Area Guidebook. Categories of streams are summarized in Table 17.
Table 17 – Stream categories
Stream Class Single Line Water Type Slope Class
S2/S3 Definite & Indefinite <20%
S4 Intermittent <20%
S5 Definite & Indefinite >= 20%
S6(1) N/A N/A
(1) – N/A for TRIM base, licensee
5.1.13.1 Streams and Rivers Where available, stream classification was based on information submitted with Forest Development Plans. This inventory is updated as operational inventories are completed for planned harvest blocks. Stream reaches that are currently not inventoried are classified according to local knowledge and by relating to inventoried stream reaches. The number of mapped smaller streams has increased with the application of enhanced TRIM map data. The netdowns for riparian management areas follow the direction defined in the Riparian Management Area Guidebook. The classifications and associated stream buffer widths are summarized in Table 18.
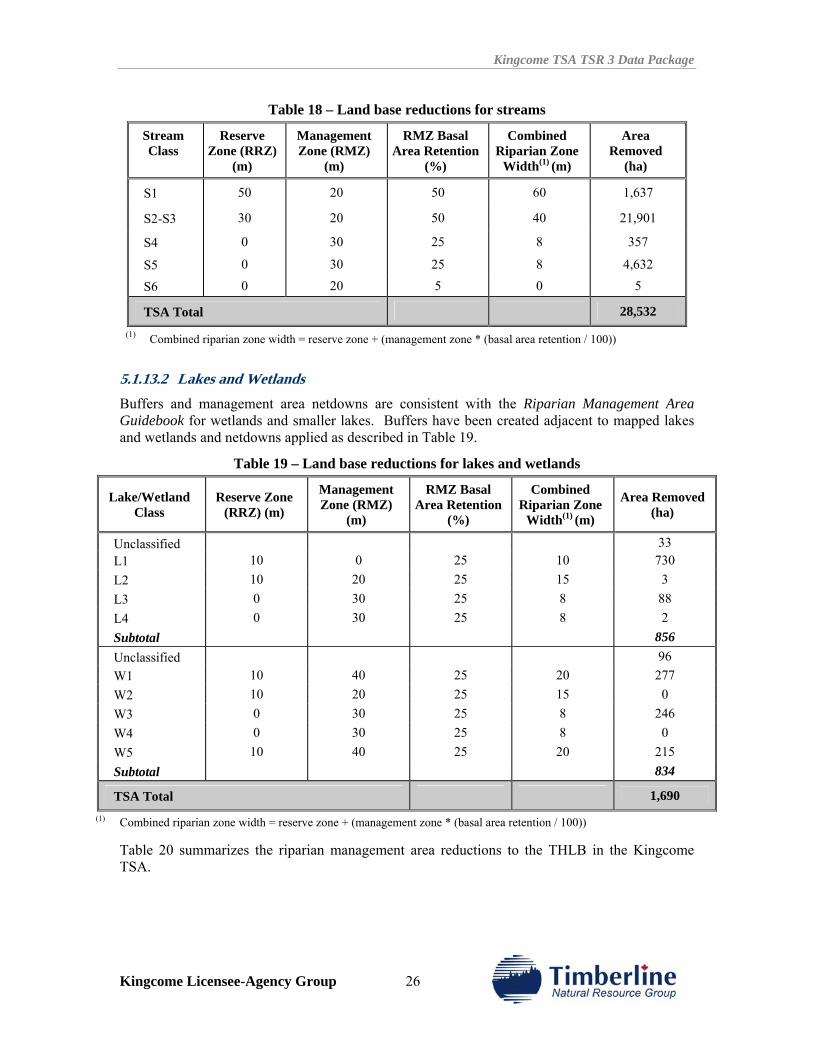
Kingcome TSA TSR 3 Data Package
Kingcome Licensee-Agency Group 26
Table 18 – Land base reductions for streams
Stream Class
Reserve Zone (RRZ)
(m)
Management Zone (RMZ)
(m)
RMZ Basal Area Retention
(%)
Combined Riparian Zone
Width(1) (m)
Area Removed
(ha)
S1 50 20 50 60 1,637
S2-S3 30 20 50 40 21,901
S4 0 30 25 8 357
S5 0 30 25 8 4,632
S6 0 20 5 0 5
TSA Total 28,532 (1) Combined riparian zone width = reserve zone + (management zone * (basal area retention / 100))
5.1.13.2 Lakes and Wetlands Buffers and management area netdowns are consistent with the Riparian Management Area Guidebook for wetlands and smaller lakes. Buffers have been created adjacent to mapped lakes and wetlands and netdowns applied as described in Table 19.
Table 19 – Land base reductions for lakes and wetlands
Lake/Wetland Class
Reserve Zone (RRZ) (m)
Management Zone (RMZ)
(m)
RMZ Basal Area Retention
(%)
Combined Riparian Zone
Width(1) (m)
Area Removed (ha)
Unclassified 33 L1 10 0 25 10 730 L2 10 20 25 15 3 L3 0 30 25 8 88 L4 0 30 25 8 2 Subtotal 856 Unclassified 96 W1 10 40 25 20 277 W2 10 20 25 15 0 W3 0 30 25 8 246 W4 0 30 25 8 0 W5 10 40 25 20 215 Subtotal 834
TSA Total 1,690 (1) Combined riparian zone width = reserve zone + (management zone * (basal area retention / 100))
Table 20 summarizes the riparian management area reductions to the THLB in the Kingcome TSA.
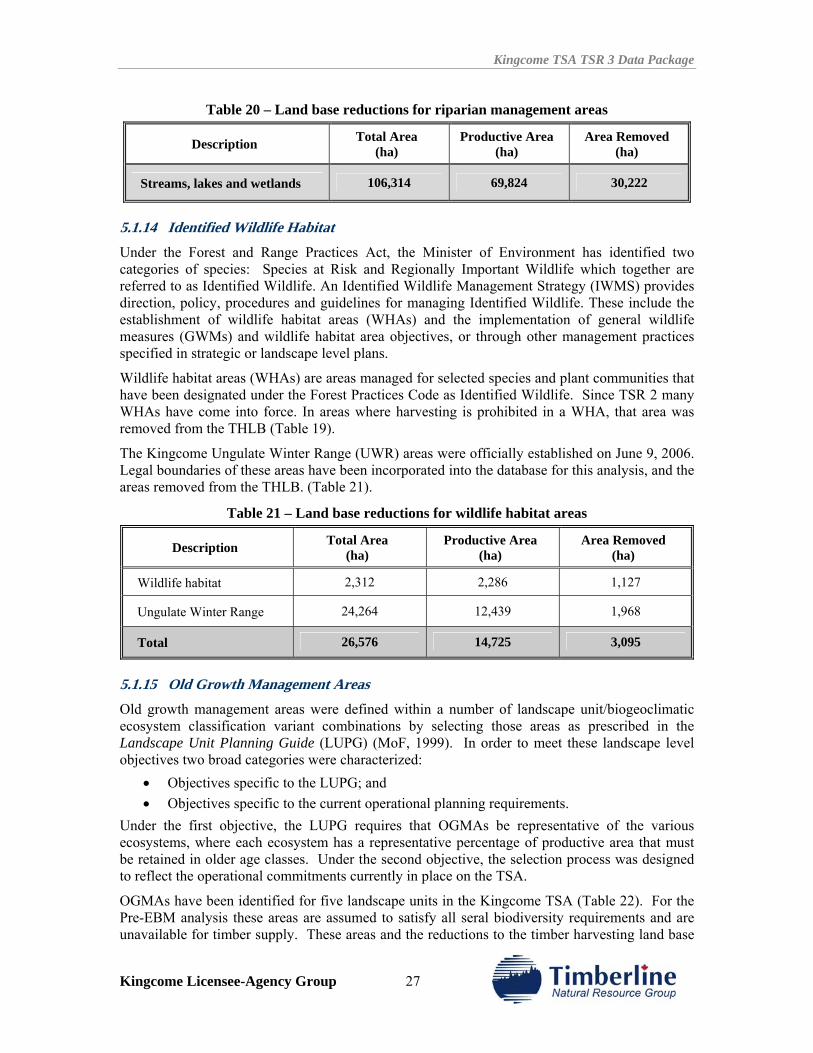
Kingcome TSA TSR 3 Data Package
Kingcome Licensee-Agency Group 27
Table 20 – Land base reductions for riparian management areas
Description Total Area (ha)
Productive Area (ha)
Area Removed (ha)
Streams, lakes and wetlands 106,314 69,824 30,222
5.1.14 Identified Wildlife Habitat Under the Forest and Range Practices Act, the Minister of Environment has identified two categories of species: Species at Risk and Regionally Important Wildlife which together are referred to as Identified Wildlife. An Identified Wildlife Management Strategy (IWMS) provides direction, policy, procedures and guidelines for managing Identified Wildlife. These include the establishment of wildlife habitat areas (WHAs) and the implementation of general wildlife measures (GWMs) and wildlife habitat area objectives, or through other management practices specified in strategic or landscape level plans.
Wildlife habitat areas (WHAs) are areas managed for selected species and plant communities that have been designated under the Forest Practices Code as Identified Wildlife. Since TSR 2 many WHAs have come into force. In areas where harvesting is prohibited in a WHA, that area was removed from the THLB (Table 19).
The Kingcome Ungulate Winter Range (UWR) areas were officially established on June 9, 2006. Legal boundaries of these areas have been incorporated into the database for this analysis, and the areas removed from the THLB. (Table 21).
Table 21 – Land base reductions for wildlife habitat areas
Description Total Area (ha)
Productive Area (ha)
Area Removed (ha)
Wildlife habitat 2,312 2,286 1,127
Ungulate Winter Range 24,264 12,439 1,968
Total 26,576 14,725 3,095
5.1.15 Old Growth Management Areas Old growth management areas were defined within a number of landscape unit/biogeoclimatic ecosystem classification variant combinations by selecting those areas as prescribed in the Landscape Unit Planning Guide (LUPG) (MoF, 1999). In order to meet these landscape level objectives two broad categories were characterized:
• Objectives specific to the LUPG; and • Objectives specific to the current operational planning requirements.
Under the first objective, the LUPG requires that OGMAs be representative of the various ecosystems, where each ecosystem has a representative percentage of productive area that must be retained in older age classes. Under the second objective, the selection process was designed to reflect the operational commitments currently in place on the TSA.
OGMAs have been identified for five landscape units in the Kingcome TSA (Table 22). For the Pre-EBM analysis these areas are assumed to satisfy all seral biodiversity requirements and are unavailable for timber supply. These areas and the reductions to the timber harvesting land base
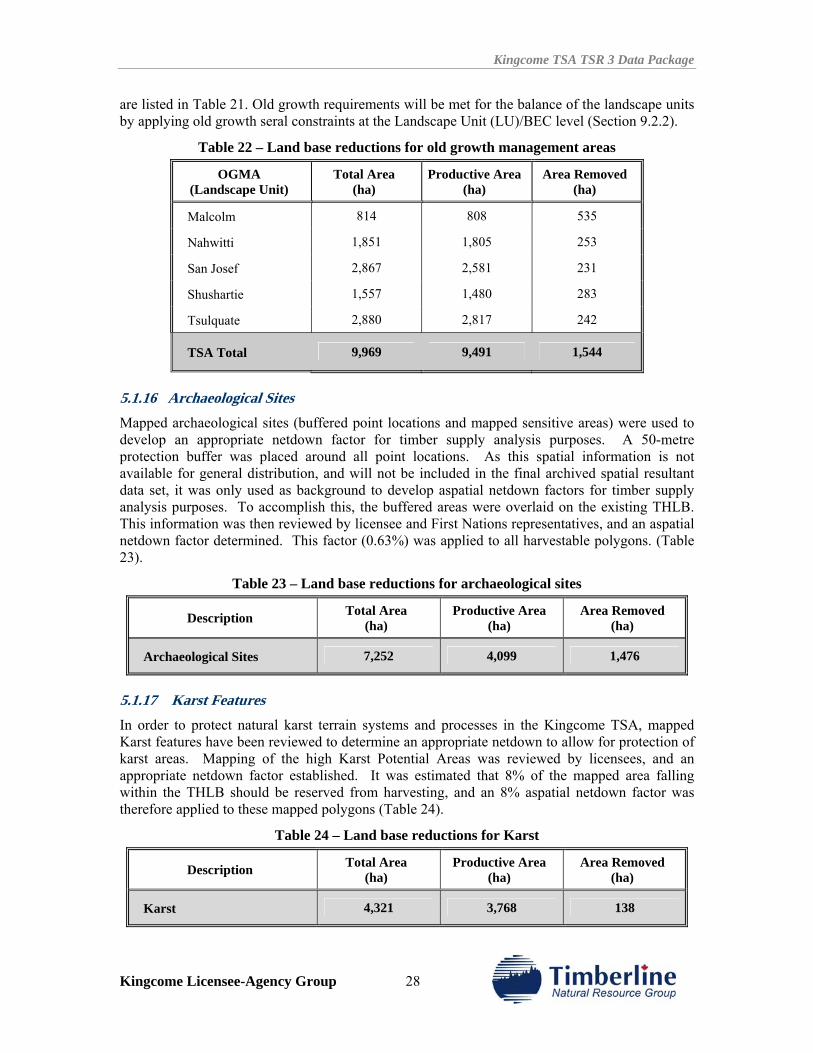
Kingcome TSA TSR 3 Data Package
Kingcome Licensee-Agency Group 28
are listed in Table 21. Old growth requirements will be met for the balance of the landscape units by applying old growth seral constraints at the Landscape Unit (LU)/BEC level (Section 9.2.2).
Table 22 – Land base reductions for old growth management areas
OGMA (Landscape Unit)
Total Area (ha)
Productive Area (ha)
Area Removed (ha)
Malcolm 814 808 535
Nahwitti 1,851 1,805 253
San Josef 2,867 2,581 231
Shushartie 1,557 1,480 283
Tsulquate 2,880 2,817 242
TSA Total 9,969 9,491 1,544
5.1.16 Archaeological Sites Mapped archaeological sites (buffered point locations and mapped sensitive areas) were used to develop an appropriate netdown factor for timber supply analysis purposes. A 50-metre protection buffer was placed around all point locations. As this spatial information is not available for general distribution, and will not be included in the final archived spatial resultant data set, it was only used as background to develop aspatial netdown factors for timber supply analysis purposes. To accomplish this, the buffered areas were overlaid on the existing THLB. This information was then reviewed by licensee and First Nations representatives, and an aspatial netdown factor determined. This factor (0.63%) was applied to all harvestable polygons. (Table 23).
Table 23 – Land base reductions for archaeological sites
Description Total Area (ha)
Productive Area (ha)
Area Removed (ha)
Archaeological Sites 7,252 4,099 1,476
5.1.17 Karst Features In order to protect natural karst terrain systems and processes in the Kingcome TSA, mapped Karst features have been reviewed to determine an appropriate netdown to allow for protection of karst areas. Mapping of the high Karst Potential Areas was reviewed by licensees, and an appropriate netdown factor established. It was estimated that 8% of the mapped area falling within the THLB should be reserved from harvesting, and an 8% aspatial netdown factor was therefore applied to these mapped polygons (Table 24).
Table 24 – Land base reductions for Karst
Description Total Area (ha)
Productive Area (ha)
Area Removed (ha)
Karst 4,321 3,768 138
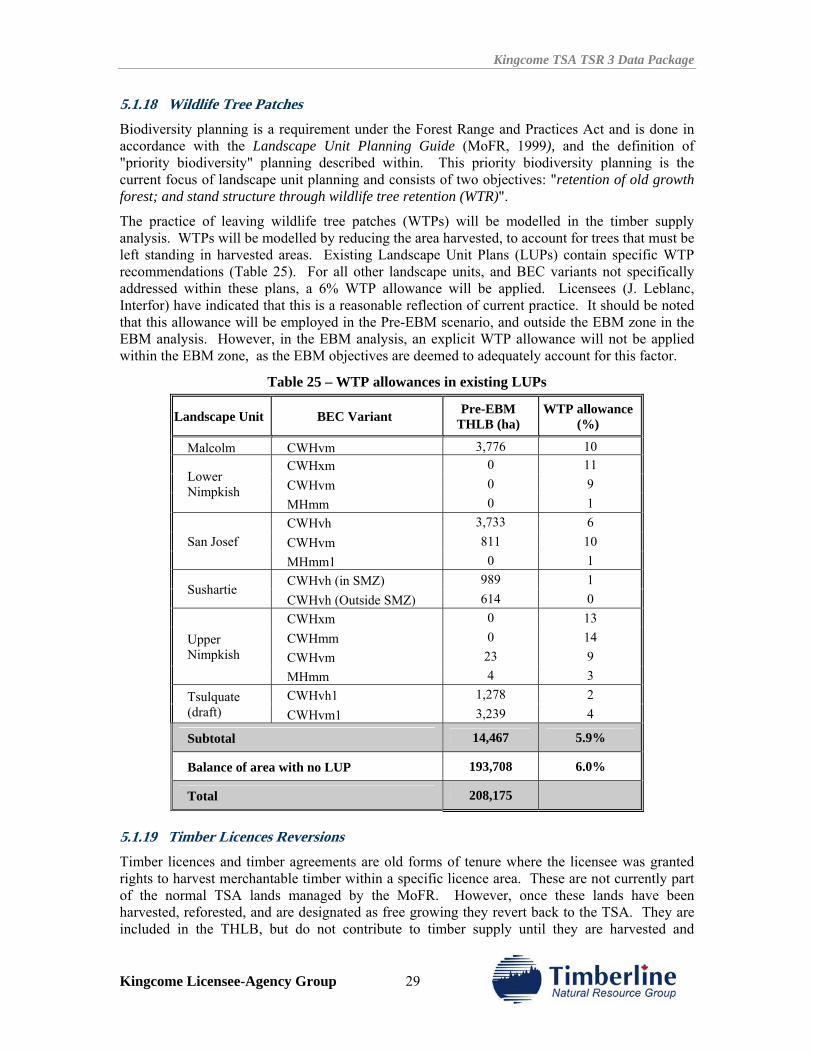
Kingcome TSA TSR 3 Data Package
Kingcome Licensee-Agency Group 29
5.1.18 Wildlife Tree Patches Biodiversity planning is a requirement under the Forest Range and Practices Act and is done in accordance with the Landscape Unit Planning Guide (MoFR, 1999), and the definition of "priority biodiversity" planning described within. This priority biodiversity planning is the current focus of landscape unit planning and consists of two objectives: "retention of old growth forest; and stand structure through wildlife tree retention (WTR)".
The practice of leaving wildlife tree patches (WTPs) will be modelled in the timber supply analysis. WTPs will be modelled by reducing the area harvested, to account for trees that must be left standing in harvested areas. Existing Landscape Unit Plans (LUPs) contain specific WTP recommendations (Table 25). For all other landscape units, and BEC variants not specifically addressed within these plans, a 6% WTP allowance will be applied. Licensees (J. Leblanc, Interfor) have indicated that this is a reasonable reflection of current practice. It should be noted that this allowance will be employed in the Pre-EBM scenario, and outside the EBM zone in the EBM analysis. However, in the EBM analysis, an explicit WTP allowance will not be applied within the EBM zone, as the EBM objectives are deemed to adequately account for this factor.
Table 25 – WTP allowances in existing LUPs
Landscape Unit BEC Variant Pre-EBM THLB (ha)
WTP allowance (%)
Malcolm CWHvm 3,776 10 CWHxm 0 11 CWHvm 0 9 Lower
Nimpkish MHmm 0 1 CWHvh 3,733 6 CWHvm 811 10 San Josef MHmm1 0 1 CWHvh (in SMZ) 989 1
Sushartie CWHvh (Outside SMZ) 614 0 CWHxm 0 13 CWHmm 0 14 CWHvm 23 9
Upper Nimpkish
MHmm 4 3 CWHvh1 1,278 2 Tsulquate
(draft) CWHvm1 3,239 4
Subtotal 14,467 5.9%
Balance of area with no LUP 193,708 6.0%
Total 208,175
5.1.19 Timber Licences Reversions Timber licences and timber agreements are old forms of tenure where the licensee was granted rights to harvest merchantable timber within a specific licence area. These are not currently part of the normal TSA lands managed by the MoFR. However, once these lands have been harvested, reforested, and are designated as free growing they revert back to the TSA. They are included in the THLB, but do not contribute to timber supply until they are harvested and
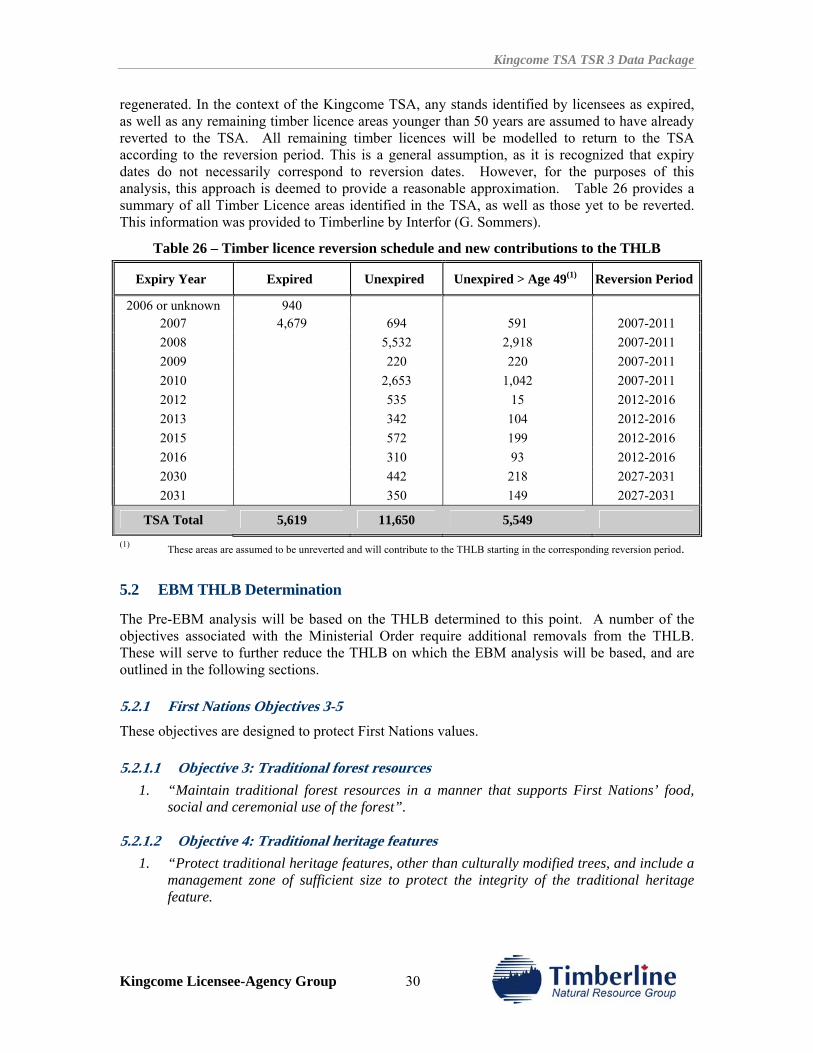
Kingcome TSA TSR 3 Data Package
Kingcome Licensee-Agency Group 30
regenerated. In the context of the Kingcome TSA, any stands identified by licensees as expired, as well as any remaining timber licence areas younger than 50 years are assumed to have already reverted to the TSA. All remaining timber licences will be modelled to return to the TSA according to the reversion period. This is a general assumption, as it is recognized that expiry dates do not necessarily correspond to reversion dates. However, for the purposes of this analysis, this approach is deemed to provide a reasonable approximation. Table 26 provides a summary of all Timber Licence areas identified in the TSA, as well as those yet to be reverted. This information was provided to Timberline by Interfor (G. Sommers).
Table 26 – Timber licence reversion schedule and new contributions to the THLB
Expiry Year Expired Unexpired Unexpired > Age 49(1) Reversion Period
2006 or unknown 940 2007 4,679 694 591 2007-2011 2008 5,532 2,918 2007-2011 2009 220 220 2007-2011 2010 2,653 1,042 2007-2011 2012 535 15 2012-2016 2013 342 104 2012-2016 2015 572 199 2012-2016 2016 310 93 2012-2016 2030 442 218 2027-2031 2031 350 149 2027-2031
TSA Total 5,619 11,650 5,549
(1) These areas are assumed to be unreverted and will contribute to the THLB starting in the corresponding reversion period.
5.2 EBM THLB Determination
The Pre-EBM analysis will be based on the THLB determined to this point. A number of the objectives associated with the Ministerial Order require additional removals from the THLB. These will serve to further reduce the THLB on which the EBM analysis will be based, and are outlined in the following sections.
5.2.1 First Nations Objectives 3-5 These objectives are designed to protect First Nations values.
5.2.1.1 Objective 3: Traditional forest resources 1. “Maintain traditional forest resources in a manner that supports First Nations’ food,
social and ceremonial use of the forest”.
5.2.1.2 Objective 4: Traditional heritage features 1. “Protect traditional heritage features, other than culturally modified trees, and include a
management zone of sufficient size to protect the integrity of the traditional heritage feature.
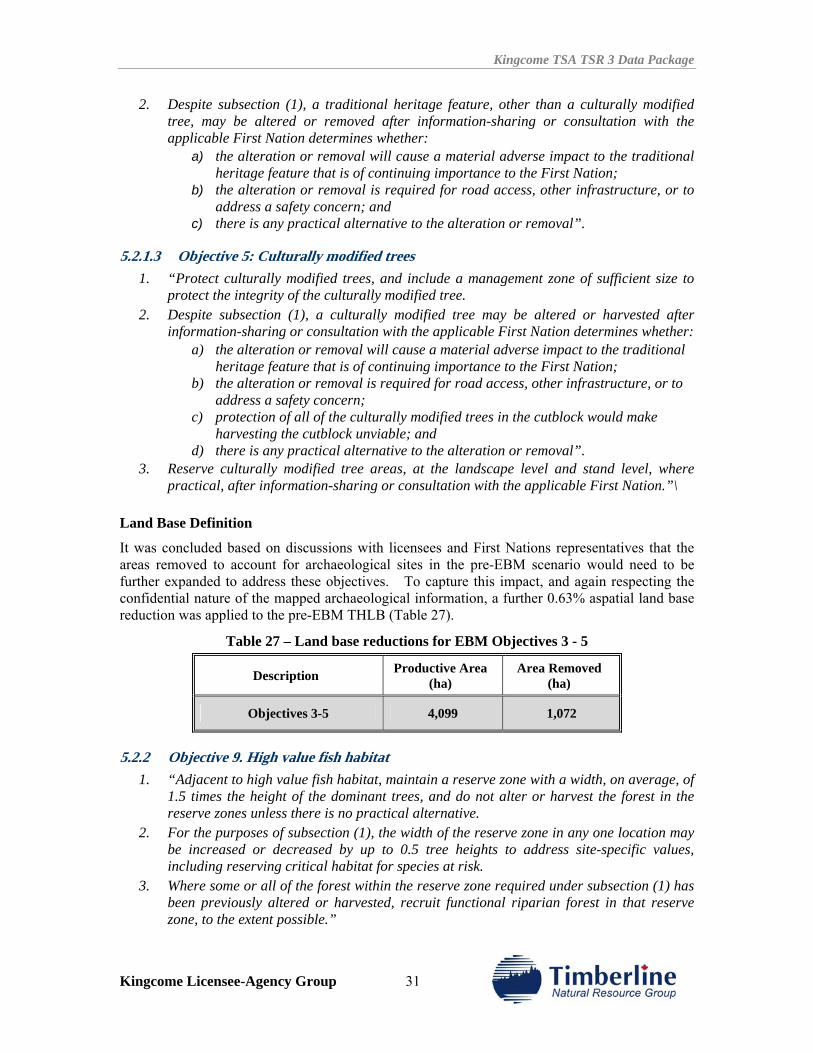
Kingcome TSA TSR 3 Data Package
Kingcome Licensee-Agency Group 31
2. Despite subsection (1), a traditional heritage feature, other than a culturally modified tree, may be altered or removed after information-sharing or consultation with the applicable First Nation determines whether:
a) the alteration or removal will cause a material adverse impact to the traditional heritage feature that is of continuing importance to the First Nation;
b) the alteration or removal is required for road access, other infrastructure, or to address a safety concern; and
c) there is any practical alternative to the alteration or removal”.
5.2.1.3 Objective 5: Culturally modified trees 1. “Protect culturally modified trees, and include a management zone of sufficient size to
protect the integrity of the culturally modified tree. 2. Despite subsection (1), a culturally modified tree may be altered or harvested after
information-sharing or consultation with the applicable First Nation determines whether: a) the alteration or removal will cause a material adverse impact to the traditional
heritage feature that is of continuing importance to the First Nation; b) the alteration or removal is required for road access, other infrastructure, or to
address a safety concern; c) protection of all of the culturally modified trees in the cutblock would make
harvesting the cutblock unviable; and d) there is any practical alternative to the alteration or removal”.
3. Reserve culturally modified tree areas, at the landscape level and stand level, where practical, after information-sharing or consultation with the applicable First Nation.”\
Land Base Definition
It was concluded based on discussions with licensees and First Nations representatives that the areas removed to account for archaeological sites in the pre-EBM scenario would need to be further expanded to address these objectives. To capture this impact, and again respecting the confidential nature of the mapped archaeological information, a further 0.63% aspatial land base reduction was applied to the pre-EBM THLB (Table 27).
Table 27 – Land base reductions for EBM Objectives 3 - 5
Description Productive Area (ha)
Area Removed (ha)
Objectives 3-5 4,099 1,072
5.2.2 Objective 9. High value fish habitat 1. “Adjacent to high value fish habitat, maintain a reserve zone with a width, on average, of
1.5 times the height of the dominant trees, and do not alter or harvest the forest in the reserve zones unless there is no practical alternative.
2. For the purposes of subsection (1), the width of the reserve zone in any one location may be increased or decreased by up to 0.5 tree heights to address site-specific values, including reserving critical habitat for species at risk.
3. Where some or all of the forest within the reserve zone required under subsection (1) has been previously altered or harvested, recruit functional riparian forest in that reserve zone, to the extent possible.”
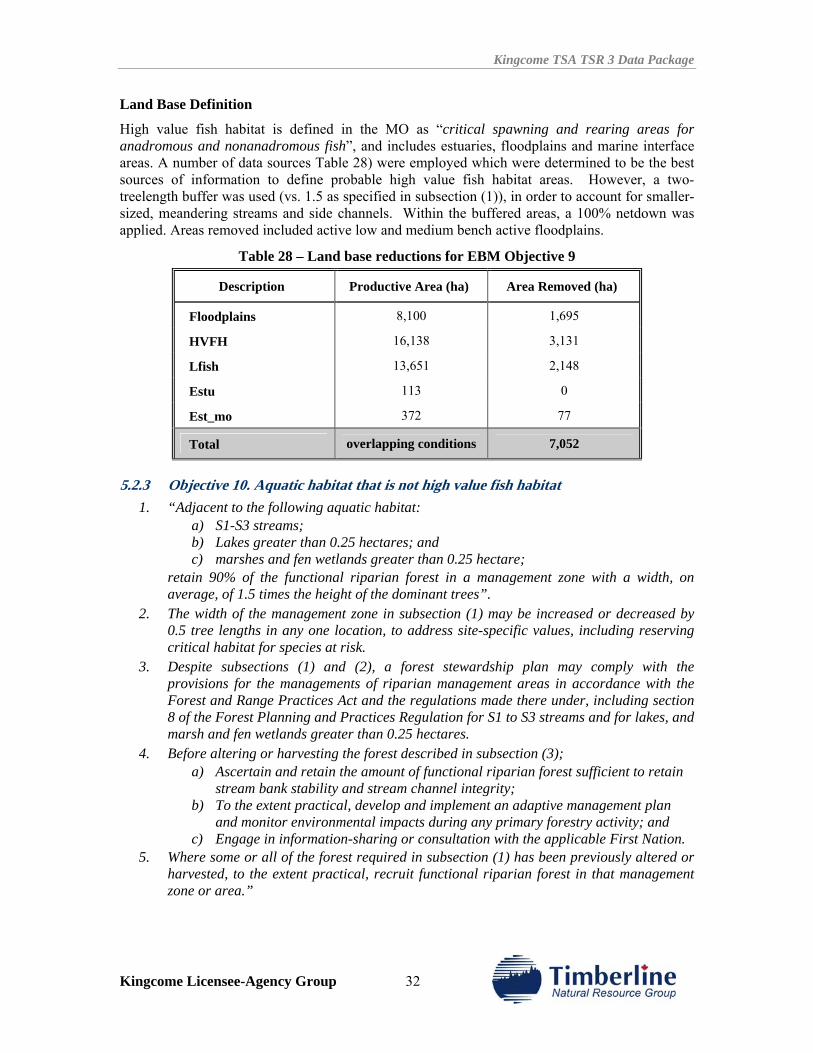
Kingcome TSA TSR 3 Data Package
Kingcome Licensee-Agency Group 32
Land Base Definition
High value fish habitat is defined in the MO as “critical spawning and rearing areas for anadromous and nonanadromous fish”, and includes estuaries, floodplains and marine interface areas. A number of data sources Table 28) were employed which were determined to be the best sources of information to define probable high value fish habitat areas. However, a two-treelength buffer was used (vs. 1.5 as specified in subsection (1)), in order to account for smaller-sized, meandering streams and side channels. Within the buffered areas, a 100% netdown was applied. Areas removed included active low and medium bench active floodplains.
Table 28 – Land base reductions for EBM Objective 9
Description Productive Area (ha) Area Removed (ha)
Floodplains 8,100 1,695
HVFH 16,138 3,131
Lfish 13,651 2,148
Estu 113 0
Est_mo 372 77
Total overlapping conditions 7,052
5.2.3 Objective 10. Aquatic habitat that is not high value fish habitat 1. “Adjacent to the following aquatic habitat:
a) S1-S3 streams; b) Lakes greater than 0.25 hectares; and c) marshes and fen wetlands greater than 0.25 hectare;
retain 90% of the functional riparian forest in a management zone with a width, on average, of 1.5 times the height of the dominant trees”.
2. The width of the management zone in subsection (1) may be increased or decreased by 0.5 tree lengths in any one location, to address site-specific values, including reserving critical habitat for species at risk.
3. Despite subsections (1) and (2), a forest stewardship plan may comply with the provisions for the managements of riparian management areas in accordance with the Forest and Range Practices Act and the regulations made there under, including section 8 of the Forest Planning and Practices Regulation for S1 to S3 streams and for lakes, and marsh and fen wetlands greater than 0.25 hectares.
4. Before altering or harvesting the forest described in subsection (3); a) Ascertain and retain the amount of functional riparian forest sufficient to retain
stream bank stability and stream channel integrity; b) To the extent practical, develop and implement an adaptive management plan
and monitor environmental impacts during any primary forestry activity; and c) Engage in information-sharing or consultation with the applicable First Nation.
5. Where some or all of the forest required in subsection (1) has been previously altered or harvested, to the extent practical, recruit functional riparian forest in that management zone or area.”
Kingcome TSA TSR 3 Data Package
Kingcome Licensee-Agency Group 33
Land Base Definition
Buffers were defined as specified in subsection (1) from TRIM features. A buffer width of 1.35 times tree height was used (0.9 x 1.5). A 100% netdown was applied within these defined riparian buffers (Table 29).
Table 29 – Land base reductions for EBM Objective 10
Description Productive Area (ha)
Area Removed (ha)
Not High Value Fish Habitat 30,711 1,462
5.2.4 Objective 11. Forested swamps 1. “Adjacent to forested swamps greater than 0.25 hectares, retain 70% of the functional
riparian forest in a management zone with a width, on average, equal to 1.5 times the height of the dominant trees.
2. For the purposes of subsection (1), the width of the management zone in any one location may be increased or decreased by 0.5 tree lengths, to address site-specific values, including reserving critical habitat for species at risk.
3. Despite subsection (1), an additional 10% of the forest in the management zone adjacent to the forested swamp may be altered or harvested where:
a) alteration or removal is required for road access, other infrastructure, or to address a safety concern; or
b) where 70% retention would make harvesting the cutblocks economically unviable.
4. Before altering or harvesting the forest pursuant to subsection (3); a) Ascertain and retain the amount of functional riparian forest sufficient to retain
the integrity of the forested swamp; b) To the extent practical, develop and implement an adaptive management plan
and monitor environmental impacts during any primary forestry activity; and c) Engage in information-sharing or consultation with the applicable First Nation.
5. Where some or all of the forest required in subsection (1) has been previously altered or harvested, to the extent practical, recruit functional riparian forest in that management zone or area.”
Land Base Definition
A forested swamp as defined in the MO means “ a forested mineral wetland or a forested peatland with standing or gently flowing nutrient rich water in pools or channels, and the water table is usually at or near the surface…”. Forested swamp buffers were determined from TRIM features as described in the MO. A 100% netdown within these areas within the defined buffer was applied to account for unmapped forest swamps. Potential forested swamp features were restricted to those falling within CWHvm1, CWHws2 and CWHds2 BEC subzones. Swamp features in other subzones were not considered to meet the nutrient rich definition of forested swamps. (Interfor, personal communications). The area removed is listed in Table 30.
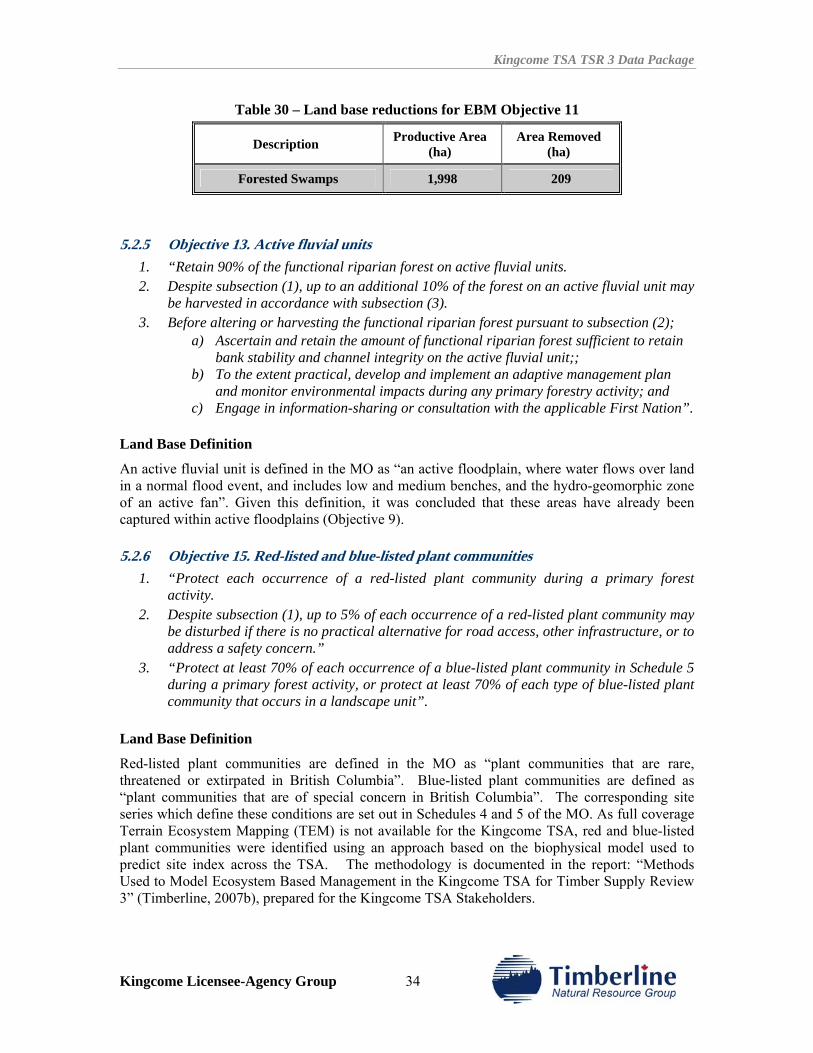
Kingcome TSA TSR 3 Data Package
Kingcome Licensee-Agency Group 34
Table 30 – Land base reductions for EBM Objective 11
Description Productive Area (ha)
Area Removed (ha)
Forested Swamps 1,998 209
5.2.5 Objective 13. Active fluvial units 1. “Retain 90% of the functional riparian forest on active fluvial units. 2. Despite subsection (1), up to an additional 10% of the forest on an active fluvial unit may
be harvested in accordance with subsection (3). 3. Before altering or harvesting the functional riparian forest pursuant to subsection (2);
a) Ascertain and retain the amount of functional riparian forest sufficient to retain bank stability and channel integrity on the active fluvial unit;;
b) To the extent practical, develop and implement an adaptive management plan and monitor environmental impacts during any primary forestry activity; and
c) Engage in information-sharing or consultation with the applicable First Nation”. Land Base Definition
An active fluvial unit is defined in the MO as “an active floodplain, where water flows over land in a normal flood event, and includes low and medium benches, and the hydro-geomorphic zone of an active fan”. Given this definition, it was concluded that these areas have already been captured within active floodplains (Objective 9).
5.2.6 Objective 15. Red-listed and blue-listed plant communities 1. “Protect each occurrence of a red-listed plant community during a primary forest
activity. 2. Despite subsection (1), up to 5% of each occurrence of a red-listed plant community may
be disturbed if there is no practical alternative for road access, other infrastructure, or to address a safety concern.”
3. “Protect at least 70% of each occurrence of a blue-listed plant community in Schedule 5 during a primary forest activity, or protect at least 70% of each type of blue-listed plant community that occurs in a landscape unit”.
Land Base Definition
Red-listed plant communities are defined in the MO as “plant communities that are rare, threatened or extirpated in British Columbia”. Blue-listed plant communities are defined as “plant communities that are of special concern in British Columbia”. The corresponding site series which define these conditions are set out in Schedules 4 and 5 of the MO. As full coverage Terrain Ecosystem Mapping (TEM) is not available for the Kingcome TSA, red and blue-listed plant communities were identified using an approach based on the biophysical model used to predict site index across the TSA. The methodology is documented in the report: “Methods Used to Model Ecosystem Based Management in the Kingcome TSA for Timber Supply Review 3” (Timberline, 2007b), prepared for the Kingcome TSA Stakeholders.
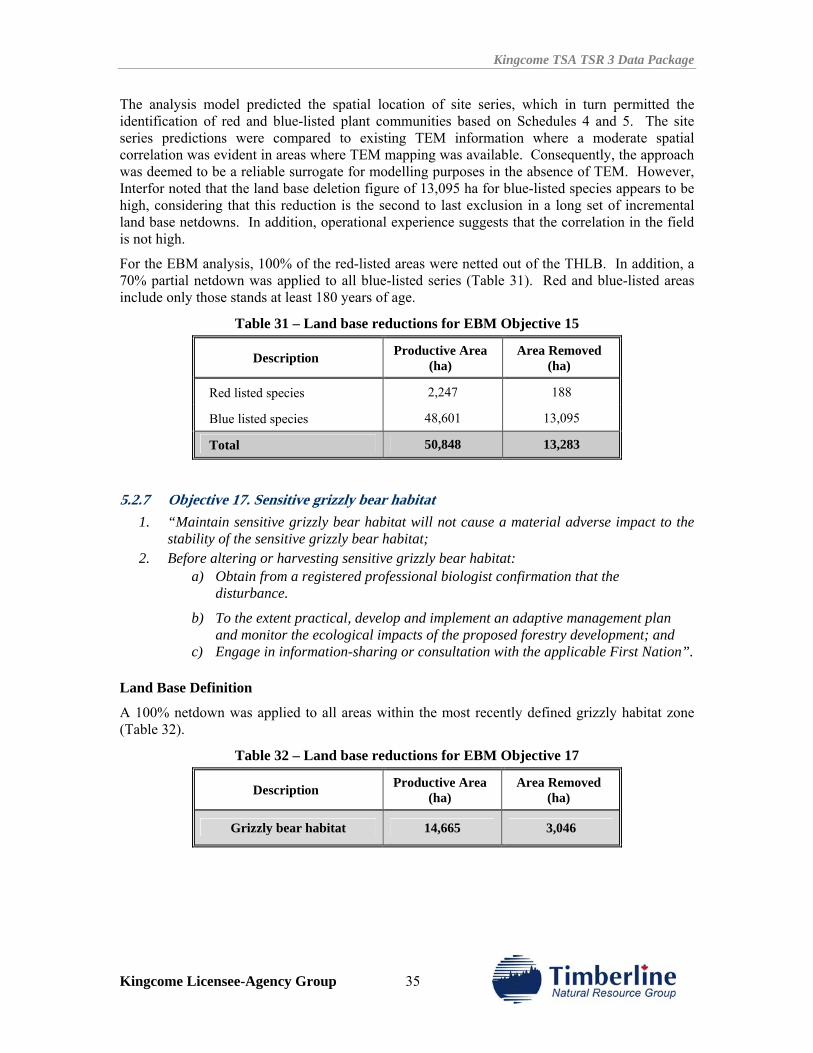
Kingcome TSA TSR 3 Data Package
Kingcome Licensee-Agency Group 35
The analysis model predicted the spatial location of site series, which in turn permitted the identification of red and blue-listed plant communities based on Schedules 4 and 5. The site series predictions were compared to existing TEM information where a moderate spatial correlation was evident in areas where TEM mapping was available. Consequently, the approach was deemed to be a reliable surrogate for modelling purposes in the absence of TEM. However, Interfor noted that the land base deletion figure of 13,095 ha for blue-listed species appears to be high, considering that this reduction is the second to last exclusion in a long set of incremental land base netdowns. In addition, operational experience suggests that the correlation in the field is not high.
For the EBM analysis, 100% of the red-listed areas were netted out of the THLB. In addition, a 70% partial netdown was applied to all blue-listed series (Table 31). Red and blue-listed areas include only those stands at least 180 years of age.
Table 31 – Land base reductions for EBM Objective 15
Description Productive Area (ha)
Area Removed (ha)
Red listed species 2,247 188
Blue listed species 48,601 13,095
Total 50,848 13,283
5.2.7 Objective 17. Sensitive grizzly bear habitat 1. “Maintain sensitive grizzly bear habitat will not cause a material adverse impact to the
stability of the sensitive grizzly bear habitat; 2. Before altering or harvesting sensitive grizzly bear habitat:
a) Obtain from a registered professional biologist confirmation that the disturbance.
b) To the extent practical, develop and implement an adaptive management plan and monitor the ecological impacts of the proposed forestry development; and
c) Engage in information-sharing or consultation with the applicable First Nation”. Land Base Definition
A 100% netdown was applied to all areas within the most recently defined grizzly habitat zone (Table 32).
Table 32 – Land base reductions for EBM Objective 17
Description Productive Area (ha)
Area Removed (ha)
Grizzly bear habitat 14,665 3,046
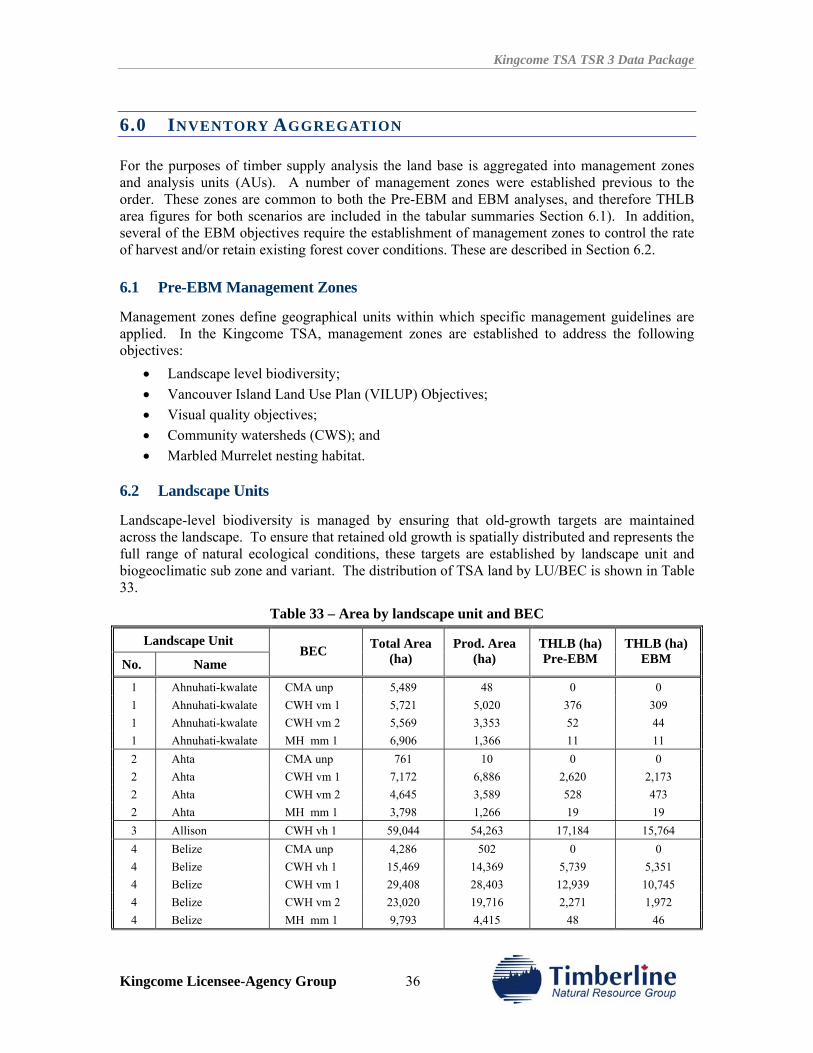
Kingcome TSA TSR 3 Data Package
Kingcome Licensee-Agency Group 36
6.0 INVENTORY AGGREGATION
For the purposes of timber supply analysis the land base is aggregated into management zones and analysis units (AUs). A number of management zones were established previous to the order. These zones are common to both the Pre-EBM and EBM analyses, and therefore THLB area figures for both scenarios are included in the tabular summaries Section 6.1). In addition, several of the EBM objectives require the establishment of management zones to control the rate of harvest and/or retain existing forest cover conditions. These are described in Section 6.2.
6.1 Pre-EBM Management Zones
Management zones define geographical units within which specific management guidelines are applied. In the Kingcome TSA, management zones are established to address the following objectives:
• Landscape level biodiversity; • Vancouver Island Land Use Plan (VILUP) Objectives; • Visual quality objectives; • Community watersheds (CWS); and • Marbled Murrelet nesting habitat.
6.2 Landscape Units
Landscape-level biodiversity is managed by ensuring that old-growth targets are maintained across the landscape. To ensure that retained old growth is spatially distributed and represents the full range of natural ecological conditions, these targets are established by landscape unit and biogeoclimatic sub zone and variant. The distribution of TSA land by LU/BEC is shown in Table 33.
Table 33 – Area by landscape unit and BEC
Landscape Unit
No. Name BEC Total Area
(ha) Prod. Area
(ha) THLB (ha) Pre-EBM
THLB (ha) EBM
1 Ahnuhati-kwalate CMA unp 5,489 48 0 0 1 Ahnuhati-kwalate CWH vm 1 5,721 5,020 376 309 1 Ahnuhati-kwalate CWH vm 2 5,569 3,353 52 44 1 Ahnuhati-kwalate MH mm 1 6,906 1,366 11 11 2 Ahta CMA unp 761 10 0 0 2 Ahta CWH vm 1 7,172 6,886 2,620 2,173 2 Ahta CWH vm 2 4,645 3,589 528 473 2 Ahta MH mm 1 3,798 1,266 19 19 3 Allison CWH vh 1 59,044 54,263 17,184 15,764 4 Belize CMA unp 4,286 502 0 0 4 Belize CWH vh 1 15,469 14,369 5,739 5,351 4 Belize CWH vm 1 29,408 28,403 12,939 10,745 4 Belize CWH vm 2 23,020 19,716 2,271 1,972 4 Belize MH mm 1 9,793 4,415 48 46
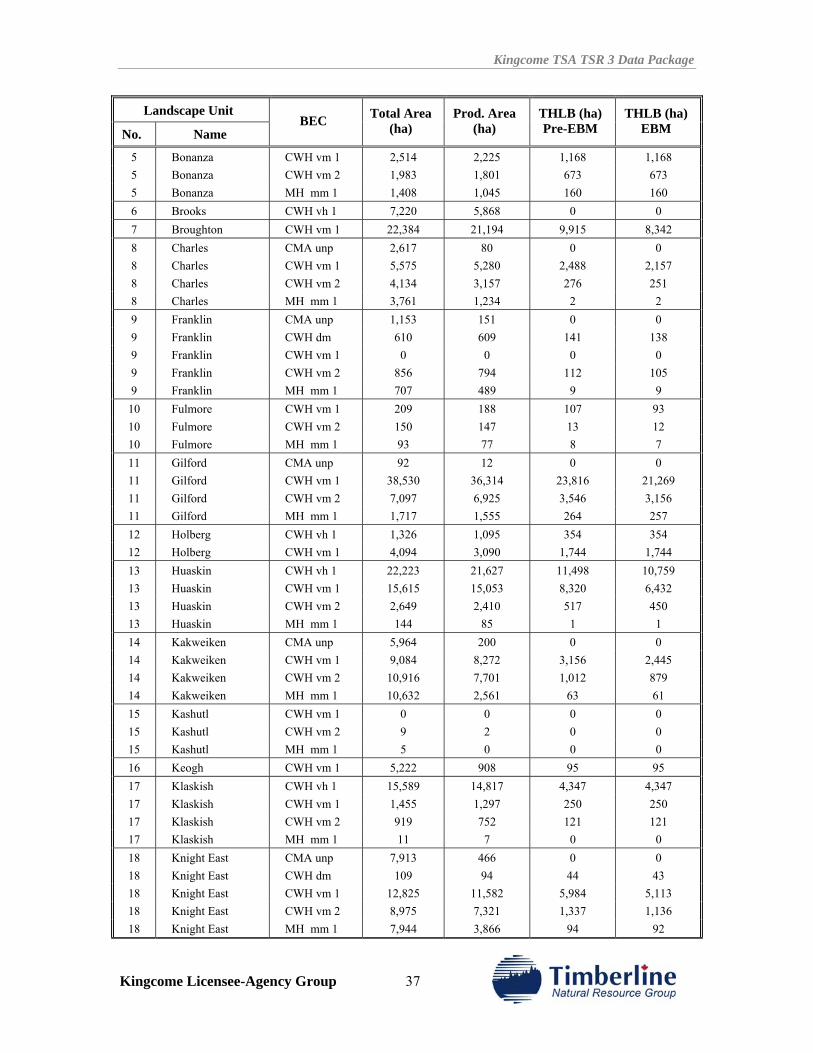
Kingcome TSA TSR 3 Data Package
Kingcome Licensee-Agency Group 37
Landscape Unit
No. Name BEC Total Area
(ha) Prod. Area
(ha) THLB (ha) Pre-EBM
THLB (ha) EBM
5 Bonanza CWH vm 1 2,514 2,225 1,168 1,168 5 Bonanza CWH vm 2 1,983 1,801 673 673 5 Bonanza MH mm 1 1,408 1,045 160 160 6 Brooks CWH vh 1 7,220 5,868 0 0 7 Broughton CWH vm 1 22,384 21,194 9,915 8,342 8 Charles CMA unp 2,617 80 0 0 8 Charles CWH vm 1 5,575 5,280 2,488 2,157 8 Charles CWH vm 2 4,134 3,157 276 251 8 Charles MH mm 1 3,761 1,234 2 2 9 Franklin CMA unp 1,153 151 0 0 9 Franklin CWH dm 610 609 141 138 9 Franklin CWH vm 1 0 0 0 0 9 Franklin CWH vm 2 856 794 112 105 9 Franklin MH mm 1 707 489 9 9 10 Fulmore CWH vm 1 209 188 107 93 10 Fulmore CWH vm 2 150 147 13 12 10 Fulmore MH mm 1 93 77 8 7 11 Gilford CMA unp 92 12 0 0 11 Gilford CWH vm 1 38,530 36,314 23,816 21,269 11 Gilford CWH vm 2 7,097 6,925 3,546 3,156 11 Gilford MH mm 1 1,717 1,555 264 257 12 Holberg CWH vh 1 1,326 1,095 354 354 12 Holberg CWH vm 1 4,094 3,090 1,744 1,744 13 Huaskin CWH vh 1 22,223 21,627 11,498 10,759 13 Huaskin CWH vm 1 15,615 15,053 8,320 6,432 13 Huaskin CWH vm 2 2,649 2,410 517 450 13 Huaskin MH mm 1 144 85 1 1 14 Kakweiken CMA unp 5,964 200 0 0 14 Kakweiken CWH vm 1 9,084 8,272 3,156 2,445 14 Kakweiken CWH vm 2 10,916 7,701 1,012 879 14 Kakweiken MH mm 1 10,632 2,561 63 61 15 Kashutl CWH vm 1 0 0 0 0 15 Kashutl CWH vm 2 9 2 0 0 15 Kashutl MH mm 1 5 0 0 0 16 Keogh CWH vm 1 5,222 908 95 95 17 Klaskish CWH vh 1 15,589 14,817 4,347 4,347 17 Klaskish CWH vm 1 1,455 1,297 250 250 17 Klaskish CWH vm 2 919 752 121 121 17 Klaskish MH mm 1 11 7 0 0 18 Knight East CMA unp 7,913 466 0 0 18 Knight East CWH dm 109 94 44 43 18 Knight East CWH vm 1 12,825 11,582 5,984 5,113 18 Knight East CWH vm 2 8,975 7,321 1,337 1,136 18 Knight East MH mm 1 7,944 3,866 94 92
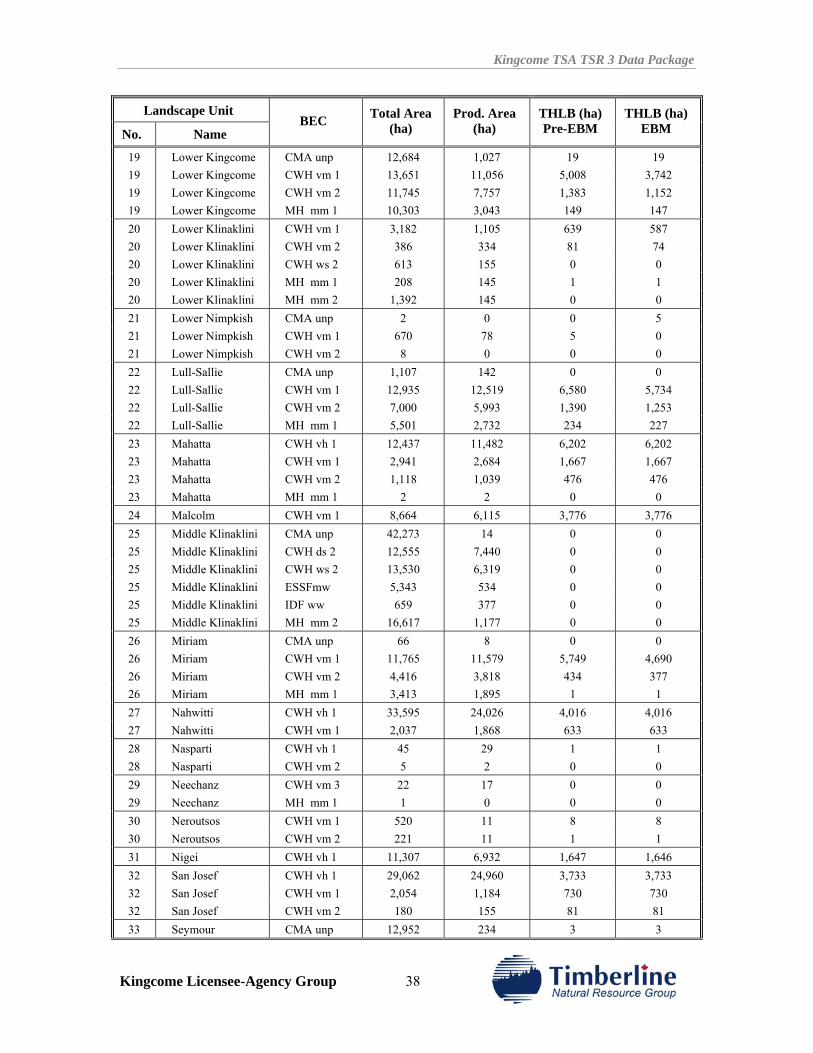
Kingcome TSA TSR 3 Data Package
Kingcome Licensee-Agency Group 38
Landscape Unit
No. Name BEC Total Area
(ha) Prod. Area
(ha) THLB (ha) Pre-EBM
THLB (ha) EBM
19 Lower Kingcome CMA unp 12,684 1,027 19 19 19 Lower Kingcome CWH vm 1 13,651 11,056 5,008 3,742 19 Lower Kingcome CWH vm 2 11,745 7,757 1,383 1,152 19 Lower Kingcome MH mm 1 10,303 3,043 149 147 20 Lower Klinaklini CWH vm 1 3,182 1,105 639 587 20 Lower Klinaklini CWH vm 2 386 334 81 74 20 Lower Klinaklini CWH ws 2 613 155 0 0 20 Lower Klinaklini MH mm 1 208 145 1 1 20 Lower Klinaklini MH mm 2 1,392 145 0 0 21 Lower Nimpkish CMA unp 2 0 0 5 21 Lower Nimpkish CWH vm 1 670 78 5 0 21 Lower Nimpkish CWH vm 2 8 0 0 0 22 Lull-Sallie CMA unp 1,107 142 0 0 22 Lull-Sallie CWH vm 1 12,935 12,519 6,580 5,734 22 Lull-Sallie CWH vm 2 7,000 5,993 1,390 1,253 22 Lull-Sallie MH mm 1 5,501 2,732 234 227 23 Mahatta CWH vh 1 12,437 11,482 6,202 6,202 23 Mahatta CWH vm 1 2,941 2,684 1,667 1,667 23 Mahatta CWH vm 2 1,118 1,039 476 476 23 Mahatta MH mm 1 2 2 0 0 24 Malcolm CWH vm 1 8,664 6,115 3,776 3,776 25 Middle Klinaklini CMA unp 42,273 14 0 0 25 Middle Klinaklini CWH ds 2 12,555 7,440 0 0 25 Middle Klinaklini CWH ws 2 13,530 6,319 0 0 25 Middle Klinaklini ESSFmw 5,343 534 0 0 25 Middle Klinaklini IDF ww 659 377 0 0 25 Middle Klinaklini MH mm 2 16,617 1,177 0 0 26 Miriam CMA unp 66 8 0 0 26 Miriam CWH vm 1 11,765 11,579 5,749 4,690 26 Miriam CWH vm 2 4,416 3,818 434 377 26 Miriam MH mm 1 3,413 1,895 1 1 27 Nahwitti CWH vh 1 33,595 24,026 4,016 4,016 27 Nahwitti CWH vm 1 2,037 1,868 633 633 28 Nasparti CWH vh 1 45 29 1 1 28 Nasparti CWH vm 2 5 2 0 0 29 Neechanz CWH vm 3 22 17 0 0 29 Neechanz MH mm 1 1 0 0 0 30 Neroutsos CWH vm 1 520 11 8 8 30 Neroutsos CWH vm 2 221 11 1 1 31 Nigei CWH vh 1 11,307 6,932 1,647 1,646 32 San Josef CWH vh 1 29,062 24,960 3,733 3,733 32 San Josef CWH vm 1 2,054 1,184 730 730 32 San Josef CWH vm 2 180 155 81 81 33 Seymour CMA unp 12,952 234 3 3
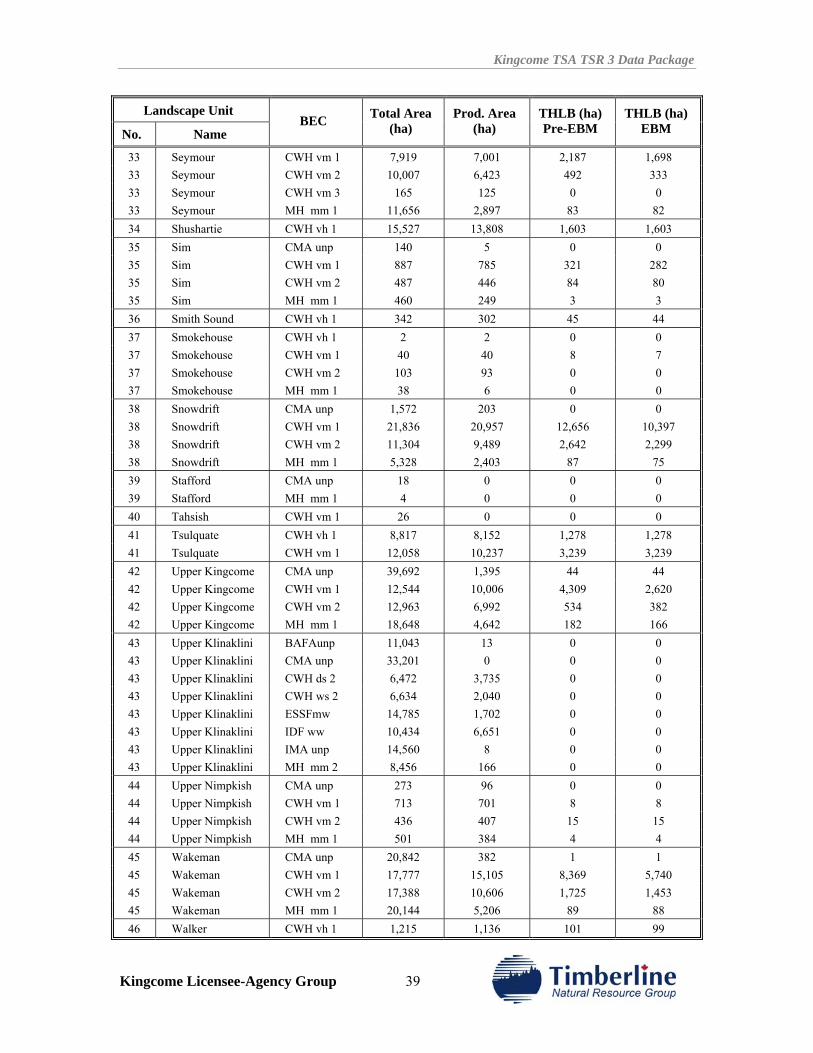
Kingcome TSA TSR 3 Data Package
Kingcome Licensee-Agency Group 39
Landscape Unit
No. Name BEC Total Area
(ha) Prod. Area
(ha) THLB (ha) Pre-EBM
THLB (ha) EBM
33 Seymour CWH vm 1 7,919 7,001 2,187 1,698 33 Seymour CWH vm 2 10,007 6,423 492 333 33 Seymour CWH vm 3 165 125 0 0 33 Seymour MH mm 1 11,656 2,897 83 82 34 Shushartie CWH vh 1 15,527 13,808 1,603 1,603 35 Sim CMA unp 140 5 0 0 35 Sim CWH vm 1 887 785 321 282 35 Sim CWH vm 2 487 446 84 80 35 Sim MH mm 1 460 249 3 3 36 Smith Sound CWH vh 1 342 302 45 44 37 Smokehouse CWH vh 1 2 2 0 0 37 Smokehouse CWH vm 1 40 40 8 7 37 Smokehouse CWH vm 2 103 93 0 0 37 Smokehouse MH mm 1 38 6 0 0 38 Snowdrift CMA unp 1,572 203 0 0 38 Snowdrift CWH vm 1 21,836 20,957 12,656 10,397 38 Snowdrift CWH vm 2 11,304 9,489 2,642 2,299 38 Snowdrift MH mm 1 5,328 2,403 87 75 39 Stafford CMA unp 18 0 0 0 39 Stafford MH mm 1 4 0 0 0 40 Tahsish CWH vm 1 26 0 0 0 41 Tsulquate CWH vh 1 8,817 8,152 1,278 1,278 41 Tsulquate CWH vm 1 12,058 10,237 3,239 3,239 42 Upper Kingcome CMA unp 39,692 1,395 44 44 42 Upper Kingcome CWH vm 1 12,544 10,006 4,309 2,620 42 Upper Kingcome CWH vm 2 12,963 6,992 534 382 42 Upper Kingcome MH mm 1 18,648 4,642 182 166 43 Upper Klinaklini BAFAunp 11,043 13 0 0 43 Upper Klinaklini CMA unp 33,201 0 0 0 43 Upper Klinaklini CWH ds 2 6,472 3,735 0 0 43 Upper Klinaklini CWH ws 2 6,634 2,040 0 0 43 Upper Klinaklini ESSFmw 14,785 1,702 0 0 43 Upper Klinaklini IDF ww 10,434 6,651 0 0 43 Upper Klinaklini IMA unp 14,560 8 0 0 43 Upper Klinaklini MH mm 2 8,456 166 0 0 44 Upper Nimpkish CMA unp 273 96 0 0 44 Upper Nimpkish CWH vm 1 713 701 8 8 44 Upper Nimpkish CWH vm 2 436 407 15 15 44 Upper Nimpkish MH mm 1 501 384 4 4 45 Wakeman CMA unp 20,842 382 1 1 45 Wakeman CWH vm 1 17,777 15,105 8,369 5,740 45 Wakeman CWH vm 2 17,388 10,606 1,725 1,453 45 Wakeman MH mm 1 20,144 5,206 89 88 46 Walker CWH vh 1 1,215 1,136 101 99
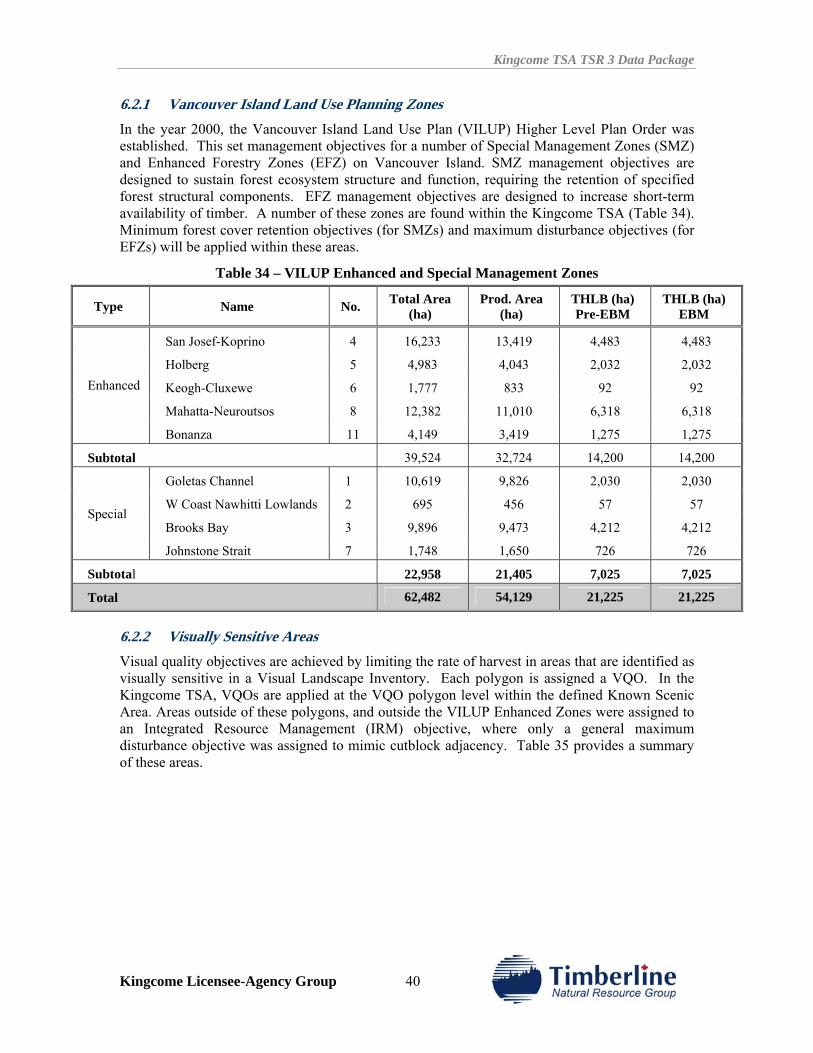
Kingcome TSA TSR 3 Data Package
Kingcome Licensee-Agency Group 40
6.2.1 Vancouver Island Land Use Planning Zones In the year 2000, the Vancouver Island Land Use Plan (VILUP) Higher Level Plan Order was established. This set management objectives for a number of Special Management Zones (SMZ) and Enhanced Forestry Zones (EFZ) on Vancouver Island. SMZ management objectives are designed to sustain forest ecosystem structure and function, requiring the retention of specified forest structural components. EFZ management objectives are designed to increase short-term availability of timber. A number of these zones are found within the Kingcome TSA (Table 34). Minimum forest cover retention objectives (for SMZs) and maximum disturbance objectives (for EFZs) will be applied within these areas.
Table 34 – VILUP Enhanced and Special Management Zones
Type Name No. Total Area (ha)
Prod. Area (ha)
THLB (ha) Pre-EBM
THLB (ha) EBM
San Josef-Koprino 4 16,233 13,419 4,483 4,483
Holberg 5 4,983 4,043 2,032 2,032
Keogh-Cluxewe 6 1,777 833 92 92
Mahatta-Neuroutsos 8 12,382 11,010 6,318 6,318
Enhanced
Bonanza 11 4,149 3,419 1,275 1,275
Subtotal 39,524 32,724 14,200 14,200
Goletas Channel 1 10,619 9,826 2,030 2,030
W Coast Nawhitti Lowlands 2 695 456 57 57
Brooks Bay 3 9,896 9,473 4,212 4,212 Special
Johnstone Strait 7 1,748 1,650 726 726
Subtotal 22,958 21,405 7,025 7,025
Total 62,482 54,129 21,225 21,225
6.2.2 Visually Sensitive Areas Visual quality objectives are achieved by limiting the rate of harvest in areas that are identified as visually sensitive in a Visual Landscape Inventory. Each polygon is assigned a VQO. In the Kingcome TSA, VQOs are applied at the VQO polygon level within the defined Known Scenic Area. Areas outside of these polygons, and outside the VILUP Enhanced Zones were assigned to an Integrated Resource Management (IRM) objective, where only a general maximum disturbance objective was assigned to mimic cutblock adjacency. Table 35 provides a summary of these areas.
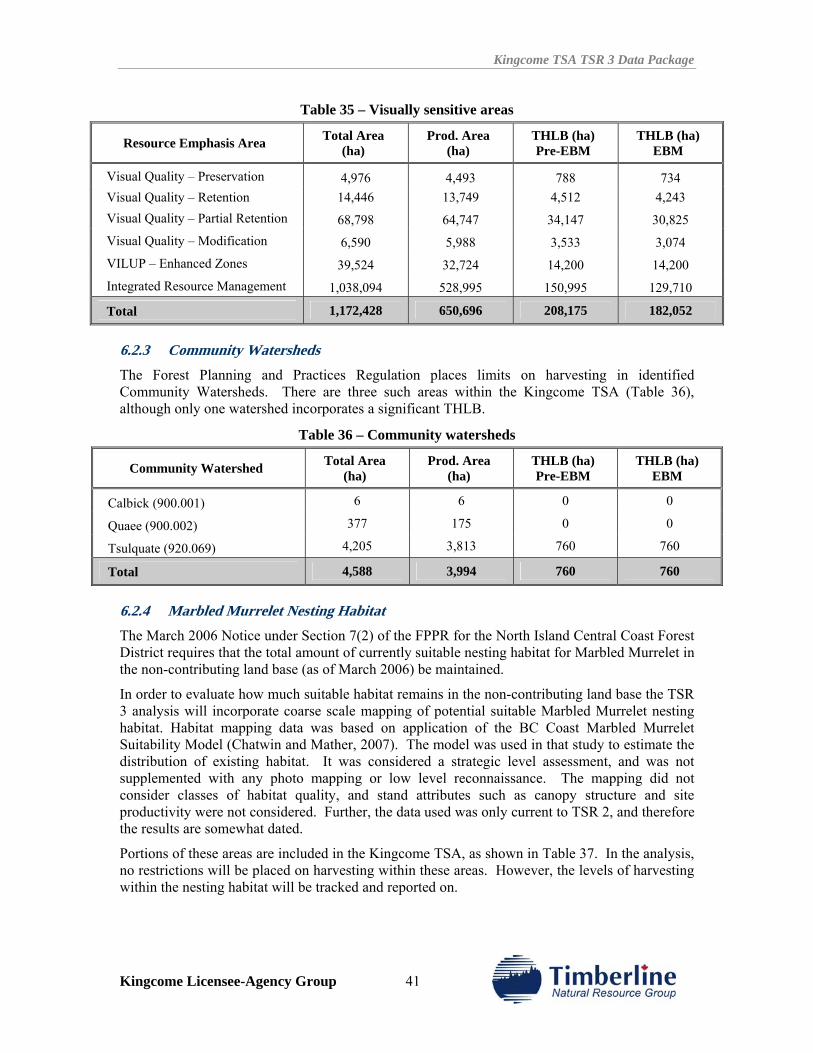
Kingcome TSA TSR 3 Data Package
Kingcome Licensee-Agency Group 41
Table 35 – Visually sensitive areas
Resource Emphasis Area Total Area (ha)
Prod. Area (ha)
THLB (ha) Pre-EBM
THLB (ha) EBM
Visual Quality – Preservation 4,976 4,493 788 734 Visual Quality – Retention 14,446 13,749 4,512 4,243 Visual Quality – Partial Retention 68,798 64,747 34,147 30,825 Visual Quality – Modification 6,590 5,988 3,533 3,074 VILUP – Enhanced Zones 39,524 32,724 14,200 14,200 Integrated Resource Management 1,038,094 528,995 150,995 129,710
Total 1,172,428 650,696 208,175 182,052
6.2.3 Community Watersheds The Forest Planning and Practices Regulation places limits on harvesting in identified Community Watersheds. There are three such areas within the Kingcome TSA (Table 36), although only one watershed incorporates a significant THLB.
Table 36 – Community watersheds
Community Watershed Total Area (ha)
Prod. Area (ha)
THLB (ha) Pre-EBM
THLB (ha) EBM
Calbick (900.001) 6 6 0 0
Quaee (900.002) 377 175 0 0
Tsulquate (920.069) 4,205 3,813 760 760
Total 4,588 3,994 760 760
6.2.4 Marbled Murrelet Nesting Habitat The March 2006 Notice under Section 7(2) of the FPPR for the North Island Central Coast Forest District requires that the total amount of currently suitable nesting habitat for Marbled Murrelet in the non-contributing land base (as of March 2006) be maintained.
In order to evaluate how much suitable habitat remains in the non-contributing land base the TSR 3 analysis will incorporate coarse scale mapping of potential suitable Marbled Murrelet nesting habitat. Habitat mapping data was based on application of the BC Coast Marbled Murrelet Suitability Model (Chatwin and Mather, 2007). The model was used in that study to estimate the distribution of existing habitat. It was considered a strategic level assessment, and was not supplemented with any photo mapping or low level reconnaissance. The mapping did not consider classes of habitat quality, and stand attributes such as canopy structure and site productivity were not considered. Further, the data used was only current to TSR 2, and therefore the results are somewhat dated.
Portions of these areas are included in the Kingcome TSA, as shown in Table 37. In the analysis, no restrictions will be placed on harvesting within these areas. However, the levels of harvesting within the nesting habitat will be tracked and reported on.
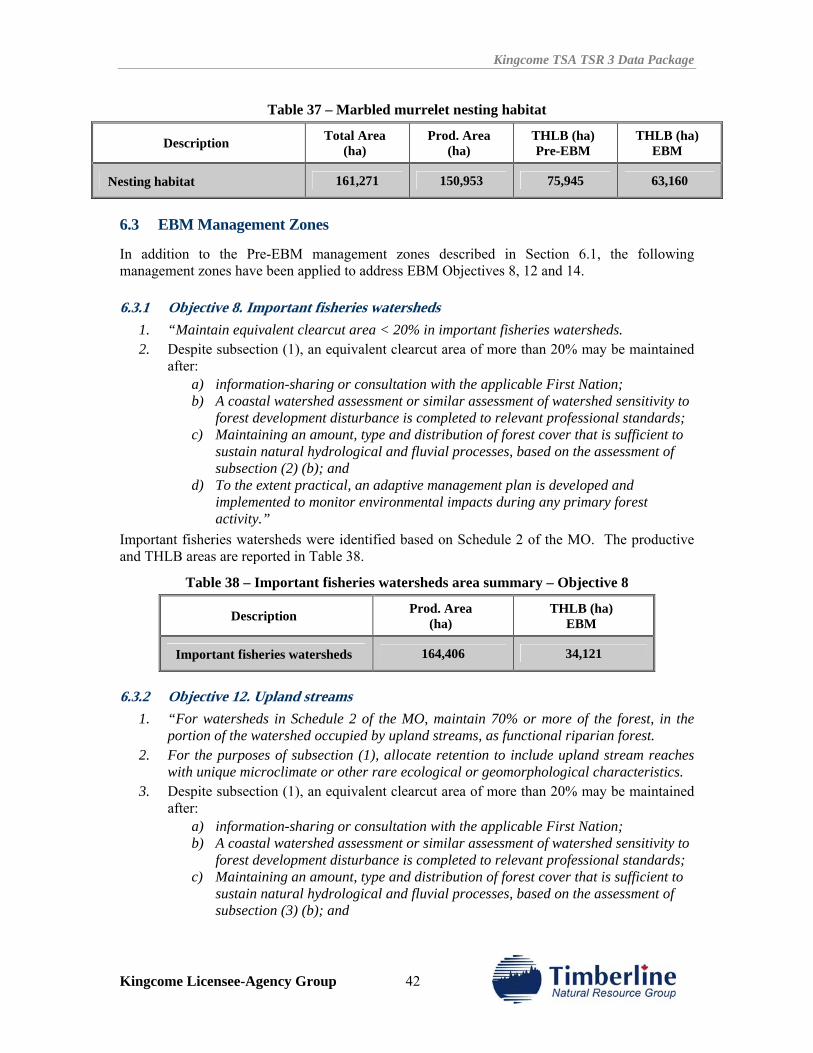
Kingcome TSA TSR 3 Data Package
Kingcome Licensee-Agency Group 42
Table 37 – Marbled murrelet nesting habitat
Description Total Area (ha)
Prod. Area (ha)
THLB (ha) Pre-EBM
THLB (ha) EBM
Nesting habitat 161,271 150,953 75,945 63,160
6.3 EBM Management Zones
In addition to the Pre-EBM management zones described in Section 6.1, the following management zones have been applied to address EBM Objectives 8, 12 and 14.
6.3.1 Objective 8. Important fisheries watersheds 1. “Maintain equivalent clearcut area < 20% in important fisheries watersheds. 2. Despite subsection (1), an equivalent clearcut area of more than 20% may be maintained
after: a) information-sharing or consultation with the applicable First Nation; b) A coastal watershed assessment or similar assessment of watershed sensitivity to
forest development disturbance is completed to relevant professional standards; c) Maintaining an amount, type and distribution of forest cover that is sufficient to
sustain natural hydrological and fluvial processes, based on the assessment of subsection (2) (b); and
d) To the extent practical, an adaptive management plan is developed and implemented to monitor environmental impacts during any primary forest activity.”
Important fisheries watersheds were identified based on Schedule 2 of the MO. The productive and THLB areas are reported in Table 38.
Table 38 – Important fisheries watersheds area summary – Objective 8
Description Prod. Area (ha)
THLB (ha) EBM
Important fisheries watersheds 164,406 34,121
6.3.2 Objective 12. Upland streams 1. “For watersheds in Schedule 2 of the MO, maintain 70% or more of the forest, in the
portion of the watershed occupied by upland streams, as functional riparian forest. 2. For the purposes of subsection (1), allocate retention to include upland stream reaches
with unique microclimate or other rare ecological or geomorphological characteristics. 3. Despite subsection (1), an equivalent clearcut area of more than 20% may be maintained
after: a) information-sharing or consultation with the applicable First Nation; b) A coastal watershed assessment or similar assessment of watershed sensitivity to
forest development disturbance is completed to relevant professional standards; c) Maintaining an amount, type and distribution of forest cover that is sufficient to
sustain natural hydrological and fluvial processes, based on the assessment of subsection (3) (b); and
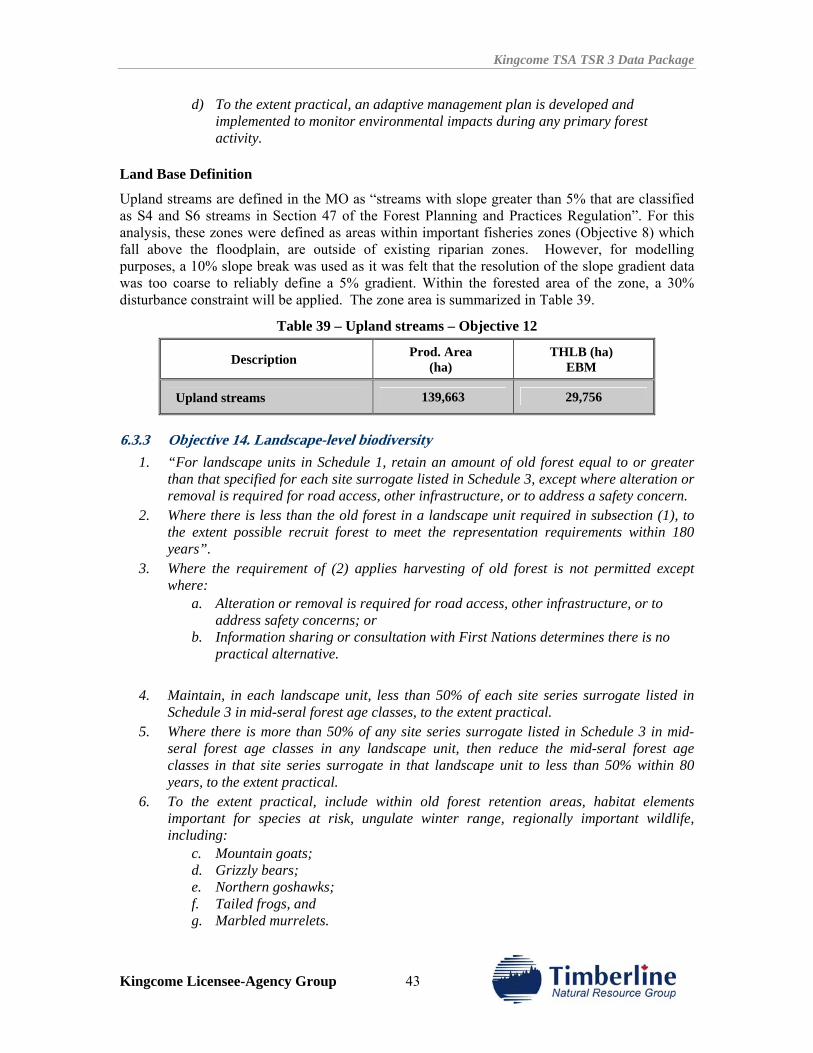
Kingcome TSA TSR 3 Data Package
Kingcome Licensee-Agency Group 43
d) To the extent practical, an adaptive management plan is developed and implemented to monitor environmental impacts during any primary forest activity.
Land Base Definition
Upland streams are defined in the MO as “streams with slope greater than 5% that are classified as S4 and S6 streams in Section 47 of the Forest Planning and Practices Regulation”. For this analysis, these zones were defined as areas within important fisheries zones (Objective 8) which fall above the floodplain, are outside of existing riparian zones. However, for modelling purposes, a 10% slope break was used as it was felt that the resolution of the slope gradient data was too coarse to reliably define a 5% gradient. Within the forested area of the zone, a 30% disturbance constraint will be applied. The zone area is summarized in Table 39.
Table 39 – Upland streams – Objective 12
Description Prod. Area (ha)
THLB (ha) EBM
Upland streams 139,663 29,756
6.3.3 Objective 14. Landscape-level biodiversity 1. “For landscape units in Schedule 1, retain an amount of old forest equal to or greater
than that specified for each site surrogate listed in Schedule 3, except where alteration or removal is required for road access, other infrastructure, or to address a safety concern.
2. Where there is less than the old forest in a landscape unit required in subsection (1), to the extent possible recruit forest to meet the representation requirements within 180 years”.
3. Where the requirement of (2) applies harvesting of old forest is not permitted except where:
a. Alteration or removal is required for road access, other infrastructure, or to address safety concerns; or
b. Information sharing or consultation with First Nations determines there is no practical alternative.
4. Maintain, in each landscape unit, less than 50% of each site series surrogate listed in
Schedule 3 in mid-seral forest age classes, to the extent practical. 5. Where there is more than 50% of any site series surrogate listed in Schedule 3 in mid-
seral forest age classes in any landscape unit, then reduce the mid-seral forest age classes in that site series surrogate in that landscape unit to less than 50% within 80 years, to the extent practical.
6. To the extent practical, include within old forest retention areas, habitat elements important for species at risk, ungulate winter range, regionally important wildlife, including:
c. Mountain goats; d. Grizzly bears; e. Northern goshawks; f. Tailed frogs, and g. Marbled murrelets.
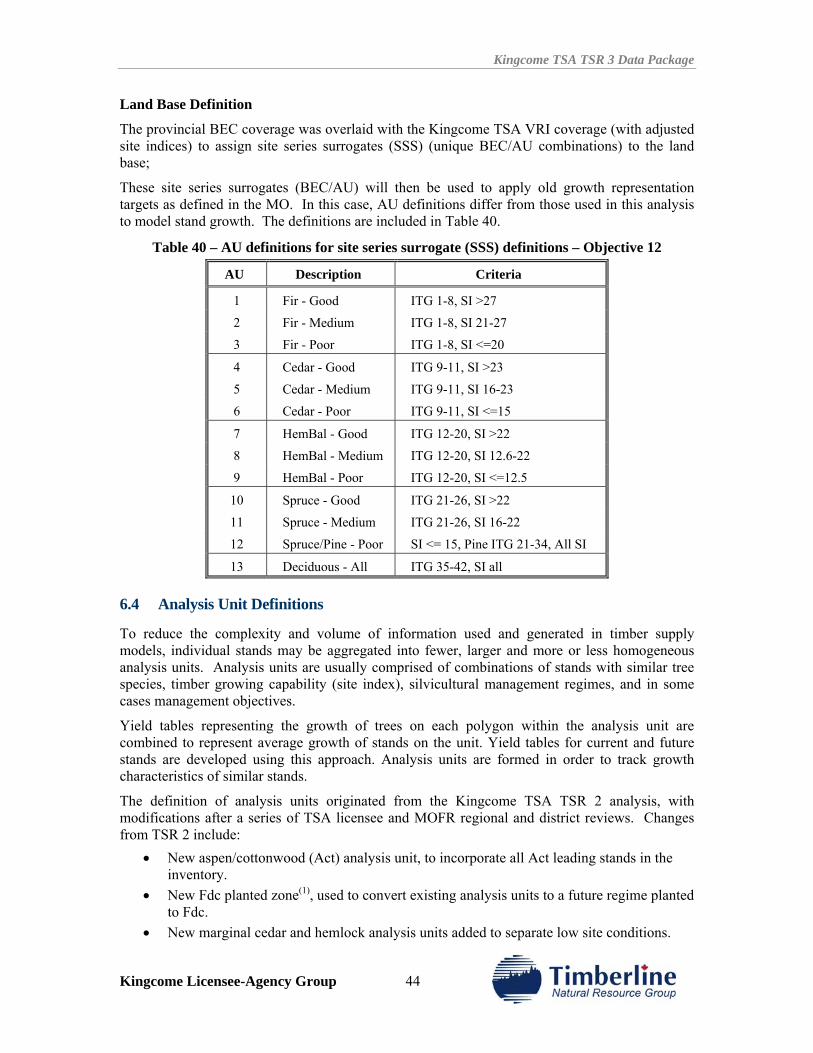
Kingcome TSA TSR 3 Data Package
Kingcome Licensee-Agency Group 44
Land Base Definition
The provincial BEC coverage was overlaid with the Kingcome TSA VRI coverage (with adjusted site indices) to assign site series surrogates (SSS) (unique BEC/AU combinations) to the land base;
These site series surrogates (BEC/AU) will then be used to apply old growth representation targets as defined in the MO. In this case, AU definitions differ from those used in this analysis to model stand growth. The definitions are included in Table 40.
Table 40 – AU definitions for site series surrogate (SSS) definitions – Objective 12
AU Description Criteria
1 Fir - Good ITG 1-8, SI >27
2 Fir - Medium ITG 1-8, SI 21-27
3 Fir - Poor ITG 1-8, SI <=20
4 Cedar - Good ITG 9-11, SI >23
5 Cedar - Medium ITG 9-11, SI 16-23
6 Cedar - Poor ITG 9-11, SI <=15
7 HemBal - Good ITG 12-20, SI >22
8 HemBal - Medium ITG 12-20, SI 12.6-22
9 HemBal - Poor ITG 12-20, SI <=12.5
10 Spruce - Good ITG 21-26, SI >22
11 Spruce - Medium ITG 21-26, SI 16-22
12 Spruce/Pine - Poor SI <= 15, Pine ITG 21-34, All SI
13 Deciduous - All ITG 35-42, SI all
6.4 Analysis Unit Definitions
To reduce the complexity and volume of information used and generated in timber supply models, individual stands may be aggregated into fewer, larger and more or less homogeneous analysis units. Analysis units are usually comprised of combinations of stands with similar tree species, timber growing capability (site index), silvicultural management regimes, and in some cases management objectives.
Yield tables representing the growth of trees on each polygon within the analysis unit are combined to represent average growth of stands on the unit. Yield tables for current and future stands are developed using this approach. Analysis units are formed in order to track growth characteristics of similar stands.
The definition of analysis units originated from the Kingcome TSA TSR 2 analysis, with modifications after a series of TSA licensee and MOFR regional and district reviews. Changes from TSR 2 include:
• New aspen/cottonwood (Act) analysis unit, to incorporate all Act leading stands in the inventory.
• New Fdc planted zone(1), used to convert existing analysis units to a future regime planted to Fdc.
• New marginal cedar and hemlock analysis units added to separate low site conditions.
Kingcome TSA TSR 3 Data Package
Kingcome Licensee-Agency Group 45
• Analysis units divided by EBM management zone, to provide for subsequent flexibility with different yield table generation parameters under EBM management scenarios.
(1)Fdc is being planted as a leading component in the southern most part of the TSA and on south facing slopes, warranting its inclusion as part of the analysis unit definition. Interfor spatially identified these areas on a map, which was used to define the Fdc planted zone. Modelling assumptions within this Fdc planted zone were subsequently clarified with MoFR and Interfor, and it was agreed that all existing non-Fdc leading stands inside the Fdc planted zone would be directed to a future planted Fdc managed stand yield table (MSYT).
The same analysis unit designations and numbering conventions were employed in both the pre-EBM and EBM runs. However, for the EBM scenario, an additional high stand retention EBM zone was defined based on VQO preservation and retention designations. Analysis units within this area were split out and assigned separate designations.
Analysis unit definitions are summarized in Table 41. EBM high retention analysis units include “VQO” in the AU description.
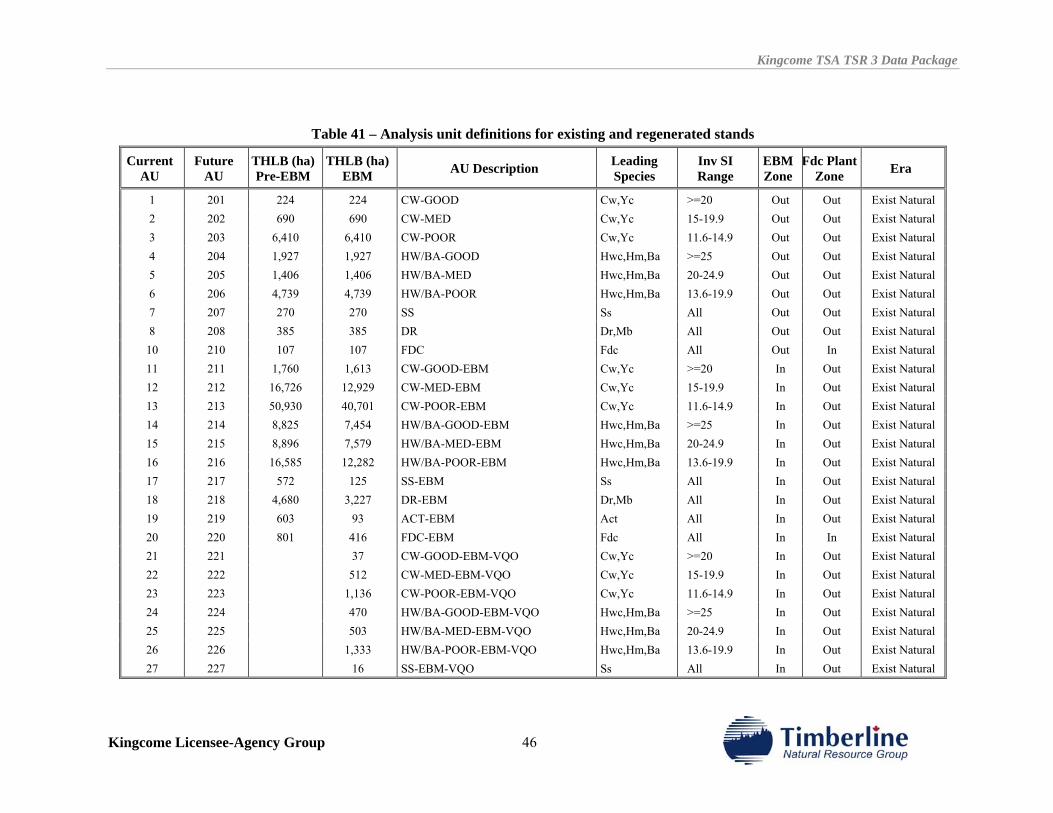
Kingcome TSA TSR 3 Data Package
Kingcome Licensee-Agency Group 46
Table 41 – Analysis unit definitions for existing and regenerated stands
Current AU
Future AU
THLB (ha) Pre-EBM
THLB (ha)EBM AU Description Leading
Species Inv SI Range
EBM Zone
Fdc PlantZone Era
1 201 224 224 CW-GOOD Cw,Yc >=20 Out Out Exist Natural 2 202 690 690 CW-MED Cw,Yc 15-19.9 Out Out Exist Natural 3 203 6,410 6,410 CW-POOR Cw,Yc 11.6-14.9 Out Out Exist Natural 4 204 1,927 1,927 HW/BA-GOOD Hwc,Hm,Ba >=25 Out Out Exist Natural 5 205 1,406 1,406 HW/BA-MED Hwc,Hm,Ba 20-24.9 Out Out Exist Natural 6 206 4,739 4,739 HW/BA-POOR Hwc,Hm,Ba 13.6-19.9 Out Out Exist Natural 7 207 270 270 SS Ss All Out Out Exist Natural 8 208 385 385 DR Dr,Mb All Out Out Exist Natural
10 210 107 107 FDC Fdc All Out In Exist Natural 11 211 1,760 1,613 CW-GOOD-EBM Cw,Yc >=20 In Out Exist Natural 12 212 16,726 12,929 CW-MED-EBM Cw,Yc 15-19.9 In Out Exist Natural 13 213 50,930 40,701 CW-POOR-EBM Cw,Yc 11.6-14.9 In Out Exist Natural 14 214 8,825 7,454 HW/BA-GOOD-EBM Hwc,Hm,Ba >=25 In Out Exist Natural 15 215 8,896 7,579 HW/BA-MED-EBM Hwc,Hm,Ba 20-24.9 In Out Exist Natural 16 216 16,585 12,282 HW/BA-POOR-EBM Hwc,Hm,Ba 13.6-19.9 In Out Exist Natural 17 217 572 125 SS-EBM Ss All In Out Exist Natural 18 218 4,680 3,227 DR-EBM Dr,Mb All In Out Exist Natural 19 219 603 93 ACT-EBM Act All In Out Exist Natural 20 220 801 416 FDC-EBM Fdc All In In Exist Natural 21 221 37 CW-GOOD-EBM-VQO Cw,Yc >=20 In Out Exist Natural 22 222 512 CW-MED-EBM-VQO Cw,Yc 15-19.9 In Out Exist Natural 23 223 1,136 CW-POOR-EBM-VQO Cw,Yc 11.6-14.9 In Out Exist Natural 24 224 470 HW/BA-GOOD-EBM-VQO Hwc,Hm,Ba >=25 In Out Exist Natural 25 225 503 HW/BA-MED-EBM-VQO Hwc,Hm,Ba 20-24.9 In Out Exist Natural 26 226 1,333 HW/BA-POOR-EBM-VQO Hwc,Hm,Ba 13.6-19.9 In Out Exist Natural 27 227 16 SS-EBM-VQO Ss All In Out Exist Natural
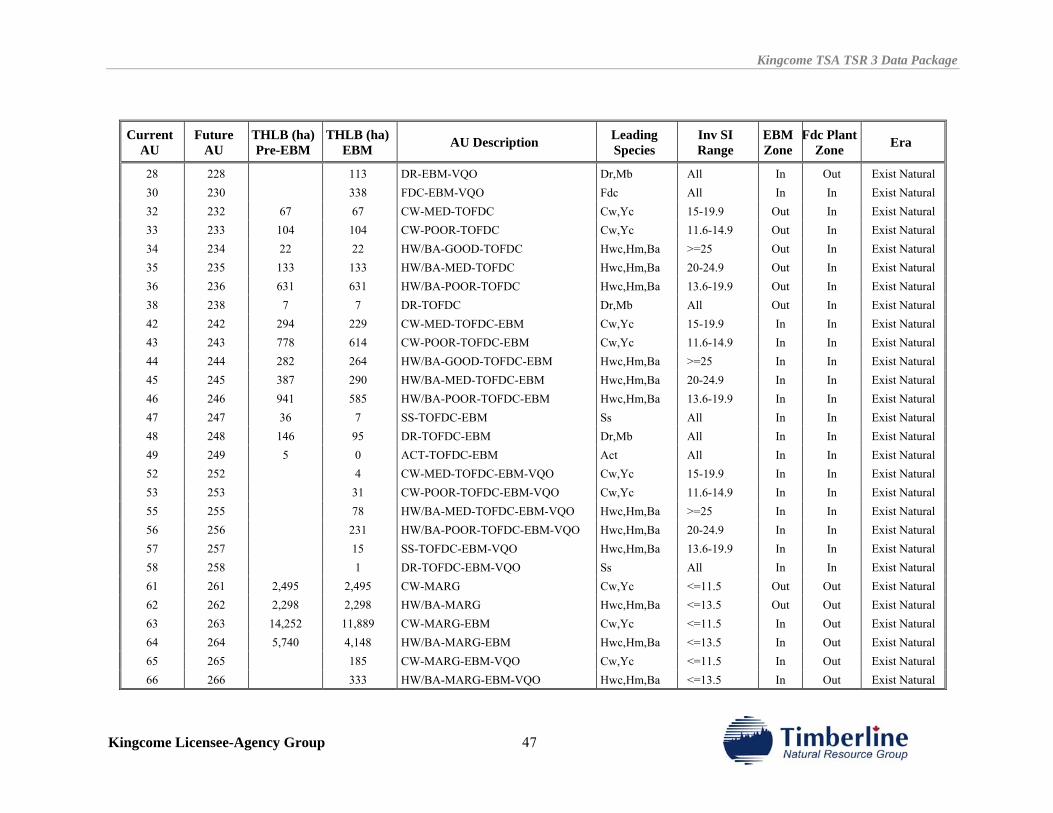
Kingcome TSA TSR 3 Data Package
Kingcome Licensee-Agency Group 47
Current AU
Future AU
THLB (ha) Pre-EBM
THLB (ha)EBM AU Description Leading
Species Inv SI Range
EBM Zone
Fdc PlantZone Era
28 228 113 DR-EBM-VQO Dr,Mb All In Out Exist Natural 30 230 338 FDC-EBM-VQO Fdc All In In Exist Natural 32 232 67 67 CW-MED-TOFDC Cw,Yc 15-19.9 Out In Exist Natural 33 233 104 104 CW-POOR-TOFDC Cw,Yc 11.6-14.9 Out In Exist Natural 34 234 22 22 HW/BA-GOOD-TOFDC Hwc,Hm,Ba >=25 Out In Exist Natural 35 235 133 133 HW/BA-MED-TOFDC Hwc,Hm,Ba 20-24.9 Out In Exist Natural 36 236 631 631 HW/BA-POOR-TOFDC Hwc,Hm,Ba 13.6-19.9 Out In Exist Natural 38 238 7 7 DR-TOFDC Dr,Mb All Out In Exist Natural 42 242 294 229 CW-MED-TOFDC-EBM Cw,Yc 15-19.9 In In Exist Natural 43 243 778 614 CW-POOR-TOFDC-EBM Cw,Yc 11.6-14.9 In In Exist Natural 44 244 282 264 HW/BA-GOOD-TOFDC-EBM Hwc,Hm,Ba >=25 In In Exist Natural 45 245 387 290 HW/BA-MED-TOFDC-EBM Hwc,Hm,Ba 20-24.9 In In Exist Natural 46 246 941 585 HW/BA-POOR-TOFDC-EBM Hwc,Hm,Ba 13.6-19.9 In In Exist Natural 47 247 36 7 SS-TOFDC-EBM Ss All In In Exist Natural 48 248 146 95 DR-TOFDC-EBM Dr,Mb All In In Exist Natural 49 249 5 0 ACT-TOFDC-EBM Act All In In Exist Natural 52 252 4 CW-MED-TOFDC-EBM-VQO Cw,Yc 15-19.9 In In Exist Natural 53 253 31 CW-POOR-TOFDC-EBM-VQO Cw,Yc 11.6-14.9 In In Exist Natural 55 255 78 HW/BA-MED-TOFDC-EBM-VQO Hwc,Hm,Ba >=25 In In Exist Natural 56 256 231 HW/BA-POOR-TOFDC-EBM-VQO Hwc,Hm,Ba 20-24.9 In In Exist Natural 57 257 15 SS-TOFDC-EBM-VQO Hwc,Hm,Ba 13.6-19.9 In In Exist Natural 58 258 1 DR-TOFDC-EBM-VQO Ss All In In Exist Natural 61 261 2,495 2,495 CW-MARG Cw,Yc <=11.5 Out Out Exist Natural 62 262 2,298 2,298 HW/BA-MARG Hwc,Hm,Ba <=13.5 Out Out Exist Natural 63 263 14,252 11,889 CW-MARG-EBM Cw,Yc <=11.5 In Out Exist Natural 64 264 5,740 4,148 HW/BA-MARG-EBM Hwc,Hm,Ba <=13.5 In Out Exist Natural 65 265 185 CW-MARG-EBM-VQO Cw,Yc <=11.5 In Out Exist Natural 66 266 333 HW/BA-MARG-EBM-VQO Hwc,Hm,Ba <=13.5 In Out Exist Natural
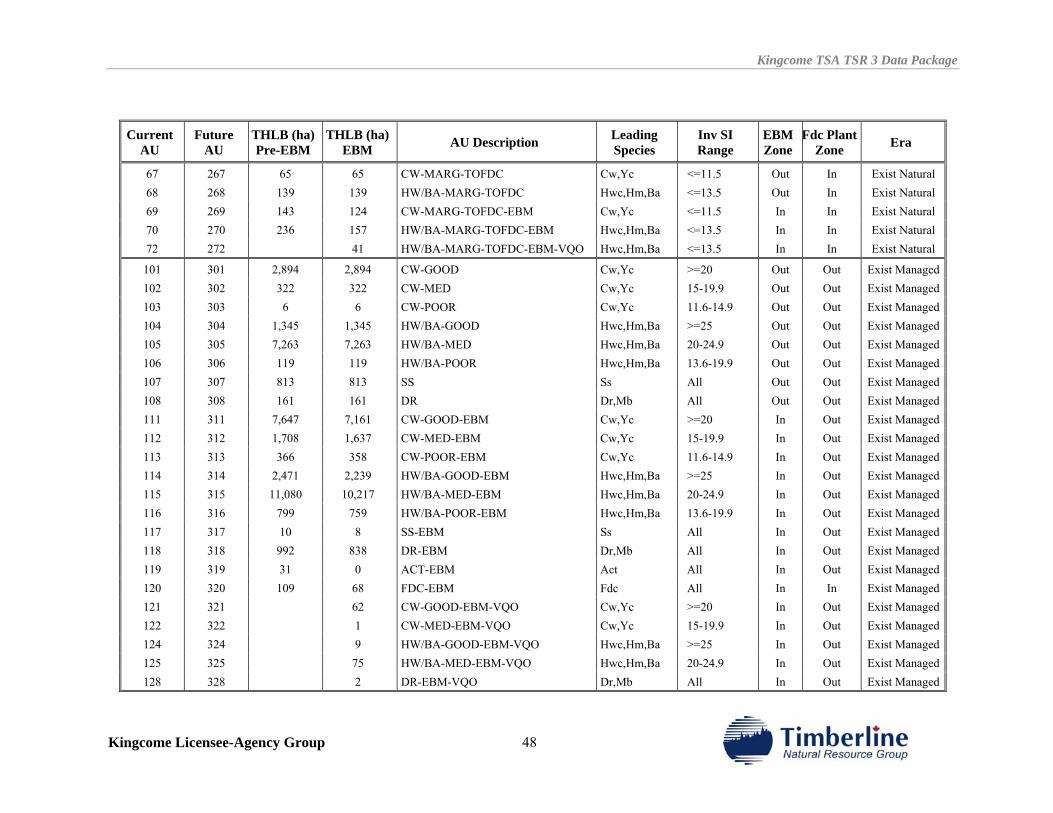
Kingcome TSA TSR 3 Data Package
Kingcome Licensee-Agency Group 48
Current AU
Future AU
THLB (ha) Pre-EBM
THLB (ha)EBM AU Description Leading
Species Inv SI Range
EBM Zone
Fdc PlantZone Era
67 267 65 65 CW-MARG-TOFDC Cw,Yc <=11.5 Out In Exist Natural 68 268 139 139 HW/BA-MARG-TOFDC Hwc,Hm,Ba <=13.5 Out In Exist Natural 69 269 143 124 CW-MARG-TOFDC-EBM Cw,Yc <=11.5 In In Exist Natural 70 270 236 157 HW/BA-MARG-TOFDC-EBM Hwc,Hm,Ba <=13.5 In In Exist Natural 72 272 41 HW/BA-MARG-TOFDC-EBM-VQO Hwc,Hm,Ba <=13.5 In In Exist Natural
101 301 2,894 2,894 CW-GOOD Cw,Yc >=20 Out Out Exist Managed102 302 322 322 CW-MED Cw,Yc 15-19.9 Out Out Exist Managed103 303 6 6 CW-POOR Cw,Yc 11.6-14.9 Out Out Exist Managed104 304 1,345 1,345 HW/BA-GOOD Hwc,Hm,Ba >=25 Out Out Exist Managed105 305 7,263 7,263 HW/BA-MED Hwc,Hm,Ba 20-24.9 Out Out Exist Managed106 306 119 119 HW/BA-POOR Hwc,Hm,Ba 13.6-19.9 Out Out Exist Managed107 307 813 813 SS Ss All Out Out Exist Managed108 308 161 161 DR Dr,Mb All Out Out Exist Managed111 311 7,647 7,161 CW-GOOD-EBM Cw,Yc >=20 In Out Exist Managed112 312 1,708 1,637 CW-MED-EBM Cw,Yc 15-19.9 In Out Exist Managed113 313 366 358 CW-POOR-EBM Cw,Yc 11.6-14.9 In Out Exist Managed114 314 2,471 2,239 HW/BA-GOOD-EBM Hwc,Hm,Ba >=25 In Out Exist Managed115 315 11,080 10,217 HW/BA-MED-EBM Hwc,Hm,Ba 20-24.9 In Out Exist Managed116 316 799 759 HW/BA-POOR-EBM Hwc,Hm,Ba 13.6-19.9 In Out Exist Managed117 317 10 8 SS-EBM Ss All In Out Exist Managed118 318 992 838 DR-EBM Dr,Mb All In Out Exist Managed119 319 31 0 ACT-EBM Act All In Out Exist Managed120 320 109 68 FDC-EBM Fdc All In In Exist Managed121 321 62 CW-GOOD-EBM-VQO Cw,Yc >=20 In Out Exist Managed122 322 1 CW-MED-EBM-VQO Cw,Yc 15-19.9 In Out Exist Managed124 324 9 HW/BA-GOOD-EBM-VQO Hwc,Hm,Ba >=25 In Out Exist Managed125 325 75 HW/BA-MED-EBM-VQO Hwc,Hm,Ba 20-24.9 In Out Exist Managed128 328 2 DR-EBM-VQO Dr,Mb All In Out Exist Managed
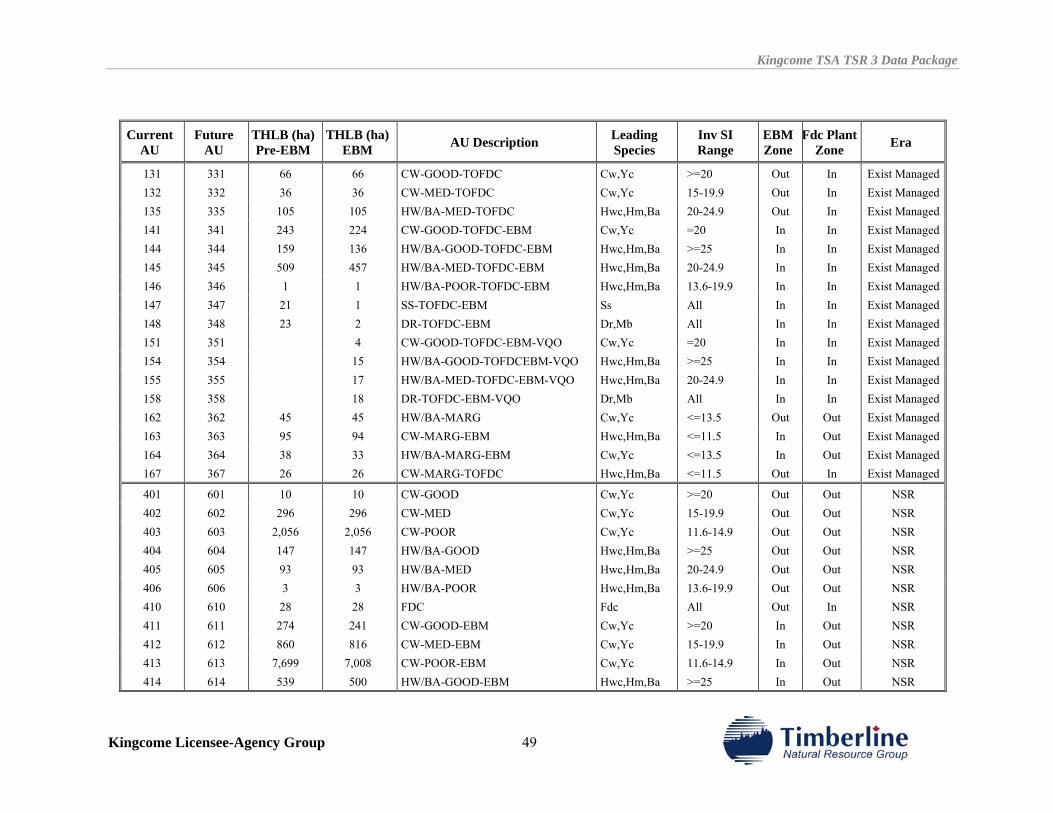
Kingcome TSA TSR 3 Data Package
Kingcome Licensee-Agency Group 49
Current AU
Future AU
THLB (ha) Pre-EBM
THLB (ha)EBM AU Description Leading
Species Inv SI Range
EBM Zone
Fdc PlantZone Era
131 331 66 66 CW-GOOD-TOFDC Cw,Yc >=20 Out In Exist Managed132 332 36 36 CW-MED-TOFDC Cw,Yc 15-19.9 Out In Exist Managed135 335 105 105 HW/BA-MED-TOFDC Hwc,Hm,Ba 20-24.9 Out In Exist Managed141 341 243 224 CW-GOOD-TOFDC-EBM Cw,Yc =20 In In Exist Managed144 344 159 136 HW/BA-GOOD-TOFDC-EBM Hwc,Hm,Ba >=25 In In Exist Managed145 345 509 457 HW/BA-MED-TOFDC-EBM Hwc,Hm,Ba 20-24.9 In In Exist Managed146 346 1 1 HW/BA-POOR-TOFDC-EBM Hwc,Hm,Ba 13.6-19.9 In In Exist Managed147 347 21 1 SS-TOFDC-EBM Ss All In In Exist Managed148 348 23 2 DR-TOFDC-EBM Dr,Mb All In In Exist Managed151 351 4 CW-GOOD-TOFDC-EBM-VQO Cw,Yc =20 In In Exist Managed154 354 15 HW/BA-GOOD-TOFDCEBM-VQO Hwc,Hm,Ba >=25 In In Exist Managed155 355 17 HW/BA-MED-TOFDC-EBM-VQO Hwc,Hm,Ba 20-24.9 In In Exist Managed158 358 18 DR-TOFDC-EBM-VQO Dr,Mb All In In Exist Managed162 362 45 45 HW/BA-MARG Cw,Yc <=13.5 Out Out Exist Managed163 363 95 94 CW-MARG-EBM Hwc,Hm,Ba <=11.5 In Out Exist Managed164 364 38 33 HW/BA-MARG-EBM Cw,Yc <=13.5 In Out Exist Managed167 367 26 26 CW-MARG-TOFDC Hwc,Hm,Ba <=11.5 Out In Exist Managed
401 601 10 10 CW-GOOD Cw,Yc >=20 Out Out NSR 402 602 296 296 CW-MED Cw,Yc 15-19.9 Out Out NSR 403 603 2,056 2,056 CW-POOR Cw,Yc 11.6-14.9 Out Out NSR 404 604 147 147 HW/BA-GOOD Hwc,Hm,Ba >=25 Out Out NSR 405 605 93 93 HW/BA-MED Hwc,Hm,Ba 20-24.9 Out Out NSR 406 606 3 3 HW/BA-POOR Hwc,Hm,Ba 13.6-19.9 Out Out NSR 410 610 28 28 FDC Fdc All Out In NSR 411 611 274 241 CW-GOOD-EBM Cw,Yc >=20 In Out NSR 412 612 860 816 CW-MED-EBM Cw,Yc 15-19.9 In Out NSR 413 613 7,699 7,008 CW-POOR-EBM Cw,Yc 11.6-14.9 In Out NSR 414 614 539 500 HW/BA-GOOD-EBM Hwc,Hm,Ba >=25 In Out NSR
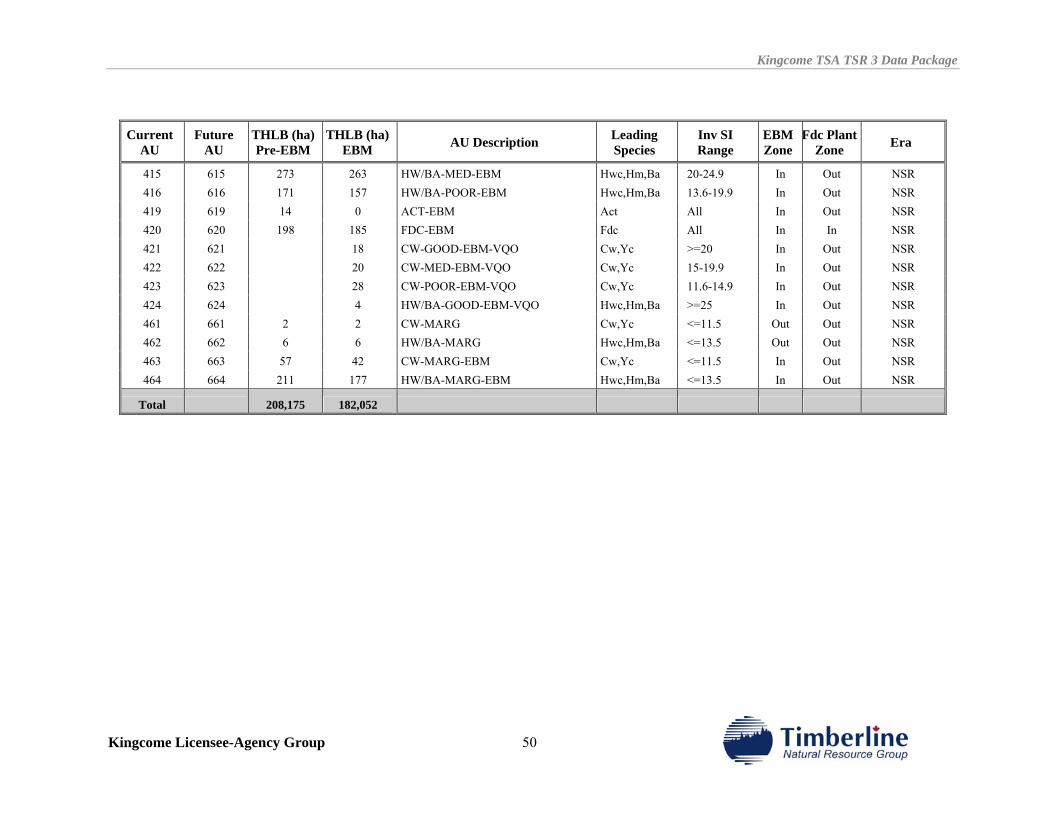
Kingcome TSA TSR 3 Data Package
Kingcome Licensee-Agency Group 50
Current AU
Future AU
THLB (ha) Pre-EBM
THLB (ha)EBM AU Description Leading
Species Inv SI Range
EBM Zone
Fdc PlantZone Era
415 615 273 263 HW/BA-MED-EBM Hwc,Hm,Ba 20-24.9 In Out NSR 416 616 171 157 HW/BA-POOR-EBM Hwc,Hm,Ba 13.6-19.9 In Out NSR 419 619 14 0 ACT-EBM Act All In Out NSR 420 620 198 185 FDC-EBM Fdc All In In NSR 421 621 18 CW-GOOD-EBM-VQO Cw,Yc >=20 In Out NSR 422 622 20 CW-MED-EBM-VQO Cw,Yc 15-19.9 In Out NSR 423 623 28 CW-POOR-EBM-VQO Cw,Yc 11.6-14.9 In Out NSR 424 624 4 HW/BA-GOOD-EBM-VQO Hwc,Hm,Ba >=25 In Out NSR 461 661 2 2 CW-MARG Cw,Yc <=11.5 Out Out NSR 462 662 6 6 HW/BA-MARG Hwc,Hm,Ba <=13.5 Out Out NSR 463 663 57 42 CW-MARG-EBM Cw,Yc <=11.5 In Out NSR 464 664 211 177 HW/BA-MARG-EBM Hwc,Hm,Ba <=13.5 In Out NSR
Total 208,175 182,052
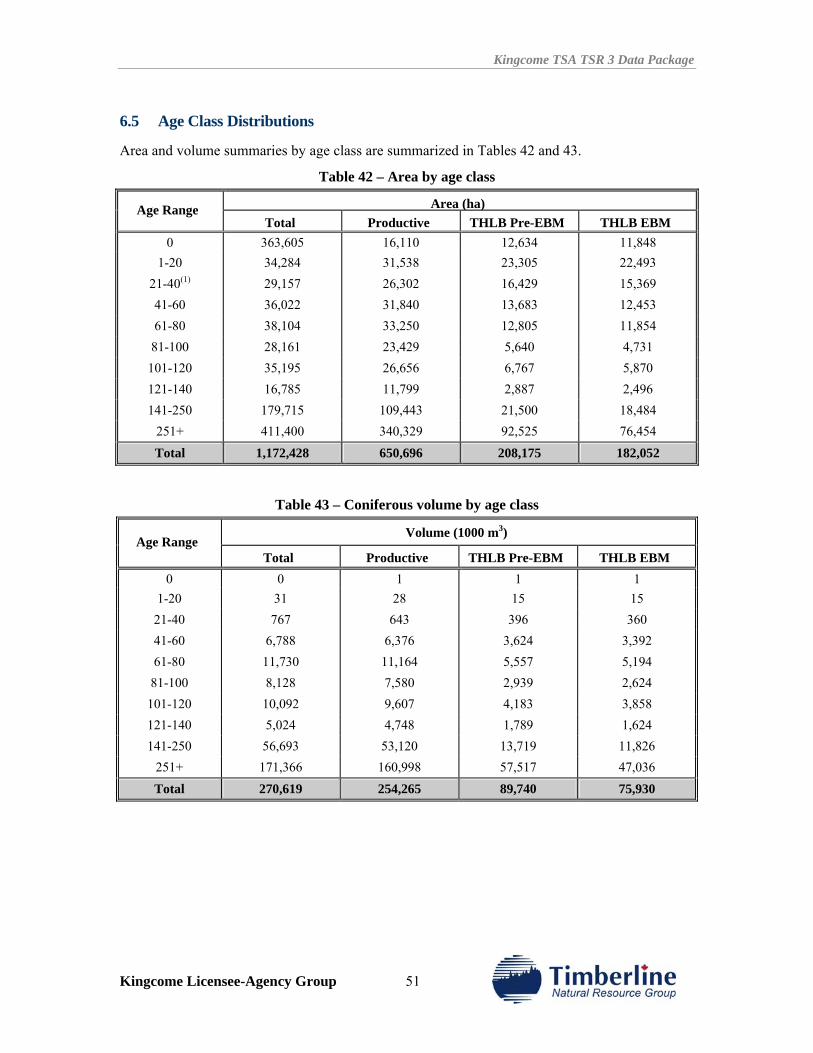
Kingcome TSA TSR 3 Data Package
Kingcome Licensee-Agency Group 51
6.5 Age Class Distributions
Area and volume summaries by age class are summarized in Tables 42 and 43.
Table 42 – Area by age class
Area (ha)Age Range Total Productive THLB Pre-EBM THLB EBM
0 363,605 16,110 12,634 11,848 1-20 34,284 31,538 23,305 22,493
21-40(1) 29,157 26,302 16,429 15,369 41-60 36,022 31,840 13,683 12,453 61-80 38,104 33,250 12,805 11,854 81-100 28,161 23,429 5,640 4,731
101-120 35,195 26,656 6,767 5,870 121-140 16,785 11,799 2,887 2,496 141-250 179,715 109,443 21,500 18,484
251+ 411,400 340,329 92,525 76,454 Total 1,172,428 650,696 208,175 182,052
Table 43 – Coniferous volume by age class
Volume (1000 m3) Age Range
Total Productive THLB Pre-EBM THLB EBM 0 0 1 1 1
1-20 31 28 15 15 21-40 767 643 396 360 41-60 6,788 6,376 3,624 3,392 61-80 11,730 11,164 5,557 5,194 81-100 8,128 7,580 2,939 2,624
101-120 10,092 9,607 4,183 3,858 121-140 5,024 4,748 1,789 1,624 141-250 56,693 53,120 13,719 11,826
251+ 171,366 160,998 57,517 47,036 Total 270,619 254,265 89,740 75,930
Kingcome TSA TSR 3 Data Package
Kingcome Licensee-Agency Group 52
7.0 GROWTH AND YIELD
This section describes the issues, information sources, assumptions, methods, and any relevant processing or adjustments related to growth and yield estimates for existing and future stands.
7.1 Inventory
The Forest cover inventory was received from the MoFR January 1, 2006, with age and height attributes projected to this date. Both age and height attributes included in this inventory originate from the VRI Phase 2 adjustment process.2
In assigning analysis units based on inventory attributes, the following assumptions were made: • Leading species (as opposed to inventory type group) was used to define analysis units,
due to the inventory coverage data discrepancy between ITG and leading species labels. • If previous stand attribute data were available, the previous stand attributes were used to
assign analysis units using a combination of leading species, age, height and stocking classes to assign broad good, medium, and poor site classes. (assigned to NSR)
• If no previous stand attribute data was available, the dominant analysis unit in a given BEC subzone was used to assign an equivalent analysis unit to each stand occurring in the same BEC subzone. (assigned to NSR)
• In some cases, the combination of age, height, and inventory site index from the current VRI was considered questionable (ie., height 1.3m, age 250yrs). For these stands, the current inventory attributes were ignored, and the stands were assumed to be NSR. No change was made to the analysis unit assignment.
7.2 Natural Stand Yield Tables.
Natural stand yield tables (NSYT) were developed using the MoFR program Variable Density Yield Prediction Model (VDYP Batch version 6.6D). Phase 2 adjusted age and height attributes were used as inputs to the natural stand yield tables, and the volume adjustment factor (also included in the inventory) was used as a multiplier to all natural stand yield tables.
Individual NSYTs were generated for all existing natural stands by forest cover polygon, and then aggregated by analysis unit. For the Cottonwood leading (Act) analysis unit, VDYP version 7 for the NSYT was approved by the MOFR. 3
7.3 Managed Stand Yield Tables
Managed stand yield tables used the MoFR Table Interpolation Program for Stand Yields (TIPSY Batch version 4.1) growth model. Individual MSYTs were generated for all existing and future managed stands by forest cover polygon, and then aggregated by analysis unit.
The managed yield curves for alder reported in this Data Package have been developed using TIPSY. However, Northwest Hardwoods staff has expressed concern that these yields appear
2 Confirmed via email from T.Salkeld, MoFR, June 20, 2007. 3 VDYP version 7 was used for the Act analysis unit with the approval of J. Brown, MoFR. This same NSYT was used for both current and future analysis units.
Kingcome TSA TSR 3 Data Package
Kingcome Licensee-Agency Group 53
very conservative when compared to data from the Pacific Northwest Hardwood Cooperative, and yield curves developed with TASS. This issue will be explored further prior to finalizing yield curve tables for alder analysis units.
7.4 Site Index
Site Index is a measure of productivity used during yield analysis. SI is an estimate of potential height growth on a site over a fixed period of time, normally 50 years breast height age. The productivity of a site largely determines how quickly trees grow and when rotation age and minimum harvest age (MHA) are reached. The inventory site index from the forest inventory coverage is used to develop yield tables for existing natural stands.
Adjusted site index has been used to develop yield tables for future managed stands. The derivation of these site indices is described in the report Site Index Adjustment of the Kingcome Timber Supply Area. (Timberline, 2007a).
The Kingcome SIA project was completed in three major steps: 1. Preliminary potential site index (PSI) was estimated for western red cedar (Cw) and
western hemlock (Hw) using the TNRG biophysical model. 2. Field sampling was completed to estimate PSI of Cw and Hw from height and age
measurements of site trees in randomly located points, in suitable second-growth stands. 3. The preliminary PSI estimates were statistically adjusted using the sample data to remove
potential bias from the predicted PSI estimates. Both Cw and Hw predicted PSI were adjusted using the ratio of means method. The Cw preliminary PSI estimates showed almost no bias (less than 1%), while the Hw bias was approximately 2.4%. The relationship between preliminary PSI and ground site index was relatively strong. The coefficient of determination (R2) was 20-30%, while the 95% sampling error was relatively low (1.2 m) for Cw, and slightly higher than the targeted ±1.5 m (1.7 m) for Hw.
The adjusted PSI estimates were higher than current inventory site index estimates in areas where Cw and Hw are currently the leading species. The differences were approximately 4.2 m (or 30%) for Cw and 3.2 m (or 15%) for Hw. This site index increase should increase mean annual increment estimates on the TSA by 60% for Cw stands and 30% for Hw stands in timber supply analysis.
The following rules were used to assign adjusted site index to each record for existing managed and future managed stands:
• For Cw and Hw analysis units, adjusted site indices were used where available.4 Where adjusted site indices were not generated, inventory site index was used.
• For Cw and Hw analysis units that converted to future Fdc analysis units, MoFR site index conversion equations were used to convert from either Cw or Hw to Fdc site index.
• For all other analysis units, inventory site index was used. For the Act analysis unit, a single average site index was computed from all stands, using a minimum SI of 25m.5 Table 44 lists the weighted average site index assigned to all existing and future analysis units.
4 The site index adjusted area included all operable schedule C vegetated lands in the CWH, as defined in the site index adjustment report.
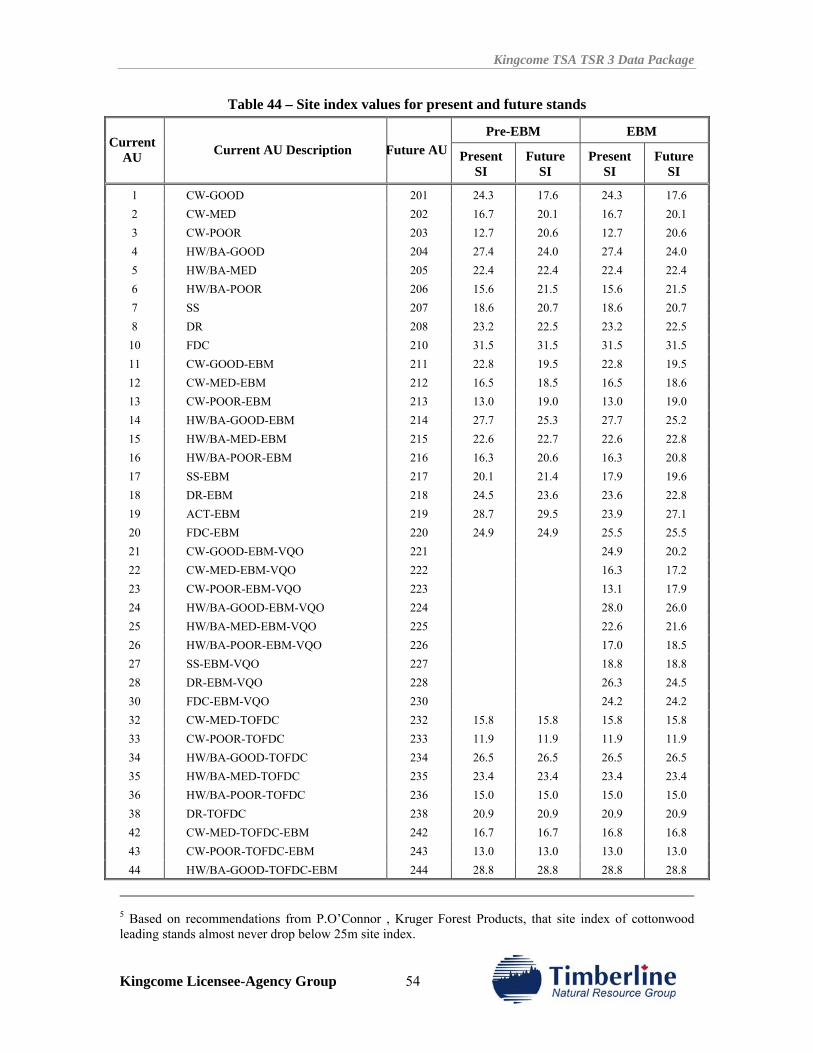
Kingcome TSA TSR 3 Data Package
Kingcome Licensee-Agency Group 54
Table 44 – Site index values for present and future stands
Pre-EBM EBM Current
AU Current AU Description Future AU Present SI
Future SI
Present SI
Future SI
1 CW-GOOD 201 24.3 17.6 24.3 17.6 2 CW-MED 202 16.7 20.1 16.7 20.1 3 CW-POOR 203 12.7 20.6 12.7 20.6 4 HW/BA-GOOD 204 27.4 24.0 27.4 24.0 5 HW/BA-MED 205 22.4 22.4 22.4 22.4 6 HW/BA-POOR 206 15.6 21.5 15.6 21.5 7 SS 207 18.6 20.7 18.6 20.7 8 DR 208 23.2 22.5 23.2 22.5
10 FDC 210 31.5 31.5 31.5 31.5 11 CW-GOOD-EBM 211 22.8 19.5 22.8 19.5 12 CW-MED-EBM 212 16.5 18.5 16.5 18.6 13 CW-POOR-EBM 213 13.0 19.0 13.0 19.0 14 HW/BA-GOOD-EBM 214 27.7 25.3 27.7 25.2 15 HW/BA-MED-EBM 215 22.6 22.7 22.6 22.8 16 HW/BA-POOR-EBM 216 16.3 20.6 16.3 20.8 17 SS-EBM 217 20.1 21.4 17.9 19.6 18 DR-EBM 218 24.5 23.6 23.6 22.8 19 ACT-EBM 219 28.7 29.5 23.9 27.1 20 FDC-EBM 220 24.9 24.9 25.5 25.5 21 CW-GOOD-EBM-VQO 221 24.9 20.2 22 CW-MED-EBM-VQO 222 16.3 17.2 23 CW-POOR-EBM-VQO 223 13.1 17.9 24 HW/BA-GOOD-EBM-VQO 224 28.0 26.0 25 HW/BA-MED-EBM-VQO 225 22.6 21.6 26 HW/BA-POOR-EBM-VQO 226 17.0 18.5 27 SS-EBM-VQO 227 18.8 18.8 28 DR-EBM-VQO 228 26.3 24.5 30 FDC-EBM-VQO 230 24.2 24.2 32 CW-MED-TOFDC 232 15.8 15.8 15.8 15.8 33 CW-POOR-TOFDC 233 11.9 11.9 11.9 11.9 34 HW/BA-GOOD-TOFDC 234 26.5 26.5 26.5 26.5 35 HW/BA-MED-TOFDC 235 23.4 23.4 23.4 23.4 36 HW/BA-POOR-TOFDC 236 15.0 15.0 15.0 15.0 38 DR-TOFDC 238 20.9 20.9 20.9 20.9 42 CW-MED-TOFDC-EBM 242 16.7 16.7 16.8 16.8 43 CW-POOR-TOFDC-EBM 243 13.0 13.0 13.0 13.0 44 HW/BA-GOOD-TOFDC-EBM 244 28.8 28.8 28.8 28.8
5 Based on recommendations from P.O’Connor , Kruger Forest Products, that site index of cottonwood leading stands almost never drop below 25m site index.
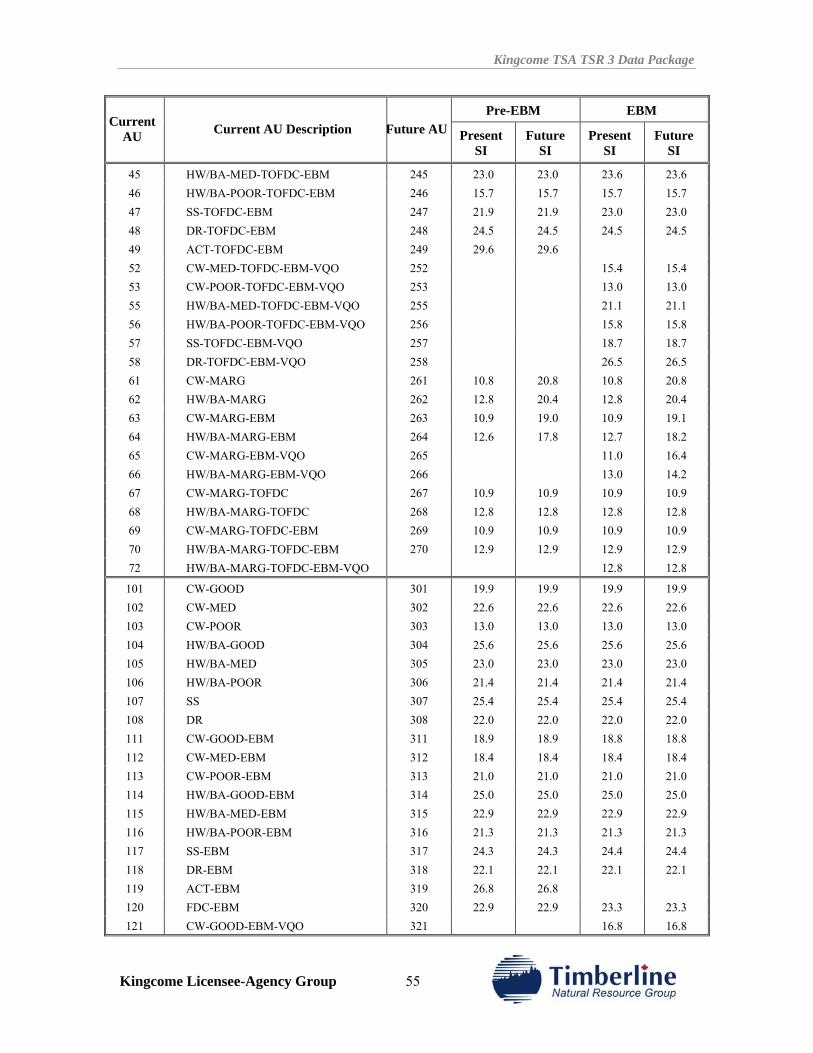
Kingcome TSA TSR 3 Data Package
Kingcome Licensee-Agency Group 55
Pre-EBM EBM Current
AU Current AU Description Future AU Present SI
Future SI
Present SI
Future SI
45 HW/BA-MED-TOFDC-EBM 245 23.0 23.0 23.6 23.6 46 HW/BA-POOR-TOFDC-EBM 246 15.7 15.7 15.7 15.7 47 SS-TOFDC-EBM 247 21.9 21.9 23.0 23.0 48 DR-TOFDC-EBM 248 24.5 24.5 24.5 24.5 49 ACT-TOFDC-EBM 249 29.6 29.6 52 CW-MED-TOFDC-EBM-VQO 252 15.4 15.4 53 CW-POOR-TOFDC-EBM-VQO 253 13.0 13.0 55 HW/BA-MED-TOFDC-EBM-VQO 255 21.1 21.1 56 HW/BA-POOR-TOFDC-EBM-VQO 256 15.8 15.8 57 SS-TOFDC-EBM-VQO 257 18.7 18.7 58 DR-TOFDC-EBM-VQO 258 26.5 26.5 61 CW-MARG 261 10.8 20.8 10.8 20.8 62 HW/BA-MARG 262 12.8 20.4 12.8 20.4 63 CW-MARG-EBM 263 10.9 19.0 10.9 19.1 64 HW/BA-MARG-EBM 264 12.6 17.8 12.7 18.2 65 CW-MARG-EBM-VQO 265 11.0 16.4 66 HW/BA-MARG-EBM-VQO 266 13.0 14.2 67 CW-MARG-TOFDC 267 10.9 10.9 10.9 10.9 68 HW/BA-MARG-TOFDC 268 12.8 12.8 12.8 12.8 69 CW-MARG-TOFDC-EBM 269 10.9 10.9 10.9 10.9 70 HW/BA-MARG-TOFDC-EBM 270 12.9 12.9 12.9 12.9 72 HW/BA-MARG-TOFDC-EBM-VQO 12.8 12.8
101 CW-GOOD 301 19.9 19.9 19.9 19.9 102 CW-MED 302 22.6 22.6 22.6 22.6 103 CW-POOR 303 13.0 13.0 13.0 13.0 104 HW/BA-GOOD 304 25.6 25.6 25.6 25.6 105 HW/BA-MED 305 23.0 23.0 23.0 23.0 106 HW/BA-POOR 306 21.4 21.4 21.4 21.4 107 SS 307 25.4 25.4 25.4 25.4 108 DR 308 22.0 22.0 22.0 22.0 111 CW-GOOD-EBM 311 18.9 18.9 18.8 18.8 112 CW-MED-EBM 312 18.4 18.4 18.4 18.4 113 CW-POOR-EBM 313 21.0 21.0 21.0 21.0 114 HW/BA-GOOD-EBM 314 25.0 25.0 25.0 25.0 115 HW/BA-MED-EBM 315 22.9 22.9 22.9 22.9 116 HW/BA-POOR-EBM 316 21.3 21.3 21.3 21.3 117 SS-EBM 317 24.3 24.3 24.4 24.4 118 DR-EBM 318 22.1 22.1 22.1 22.1 119 ACT-EBM 319 26.8 26.8 120 FDC-EBM 320 22.9 22.9 23.3 23.3 121 CW-GOOD-EBM-VQO 321 16.8 16.8
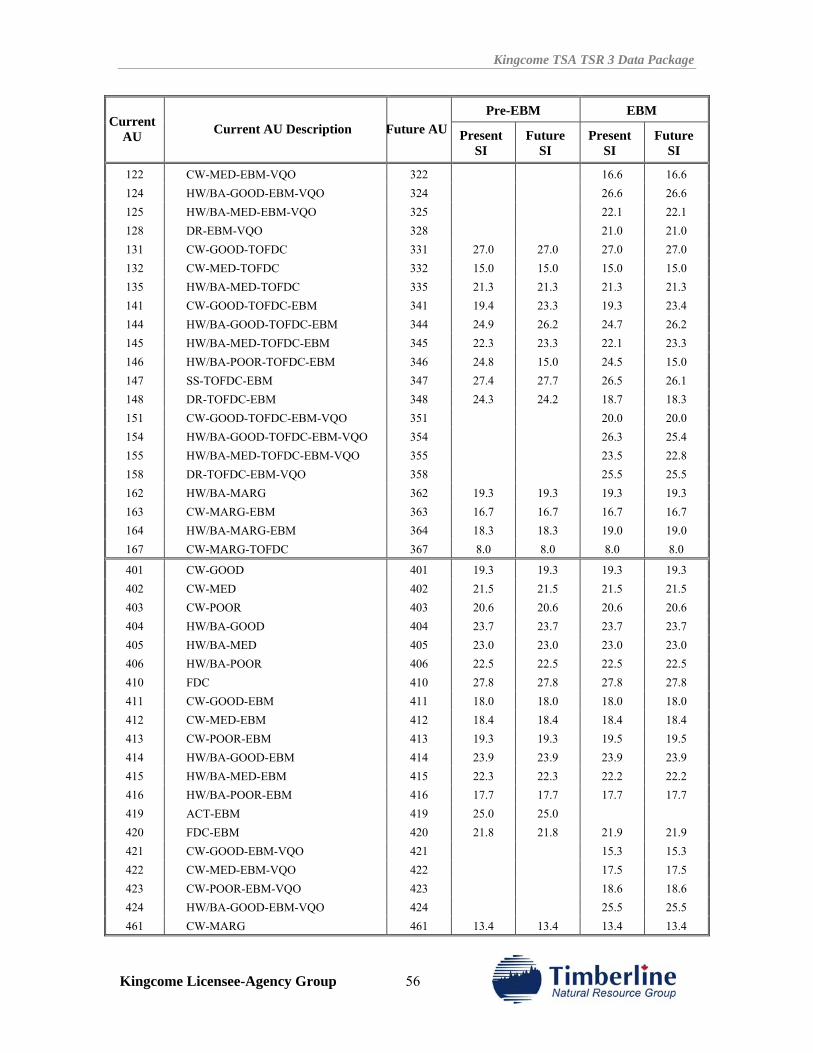
Kingcome TSA TSR 3 Data Package
Kingcome Licensee-Agency Group 56
Pre-EBM EBM Current
AU Current AU Description Future AU Present SI
Future SI
Present SI
Future SI
122 CW-MED-EBM-VQO 322 16.6 16.6 124 HW/BA-GOOD-EBM-VQO 324 26.6 26.6 125 HW/BA-MED-EBM-VQO 325 22.1 22.1 128 DR-EBM-VQO 328 21.0 21.0 131 CW-GOOD-TOFDC 331 27.0 27.0 27.0 27.0 132 CW-MED-TOFDC 332 15.0 15.0 15.0 15.0 135 HW/BA-MED-TOFDC 335 21.3 21.3 21.3 21.3 141 CW-GOOD-TOFDC-EBM 341 19.4 23.3 19.3 23.4 144 HW/BA-GOOD-TOFDC-EBM 344 24.9 26.2 24.7 26.2 145 HW/BA-MED-TOFDC-EBM 345 22.3 23.3 22.1 23.3 146 HW/BA-POOR-TOFDC-EBM 346 24.8 15.0 24.5 15.0 147 SS-TOFDC-EBM 347 27.4 27.7 26.5 26.1 148 DR-TOFDC-EBM 348 24.3 24.2 18.7 18.3 151 CW-GOOD-TOFDC-EBM-VQO 351 20.0 20.0 154 HW/BA-GOOD-TOFDC-EBM-VQO 354 26.3 25.4 155 HW/BA-MED-TOFDC-EBM-VQO 355 23.5 22.8 158 DR-TOFDC-EBM-VQO 358 25.5 25.5 162 HW/BA-MARG 362 19.3 19.3 19.3 19.3 163 CW-MARG-EBM 363 16.7 16.7 16.7 16.7 164 HW/BA-MARG-EBM 364 18.3 18.3 19.0 19.0 167 CW-MARG-TOFDC 367 8.0 8.0 8.0 8.0
401 CW-GOOD 401 19.3 19.3 19.3 19.3 402 CW-MED 402 21.5 21.5 21.5 21.5 403 CW-POOR 403 20.6 20.6 20.6 20.6 404 HW/BA-GOOD 404 23.7 23.7 23.7 23.7 405 HW/BA-MED 405 23.0 23.0 23.0 23.0 406 HW/BA-POOR 406 22.5 22.5 22.5 22.5 410 FDC 410 27.8 27.8 27.8 27.8 411 CW-GOOD-EBM 411 18.0 18.0 18.0 18.0 412 CW-MED-EBM 412 18.4 18.4 18.4 18.4 413 CW-POOR-EBM 413 19.3 19.3 19.5 19.5 414 HW/BA-GOOD-EBM 414 23.9 23.9 23.9 23.9 415 HW/BA-MED-EBM 415 22.3 22.3 22.2 22.2 416 HW/BA-POOR-EBM 416 17.7 17.7 17.7 17.7 419 ACT-EBM 419 25.0 25.0 420 FDC-EBM 420 21.8 21.8 21.9 21.9 421 CW-GOOD-EBM-VQO 421 15.3 15.3 422 CW-MED-EBM-VQO 422 17.5 17.5 423 CW-POOR-EBM-VQO 423 18.6 18.6 424 HW/BA-GOOD-EBM-VQO 424 25.5 25.5 461 CW-MARG 461 13.4 13.4 13.4 13.4
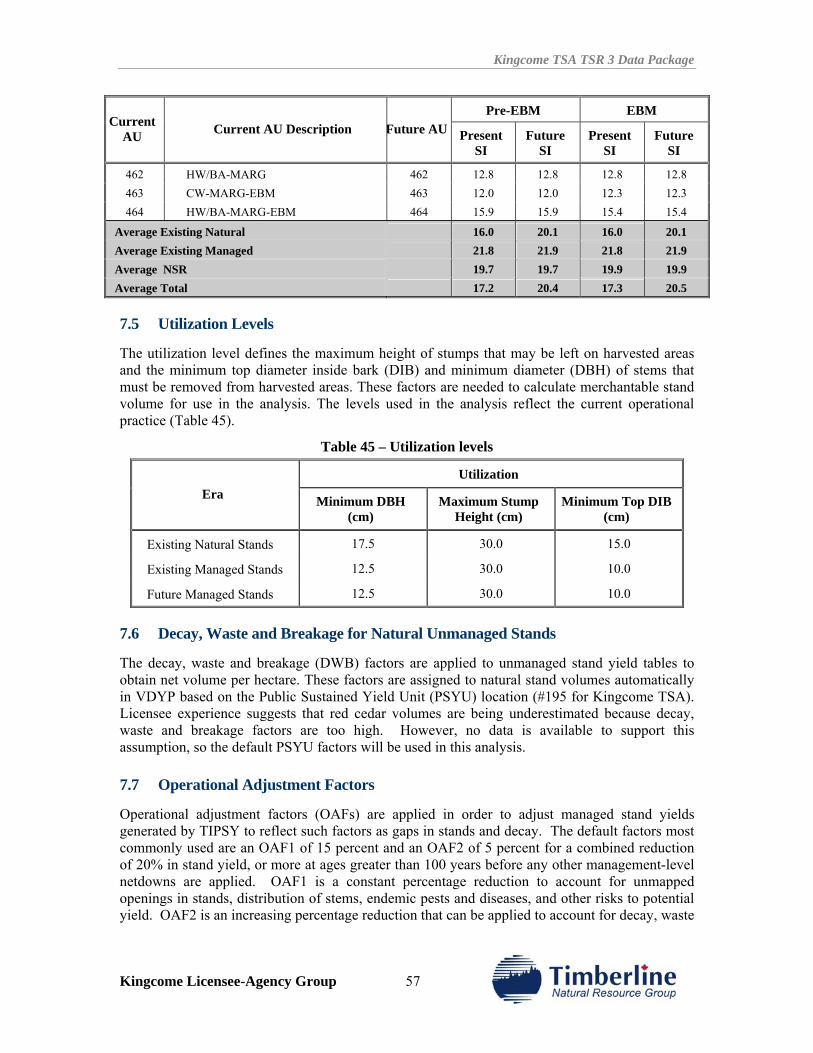
Kingcome TSA TSR 3 Data Package
Kingcome Licensee-Agency Group 57
Pre-EBM EBM Current
AU Current AU Description Future AU Present SI
Future SI
Present SI
Future SI
462 HW/BA-MARG 462 12.8 12.8 12.8 12.8 463 CW-MARG-EBM 463 12.0 12.0 12.3 12.3 464 HW/BA-MARG-EBM 464 15.9 15.9 15.4 15.4
Average Existing Natural 16.0 20.1 16.0 20.1 Average Existing Managed 21.8 21.9 21.8 21.9 Average NSR 19.7 19.7 19.9 19.9 Average Total 17.2 20.4 17.3 20.5
7.5 Utilization Levels
The utilization level defines the maximum height of stumps that may be left on harvested areas and the minimum top diameter inside bark (DIB) and minimum diameter (DBH) of stems that must be removed from harvested areas. These factors are needed to calculate merchantable stand volume for use in the analysis. The levels used in the analysis reflect the current operational practice (Table 45).
Table 45 – Utilization levels
Utilization Era Minimum DBH
(cm) Maximum Stump
Height (cm) Minimum Top DIB
(cm)
Existing Natural Stands 17.5 30.0 15.0
Existing Managed Stands 12.5 30.0 10.0
Future Managed Stands 12.5 30.0 10.0
7.6 Decay, Waste and Breakage for Natural Unmanaged Stands
The decay, waste and breakage (DWB) factors are applied to unmanaged stand yield tables to obtain net volume per hectare. These factors are assigned to natural stand volumes automatically in VDYP based on the Public Sustained Yield Unit (PSYU) location (#195 for Kingcome TSA). Licensee experience suggests that red cedar volumes are being underestimated because decay, waste and breakage factors are too high. However, no data is available to support this assumption, so the default PSYU factors will be used in this analysis.
7.7 Operational Adjustment Factors
Operational adjustment factors (OAFs) are applied in order to adjust managed stand yields generated by TIPSY to reflect such factors as gaps in stands and decay. The default factors most commonly used are an OAF1 of 15 percent and an OAF2 of 5 percent for a combined reduction of 20% in stand yield, or more at ages greater than 100 years before any other management-level netdowns are applied. OAF1 is a constant percentage reduction to account for unmapped openings in stands, distribution of stems, endemic pests and diseases, and other risks to potential yield. OAF2 is an increasing percentage reduction that can be applied to account for decay, waste
Kingcome TSA TSR 3 Data Package
Kingcome Licensee-Agency Group 58
and breakage. The MoFR recommends that the standard OAF1 of 15% and an OAF2 of 5% be used for existing and future managed stands.
Interfor has expressed concern that the 15% OAF1 adjustment overstates the impacts that it is designed to capture. Smaller block sizes characteristic of current operations, and those expected under EBM, reduce the variability of factors associated with the OAF1 allowance as they are more likely to be typed out as non-productive features or incorporated into adjacent unharvested conditions such as wildlife features. On this basis, it has been proposed by Interfor that the OAF1 allowance should be reduced to 8% for existing post-1995 and future regenerating types, to capture the changes in operating practices. While the base case will employ the status quo 15% OAF1, a sensitivity analysis will be conducted to determine the impact of the proposed 8% OAF1.
Kingcome TSA TSR 3 Data Package
Kingcome Licensee-Agency Group 59
8.0 SILVICULTURE
Silvicultural practices and the conditions of existing regenerating conditions in the TSA need to be considered as a prelude to developing managed yield curves.
8.1 Regeneration Delay
Licensees have indicated that regeneration delays range from one to three years, with most cutblocks being replanted within one year of harvest.
8.2 Current and Backlog Not Satisfactorily Restocked Areas
NSR areas originally contained operable timber, were harvested and have not yet regenerated to commercial species. For every stand scheduled for harvest there is a target period for regeneration following harvest. Under the Silviculture Regulations land is not allowed to become backlog. It must be planted within the regeneration delay period if it has not regenerated naturally before that. No backlog NSR exists in the Kingcome TSA. Land that has been harvested recently, for which the regeneration delay period has not yet expired, is current NSR. Current NSR is part of the working forest and is expected to be regenerated on schedule. Stands were designated NSR where the current inventory attribute information is missing or unreliable, in one of three ways, resulting in a total NSR area of 12,937 hectares:
1. If previous stand attribute data were available, the previous stand attributes were used to assign analysis units using a combination of leading species, age, height and stocking classes to assign broad good, medium, and poor site classes. This applied to 3,809 hectares.
2. If no previous stand attribute data was available, the dominant analysis unit in a given BGC subzone was used to assign an equivalent analysis unit to each stand occurring in the same BGC subzone. This applied to 8,851 hectares.
3. In some cases, the combination of age, height, and inventory site index from the current VRI was considered questionable (ie., height 1.3m, age 250yrs). For these stands, the current inventory attributes were ignored, and the stands were assumed to be NSR. No change was made to the analysis unit assignment. This applied to 277 hectares.
Some of these NSR areas may actually be regenerated, but new forest cover inventory attributes have not yet been assigned to the inventory database.
8.3 Genetic Gain
Improvements in growth due to the use of genetically improved seed were modelled during yield table development. Genetic gain is attributed to class ‘A’ seed. Genetic gain estimates are based on Tree Improvement Branch three year average gains between 2005 and 2007. For the Kingcome TSA, genetic gains were assigned only to future managed stands and specifically only for planted regimes of either redcedar or Douglas-fir. One hundred percent of class A seed is used for planted redcedar, and the 3-year average genetic gain is 3%. The genetic gain for Douglas-fir is 6.3%. However, the current operational use of Fdc select seed is 50% Therefore, there is a 3% realized gain for Fdc.
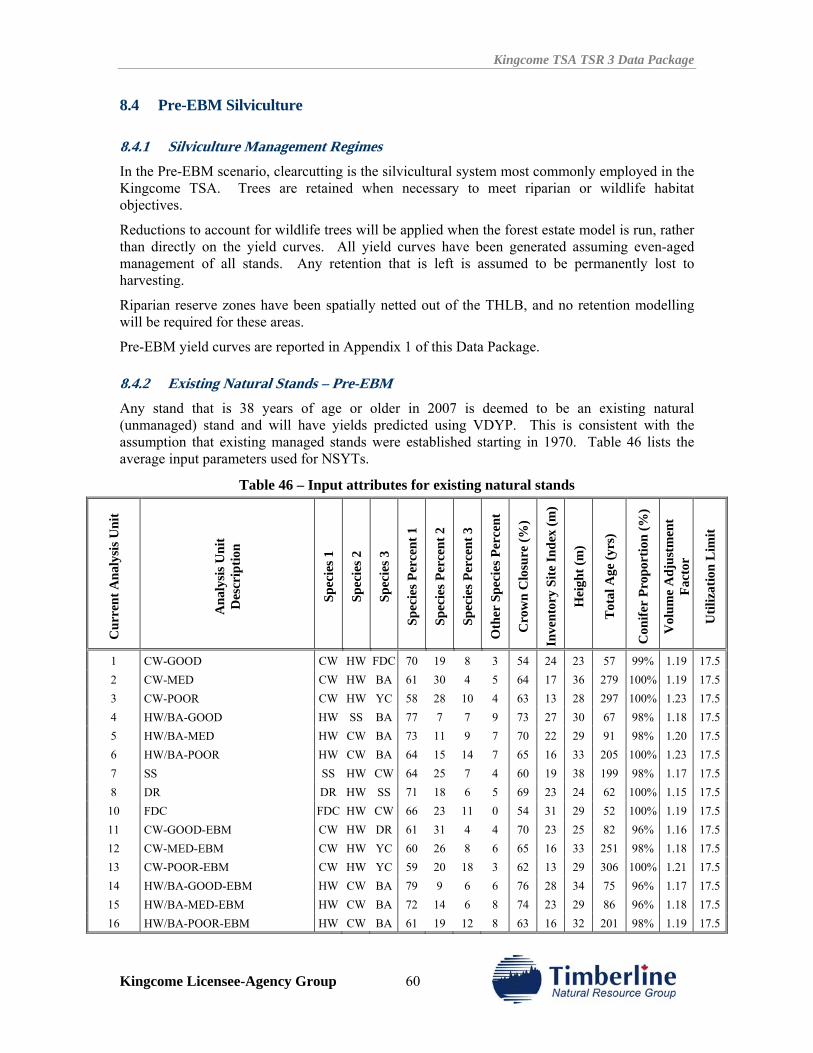
Kingcome TSA TSR 3 Data Package
Kingcome Licensee-Agency Group 60
8.4 Pre-EBM Silviculture
8.4.1 Silviculture Management Regimes In the Pre-EBM scenario, clearcutting is the silvicultural system most commonly employed in the Kingcome TSA. Trees are retained when necessary to meet riparian or wildlife habitat objectives.
Reductions to account for wildlife trees will be applied when the forest estate model is run, rather than directly on the yield curves. All yield curves have been generated assuming even-aged management of all stands. Any retention that is left is assumed to be permanently lost to harvesting.
Riparian reserve zones have been spatially netted out of the THLB, and no retention modelling will be required for these areas.
Pre-EBM yield curves are reported in Appendix 1 of this Data Package.
8.4.2 Existing Natural Stands – Pre-EBM Any stand that is 38 years of age or older in 2007 is deemed to be an existing natural (unmanaged) stand and will have yields predicted using VDYP. This is consistent with the assumption that existing managed stands were established starting in 1970. Table 46 lists the average input parameters used for NSYTs.
Table 46 – Input attributes for existing natural stands
Cur
rent
Ana
lysi
s Uni
t
Ana
lysi
s Uni
t D
escr
iptio
n
Spec
ies 1
Spec
ies 2
Spec
ies 3
Spec
ies P
erce
nt 1
Spec
ies P
erce
nt 2
Spec
ies P
erce
nt 3
Oth
er S
peci
es P
erce
nt
Cro
wn
Clo
sure
(%)
Inve
ntor
y Si
te In
dex
(m)
Hei
ght (
m)
Tot
al A
ge (y
rs)
Con
ifer
Prop
ortio
n (%
)
Vol
ume
Adj
ustm
ent
Fact
or
Util
izat
ion
Lim
it
1 CW-GOOD CW HW FDC 70 19 8 3 54 24 23 57 99% 1.19 17.52 CW-MED CW HW BA 61 30 4 5 64 17 36 279 100% 1.19 17.53 CW-POOR CW HW YC 58 28 10 4 63 13 28 297 100% 1.23 17.54 HW/BA-GOOD HW SS BA 77 7 7 9 73 27 30 67 98% 1.18 17.55 HW/BA-MED HW CW BA 73 11 9 7 70 22 29 91 98% 1.20 17.56 HW/BA-POOR HW CW BA 64 15 14 7 65 16 33 205 100% 1.23 17.57 SS SS HW CW 64 25 7 4 60 19 38 199 98% 1.17 17.58 DR DR HW SS 71 18 6 5 69 23 24 62 100% 1.15 17.5
10 FDC FDC HW CW 66 23 11 0 54 31 29 52 100% 1.19 17.511 CW-GOOD-EBM CW HW DR 61 31 4 4 70 23 25 82 96% 1.16 17.512 CW-MED-EBM CW HW YC 60 26 8 6 65 16 33 251 98% 1.18 17.513 CW-POOR-EBM CW HW YC 59 20 18 3 62 13 29 306 100% 1.21 17.514 HW/BA-GOOD-EBM HW CW BA 79 9 6 6 76 28 34 75 96% 1.17 17.515 HW/BA-MED-EBM HW CW BA 72 14 6 8 74 23 29 86 96% 1.18 17.516 HW/BA-POOR-EBM HW CW BA 61 19 12 8 63 16 32 201 98% 1.19 17.5
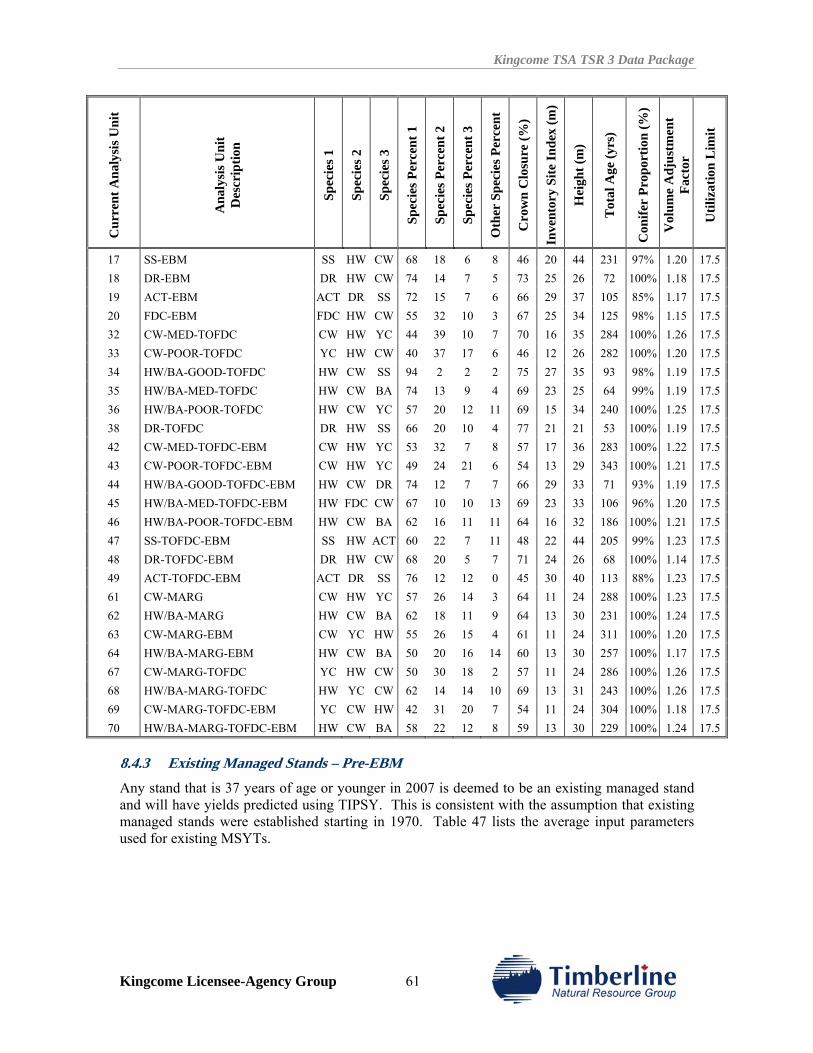
Kingcome TSA TSR 3 Data Package
Kingcome Licensee-Agency Group 61
Cur
rent
Ana
lysi
s Uni
t
Ana
lysi
s Uni
t D
escr
iptio
n
Spec
ies 1
Spec
ies 2
Spec
ies 3
Spec
ies P
erce
nt 1
Spec
ies P
erce
nt 2
Spec
ies P
erce
nt 3
Oth
er S
peci
es P
erce
nt
Cro
wn
Clo
sure
(%)
Inve
ntor
y Si
te In
dex
(m)
Hei
ght (
m)
Tot
al A
ge (y
rs)
Con
ifer
Prop
ortio
n (%
)
Vol
ume
Adj
ustm
ent
Fact
or
Util
izat
ion
Lim
it
17 SS-EBM SS HW CW 68 18 6 8 46 20 44 231 97% 1.20 17.518 DR-EBM DR HW CW 74 14 7 5 73 25 26 72 100% 1.18 17.519 ACT-EBM ACT DR SS 72 15 7 6 66 29 37 105 85% 1.17 17.520 FDC-EBM FDC HW CW 55 32 10 3 67 25 34 125 98% 1.15 17.532 CW-MED-TOFDC CW HW YC 44 39 10 7 70 16 35 284 100% 1.26 17.533 CW-POOR-TOFDC YC HW CW 40 37 17 6 46 12 26 282 100% 1.20 17.534 HW/BA-GOOD-TOFDC HW CW SS 94 2 2 2 75 27 35 93 98% 1.19 17.535 HW/BA-MED-TOFDC HW CW BA 74 13 9 4 69 23 25 64 99% 1.19 17.536 HW/BA-POOR-TOFDC HW CW YC 57 20 12 11 69 15 34 240 100% 1.25 17.538 DR-TOFDC DR HW SS 66 20 10 4 77 21 21 53 100% 1.19 17.542 CW-MED-TOFDC-EBM CW HW YC 53 32 7 8 57 17 36 283 100% 1.22 17.543 CW-POOR-TOFDC-EBM CW HW YC 49 24 21 6 54 13 29 343 100% 1.21 17.544 HW/BA-GOOD-TOFDC-EBM HW CW DR 74 12 7 7 66 29 33 71 93% 1.19 17.545 HW/BA-MED-TOFDC-EBM HW FDC CW 67 10 10 13 69 23 33 106 96% 1.20 17.546 HW/BA-POOR-TOFDC-EBM HW CW BA 62 16 11 11 64 16 32 186 100% 1.21 17.547 SS-TOFDC-EBM SS HW ACT 60 22 7 11 48 22 44 205 99% 1.23 17.548 DR-TOFDC-EBM DR HW CW 68 20 5 7 71 24 26 68 100% 1.14 17.549 ACT-TOFDC-EBM ACT DR SS 76 12 12 0 45 30 40 113 88% 1.23 17.561 CW-MARG CW HW YC 57 26 14 3 64 11 24 288 100% 1.23 17.562 HW/BA-MARG HW CW BA 62 18 11 9 64 13 30 231 100% 1.24 17.563 CW-MARG-EBM CW YC HW 55 26 15 4 61 11 24 311 100% 1.20 17.564 HW/BA-MARG-EBM HW CW BA 50 20 16 14 60 13 30 257 100% 1.17 17.567 CW-MARG-TOFDC YC HW CW 50 30 18 2 57 11 24 286 100% 1.26 17.568 HW/BA-MARG-TOFDC HW YC CW 62 14 14 10 69 13 31 243 100% 1.26 17.569 CW-MARG-TOFDC-EBM YC CW HW 42 31 20 7 54 11 24 304 100% 1.18 17.570 HW/BA-MARG-TOFDC-EBM HW CW BA 58 22 12 8 59 13 30 229 100% 1.24 17.5
8.4.3 Existing Managed Stands – Pre-EBM Any stand that is 37 years of age or younger in 2007 is deemed to be an existing managed stand and will have yields predicted using TIPSY. This is consistent with the assumption that existing managed stands were established starting in 1970. Table 47 lists the average input parameters used for existing MSYTs.
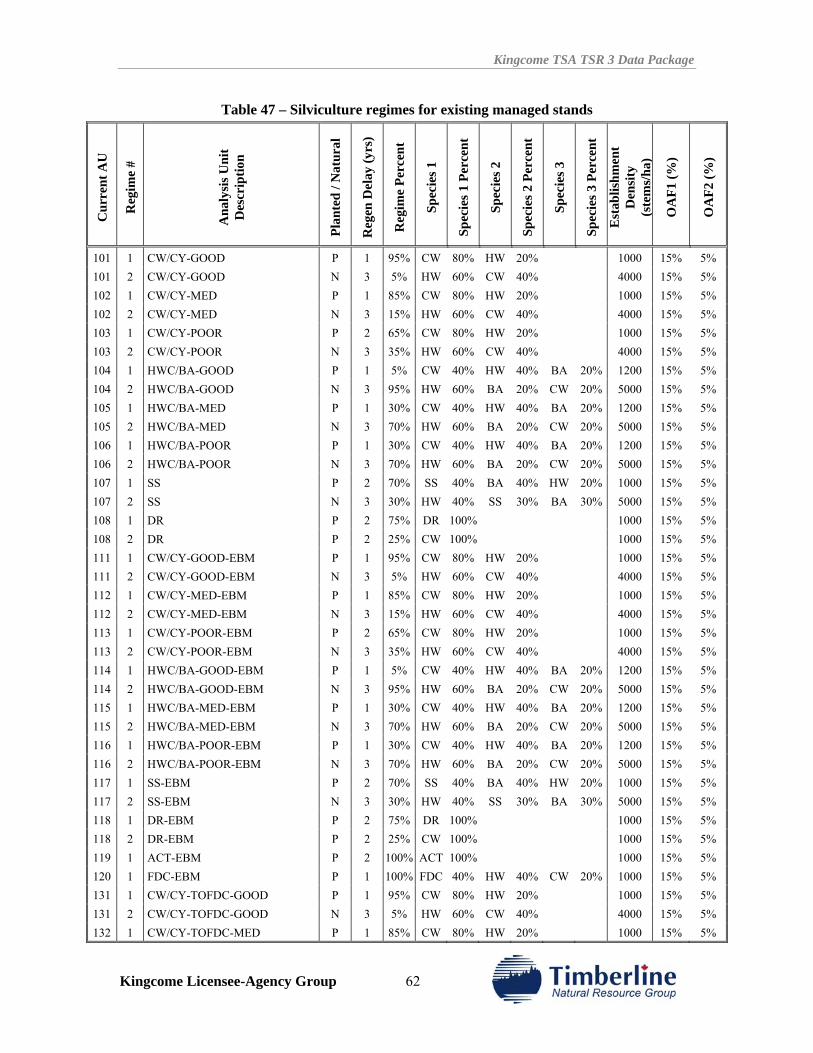
Kingcome TSA TSR 3 Data Package
Kingcome Licensee-Agency Group 62
Table 47 – Silviculture regimes for existing managed stands C
urre
nt A
U
Reg
ime
#
Ana
lysi
s Uni
t D
escr
iptio
n
Plan
ted
/ Nat
ural
Reg
en D
elay
(yrs
)
Reg
ime
Perc
ent
Spec
ies 1
Spec
ies 1
Per
cent
Spec
ies 2
Spec
ies 2
Per
cent
Spec
ies 3
Spec
ies 3
Per
cent
Est
ablis
hmen
t D
ensi
ty
(ste
ms/
ha)
OA
F1 (%
)
OA
F2 (%
)
101 1 CW/CY-GOOD P 1 95% CW 80% HW 20% 1000 15% 5% 101 2 CW/CY-GOOD N 3 5% HW 60% CW 40% 4000 15% 5% 102 1 CW/CY-MED P 1 85% CW 80% HW 20% 1000 15% 5% 102 2 CW/CY-MED N 3 15% HW 60% CW 40% 4000 15% 5% 103 1 CW/CY-POOR P 2 65% CW 80% HW 20% 1000 15% 5% 103 2 CW/CY-POOR N 3 35% HW 60% CW 40% 4000 15% 5% 104 1 HWC/BA-GOOD P 1 5% CW 40% HW 40% BA 20% 1200 15% 5% 104 2 HWC/BA-GOOD N 3 95% HW 60% BA 20% CW 20% 5000 15% 5% 105 1 HWC/BA-MED P 1 30% CW 40% HW 40% BA 20% 1200 15% 5% 105 2 HWC/BA-MED N 3 70% HW 60% BA 20% CW 20% 5000 15% 5% 106 1 HWC/BA-POOR P 1 30% CW 40% HW 40% BA 20% 1200 15% 5% 106 2 HWC/BA-POOR N 3 70% HW 60% BA 20% CW 20% 5000 15% 5% 107 1 SS P 2 70% SS 40% BA 40% HW 20% 1000 15% 5% 107 2 SS N 3 30% HW 40% SS 30% BA 30% 5000 15% 5% 108 1 DR P 2 75% DR 100% 1000 15% 5% 108 2 DR P 2 25% CW 100% 1000 15% 5% 111 1 CW/CY-GOOD-EBM P 1 95% CW 80% HW 20% 1000 15% 5% 111 2 CW/CY-GOOD-EBM N 3 5% HW 60% CW 40% 4000 15% 5% 112 1 CW/CY-MED-EBM P 1 85% CW 80% HW 20% 1000 15% 5% 112 2 CW/CY-MED-EBM N 3 15% HW 60% CW 40% 4000 15% 5% 113 1 CW/CY-POOR-EBM P 2 65% CW 80% HW 20% 1000 15% 5% 113 2 CW/CY-POOR-EBM N 3 35% HW 60% CW 40% 4000 15% 5% 114 1 HWC/BA-GOOD-EBM P 1 5% CW 40% HW 40% BA 20% 1200 15% 5% 114 2 HWC/BA-GOOD-EBM N 3 95% HW 60% BA 20% CW 20% 5000 15% 5% 115 1 HWC/BA-MED-EBM P 1 30% CW 40% HW 40% BA 20% 1200 15% 5% 115 2 HWC/BA-MED-EBM N 3 70% HW 60% BA 20% CW 20% 5000 15% 5% 116 1 HWC/BA-POOR-EBM P 1 30% CW 40% HW 40% BA 20% 1200 15% 5% 116 2 HWC/BA-POOR-EBM N 3 70% HW 60% BA 20% CW 20% 5000 15% 5% 117 1 SS-EBM P 2 70% SS 40% BA 40% HW 20% 1000 15% 5% 117 2 SS-EBM N 3 30% HW 40% SS 30% BA 30% 5000 15% 5% 118 1 DR-EBM P 2 75% DR 100% 1000 15% 5% 118 2 DR-EBM P 2 25% CW 100% 1000 15% 5% 119 1 ACT-EBM P 2 100% ACT 100% 1000 15% 5% 120 1 FDC-EBM P 1 100% FDC 40% HW 40% CW 20% 1000 15% 5% 131 1 CW/CY-TOFDC-GOOD P 1 95% CW 80% HW 20% 1000 15% 5% 131 2 CW/CY-TOFDC-GOOD N 3 5% HW 60% CW 40% 4000 15% 5% 132 1 CW/CY-TOFDC-MED P 1 85% CW 80% HW 20% 1000 15% 5%
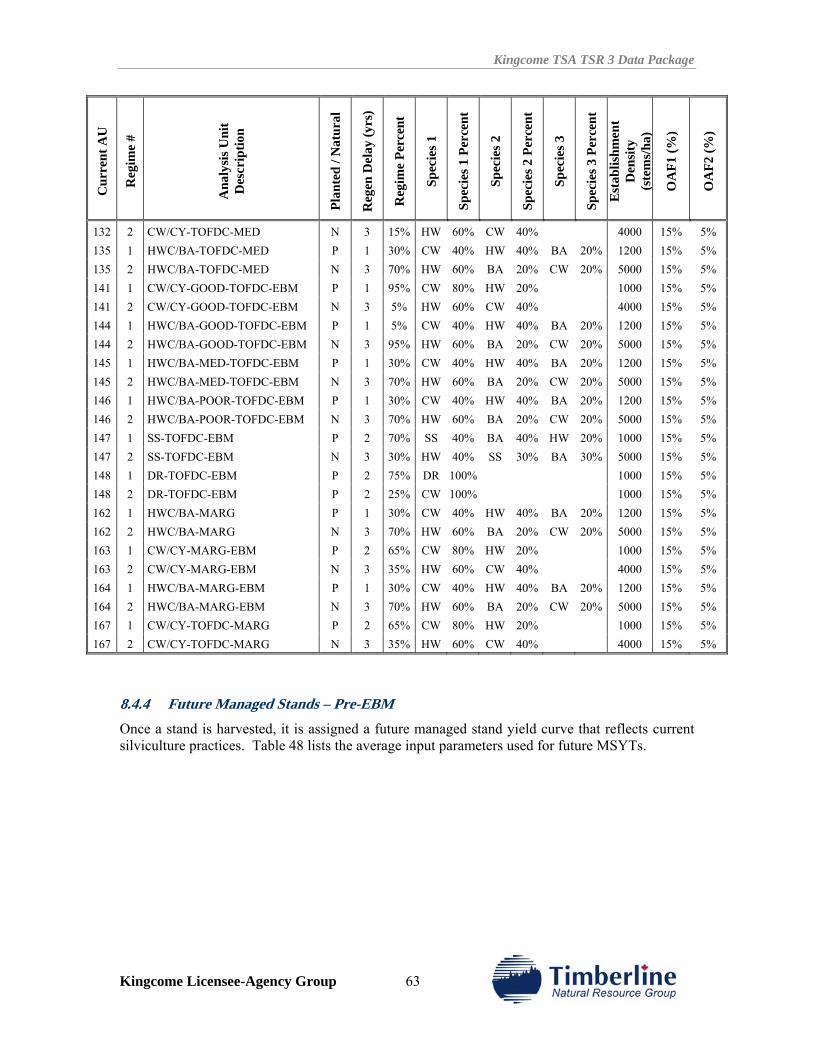
Kingcome TSA TSR 3 Data Package
Kingcome Licensee-Agency Group 63
Cur
rent
AU
Reg
ime
#
Ana
lysi
s Uni
t D
escr
iptio
n
Plan
ted
/ Nat
ural
Reg
en D
elay
(yrs
)
Reg
ime
Perc
ent
Spec
ies 1
Spec
ies 1
Per
cent
Spec
ies 2
Spec
ies 2
Per
cent
Spec
ies 3
Spec
ies 3
Per
cent
Est
ablis
hmen
t D
ensi
ty
(ste
ms/
ha)
OA
F1 (%
)
OA
F2 (%
)
132 2 CW/CY-TOFDC-MED N 3 15% HW 60% CW 40% 4000 15% 5% 135 1 HWC/BA-TOFDC-MED P 1 30% CW 40% HW 40% BA 20% 1200 15% 5% 135 2 HWC/BA-TOFDC-MED N 3 70% HW 60% BA 20% CW 20% 5000 15% 5% 141 1 CW/CY-GOOD-TOFDC-EBM P 1 95% CW 80% HW 20% 1000 15% 5% 141 2 CW/CY-GOOD-TOFDC-EBM N 3 5% HW 60% CW 40% 4000 15% 5% 144 1 HWC/BA-GOOD-TOFDC-EBM P 1 5% CW 40% HW 40% BA 20% 1200 15% 5% 144 2 HWC/BA-GOOD-TOFDC-EBM N 3 95% HW 60% BA 20% CW 20% 5000 15% 5% 145 1 HWC/BA-MED-TOFDC-EBM P 1 30% CW 40% HW 40% BA 20% 1200 15% 5% 145 2 HWC/BA-MED-TOFDC-EBM N 3 70% HW 60% BA 20% CW 20% 5000 15% 5% 146 1 HWC/BA-POOR-TOFDC-EBM P 1 30% CW 40% HW 40% BA 20% 1200 15% 5% 146 2 HWC/BA-POOR-TOFDC-EBM N 3 70% HW 60% BA 20% CW 20% 5000 15% 5% 147 1 SS-TOFDC-EBM P 2 70% SS 40% BA 40% HW 20% 1000 15% 5% 147 2 SS-TOFDC-EBM N 3 30% HW 40% SS 30% BA 30% 5000 15% 5% 148 1 DR-TOFDC-EBM P 2 75% DR 100% 1000 15% 5% 148 2 DR-TOFDC-EBM P 2 25% CW 100% 1000 15% 5% 162 1 HWC/BA-MARG P 1 30% CW 40% HW 40% BA 20% 1200 15% 5% 162 2 HWC/BA-MARG N 3 70% HW 60% BA 20% CW 20% 5000 15% 5% 163 1 CW/CY-MARG-EBM P 2 65% CW 80% HW 20% 1000 15% 5% 163 2 CW/CY-MARG-EBM N 3 35% HW 60% CW 40% 4000 15% 5% 164 1 HWC/BA-MARG-EBM P 1 30% CW 40% HW 40% BA 20% 1200 15% 5% 164 2 HWC/BA-MARG-EBM N 3 70% HW 60% BA 20% CW 20% 5000 15% 5% 167 1 CW/CY-TOFDC-MARG P 2 65% CW 80% HW 20% 1000 15% 5% 167 2 CW/CY-TOFDC-MARG N 3 35% HW 60% CW 40% 4000 15% 5%
8.4.4 Future Managed Stands – Pre-EBM Once a stand is harvested, it is assigned a future managed stand yield curve that reflects current silviculture practices. Table 48 lists the average input parameters used for future MSYTs.
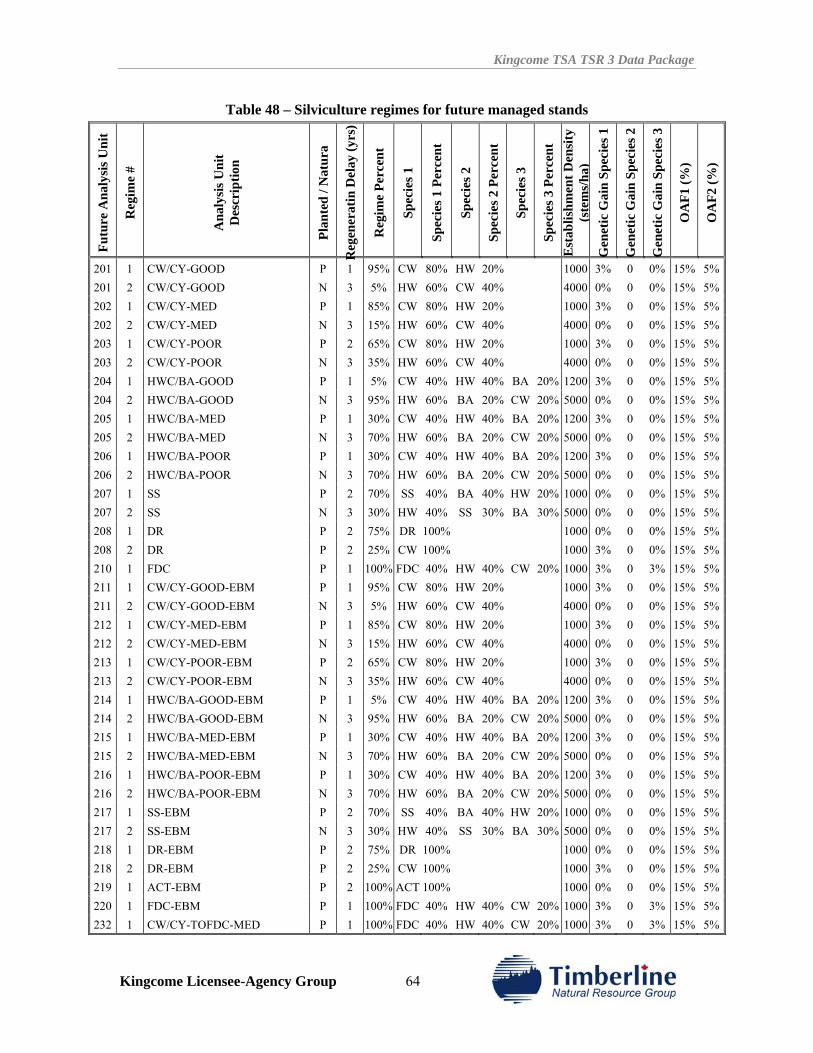
Kingcome TSA TSR 3 Data Package
Kingcome Licensee-Agency Group 64
Table 48 – Silviculture regimes for future managed stands Fu
ture
Ana
lysi
s Uni
t
Reg
ime
#
Ana
lysi
s Uni
t D
escr
iptio
n
Plan
ted
/ Nat
ura
Reg
ener
atin
Del
ay (y
rs)
Reg
ime
Perc
ent
Spec
ies 1
Spec
ies 1
Per
cent
Spec
ies 2
Spec
ies 2
Per
cent
Spec
ies 3
Spec
ies 3
Per
cent
E
stab
lishm
ent D
ensi
ty
(ste
ms/
ha)
Gen
etic
Gai
n Sp
ecie
s 1
Gen
etic
Gai
n Sp
ecie
s 2
Gen
etic
Gai
n Sp
ecie
s 3
OA
F1 (%
)
OA
F2 (%
)
201 1 CW/CY-GOOD P 1 95% CW 80% HW 20% 1000 3% 0 0% 15% 5%201 2 CW/CY-GOOD N 3 5% HW 60% CW 40% 4000 0% 0 0% 15% 5%202 1 CW/CY-MED P 1 85% CW 80% HW 20% 1000 3% 0 0% 15% 5%202 2 CW/CY-MED N 3 15% HW 60% CW 40% 4000 0% 0 0% 15% 5%203 1 CW/CY-POOR P 2 65% CW 80% HW 20% 1000 3% 0 0% 15% 5%203 2 CW/CY-POOR N 3 35% HW 60% CW 40% 4000 0% 0 0% 15% 5%204 1 HWC/BA-GOOD P 1 5% CW 40% HW 40% BA 20% 1200 3% 0 0% 15% 5%204 2 HWC/BA-GOOD N 3 95% HW 60% BA 20% CW 20% 5000 0% 0 0% 15% 5%205 1 HWC/BA-MED P 1 30% CW 40% HW 40% BA 20% 1200 3% 0 0% 15% 5%205 2 HWC/BA-MED N 3 70% HW 60% BA 20% CW 20% 5000 0% 0 0% 15% 5%206 1 HWC/BA-POOR P 1 30% CW 40% HW 40% BA 20% 1200 3% 0 0% 15% 5%206 2 HWC/BA-POOR N 3 70% HW 60% BA 20% CW 20% 5000 0% 0 0% 15% 5%207 1 SS P 2 70% SS 40% BA 40% HW 20% 1000 0% 0 0% 15% 5%207 2 SS N 3 30% HW 40% SS 30% BA 30% 5000 0% 0 0% 15% 5%208 1 DR P 2 75% DR 100% 1000 0% 0 0% 15% 5%208 2 DR P 2 25% CW 100% 1000 3% 0 0% 15% 5%210 1 FDC P 1 100% FDC 40% HW 40% CW 20% 1000 3% 0 3% 15% 5%211 1 CW/CY-GOOD-EBM P 1 95% CW 80% HW 20% 1000 3% 0 0% 15% 5%211 2 CW/CY-GOOD-EBM N 3 5% HW 60% CW 40% 4000 0% 0 0% 15% 5%212 1 CW/CY-MED-EBM P 1 85% CW 80% HW 20% 1000 3% 0 0% 15% 5%212 2 CW/CY-MED-EBM N 3 15% HW 60% CW 40% 4000 0% 0 0% 15% 5%213 1 CW/CY-POOR-EBM P 2 65% CW 80% HW 20% 1000 3% 0 0% 15% 5%213 2 CW/CY-POOR-EBM N 3 35% HW 60% CW 40% 4000 0% 0 0% 15% 5%214 1 HWC/BA-GOOD-EBM P 1 5% CW 40% HW 40% BA 20% 1200 3% 0 0% 15% 5%214 2 HWC/BA-GOOD-EBM N 3 95% HW 60% BA 20% CW 20% 5000 0% 0 0% 15% 5%215 1 HWC/BA-MED-EBM P 1 30% CW 40% HW 40% BA 20% 1200 3% 0 0% 15% 5%215 2 HWC/BA-MED-EBM N 3 70% HW 60% BA 20% CW 20% 5000 0% 0 0% 15% 5%216 1 HWC/BA-POOR-EBM P 1 30% CW 40% HW 40% BA 20% 1200 3% 0 0% 15% 5%216 2 HWC/BA-POOR-EBM N 3 70% HW 60% BA 20% CW 20% 5000 0% 0 0% 15% 5%217 1 SS-EBM P 2 70% SS 40% BA 40% HW 20% 1000 0% 0 0% 15% 5%217 2 SS-EBM N 3 30% HW 40% SS 30% BA 30% 5000 0% 0 0% 15% 5%218 1 DR-EBM P 2 75% DR 100% 1000 0% 0 0% 15% 5%218 2 DR-EBM P 2 25% CW 100% 1000 3% 0 0% 15% 5%219 1 ACT-EBM P 2 100% ACT 100% 1000 0% 0 0% 15% 5%220 1 FDC-EBM P 1 100% FDC 40% HW 40% CW 20% 1000 3% 0 3% 15% 5%232 1 CW/CY-TOFDC-MED P 1 100% FDC 40% HW 40% CW 20% 1000 3% 0 3% 15% 5%
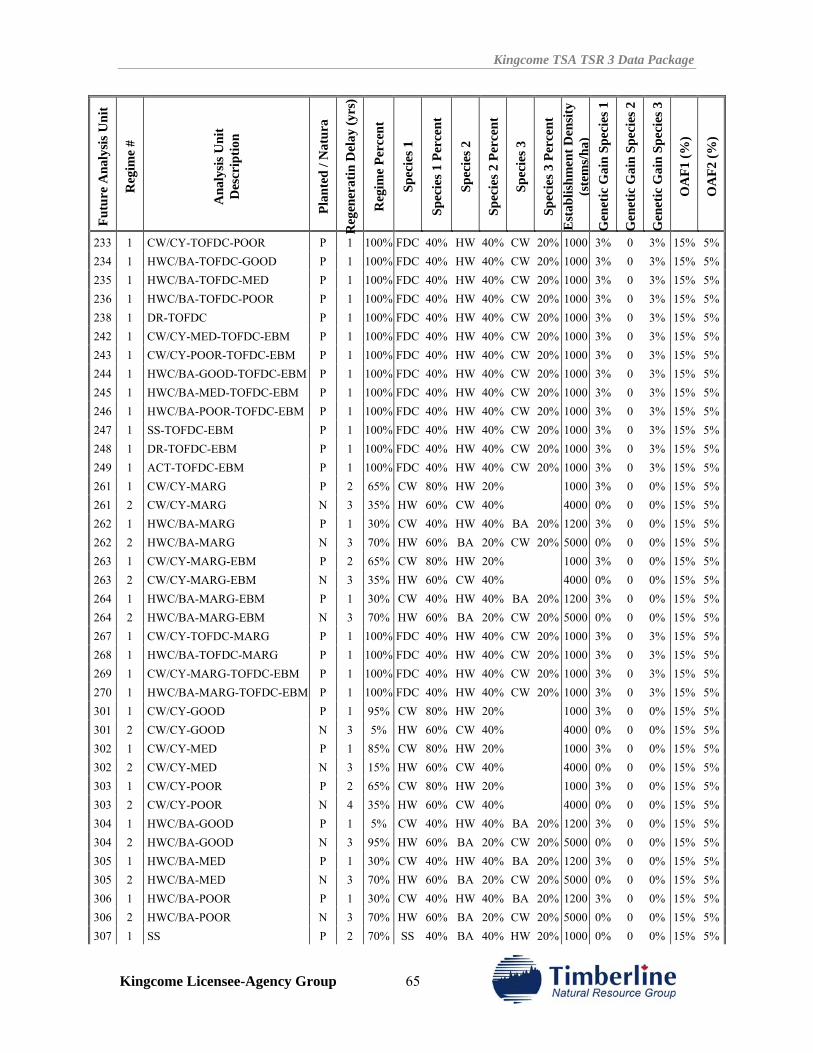
Kingcome TSA TSR 3 Data Package
Kingcome Licensee-Agency Group 65
Futu
re A
naly
sis U
nit
Reg
ime
#
Ana
lysi
s Uni
t D
escr
iptio
n
Plan
ted
/ Nat
ura
Reg
ener
atin
Del
ay (y
rs)
Reg
ime
Perc
ent
Spec
ies 1
Spec
ies 1
Per
cent
Spec
ies 2
Spec
ies 2
Per
cent
Spec
ies 3
Spec
ies 3
Per
cent
E
stab
lishm
ent D
ensi
ty
(ste
ms/
ha)
Gen
etic
Gai
n Sp
ecie
s 1
Gen
etic
Gai
n Sp
ecie
s 2
Gen
etic
Gai
n Sp
ecie
s 3
OA
F1 (%
)
OA
F2 (%
)
233 1 CW/CY-TOFDC-POOR P 1 100% FDC 40% HW 40% CW 20% 1000 3% 0 3% 15% 5%234 1 HWC/BA-TOFDC-GOOD P 1 100% FDC 40% HW 40% CW 20% 1000 3% 0 3% 15% 5%235 1 HWC/BA-TOFDC-MED P 1 100% FDC 40% HW 40% CW 20% 1000 3% 0 3% 15% 5%236 1 HWC/BA-TOFDC-POOR P 1 100% FDC 40% HW 40% CW 20% 1000 3% 0 3% 15% 5%238 1 DR-TOFDC P 1 100% FDC 40% HW 40% CW 20% 1000 3% 0 3% 15% 5%242 1 CW/CY-MED-TOFDC-EBM P 1 100% FDC 40% HW 40% CW 20% 1000 3% 0 3% 15% 5%243 1 CW/CY-POOR-TOFDC-EBM P 1 100% FDC 40% HW 40% CW 20% 1000 3% 0 3% 15% 5%244 1 HWC/BA-GOOD-TOFDC-EBM P 1 100% FDC 40% HW 40% CW 20% 1000 3% 0 3% 15% 5%245 1 HWC/BA-MED-TOFDC-EBM P 1 100% FDC 40% HW 40% CW 20% 1000 3% 0 3% 15% 5%246 1 HWC/BA-POOR-TOFDC-EBM P 1 100% FDC 40% HW 40% CW 20% 1000 3% 0 3% 15% 5%247 1 SS-TOFDC-EBM P 1 100% FDC 40% HW 40% CW 20% 1000 3% 0 3% 15% 5%248 1 DR-TOFDC-EBM P 1 100% FDC 40% HW 40% CW 20% 1000 3% 0 3% 15% 5%249 1 ACT-TOFDC-EBM P 1 100% FDC 40% HW 40% CW 20% 1000 3% 0 3% 15% 5%261 1 CW/CY-MARG P 2 65% CW 80% HW 20% 1000 3% 0 0% 15% 5%261 2 CW/CY-MARG N 3 35% HW 60% CW 40% 4000 0% 0 0% 15% 5%262 1 HWC/BA-MARG P 1 30% CW 40% HW 40% BA 20% 1200 3% 0 0% 15% 5%262 2 HWC/BA-MARG N 3 70% HW 60% BA 20% CW 20% 5000 0% 0 0% 15% 5%263 1 CW/CY-MARG-EBM P 2 65% CW 80% HW 20% 1000 3% 0 0% 15% 5%263 2 CW/CY-MARG-EBM N 3 35% HW 60% CW 40% 4000 0% 0 0% 15% 5%264 1 HWC/BA-MARG-EBM P 1 30% CW 40% HW 40% BA 20% 1200 3% 0 0% 15% 5%264 2 HWC/BA-MARG-EBM N 3 70% HW 60% BA 20% CW 20% 5000 0% 0 0% 15% 5%267 1 CW/CY-TOFDC-MARG P 1 100% FDC 40% HW 40% CW 20% 1000 3% 0 3% 15% 5%268 1 HWC/BA-TOFDC-MARG P 1 100% FDC 40% HW 40% CW 20% 1000 3% 0 3% 15% 5%269 1 CW/CY-MARG-TOFDC-EBM P 1 100% FDC 40% HW 40% CW 20% 1000 3% 0 3% 15% 5%270 1 HWC/BA-MARG-TOFDC-EBM P 1 100% FDC 40% HW 40% CW 20% 1000 3% 0 3% 15% 5%301 1 CW/CY-GOOD P 1 95% CW 80% HW 20% 1000 3% 0 0% 15% 5%301 2 CW/CY-GOOD N 3 5% HW 60% CW 40% 4000 0% 0 0% 15% 5%302 1 CW/CY-MED P 1 85% CW 80% HW 20% 1000 3% 0 0% 15% 5%302 2 CW/CY-MED N 3 15% HW 60% CW 40% 4000 0% 0 0% 15% 5%303 1 CW/CY-POOR P 2 65% CW 80% HW 20% 1000 3% 0 0% 15% 5%303 2 CW/CY-POOR N 4 35% HW 60% CW 40% 4000 0% 0 0% 15% 5%304 1 HWC/BA-GOOD P 1 5% CW 40% HW 40% BA 20% 1200 3% 0 0% 15% 5%304 2 HWC/BA-GOOD N 3 95% HW 60% BA 20% CW 20% 5000 0% 0 0% 15% 5%305 1 HWC/BA-MED P 1 30% CW 40% HW 40% BA 20% 1200 3% 0 0% 15% 5%305 2 HWC/BA-MED N 3 70% HW 60% BA 20% CW 20% 5000 0% 0 0% 15% 5%306 1 HWC/BA-POOR P 1 30% CW 40% HW 40% BA 20% 1200 3% 0 0% 15% 5%306 2 HWC/BA-POOR N 3 70% HW 60% BA 20% CW 20% 5000 0% 0 0% 15% 5%307 1 SS P 2 70% SS 40% BA 40% HW 20% 1000 0% 0 0% 15% 5%
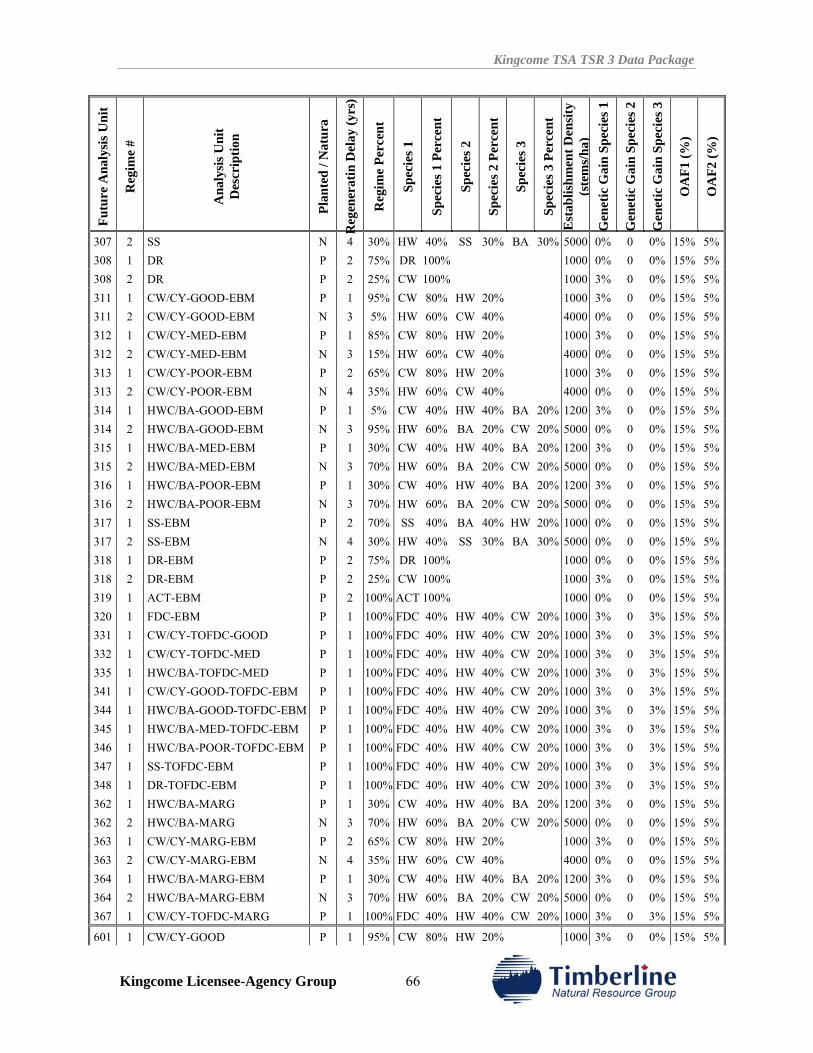
Kingcome TSA TSR 3 Data Package
Kingcome Licensee-Agency Group 66
Futu
re A
naly
sis U
nit
Reg
ime
#
Ana
lysi
s Uni
t D
escr
iptio
n
Plan
ted
/ Nat
ura
Reg
ener
atin
Del
ay (y
rs)
Reg
ime
Perc
ent
Spec
ies 1
Spec
ies 1
Per
cent
Spec
ies 2
Spec
ies 2
Per
cent
Spec
ies 3
Spec
ies 3
Per
cent
E
stab
lishm
ent D
ensi
ty
(ste
ms/
ha)
Gen
etic
Gai
n Sp
ecie
s 1
Gen
etic
Gai
n Sp
ecie
s 2
Gen
etic
Gai
n Sp
ecie
s 3
OA
F1 (%
)
OA
F2 (%
)
307 2 SS N 4 30% HW 40% SS 30% BA 30% 5000 0% 0 0% 15% 5%308 1 DR P 2 75% DR 100% 1000 0% 0 0% 15% 5%308 2 DR P 2 25% CW 100% 1000 3% 0 0% 15% 5%311 1 CW/CY-GOOD-EBM P 1 95% CW 80% HW 20% 1000 3% 0 0% 15% 5%311 2 CW/CY-GOOD-EBM N 3 5% HW 60% CW 40% 4000 0% 0 0% 15% 5%312 1 CW/CY-MED-EBM P 1 85% CW 80% HW 20% 1000 3% 0 0% 15% 5%312 2 CW/CY-MED-EBM N 3 15% HW 60% CW 40% 4000 0% 0 0% 15% 5%313 1 CW/CY-POOR-EBM P 2 65% CW 80% HW 20% 1000 3% 0 0% 15% 5%313 2 CW/CY-POOR-EBM N 4 35% HW 60% CW 40% 4000 0% 0 0% 15% 5%314 1 HWC/BA-GOOD-EBM P 1 5% CW 40% HW 40% BA 20% 1200 3% 0 0% 15% 5%314 2 HWC/BA-GOOD-EBM N 3 95% HW 60% BA 20% CW 20% 5000 0% 0 0% 15% 5%315 1 HWC/BA-MED-EBM P 1 30% CW 40% HW 40% BA 20% 1200 3% 0 0% 15% 5%315 2 HWC/BA-MED-EBM N 3 70% HW 60% BA 20% CW 20% 5000 0% 0 0% 15% 5%316 1 HWC/BA-POOR-EBM P 1 30% CW 40% HW 40% BA 20% 1200 3% 0 0% 15% 5%316 2 HWC/BA-POOR-EBM N 3 70% HW 60% BA 20% CW 20% 5000 0% 0 0% 15% 5%317 1 SS-EBM P 2 70% SS 40% BA 40% HW 20% 1000 0% 0 0% 15% 5%317 2 SS-EBM N 4 30% HW 40% SS 30% BA 30% 5000 0% 0 0% 15% 5%318 1 DR-EBM P 2 75% DR 100% 1000 0% 0 0% 15% 5%318 2 DR-EBM P 2 25% CW 100% 1000 3% 0 0% 15% 5%319 1 ACT-EBM P 2 100% ACT 100% 1000 0% 0 0% 15% 5%320 1 FDC-EBM P 1 100% FDC 40% HW 40% CW 20% 1000 3% 0 3% 15% 5%331 1 CW/CY-TOFDC-GOOD P 1 100% FDC 40% HW 40% CW 20% 1000 3% 0 3% 15% 5%332 1 CW/CY-TOFDC-MED P 1 100% FDC 40% HW 40% CW 20% 1000 3% 0 3% 15% 5%335 1 HWC/BA-TOFDC-MED P 1 100% FDC 40% HW 40% CW 20% 1000 3% 0 3% 15% 5%341 1 CW/CY-GOOD-TOFDC-EBM P 1 100% FDC 40% HW 40% CW 20% 1000 3% 0 3% 15% 5%344 1 HWC/BA-GOOD-TOFDC-EBM P 1 100% FDC 40% HW 40% CW 20% 1000 3% 0 3% 15% 5%345 1 HWC/BA-MED-TOFDC-EBM P 1 100% FDC 40% HW 40% CW 20% 1000 3% 0 3% 15% 5%346 1 HWC/BA-POOR-TOFDC-EBM P 1 100% FDC 40% HW 40% CW 20% 1000 3% 0 3% 15% 5%347 1 SS-TOFDC-EBM P 1 100% FDC 40% HW 40% CW 20% 1000 3% 0 3% 15% 5%348 1 DR-TOFDC-EBM P 1 100% FDC 40% HW 40% CW 20% 1000 3% 0 3% 15% 5%362 1 HWC/BA-MARG P 1 30% CW 40% HW 40% BA 20% 1200 3% 0 0% 15% 5%362 2 HWC/BA-MARG N 3 70% HW 60% BA 20% CW 20% 5000 0% 0 0% 15% 5%363 1 CW/CY-MARG-EBM P 2 65% CW 80% HW 20% 1000 3% 0 0% 15% 5%363 2 CW/CY-MARG-EBM N 4 35% HW 60% CW 40% 4000 0% 0 0% 15% 5%364 1 HWC/BA-MARG-EBM P 1 30% CW 40% HW 40% BA 20% 1200 3% 0 0% 15% 5%364 2 HWC/BA-MARG-EBM N 3 70% HW 60% BA 20% CW 20% 5000 0% 0 0% 15% 5%367 1 CW/CY-TOFDC-MARG P 1 100% FDC 40% HW 40% CW 20% 1000 3% 0 3% 15% 5%
601 1 CW/CY-GOOD P 1 95% CW 80% HW 20% 1000 3% 0 0% 15% 5%
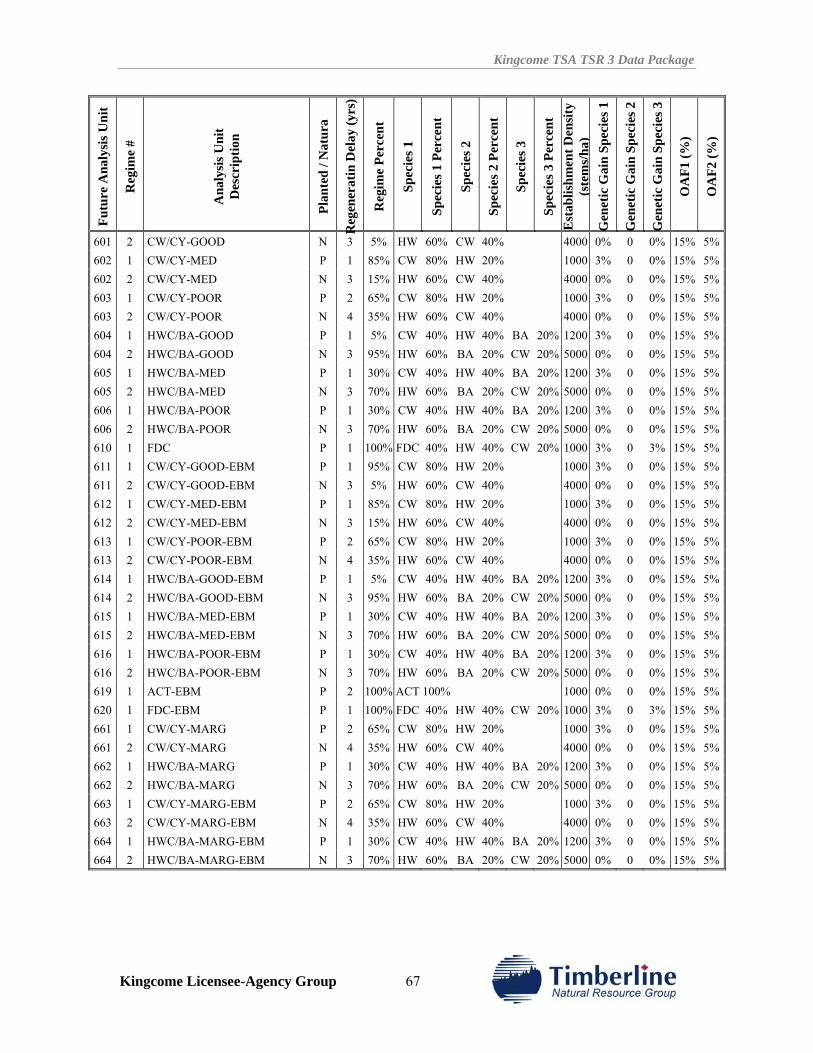
Kingcome TSA TSR 3 Data Package
Kingcome Licensee-Agency Group 67
Futu
re A
naly
sis U
nit
Reg
ime
#
Ana
lysi
s Uni
t D
escr
iptio
n
Plan
ted
/ Nat
ura
Reg
ener
atin
Del
ay (y
rs)
Reg
ime
Perc
ent
Spec
ies 1
Spec
ies 1
Per
cent
Spec
ies 2
Spec
ies 2
Per
cent
Spec
ies 3
Spec
ies 3
Per
cent
E
stab
lishm
ent D
ensi
ty
(ste
ms/
ha)
Gen
etic
Gai
n Sp
ecie
s 1
Gen
etic
Gai
n Sp
ecie
s 2
Gen
etic
Gai
n Sp
ecie
s 3
OA
F1 (%
)
OA
F2 (%
)
601 2 CW/CY-GOOD N 3 5% HW 60% CW 40% 4000 0% 0 0% 15% 5%602 1 CW/CY-MED P 1 85% CW 80% HW 20% 1000 3% 0 0% 15% 5%602 2 CW/CY-MED N 3 15% HW 60% CW 40% 4000 0% 0 0% 15% 5%603 1 CW/CY-POOR P 2 65% CW 80% HW 20% 1000 3% 0 0% 15% 5%603 2 CW/CY-POOR N 4 35% HW 60% CW 40% 4000 0% 0 0% 15% 5%604 1 HWC/BA-GOOD P 1 5% CW 40% HW 40% BA 20% 1200 3% 0 0% 15% 5%604 2 HWC/BA-GOOD N 3 95% HW 60% BA 20% CW 20% 5000 0% 0 0% 15% 5%605 1 HWC/BA-MED P 1 30% CW 40% HW 40% BA 20% 1200 3% 0 0% 15% 5%605 2 HWC/BA-MED N 3 70% HW 60% BA 20% CW 20% 5000 0% 0 0% 15% 5%606 1 HWC/BA-POOR P 1 30% CW 40% HW 40% BA 20% 1200 3% 0 0% 15% 5%606 2 HWC/BA-POOR N 3 70% HW 60% BA 20% CW 20% 5000 0% 0 0% 15% 5%610 1 FDC P 1 100% FDC 40% HW 40% CW 20% 1000 3% 0 3% 15% 5%611 1 CW/CY-GOOD-EBM P 1 95% CW 80% HW 20% 1000 3% 0 0% 15% 5%611 2 CW/CY-GOOD-EBM N 3 5% HW 60% CW 40% 4000 0% 0 0% 15% 5%612 1 CW/CY-MED-EBM P 1 85% CW 80% HW 20% 1000 3% 0 0% 15% 5%612 2 CW/CY-MED-EBM N 3 15% HW 60% CW 40% 4000 0% 0 0% 15% 5%613 1 CW/CY-POOR-EBM P 2 65% CW 80% HW 20% 1000 3% 0 0% 15% 5%613 2 CW/CY-POOR-EBM N 4 35% HW 60% CW 40% 4000 0% 0 0% 15% 5%614 1 HWC/BA-GOOD-EBM P 1 5% CW 40% HW 40% BA 20% 1200 3% 0 0% 15% 5%614 2 HWC/BA-GOOD-EBM N 3 95% HW 60% BA 20% CW 20% 5000 0% 0 0% 15% 5%615 1 HWC/BA-MED-EBM P 1 30% CW 40% HW 40% BA 20% 1200 3% 0 0% 15% 5%615 2 HWC/BA-MED-EBM N 3 70% HW 60% BA 20% CW 20% 5000 0% 0 0% 15% 5%616 1 HWC/BA-POOR-EBM P 1 30% CW 40% HW 40% BA 20% 1200 3% 0 0% 15% 5%616 2 HWC/BA-POOR-EBM N 3 70% HW 60% BA 20% CW 20% 5000 0% 0 0% 15% 5%619 1 ACT-EBM P 2 100% ACT 100% 1000 0% 0 0% 15% 5%620 1 FDC-EBM P 1 100% FDC 40% HW 40% CW 20% 1000 3% 0 3% 15% 5%661 1 CW/CY-MARG P 2 65% CW 80% HW 20% 1000 3% 0 0% 15% 5%661 2 CW/CY-MARG N 4 35% HW 60% CW 40% 4000 0% 0 0% 15% 5%662 1 HWC/BA-MARG P 1 30% CW 40% HW 40% BA 20% 1200 3% 0 0% 15% 5%662 2 HWC/BA-MARG N 3 70% HW 60% BA 20% CW 20% 5000 0% 0 0% 15% 5%663 1 CW/CY-MARG-EBM P 2 65% CW 80% HW 20% 1000 3% 0 0% 15% 5%663 2 CW/CY-MARG-EBM N 4 35% HW 60% CW 40% 4000 0% 0 0% 15% 5%664 1 HWC/BA-MARG-EBM P 1 30% CW 40% HW 40% BA 20% 1200 3% 0 0% 15% 5%664 2 HWC/BA-MARG-EBM N 3 70% HW 60% BA 20% CW 20% 5000 0% 0 0% 15% 5%
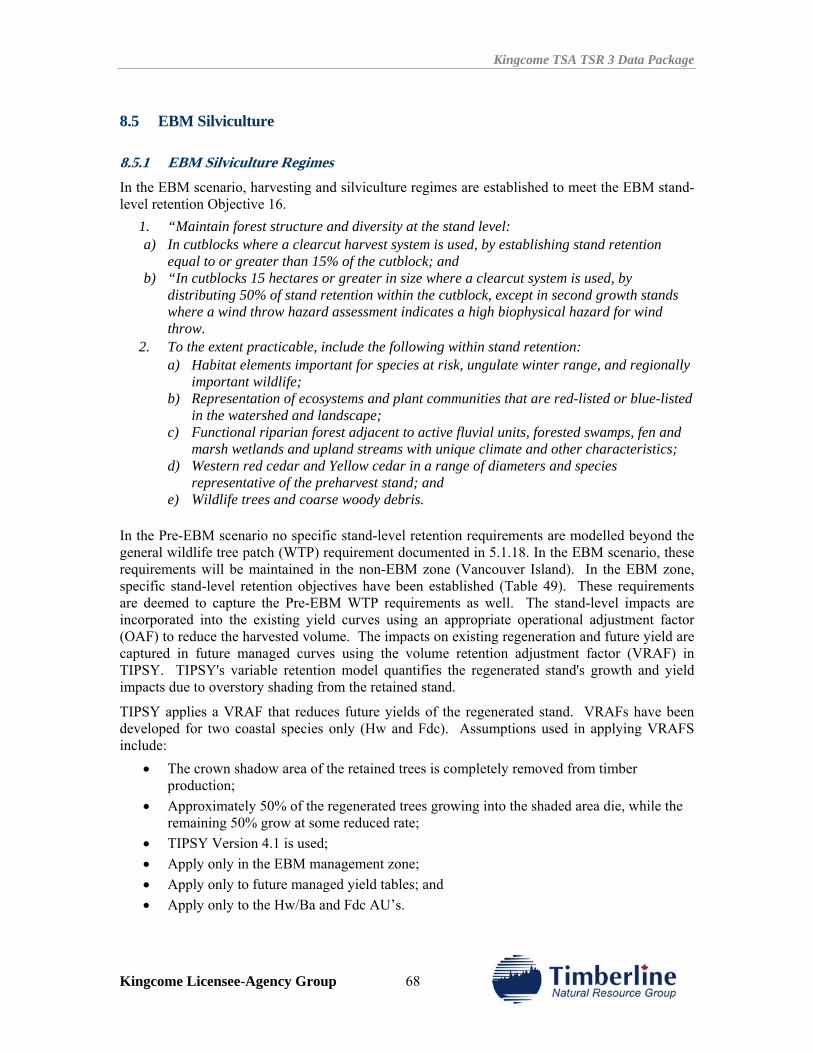
Kingcome TSA TSR 3 Data Package
Kingcome Licensee-Agency Group 68
8.5 EBM Silviculture
8.5.1 EBM Silviculture Regimes In the EBM scenario, harvesting and silviculture regimes are established to meet the EBM stand-level retention Objective 16.
1. “Maintain forest structure and diversity at the stand level: a) In cutblocks where a clearcut harvest system is used, by establishing stand retention
equal to or greater than 15% of the cutblock; and b) “In cutblocks 15 hectares or greater in size where a clearcut system is used, by
distributing 50% of stand retention within the cutblock, except in second growth stands where a wind throw hazard assessment indicates a high biophysical hazard for wind throw.
2. To the extent practicable, include the following within stand retention: a) Habitat elements important for species at risk, ungulate winter range, and regionally
important wildlife; b) Representation of ecosystems and plant communities that are red-listed or blue-listed
in the watershed and landscape; c) Functional riparian forest adjacent to active fluvial units, forested swamps, fen and
marsh wetlands and upland streams with unique climate and other characteristics; d) Western red cedar and Yellow cedar in a range of diameters and species
representative of the preharvest stand; and e) Wildlife trees and coarse woody debris.
In the Pre-EBM scenario no specific stand-level retention requirements are modelled beyond the general wildlife tree patch (WTP) requirement documented in 5.1.18. In the EBM scenario, these requirements will be maintained in the non-EBM zone (Vancouver Island). In the EBM zone, specific stand-level retention objectives have been established (Table 49). These requirements are deemed to capture the Pre-EBM WTP requirements as well. The stand-level impacts are incorporated into the existing yield curves using an appropriate operational adjustment factor (OAF) to reduce the harvested volume. The impacts on existing regeneration and future yield are captured in future managed curves using the volume retention adjustment factor (VRAF) in TIPSY. TIPSY's variable retention model quantifies the regenerated stand's growth and yield impacts due to overstory shading from the retained stand.
TIPSY applies a VRAF that reduces future yields of the regenerated stand. VRAFs have been developed for two coastal species only (Hw and Fdc). Assumptions used in applying VRAFS include:
• The crown shadow area of the retained trees is completely removed from timber production;
• Approximately 50% of the regenerated trees growing into the shaded area die, while the remaining 50% grow at some reduced rate;
• TIPSY Version 4.1 is used; • Apply only in the EBM management zone; • Apply only to future managed yield tables; and • Apply only to the Hw/Ba and Fdc AU’s.
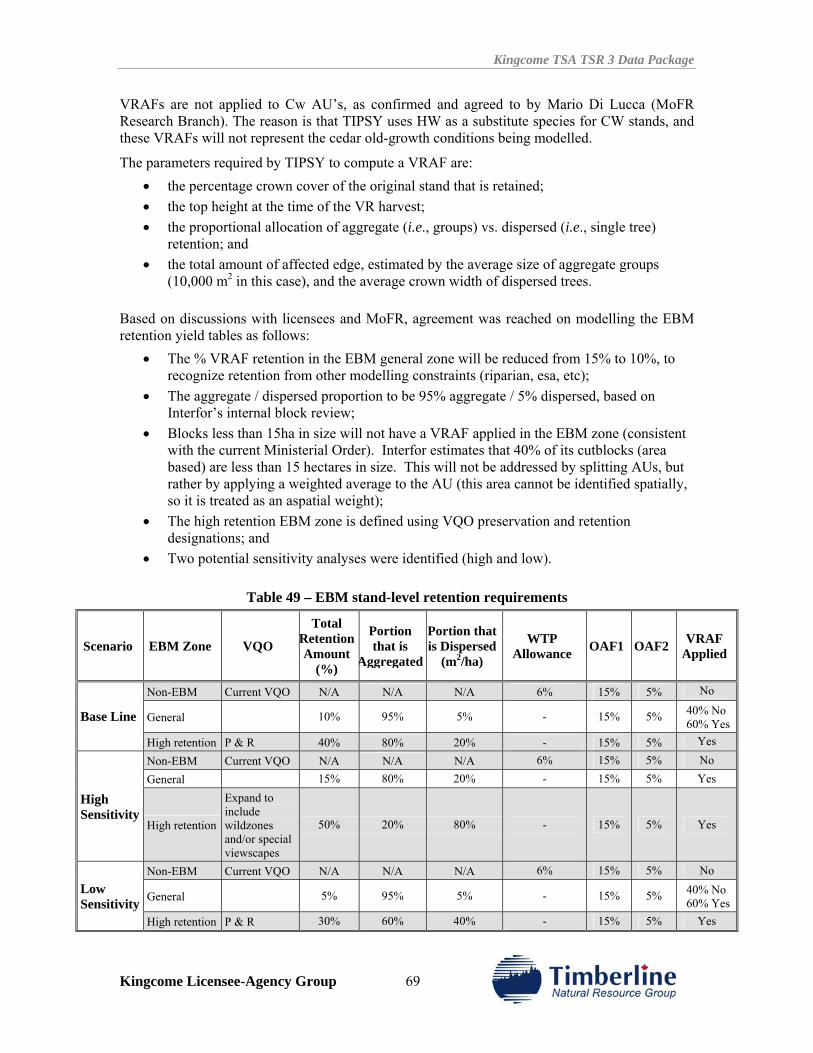
Kingcome TSA TSR 3 Data Package
Kingcome Licensee-Agency Group 69
VRAFs are not applied to Cw AU’s, as confirmed and agreed to by Mario Di Lucca (MoFR Research Branch). The reason is that TIPSY uses HW as a substitute species for CW stands, and these VRAFs will not represent the cedar old-growth conditions being modelled.
The parameters required by TIPSY to compute a VRAF are: • the percentage crown cover of the original stand that is retained; • the top height at the time of the VR harvest; • the proportional allocation of aggregate (i.e., groups) vs. dispersed (i.e., single tree)
retention; and • the total amount of affected edge, estimated by the average size of aggregate groups
(10,000 m2 in this case), and the average crown width of dispersed trees. Based on discussions with licensees and MoFR, agreement was reached on modelling the EBM retention yield tables as follows:
• The % VRAF retention in the EBM general zone will be reduced from 15% to 10%, to recognize retention from other modelling constraints (riparian, esa, etc);
• The aggregate / dispersed proportion to be 95% aggregate / 5% dispersed, based on Interfor’s internal block review;
• Blocks less than 15ha in size will not have a VRAF applied in the EBM zone (consistent with the current Ministerial Order). Interfor estimates that 40% of its cutblocks (area based) are less than 15 hectares in size. This will not be addressed by splitting AUs, but rather by applying a weighted average to the AU (this area cannot be identified spatially, so it is treated as an aspatial weight);
• The high retention EBM zone is defined using VQO preservation and retention designations; and
• Two potential sensitivity analyses were identified (high and low).
Table 49 – EBM stand-level retention requirements
Scenario EBM Zone VQO
Total Retention Amount
(%)
Portion that is
Aggregated
Portion thatis Dispersed
(m2/ha)
WTP Allowance OAF1 OAF2 VRAF
Applied
Non-EBM Current VQO N/A N/A N/A 6% 15% 5% No
General 10% 95% 5% - 15% 5% 40% No 60% Yes Base Line
High retention P & R 40% 80% 20% - 15% 5% Yes
Non-EBM Current VQO N/A N/A N/A 6% 15% 5% No General 15% 80% 20% - 15% 5% Yes
High Sensitivity
High retention
Expand to include wildzones and/or special viewscapes
50% 20% 80% - 15% 5% Yes
Non-EBM Current VQO N/A N/A N/A 6% 15% 5% No
General 5% 95% 5% - 15% 5% 40% No 60% Yes
Low Sensitivity
High retention P & R 30% 60% 40% - 15% 5% Yes
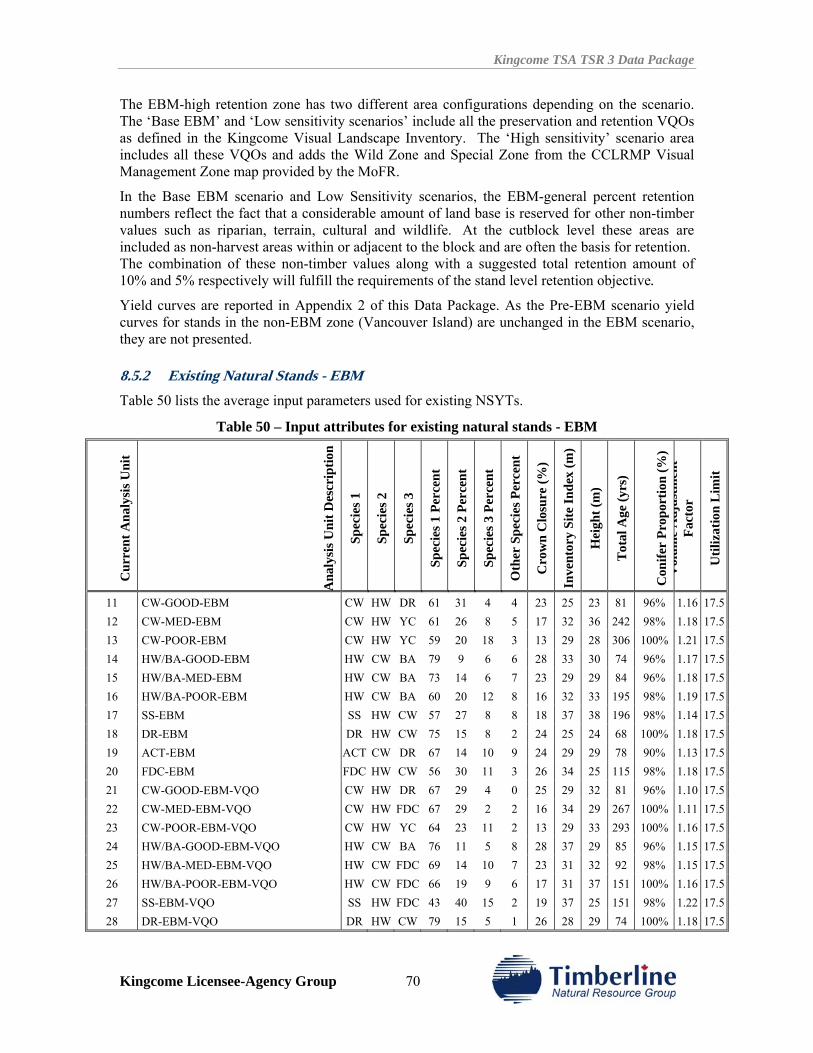
Kingcome TSA TSR 3 Data Package
Kingcome Licensee-Agency Group 70
The EBM-high retention zone has two different area configurations depending on the scenario. The ‘Base EBM’ and ‘Low sensitivity scenarios’ include all the preservation and retention VQOs as defined in the Kingcome Visual Landscape Inventory. The ‘High sensitivity’ scenario area includes all these VQOs and adds the Wild Zone and Special Zone from the CCLRMP Visual Management Zone map provided by the MoFR.
In the Base EBM scenario and Low Sensitivity scenarios, the EBM-general percent retention numbers reflect the fact that a considerable amount of land base is reserved for other non-timber values such as riparian, terrain, cultural and wildlife. At the cutblock level these areas are included as non-harvest areas within or adjacent to the block and are often the basis for retention. The combination of these non-timber values along with a suggested total retention amount of 10% and 5% respectively will fulfill the requirements of the stand level retention objective.
Yield curves are reported in Appendix 2 of this Data Package. As the Pre-EBM scenario yield curves for stands in the non-EBM zone (Vancouver Island) are unchanged in the EBM scenario, they are not presented.
8.5.2 Existing Natural Stands - EBM Table 50 lists the average input parameters used for existing NSYTs.
Table 50 – Input attributes for existing natural stands - EBM
Cur
rent
Ana
lysi
s Uni
t
Ana
lysi
s Uni
t Des
crip
tion
Spec
ies 1
Spec
ies 2
Spec
ies 3
Spec
ies 1
Per
cent
Spec
ies 2
Per
cent
Spec
ies 3
Per
cent
Oth
er S
peci
es P
erce
nt
Cro
wn
Clo
sure
(%)
Inve
ntor
y Si
te In
dex
(m)
Hei
ght (
m)
Tot
al A
ge (y
rs)
Con
ifer
Prop
ortio
n (%
) V
olum
e A
djus
tmen
t Fa
ctor
Util
izat
ion
Lim
it
11 CW-GOOD-EBM CW HW DR 61 31 4 4 23 25 23 81 96% 1.16 17.512 CW-MED-EBM CW HW YC 61 26 8 5 17 32 36 242 98% 1.18 17.513 CW-POOR-EBM CW HW YC 59 20 18 3 13 29 28 306 100% 1.21 17.514 HW/BA-GOOD-EBM HW CW BA 79 9 6 6 28 33 30 74 96% 1.17 17.515 HW/BA-MED-EBM HW CW BA 73 14 6 7 23 29 29 84 96% 1.18 17.516 HW/BA-POOR-EBM HW CW BA 60 20 12 8 16 32 33 195 98% 1.19 17.517 SS-EBM SS HW CW 57 27 8 8 18 37 38 196 98% 1.14 17.518 DR-EBM DR HW CW 75 15 8 2 24 25 24 68 100% 1.18 17.519 ACT-EBM ACT CW DR 67 14 10 9 24 29 29 78 90% 1.13 17.520 FDC-EBM FDC HW CW 56 30 11 3 26 34 25 115 98% 1.18 17.521 CW-GOOD-EBM-VQO CW HW DR 67 29 4 0 25 29 32 81 96% 1.10 17.522 CW-MED-EBM-VQO CW HW FDC 67 29 2 2 16 34 29 267 100% 1.11 17.523 CW-POOR-EBM-VQO CW HW YC 64 23 11 2 13 29 33 293 100% 1.16 17.524 HW/BA-GOOD-EBM-VQO HW CW BA 76 11 5 8 28 37 29 85 96% 1.15 17.525 HW/BA-MED-EBM-VQO HW CW FDC 69 14 10 7 23 31 32 92 98% 1.15 17.526 HW/BA-POOR-EBM-VQO HW CW FDC 66 19 9 6 17 31 37 151 100% 1.16 17.527 SS-EBM-VQO SS HW FDC 43 40 15 2 19 37 25 151 98% 1.22 17.528 DR-EBM-VQO DR HW CW 79 15 5 1 26 28 29 74 100% 1.18 17.5
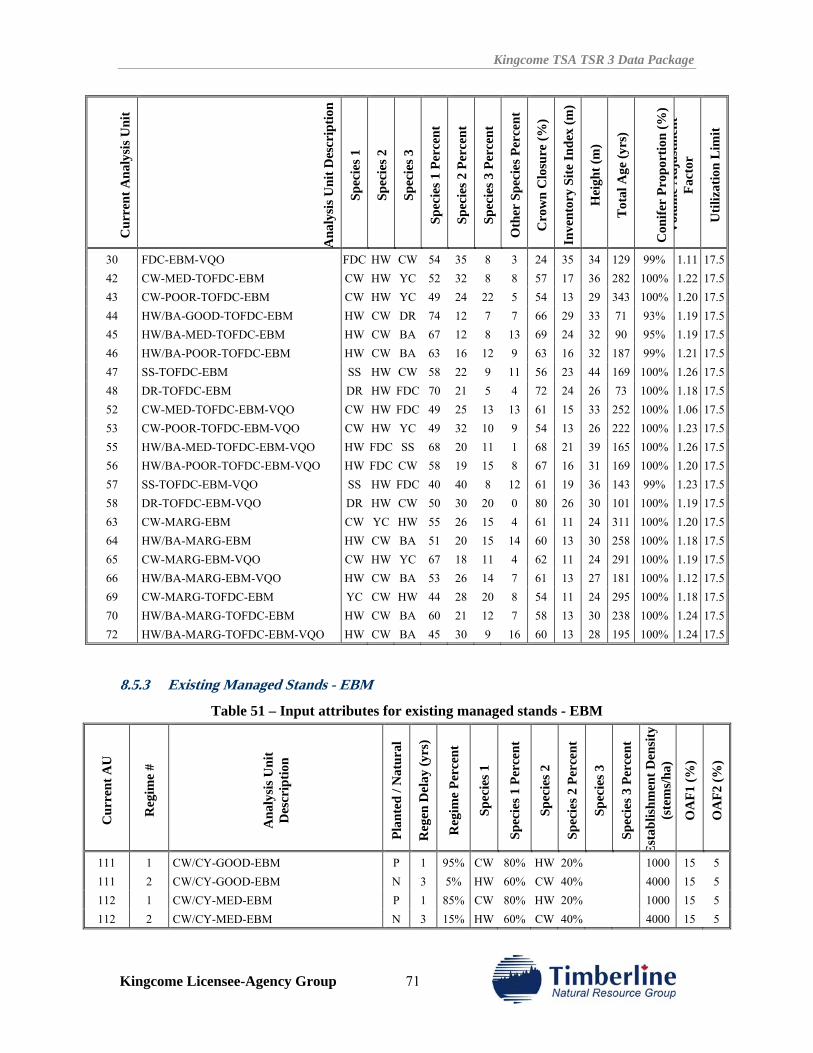
Kingcome TSA TSR 3 Data Package
Kingcome Licensee-Agency Group 71
Cur
rent
Ana
lysi
s Uni
t
Ana
lysi
s Uni
t Des
crip
tion
Spec
ies 1
Spec
ies 2
Spec
ies 3
Spec
ies 1
Per
cent
Spec
ies 2
Per
cent
Spec
ies 3
Per
cent
Oth
er S
peci
es P
erce
nt
Cro
wn
Clo
sure
(%)
Inve
ntor
y Si
te In
dex
(m)
Hei
ght (
m)
Tot
al A
ge (y
rs)
Con
ifer
Prop
ortio
n (%
) V
olum
e A
djus
tmen
t Fa
ctor
Util
izat
ion
Lim
it
30 FDC-EBM-VQO FDC HW CW 54 35 8 3 24 35 34 129 99% 1.11 17.542 CW-MED-TOFDC-EBM CW HW YC 52 32 8 8 57 17 36 282 100% 1.22 17.543 CW-POOR-TOFDC-EBM CW HW YC 49 24 22 5 54 13 29 343 100% 1.20 17.544 HW/BA-GOOD-TOFDC-EBM HW CW DR 74 12 7 7 66 29 33 71 93% 1.19 17.545 HW/BA-MED-TOFDC-EBM HW CW BA 67 12 8 13 69 24 32 90 95% 1.19 17.546 HW/BA-POOR-TOFDC-EBM HW CW BA 63 16 12 9 63 16 32 187 99% 1.21 17.547 SS-TOFDC-EBM SS HW CW 58 22 9 11 56 23 44 169 100% 1.26 17.548 DR-TOFDC-EBM DR HW FDC 70 21 5 4 72 24 26 73 100% 1.18 17.552 CW-MED-TOFDC-EBM-VQO CW HW FDC 49 25 13 13 61 15 33 252 100% 1.06 17.553 CW-POOR-TOFDC-EBM-VQO CW HW YC 49 32 10 9 54 13 26 222 100% 1.23 17.555 HW/BA-MED-TOFDC-EBM-VQO HW FDC SS 68 20 11 1 68 21 39 165 100% 1.26 17.556 HW/BA-POOR-TOFDC-EBM-VQO HW FDC CW 58 19 15 8 67 16 31 169 100% 1.20 17.557 SS-TOFDC-EBM-VQO SS HW FDC 40 40 8 12 61 19 36 143 99% 1.23 17.558 DR-TOFDC-EBM-VQO DR HW CW 50 30 20 0 80 26 30 101 100% 1.19 17.563 CW-MARG-EBM CW YC HW 55 26 15 4 61 11 24 311 100% 1.20 17.564 HW/BA-MARG-EBM HW CW BA 51 20 15 14 60 13 30 258 100% 1.18 17.565 CW-MARG-EBM-VQO CW HW YC 67 18 11 4 62 11 24 291 100% 1.19 17.566 HW/BA-MARG-EBM-VQO HW CW BA 53 26 14 7 61 13 27 181 100% 1.12 17.569 CW-MARG-TOFDC-EBM YC CW HW 44 28 20 8 54 11 24 295 100% 1.18 17.570 HW/BA-MARG-TOFDC-EBM HW CW BA 60 21 12 7 58 13 30 238 100% 1.24 17.572 HW/BA-MARG-TOFDC-EBM-VQO HW CW BA 45 30 9 16 60 13 28 195 100% 1.24 17.5
8.5.3 Existing Managed Stands - EBM
Table 51 – Input attributes for existing managed stands - EBM
Cur
rent
AU
Reg
ime
#
Ana
lysi
s Uni
t D
escr
iptio
n
Plan
ted
/ Nat
ural
Reg
en D
elay
(yrs
)
Reg
ime
Perc
ent
Spec
ies 1
Spec
ies 1
Per
cent
Spec
ies 2
Spec
ies 2
Per
cent
Spec
ies 3
Spec
ies 3
Per
cent
Est
ablis
hmen
t Den
sity
(s
tem
s/ha
)
OA
F1 (%
)
OA
F2 (%
)
111 1 CW/CY-GOOD-EBM P 1 95% CW 80% HW 20% 1000 15 5 111 2 CW/CY-GOOD-EBM N 3 5% HW 60% CW 40% 4000 15 5 112 1 CW/CY-MED-EBM P 1 85% CW 80% HW 20% 1000 15 5 112 2 CW/CY-MED-EBM N 3 15% HW 60% CW 40% 4000 15 5
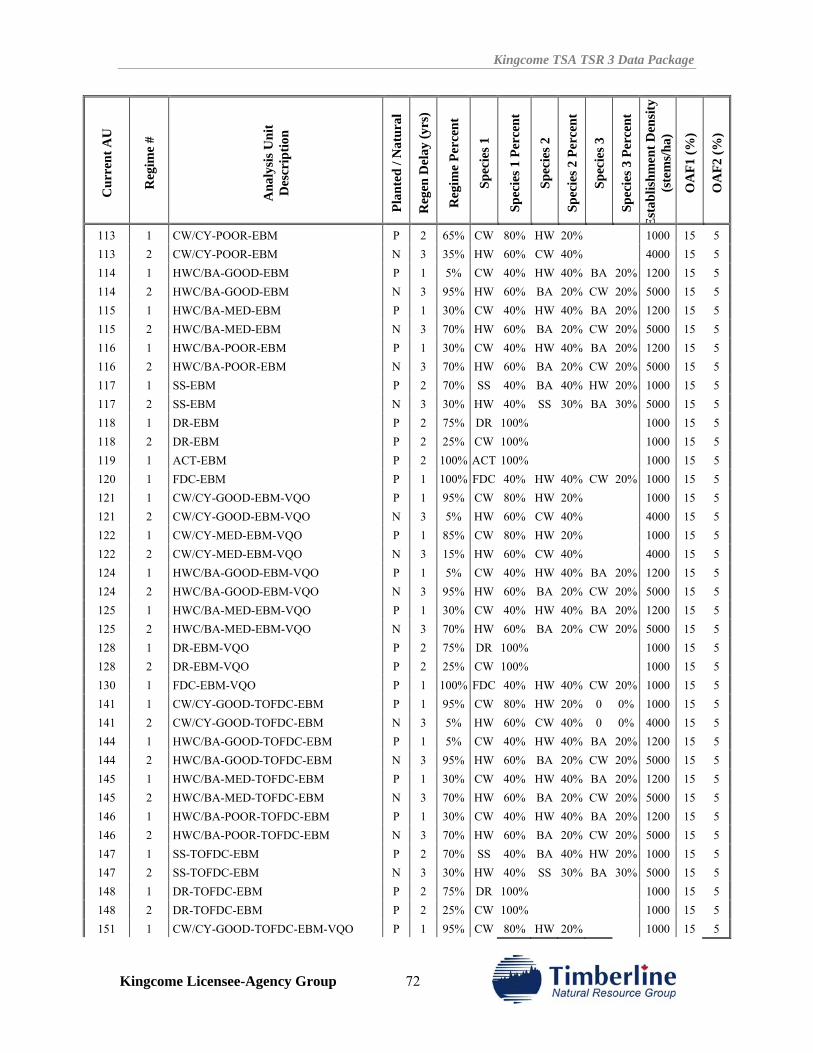
Kingcome TSA TSR 3 Data Package
Kingcome Licensee-Agency Group 72
Cur
rent
AU
Reg
ime
#
Ana
lysi
s Uni
t D
escr
iptio
n
Plan
ted
/ Nat
ural
Reg
en D
elay
(yrs
)
Reg
ime
Perc
ent
Spec
ies 1
Spec
ies 1
Per
cent
Spec
ies 2
Spec
ies 2
Per
cent
Spec
ies 3
Spec
ies 3
Per
cent
Est
ablis
hmen
t Den
sity
(s
tem
s/ha
)
OA
F1 (%
)
OA
F2 (%
)
113 1 CW/CY-POOR-EBM P 2 65% CW 80% HW 20% 1000 15 5 113 2 CW/CY-POOR-EBM N 3 35% HW 60% CW 40% 4000 15 5 114 1 HWC/BA-GOOD-EBM P 1 5% CW 40% HW 40% BA 20% 1200 15 5 114 2 HWC/BA-GOOD-EBM N 3 95% HW 60% BA 20% CW 20% 5000 15 5 115 1 HWC/BA-MED-EBM P 1 30% CW 40% HW 40% BA 20% 1200 15 5 115 2 HWC/BA-MED-EBM N 3 70% HW 60% BA 20% CW 20% 5000 15 5 116 1 HWC/BA-POOR-EBM P 1 30% CW 40% HW 40% BA 20% 1200 15 5 116 2 HWC/BA-POOR-EBM N 3 70% HW 60% BA 20% CW 20% 5000 15 5 117 1 SS-EBM P 2 70% SS 40% BA 40% HW 20% 1000 15 5 117 2 SS-EBM N 3 30% HW 40% SS 30% BA 30% 5000 15 5 118 1 DR-EBM P 2 75% DR 100% 1000 15 5 118 2 DR-EBM P 2 25% CW 100% 1000 15 5 119 1 ACT-EBM P 2 100% ACT 100% 1000 15 5 120 1 FDC-EBM P 1 100% FDC 40% HW 40% CW 20% 1000 15 5 121 1 CW/CY-GOOD-EBM-VQO P 1 95% CW 80% HW 20% 1000 15 5 121 2 CW/CY-GOOD-EBM-VQO N 3 5% HW 60% CW 40% 4000 15 5 122 1 CW/CY-MED-EBM-VQO P 1 85% CW 80% HW 20% 1000 15 5 122 2 CW/CY-MED-EBM-VQO N 3 15% HW 60% CW 40% 4000 15 5 124 1 HWC/BA-GOOD-EBM-VQO P 1 5% CW 40% HW 40% BA 20% 1200 15 5 124 2 HWC/BA-GOOD-EBM-VQO N 3 95% HW 60% BA 20% CW 20% 5000 15 5 125 1 HWC/BA-MED-EBM-VQO P 1 30% CW 40% HW 40% BA 20% 1200 15 5 125 2 HWC/BA-MED-EBM-VQO N 3 70% HW 60% BA 20% CW 20% 5000 15 5 128 1 DR-EBM-VQO P 2 75% DR 100% 1000 15 5 128 2 DR-EBM-VQO P 2 25% CW 100% 1000 15 5 130 1 FDC-EBM-VQO P 1 100% FDC 40% HW 40% CW 20% 1000 15 5 141 1 CW/CY-GOOD-TOFDC-EBM P 1 95% CW 80% HW 20% 0 0% 1000 15 5 141 2 CW/CY-GOOD-TOFDC-EBM N 3 5% HW 60% CW 40% 0 0% 4000 15 5 144 1 HWC/BA-GOOD-TOFDC-EBM P 1 5% CW 40% HW 40% BA 20% 1200 15 5 144 2 HWC/BA-GOOD-TOFDC-EBM N 3 95% HW 60% BA 20% CW 20% 5000 15 5 145 1 HWC/BA-MED-TOFDC-EBM P 1 30% CW 40% HW 40% BA 20% 1200 15 5 145 2 HWC/BA-MED-TOFDC-EBM N 3 70% HW 60% BA 20% CW 20% 5000 15 5 146 1 HWC/BA-POOR-TOFDC-EBM P 1 30% CW 40% HW 40% BA 20% 1200 15 5 146 2 HWC/BA-POOR-TOFDC-EBM N 3 70% HW 60% BA 20% CW 20% 5000 15 5 147 1 SS-TOFDC-EBM P 2 70% SS 40% BA 40% HW 20% 1000 15 5 147 2 SS-TOFDC-EBM N 3 30% HW 40% SS 30% BA 30% 5000 15 5 148 1 DR-TOFDC-EBM P 2 75% DR 100% 1000 15 5 148 2 DR-TOFDC-EBM P 2 25% CW 100% 1000 15 5 151 1 CW/CY-GOOD-TOFDC-EBM-VQO P 1 95% CW 80% HW 20% 1000 15 5
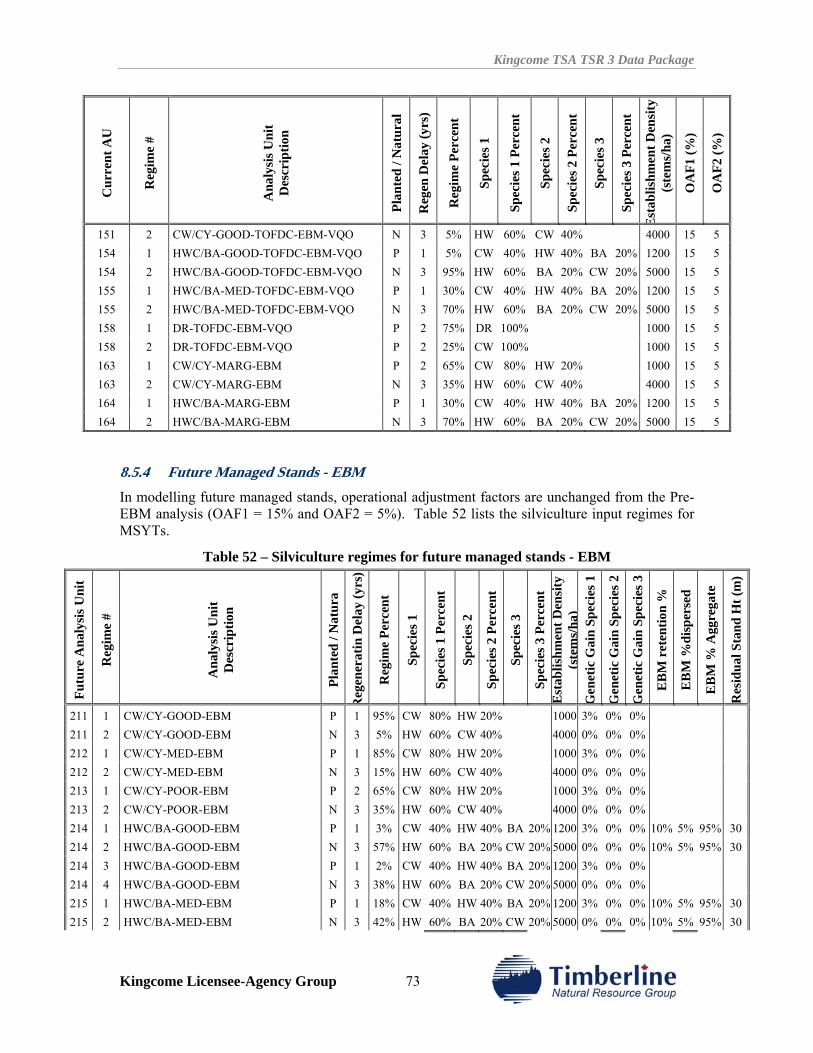
Kingcome TSA TSR 3 Data Package
Kingcome Licensee-Agency Group 73
Cur
rent
AU
Reg
ime
#
Ana
lysi
s Uni
t D
escr
iptio
n
Plan
ted
/ Nat
ural
Reg
en D
elay
(yrs
)
Reg
ime
Perc
ent
Spec
ies 1
Spec
ies 1
Per
cent
Spec
ies 2
Spec
ies 2
Per
cent
Spec
ies 3
Spec
ies 3
Per
cent
Est
ablis
hmen
t Den
sity
(s
tem
s/ha
)
OA
F1 (%
)
OA
F2 (%
)
151 2 CW/CY-GOOD-TOFDC-EBM-VQO N 3 5% HW 60% CW 40% 4000 15 5 154 1 HWC/BA-GOOD-TOFDC-EBM-VQO P 1 5% CW 40% HW 40% BA 20% 1200 15 5 154 2 HWC/BA-GOOD-TOFDC-EBM-VQO N 3 95% HW 60% BA 20% CW 20% 5000 15 5 155 1 HWC/BA-MED-TOFDC-EBM-VQO P 1 30% CW 40% HW 40% BA 20% 1200 15 5 155 2 HWC/BA-MED-TOFDC-EBM-VQO N 3 70% HW 60% BA 20% CW 20% 5000 15 5 158 1 DR-TOFDC-EBM-VQO P 2 75% DR 100% 1000 15 5 158 2 DR-TOFDC-EBM-VQO P 2 25% CW 100% 1000 15 5 163 1 CW/CY-MARG-EBM P 2 65% CW 80% HW 20% 1000 15 5 163 2 CW/CY-MARG-EBM N 3 35% HW 60% CW 40% 4000 15 5 164 1 HWC/BA-MARG-EBM P 1 30% CW 40% HW 40% BA 20% 1200 15 5 164 2 HWC/BA-MARG-EBM N 3 70% HW 60% BA 20% CW 20% 5000 15 5
8.5.4 Future Managed Stands - EBM In modelling future managed stands, operational adjustment factors are unchanged from the Pre-EBM analysis (OAF1 = 15% and OAF2 = 5%). Table 52 lists the silviculture input regimes for MSYTs.
Table 52 – Silviculture regimes for future managed stands - EBM
Futu
re A
naly
sis U
nit
Reg
ime
#
Ana
lysi
s Uni
t D
escr
iptio
n
Plan
ted
/ Nat
ura
Reg
ener
atin
Del
ay (y
rs)
Reg
ime
Perc
ent
Spec
ies 1
Spec
ies 1
Per
cent
Spec
ies 2
Spec
ies 2
Per
cent
Spec
ies 3
Spec
ies 3
Per
cent
E
stab
lishm
ent D
ensi
ty
(ste
ms/
ha)
Gen
etic
Gai
n Sp
ecie
s 1
Gen
etic
Gai
n Sp
ecie
s 2
Gen
etic
Gai
n Sp
ecie
s 3
EB
M r
eten
tion
%
EB
M %
disp
erse
d
EB
M %
Agg
rega
te
Res
idua
l Sta
nd H
t (m
) 211 1 CW/CY-GOOD-EBM P 1 95% CW 80% HW 20% 1000 3% 0% 0% 211 2 CW/CY-GOOD-EBM N 3 5% HW 60% CW 40% 4000 0% 0% 0% 212 1 CW/CY-MED-EBM P 1 85% CW 80% HW 20% 1000 3% 0% 0% 212 2 CW/CY-MED-EBM N 3 15% HW 60% CW 40% 4000 0% 0% 0% 213 1 CW/CY-POOR-EBM P 2 65% CW 80% HW 20% 1000 3% 0% 0% 213 2 CW/CY-POOR-EBM N 3 35% HW 60% CW 40% 4000 0% 0% 0% 214 1 HWC/BA-GOOD-EBM P 1 3% CW 40% HW 40% BA 20% 1200 3% 0% 0% 10% 5% 95% 30214 2 HWC/BA-GOOD-EBM N 3 57% HW 60% BA 20% CW 20% 5000 0% 0% 0% 10% 5% 95% 30214 3 HWC/BA-GOOD-EBM P 1 2% CW 40% HW 40% BA 20% 1200 3% 0% 0% 214 4 HWC/BA-GOOD-EBM N 3 38% HW 60% BA 20% CW 20% 5000 0% 0% 0% 215 1 HWC/BA-MED-EBM P 1 18% CW 40% HW 40% BA 20% 1200 3% 0% 0% 10% 5% 95% 30215 2 HWC/BA-MED-EBM N 3 42% HW 60% BA 20% CW 20% 5000 0% 0% 0% 10% 5% 95% 30
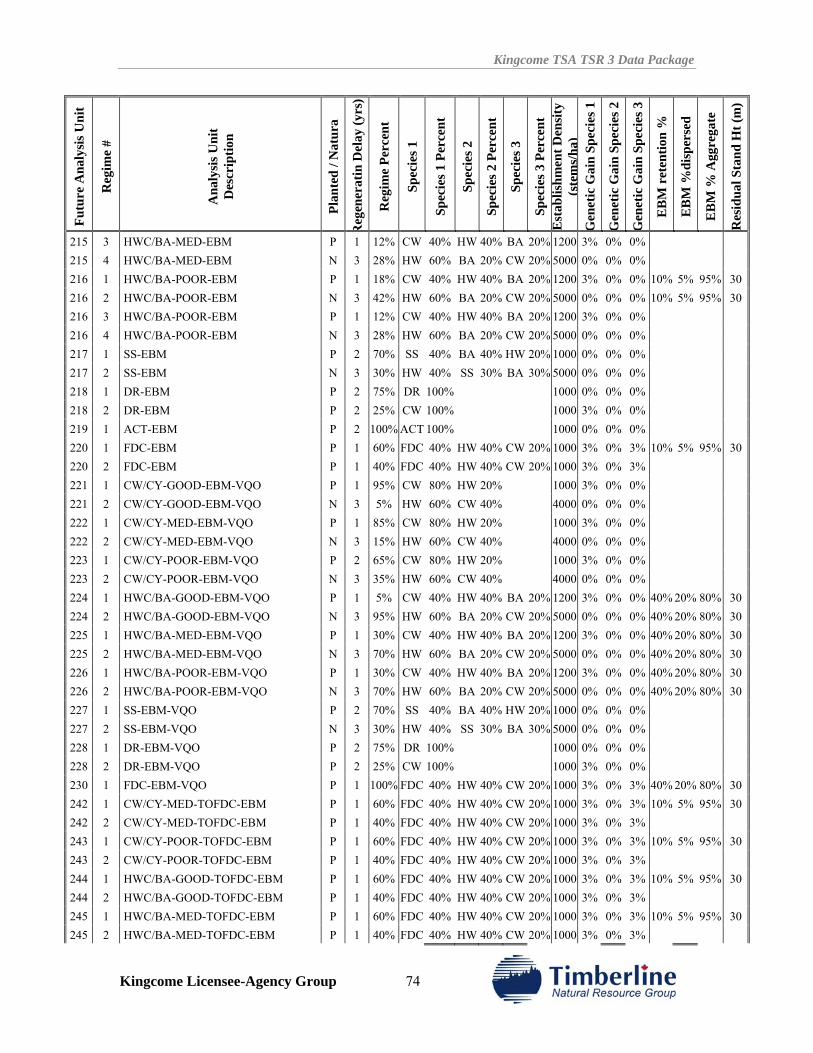
Kingcome TSA TSR 3 Data Package
Kingcome Licensee-Agency Group 74
Futu
re A
naly
sis U
nit
Reg
ime
#
Ana
lysi
s Uni
t D
escr
iptio
n
Plan
ted
/ Nat
ura
Reg
ener
atin
Del
ay (y
rs)
Reg
ime
Perc
ent
Spec
ies 1
Spec
ies 1
Per
cent
Spec
ies 2
Spec
ies 2
Per
cent
Spec
ies 3
Spec
ies 3
Per
cent
E
stab
lishm
ent D
ensi
ty
(ste
ms/
ha)
Gen
etic
Gai
n Sp
ecie
s 1
Gen
etic
Gai
n Sp
ecie
s 2
Gen
etic
Gai
n Sp
ecie
s 3
EB
M r
eten
tion
%
EB
M %
disp
erse
d
EB
M %
Agg
rega
te
Res
idua
l Sta
nd H
t (m
)
215 3 HWC/BA-MED-EBM P 1 12% CW 40% HW 40% BA 20% 1200 3% 0% 0% 215 4 HWC/BA-MED-EBM N 3 28% HW 60% BA 20% CW 20% 5000 0% 0% 0% 216 1 HWC/BA-POOR-EBM P 1 18% CW 40% HW 40% BA 20% 1200 3% 0% 0% 10% 5% 95% 30216 2 HWC/BA-POOR-EBM N 3 42% HW 60% BA 20% CW 20% 5000 0% 0% 0% 10% 5% 95% 30216 3 HWC/BA-POOR-EBM P 1 12% CW 40% HW 40% BA 20% 1200 3% 0% 0% 216 4 HWC/BA-POOR-EBM N 3 28% HW 60% BA 20% CW 20% 5000 0% 0% 0% 217 1 SS-EBM P 2 70% SS 40% BA 40% HW 20% 1000 0% 0% 0% 217 2 SS-EBM N 3 30% HW 40% SS 30% BA 30% 5000 0% 0% 0% 218 1 DR-EBM P 2 75% DR 100% 1000 0% 0% 0% 218 2 DR-EBM P 2 25% CW 100% 1000 3% 0% 0% 219 1 ACT-EBM P 2 100% ACT 100% 1000 0% 0% 0% 220 1 FDC-EBM P 1 60% FDC 40% HW 40% CW 20% 1000 3% 0% 3% 10% 5% 95% 30220 2 FDC-EBM P 1 40% FDC 40% HW 40% CW 20% 1000 3% 0% 3% 221 1 CW/CY-GOOD-EBM-VQO P 1 95% CW 80% HW 20% 1000 3% 0% 0% 221 2 CW/CY-GOOD-EBM-VQO N 3 5% HW 60% CW 40% 4000 0% 0% 0% 222 1 CW/CY-MED-EBM-VQO P 1 85% CW 80% HW 20% 1000 3% 0% 0% 222 2 CW/CY-MED-EBM-VQO N 3 15% HW 60% CW 40% 4000 0% 0% 0% 223 1 CW/CY-POOR-EBM-VQO P 2 65% CW 80% HW 20% 1000 3% 0% 0% 223 2 CW/CY-POOR-EBM-VQO N 3 35% HW 60% CW 40% 4000 0% 0% 0% 224 1 HWC/BA-GOOD-EBM-VQO P 1 5% CW 40% HW 40% BA 20% 1200 3% 0% 0% 40% 20% 80% 30224 2 HWC/BA-GOOD-EBM-VQO N 3 95% HW 60% BA 20% CW 20% 5000 0% 0% 0% 40% 20% 80% 30225 1 HWC/BA-MED-EBM-VQO P 1 30% CW 40% HW 40% BA 20% 1200 3% 0% 0% 40% 20% 80% 30225 2 HWC/BA-MED-EBM-VQO N 3 70% HW 60% BA 20% CW 20% 5000 0% 0% 0% 40% 20% 80% 30226 1 HWC/BA-POOR-EBM-VQO P 1 30% CW 40% HW 40% BA 20% 1200 3% 0% 0% 40% 20% 80% 30226 2 HWC/BA-POOR-EBM-VQO N 3 70% HW 60% BA 20% CW 20% 5000 0% 0% 0% 40% 20% 80% 30227 1 SS-EBM-VQO P 2 70% SS 40% BA 40% HW 20% 1000 0% 0% 0% 227 2 SS-EBM-VQO N 3 30% HW 40% SS 30% BA 30% 5000 0% 0% 0% 228 1 DR-EBM-VQO P 2 75% DR 100% 1000 0% 0% 0% 228 2 DR-EBM-VQO P 2 25% CW 100% 1000 3% 0% 0% 230 1 FDC-EBM-VQO P 1 100% FDC 40% HW 40% CW 20% 1000 3% 0% 3% 40% 20% 80% 30242 1 CW/CY-MED-TOFDC-EBM P 1 60% FDC 40% HW 40% CW 20% 1000 3% 0% 3% 10% 5% 95% 30242 2 CW/CY-MED-TOFDC-EBM P 1 40% FDC 40% HW 40% CW 20% 1000 3% 0% 3% 243 1 CW/CY-POOR-TOFDC-EBM P 1 60% FDC 40% HW 40% CW 20% 1000 3% 0% 3% 10% 5% 95% 30243 2 CW/CY-POOR-TOFDC-EBM P 1 40% FDC 40% HW 40% CW 20% 1000 3% 0% 3% 244 1 HWC/BA-GOOD-TOFDC-EBM P 1 60% FDC 40% HW 40% CW 20% 1000 3% 0% 3% 10% 5% 95% 30244 2 HWC/BA-GOOD-TOFDC-EBM P 1 40% FDC 40% HW 40% CW 20% 1000 3% 0% 3% 245 1 HWC/BA-MED-TOFDC-EBM P 1 60% FDC 40% HW 40% CW 20% 1000 3% 0% 3% 10% 5% 95% 30245 2 HWC/BA-MED-TOFDC-EBM P 1 40% FDC 40% HW 40% CW 20% 1000 3% 0% 3%
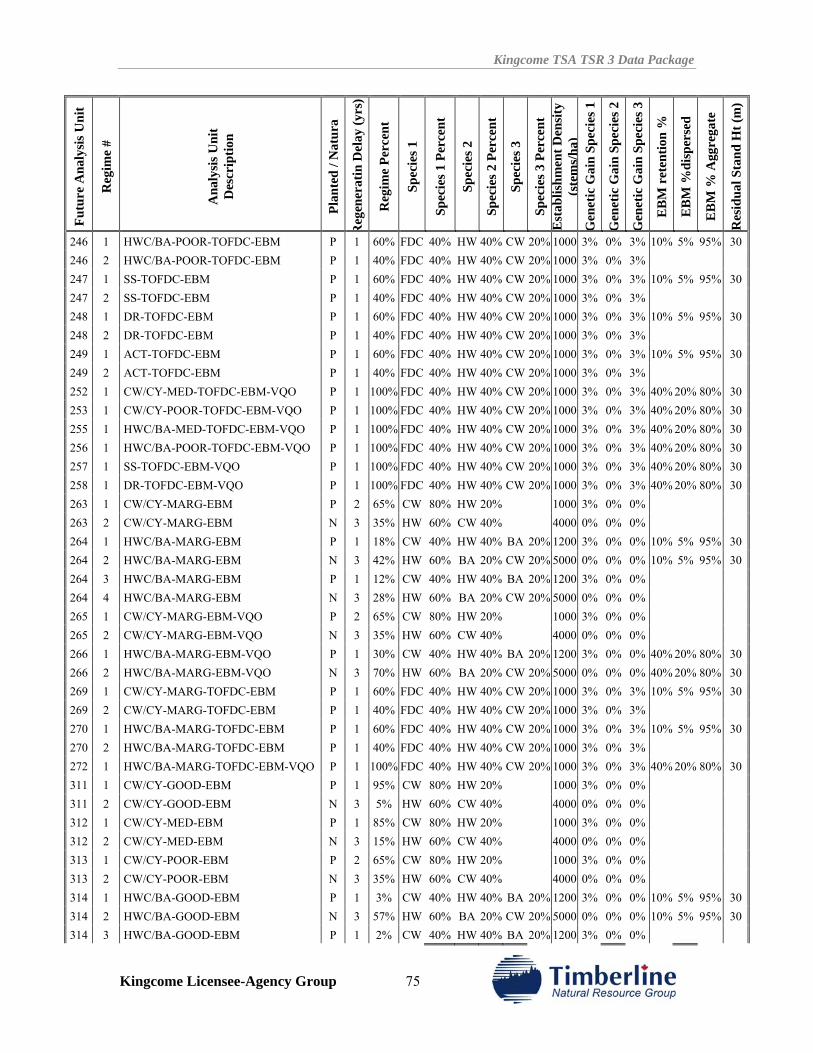
Kingcome TSA TSR 3 Data Package
Kingcome Licensee-Agency Group 75
Futu
re A
naly
sis U
nit
Reg
ime
#
Ana
lysi
s Uni
t D
escr
iptio
n
Plan
ted
/ Nat
ura
Reg
ener
atin
Del
ay (y
rs)
Reg
ime
Perc
ent
Spec
ies 1
Spec
ies 1
Per
cent
Spec
ies 2
Spec
ies 2
Per
cent
Spec
ies 3
Spec
ies 3
Per
cent
E
stab
lishm
ent D
ensi
ty
(ste
ms/
ha)
Gen
etic
Gai
n Sp
ecie
s 1
Gen
etic
Gai
n Sp
ecie
s 2
Gen
etic
Gai
n Sp
ecie
s 3
EB
M r
eten
tion
%
EB
M %
disp
erse
d
EB
M %
Agg
rega
te
Res
idua
l Sta
nd H
t (m
)
246 1 HWC/BA-POOR-TOFDC-EBM P 1 60% FDC 40% HW 40% CW 20% 1000 3% 0% 3% 10% 5% 95% 30246 2 HWC/BA-POOR-TOFDC-EBM P 1 40% FDC 40% HW 40% CW 20% 1000 3% 0% 3% 247 1 SS-TOFDC-EBM P 1 60% FDC 40% HW 40% CW 20% 1000 3% 0% 3% 10% 5% 95% 30247 2 SS-TOFDC-EBM P 1 40% FDC 40% HW 40% CW 20% 1000 3% 0% 3% 248 1 DR-TOFDC-EBM P 1 60% FDC 40% HW 40% CW 20% 1000 3% 0% 3% 10% 5% 95% 30248 2 DR-TOFDC-EBM P 1 40% FDC 40% HW 40% CW 20% 1000 3% 0% 3% 249 1 ACT-TOFDC-EBM P 1 60% FDC 40% HW 40% CW 20% 1000 3% 0% 3% 10% 5% 95% 30249 2 ACT-TOFDC-EBM P 1 40% FDC 40% HW 40% CW 20% 1000 3% 0% 3% 252 1 CW/CY-MED-TOFDC-EBM-VQO P 1 100% FDC 40% HW 40% CW 20% 1000 3% 0% 3% 40% 20% 80% 30253 1 CW/CY-POOR-TOFDC-EBM-VQO P 1 100% FDC 40% HW 40% CW 20% 1000 3% 0% 3% 40% 20% 80% 30255 1 HWC/BA-MED-TOFDC-EBM-VQO P 1 100% FDC 40% HW 40% CW 20% 1000 3% 0% 3% 40% 20% 80% 30256 1 HWC/BA-POOR-TOFDC-EBM-VQO P 1 100% FDC 40% HW 40% CW 20% 1000 3% 0% 3% 40% 20% 80% 30257 1 SS-TOFDC-EBM-VQO P 1 100% FDC 40% HW 40% CW 20% 1000 3% 0% 3% 40% 20% 80% 30258 1 DR-TOFDC-EBM-VQO P 1 100% FDC 40% HW 40% CW 20% 1000 3% 0% 3% 40% 20% 80% 30263 1 CW/CY-MARG-EBM P 2 65% CW 80% HW 20% 1000 3% 0% 0% 263 2 CW/CY-MARG-EBM N 3 35% HW 60% CW 40% 4000 0% 0% 0% 264 1 HWC/BA-MARG-EBM P 1 18% CW 40% HW 40% BA 20% 1200 3% 0% 0% 10% 5% 95% 30264 2 HWC/BA-MARG-EBM N 3 42% HW 60% BA 20% CW 20% 5000 0% 0% 0% 10% 5% 95% 30264 3 HWC/BA-MARG-EBM P 1 12% CW 40% HW 40% BA 20% 1200 3% 0% 0% 264 4 HWC/BA-MARG-EBM N 3 28% HW 60% BA 20% CW 20% 5000 0% 0% 0% 265 1 CW/CY-MARG-EBM-VQO P 2 65% CW 80% HW 20% 1000 3% 0% 0% 265 2 CW/CY-MARG-EBM-VQO N 3 35% HW 60% CW 40% 4000 0% 0% 0% 266 1 HWC/BA-MARG-EBM-VQO P 1 30% CW 40% HW 40% BA 20% 1200 3% 0% 0% 40% 20% 80% 30266 2 HWC/BA-MARG-EBM-VQO N 3 70% HW 60% BA 20% CW 20% 5000 0% 0% 0% 40% 20% 80% 30269 1 CW/CY-MARG-TOFDC-EBM P 1 60% FDC 40% HW 40% CW 20% 1000 3% 0% 3% 10% 5% 95% 30269 2 CW/CY-MARG-TOFDC-EBM P 1 40% FDC 40% HW 40% CW 20% 1000 3% 0% 3% 270 1 HWC/BA-MARG-TOFDC-EBM P 1 60% FDC 40% HW 40% CW 20% 1000 3% 0% 3% 10% 5% 95% 30270 2 HWC/BA-MARG-TOFDC-EBM P 1 40% FDC 40% HW 40% CW 20% 1000 3% 0% 3% 272 1 HWC/BA-MARG-TOFDC-EBM-VQO P 1 100% FDC 40% HW 40% CW 20% 1000 3% 0% 3% 40% 20% 80% 30311 1 CW/CY-GOOD-EBM P 1 95% CW 80% HW 20% 1000 3% 0% 0% 311 2 CW/CY-GOOD-EBM N 3 5% HW 60% CW 40% 4000 0% 0% 0% 312 1 CW/CY-MED-EBM P 1 85% CW 80% HW 20% 1000 3% 0% 0% 312 2 CW/CY-MED-EBM N 3 15% HW 60% CW 40% 4000 0% 0% 0% 313 1 CW/CY-POOR-EBM P 2 65% CW 80% HW 20% 1000 3% 0% 0% 313 2 CW/CY-POOR-EBM N 3 35% HW 60% CW 40% 4000 0% 0% 0% 314 1 HWC/BA-GOOD-EBM P 1 3% CW 40% HW 40% BA 20% 1200 3% 0% 0% 10% 5% 95% 30314 2 HWC/BA-GOOD-EBM N 3 57% HW 60% BA 20% CW 20% 5000 0% 0% 0% 10% 5% 95% 30314 3 HWC/BA-GOOD-EBM P 1 2% CW 40% HW 40% BA 20% 1200 3% 0% 0%
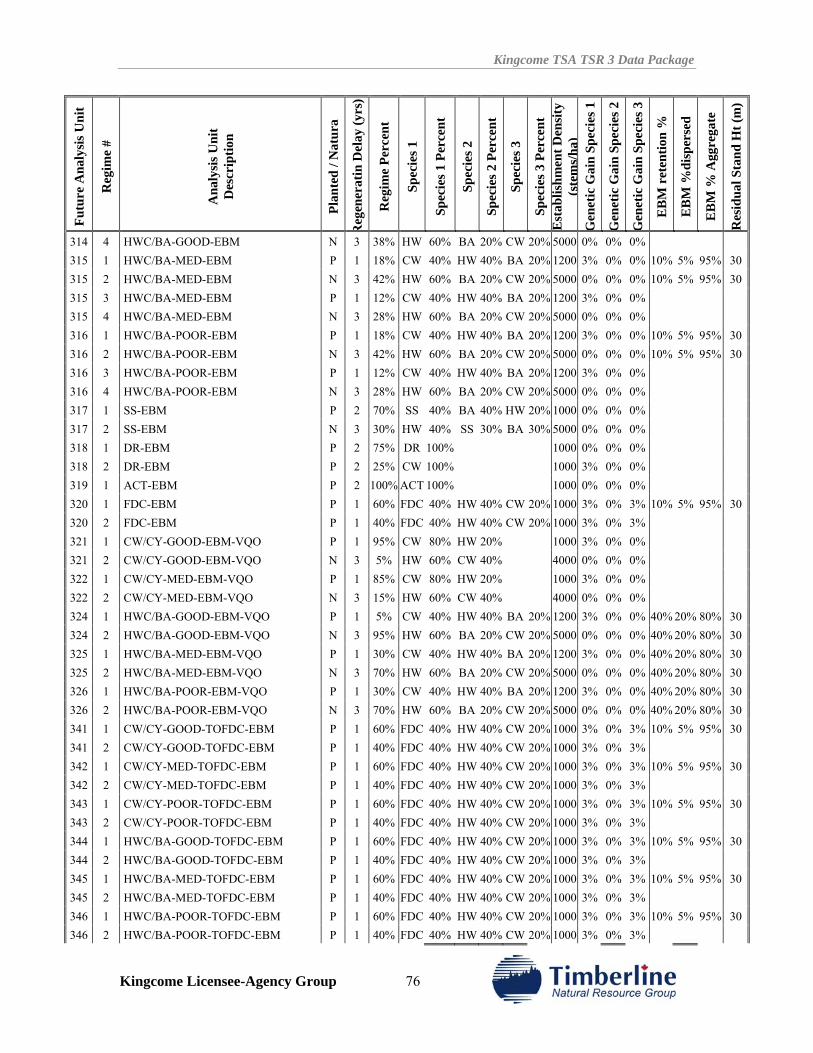
Kingcome TSA TSR 3 Data Package
Kingcome Licensee-Agency Group 76
Futu
re A
naly
sis U
nit
Reg
ime
#
Ana
lysi
s Uni
t D
escr
iptio
n
Plan
ted
/ Nat
ura
Reg
ener
atin
Del
ay (y
rs)
Reg
ime
Perc
ent
Spec
ies 1
Spec
ies 1
Per
cent
Spec
ies 2
Spec
ies 2
Per
cent
Spec
ies 3
Spec
ies 3
Per
cent
E
stab
lishm
ent D
ensi
ty
(ste
ms/
ha)
Gen
etic
Gai
n Sp
ecie
s 1
Gen
etic
Gai
n Sp
ecie
s 2
Gen
etic
Gai
n Sp
ecie
s 3
EB
M r
eten
tion
%
EB
M %
disp
erse
d
EB
M %
Agg
rega
te
Res
idua
l Sta
nd H
t (m
)
314 4 HWC/BA-GOOD-EBM N 3 38% HW 60% BA 20% CW 20% 5000 0% 0% 0% 315 1 HWC/BA-MED-EBM P 1 18% CW 40% HW 40% BA 20% 1200 3% 0% 0% 10% 5% 95% 30315 2 HWC/BA-MED-EBM N 3 42% HW 60% BA 20% CW 20% 5000 0% 0% 0% 10% 5% 95% 30315 3 HWC/BA-MED-EBM P 1 12% CW 40% HW 40% BA 20% 1200 3% 0% 0% 315 4 HWC/BA-MED-EBM N 3 28% HW 60% BA 20% CW 20% 5000 0% 0% 0% 316 1 HWC/BA-POOR-EBM P 1 18% CW 40% HW 40% BA 20% 1200 3% 0% 0% 10% 5% 95% 30316 2 HWC/BA-POOR-EBM N 3 42% HW 60% BA 20% CW 20% 5000 0% 0% 0% 10% 5% 95% 30316 3 HWC/BA-POOR-EBM P 1 12% CW 40% HW 40% BA 20% 1200 3% 0% 0% 316 4 HWC/BA-POOR-EBM N 3 28% HW 60% BA 20% CW 20% 5000 0% 0% 0% 317 1 SS-EBM P 2 70% SS 40% BA 40% HW 20% 1000 0% 0% 0% 317 2 SS-EBM N 3 30% HW 40% SS 30% BA 30% 5000 0% 0% 0% 318 1 DR-EBM P 2 75% DR 100% 1000 0% 0% 0% 318 2 DR-EBM P 2 25% CW 100% 1000 3% 0% 0% 319 1 ACT-EBM P 2 100% ACT 100% 1000 0% 0% 0% 320 1 FDC-EBM P 1 60% FDC 40% HW 40% CW 20% 1000 3% 0% 3% 10% 5% 95% 30320 2 FDC-EBM P 1 40% FDC 40% HW 40% CW 20% 1000 3% 0% 3% 321 1 CW/CY-GOOD-EBM-VQO P 1 95% CW 80% HW 20% 1000 3% 0% 0% 321 2 CW/CY-GOOD-EBM-VQO N 3 5% HW 60% CW 40% 4000 0% 0% 0% 322 1 CW/CY-MED-EBM-VQO P 1 85% CW 80% HW 20% 1000 3% 0% 0% 322 2 CW/CY-MED-EBM-VQO N 3 15% HW 60% CW 40% 4000 0% 0% 0% 324 1 HWC/BA-GOOD-EBM-VQO P 1 5% CW 40% HW 40% BA 20% 1200 3% 0% 0% 40% 20% 80% 30324 2 HWC/BA-GOOD-EBM-VQO N 3 95% HW 60% BA 20% CW 20% 5000 0% 0% 0% 40% 20% 80% 30325 1 HWC/BA-MED-EBM-VQO P 1 30% CW 40% HW 40% BA 20% 1200 3% 0% 0% 40% 20% 80% 30325 2 HWC/BA-MED-EBM-VQO N 3 70% HW 60% BA 20% CW 20% 5000 0% 0% 0% 40% 20% 80% 30326 1 HWC/BA-POOR-EBM-VQO P 1 30% CW 40% HW 40% BA 20% 1200 3% 0% 0% 40% 20% 80% 30326 2 HWC/BA-POOR-EBM-VQO N 3 70% HW 60% BA 20% CW 20% 5000 0% 0% 0% 40% 20% 80% 30341 1 CW/CY-GOOD-TOFDC-EBM P 1 60% FDC 40% HW 40% CW 20% 1000 3% 0% 3% 10% 5% 95% 30341 2 CW/CY-GOOD-TOFDC-EBM P 1 40% FDC 40% HW 40% CW 20% 1000 3% 0% 3% 342 1 CW/CY-MED-TOFDC-EBM P 1 60% FDC 40% HW 40% CW 20% 1000 3% 0% 3% 10% 5% 95% 30342 2 CW/CY-MED-TOFDC-EBM P 1 40% FDC 40% HW 40% CW 20% 1000 3% 0% 3% 343 1 CW/CY-POOR-TOFDC-EBM P 1 60% FDC 40% HW 40% CW 20% 1000 3% 0% 3% 10% 5% 95% 30343 2 CW/CY-POOR-TOFDC-EBM P 1 40% FDC 40% HW 40% CW 20% 1000 3% 0% 3% 344 1 HWC/BA-GOOD-TOFDC-EBM P 1 60% FDC 40% HW 40% CW 20% 1000 3% 0% 3% 10% 5% 95% 30344 2 HWC/BA-GOOD-TOFDC-EBM P 1 40% FDC 40% HW 40% CW 20% 1000 3% 0% 3% 345 1 HWC/BA-MED-TOFDC-EBM P 1 60% FDC 40% HW 40% CW 20% 1000 3% 0% 3% 10% 5% 95% 30345 2 HWC/BA-MED-TOFDC-EBM P 1 40% FDC 40% HW 40% CW 20% 1000 3% 0% 3% 346 1 HWC/BA-POOR-TOFDC-EBM P 1 60% FDC 40% HW 40% CW 20% 1000 3% 0% 3% 10% 5% 95% 30346 2 HWC/BA-POOR-TOFDC-EBM P 1 40% FDC 40% HW 40% CW 20% 1000 3% 0% 3%
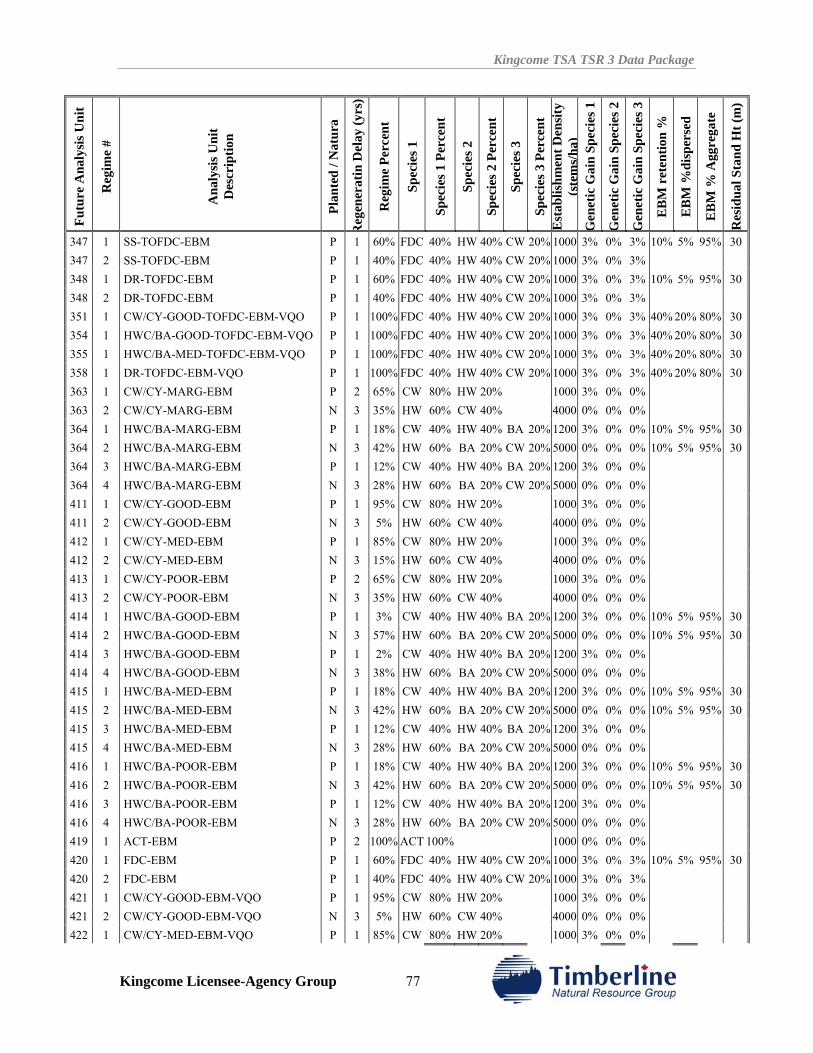
Kingcome TSA TSR 3 Data Package
Kingcome Licensee-Agency Group 77
Futu
re A
naly
sis U
nit
Reg
ime
#
Ana
lysi
s Uni
t D
escr
iptio
n
Plan
ted
/ Nat
ura
Reg
ener
atin
Del
ay (y
rs)
Reg
ime
Perc
ent
Spec
ies 1
Spec
ies 1
Per
cent
Spec
ies 2
Spec
ies 2
Per
cent
Spec
ies 3
Spec
ies 3
Per
cent
E
stab
lishm
ent D
ensi
ty
(ste
ms/
ha)
Gen
etic
Gai
n Sp
ecie
s 1
Gen
etic
Gai
n Sp
ecie
s 2
Gen
etic
Gai
n Sp
ecie
s 3
EB
M r
eten
tion
%
EB
M %
disp
erse
d
EB
M %
Agg
rega
te
Res
idua
l Sta
nd H
t (m
)
347 1 SS-TOFDC-EBM P 1 60% FDC 40% HW 40% CW 20% 1000 3% 0% 3% 10% 5% 95% 30347 2 SS-TOFDC-EBM P 1 40% FDC 40% HW 40% CW 20% 1000 3% 0% 3% 348 1 DR-TOFDC-EBM P 1 60% FDC 40% HW 40% CW 20% 1000 3% 0% 3% 10% 5% 95% 30348 2 DR-TOFDC-EBM P 1 40% FDC 40% HW 40% CW 20% 1000 3% 0% 3% 351 1 CW/CY-GOOD-TOFDC-EBM-VQO P 1 100% FDC 40% HW 40% CW 20% 1000 3% 0% 3% 40% 20% 80% 30354 1 HWC/BA-GOOD-TOFDC-EBM-VQO P 1 100% FDC 40% HW 40% CW 20% 1000 3% 0% 3% 40% 20% 80% 30355 1 HWC/BA-MED-TOFDC-EBM-VQO P 1 100% FDC 40% HW 40% CW 20% 1000 3% 0% 3% 40% 20% 80% 30358 1 DR-TOFDC-EBM-VQO P 1 100% FDC 40% HW 40% CW 20% 1000 3% 0% 3% 40% 20% 80% 30363 1 CW/CY-MARG-EBM P 2 65% CW 80% HW 20% 1000 3% 0% 0% 363 2 CW/CY-MARG-EBM N 3 35% HW 60% CW 40% 4000 0% 0% 0% 364 1 HWC/BA-MARG-EBM P 1 18% CW 40% HW 40% BA 20% 1200 3% 0% 0% 10% 5% 95% 30364 2 HWC/BA-MARG-EBM N 3 42% HW 60% BA 20% CW 20% 5000 0% 0% 0% 10% 5% 95% 30364 3 HWC/BA-MARG-EBM P 1 12% CW 40% HW 40% BA 20% 1200 3% 0% 0% 364 4 HWC/BA-MARG-EBM N 3 28% HW 60% BA 20% CW 20% 5000 0% 0% 0% 411 1 CW/CY-GOOD-EBM P 1 95% CW 80% HW 20% 1000 3% 0% 0% 411 2 CW/CY-GOOD-EBM N 3 5% HW 60% CW 40% 4000 0% 0% 0% 412 1 CW/CY-MED-EBM P 1 85% CW 80% HW 20% 1000 3% 0% 0% 412 2 CW/CY-MED-EBM N 3 15% HW 60% CW 40% 4000 0% 0% 0% 413 1 CW/CY-POOR-EBM P 2 65% CW 80% HW 20% 1000 3% 0% 0% 413 2 CW/CY-POOR-EBM N 3 35% HW 60% CW 40% 4000 0% 0% 0% 414 1 HWC/BA-GOOD-EBM P 1 3% CW 40% HW 40% BA 20% 1200 3% 0% 0% 10% 5% 95% 30414 2 HWC/BA-GOOD-EBM N 3 57% HW 60% BA 20% CW 20% 5000 0% 0% 0% 10% 5% 95% 30414 3 HWC/BA-GOOD-EBM P 1 2% CW 40% HW 40% BA 20% 1200 3% 0% 0% 414 4 HWC/BA-GOOD-EBM N 3 38% HW 60% BA 20% CW 20% 5000 0% 0% 0% 415 1 HWC/BA-MED-EBM P 1 18% CW 40% HW 40% BA 20% 1200 3% 0% 0% 10% 5% 95% 30415 2 HWC/BA-MED-EBM N 3 42% HW 60% BA 20% CW 20% 5000 0% 0% 0% 10% 5% 95% 30415 3 HWC/BA-MED-EBM P 1 12% CW 40% HW 40% BA 20% 1200 3% 0% 0% 415 4 HWC/BA-MED-EBM N 3 28% HW 60% BA 20% CW 20% 5000 0% 0% 0% 416 1 HWC/BA-POOR-EBM P 1 18% CW 40% HW 40% BA 20% 1200 3% 0% 0% 10% 5% 95% 30416 2 HWC/BA-POOR-EBM N 3 42% HW 60% BA 20% CW 20% 5000 0% 0% 0% 10% 5% 95% 30416 3 HWC/BA-POOR-EBM P 1 12% CW 40% HW 40% BA 20% 1200 3% 0% 0% 416 4 HWC/BA-POOR-EBM N 3 28% HW 60% BA 20% CW 20% 5000 0% 0% 0% 419 1 ACT-EBM P 2 100% ACT 100% 1000 0% 0% 0% 420 1 FDC-EBM P 1 60% FDC 40% HW 40% CW 20% 1000 3% 0% 3% 10% 5% 95% 30420 2 FDC-EBM P 1 40% FDC 40% HW 40% CW 20% 1000 3% 0% 3% 421 1 CW/CY-GOOD-EBM-VQO P 1 95% CW 80% HW 20% 1000 3% 0% 0% 421 2 CW/CY-GOOD-EBM-VQO N 3 5% HW 60% CW 40% 4000 0% 0% 0% 422 1 CW/CY-MED-EBM-VQO P 1 85% CW 80% HW 20% 1000 3% 0% 0%
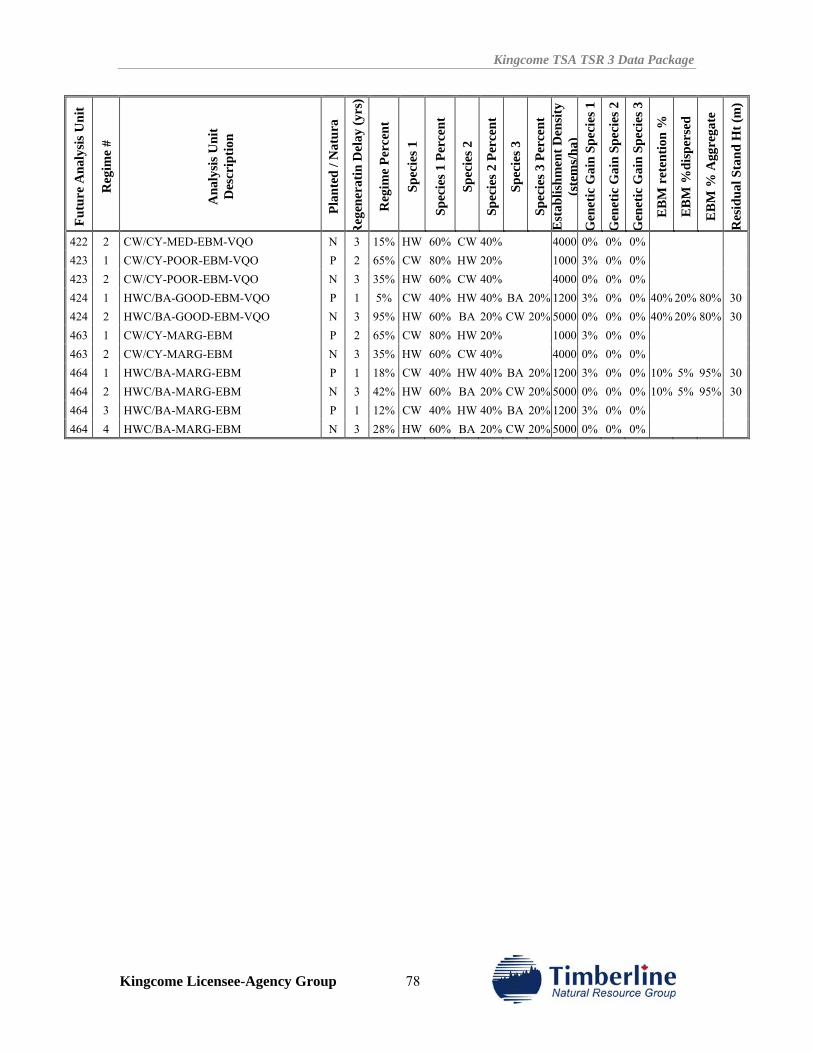
Kingcome TSA TSR 3 Data Package
Kingcome Licensee-Agency Group 78
Futu
re A
naly
sis U
nit
Reg
ime
#
Ana
lysi
s Uni
t D
escr
iptio
n
Plan
ted
/ Nat
ura
Reg
ener
atin
Del
ay (y
rs)
Reg
ime
Perc
ent
Spec
ies 1
Spec
ies 1
Per
cent
Spec
ies 2
Spec
ies 2
Per
cent
Spec
ies 3
Spec
ies 3
Per
cent
E
stab
lishm
ent D
ensi
ty
(ste
ms/
ha)
Gen
etic
Gai
n Sp
ecie
s 1
Gen
etic
Gai
n Sp
ecie
s 2
Gen
etic
Gai
n Sp
ecie
s 3
EB
M r
eten
tion
%
EB
M %
disp
erse
d
EB
M %
Agg
rega
te
Res
idua
l Sta
nd H
t (m
)
422 2 CW/CY-MED-EBM-VQO N 3 15% HW 60% CW 40% 4000 0% 0% 0% 423 1 CW/CY-POOR-EBM-VQO P 2 65% CW 80% HW 20% 1000 3% 0% 0% 423 2 CW/CY-POOR-EBM-VQO N 3 35% HW 60% CW 40% 4000 0% 0% 0% 424 1 HWC/BA-GOOD-EBM-VQO P 1 5% CW 40% HW 40% BA 20% 1200 3% 0% 0% 40% 20% 80% 30424 2 HWC/BA-GOOD-EBM-VQO N 3 95% HW 60% BA 20% CW 20% 5000 0% 0% 0% 40% 20% 80% 30463 1 CW/CY-MARG-EBM P 2 65% CW 80% HW 20% 1000 3% 0% 0% 463 2 CW/CY-MARG-EBM N 3 35% HW 60% CW 40% 4000 0% 0% 0% 464 1 HWC/BA-MARG-EBM P 1 18% CW 40% HW 40% BA 20% 1200 3% 0% 0% 10% 5% 95% 30464 2 HWC/BA-MARG-EBM N 3 42% HW 60% BA 20% CW 20% 5000 0% 0% 0% 10% 5% 95% 30464 3 HWC/BA-MARG-EBM P 1 12% CW 40% HW 40% BA 20% 1200 3% 0% 0% 464 4 HWC/BA-MARG-EBM N 3 28% HW 60% BA 20% CW 20% 5000 0% 0% 0%
Kingcome TSA TSR 3 Data Package
Kingcome Licensee-Agency Group 79
9.0 INTEGRATED RESOURCE MANAGEMENT
9.1 Forest Cover Objectives – Rationale
Forest cover objectives place maximum and/or minimum limits on the amount of young, mature and/or old growth found in land base aggregates such as combinations of landscape units and ecosystem units or resource emphasis areas. Three classes of forest cover constraints can be modelled to capture these management objectives within management zones:
1. Disturbance: the maximum area that can be younger than a specified age or shorter than a specified height. This is intended to model cutblock adjacency and green-up requirements.
2. Old-growth Retention: the minimum area that must be older than, or as old as, a specified age. This is intended to model both retention of cover and retention of old growth.
3. Mature Retention: the minimum proportion of area that must be retained over a lower retention age. This is intended to model thermal cover for wildlife or mature biodiversity requirements. Mature and old growth retention forest cover objectives may overlap and area that qualifies for both is counted in both.
9.2 Pre-EBM Objectives
9.2.1 Cut-Block Adjacency , Maximum Disturbance and Minimum Retention Visual quality is maintained by limiting the rate of harvest in areas that are identified as visually sensitive in the Visual Landscape Inventory. Each polygon has a forest cover constraint applied to it, depending on its visual quality objective and Visual Absorption Capacity (VAC). The forest cover constraint specifies the maximum area that can be below the specified green-up height at any point in time. In the analysis, harvesting will not occur within a VQO polygon in any period when doing so would violate this constraint.
Areas outside the VQO polygons are assigned a disturbance constraint designed to mimic cut-block adjacency. The Enhanced Zones of the VILUP portion of the TSA have a reduced green-up requirement to permit additional harvesting activity.
Minimum retention constraints are necessary to ensure sufficient old forest is maintained within the VILUP Special Management Zones.
Table 53 summarizes the disturbance and retention forest cover constraints for the management zones defined for management under Pre-EBM rules.
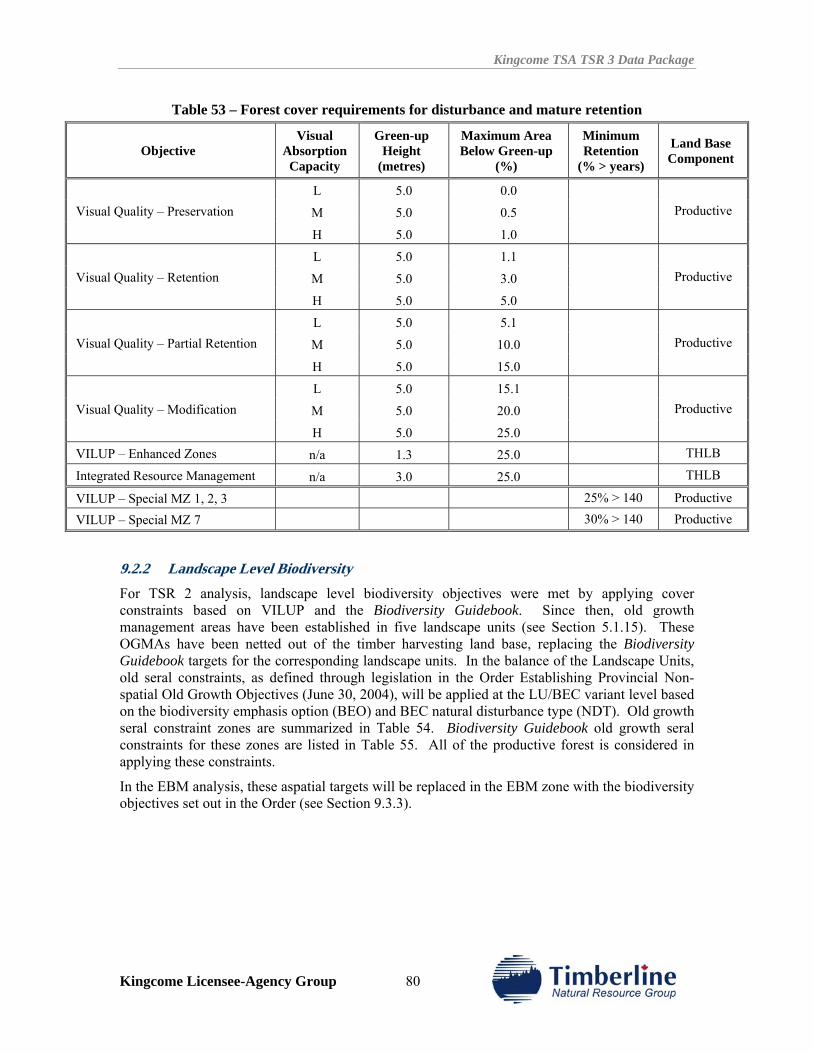
Kingcome TSA TSR 3 Data Package
Kingcome Licensee-Agency Group 80
Table 53 – Forest cover requirements for disturbance and mature retention
Objective Visual
Absorption Capacity
Green-up Height
(metres)
Maximum Area Below Green-up
(%)
Minimum Retention
(% > years)
Land Base Component
L 5.0 0.0
M 5.0 0.5 Visual Quality – Preservation
H 5.0 1.0
Productive
L 5.0 1.1
M 5.0 3.0 Visual Quality – Retention
H 5.0 5.0
Productive
L 5.0 5.1
M 5.0 10.0 Visual Quality – Partial Retention
H 5.0 15.0
Productive
L 5.0 15.1
M 5.0 20.0 Visual Quality – Modification
H 5.0 25.0
Productive
VILUP – Enhanced Zones n/a 1.3 25.0 THLB
Integrated Resource Management n/a 3.0 25.0 THLB
VILUP – Special MZ 1, 2, 3 25% > 140 Productive
VILUP – Special MZ 7 30% > 140 Productive
9.2.2 Landscape Level Biodiversity For TSR 2 analysis, landscape level biodiversity objectives were met by applying cover constraints based on VILUP and the Biodiversity Guidebook. Since then, old growth management areas have been established in five landscape units (see Section 5.1.15). These OGMAs have been netted out of the timber harvesting land base, replacing the Biodiversity Guidebook targets for the corresponding landscape units. In the balance of the Landscape Units, old seral constraints, as defined through legislation in the Order Establishing Provincial Non-spatial Old Growth Objectives (June 30, 2004), will be applied at the LU/BEC variant level based on the biodiversity emphasis option (BEO) and BEC natural disturbance type (NDT). Old growth seral constraint zones are summarized in Table 54. Biodiversity Guidebook old growth seral constraints for these zones are listed in Table 55. All of the productive forest is considered in applying these constraints.
In the EBM analysis, these aspatial targets will be replaced in the EBM zone with the biodiversity objectives set out in the Order (see Section 9.3.3).
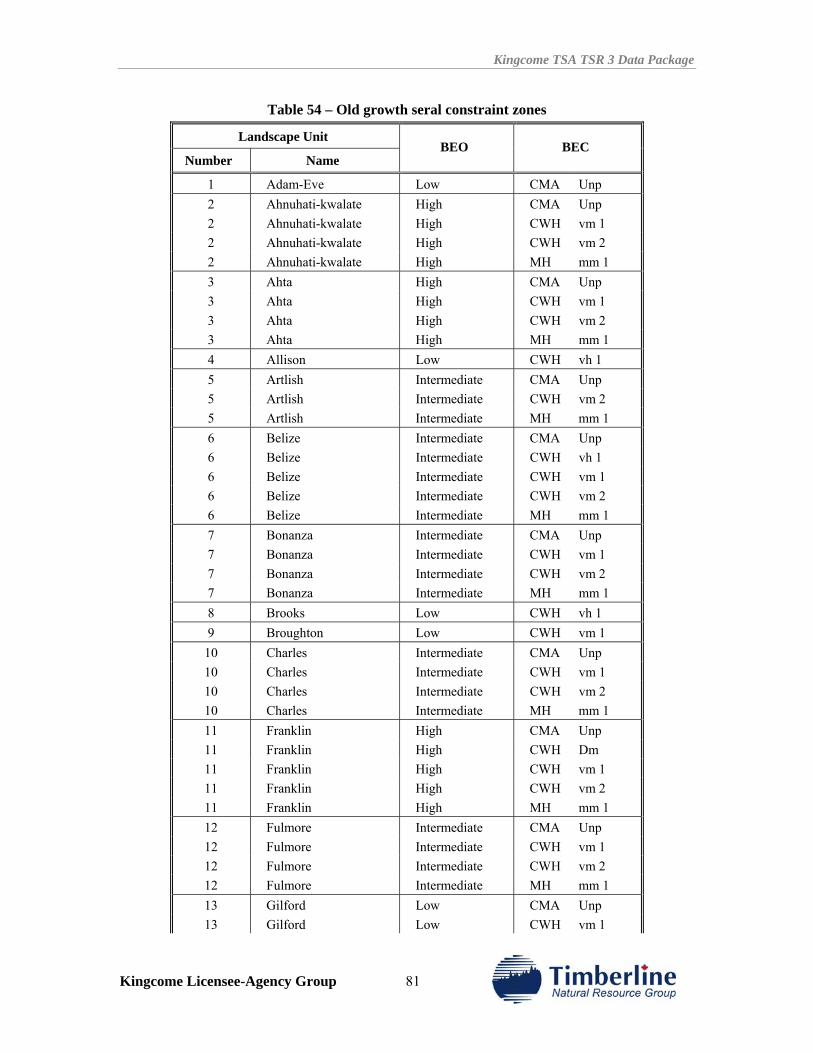
Kingcome TSA TSR 3 Data Package
Kingcome Licensee-Agency Group 81
Table 54 – Old growth seral constraint zones
Landscape Unit
Number Name BEO BEC
1 Adam-Eve Low CMA Unp 2 Ahnuhati-kwalate High CMA Unp 2 Ahnuhati-kwalate High CWH vm 1 2 Ahnuhati-kwalate High CWH vm 2 2 Ahnuhati-kwalate High MH mm 1 3 Ahta High CMA Unp 3 Ahta High CWH vm 1 3 Ahta High CWH vm 2 3 Ahta High MH mm 1 4 Allison Low CWH vh 1 5 Artlish Intermediate CMA Unp 5 Artlish Intermediate CWH vm 2 5 Artlish Intermediate MH mm 1 6 Belize Intermediate CMA Unp 6 Belize Intermediate CWH vh 1 6 Belize Intermediate CWH vm 1 6 Belize Intermediate CWH vm 2 6 Belize Intermediate MH mm 1 7 Bonanza Intermediate CMA Unp 7 Bonanza Intermediate CWH vm 1 7 Bonanza Intermediate CWH vm 2 7 Bonanza Intermediate MH mm 1 8 Brooks Low CWH vh 1 9 Broughton Low CWH vm 1
10 Charles Intermediate CMA Unp 10 Charles Intermediate CWH vm 1 10 Charles Intermediate CWH vm 2 10 Charles Intermediate MH mm 1 11 Franklin High CMA Unp 11 Franklin High CWH Dm 11 Franklin High CWH vm 1 11 Franklin High CWH vm 2 11 Franklin High MH mm 1 12 Fulmore Intermediate CMA Unp 12 Fulmore Intermediate CWH vm 1 12 Fulmore Intermediate CWH vm 2 12 Fulmore Intermediate MH mm 1 13 Gilford Low CMA Unp 13 Gilford Low CWH vm 1
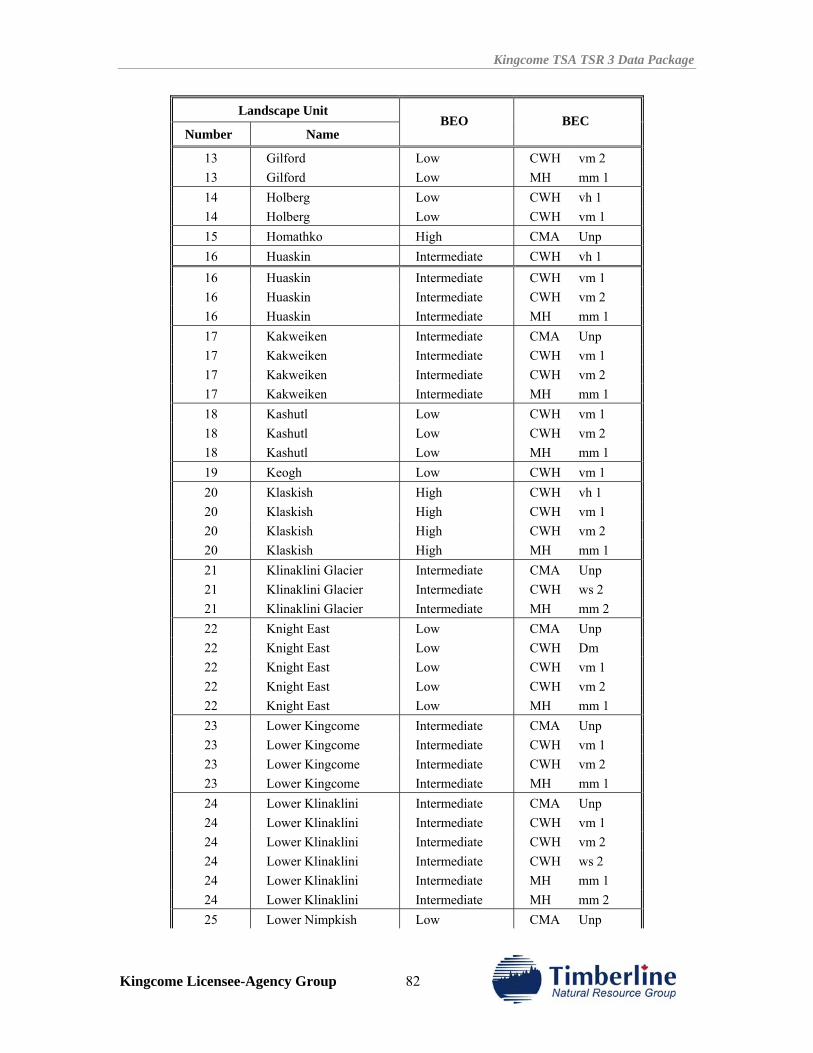
Kingcome TSA TSR 3 Data Package
Kingcome Licensee-Agency Group 82
Landscape Unit
Number Name BEO BEC
13 Gilford Low CWH vm 2 13 Gilford Low MH mm 1 14 Holberg Low CWH vh 1 14 Holberg Low CWH vm 1 15 Homathko High CMA Unp 16 Huaskin Intermediate CWH vh 1 16 Huaskin Intermediate CWH vm 1 16 Huaskin Intermediate CWH vm 2 16 Huaskin Intermediate MH mm 1 17 Kakweiken Intermediate CMA Unp 17 Kakweiken Intermediate CWH vm 1 17 Kakweiken Intermediate CWH vm 2 17 Kakweiken Intermediate MH mm 1 18 Kashutl Low CWH vm 1 18 Kashutl Low CWH vm 2 18 Kashutl Low MH mm 1 19 Keogh Low CWH vm 1 20 Klaskish High CWH vh 1 20 Klaskish High CWH vm 1 20 Klaskish High CWH vm 2 20 Klaskish High MH mm 1 21 Klinaklini Glacier Intermediate CMA Unp 21 Klinaklini Glacier Intermediate CWH ws 2 21 Klinaklini Glacier Intermediate MH mm 2 22 Knight East Low CMA Unp 22 Knight East Low CWH Dm 22 Knight East Low CWH vm 1 22 Knight East Low CWH vm 2 22 Knight East Low MH mm 1 23 Lower Kingcome Intermediate CMA Unp 23 Lower Kingcome Intermediate CWH vm 1 23 Lower Kingcome Intermediate CWH vm 2 23 Lower Kingcome Intermediate MH mm 1 24 Lower Klinaklini Intermediate CMA Unp 24 Lower Klinaklini Intermediate CWH vm 1 24 Lower Klinaklini Intermediate CWH vm 2 24 Lower Klinaklini Intermediate CWH ws 2 24 Lower Klinaklini Intermediate MH mm 1 24 Lower Klinaklini Intermediate MH mm 2 25 Lower Nimpkish Low CMA Unp
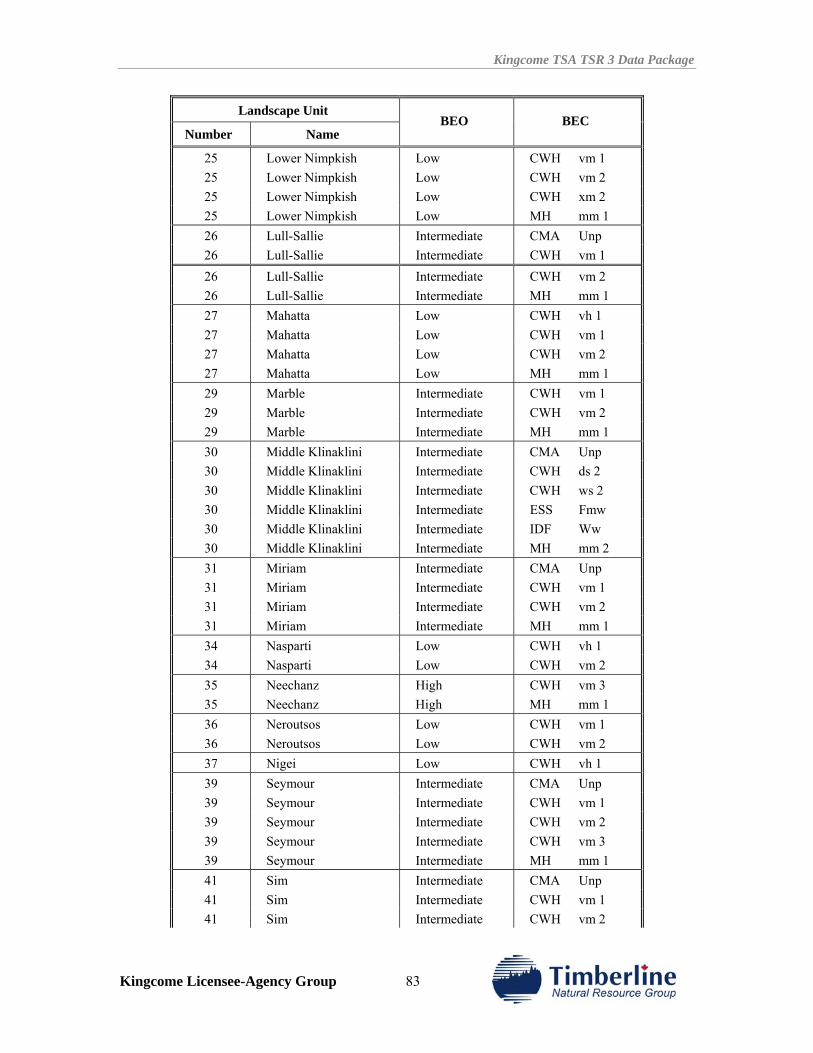
Kingcome TSA TSR 3 Data Package
Kingcome Licensee-Agency Group 83
Landscape Unit
Number Name BEO BEC
25 Lower Nimpkish Low CWH vm 1 25 Lower Nimpkish Low CWH vm 2 25 Lower Nimpkish Low CWH xm 2 25 Lower Nimpkish Low MH mm 1 26 Lull-Sallie Intermediate CMA Unp 26 Lull-Sallie Intermediate CWH vm 1 26 Lull-Sallie Intermediate CWH vm 2 26 Lull-Sallie Intermediate MH mm 1 27 Mahatta Low CWH vh 1 27 Mahatta Low CWH vm 1 27 Mahatta Low CWH vm 2 27 Mahatta Low MH mm 1 29 Marble Intermediate CWH vm 1 29 Marble Intermediate CWH vm 2 29 Marble Intermediate MH mm 1 30 Middle Klinaklini Intermediate CMA Unp 30 Middle Klinaklini Intermediate CWH ds 2 30 Middle Klinaklini Intermediate CWH ws 2 30 Middle Klinaklini Intermediate ESS Fmw 30 Middle Klinaklini Intermediate IDF Ww 30 Middle Klinaklini Intermediate MH mm 2 31 Miriam Intermediate CMA Unp 31 Miriam Intermediate CWH vm 1 31 Miriam Intermediate CWH vm 2 31 Miriam Intermediate MH mm 1 34 Nasparti Low CWH vh 1 34 Nasparti Low CWH vm 2 35 Neechanz High CWH vm 3 35 Neechanz High MH mm 1 36 Neroutsos Low CWH vm 1 36 Neroutsos Low CWH vm 2 37 Nigei Low CWH vh 1 39 Seymour Intermediate CMA Unp 39 Seymour Intermediate CWH vm 1 39 Seymour Intermediate CWH vm 2 39 Seymour Intermediate CWH vm 3 39 Seymour Intermediate MH mm 1 41 Sim Intermediate CMA Unp 41 Sim Intermediate CWH vm 1 41 Sim Intermediate CWH vm 2
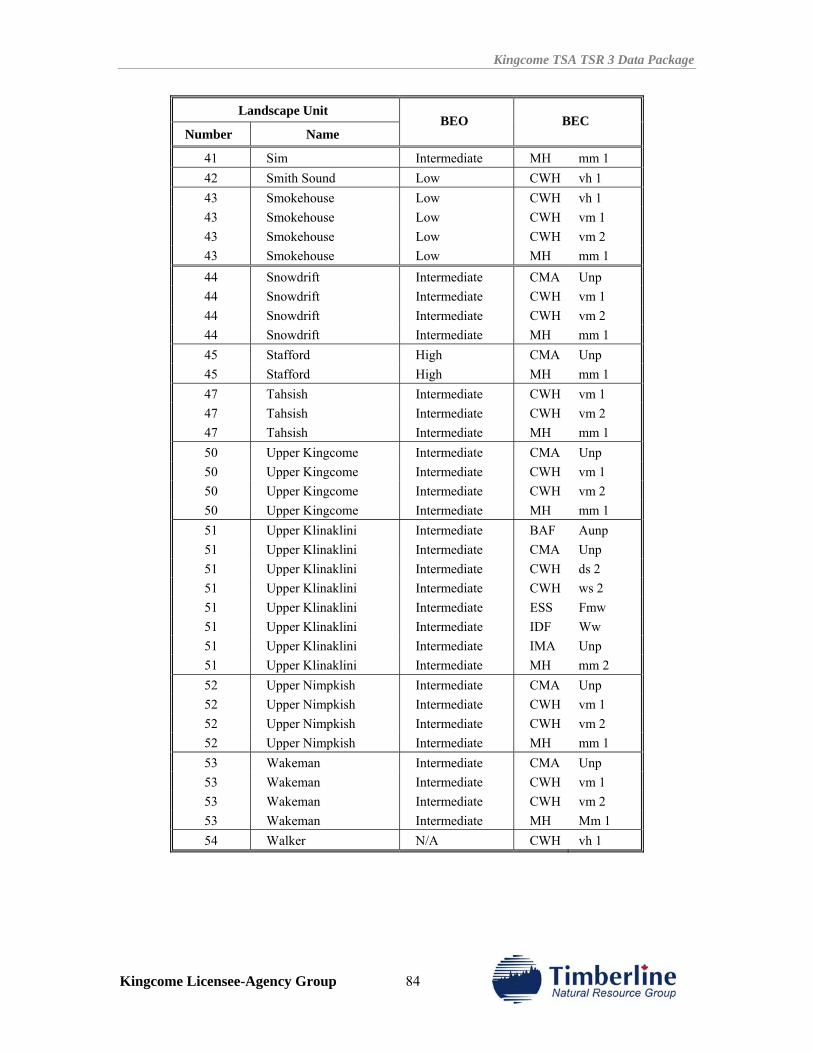
Kingcome TSA TSR 3 Data Package
Kingcome Licensee-Agency Group 84
Landscape Unit
Number Name BEO BEC
41 Sim Intermediate MH mm 1 42 Smith Sound Low CWH vh 1 43 Smokehouse Low CWH vh 1 43 Smokehouse Low CWH vm 1 43 Smokehouse Low CWH vm 2 43 Smokehouse Low MH mm 1 44 Snowdrift Intermediate CMA Unp 44 Snowdrift Intermediate CWH vm 1 44 Snowdrift Intermediate CWH vm 2 44 Snowdrift Intermediate MH mm 1 45 Stafford High CMA Unp 45 Stafford High MH mm 1 47 Tahsish Intermediate CWH vm 1 47 Tahsish Intermediate CWH vm 2 47 Tahsish Intermediate MH mm 1 50 Upper Kingcome Intermediate CMA Unp 50 Upper Kingcome Intermediate CWH vm 1 50 Upper Kingcome Intermediate CWH vm 2 50 Upper Kingcome Intermediate MH mm 1 51 Upper Klinaklini Intermediate BAF Aunp 51 Upper Klinaklini Intermediate CMA Unp 51 Upper Klinaklini Intermediate CWH ds 2 51 Upper Klinaklini Intermediate CWH ws 2 51 Upper Klinaklini Intermediate ESS Fmw 51 Upper Klinaklini Intermediate IDF Ww 51 Upper Klinaklini Intermediate IMA Unp 51 Upper Klinaklini Intermediate MH mm 2 52 Upper Nimpkish Intermediate CMA Unp 52 Upper Nimpkish Intermediate CWH vm 1 52 Upper Nimpkish Intermediate CWH vm 2 52 Upper Nimpkish Intermediate MH mm 1 53 Wakeman Intermediate CMA Unp 53 Wakeman Intermediate CWH vm 1 53 Wakeman Intermediate CWH vm 2 53 Wakeman Intermediate MH Mm 1 54 Walker N/A CWH vh 1
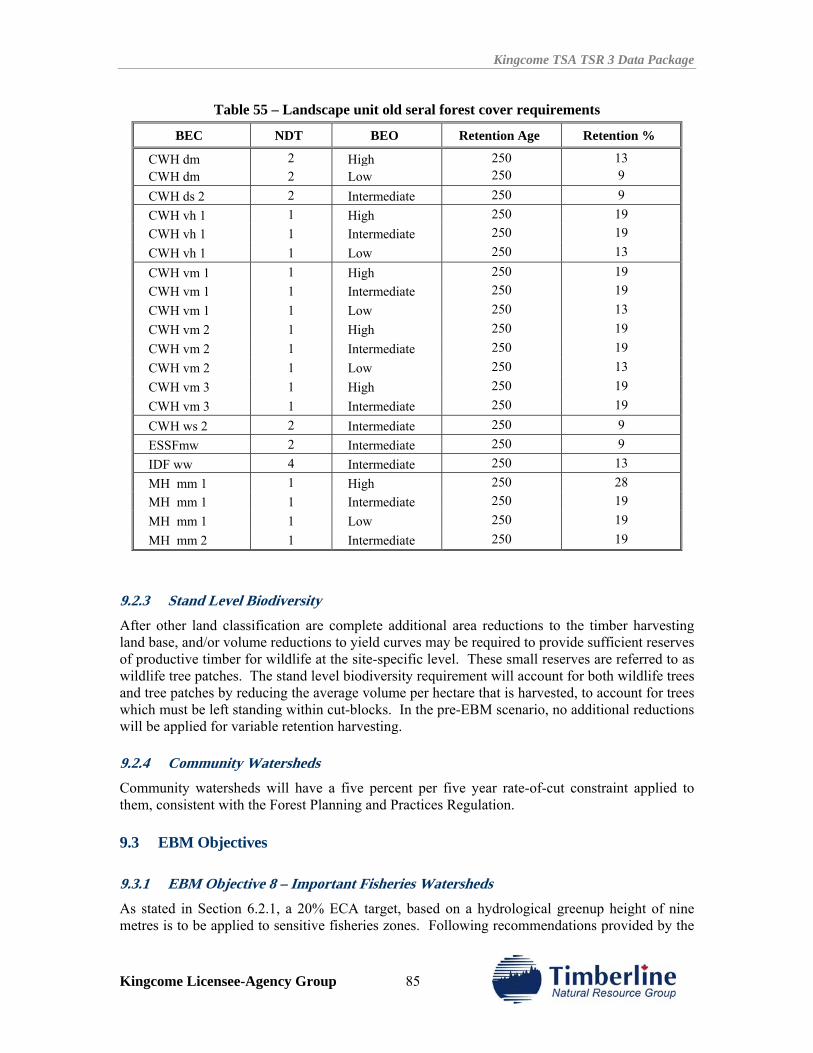
Kingcome TSA TSR 3 Data Package
Kingcome Licensee-Agency Group 85
Table 55 – Landscape unit old seral forest cover requirements
BEC NDT BEO Retention Age Retention %
CWH dm 2 High 250 13 CWH dm 2 Low 250 9 CWH ds 2 2 Intermediate 250 9 CWH vh 1 1 High 250 19 CWH vh 1 1 Intermediate 250 19 CWH vh 1 1 Low 250 13 CWH vm 1 1 High 250 19 CWH vm 1 1 Intermediate 250 19 CWH vm 1 1 Low 250 13 CWH vm 2 1 High 250 19 CWH vm 2 1 Intermediate 250 19 CWH vm 2 1 Low 250 13 CWH vm 3 1 High 250 19 CWH vm 3 1 Intermediate 250 19 CWH ws 2 2 Intermediate 250 9 ESSFmw 2 Intermediate 250 9 IDF ww 4 Intermediate 250 13 MH mm 1 1 High 250 28 MH mm 1 1 Intermediate 250 19 MH mm 1 1 Low 250 19 MH mm 2 1 Intermediate 250 19
9.2.3 Stand Level Biodiversity After other land classification are complete additional area reductions to the timber harvesting land base, and/or volume reductions to yield curves may be required to provide sufficient reserves of productive timber for wildlife at the site-specific level. These small reserves are referred to as wildlife tree patches. The stand level biodiversity requirement will account for both wildlife trees and tree patches by reducing the average volume per hectare that is harvested, to account for trees which must be left standing within cut-blocks. In the pre-EBM scenario, no additional reductions will be applied for variable retention harvesting.
9.2.4 Community Watersheds Community watersheds will have a five percent per five year rate-of-cut constraint applied to them, consistent with the Forest Planning and Practices Regulation.
9.3 EBM Objectives
9.3.1 EBM Objective 8 – Important Fisheries Watersheds As stated in Section 6.2.1, a 20% ECA target, based on a hydrological greenup height of nine metres is to be applied to sensitive fisheries zones. Following recommendations provided by the

Kingcome TSA TSR 3 Data Package
Kingcome Licensee-Agency Group 86
MoFR Forest Analysis and Inventory Branch, this will be modelled by establishing a maximum disturbance constraint equal to 16% of the productive forest less than six metres in height.
9.3.2 EBM Objective 12 – Upland Streams For the watersheds summarized in Section 6.2.2, a 30% maximum disturbance constraint will be applied. This will ensure that 70% or more of the forest will be maintained as functional riparian forest.
9.3.3 EBM Objective 14 – Landscape Level Biodiversity In the EBM zone, the aspatial targets specified in Section 9.2.2 will be replaced in the EBM zone with the biodiversity objectives set out in the Order. The old seral forest cover retention targets defined in Table 56 will be applied to the site series surrogates as defined in Section 6.2.3. In this case, minimum old seral is defined as age 180.
Table 56 – SSS old seral forest cover requirements - EBM
Very Rare (70% of RONV)
Rare (70% of RONV)
Modal (70% of RONV)
Common (30% of RONV)
Very Common (30% of RONV)
SS Surrogate
Old Forest Target
SS Surrogate
Old Forest Target
SS Surrogate
Old Forest Target
SS Surrogate
Old Forest Target
SS Surrogate
Old Forest Target
CWHds2-AU10 60%
CWHds2-AU6 60%
CWHds2-AU1 42%
CWHdm-AU1 23%
CWHdm-AU7 23%
CWHds2-AU11 60%
CWHmm1-AU5 53%
CWHds2-AU7 60%
CWHdm-AU2 17%
CWHds2-AU12 12%
CWHmm1-AU4 53%
CWHvh1-AU2 63%
CWHmm1-AU3 41%
CWHdm-AU8 23%
CWHds2-AU2 18%
CWHmm1-AU12 29%
CWHvm2-AU1 49%
CWHmm1-AU6 61%
CWHds2-AU5 22%
CWHds2-AU3 22%
CWHvm2-AU10 59%
CWHvm2-AU2 49%
CWHmm1-AU9 23%
CWHds2-AU9 26%
CWHds2-AU8 26%
CWHxm-AU1 53%
CWHvm2-AU3 49%
CWHms2-AU10 61%
CWHmm1-AU7 23%
CWHms2-AU2 17%
CWHxm-AU3 41%
CWHxm-AU2 41%
CWHms2-AU11 61%
CWHmm1-AU8 23%
CWHms2-AU3 17%
CWHxm-AU4 53%
CWHxm-AU7 53%
CWHms2-AU4 53%
CWHms2-AU1 23%
CWHms2-AU5 23%
CWHxm-AU5 53%
CWHxm-AU8 53%
CWHvh1-AU11 25%
CWHms2-AU6 26%
CWHms2-AU7 23%
CWHxm2-AU10 61%
CWHxm2-AU5 53%
CWHvh1-AU9 29%
CWHms2-AU12 12%
CWHms2-AU8 23%
ESSFmwh-AU12 29%
CWHxm2-AU9 53%
CWHvh2-AU11 59%
CWHvh1-AU12 12%
CWHms2-AU9 23%
ESSFmwh-AU8 60%
ESSFmw-AU3 50%
CWHvh2-AU4 63%
CWHvh1-AU4 27%
CWHvh1-AU5 29%
ESSFmwh-AU9 60%
IDFww-AU11 60%
CWHvm2-AU11 59%
CWHvh1-AU7 25%
CWHvh1-AU6 29%
IDFww-AU6 60%
IDFww-AU5 50%
CWHvm2-AU12 29%
CWHvh1-AU8 29%
CWHvh2-AU5 29%
IDFww-AU7 60%
IDFww-AU9 60%
CWHvm2-AU4 59%
CWHvh2-AU10 25%
CWHvh2-AU6 29%
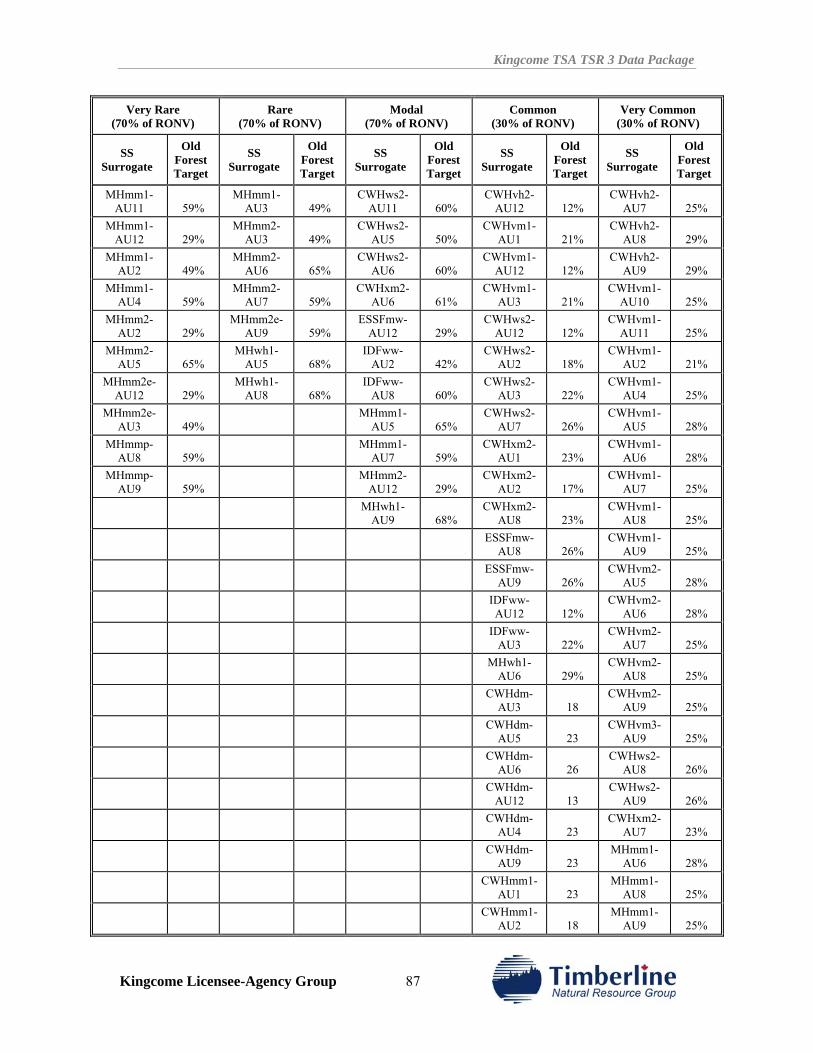
Kingcome TSA TSR 3 Data Package
Kingcome Licensee-Agency Group 87
Very Rare (70% of RONV)
Rare (70% of RONV)
Modal (70% of RONV)
Common (30% of RONV)
Very Common (30% of RONV)
SS Surrogate
Old Forest Target
SS Surrogate
Old Forest Target
SS Surrogate
Old Forest Target
SS Surrogate
Old Forest Target
SS Surrogate
Old Forest Target
MHmm1-AU11 59%
MHmm1-AU3 49%
CWHws2-AU11 60%
CWHvh2-AU12 12%
CWHvh2-AU7 25%
MHmm1-AU12 29%
MHmm2-AU3 49%
CWHws2-AU5 50%
CWHvm1-AU1 21%
CWHvh2-AU8 29%
MHmm1-AU2 49%
MHmm2-AU6 65%
CWHws2-AU6 60%
CWHvm1-AU12 12%
CWHvh2-AU9 29%
MHmm1-AU4 59%
MHmm2-AU7 59%
CWHxm2-AU6 61%
CWHvm1-AU3 21%
CWHvm1-AU10 25%
MHmm2-AU2 29%
MHmm2e-AU9 59%
ESSFmw-AU12 29%
CWHws2-AU12 12%
CWHvm1-AU11 25%
MHmm2-AU5 65%
MHwh1-AU5 68%
IDFww-AU2 42%
CWHws2-AU2 18%
CWHvm1-AU2 21%
MHmm2e-AU12 29%
MHwh1-AU8 68%
IDFww-AU8 60%
CWHws2-AU3 22%
CWHvm1-AU4 25%
MHmm2e-AU3 49%
MHmm1-AU5 65%
CWHws2-AU7 26%
CWHvm1-AU5 28%
MHmmp-AU8 59%
MHmm1-AU7 59%
CWHxm2-AU1 23%
CWHvm1-AU6 28%
MHmmp-AU9 59%
MHmm2-AU12 29%
CWHxm2-AU2 17%
CWHvm1-AU7 25%
MHwh1-
AU9 68% CWHxm2-
AU8 23% CWHvm1-
AU8 25%
ESSFmw-
AU8 26% CWHvm1-
AU9 25%
ESSFmw-
AU9 26% CWHvm2-
AU5 28%
IDFww-AU12 12%
CWHvm2-AU6 28%
IDFww-
AU3 22% CWHvm2-
AU7 25%
MHwh1-
AU6 29% CWHvm2-
AU8 25%
CWHdm-
AU3 18 CWHvm2-
AU9 25%
CWHdm-
AU5 23 CWHvm3-
AU9 25%
CWHdm-
AU6 26 CWHws2-
AU8 26%
CWHdm-
AU12 13 CWHws2-
AU9 26%
CWHdm-
AU4 23 CWHxm2-
AU7 23%
CWHdm-
AU9 23 MHmm1-
AU6 28%
CWHmm1-
AU1 23 MHmm1-
AU8 25%
CWHmm1-
AU2 18 MHmm1-
AU9 25%
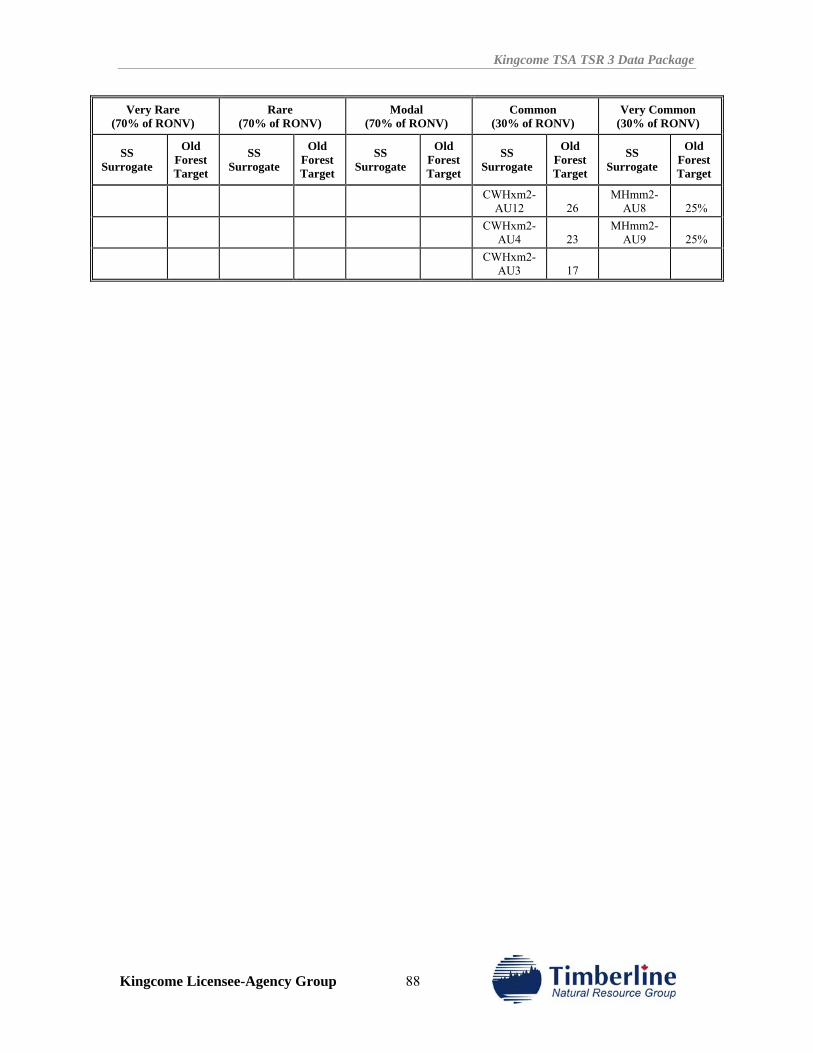
Kingcome TSA TSR 3 Data Package
Kingcome Licensee-Agency Group 88
Very Rare (70% of RONV)
Rare (70% of RONV)
Modal (70% of RONV)
Common (30% of RONV)
Very Common (30% of RONV)
SS Surrogate
Old Forest Target
SS Surrogate
Old Forest Target
SS Surrogate
Old Forest Target
SS Surrogate
Old Forest Target
SS Surrogate
Old Forest Target
CWHxm2-
AU12 26 MHmm2-
AU8 25%
CWHxm2-
AU4 23 MHmm2-
AU9 25%
CWHxm2-
AU3 17
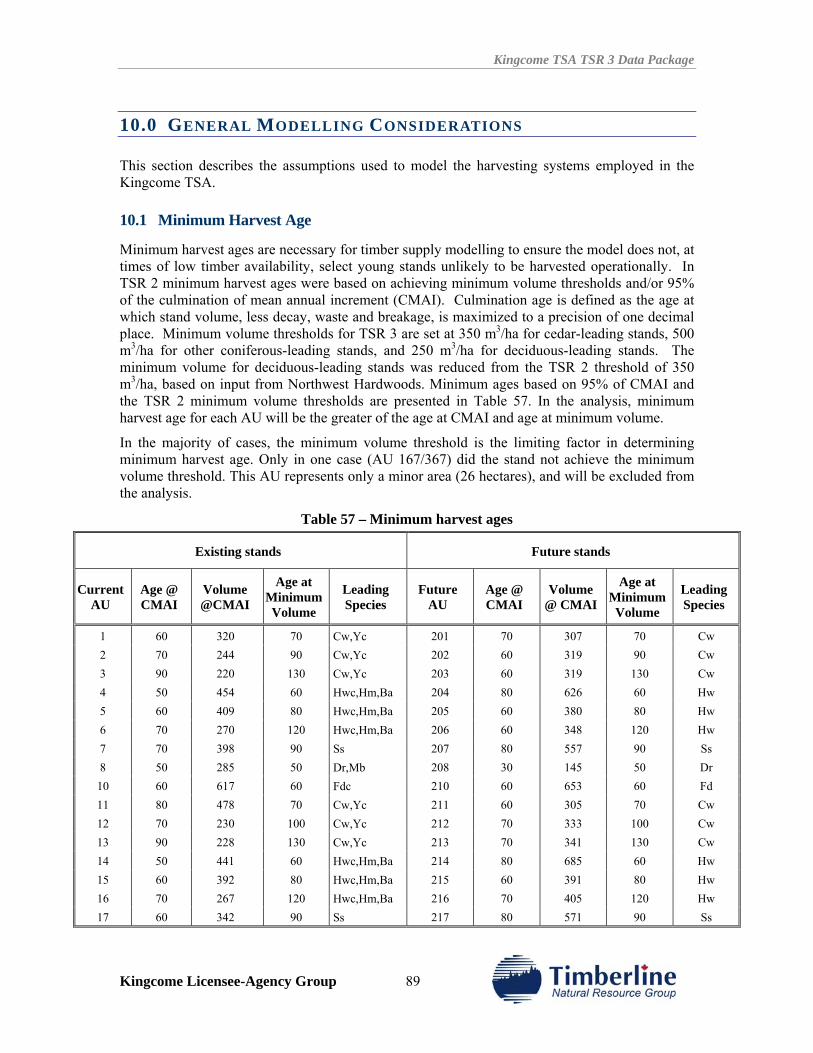
Kingcome TSA TSR 3 Data Package
Kingcome Licensee-Agency Group 89
10.0 GENERAL MODELLING CONSIDERATIONS
This section describes the assumptions used to model the harvesting systems employed in the Kingcome TSA.
10.1 Minimum Harvest Age
Minimum harvest ages are necessary for timber supply modelling to ensure the model does not, at times of low timber availability, select young stands unlikely to be harvested operationally. In TSR 2 minimum harvest ages were based on achieving minimum volume thresholds and/or 95% of the culmination of mean annual increment (CMAI). Culmination age is defined as the age at which stand volume, less decay, waste and breakage, is maximized to a precision of one decimal place. Minimum volume thresholds for TSR 3 are set at 350 m3/ha for cedar-leading stands, 500 m3/ha for other coniferous-leading stands, and 250 m3/ha for deciduous-leading stands. The minimum volume for deciduous-leading stands was reduced from the TSR 2 threshold of 350 m3/ha, based on input from Northwest Hardwoods. Minimum ages based on 95% of CMAI and the TSR 2 minimum volume thresholds are presented in Table 57. In the analysis, minimum harvest age for each AU will be the greater of the age at CMAI and age at minimum volume.
In the majority of cases, the minimum volume threshold is the limiting factor in determining minimum harvest age. Only in one case (AU 167/367) did the stand not achieve the minimum volume threshold. This AU represents only a minor area (26 hectares), and will be excluded from the analysis.
Table 57 – Minimum harvest ages
Existing stands Future stands
Current AU
Age @ CMAI
Volume @CMAI
Age at Minimum Volume
Leading Species
Future AU
Age @ CMAI
Volume @ CMAI
Age at Minimum Volume
Leading Species
1 60 320 70 Cw,Yc 201 70 307 70 Cw 2 70 244 90 Cw,Yc 202 60 319 90 Cw 3 90 220 130 Cw,Yc 203 60 319 130 Cw 4 50 454 60 Hwc,Hm,Ba 204 80 626 60 Hw 5 60 409 80 Hwc,Hm,Ba 205 60 380 80 Hw 6 70 270 120 Hwc,Hm,Ba 206 60 348 120 Hw 7 70 398 90 Ss 207 80 557 90 Ss 8 50 285 50 Dr,Mb 208 30 145 50 Dr 10 60 617 60 Fdc 210 60 653 60 Fd 11 80 478 70 Cw,Yc 211 60 305 70 Cw 12 70 230 100 Cw,Yc 212 70 333 100 Cw 13 90 228 130 Cw,Yc 213 70 341 130 Cw 14 50 441 60 Hwc,Hm,Ba 214 80 685 60 Hw 15 60 392 80 Hwc,Hm,Ba 215 60 391 80 Hw 16 70 267 120 Hwc,Hm,Ba 216 70 405 120 Hw 17 60 342 90 Ss 217 80 571 90 Ss
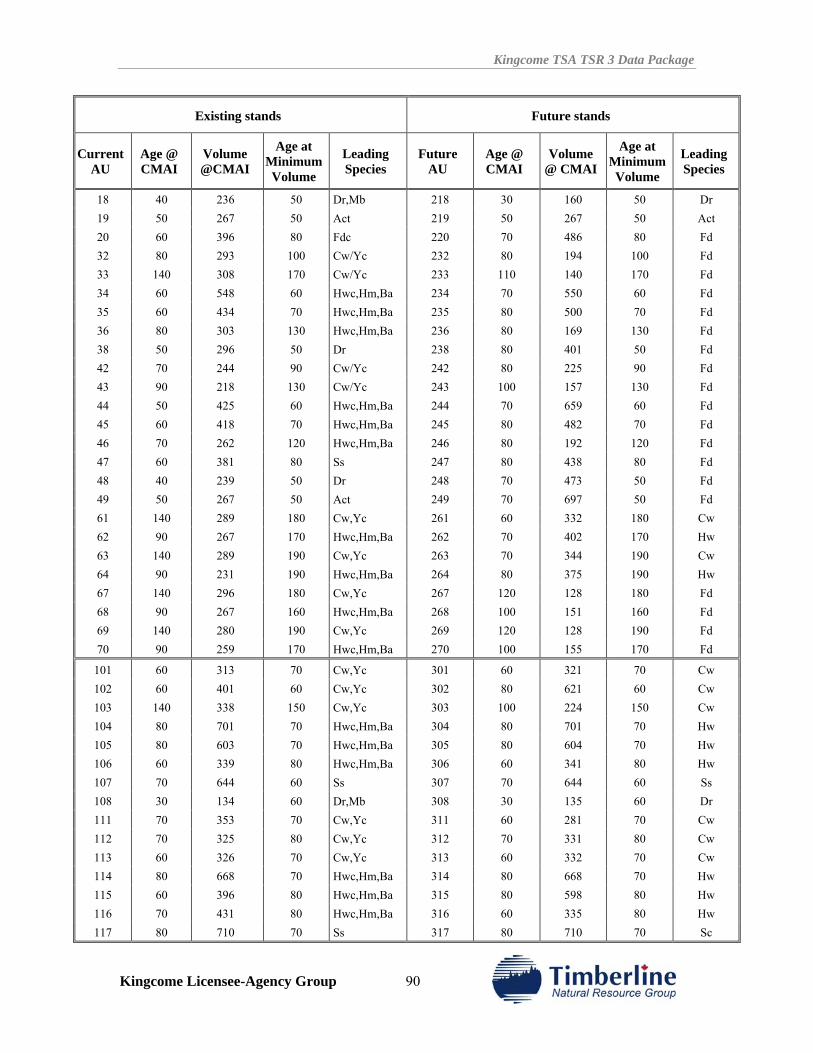
Kingcome TSA TSR 3 Data Package
Kingcome Licensee-Agency Group 90
Existing stands Future stands
Current AU
Age @ CMAI
Volume @CMAI
Age at Minimum Volume
Leading Species
Future AU
Age @ CMAI
Volume @ CMAI
Age at Minimum Volume
Leading Species
18 40 236 50 Dr,Mb 218 30 160 50 Dr 19 50 267 50 Act 219 50 267 50 Act 20 60 396 80 Fdc 220 70 486 80 Fd 32 80 293 100 Cw/Yc 232 80 194 100 Fd 33 140 308 170 Cw/Yc 233 110 140 170 Fd 34 60 548 60 Hwc,Hm,Ba 234 70 550 60 Fd 35 60 434 70 Hwc,Hm,Ba 235 80 500 70 Fd 36 80 303 130 Hwc,Hm,Ba 236 80 169 130 Fd 38 50 296 50 Dr 238 80 401 50 Fd 42 70 244 90 Cw/Yc 242 80 225 90 Fd 43 90 218 130 Cw/Yc 243 100 157 130 Fd 44 50 425 60 Hwc,Hm,Ba 244 70 659 60 Fd 45 60 418 70 Hwc,Hm,Ba 245 80 482 70 Fd 46 70 262 120 Hwc,Hm,Ba 246 80 192 120 Fd 47 60 381 80 Ss 247 80 438 80 Fd 48 40 239 50 Dr 248 70 473 50 Fd 49 50 267 50 Act 249 70 697 50 Fd 61 140 289 180 Cw,Yc 261 60 332 180 Cw 62 90 267 170 Hwc,Hm,Ba 262 70 402 170 Hw 63 140 289 190 Cw,Yc 263 70 344 190 Cw 64 90 231 190 Hwc,Hm,Ba 264 80 375 190 Hw 67 140 296 180 Cw,Yc 267 120 128 180 Fd 68 90 267 160 Hwc,Hm,Ba 268 100 151 160 Fd 69 140 280 190 Cw,Yc 269 120 128 190 Fd 70 90 259 170 Hwc,Hm,Ba 270 100 155 170 Fd
101 60 313 70 Cw,Yc 301 60 321 70 Cw 102 60 401 60 Cw,Yc 302 80 621 60 Cw 103 140 338 150 Cw,Yc 303 100 224 150 Cw 104 80 701 70 Hwc,Hm,Ba 304 80 701 70 Hw 105 80 603 70 Hwc,Hm,Ba 305 80 604 70 Hw 106 60 339 80 Hwc,Hm,Ba 306 60 341 80 Hw 107 70 644 60 Ss 307 70 644 60 Ss 108 30 134 60 Dr,Mb 308 30 135 60 Dr 111 70 353 70 Cw,Yc 311 60 281 70 Cw 112 70 325 80 Cw,Yc 312 70 331 80 Cw 113 60 326 70 Cw,Yc 313 60 332 70 Cw 114 80 668 70 Hwc,Hm,Ba 314 80 668 70 Hw 115 60 396 80 Hwc,Hm,Ba 315 80 598 80 Hw 116 70 431 80 Hwc,Hm,Ba 316 60 335 80 Hw 117 80 710 70 Ss 317 80 710 70 Sc
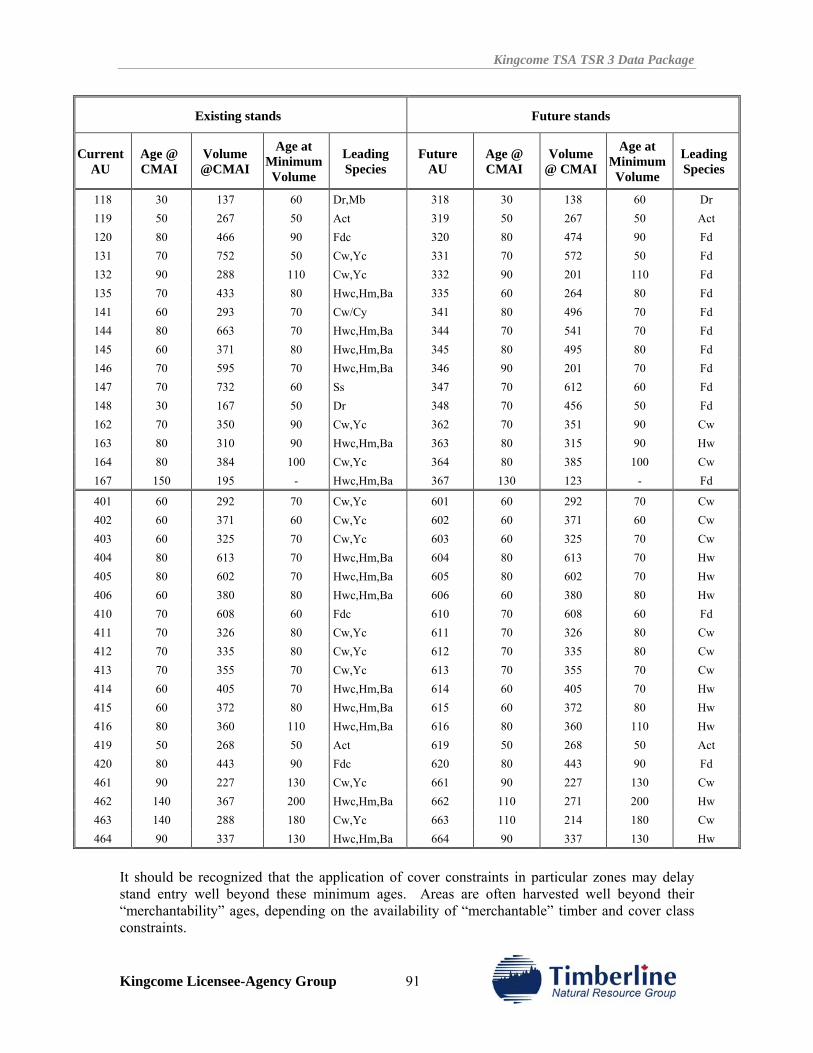
Kingcome TSA TSR 3 Data Package
Kingcome Licensee-Agency Group 91
Existing stands Future stands
Current AU
Age @ CMAI
Volume @CMAI
Age at Minimum Volume
Leading Species
Future AU
Age @ CMAI
Volume @ CMAI
Age at Minimum Volume
Leading Species
118 30 137 60 Dr,Mb 318 30 138 60 Dr 119 50 267 50 Act 319 50 267 50 Act 120 80 466 90 Fdc 320 80 474 90 Fd 131 70 752 50 Cw,Yc 331 70 572 50 Fd 132 90 288 110 Cw,Yc 332 90 201 110 Fd 135 70 433 80 Hwc,Hm,Ba 335 60 264 80 Fd 141 60 293 70 Cw/Cy 341 80 496 70 Fd 144 80 663 70 Hwc,Hm,Ba 344 70 541 70 Fd 145 60 371 80 Hwc,Hm,Ba 345 80 495 80 Fd 146 70 595 70 Hwc,Hm,Ba 346 90 201 70 Fd 147 70 732 60 Ss 347 70 612 60 Fd 148 30 167 50 Dr 348 70 456 50 Fd 162 70 350 90 Cw,Yc 362 70 351 90 Cw 163 80 310 90 Hwc,Hm,Ba 363 80 315 90 Hw 164 80 384 100 Cw,Yc 364 80 385 100 Cw 167 150 195 - Hwc,Hm,Ba 367 130 123 - Fd
401 60 292 70 Cw,Yc 601 60 292 70 Cw 402 60 371 60 Cw,Yc 602 60 371 60 Cw 403 60 325 70 Cw,Yc 603 60 325 70 Cw 404 80 613 70 Hwc,Hm,Ba 604 80 613 70 Hw 405 80 602 70 Hwc,Hm,Ba 605 80 602 70 Hw 406 60 380 80 Hwc,Hm,Ba 606 60 380 80 Hw 410 70 608 60 Fdc 610 70 608 60 Fd 411 70 326 80 Cw,Yc 611 70 326 80 Cw 412 70 335 80 Cw,Yc 612 70 335 80 Cw 413 70 355 70 Cw,Yc 613 70 355 70 Cw 414 60 405 70 Hwc,Hm,Ba 614 60 405 70 Hw 415 60 372 80 Hwc,Hm,Ba 615 60 372 80 Hw 416 80 360 110 Hwc,Hm,Ba 616 80 360 110 Hw 419 50 268 50 Act 619 50 268 50 Act 420 80 443 90 Fdc 620 80 443 90 Fd 461 90 227 130 Cw,Yc 661 90 227 130 Cw 462 140 367 200 Hwc,Hm,Ba 662 110 271 200 Hw 463 140 288 180 Cw,Yc 663 110 214 180 Cw 464 90 337 130 Hwc,Hm,Ba 664 90 337 130 Hw
It should be recognized that the application of cover constraints in particular zones may delay stand entry well beyond these minimum ages. Areas are often harvested well beyond their “merchantability” ages, depending on the availability of “merchantable” timber and cover class constraints.
Kingcome TSA TSR 3 Data Package
Kingcome Licensee-Agency Group 92
A sensitivity analysis investigating the impact of increasing or decreasing the minimum harvest age by ten years will also be performed.
10.2 Harvest Systems
In the Pre-EBM analysis, clearcutting with wildlife tree patch retention is applied in all cases. In the EBM analysis, variable retention harvesting is applied in specific areas within the EBM zone, as described in Section 8.5, with wildlife tree patch retention applied only in the non-EBM zone.
10.3 Harvest Flow Objectives
A number of different harvest flows will be explored, based on tradeoffs between short and mid-term harvest levels. The forest cover constraints and biological capacity of the THLB will dictate timber availability and harvest level options.
The overall strategy employed in the TSA is to gradually adjust harvest levels towards the best estimate of the long-term harvest level (LTHL) for the forest. In all timber supply scenarios, the choice(s) of harvest flow will reflect the following objectives:
• Achieve an acceptable short-term harvest level; • Decrease the periodic harvest level in acceptable steps (≤ 10%) when declines are
required to meet all objectives associated with the various resources on the land base; • Do not permit the mid-term harvest level to fall below a level reflecting the productive
capacity of the TSA (based on VDYP yield estimates); and • Achieve a stable long-term harvest level over a 250-year time horizon reflecting the
productive capacity of the TSA (based on TIPSY yield estimates).
10.4 Non-recoverable Losses
In the analysis, an allowance must be made for non-recoverable losses (volume losses due to fire, windthrow and insect damage that are not captures in stand yield forecasts). In TSR 2 these losses were estimated at 3,083 m3 per year from fire and 10,500 m3/year from windthrow, for a total of 13,583 m3/year. The 2008-2010 Coast Timber Supply Areas Regional Forest Health Overview indicates that this estimate is now too conservative with the increased use of partial cutting and retention system harvesting. However, at this time a revised estimate is not available, and therefore the TSR 2 estimate will be used.
10.5 Initial Harvest Level
The current AAC for the Kingcome TSA is 1,232,000 m3/yr. In addition, an allowance must be made for non-recoverable losses (NRLs). As the timber supply analysis is based on the net harvest plus NRLs, the initial gross harvest level for the TSR 3 Pre-EBM option will be set to 1,245,600 m3/yr, as summarized in Table 58.
Table 58 – Initial harvest level
Volumes (m3/yr) Management Unit
Net Harvest NRLs Gross Harvest
Kingcome TSA 1,232,000 13,600 1,245,600
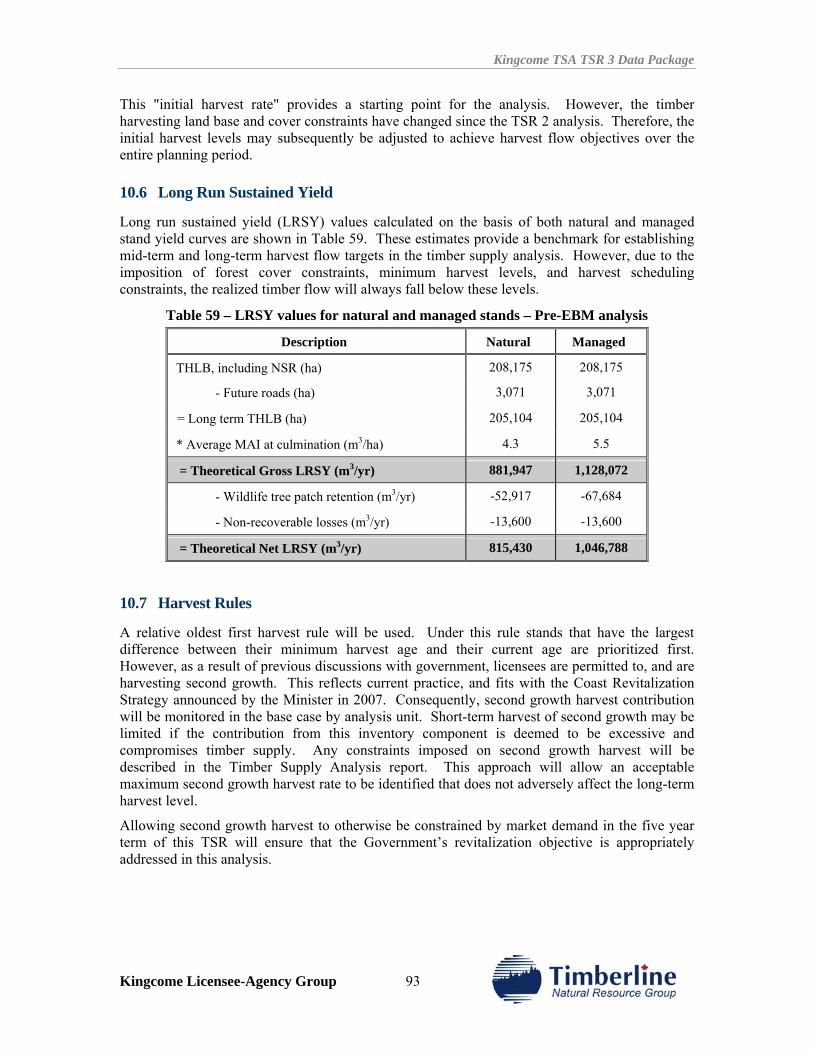
Kingcome TSA TSR 3 Data Package
Kingcome Licensee-Agency Group 93
This "initial harvest rate" provides a starting point for the analysis. However, the timber harvesting land base and cover constraints have changed since the TSR 2 analysis. Therefore, the initial harvest levels may subsequently be adjusted to achieve harvest flow objectives over the entire planning period.
10.6 Long Run Sustained Yield
Long run sustained yield (LRSY) values calculated on the basis of both natural and managed stand yield curves are shown in Table 59. These estimates provide a benchmark for establishing mid-term and long-term harvest flow targets in the timber supply analysis. However, due to the imposition of forest cover constraints, minimum harvest levels, and harvest scheduling constraints, the realized timber flow will always fall below these levels.
Table 59 – LRSY values for natural and managed stands – Pre-EBM analysis
Description Natural Managed
THLB, including NSR (ha) 208,175 208,175
- Future roads (ha) 3,071 3,071
= Long term THLB (ha) 205,104 205,104
* Average MAI at culmination (m3/ha) 4.3 5.5
= Theoretical Gross LRSY (m3/yr) 881,947 1,128,072
- Wildlife tree patch retention (m3/yr) -52,917 -67,684
- Non-recoverable losses (m3/yr) -13,600 -13,600
= Theoretical Net LRSY (m3/yr) 815,430 1,046,788
10.7 Harvest Rules
A relative oldest first harvest rule will be used. Under this rule stands that have the largest difference between their minimum harvest age and their current age are prioritized first. However, as a result of previous discussions with government, licensees are permitted to, and are harvesting second growth. This reflects current practice, and fits with the Coast Revitalization Strategy announced by the Minister in 2007. Consequently, second growth harvest contribution will be monitored in the base case by analysis unit. Short-term harvest of second growth may be limited if the contribution from this inventory component is deemed to be excessive and compromises timber supply. Any constraints imposed on second growth harvest will be described in the Timber Supply Analysis report. This approach will allow an acceptable maximum second growth harvest rate to be identified that does not adversely affect the long-term harvest level.
Allowing second growth harvest to otherwise be constrained by market demand in the five year term of this TSR will ensure that the Government’s revitalization objective is appropriately addressed in this analysis.
Kingcome TSA TSR 3 Data Package
Kingcome Licensee-Agency Group 94
10.8 Natural Disturbance Modelling
In timber supply analysis, the productive non-contributing land base is available to fulfill various resource management requirements, (i.e. seral requirements, retention requirements and thermal requirements). The productive non-contributing land base is not available for harvest. Therefore, unless modelled otherwise, it will continuously age throughout the planning horizon. This is of concern as it becomes unrealistically old and over-contributes to the fulfillment of certain forest cover requirements, thereby reducing the impact on the timber harvest land base (MoFR, 2003b). In reality there will be some level of natural disturbance within the non-contributing land base component, although the frequency, location, and size of these disturbances cannot be reliably predicted.
The following modelling methodology will be employed in these analyses in order to capture the impact of natural disturbances patterns on the productive land base, and in particular on seral and old growth retention requirements:
The methodology follows that outlined in “Modelling Options for Disturbance of Areas Outside of the Timber Harvesting Land base, Draft Working Paper, March 2004”.
For each BEC variant containing pre-EBM THLB, the following parameters were determined based on the Biodiversity Guidebook.
A. Disturbance event return interval (based on NDT).
B. Old growth minimum age.
C. The estimated percentage of area older than the applicable old seral stage. (Biodiversity Guidebook, Table A.4.2)
D. Effective rotation age (B / (1-C/100))
E. Minimum target area (contributing non-THLB area / D)
F. Application of disturbance targets at the LU/BEC level to simulate disturbance rates in the contributing non-THLB.
This process will achieve the natural range of variation for each biogeoclimatic zone within the forest estate, but by design there will be some variations within individual landscape units. The model will recruit the oldest stands in order to achieve the seral requirements as soon as possible. This will impose the desired disturbance each year and achieve a seral stage distribution compatible with the natural range of variation.
Table 60 provides a summary of disturbance targets, to be applied in the analysis at the LU/BEC level.
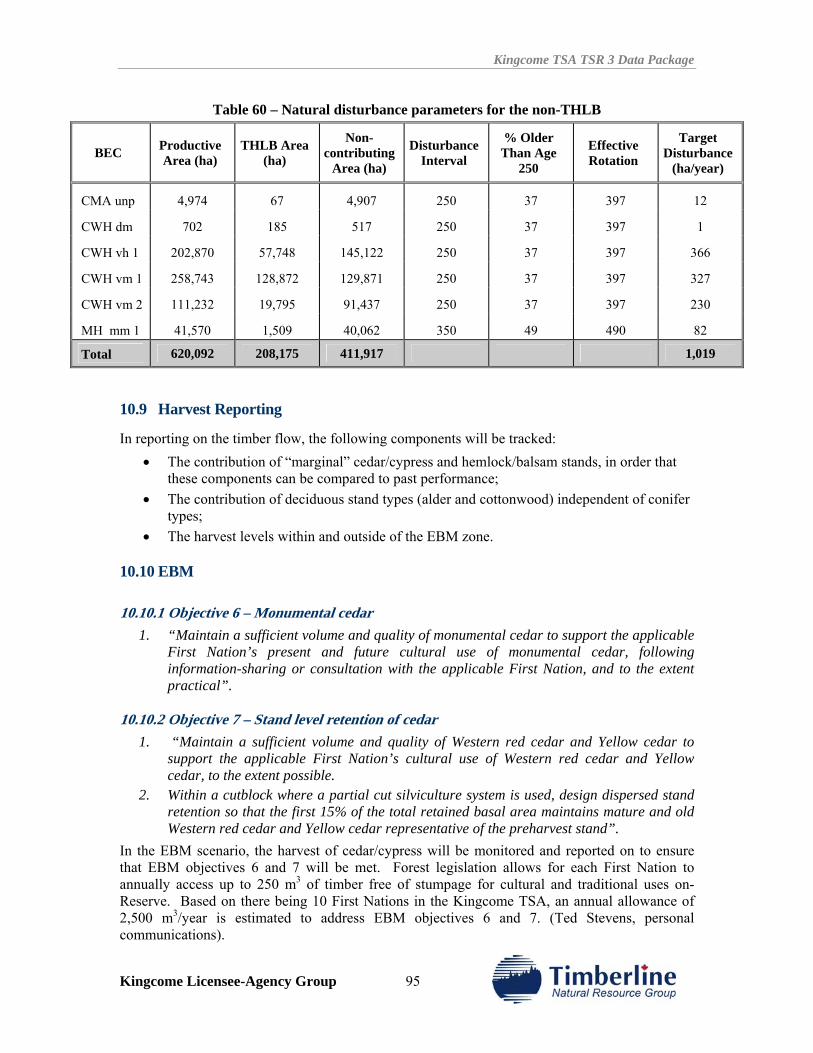
Kingcome TSA TSR 3 Data Package
Kingcome Licensee-Agency Group 95
Table 60 – Natural disturbance parameters for the non-THLB
BEC Productive Area (ha)
THLB Area (ha)
Non-contributing
Area (ha)
Disturbance Interval
% Older Than Age
250
Effective Rotation
Target Disturbance
(ha/year)
CMA unp 4,974 67 4,907 250 37 397 12
CWH dm 702 185 517 250 37 397 1
CWH vh 1 202,870 57,748 145,122 250 37 397 366
CWH vm 1 258,743 128,872 129,871 250 37 397 327
CWH vm 2 111,232 19,795 91,437 250 37 397 230
MH mm 1 41,570 1,509 40,062 350 49 490 82
Total 620,092 208,175 411,917 1,019
10.9 Harvest Reporting
In reporting on the timber flow, the following components will be tracked: • The contribution of “marginal” cedar/cypress and hemlock/balsam stands, in order that
these components can be compared to past performance; • The contribution of deciduous stand types (alder and cottonwood) independent of conifer
types; • The harvest levels within and outside of the EBM zone.
10.10 EBM
10.10.1 Objective 6 – Monumental cedar 1. “Maintain a sufficient volume and quality of monumental cedar to support the applicable
First Nation’s present and future cultural use of monumental cedar, following information-sharing or consultation with the applicable First Nation, and to the extent practical”.
10.10.2 Objective 7 – Stand level retention of cedar 1. “Maintain a sufficient volume and quality of Western red cedar and Yellow cedar to
support the applicable First Nation’s cultural use of Western red cedar and Yellow cedar, to the extent possible.
2. Within a cutblock where a partial cut silviculture system is used, design dispersed stand retention so that the first 15% of the total retained basal area maintains mature and old Western red cedar and Yellow cedar representative of the preharvest stand”.
In the EBM scenario, the harvest of cedar/cypress will be monitored and reported on to ensure that EBM objectives 6 and 7 will be met. Forest legislation allows for each First Nation to annually access up to 250 m3 of timber free of stumpage for cultural and traditional uses on-Reserve. Based on there being 10 First Nations in the Kingcome TSA, an annual allowance of 2,500 m3/year is estimated to address EBM objectives 6 and 7. (Ted Stevens, personal communications).
Kingcome TSA TSR 3 Data Package
Kingcome Licensee-Agency Group 96
11.0 SENSITIVITY ANALYSES
Sensitivity analysis will be used to provide a measure of the upper and lower bounds of the Pre-EBM harvest forecast that reflects the uncertainty in the data and/or the management assumptions made. A specific variable is adjusted and the magnitude of the increase and decrease in the sensitivity variable reflects the degree of uncertainty surrounding the assumption associated with that given variable. By developing and testing a number of sensitivity analyses, it is possible to determine which variables most affect results. Table 61 summarizes the sensitivity issues currently identified.
Table 61 – Sensitivity analysis issues
Issue Tested Sensitivity Level
Harvest flow Establish highest initial harvest level
Establish non-declining even flow (NDEF) harvest level
Regulate the flow from the EBM and non-EBM zones
Harvest rule Use absolute oldest first
Alternate deciduous harvest profiles
Land base Adjust timber harvesting land base by +/- 10%
Alter economic thresholds in operability assessment
Exclude marginal cedar/cypress and hemlock/balsam types
Growth and yield Adjust existing yields by +/- 10% Adjust managed yield site index values by +/- 2 metres. Apply inventory SI values instead of SIA values to managed stands Apply 8% OAF1 adjustments to TIPSY yield curves
Visual landscape Adjust green-up ages +/- 5 years
Green-up Adjust all green-up ages +/- 5 years
Minimum harvest ages Adjust minimum harvest ages +/- 10 years
Second growth Evaluation of alternative second growth harvest rates on short and long-term harvest levels
Variable retention Apply alternative (high and low) EBM variable retention rules
Kingcome TSA TSR 3 Data Package
Kingcome Licensee-Agency Group 97
12.0 REFERENCES
B.C. Ministry of Agriculture and Lands. 2007. South Central Coast Order.
B.C. Ministry of Forests. 1995. Riparian Management Area Guidebook.
B.C. Ministry of Forests. 1999. Landscape Unit Planning Guide..
B.C. Ministry of Forests. 2001. Timber supply review, Kingcome Timber Supply Area Analysis Report. Timber Supply Branch.
B.C. Ministry of Forests. 2002. Kingcome Timber Supply Area, Rationale for Allowable Annual Cut (AAC) determination.
B.C. Ministry of Forests. 2003a. DFAM interim standards for Data Package preparation and timber supply analysis. Timber Supply Branch.
B.C. Ministry of Forests. 2003b. Modelling options for disturbance of areas outside the timber harvesting land base. Draft working paper. Forest Analysis Branch.
B.C. Ministry of Forests. 2003c. Supplemental guide for preparing the timber supply analysis package. Forest Analysis Branch.
B.C. Ministry of Forests. 2003d Harvest flow considerations for the timber supply review. Draft working paper. Forest Analysis Branch.
B.C. Ministry of Forests. 2004. Vegetation Resources Inventory, Procedures and Standards for Data Analysis Attribute Adjustment and Implementation of Adjustment in a Corporate Database, Unpublished Report.
Chatwin, T and M. Mather. 2007. Background document to accompany BC coastal marbled murrelet habitat suitability maps. Marbled murrelet habitat recovery implementation group.
Coast Region FRPA Implementation Team (CRIT) Silviculture Committee. 2008. Hardwood management in the Coast Forest Region, Unpublished Draft Report.
J.S. Thrower & Associates. 2005. Kingcome Timber Supply Area, Vegetation Resources Inventory, Statistical Adjustment.
Timberline Forest Inventory Consultants. 2006. Kingcome TSA Economic Operability Assessment.
Timberline Natural Resource Group. 2007a. Site Index Adjustment of the Kingcome TSA. Report prepared for I.Robertson on behalf of TSA licensees, by TNRG.
Timberline Natural Resource Group. 2007b. Methods Used to Model Ecosystem Based Management in the Kingcome TSA for Timber Supply Review 3.

Kingcome TSA TSR 3 Data Package
Kingcome Licensee-Agency Group 98
Kingcome TSA TSR 3 Data Package
Kingcome Licensee-Agency Group A-99
APPENDIX I PRE-EBM YIELD TABLES
Kingcome TSA TSR 3 Data Package
Kingcome Licensee-Agency Group A-100
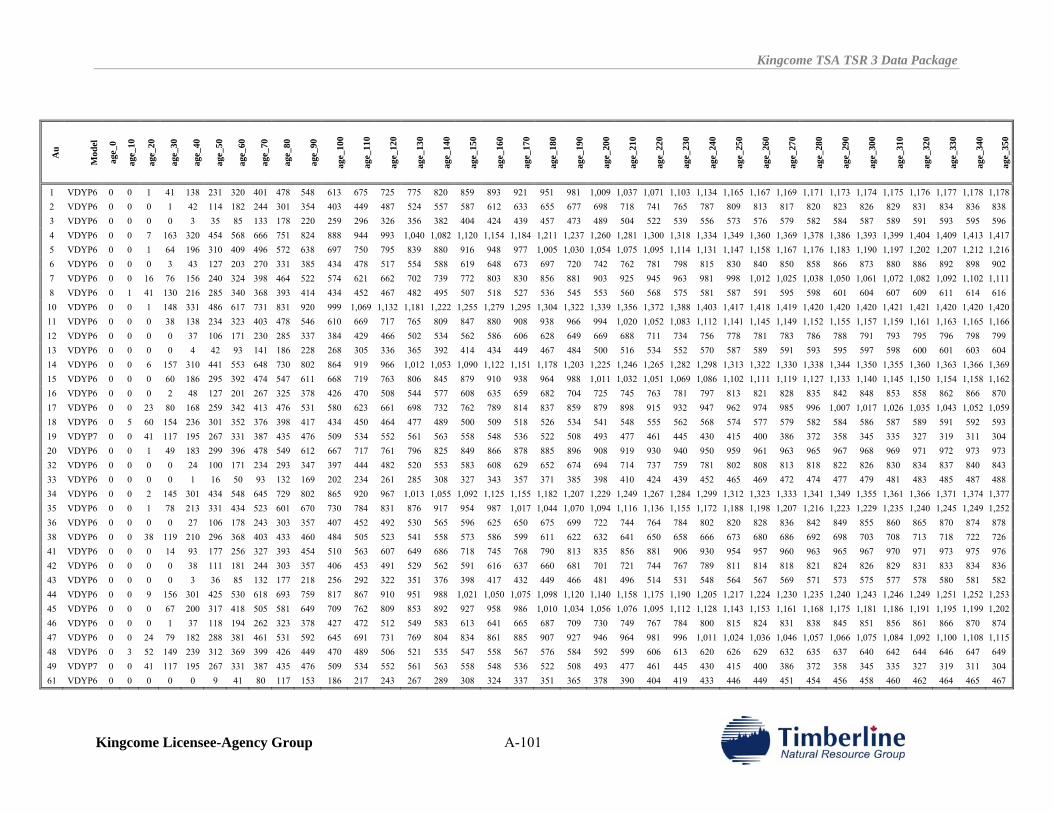
Kingcome TSA TSR 3 Data Package
Kingcome Licensee-Agency Group A-101
Au
Mod
el
age_
0
age_
10
age_
20
age_
30
age_
40
age_
50
age_
60
age_
70
age_
80
age_
90
age_
100
age_
110
age_
120
age_
130
age_
140
age_
150
age_
160
age_
170
age_
180
age_
190
age_
200
age_
210
age_
220
age_
230
age_
240
age_
250
age_
260
age_
270
age_
280
age_
290
age_
300
age_
310
age_
320
age_
330
age_
340
age_
350
1 VDYP6 0 0 1 41 138 231 320 401 478 548 613 675 725 775 820 859 893 921 951 981 1,009 1,037 1,071 1,103 1,134 1,165 1,167 1,169 1,171 1,173 1,174 1,175 1,176 1,177 1,178 1,178 2 VDYP6 0 0 0 1 42 114 182 244 301 354 403 449 487 524 557 587 612 633 655 677 698 718 741 765 787 809 813 817 820 823 826 829 831 834 836 838 3 VDYP6 0 0 0 0 3 35 85 133 178 220 259 296 326 356 382 404 424 439 457 473 489 504 522 539 556 573 576 579 582 584 587 589 591 593 595 596 4 VDYP6 0 0 7 163 320 454 568 666 751 824 888 944 993 1,040 1,082 1,120 1,154 1,184 1,211 1,237 1,260 1,281 1,300 1,318 1,334 1,349 1,360 1,369 1,378 1,386 1,393 1,399 1,404 1,409 1,413 1,417 5 VDYP6 0 0 1 64 196 310 409 496 572 638 697 750 795 839 880 916 948 977 1,005 1,030 1,054 1,075 1,095 1,114 1,131 1,147 1,158 1,167 1,176 1,183 1,190 1,197 1,202 1,207 1,212 1,216 6 VDYP6 0 0 0 3 43 127 203 270 331 385 434 478 517 554 588 619 648 673 697 720 742 762 781 798 815 830 840 850 858 866 873 880 886 892 898 902 7 VDYP6 0 0 16 76 156 240 324 398 464 522 574 621 662 702 739 772 803 830 856 881 903 925 945 963 981 998 1,012 1,025 1,038 1,050 1,061 1,072 1,082 1,092 1,102 1,111 8 VDYP6 0 1 41 130 216 285 340 368 393 414 434 452 467 482 495 507 518 527 536 545 553 560 568 575 581 587 591 595 598 601 604 607 609 611 614 616 10 VDYP6 0 0 1 148 331 486 617 731 831 920 999 1,069 1,132 1,181 1,222 1,255 1,279 1,295 1,304 1,322 1,339 1,356 1,372 1,388 1,403 1,417 1,418 1,419 1,420 1,420 1,420 1,421 1,421 1,420 1,420 1,420 11 VDYP6 0 0 0 38 138 234 323 403 478 546 610 669 717 765 809 847 880 908 938 966 994 1,020 1,052 1,083 1,112 1,141 1,145 1,149 1,152 1,155 1,157 1,159 1,161 1,163 1,165 1,166 12 VDYP6 0 0 0 0 37 106 171 230 285 337 384 429 466 502 534 562 586 606 628 649 669 688 711 734 756 778 781 783 786 788 791 793 795 796 798 799 13 VDYP6 0 0 0 0 4 42 93 141 186 228 268 305 336 365 392 414 434 449 467 484 500 516 534 552 570 587 589 591 593 595 597 598 600 601 603 604 14 VDYP6 0 0 6 157 310 441 553 648 730 802 864 919 966 1,012 1,053 1,090 1,122 1,151 1,178 1,203 1,225 1,246 1,265 1,282 1,298 1,313 1,322 1,330 1,338 1,344 1,350 1,355 1,360 1,363 1,366 1,369 15 VDYP6 0 0 0 60 186 295 392 474 547 611 668 719 763 806 845 879 910 938 964 988 1,011 1,032 1,051 1,069 1,086 1,102 1,111 1,119 1,127 1,133 1,140 1,145 1,150 1,154 1,158 1,162 16 VDYP6 0 0 0 2 48 127 201 267 325 378 426 470 508 544 577 608 635 659 682 704 725 745 763 781 797 813 821 828 835 842 848 853 858 862 866 870 17 VDYP6 0 0 23 80 168 259 342 413 476 531 580 623 661 698 732 762 789 814 837 859 879 898 915 932 947 962 974 985 996 1,007 1,017 1,026 1,035 1,043 1,052 1,059 18 VDYP6 0 5 60 154 236 301 352 376 398 417 434 450 464 477 489 500 509 518 526 534 541 548 555 562 568 574 577 579 582 584 586 587 589 591 592 593 19 VDYP7 0 0 41 117 195 267 331 387 435 476 509 534 552 561 563 558 548 536 522 508 493 477 461 445 430 415 400 386 372 358 345 335 327 319 311 304 20 VDYP6 0 0 1 49 183 299 396 478 549 612 667 717 761 796 825 849 866 878 885 896 908 919 930 940 950 959 961 963 965 967 968 969 971 972 973 973 32 VDYP6 0 0 0 0 24 100 171 234 293 347 397 444 482 520 553 583 608 629 652 674 694 714 737 759 781 802 808 813 818 822 826 830 834 837 840 843 33 VDYP6 0 0 0 0 1 16 50 93 132 169 202 234 261 285 308 327 343 357 371 385 398 410 424 439 452 465 469 472 474 477 479 481 483 485 487 488 34 VDYP6 0 0 2 145 301 434 548 645 729 802 865 920 967 1,013 1,055 1,092 1,125 1,155 1,182 1,207 1,229 1,249 1,267 1,284 1,299 1,312 1,323 1,333 1,341 1,349 1,355 1,361 1,366 1,371 1,374 1,377 35 VDYP6 0 0 1 78 213 331 434 523 601 670 730 784 831 876 917 954 987 1,017 1,044 1,070 1,094 1,116 1,136 1,155 1,172 1,188 1,198 1,207 1,216 1,223 1,229 1,235 1,240 1,245 1,249 1,252 36 VDYP6 0 0 0 0 27 106 178 243 303 357 407 452 492 530 565 596 625 650 675 699 722 744 764 784 802 820 828 836 842 849 855 860 865 870 874 878 38 VDYP6 0 0 38 119 210 296 368 403 433 460 484 505 523 541 558 573 586 599 611 622 632 641 650 658 666 673 680 686 692 698 703 708 713 718 722 726 41 VDYP6 0 0 0 14 93 177 256 327 393 454 510 563 607 649 686 718 745 768 790 813 835 856 881 906 930 954 957 960 963 965 967 970 971 973 975 976 42 VDYP6 0 0 0 0 38 111 181 244 303 357 406 453 491 529 562 591 616 637 660 681 701 721 744 767 789 811 814 818 821 824 826 829 831 833 834 836 43 VDYP6 0 0 0 0 3 36 85 132 177 218 256 292 322 351 376 398 417 432 449 466 481 496 514 531 548 564 567 569 571 573 575 577 578 580 581 582 44 VDYP6 0 0 9 156 301 425 530 618 693 759 817 867 910 951 988 1,021 1,050 1,075 1,098 1,120 1,140 1,158 1,175 1,190 1,205 1,217 1,224 1,230 1,235 1,240 1,243 1,246 1,249 1,251 1,252 1,253 45 VDYP6 0 0 0 67 200 317 418 505 581 649 709 762 809 853 892 927 958 986 1,010 1,034 1,056 1,076 1,095 1,112 1,128 1,143 1,153 1,161 1,168 1,175 1,181 1,186 1,191 1,195 1,199 1,202 46 VDYP6 0 0 0 1 37 118 194 262 323 378 427 472 512 549 583 613 641 665 687 709 730 749 767 784 800 815 824 831 838 845 851 856 861 866 870 874 47 VDYP6 0 0 24 79 182 288 381 461 531 592 645 691 731 769 804 834 861 885 907 927 946 964 981 996 1,011 1,024 1,036 1,046 1,057 1,066 1,075 1,084 1,092 1,100 1,108 1,115 48 VDYP6 0 3 52 149 239 312 369 399 426 449 470 489 506 521 535 547 558 567 576 584 592 599 606 613 620 626 629 632 635 637 640 642 644 646 647 649 49 VDYP7 0 0 41 117 195 267 331 387 435 476 509 534 552 561 563 558 548 536 522 508 493 477 461 445 430 415 400 386 372 358 345 335 327 319 311 304 61 VDYP6 0 0 0 0 0 9 41 80 117 153 186 217 243 267 289 308 324 337 351 365 378 390 404 419 433 446 449 451 454 456 458 460 462 464 465 467
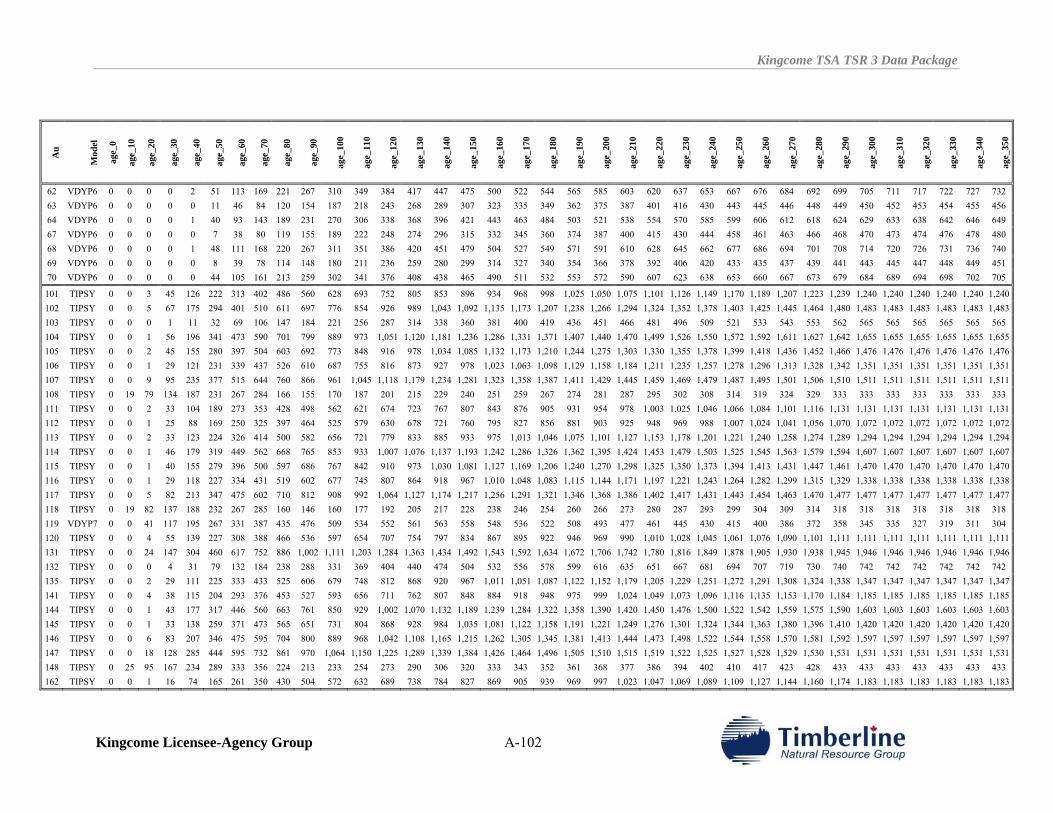
Kingcome TSA TSR 3 Data Package
Kingcome Licensee-Agency Group A-102
Au
Mod
el
age_
0
age_
10
age_
20
age_
30
age_
40
age_
50
age_
60
age_
70
age_
80
age_
90
age_
100
age_
110
age_
120
age_
130
age_
140
age_
150
age_
160
age_
170
age_
180
age_
190
age_
200
age_
210
age_
220
age_
230
age_
240
age_
250
age_
260
age_
270
age_
280
age_
290
age_
300
age_
310
age_
320
age_
330
age_
340
age_
350
62 VDYP6 0 0 0 0 2 51 113 169 221 267 310 349 384 417 447 475 500 522 544 565 585 603 620 637 653 667 676 684 692 699 705 711 717 722 727 732 63 VDYP6 0 0 0 0 0 11 46 84 120 154 187 218 243 268 289 307 323 335 349 362 375 387 401 416 430 443 445 446 448 449 450 452 453 454 455 456 64 VDYP6 0 0 0 0 1 40 93 143 189 231 270 306 338 368 396 421 443 463 484 503 521 538 554 570 585 599 606 612 618 624 629 633 638 642 646 649 67 VDYP6 0 0 0 0 0 7 38 80 119 155 189 222 248 274 296 315 332 345 360 374 387 400 415 430 444 458 461 463 466 468 470 473 474 476 478 480 68 VDYP6 0 0 0 0 1 48 111 168 220 267 311 351 386 420 451 479 504 527 549 571 591 610 628 645 662 677 686 694 701 708 714 720 726 731 736 740 69 VDYP6 0 0 0 0 0 8 39 78 114 148 180 211 236 259 280 299 314 327 340 354 366 378 392 406 420 433 435 437 439 441 443 445 447 448 449 451 70 VDYP6 0 0 0 0 0 44 105 161 213 259 302 341 376 408 438 465 490 511 532 553 572 590 607 623 638 653 660 667 673 679 684 689 694 698 702 705
101 TIPSY 0 0 3 45 126 222 313 402 486 560 628 693 752 805 853 896 934 968 998 1,025 1,050 1,075 1,101 1,126 1,149 1,170 1,189 1,207 1,223 1,239 1,240 1,240 1,240 1,240 1,240 1,240 102 TIPSY 0 0 5 67 175 294 401 510 611 697 776 854 926 989 1,043 1,092 1,135 1,173 1,207 1,238 1,266 1,294 1,324 1,352 1,378 1,403 1,425 1,445 1,464 1,480 1,483 1,483 1,483 1,483 1,483 1,483 103 TIPSY 0 0 0 1 11 32 69 106 147 184 221 256 287 314 338 360 381 400 419 436 451 466 481 496 509 521 533 543 553 562 565 565 565 565 565 565 104 TIPSY 0 0 1 56 196 341 473 590 701 799 889 973 1,051 1,120 1,181 1,236 1,286 1,331 1,371 1,407 1,440 1,470 1,499 1,526 1,550 1,572 1,592 1,611 1,627 1,642 1,655 1,655 1,655 1,655 1,655 1,655 105 TIPSY 0 0 2 45 155 280 397 504 603 692 773 848 916 978 1,034 1,085 1,132 1,173 1,210 1,244 1,275 1,303 1,330 1,355 1,378 1,399 1,418 1,436 1,452 1,466 1,476 1,476 1,476 1,476 1,476 1,476 106 TIPSY 0 0 1 29 121 231 339 437 526 610 687 755 816 873 927 978 1,023 1,063 1,098 1,129 1,158 1,184 1,211 1,235 1,257 1,278 1,296 1,313 1,328 1,342 1,351 1,351 1,351 1,351 1,351 1,351 107 TIPSY 0 0 9 95 235 377 515 644 760 866 961 1,045 1,118 1,179 1,234 1,281 1,323 1,358 1,387 1,411 1,429 1,445 1,459 1,469 1,479 1,487 1,495 1,501 1,506 1,510 1,511 1,511 1,511 1,511 1,511 1,511 108 TIPSY 0 19 79 134 187 231 267 284 166 155 170 187 201 215 229 240 251 259 267 274 281 287 295 302 308 314 319 324 329 333 333 333 333 333 333 333 111 TIPSY 0 0 2 33 104 189 273 353 428 498 562 621 674 723 767 807 843 876 905 931 954 978 1,003 1,025 1,046 1,066 1,084 1,101 1,116 1,131 1,131 1,131 1,131 1,131 1,131 1,131 112 TIPSY 0 0 1 25 88 169 250 325 397 464 525 579 630 678 721 760 795 827 856 881 903 925 948 969 988 1,007 1,024 1,041 1,056 1,070 1,072 1,072 1,072 1,072 1,072 1,072 113 TIPSY 0 0 2 33 123 224 326 414 500 582 656 721 779 833 885 933 975 1,013 1,046 1,075 1,101 1,127 1,153 1,178 1,201 1,221 1,240 1,258 1,274 1,289 1,294 1,294 1,294 1,294 1,294 1,294 114 TIPSY 0 0 1 46 179 319 449 562 668 765 853 933 1,007 1,076 1,137 1,193 1,242 1,286 1,326 1,362 1,395 1,424 1,453 1,479 1,503 1,525 1,545 1,563 1,579 1,594 1,607 1,607 1,607 1,607 1,607 1,607 115 TIPSY 0 0 1 40 155 279 396 500 597 686 767 842 910 973 1,030 1,081 1,127 1,169 1,206 1,240 1,270 1,298 1,325 1,350 1,373 1,394 1,413 1,431 1,447 1,461 1,470 1,470 1,470 1,470 1,470 1,470 116 TIPSY 0 0 1 29 118 227 334 431 519 602 677 745 807 864 918 967 1,010 1,048 1,083 1,115 1,144 1,171 1,197 1,221 1,243 1,264 1,282 1,299 1,315 1,329 1,338 1,338 1,338 1,338 1,338 1,338 117 TIPSY 0 0 5 82 213 347 475 602 710 812 908 992 1,064 1,127 1,174 1,217 1,256 1,291 1,321 1,346 1,368 1,386 1,402 1,417 1,431 1,443 1,454 1,463 1,470 1,477 1,477 1,477 1,477 1,477 1,477 1,477 118 TIPSY 0 19 82 137 188 232 267 285 160 146 160 177 192 205 217 228 238 246 254 260 266 273 280 287 293 299 304 309 314 318 318 318 318 318 318 318 119 VDYP7 0 0 41 117 195 267 331 387 435 476 509 534 552 561 563 558 548 536 522 508 493 477 461 445 430 415 400 386 372 358 345 335 327 319 311 304 120 TIPSY 0 0 4 55 139 227 308 388 466 536 597 654 707 754 797 834 867 895 922 946 969 990 1,010 1,028 1,045 1,061 1,076 1,090 1,101 1,111 1,111 1,111 1,111 1,111 1,111 1,111 131 TIPSY 0 0 24 147 304 460 617 752 886 1,002 1,111 1,203 1,284 1,363 1,434 1,492 1,543 1,592 1,634 1,672 1,706 1,742 1,780 1,816 1,849 1,878 1,905 1,930 1,938 1,945 1,946 1,946 1,946 1,946 1,946 1,946 132 TIPSY 0 0 0 4 31 79 132 184 238 288 331 369 404 440 474 504 532 556 578 599 616 635 651 667 681 694 707 719 730 740 742 742 742 742 742 742 135 TIPSY 0 0 2 29 111 225 333 433 525 606 679 748 812 868 920 967 1,011 1,051 1,087 1,122 1,152 1,179 1,205 1,229 1,251 1,272 1,291 1,308 1,324 1,338 1,347 1,347 1,347 1,347 1,347 1,347 141 TIPSY 0 0 4 38 115 204 293 376 453 527 593 656 711 762 807 848 884 918 948 975 999 1,024 1,049 1,073 1,096 1,116 1,135 1,153 1,170 1,184 1,185 1,185 1,185 1,185 1,185 1,185 144 TIPSY 0 0 1 43 177 317 446 560 663 761 850 929 1,002 1,070 1,132 1,189 1,239 1,284 1,322 1,358 1,390 1,420 1,450 1,476 1,500 1,522 1,542 1,559 1,575 1,590 1,603 1,603 1,603 1,603 1,603 1,603 145 TIPSY 0 0 1 33 138 259 371 473 565 651 731 804 868 928 984 1,035 1,081 1,122 1,158 1,191 1,221 1,249 1,276 1,301 1,324 1,344 1,363 1,380 1,396 1,410 1,420 1,420 1,420 1,420 1,420 1,420 146 TIPSY 0 0 6 83 207 346 475 595 704 800 889 968 1,042 1,108 1,165 1,215 1,262 1,305 1,345 1,381 1,413 1,444 1,473 1,498 1,522 1,544 1,558 1,570 1,581 1,592 1,597 1,597 1,597 1,597 1,597 1,597 147 TIPSY 0 0 18 128 285 444 595 732 861 970 1,064 1,150 1,225 1,289 1,339 1,384 1,426 1,464 1,496 1,505 1,510 1,515 1,519 1,522 1,525 1,527 1,528 1,529 1,530 1,531 1,531 1,531 1,531 1,531 1,531 1,531 148 TIPSY 0 25 95 167 234 289 333 356 224 213 233 254 273 290 306 320 333 343 352 361 368 377 386 394 402 410 417 423 428 433 433 433 433 433 433 433 162 TIPSY 0 0 1 16 74 165 261 350 430 504 572 632 689 738 784 827 869 905 939 969 997 1,023 1,047 1,069 1,089 1,109 1,127 1,144 1,160 1,174 1,183 1,183 1,183 1,183 1,183 1,183
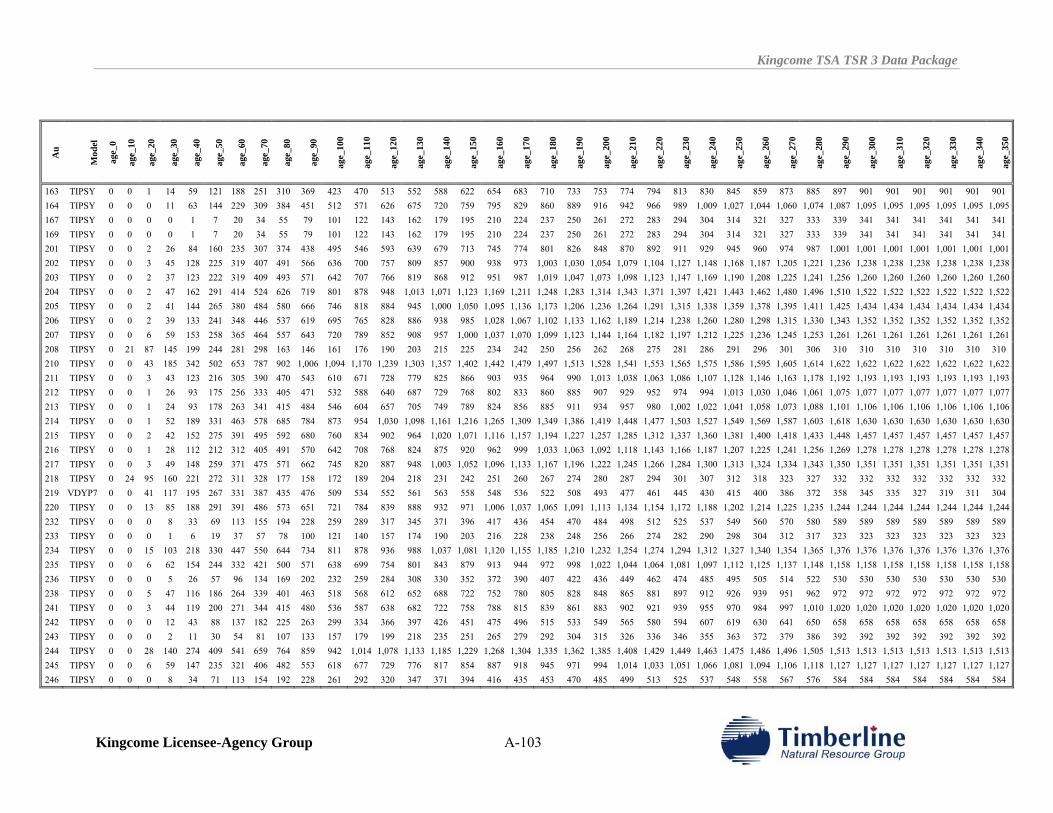
Kingcome TSA TSR 3 Data Package
Kingcome Licensee-Agency Group A-103
Au
Mod
el
age_
0
age_
10
age_
20
age_
30
age_
40
age_
50
age_
60
age_
70
age_
80
age_
90
age_
100
age_
110
age_
120
age_
130
age_
140
age_
150
age_
160
age_
170
age_
180
age_
190
age_
200
age_
210
age_
220
age_
230
age_
240
age_
250
age_
260
age_
270
age_
280
age_
290
age_
300
age_
310
age_
320
age_
330
age_
340
age_
350
163 TIPSY 0 0 1 14 59 121 188 251 310 369 423 470 513 552 588 622 654 683 710 733 753 774 794 813 830 845 859 873 885 897 901 901 901 901 901 901 164 TIPSY 0 0 0 11 63 144 229 309 384 451 512 571 626 675 720 759 795 829 860 889 916 942 966 989 1,009 1,027 1,044 1,060 1,074 1,087 1,095 1,095 1,095 1,095 1,095 1,095 167 TIPSY 0 0 0 0 1 7 20 34 55 79 101 122 143 162 179 195 210 224 237 250 261 272 283 294 304 314 321 327 333 339 341 341 341 341 341 341 169 TIPSY 0 0 0 0 1 7 20 34 55 79 101 122 143 162 179 195 210 224 237 250 261 272 283 294 304 314 321 327 333 339 341 341 341 341 341 341 201 TIPSY 0 0 2 26 84 160 235 307 374 438 495 546 593 639 679 713 745 774 801 826 848 870 892 911 929 945 960 974 987 1,001 1,001 1,001 1,001 1,001 1,001 1,001 202 TIPSY 0 0 3 45 128 225 319 407 491 566 636 700 757 809 857 900 938 973 1,003 1,030 1,054 1,079 1,104 1,127 1,148 1,168 1,187 1,205 1,221 1,236 1,238 1,238 1,238 1,238 1,238 1,238 203 TIPSY 0 0 2 37 123 222 319 409 493 571 642 707 766 819 868 912 951 987 1,019 1,047 1,073 1,098 1,123 1,147 1,169 1,190 1,208 1,225 1,241 1,256 1,260 1,260 1,260 1,260 1,260 1,260 204 TIPSY 0 0 2 47 162 291 414 524 626 719 801 878 948 1,013 1,071 1,123 1,169 1,211 1,248 1,283 1,314 1,343 1,371 1,397 1,421 1,443 1,462 1,480 1,496 1,510 1,522 1,522 1,522 1,522 1,522 1,522 205 TIPSY 0 0 2 41 144 265 380 484 580 666 746 818 884 945 1,000 1,050 1,095 1,136 1,173 1,206 1,236 1,264 1,291 1,315 1,338 1,359 1,378 1,395 1,411 1,425 1,434 1,434 1,434 1,434 1,434 1,434 206 TIPSY 0 0 2 39 133 241 348 446 537 619 695 765 828 886 938 985 1,028 1,067 1,102 1,133 1,162 1,189 1,214 1,238 1,260 1,280 1,298 1,315 1,330 1,343 1,352 1,352 1,352 1,352 1,352 1,352 207 TIPSY 0 0 6 59 153 258 365 464 557 643 720 789 852 908 957 1,000 1,037 1,070 1,099 1,123 1,144 1,164 1,182 1,197 1,212 1,225 1,236 1,245 1,253 1,261 1,261 1,261 1,261 1,261 1,261 1,261 208 TIPSY 0 21 87 145 199 244 281 298 163 146 161 176 190 203 215 225 234 242 250 256 262 268 275 281 286 291 296 301 306 310 310 310 310 310 310 310 210 TIPSY 0 0 43 185 342 502 653 787 902 1,006 1,094 1,170 1,239 1,303 1,357 1,402 1,442 1,479 1,497 1,513 1,528 1,541 1,553 1,565 1,575 1,586 1,595 1,605 1,614 1,622 1,622 1,622 1,622 1,622 1,622 1,622 211 TIPSY 0 0 3 43 123 216 305 390 470 543 610 671 728 779 825 866 903 935 964 990 1,013 1,038 1,063 1,086 1,107 1,128 1,146 1,163 1,178 1,192 1,193 1,193 1,193 1,193 1,193 1,193 212 TIPSY 0 0 1 26 93 175 256 333 405 471 532 588 640 687 729 768 802 833 860 885 907 929 952 974 994 1,013 1,030 1,046 1,061 1,075 1,077 1,077 1,077 1,077 1,077 1,077 213 TIPSY 0 0 1 24 93 178 263 341 415 484 546 604 657 705 749 789 824 856 885 911 934 957 980 1,002 1,022 1,041 1,058 1,073 1,088 1,101 1,106 1,106 1,106 1,106 1,106 1,106 214 TIPSY 0 0 1 52 189 331 463 578 685 784 873 954 1,030 1,098 1,161 1,216 1,265 1,309 1,349 1,386 1,419 1,448 1,477 1,503 1,527 1,549 1,569 1,587 1,603 1,618 1,630 1,630 1,630 1,630 1,630 1,630 215 TIPSY 0 0 2 42 152 275 391 495 592 680 760 834 902 964 1,020 1,071 1,116 1,157 1,194 1,227 1,257 1,285 1,312 1,337 1,360 1,381 1,400 1,418 1,433 1,448 1,457 1,457 1,457 1,457 1,457 1,457 216 TIPSY 0 0 1 28 112 212 312 405 491 570 642 708 768 824 875 920 962 999 1,033 1,063 1,092 1,118 1,143 1,166 1,187 1,207 1,225 1,241 1,256 1,269 1,278 1,278 1,278 1,278 1,278 1,278 217 TIPSY 0 0 3 49 148 259 371 475 571 662 745 820 887 948 1,003 1,052 1,096 1,133 1,167 1,196 1,222 1,245 1,266 1,284 1,300 1,313 1,324 1,334 1,343 1,350 1,351 1,351 1,351 1,351 1,351 1,351 218 TIPSY 0 24 95 160 221 272 311 328 177 158 172 189 204 218 231 242 251 260 267 274 280 287 294 301 307 312 318 323 327 332 332 332 332 332 332 332 219 VDYP7 0 0 41 117 195 267 331 387 435 476 509 534 552 561 563 558 548 536 522 508 493 477 461 445 430 415 400 386 372 358 345 335 327 319 311 304 220 TIPSY 0 0 13 85 188 291 391 486 573 651 721 784 839 888 932 971 1,006 1,037 1,065 1,091 1,113 1,134 1,154 1,172 1,188 1,202 1,214 1,225 1,235 1,244 1,244 1,244 1,244 1,244 1,244 1,244 232 TIPSY 0 0 0 8 33 69 113 155 194 228 259 289 317 345 371 396 417 436 454 470 484 498 512 525 537 549 560 570 580 589 589 589 589 589 589 589 233 TIPSY 0 0 0 1 6 19 37 57 78 100 121 140 157 174 190 203 216 228 238 248 256 266 274 282 290 298 304 312 317 323 323 323 323 323 323 323 234 TIPSY 0 0 15 103 218 330 447 550 644 734 811 878 936 988 1,037 1,081 1,120 1,155 1,185 1,210 1,232 1,254 1,274 1,294 1,312 1,327 1,340 1,354 1,365 1,376 1,376 1,376 1,376 1,376 1,376 1,376 235 TIPSY 0 0 6 62 154 244 332 421 500 571 638 699 754 801 843 879 913 944 972 998 1,022 1,044 1,064 1,081 1,097 1,112 1,125 1,137 1,148 1,158 1,158 1,158 1,158 1,158 1,158 1,158 236 TIPSY 0 0 0 5 26 57 96 134 169 202 232 259 284 308 330 352 372 390 407 422 436 449 462 474 485 495 505 514 522 530 530 530 530 530 530 530 238 TIPSY 0 0 5 47 116 186 264 339 401 463 518 568 612 652 688 722 752 780 805 828 848 865 881 897 912 926 939 951 962 972 972 972 972 972 972 972 241 TIPSY 0 0 3 44 119 200 271 344 415 480 536 587 638 682 722 758 788 815 839 861 883 902 921 939 955 970 984 997 1,010 1,020 1,020 1,020 1,020 1,020 1,020 1,020 242 TIPSY 0 0 0 12 43 88 137 182 225 263 299 334 366 397 426 451 475 496 515 533 549 565 580 594 607 619 630 641 650 658 658 658 658 658 658 658 243 TIPSY 0 0 0 2 11 30 54 81 107 133 157 179 199 218 235 251 265 279 292 304 315 326 336 346 355 363 372 379 386 392 392 392 392 392 392 392 244 TIPSY 0 0 28 140 274 409 541 659 764 859 942 1,014 1,078 1,133 1,185 1,229 1,268 1,304 1,335 1,362 1,385 1,408 1,429 1,449 1,463 1,475 1,486 1,496 1,505 1,513 1,513 1,513 1,513 1,513 1,513 1,513 245 TIPSY 0 0 6 59 147 235 321 406 482 553 618 677 729 776 817 854 887 918 945 971 994 1,014 1,033 1,051 1,066 1,081 1,094 1,106 1,118 1,127 1,127 1,127 1,127 1,127 1,127 1,127 246 TIPSY 0 0 0 8 34 71 113 154 192 228 261 292 320 347 371 394 416 435 453 470 485 499 513 525 537 548 558 567 576 584 584 584 584 584 584 584
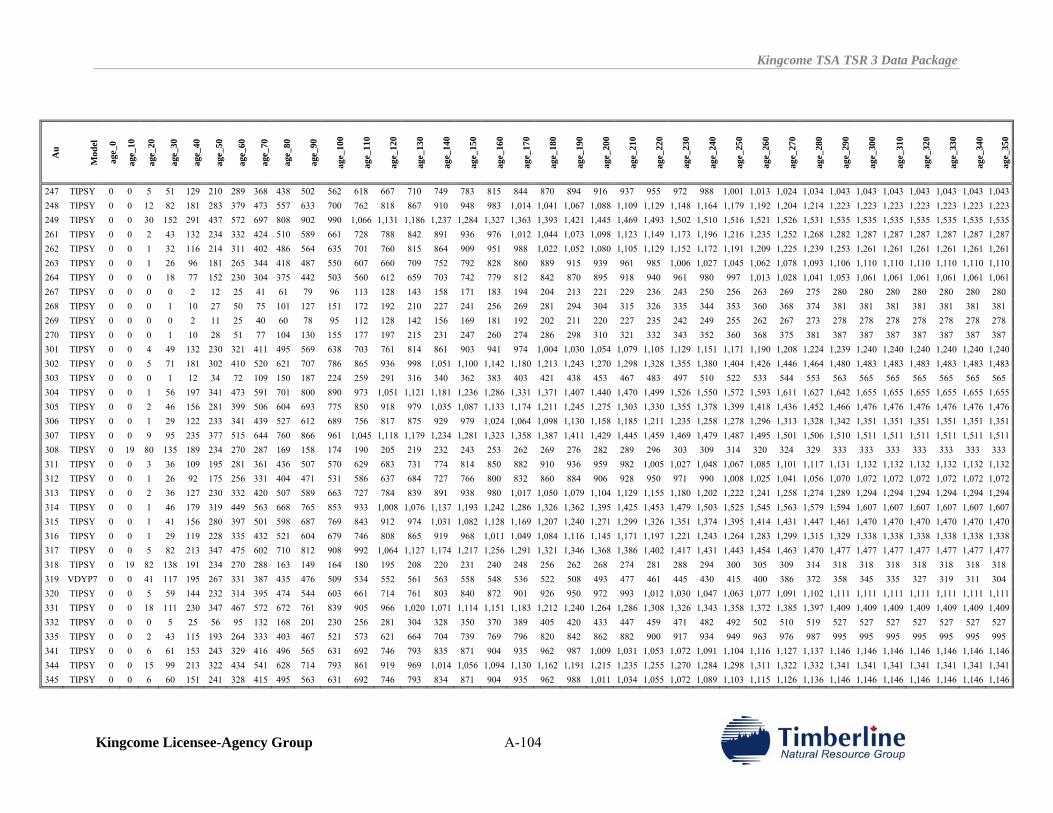
Kingcome TSA TSR 3 Data Package
Kingcome Licensee-Agency Group A-104
Au
Mod
el
age_
0
age_
10
age_
20
age_
30
age_
40
age_
50
age_
60
age_
70
age_
80
age_
90
age_
100
age_
110
age_
120
age_
130
age_
140
age_
150
age_
160
age_
170
age_
180
age_
190
age_
200
age_
210
age_
220
age_
230
age_
240
age_
250
age_
260
age_
270
age_
280
age_
290
age_
300
age_
310
age_
320
age_
330
age_
340
age_
350
247 TIPSY 0 0 5 51 129 210 289 368 438 502 562 618 667 710 749 783 815 844 870 894 916 937 955 972 988 1,001 1,013 1,024 1,034 1,043 1,043 1,043 1,043 1,043 1,043 1,043 248 TIPSY 0 0 12 82 181 283 379 473 557 633 700 762 818 867 910 948 983 1,014 1,041 1,067 1,088 1,109 1,129 1,148 1,164 1,179 1,192 1,204 1,214 1,223 1,223 1,223 1,223 1,223 1,223 1,223 249 TIPSY 0 0 30 152 291 437 572 697 808 902 990 1,066 1,131 1,186 1,237 1,284 1,327 1,363 1,393 1,421 1,445 1,469 1,493 1,502 1,510 1,516 1,521 1,526 1,531 1,535 1,535 1,535 1,535 1,535 1,535 1,535 261 TIPSY 0 0 2 43 132 234 332 424 510 589 661 728 788 842 891 936 976 1,012 1,044 1,073 1,098 1,123 1,149 1,173 1,196 1,216 1,235 1,252 1,268 1,282 1,287 1,287 1,287 1,287 1,287 1,287 262 TIPSY 0 0 1 32 116 214 311 402 486 564 635 701 760 815 864 909 951 988 1,022 1,052 1,080 1,105 1,129 1,152 1,172 1,191 1,209 1,225 1,239 1,253 1,261 1,261 1,261 1,261 1,261 1,261 263 TIPSY 0 0 1 26 96 181 265 344 418 487 550 607 660 709 752 792 828 860 889 915 939 961 985 1,006 1,027 1,045 1,062 1,078 1,093 1,106 1,110 1,110 1,110 1,110 1,110 1,110 264 TIPSY 0 0 0 18 77 152 230 304 375 442 503 560 612 659 703 742 779 812 842 870 895 918 940 961 980 997 1,013 1,028 1,041 1,053 1,061 1,061 1,061 1,061 1,061 1,061 267 TIPSY 0 0 0 0 2 12 25 41 61 79 96 113 128 143 158 171 183 194 204 213 221 229 236 243 250 256 263 269 275 280 280 280 280 280 280 280 268 TIPSY 0 0 0 1 10 27 50 75 101 127 151 172 192 210 227 241 256 269 281 294 304 315 326 335 344 353 360 368 374 381 381 381 381 381 381 381 269 TIPSY 0 0 0 0 2 11 25 40 60 78 95 112 128 142 156 169 181 192 202 211 220 227 235 242 249 255 262 267 273 278 278 278 278 278 278 278 270 TIPSY 0 0 0 1 10 28 51 77 104 130 155 177 197 215 231 247 260 274 286 298 310 321 332 343 352 360 368 375 381 387 387 387 387 387 387 387 301 TIPSY 0 0 4 49 132 230 321 411 495 569 638 703 761 814 861 903 941 974 1,004 1,030 1,054 1,079 1,105 1,129 1,151 1,171 1,190 1,208 1,224 1,239 1,240 1,240 1,240 1,240 1,240 1,240 302 TIPSY 0 0 5 71 181 302 410 520 621 707 786 865 936 998 1,051 1,100 1,142 1,180 1,213 1,243 1,270 1,298 1,328 1,355 1,380 1,404 1,426 1,446 1,464 1,480 1,483 1,483 1,483 1,483 1,483 1,483 303 TIPSY 0 0 0 1 12 34 72 109 150 187 224 259 291 316 340 362 383 403 421 438 453 467 483 497 510 522 533 544 553 563 565 565 565 565 565 565 304 TIPSY 0 0 1 56 197 341 473 591 701 800 890 973 1,051 1,121 1,181 1,236 1,286 1,331 1,371 1,407 1,440 1,470 1,499 1,526 1,550 1,572 1,593 1,611 1,627 1,642 1,655 1,655 1,655 1,655 1,655 1,655 305 TIPSY 0 0 2 46 156 281 399 506 604 693 775 850 918 979 1,035 1,087 1,133 1,174 1,211 1,245 1,275 1,303 1,330 1,355 1,378 1,399 1,418 1,436 1,452 1,466 1,476 1,476 1,476 1,476 1,476 1,476 306 TIPSY 0 0 1 29 122 233 341 439 527 612 689 756 817 875 929 979 1,024 1,064 1,098 1,130 1,158 1,185 1,211 1,235 1,258 1,278 1,296 1,313 1,328 1,342 1,351 1,351 1,351 1,351 1,351 1,351 307 TIPSY 0 0 9 95 235 377 515 644 760 866 961 1,045 1,118 1,179 1,234 1,281 1,323 1,358 1,387 1,411 1,429 1,445 1,459 1,469 1,479 1,487 1,495 1,501 1,506 1,510 1,511 1,511 1,511 1,511 1,511 1,511 308 TIPSY 0 19 80 135 189 234 270 287 169 158 174 190 205 219 232 243 253 262 269 276 282 289 296 303 309 314 320 324 329 333 333 333 333 333 333 333 311 TIPSY 0 0 3 36 109 195 281 361 436 507 570 629 683 731 774 814 850 882 910 936 959 982 1,005 1,027 1,048 1,067 1,085 1,101 1,117 1,131 1,132 1,132 1,132 1,132 1,132 1,132 312 TIPSY 0 0 1 26 92 175 256 331 404 471 531 586 637 684 727 766 800 832 860 884 906 928 950 971 990 1,008 1,025 1,041 1,056 1,070 1,072 1,072 1,072 1,072 1,072 1,072 313 TIPSY 0 0 2 36 127 230 332 420 507 589 663 727 784 839 891 938 980 1,017 1,050 1,079 1,104 1,129 1,155 1,180 1,202 1,222 1,241 1,258 1,274 1,289 1,294 1,294 1,294 1,294 1,294 1,294 314 TIPSY 0 0 1 46 179 319 449 563 668 765 853 933 1,008 1,076 1,137 1,193 1,242 1,286 1,326 1,362 1,395 1,425 1,453 1,479 1,503 1,525 1,545 1,563 1,579 1,594 1,607 1,607 1,607 1,607 1,607 1,607 315 TIPSY 0 0 1 41 156 280 397 501 598 687 769 843 912 974 1,031 1,082 1,128 1,169 1,207 1,240 1,271 1,299 1,326 1,351 1,374 1,395 1,414 1,431 1,447 1,461 1,470 1,470 1,470 1,470 1,470 1,470 316 TIPSY 0 0 1 29 119 228 335 432 521 604 679 746 808 865 919 968 1,011 1,049 1,084 1,116 1,145 1,171 1,197 1,221 1,243 1,264 1,283 1,299 1,315 1,329 1,338 1,338 1,338 1,338 1,338 1,338 317 TIPSY 0 0 5 82 213 347 475 602 710 812 908 992 1,064 1,127 1,174 1,217 1,256 1,291 1,321 1,346 1,368 1,386 1,402 1,417 1,431 1,443 1,454 1,463 1,470 1,477 1,477 1,477 1,477 1,477 1,477 1,477 318 TIPSY 0 19 82 138 191 234 270 288 163 149 164 180 195 208 220 231 240 248 256 262 268 274 281 288 294 300 305 309 314 318 318 318 318 318 318 318 319 VDYP7 0 0 41 117 195 267 331 387 435 476 509 534 552 561 563 558 548 536 522 508 493 477 461 445 430 415 400 386 372 358 345 335 327 319 311 304 320 TIPSY 0 0 5 59 144 232 314 395 474 544 603 661 714 761 803 840 872 901 926 950 972 993 1,012 1,030 1,047 1,063 1,077 1,091 1,102 1,111 1,111 1,111 1,111 1,111 1,111 1,111 331 TIPSY 0 0 18 111 230 347 467 572 672 761 839 905 966 1,020 1,071 1,114 1,151 1,183 1,212 1,240 1,264 1,286 1,308 1,326 1,343 1,358 1,372 1,385 1,397 1,409 1,409 1,409 1,409 1,409 1,409 1,409 332 TIPSY 0 0 0 5 25 56 95 132 168 201 230 256 281 304 328 350 370 389 405 420 433 447 459 471 482 492 502 510 519 527 527 527 527 527 527 527 335 TIPSY 0 0 2 43 115 193 264 333 403 467 521 573 621 664 704 739 769 796 820 842 862 882 900 917 934 949 963 976 987 995 995 995 995 995 995 995 341 TIPSY 0 0 6 61 153 243 329 416 496 565 631 692 746 793 835 871 904 935 962 987 1,009 1,031 1,053 1,072 1,091 1,104 1,116 1,127 1,137 1,146 1,146 1,146 1,146 1,146 1,146 1,146 344 TIPSY 0 0 15 99 213 322 434 541 628 714 793 861 919 969 1,014 1,056 1,094 1,130 1,162 1,191 1,215 1,235 1,255 1,270 1,284 1,298 1,311 1,322 1,332 1,341 1,341 1,341 1,341 1,341 1,341 1,341 345 TIPSY 0 0 6 60 151 241 328 415 495 563 631 692 746 793 834 871 904 935 962 988 1,011 1,034 1,055 1,072 1,089 1,103 1,115 1,126 1,136 1,146 1,146 1,146 1,146 1,146 1,146 1,146
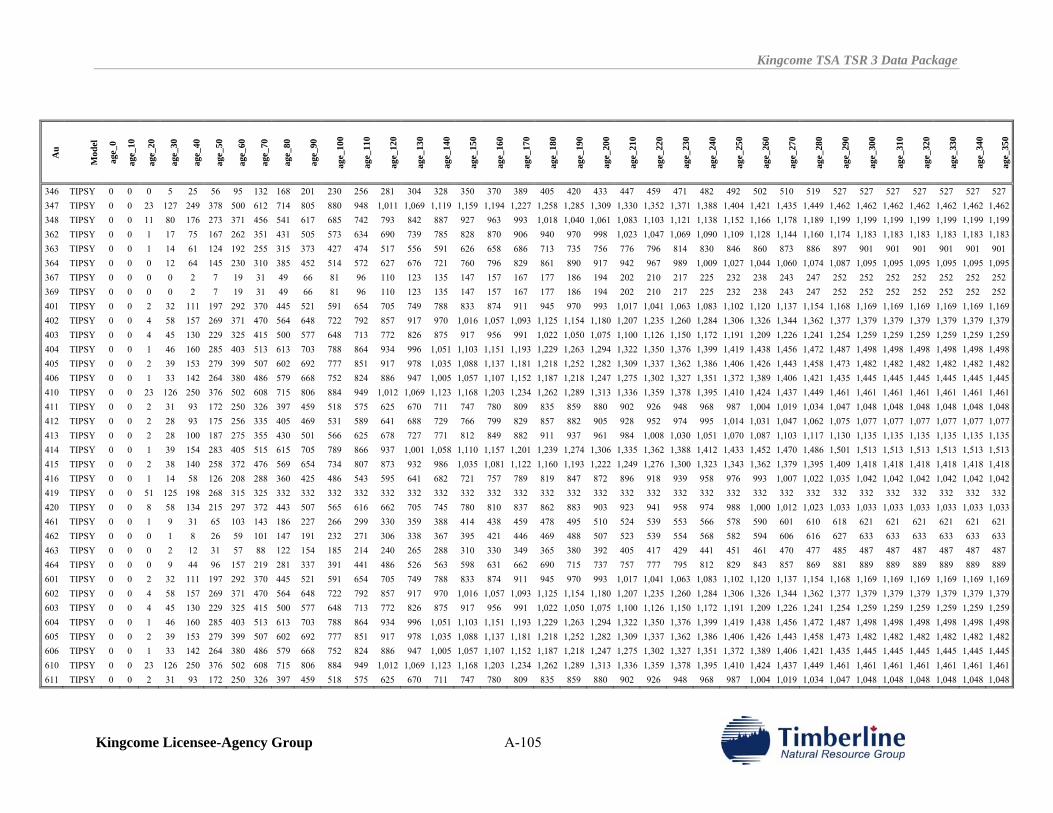
Kingcome TSA TSR 3 Data Package
Kingcome Licensee-Agency Group A-105
Au
Mod
el
age_
0
age_
10
age_
20
age_
30
age_
40
age_
50
age_
60
age_
70
age_
80
age_
90
age_
100
age_
110
age_
120
age_
130
age_
140
age_
150
age_
160
age_
170
age_
180
age_
190
age_
200
age_
210
age_
220
age_
230
age_
240
age_
250
age_
260
age_
270
age_
280
age_
290
age_
300
age_
310
age_
320
age_
330
age_
340
age_
350
346 TIPSY 0 0 0 5 25 56 95 132 168 201 230 256 281 304 328 350 370 389 405 420 433 447 459 471 482 492 502 510 519 527 527 527 527 527 527 527 347 TIPSY 0 0 23 127 249 378 500 612 714 805 880 948 1,011 1,069 1,119 1,159 1,194 1,227 1,258 1,285 1,309 1,330 1,352 1,371 1,388 1,404 1,421 1,435 1,449 1,462 1,462 1,462 1,462 1,462 1,462 1,462 348 TIPSY 0 0 11 80 176 273 371 456 541 617 685 742 793 842 887 927 963 993 1,018 1,040 1,061 1,083 1,103 1,121 1,138 1,152 1,166 1,178 1,189 1,199 1,199 1,199 1,199 1,199 1,199 1,199 362 TIPSY 0 0 1 17 75 167 262 351 431 505 573 634 690 739 785 828 870 906 940 970 998 1,023 1,047 1,069 1,090 1,109 1,128 1,144 1,160 1,174 1,183 1,183 1,183 1,183 1,183 1,183 363 TIPSY 0 0 1 14 61 124 192 255 315 373 427 474 517 556 591 626 658 686 713 735 756 776 796 814 830 846 860 873 886 897 901 901 901 901 901 901 364 TIPSY 0 0 0 12 64 145 230 310 385 452 514 572 627 676 721 760 796 829 861 890 917 942 967 989 1,009 1,027 1,044 1,060 1,074 1,087 1,095 1,095 1,095 1,095 1,095 1,095 367 TIPSY 0 0 0 0 2 7 19 31 49 66 81 96 110 123 135 147 157 167 177 186 194 202 210 217 225 232 238 243 247 252 252 252 252 252 252 252 369 TIPSY 0 0 0 0 2 7 19 31 49 66 81 96 110 123 135 147 157 167 177 186 194 202 210 217 225 232 238 243 247 252 252 252 252 252 252 252 401 TIPSY 0 0 2 32 111 197 292 370 445 521 591 654 705 749 788 833 874 911 945 970 993 1,017 1,041 1,063 1,083 1,102 1,120 1,137 1,154 1,168 1,169 1,169 1,169 1,169 1,169 1,169 402 TIPSY 0 0 4 58 157 269 371 470 564 648 722 792 857 917 970 1,016 1,057 1,093 1,125 1,154 1,180 1,207 1,235 1,260 1,284 1,306 1,326 1,344 1,362 1,377 1,379 1,379 1,379 1,379 1,379 1,379 403 TIPSY 0 0 4 45 130 229 325 415 500 577 648 713 772 826 875 917 956 991 1,022 1,050 1,075 1,100 1,126 1,150 1,172 1,191 1,209 1,226 1,241 1,254 1,259 1,259 1,259 1,259 1,259 1,259 404 TIPSY 0 0 1 46 160 285 403 513 613 703 788 864 934 996 1,051 1,103 1,151 1,193 1,229 1,263 1,294 1,322 1,350 1,376 1,399 1,419 1,438 1,456 1,472 1,487 1,498 1,498 1,498 1,498 1,498 1,498 405 TIPSY 0 0 2 39 153 279 399 507 602 692 777 851 917 978 1,035 1,088 1,137 1,181 1,218 1,252 1,282 1,309 1,337 1,362 1,386 1,406 1,426 1,443 1,458 1,473 1,482 1,482 1,482 1,482 1,482 1,482 406 TIPSY 0 0 1 33 142 264 380 486 579 668 752 824 886 947 1,005 1,057 1,107 1,152 1,187 1,218 1,247 1,275 1,302 1,327 1,351 1,372 1,389 1,406 1,421 1,435 1,445 1,445 1,445 1,445 1,445 1,445 410 TIPSY 0 0 23 126 250 376 502 608 715 806 884 949 1,012 1,069 1,123 1,168 1,203 1,234 1,262 1,289 1,313 1,336 1,359 1,378 1,395 1,410 1,424 1,437 1,449 1,461 1,461 1,461 1,461 1,461 1,461 1,461 411 TIPSY 0 0 2 31 93 172 250 326 397 459 518 575 625 670 711 747 780 809 835 859 880 902 926 948 968 987 1,004 1,019 1,034 1,047 1,048 1,048 1,048 1,048 1,048 1,048 412 TIPSY 0 0 2 28 93 175 256 335 405 469 531 589 641 688 729 766 799 829 857 882 905 928 952 974 995 1,014 1,031 1,047 1,062 1,075 1,077 1,077 1,077 1,077 1,077 1,077 413 TIPSY 0 0 2 28 100 187 275 355 430 501 566 625 678 727 771 812 849 882 911 937 961 984 1,008 1,030 1,051 1,070 1,087 1,103 1,117 1,130 1,135 1,135 1,135 1,135 1,135 1,135 414 TIPSY 0 0 1 39 154 283 405 515 615 705 789 866 937 1,001 1,058 1,110 1,157 1,201 1,239 1,274 1,306 1,335 1,362 1,388 1,412 1,433 1,452 1,470 1,486 1,501 1,513 1,513 1,513 1,513 1,513 1,513 415 TIPSY 0 0 2 38 140 258 372 476 569 654 734 807 873 932 986 1,035 1,081 1,122 1,160 1,193 1,222 1,249 1,276 1,300 1,323 1,343 1,362 1,379 1,395 1,409 1,418 1,418 1,418 1,418 1,418 1,418 416 TIPSY 0 0 1 14 58 126 208 288 360 425 486 543 595 641 682 721 757 789 819 847 872 896 918 939 958 976 993 1,007 1,022 1,035 1,042 1,042 1,042 1,042 1,042 1,042 419 TIPSY 0 0 51 125 198 268 315 325 332 332 332 332 332 332 332 332 332 332 332 332 332 332 332 332 332 332 332 332 332 332 332 332 332 332 332 332 420 TIPSY 0 0 8 58 134 215 297 372 443 507 565 616 662 705 745 780 810 837 862 883 903 923 941 958 974 988 1,000 1,012 1,023 1,033 1,033 1,033 1,033 1,033 1,033 1,033 461 TIPSY 0 0 1 9 31 65 103 143 186 227 266 299 330 359 388 414 438 459 478 495 510 524 539 553 566 578 590 601 610 618 621 621 621 621 621 621 462 TIPSY 0 0 0 1 8 26 59 101 147 191 232 271 306 338 367 395 421 446 469 488 507 523 539 554 568 582 594 606 616 627 633 633 633 633 633 633 463 TIPSY 0 0 0 2 12 31 57 88 122 154 185 214 240 265 288 310 330 349 365 380 392 405 417 429 441 451 461 470 477 485 487 487 487 487 487 487 464 TIPSY 0 0 0 9 44 96 157 219 281 337 391 441 486 526 563 598 631 662 690 715 737 757 777 795 812 829 843 857 869 881 889 889 889 889 889 889 601 TIPSY 0 0 2 32 111 197 292 370 445 521 591 654 705 749 788 833 874 911 945 970 993 1,017 1,041 1,063 1,083 1,102 1,120 1,137 1,154 1,168 1,169 1,169 1,169 1,169 1,169 1,169 602 TIPSY 0 0 4 58 157 269 371 470 564 648 722 792 857 917 970 1,016 1,057 1,093 1,125 1,154 1,180 1,207 1,235 1,260 1,284 1,306 1,326 1,344 1,362 1,377 1,379 1,379 1,379 1,379 1,379 1,379 603 TIPSY 0 0 4 45 130 229 325 415 500 577 648 713 772 826 875 917 956 991 1,022 1,050 1,075 1,100 1,126 1,150 1,172 1,191 1,209 1,226 1,241 1,254 1,259 1,259 1,259 1,259 1,259 1,259 604 TIPSY 0 0 1 46 160 285 403 513 613 703 788 864 934 996 1,051 1,103 1,151 1,193 1,229 1,263 1,294 1,322 1,350 1,376 1,399 1,419 1,438 1,456 1,472 1,487 1,498 1,498 1,498 1,498 1,498 1,498 605 TIPSY 0 0 2 39 153 279 399 507 602 692 777 851 917 978 1,035 1,088 1,137 1,181 1,218 1,252 1,282 1,309 1,337 1,362 1,386 1,406 1,426 1,443 1,458 1,473 1,482 1,482 1,482 1,482 1,482 1,482 606 TIPSY 0 0 1 33 142 264 380 486 579 668 752 824 886 947 1,005 1,057 1,107 1,152 1,187 1,218 1,247 1,275 1,302 1,327 1,351 1,372 1,389 1,406 1,421 1,435 1,445 1,445 1,445 1,445 1,445 1,445 610 TIPSY 0 0 23 126 250 376 502 608 715 806 884 949 1,012 1,069 1,123 1,168 1,203 1,234 1,262 1,289 1,313 1,336 1,359 1,378 1,395 1,410 1,424 1,437 1,449 1,461 1,461 1,461 1,461 1,461 1,461 1,461 611 TIPSY 0 0 2 31 93 172 250 326 397 459 518 575 625 670 711 747 780 809 835 859 880 902 926 948 968 987 1,004 1,019 1,034 1,047 1,048 1,048 1,048 1,048 1,048 1,048
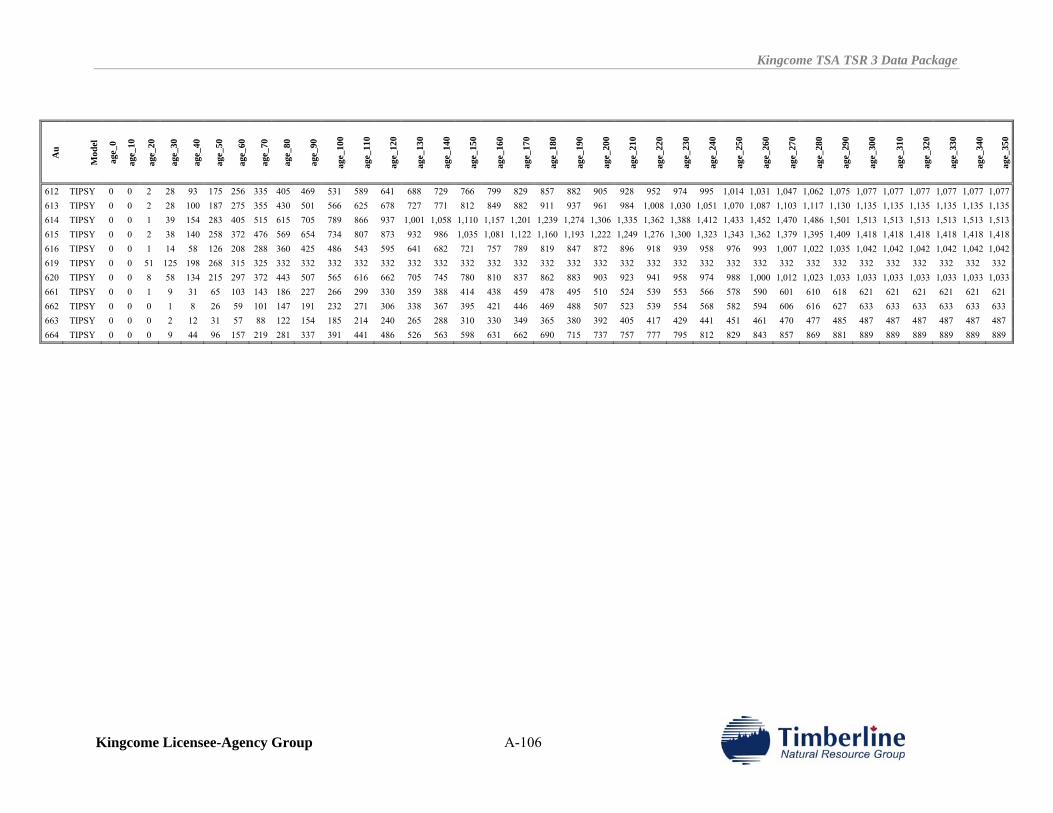
Kingcome TSA TSR 3 Data Package
Kingcome Licensee-Agency Group A-106
Au
Mod
el
age_
0
age_
10
age_
20
age_
30
age_
40
age_
50
age_
60
age_
70
age_
80
age_
90
age_
100
age_
110
age_
120
age_
130
age_
140
age_
150
age_
160
age_
170
age_
180
age_
190
age_
200
age_
210
age_
220
age_
230
age_
240
age_
250
age_
260
age_
270
age_
280
age_
290
age_
300
age_
310
age_
320
age_
330
age_
340
age_
350
612 TIPSY 0 0 2 28 93 175 256 335 405 469 531 589 641 688 729 766 799 829 857 882 905 928 952 974 995 1,014 1,031 1,047 1,062 1,075 1,077 1,077 1,077 1,077 1,077 1,077 613 TIPSY 0 0 2 28 100 187 275 355 430 501 566 625 678 727 771 812 849 882 911 937 961 984 1,008 1,030 1,051 1,070 1,087 1,103 1,117 1,130 1,135 1,135 1,135 1,135 1,135 1,135 614 TIPSY 0 0 1 39 154 283 405 515 615 705 789 866 937 1,001 1,058 1,110 1,157 1,201 1,239 1,274 1,306 1,335 1,362 1,388 1,412 1,433 1,452 1,470 1,486 1,501 1,513 1,513 1,513 1,513 1,513 1,513 615 TIPSY 0 0 2 38 140 258 372 476 569 654 734 807 873 932 986 1,035 1,081 1,122 1,160 1,193 1,222 1,249 1,276 1,300 1,323 1,343 1,362 1,379 1,395 1,409 1,418 1,418 1,418 1,418 1,418 1,418 616 TIPSY 0 0 1 14 58 126 208 288 360 425 486 543 595 641 682 721 757 789 819 847 872 896 918 939 958 976 993 1,007 1,022 1,035 1,042 1,042 1,042 1,042 1,042 1,042 619 TIPSY 0 0 51 125 198 268 315 325 332 332 332 332 332 332 332 332 332 332 332 332 332 332 332 332 332 332 332 332 332 332 332 332 332 332 332 332 620 TIPSY 0 0 8 58 134 215 297 372 443 507 565 616 662 705 745 780 810 837 862 883 903 923 941 958 974 988 1,000 1,012 1,023 1,033 1,033 1,033 1,033 1,033 1,033 1,033 661 TIPSY 0 0 1 9 31 65 103 143 186 227 266 299 330 359 388 414 438 459 478 495 510 524 539 553 566 578 590 601 610 618 621 621 621 621 621 621 662 TIPSY 0 0 0 1 8 26 59 101 147 191 232 271 306 338 367 395 421 446 469 488 507 523 539 554 568 582 594 606 616 627 633 633 633 633 633 633 663 TIPSY 0 0 0 2 12 31 57 88 122 154 185 214 240 265 288 310 330 349 365 380 392 405 417 429 441 451 461 470 477 485 487 487 487 487 487 487 664 TIPSY 0 0 0 9 44 96 157 219 281 337 391 441 486 526 563 598 631 662 690 715 737 757 777 795 812 829 843 857 869 881 889 889 889 889 889 889

Kingcome TSA TSR 3 Data Package
Kingcome Licensee-Agency Group A-107
APPENDIX II EBM YIELD TABLES

Kingcome TSA TSR 3 Data Package
Kingcome Licensee-Agency Group A-108
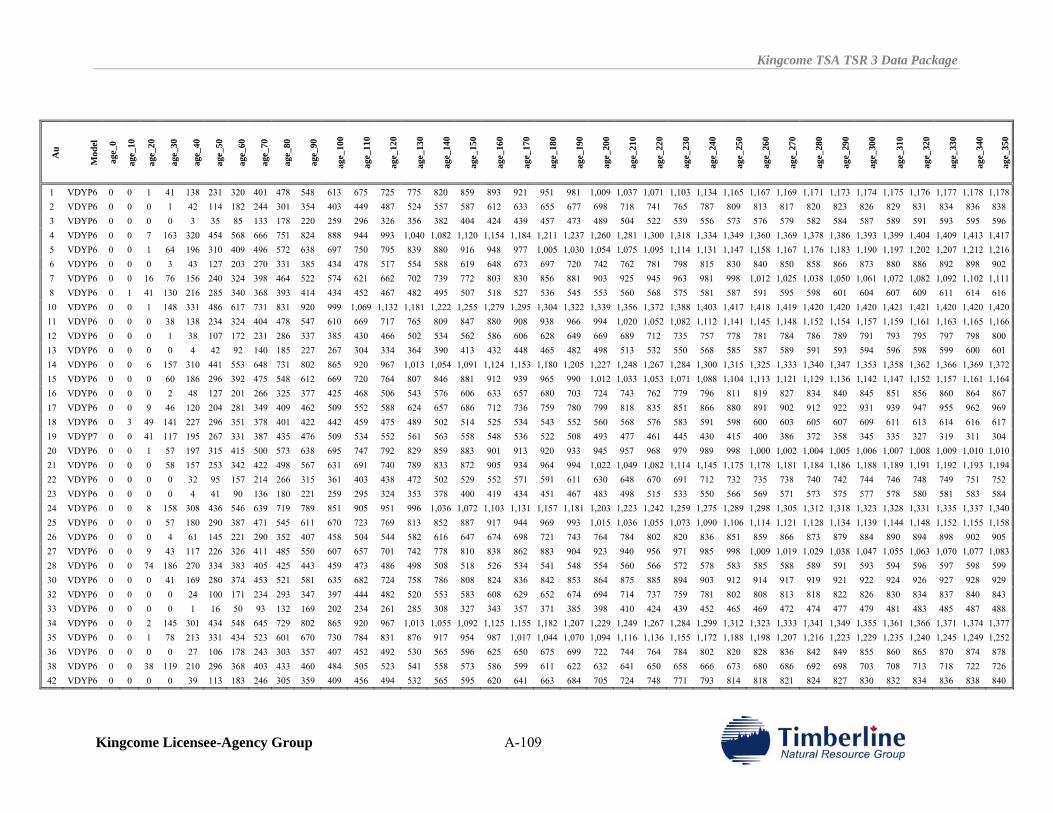
Kingcome TSA TSR 3 Data Package
Kingcome Licensee-Agency Group A-109
Au
Mod
el
age_
0
age_
10
age_
20
age_
30
age_
40
age_
50
age_
60
age_
70
age_
80
age_
90
age_
100
age_
110
age_
120
age_
130
age_
140
age_
150
age_
160
age_
170
age_
180
age_
190
age_
200
age_
210
age_
220
age_
230
age_
240
age_
250
age_
260
age_
270
age_
280
age_
290
age_
300
age_
310
age_
320
age_
330
age_
340
age_
350
1 VDYP6 0 0 1 41 138 231 320 401 478 548 613 675 725 775 820 859 893 921 951 981 1,009 1,037 1,071 1,103 1,134 1,165 1,167 1,169 1,171 1,173 1,174 1,175 1,176 1,177 1,178 1,178 2 VDYP6 0 0 0 1 42 114 182 244 301 354 403 449 487 524 557 587 612 633 655 677 698 718 741 765 787 809 813 817 820 823 826 829 831 834 836 838 3 VDYP6 0 0 0 0 3 35 85 133 178 220 259 296 326 356 382 404 424 439 457 473 489 504 522 539 556 573 576 579 582 584 587 589 591 593 595 596 4 VDYP6 0 0 7 163 320 454 568 666 751 824 888 944 993 1,040 1,082 1,120 1,154 1,184 1,211 1,237 1,260 1,281 1,300 1,318 1,334 1,349 1,360 1,369 1,378 1,386 1,393 1,399 1,404 1,409 1,413 1,417 5 VDYP6 0 0 1 64 196 310 409 496 572 638 697 750 795 839 880 916 948 977 1,005 1,030 1,054 1,075 1,095 1,114 1,131 1,147 1,158 1,167 1,176 1,183 1,190 1,197 1,202 1,207 1,212 1,216 6 VDYP6 0 0 0 3 43 127 203 270 331 385 434 478 517 554 588 619 648 673 697 720 742 762 781 798 815 830 840 850 858 866 873 880 886 892 898 902 7 VDYP6 0 0 16 76 156 240 324 398 464 522 574 621 662 702 739 772 803 830 856 881 903 925 945 963 981 998 1,012 1,025 1,038 1,050 1,061 1,072 1,082 1,092 1,102 1,111 8 VDYP6 0 1 41 130 216 285 340 368 393 414 434 452 467 482 495 507 518 527 536 545 553 560 568 575 581 587 591 595 598 601 604 607 609 611 614 616 10 VDYP6 0 0 1 148 331 486 617 731 831 920 999 1,069 1,132 1,181 1,222 1,255 1,279 1,295 1,304 1,322 1,339 1,356 1,372 1,388 1,403 1,417 1,418 1,419 1,420 1,420 1,420 1,421 1,421 1,420 1,420 1,420 11 VDYP6 0 0 0 38 138 234 324 404 478 547 610 669 717 765 809 847 880 908 938 966 994 1,020 1,052 1,082 1,112 1,141 1,145 1,148 1,152 1,154 1,157 1,159 1,161 1,163 1,165 1,166 12 VDYP6 0 0 0 1 38 107 172 231 286 337 385 430 466 502 534 562 586 606 628 649 669 689 712 735 757 778 781 784 786 789 791 793 795 797 798 800 13 VDYP6 0 0 0 0 4 42 92 140 185 227 267 304 334 364 390 413 432 448 465 482 498 513 532 550 568 585 587 589 591 593 594 596 598 599 600 601 14 VDYP6 0 0 6 157 310 441 553 648 731 802 865 920 967 1,013 1,054 1,091 1,124 1,153 1,180 1,205 1,227 1,248 1,267 1,284 1,300 1,315 1,325 1,333 1,340 1,347 1,353 1,358 1,362 1,366 1,369 1,372 15 VDYP6 0 0 0 60 186 296 392 475 548 612 669 720 764 807 846 881 912 939 965 990 1,012 1,033 1,053 1,071 1,088 1,104 1,113 1,121 1,129 1,136 1,142 1,147 1,152 1,157 1,161 1,164 16 VDYP6 0 0 0 2 48 127 201 266 325 377 425 468 506 543 576 606 633 657 680 703 724 743 762 779 796 811 819 827 834 840 845 851 856 860 864 867 17 VDYP6 0 0 9 46 120 204 281 349 409 462 509 552 588 624 657 686 712 736 759 780 799 818 835 851 866 880 891 902 912 922 931 939 947 955 962 969 18 VDYP6 0 3 49 141 227 296 351 378 401 422 442 459 475 489 502 514 525 534 543 552 560 568 576 583 591 598 600 603 605 607 609 611 613 614 616 617 19 VDYP7 0 0 41 117 195 267 331 387 435 476 509 534 552 561 563 558 548 536 522 508 493 477 461 445 430 415 400 386 372 358 345 335 327 319 311 304 20 VDYP6 0 0 1 57 197 315 415 500 573 638 695 747 792 829 859 883 901 913 920 933 945 957 968 979 989 998 1,000 1,002 1,004 1,005 1,006 1,007 1,008 1,009 1,010 1,010 21 VDYP6 0 0 0 58 157 253 342 422 498 567 631 691 740 789 833 872 905 934 964 994 1,022 1,049 1,082 1,114 1,145 1,175 1,178 1,181 1,184 1,186 1,188 1,189 1,191 1,192 1,193 1,194 22 VDYP6 0 0 0 0 32 95 157 214 266 315 361 403 438 472 502 529 552 571 591 611 630 648 670 691 712 732 735 738 740 742 744 746 748 749 751 752 23 VDYP6 0 0 0 0 4 41 90 136 180 221 259 295 324 353 378 400 419 434 451 467 483 498 515 533 550 566 569 571 573 575 577 578 580 581 583 584 24 VDYP6 0 0 8 158 308 436 546 639 719 789 851 905 951 996 1,036 1,072 1,103 1,131 1,157 1,181 1,203 1,223 1,242 1,259 1,275 1,289 1,298 1,305 1,312 1,318 1,323 1,328 1,331 1,335 1,337 1,340 25 VDYP6 0 0 0 57 180 290 387 471 545 611 670 723 769 813 852 887 917 944 969 993 1,015 1,036 1,055 1,073 1,090 1,106 1,114 1,121 1,128 1,134 1,139 1,144 1,148 1,152 1,155 1,158 26 VDYP6 0 0 0 4 61 145 221 290 352 407 458 504 544 582 616 647 674 698 721 743 764 784 802 820 836 851 859 866 873 879 884 890 894 898 902 905 27 VDYP6 0 0 9 43 117 226 326 411 485 550 607 657 701 742 778 810 838 862 883 904 923 940 956 971 985 998 1,009 1,019 1,029 1,038 1,047 1,055 1,063 1,070 1,077 1,083 28 VDYP6 0 0 74 186 270 334 383 405 425 443 459 473 486 498 508 518 526 534 541 548 554 560 566 572 578 583 585 588 589 591 593 594 596 597 598 599 30 VDYP6 0 0 0 41 169 280 374 453 521 581 635 682 724 758 786 808 824 836 842 853 864 875 885 894 903 912 914 917 919 921 922 924 926 927 928 929 32 VDYP6 0 0 0 0 24 100 171 234 293 347 397 444 482 520 553 583 608 629 652 674 694 714 737 759 781 802 808 813 818 822 826 830 834 837 840 843 33 VDYP6 0 0 0 0 1 16 50 93 132 169 202 234 261 285 308 327 343 357 371 385 398 410 424 439 452 465 469 472 474 477 479 481 483 485 487 488 34 VDYP6 0 0 2 145 301 434 548 645 729 802 865 920 967 1,013 1,055 1,092 1,125 1,155 1,182 1,207 1,229 1,249 1,267 1,284 1,299 1,312 1,323 1,333 1,341 1,349 1,355 1,361 1,366 1,371 1,374 1,377 35 VDYP6 0 0 1 78 213 331 434 523 601 670 730 784 831 876 917 954 987 1,017 1,044 1,070 1,094 1,116 1,136 1,155 1,172 1,188 1,198 1,207 1,216 1,223 1,229 1,235 1,240 1,245 1,249 1,252 36 VDYP6 0 0 0 0 27 106 178 243 303 357 407 452 492 530 565 596 625 650 675 699 722 744 764 784 802 820 828 836 842 849 855 860 865 870 874 878 38 VDYP6 0 0 38 119 210 296 368 403 433 460 484 505 523 541 558 573 586 599 611 622 632 641 650 658 666 673 680 686 692 698 703 708 713 718 722 726 42 VDYP6 0 0 0 0 39 113 183 246 305 359 409 456 494 532 565 595 620 641 663 684 705 724 748 771 793 814 818 821 824 827 830 832 834 836 838 840
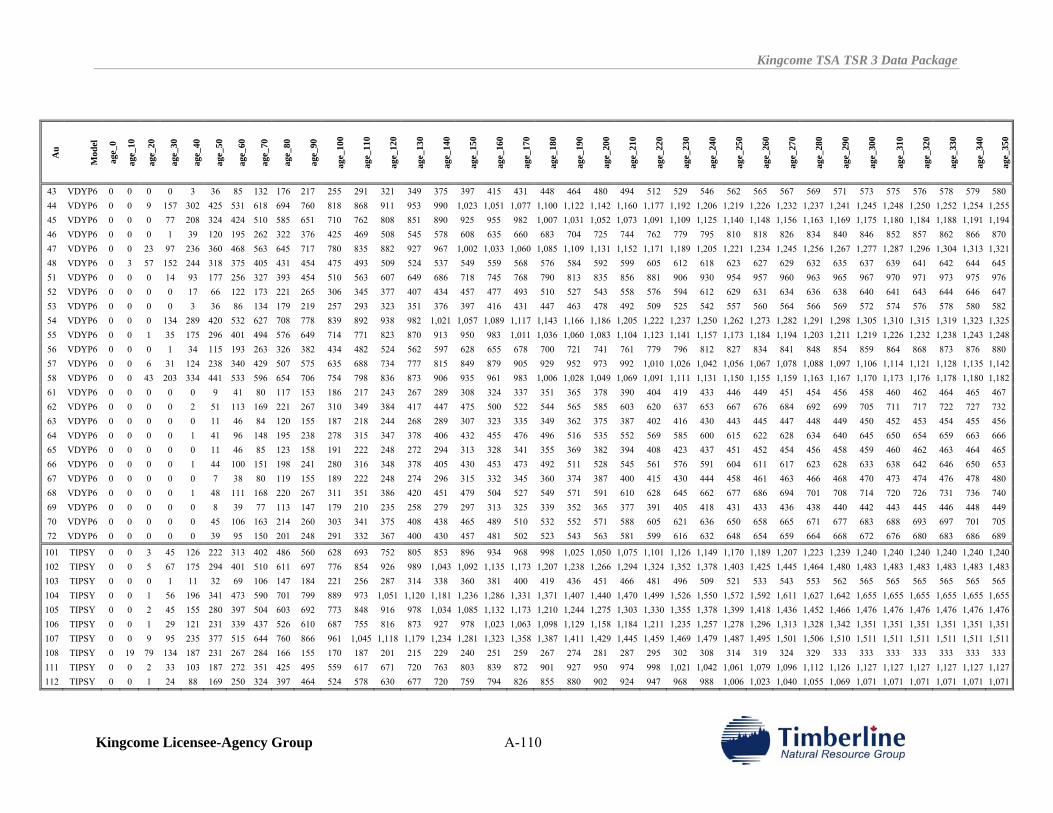
Kingcome TSA TSR 3 Data Package
Kingcome Licensee-Agency Group A-110
Au
Mod
el
age_
0
age_
10
age_
20
age_
30
age_
40
age_
50
age_
60
age_
70
age_
80
age_
90
age_
100
age_
110
age_
120
age_
130
age_
140
age_
150
age_
160
age_
170
age_
180
age_
190
age_
200
age_
210
age_
220
age_
230
age_
240
age_
250
age_
260
age_
270
age_
280
age_
290
age_
300
age_
310
age_
320
age_
330
age_
340
age_
350
43 VDYP6 0 0 0 0 3 36 85 132 176 217 255 291 321 349 375 397 415 431 448 464 480 494 512 529 546 562 565 567 569 571 573 575 576 578 579 580 44 VDYP6 0 0 9 157 302 425 531 618 694 760 818 868 911 953 990 1,023 1,051 1,077 1,100 1,122 1,142 1,160 1,177 1,192 1,206 1,219 1,226 1,232 1,237 1,241 1,245 1,248 1,250 1,252 1,254 1,255 45 VDYP6 0 0 0 77 208 324 424 510 585 651 710 762 808 851 890 925 955 982 1,007 1,031 1,052 1,073 1,091 1,109 1,125 1,140 1,148 1,156 1,163 1,169 1,175 1,180 1,184 1,188 1,191 1,194 46 VDYP6 0 0 0 1 39 120 195 262 322 376 425 469 508 545 578 608 635 660 683 704 725 744 762 779 795 810 818 826 834 840 846 852 857 862 866 870 47 VDYP6 0 0 23 97 236 360 468 563 645 717 780 835 882 927 967 1,002 1,033 1,060 1,085 1,109 1,131 1,152 1,171 1,189 1,205 1,221 1,234 1,245 1,256 1,267 1,277 1,287 1,296 1,304 1,313 1,321 48 VDYP6 0 3 57 152 244 318 375 405 431 454 475 493 509 524 537 549 559 568 576 584 592 599 605 612 618 623 627 629 632 635 637 639 641 642 644 645 51 VDYP6 0 0 0 14 93 177 256 327 393 454 510 563 607 649 686 718 745 768 790 813 835 856 881 906 930 954 957 960 963 965 967 970 971 973 975 976 52 VDYP6 0 0 0 0 17 66 122 173 221 265 306 345 377 407 434 457 477 493 510 527 543 558 576 594 612 629 631 634 636 638 640 641 643 644 646 647 53 VDYP6 0 0 0 0 3 36 86 134 179 219 257 293 323 351 376 397 416 431 447 463 478 492 509 525 542 557 560 564 566 569 572 574 576 578 580 582 54 VDYP6 0 0 0 134 289 420 532 627 708 778 839 892 938 982 1,021 1,057 1,089 1,117 1,143 1,166 1,186 1,205 1,222 1,237 1,250 1,262 1,273 1,282 1,291 1,298 1,305 1,310 1,315 1,319 1,323 1,325 55 VDYP6 0 0 1 35 175 296 401 494 576 649 714 771 823 870 913 950 983 1,011 1,036 1,060 1,083 1,104 1,123 1,141 1,157 1,173 1,184 1,194 1,203 1,211 1,219 1,226 1,232 1,238 1,243 1,248 56 VDYP6 0 0 0 1 34 115 193 263 326 382 434 482 524 562 597 628 655 678 700 721 741 761 779 796 812 827 834 841 848 854 859 864 868 873 876 880 57 VDYP6 0 0 6 31 124 238 340 429 507 575 635 688 734 777 815 849 879 905 929 952 973 992 1,010 1,026 1,042 1,056 1,067 1,078 1,088 1,097 1,106 1,114 1,121 1,128 1,135 1,142 58 VDYP6 0 0 43 203 334 441 533 596 654 706 754 798 836 873 906 935 961 983 1,006 1,028 1,049 1,069 1,091 1,111 1,131 1,150 1,155 1,159 1,163 1,167 1,170 1,173 1,176 1,178 1,180 1,182 61 VDYP6 0 0 0 0 0 9 41 80 117 153 186 217 243 267 289 308 324 337 351 365 378 390 404 419 433 446 449 451 454 456 458 460 462 464 465 467 62 VDYP6 0 0 0 0 2 51 113 169 221 267 310 349 384 417 447 475 500 522 544 565 585 603 620 637 653 667 676 684 692 699 705 711 717 722 727 732 63 VDYP6 0 0 0 0 0 11 46 84 120 155 187 218 244 268 289 307 323 335 349 362 375 387 402 416 430 443 445 447 448 449 450 452 453 454 455 456 64 VDYP6 0 0 0 0 1 41 96 148 195 238 278 315 347 378 406 432 455 476 496 516 535 552 569 585 600 615 622 628 634 640 645 650 654 659 663 666 65 VDYP6 0 0 0 0 0 11 46 85 123 158 191 222 248 272 294 313 328 341 355 369 382 394 408 423 437 451 452 454 456 458 459 460 462 463 464 465 66 VDYP6 0 0 0 0 1 44 100 151 198 241 280 316 348 378 405 430 453 473 492 511 528 545 561 576 591 604 611 617 623 628 633 638 642 646 650 653 67 VDYP6 0 0 0 0 0 7 38 80 119 155 189 222 248 274 296 315 332 345 360 374 387 400 415 430 444 458 461 463 466 468 470 473 474 476 478 480 68 VDYP6 0 0 0 0 1 48 111 168 220 267 311 351 386 420 451 479 504 527 549 571 591 610 628 645 662 677 686 694 701 708 714 720 726 731 736 740 69 VDYP6 0 0 0 0 0 8 39 77 113 147 179 210 235 258 279 297 313 325 339 352 365 377 391 405 418 431 433 436 438 440 442 443 445 446 448 449 70 VDYP6 0 0 0 0 0 45 106 163 214 260 303 341 375 408 438 465 489 510 532 552 571 588 605 621 636 650 658 665 671 677 683 688 693 697 701 705 72 VDYP6 0 0 0 0 0 39 95 150 201 248 291 332 367 400 430 457 481 502 523 543 563 581 599 616 632 648 654 659 664 668 672 676 680 683 686 689
101 TIPSY 0 0 3 45 126 222 313 402 486 560 628 693 752 805 853 896 934 968 998 1,025 1,050 1,075 1,101 1,126 1,149 1,170 1,189 1,207 1,223 1,239 1,240 1,240 1,240 1,240 1,240 1,240 102 TIPSY 0 0 5 67 175 294 401 510 611 697 776 854 926 989 1,043 1,092 1,135 1,173 1,207 1,238 1,266 1,294 1,324 1,352 1,378 1,403 1,425 1,445 1,464 1,480 1,483 1,483 1,483 1,483 1,483 1,483 103 TIPSY 0 0 0 1 11 32 69 106 147 184 221 256 287 314 338 360 381 400 419 436 451 466 481 496 509 521 533 543 553 562 565 565 565 565 565 565 104 TIPSY 0 0 1 56 196 341 473 590 701 799 889 973 1,051 1,120 1,181 1,236 1,286 1,331 1,371 1,407 1,440 1,470 1,499 1,526 1,550 1,572 1,592 1,611 1,627 1,642 1,655 1,655 1,655 1,655 1,655 1,655 105 TIPSY 0 0 2 45 155 280 397 504 603 692 773 848 916 978 1,034 1,085 1,132 1,173 1,210 1,244 1,275 1,303 1,330 1,355 1,378 1,399 1,418 1,436 1,452 1,466 1,476 1,476 1,476 1,476 1,476 1,476 106 TIPSY 0 0 1 29 121 231 339 437 526 610 687 755 816 873 927 978 1,023 1,063 1,098 1,129 1,158 1,184 1,211 1,235 1,257 1,278 1,296 1,313 1,328 1,342 1,351 1,351 1,351 1,351 1,351 1,351 107 TIPSY 0 0 9 95 235 377 515 644 760 866 961 1,045 1,118 1,179 1,234 1,281 1,323 1,358 1,387 1,411 1,429 1,445 1,459 1,469 1,479 1,487 1,495 1,501 1,506 1,510 1,511 1,511 1,511 1,511 1,511 1,511 108 TIPSY 0 19 79 134 187 231 267 284 166 155 170 187 201 215 229 240 251 259 267 274 281 287 295 302 308 314 319 324 329 333 333 333 333 333 333 333 111 TIPSY 0 0 2 33 103 187 272 351 425 495 559 617 671 720 763 803 839 872 901 927 950 974 998 1,021 1,042 1,061 1,079 1,096 1,112 1,126 1,127 1,127 1,127 1,127 1,127 1,127 112 TIPSY 0 0 1 24 88 169 250 324 397 464 524 578 630 677 720 759 794 826 855 880 902 924 947 968 988 1,006 1,023 1,040 1,055 1,069 1,071 1,071 1,071 1,071 1,071 1,071
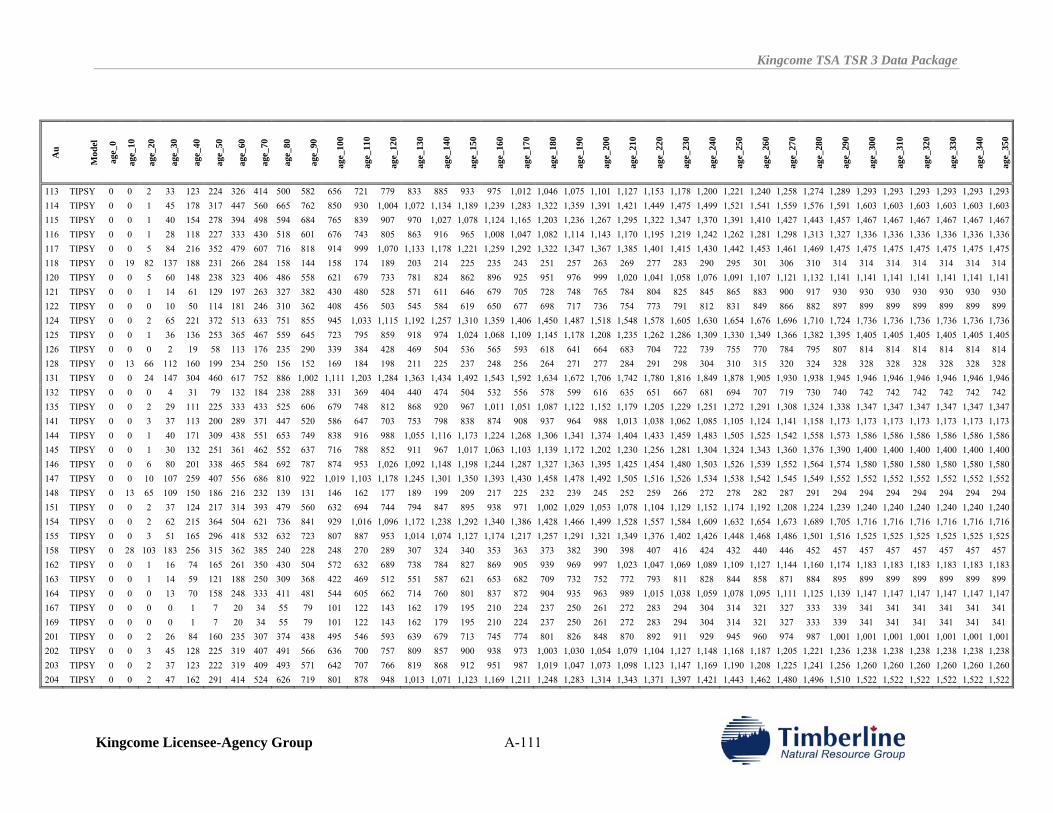
Kingcome TSA TSR 3 Data Package
Kingcome Licensee-Agency Group A-111
Au
Mod
el
age_
0
age_
10
age_
20
age_
30
age_
40
age_
50
age_
60
age_
70
age_
80
age_
90
age_
100
age_
110
age_
120
age_
130
age_
140
age_
150
age_
160
age_
170
age_
180
age_
190
age_
200
age_
210
age_
220
age_
230
age_
240
age_
250
age_
260
age_
270
age_
280
age_
290
age_
300
age_
310
age_
320
age_
330
age_
340
age_
350
113 TIPSY 0 0 2 33 123 224 326 414 500 582 656 721 779 833 885 933 975 1,012 1,046 1,075 1,101 1,127 1,153 1,178 1,200 1,221 1,240 1,258 1,274 1,289 1,293 1,293 1,293 1,293 1,293 1,293 114 TIPSY 0 0 1 45 178 317 447 560 665 762 850 930 1,004 1,072 1,134 1,189 1,239 1,283 1,322 1,359 1,391 1,421 1,449 1,475 1,499 1,521 1,541 1,559 1,576 1,591 1,603 1,603 1,603 1,603 1,603 1,603 115 TIPSY 0 0 1 40 154 278 394 498 594 684 765 839 907 970 1,027 1,078 1,124 1,165 1,203 1,236 1,267 1,295 1,322 1,347 1,370 1,391 1,410 1,427 1,443 1,457 1,467 1,467 1,467 1,467 1,467 1,467 116 TIPSY 0 0 1 28 118 227 333 430 518 601 676 743 805 863 916 965 1,008 1,047 1,082 1,114 1,143 1,170 1,195 1,219 1,242 1,262 1,281 1,298 1,313 1,327 1,336 1,336 1,336 1,336 1,336 1,336 117 TIPSY 0 0 5 84 216 352 479 607 716 818 914 999 1,070 1,133 1,178 1,221 1,259 1,292 1,322 1,347 1,367 1,385 1,401 1,415 1,430 1,442 1,453 1,461 1,469 1,475 1,475 1,475 1,475 1,475 1,475 1,475 118 TIPSY 0 19 82 137 188 231 266 284 158 144 158 174 189 203 214 225 235 243 251 257 263 269 277 283 290 295 301 306 310 314 314 314 314 314 314 314 120 TIPSY 0 0 5 60 148 238 323 406 486 558 621 679 733 781 824 862 896 925 951 976 999 1,020 1,041 1,058 1,076 1,091 1,107 1,121 1,132 1,141 1,141 1,141 1,141 1,141 1,141 1,141 121 TIPSY 0 0 1 14 61 129 197 263 327 382 430 480 528 571 611 646 679 705 728 748 765 784 804 825 845 865 883 900 917 930 930 930 930 930 930 930 122 TIPSY 0 0 0 10 50 114 181 246 310 362 408 456 503 545 584 619 650 677 698 717 736 754 773 791 812 831 849 866 882 897 899 899 899 899 899 899 124 TIPSY 0 0 2 65 221 372 513 633 751 855 945 1,033 1,115 1,192 1,257 1,310 1,359 1,406 1,450 1,487 1,518 1,548 1,578 1,605 1,630 1,654 1,676 1,696 1,710 1,724 1,736 1,736 1,736 1,736 1,736 1,736 125 TIPSY 0 0 1 36 136 253 365 467 559 645 723 795 859 918 974 1,024 1,068 1,109 1,145 1,178 1,208 1,235 1,262 1,286 1,309 1,330 1,349 1,366 1,382 1,395 1,405 1,405 1,405 1,405 1,405 1,405 126 TIPSY 0 0 0 2 19 58 113 176 235 290 339 384 428 469 504 536 565 593 618 641 664 683 704 722 739 755 770 784 795 807 814 814 814 814 814 814 128 TIPSY 0 13 66 112 160 199 234 250 156 152 169 184 198 211 225 237 248 256 264 271 277 284 291 298 304 310 315 320 324 328 328 328 328 328 328 328 131 TIPSY 0 0 24 147 304 460 617 752 886 1,002 1,111 1,203 1,284 1,363 1,434 1,492 1,543 1,592 1,634 1,672 1,706 1,742 1,780 1,816 1,849 1,878 1,905 1,930 1,938 1,945 1,946 1,946 1,946 1,946 1,946 1,946 132 TIPSY 0 0 0 4 31 79 132 184 238 288 331 369 404 440 474 504 532 556 578 599 616 635 651 667 681 694 707 719 730 740 742 742 742 742 742 742 135 TIPSY 0 0 2 29 111 225 333 433 525 606 679 748 812 868 920 967 1,011 1,051 1,087 1,122 1,152 1,179 1,205 1,229 1,251 1,272 1,291 1,308 1,324 1,338 1,347 1,347 1,347 1,347 1,347 1,347 141 TIPSY 0 0 3 37 113 200 289 371 447 520 586 647 703 753 798 838 874 908 937 964 988 1,013 1,038 1,062 1,085 1,105 1,124 1,141 1,158 1,173 1,173 1,173 1,173 1,173 1,173 1,173 144 TIPSY 0 0 1 40 171 309 438 551 653 749 838 916 988 1,055 1,116 1,173 1,224 1,268 1,306 1,341 1,374 1,404 1,433 1,459 1,483 1,505 1,525 1,542 1,558 1,573 1,586 1,586 1,586 1,586 1,586 1,586 145 TIPSY 0 0 1 30 132 251 361 462 552 637 716 788 852 911 967 1,017 1,063 1,103 1,139 1,172 1,202 1,230 1,256 1,281 1,304 1,324 1,343 1,360 1,376 1,390 1,400 1,400 1,400 1,400 1,400 1,400 146 TIPSY 0 0 6 80 201 338 465 584 692 787 874 953 1,026 1,092 1,148 1,198 1,244 1,287 1,327 1,363 1,395 1,425 1,454 1,480 1,503 1,526 1,539 1,552 1,564 1,574 1,580 1,580 1,580 1,580 1,580 1,580 147 TIPSY 0 0 10 107 259 407 556 686 810 922 1,019 1,103 1,178 1,245 1,301 1,350 1,393 1,430 1,458 1,478 1,492 1,505 1,516 1,526 1,534 1,538 1,542 1,545 1,549 1,552 1,552 1,552 1,552 1,552 1,552 1,552 148 TIPSY 0 13 65 109 150 186 216 232 139 131 146 162 177 189 199 209 217 225 232 239 245 252 259 266 272 278 282 287 291 294 294 294 294 294 294 294 151 TIPSY 0 0 2 37 124 217 314 393 479 560 632 694 744 794 847 895 938 971 1,002 1,029 1,053 1,078 1,104 1,129 1,152 1,174 1,192 1,208 1,224 1,239 1,240 1,240 1,240 1,240 1,240 1,240 154 TIPSY 0 0 2 62 215 364 504 621 736 841 929 1,016 1,096 1,172 1,238 1,292 1,340 1,386 1,428 1,466 1,499 1,528 1,557 1,584 1,609 1,632 1,654 1,673 1,689 1,705 1,716 1,716 1,716 1,716 1,716 1,716 155 TIPSY 0 0 3 51 165 296 418 532 632 723 807 887 953 1,014 1,074 1,127 1,174 1,217 1,257 1,291 1,321 1,349 1,376 1,402 1,426 1,448 1,468 1,486 1,501 1,516 1,525 1,525 1,525 1,525 1,525 1,525 158 TIPSY 0 28 103 183 256 315 362 385 240 228 248 270 289 307 324 340 353 363 373 382 390 398 407 416 424 432 440 446 452 457 457 457 457 457 457 457 162 TIPSY 0 0 1 16 74 165 261 350 430 504 572 632 689 738 784 827 869 905 939 969 997 1,023 1,047 1,069 1,089 1,109 1,127 1,144 1,160 1,174 1,183 1,183 1,183 1,183 1,183 1,183 163 TIPSY 0 0 1 14 59 121 188 250 309 368 422 469 512 551 587 621 653 682 709 732 752 772 793 811 828 844 858 871 884 895 899 899 899 899 899 899 164 TIPSY 0 0 0 13 70 158 248 333 411 481 544 605 662 714 760 801 837 872 904 935 963 989 1,015 1,038 1,059 1,078 1,095 1,111 1,125 1,139 1,147 1,147 1,147 1,147 1,147 1,147 167 TIPSY 0 0 0 0 1 7 20 34 55 79 101 122 143 162 179 195 210 224 237 250 261 272 283 294 304 314 321 327 333 339 341 341 341 341 341 341 169 TIPSY 0 0 0 0 1 7 20 34 55 79 101 122 143 162 179 195 210 224 237 250 261 272 283 294 304 314 321 327 333 339 341 341 341 341 341 341 201 TIPSY 0 0 2 26 84 160 235 307 374 438 495 546 593 639 679 713 745 774 801 826 848 870 892 911 929 945 960 974 987 1,001 1,001 1,001 1,001 1,001 1,001 1,001 202 TIPSY 0 0 3 45 128 225 319 407 491 566 636 700 757 809 857 900 938 973 1,003 1,030 1,054 1,079 1,104 1,127 1,148 1,168 1,187 1,205 1,221 1,236 1,238 1,238 1,238 1,238 1,238 1,238 203 TIPSY 0 0 2 37 123 222 319 409 493 571 642 707 766 819 868 912 951 987 1,019 1,047 1,073 1,098 1,123 1,147 1,169 1,190 1,208 1,225 1,241 1,256 1,260 1,260 1,260 1,260 1,260 1,260 204 TIPSY 0 0 2 47 162 291 414 524 626 719 801 878 948 1,013 1,071 1,123 1,169 1,211 1,248 1,283 1,314 1,343 1,371 1,397 1,421 1,443 1,462 1,480 1,496 1,510 1,522 1,522 1,522 1,522 1,522 1,522
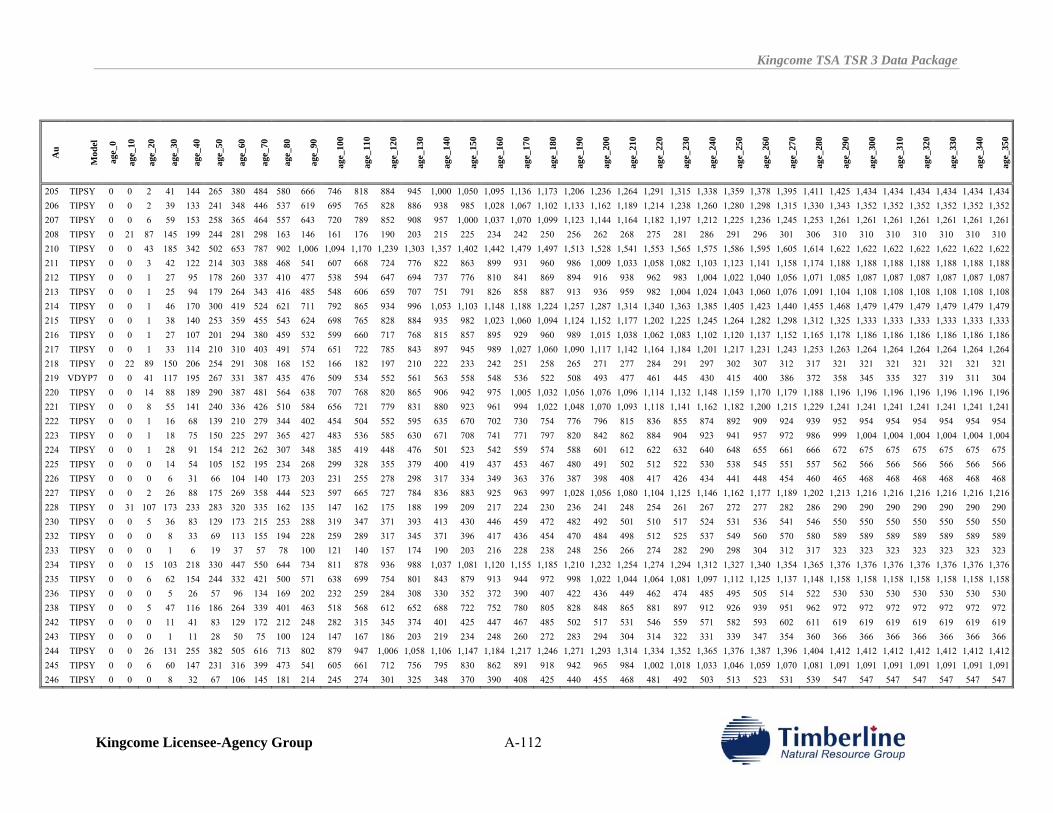
Kingcome TSA TSR 3 Data Package
Kingcome Licensee-Agency Group A-112
Au
Mod
el
age_
0
age_
10
age_
20
age_
30
age_
40
age_
50
age_
60
age_
70
age_
80
age_
90
age_
100
age_
110
age_
120
age_
130
age_
140
age_
150
age_
160
age_
170
age_
180
age_
190
age_
200
age_
210
age_
220
age_
230
age_
240
age_
250
age_
260
age_
270
age_
280
age_
290
age_
300
age_
310
age_
320
age_
330
age_
340
age_
350
205 TIPSY 0 0 2 41 144 265 380 484 580 666 746 818 884 945 1,000 1,050 1,095 1,136 1,173 1,206 1,236 1,264 1,291 1,315 1,338 1,359 1,378 1,395 1,411 1,425 1,434 1,434 1,434 1,434 1,434 1,434 206 TIPSY 0 0 2 39 133 241 348 446 537 619 695 765 828 886 938 985 1,028 1,067 1,102 1,133 1,162 1,189 1,214 1,238 1,260 1,280 1,298 1,315 1,330 1,343 1,352 1,352 1,352 1,352 1,352 1,352 207 TIPSY 0 0 6 59 153 258 365 464 557 643 720 789 852 908 957 1,000 1,037 1,070 1,099 1,123 1,144 1,164 1,182 1,197 1,212 1,225 1,236 1,245 1,253 1,261 1,261 1,261 1,261 1,261 1,261 1,261 208 TIPSY 0 21 87 145 199 244 281 298 163 146 161 176 190 203 215 225 234 242 250 256 262 268 275 281 286 291 296 301 306 310 310 310 310 310 310 310 210 TIPSY 0 0 43 185 342 502 653 787 902 1,006 1,094 1,170 1,239 1,303 1,357 1,402 1,442 1,479 1,497 1,513 1,528 1,541 1,553 1,565 1,575 1,586 1,595 1,605 1,614 1,622 1,622 1,622 1,622 1,622 1,622 1,622 211 TIPSY 0 0 3 42 122 214 303 388 468 541 607 668 724 776 822 863 899 931 960 986 1,009 1,033 1,058 1,082 1,103 1,123 1,141 1,158 1,174 1,188 1,188 1,188 1,188 1,188 1,188 1,188 212 TIPSY 0 0 1 27 95 178 260 337 410 477 538 594 647 694 737 776 810 841 869 894 916 938 962 983 1,004 1,022 1,040 1,056 1,071 1,085 1,087 1,087 1,087 1,087 1,087 1,087 213 TIPSY 0 0 1 25 94 179 264 343 416 485 548 606 659 707 751 791 826 858 887 913 936 959 982 1,004 1,024 1,043 1,060 1,076 1,091 1,104 1,108 1,108 1,108 1,108 1,108 1,108 214 TIPSY 0 0 1 46 170 300 419 524 621 711 792 865 934 996 1,053 1,103 1,148 1,188 1,224 1,257 1,287 1,314 1,340 1,363 1,385 1,405 1,423 1,440 1,455 1,468 1,479 1,479 1,479 1,479 1,479 1,479 215 TIPSY 0 0 1 38 140 253 359 455 543 624 698 765 828 884 935 982 1,023 1,060 1,094 1,124 1,152 1,177 1,202 1,225 1,245 1,264 1,282 1,298 1,312 1,325 1,333 1,333 1,333 1,333 1,333 1,333 216 TIPSY 0 0 1 27 107 201 294 380 459 532 599 660 717 768 815 857 895 929 960 989 1,015 1,038 1,062 1,083 1,102 1,120 1,137 1,152 1,165 1,178 1,186 1,186 1,186 1,186 1,186 1,186 217 TIPSY 0 0 1 33 114 210 310 403 491 574 651 722 785 843 897 945 989 1,027 1,060 1,090 1,117 1,142 1,164 1,184 1,201 1,217 1,231 1,243 1,253 1,263 1,264 1,264 1,264 1,264 1,264 1,264 218 TIPSY 0 22 89 150 206 254 291 308 168 152 166 182 197 210 222 233 242 251 258 265 271 277 284 291 297 302 307 312 317 321 321 321 321 321 321 321 219 VDYP7 0 0 41 117 195 267 331 387 435 476 509 534 552 561 563 558 548 536 522 508 493 477 461 445 430 415 400 386 372 358 345 335 327 319 311 304 220 TIPSY 0 0 14 88 189 290 387 481 564 638 707 768 820 865 906 942 975 1,005 1,032 1,056 1,076 1,096 1,114 1,132 1,148 1,159 1,170 1,179 1,188 1,196 1,196 1,196 1,196 1,196 1,196 1,196 221 TIPSY 0 0 8 55 141 240 336 426 510 584 656 721 779 831 880 923 961 994 1,022 1,048 1,070 1,093 1,118 1,141 1,162 1,182 1,200 1,215 1,229 1,241 1,241 1,241 1,241 1,241 1,241 1,241 222 TIPSY 0 0 1 16 68 139 210 279 344 402 454 504 552 595 635 670 702 730 754 776 796 815 836 855 874 892 909 924 939 952 954 954 954 954 954 954 223 TIPSY 0 0 1 18 75 150 225 297 365 427 483 536 585 630 671 708 741 771 797 820 842 862 884 904 923 941 957 972 986 999 1,004 1,004 1,004 1,004 1,004 1,004 224 TIPSY 0 0 1 28 91 154 212 262 307 348 385 419 448 476 501 523 542 559 574 588 601 612 622 632 640 648 655 661 666 672 675 675 675 675 675 675 225 TIPSY 0 0 0 14 54 105 152 195 234 268 299 328 355 379 400 419 437 453 467 480 491 502 512 522 530 538 545 551 557 562 566 566 566 566 566 566 226 TIPSY 0 0 0 6 31 66 104 140 173 203 231 255 278 298 317 334 349 363 376 387 398 408 417 426 434 441 448 454 460 465 468 468 468 468 468 468 227 TIPSY 0 0 2 26 88 175 269 358 444 523 597 665 727 784 836 883 925 963 997 1,028 1,056 1,080 1,104 1,125 1,146 1,162 1,177 1,189 1,202 1,213 1,216 1,216 1,216 1,216 1,216 1,216 228 TIPSY 0 31 107 173 233 283 320 335 162 135 147 162 175 188 199 209 217 224 230 236 241 248 254 261 267 272 277 282 286 290 290 290 290 290 290 290 230 TIPSY 0 0 5 36 83 129 173 215 253 288 319 347 371 393 413 430 446 459 472 482 492 501 510 517 524 531 536 541 546 550 550 550 550 550 550 550 232 TIPSY 0 0 0 8 33 69 113 155 194 228 259 289 317 345 371 396 417 436 454 470 484 498 512 525 537 549 560 570 580 589 589 589 589 589 589 589 233 TIPSY 0 0 0 1 6 19 37 57 78 100 121 140 157 174 190 203 216 228 238 248 256 266 274 282 290 298 304 312 317 323 323 323 323 323 323 323 234 TIPSY 0 0 15 103 218 330 447 550 644 734 811 878 936 988 1,037 1,081 1,120 1,155 1,185 1,210 1,232 1,254 1,274 1,294 1,312 1,327 1,340 1,354 1,365 1,376 1,376 1,376 1,376 1,376 1,376 1,376 235 TIPSY 0 0 6 62 154 244 332 421 500 571 638 699 754 801 843 879 913 944 972 998 1,022 1,044 1,064 1,081 1,097 1,112 1,125 1,137 1,148 1,158 1,158 1,158 1,158 1,158 1,158 1,158 236 TIPSY 0 0 0 5 26 57 96 134 169 202 232 259 284 308 330 352 372 390 407 422 436 449 462 474 485 495 505 514 522 530 530 530 530 530 530 530 238 TIPSY 0 0 5 47 116 186 264 339 401 463 518 568 612 652 688 722 752 780 805 828 848 865 881 897 912 926 939 951 962 972 972 972 972 972 972 972 242 TIPSY 0 0 0 11 41 83 129 172 212 248 282 315 345 374 401 425 447 467 485 502 517 531 546 559 571 582 593 602 611 619 619 619 619 619 619 619 243 TIPSY 0 0 0 1 11 28 50 75 100 124 147 167 186 203 219 234 248 260 272 283 294 304 314 322 331 339 347 354 360 366 366 366 366 366 366 366 244 TIPSY 0 0 26 131 255 382 505 616 713 802 879 947 1,006 1,058 1,106 1,147 1,184 1,217 1,246 1,271 1,293 1,314 1,334 1,352 1,365 1,376 1,387 1,396 1,404 1,412 1,412 1,412 1,412 1,412 1,412 1,412 245 TIPSY 0 0 6 60 147 231 316 399 473 541 605 661 712 756 795 830 862 891 918 942 965 984 1,002 1,018 1,033 1,046 1,059 1,070 1,081 1,091 1,091 1,091 1,091 1,091 1,091 1,091 246 TIPSY 0 0 0 8 32 67 106 145 181 214 245 274 301 325 348 370 390 408 425 440 455 468 481 492 503 513 523 531 539 547 547 547 547 547 547 547
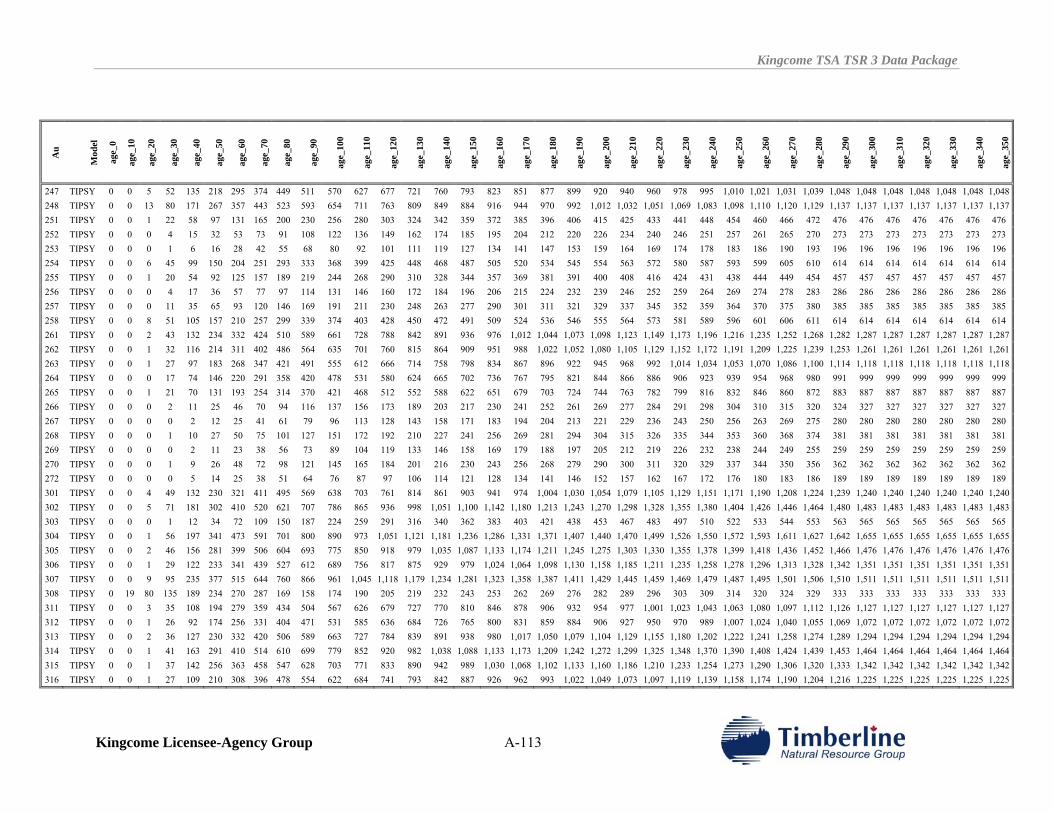
Kingcome TSA TSR 3 Data Package
Kingcome Licensee-Agency Group A-113
Au
Mod
el
age_
0
age_
10
age_
20
age_
30
age_
40
age_
50
age_
60
age_
70
age_
80
age_
90
age_
100
age_
110
age_
120
age_
130
age_
140
age_
150
age_
160
age_
170
age_
180
age_
190
age_
200
age_
210
age_
220
age_
230
age_
240
age_
250
age_
260
age_
270
age_
280
age_
290
age_
300
age_
310
age_
320
age_
330
age_
340
age_
350
247 TIPSY 0 0 5 52 135 218 295 374 449 511 570 627 677 721 760 793 823 851 877 899 920 940 960 978 995 1,010 1,021 1,031 1,039 1,048 1,048 1,048 1,048 1,048 1,048 1,048 248 TIPSY 0 0 13 80 171 267 357 443 523 593 654 711 763 809 849 884 916 944 970 992 1,012 1,032 1,051 1,069 1,083 1,098 1,110 1,120 1,129 1,137 1,137 1,137 1,137 1,137 1,137 1,137 251 TIPSY 0 0 1 22 58 97 131 165 200 230 256 280 303 324 342 359 372 385 396 406 415 425 433 441 448 454 460 466 472 476 476 476 476 476 476 476 252 TIPSY 0 0 0 4 15 32 53 73 91 108 122 136 149 162 174 185 195 204 212 220 226 234 240 246 251 257 261 265 270 273 273 273 273 273 273 273 253 TIPSY 0 0 0 1 6 16 28 42 55 68 80 92 101 111 119 127 134 141 147 153 159 164 169 174 178 183 186 190 193 196 196 196 196 196 196 196 254 TIPSY 0 0 6 45 99 150 204 251 293 333 368 399 425 448 468 487 505 520 534 545 554 563 572 580 587 593 599 605 610 614 614 614 614 614 614 614 255 TIPSY 0 0 1 20 54 92 125 157 189 219 244 268 290 310 328 344 357 369 381 391 400 408 416 424 431 438 444 449 454 457 457 457 457 457 457 457 256 TIPSY 0 0 0 4 17 36 57 77 97 114 131 146 160 172 184 196 206 215 224 232 239 246 252 259 264 269 274 278 283 286 286 286 286 286 286 286 257 TIPSY 0 0 0 11 35 65 93 120 146 169 191 211 230 248 263 277 290 301 311 321 329 337 345 352 359 364 370 375 380 385 385 385 385 385 385 385 258 TIPSY 0 0 8 51 105 157 210 257 299 339 374 403 428 450 472 491 509 524 536 546 555 564 573 581 589 596 601 606 611 614 614 614 614 614 614 614 261 TIPSY 0 0 2 43 132 234 332 424 510 589 661 728 788 842 891 936 976 1,012 1,044 1,073 1,098 1,123 1,149 1,173 1,196 1,216 1,235 1,252 1,268 1,282 1,287 1,287 1,287 1,287 1,287 1,287 262 TIPSY 0 0 1 32 116 214 311 402 486 564 635 701 760 815 864 909 951 988 1,022 1,052 1,080 1,105 1,129 1,152 1,172 1,191 1,209 1,225 1,239 1,253 1,261 1,261 1,261 1,261 1,261 1,261 263 TIPSY 0 0 1 27 97 183 268 347 421 491 555 612 666 714 758 798 834 867 896 922 945 968 992 1,014 1,034 1,053 1,070 1,086 1,100 1,114 1,118 1,118 1,118 1,118 1,118 1,118 264 TIPSY 0 0 0 17 74 146 220 291 358 420 478 531 580 624 665 702 736 767 795 821 844 866 886 906 923 939 954 968 980 991 999 999 999 999 999 999 265 TIPSY 0 0 1 21 70 131 193 254 314 370 421 468 512 552 588 622 651 679 703 724 744 763 782 799 816 832 846 860 872 883 887 887 887 887 887 887 266 TIPSY 0 0 0 2 11 25 46 70 94 116 137 156 173 189 203 217 230 241 252 261 269 277 284 291 298 304 310 315 320 324 327 327 327 327 327 327 267 TIPSY 0 0 0 0 2 12 25 41 61 79 96 113 128 143 158 171 183 194 204 213 221 229 236 243 250 256 263 269 275 280 280 280 280 280 280 280 268 TIPSY 0 0 0 1 10 27 50 75 101 127 151 172 192 210 227 241 256 269 281 294 304 315 326 335 344 353 360 368 374 381 381 381 381 381 381 381 269 TIPSY 0 0 0 0 2 11 23 38 56 73 89 104 119 133 146 158 169 179 188 197 205 212 219 226 232 238 244 249 255 259 259 259 259 259 259 259 270 TIPSY 0 0 0 1 9 26 48 72 98 121 145 165 184 201 216 230 243 256 268 279 290 300 311 320 329 337 344 350 356 362 362 362 362 362 362 362 272 TIPSY 0 0 0 0 5 14 25 38 51 64 76 87 97 106 114 121 128 134 141 146 152 157 162 167 172 176 180 183 186 189 189 189 189 189 189 189 301 TIPSY 0 0 4 49 132 230 321 411 495 569 638 703 761 814 861 903 941 974 1,004 1,030 1,054 1,079 1,105 1,129 1,151 1,171 1,190 1,208 1,224 1,239 1,240 1,240 1,240 1,240 1,240 1,240 302 TIPSY 0 0 5 71 181 302 410 520 621 707 786 865 936 998 1,051 1,100 1,142 1,180 1,213 1,243 1,270 1,298 1,328 1,355 1,380 1,404 1,426 1,446 1,464 1,480 1,483 1,483 1,483 1,483 1,483 1,483 303 TIPSY 0 0 0 1 12 34 72 109 150 187 224 259 291 316 340 362 383 403 421 438 453 467 483 497 510 522 533 544 553 563 565 565 565 565 565 565 304 TIPSY 0 0 1 56 197 341 473 591 701 800 890 973 1,051 1,121 1,181 1,236 1,286 1,331 1,371 1,407 1,440 1,470 1,499 1,526 1,550 1,572 1,593 1,611 1,627 1,642 1,655 1,655 1,655 1,655 1,655 1,655 305 TIPSY 0 0 2 46 156 281 399 506 604 693 775 850 918 979 1,035 1,087 1,133 1,174 1,211 1,245 1,275 1,303 1,330 1,355 1,378 1,399 1,418 1,436 1,452 1,466 1,476 1,476 1,476 1,476 1,476 1,476 306 TIPSY 0 0 1 29 122 233 341 439 527 612 689 756 817 875 929 979 1,024 1,064 1,098 1,130 1,158 1,185 1,211 1,235 1,258 1,278 1,296 1,313 1,328 1,342 1,351 1,351 1,351 1,351 1,351 1,351 307 TIPSY 0 0 9 95 235 377 515 644 760 866 961 1,045 1,118 1,179 1,234 1,281 1,323 1,358 1,387 1,411 1,429 1,445 1,459 1,469 1,479 1,487 1,495 1,501 1,506 1,510 1,511 1,511 1,511 1,511 1,511 1,511 308 TIPSY 0 19 80 135 189 234 270 287 169 158 174 190 205 219 232 243 253 262 269 276 282 289 296 303 309 314 320 324 329 333 333 333 333 333 333 333 311 TIPSY 0 0 3 35 108 194 279 359 434 504 567 626 679 727 770 810 846 878 906 932 954 977 1,001 1,023 1,043 1,063 1,080 1,097 1,112 1,126 1,127 1,127 1,127 1,127 1,127 1,127 312 TIPSY 0 0 1 26 92 174 256 331 404 471 531 585 636 684 726 765 800 831 859 884 906 927 950 970 989 1,007 1,024 1,040 1,055 1,069 1,072 1,072 1,072 1,072 1,072 1,072 313 TIPSY 0 0 2 36 127 230 332 420 506 589 663 727 784 839 891 938 980 1,017 1,050 1,079 1,104 1,129 1,155 1,180 1,202 1,222 1,241 1,258 1,274 1,289 1,294 1,294 1,294 1,294 1,294 1,294 314 TIPSY 0 0 1 41 163 291 410 514 610 699 779 852 920 982 1,038 1,088 1,133 1,173 1,209 1,242 1,272 1,299 1,325 1,348 1,370 1,390 1,408 1,424 1,439 1,453 1,464 1,464 1,464 1,464 1,464 1,464 315 TIPSY 0 0 1 37 142 256 363 458 547 628 703 771 833 890 942 989 1,030 1,068 1,102 1,133 1,160 1,186 1,210 1,233 1,254 1,273 1,290 1,306 1,320 1,333 1,342 1,342 1,342 1,342 1,342 1,342 316 TIPSY 0 0 1 27 109 210 308 396 478 554 622 684 741 793 842 887 926 962 993 1,022 1,049 1,073 1,097 1,119 1,139 1,158 1,174 1,190 1,204 1,216 1,225 1,225 1,225 1,225 1,225 1,225
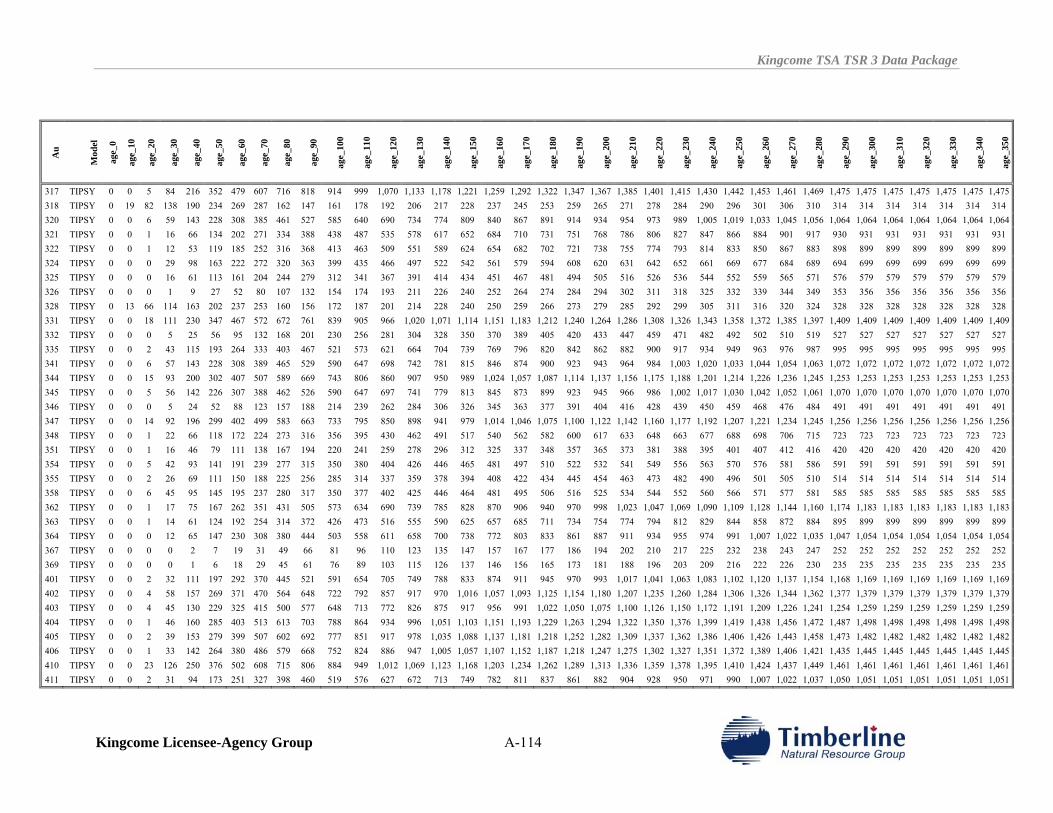
Kingcome TSA TSR 3 Data Package
Kingcome Licensee-Agency Group A-114
Au
Mod
el
age_
0
age_
10
age_
20
age_
30
age_
40
age_
50
age_
60
age_
70
age_
80
age_
90
age_
100
age_
110
age_
120
age_
130
age_
140
age_
150
age_
160
age_
170
age_
180
age_
190
age_
200
age_
210
age_
220
age_
230
age_
240
age_
250
age_
260
age_
270
age_
280
age_
290
age_
300
age_
310
age_
320
age_
330
age_
340
age_
350
317 TIPSY 0 0 5 84 216 352 479 607 716 818 914 999 1,070 1,133 1,178 1,221 1,259 1,292 1,322 1,347 1,367 1,385 1,401 1,415 1,430 1,442 1,453 1,461 1,469 1,475 1,475 1,475 1,475 1,475 1,475 1,475 318 TIPSY 0 19 82 138 190 234 269 287 162 147 161 178 192 206 217 228 237 245 253 259 265 271 278 284 290 296 301 306 310 314 314 314 314 314 314 314 320 TIPSY 0 0 6 59 143 228 308 385 461 527 585 640 690 734 774 809 840 867 891 914 934 954 973 989 1,005 1,019 1,033 1,045 1,056 1,064 1,064 1,064 1,064 1,064 1,064 1,064 321 TIPSY 0 0 1 16 66 134 202 271 334 388 438 487 535 578 617 652 684 710 731 751 768 786 806 827 847 866 884 901 917 930 931 931 931 931 931 931 322 TIPSY 0 0 1 12 53 119 185 252 316 368 413 463 509 551 589 624 654 682 702 721 738 755 774 793 814 833 850 867 883 898 899 899 899 899 899 899 324 TIPSY 0 0 0 29 98 163 222 272 320 363 399 435 466 497 522 542 561 579 594 608 620 631 642 652 661 669 677 684 689 694 699 699 699 699 699 699 325 TIPSY 0 0 0 16 61 113 161 204 244 279 312 341 367 391 414 434 451 467 481 494 505 516 526 536 544 552 559 565 571 576 579 579 579 579 579 579 326 TIPSY 0 0 0 1 9 27 52 80 107 132 154 174 193 211 226 240 252 264 274 284 294 302 311 318 325 332 339 344 349 353 356 356 356 356 356 356 328 TIPSY 0 13 66 114 163 202 237 253 160 156 172 187 201 214 228 240 250 259 266 273 279 285 292 299 305 311 316 320 324 328 328 328 328 328 328 328 331 TIPSY 0 0 18 111 230 347 467 572 672 761 839 905 966 1,020 1,071 1,114 1,151 1,183 1,212 1,240 1,264 1,286 1,308 1,326 1,343 1,358 1,372 1,385 1,397 1,409 1,409 1,409 1,409 1,409 1,409 1,409 332 TIPSY 0 0 0 5 25 56 95 132 168 201 230 256 281 304 328 350 370 389 405 420 433 447 459 471 482 492 502 510 519 527 527 527 527 527 527 527 335 TIPSY 0 0 2 43 115 193 264 333 403 467 521 573 621 664 704 739 769 796 820 842 862 882 900 917 934 949 963 976 987 995 995 995 995 995 995 995 341 TIPSY 0 0 6 57 143 228 308 389 465 529 590 647 698 742 781 815 846 874 900 923 943 964 984 1,003 1,020 1,033 1,044 1,054 1,063 1,072 1,072 1,072 1,072 1,072 1,072 1,072 344 TIPSY 0 0 15 93 200 302 407 507 589 669 743 806 860 907 950 989 1,024 1,057 1,087 1,114 1,137 1,156 1,175 1,188 1,201 1,214 1,226 1,236 1,245 1,253 1,253 1,253 1,253 1,253 1,253 1,253 345 TIPSY 0 0 5 56 142 226 307 388 462 526 590 647 697 741 779 813 845 873 899 923 945 966 986 1,002 1,017 1,030 1,042 1,052 1,061 1,070 1,070 1,070 1,070 1,070 1,070 1,070 346 TIPSY 0 0 0 5 24 52 88 123 157 188 214 239 262 284 306 326 345 363 377 391 404 416 428 439 450 459 468 476 484 491 491 491 491 491 491 491 347 TIPSY 0 0 14 92 196 299 402 499 583 663 733 795 850 898 941 979 1,014 1,046 1,075 1,100 1,122 1,142 1,160 1,177 1,192 1,207 1,221 1,234 1,245 1,256 1,256 1,256 1,256 1,256 1,256 1,256 348 TIPSY 0 0 1 22 66 118 172 224 273 316 356 395 430 462 491 517 540 562 582 600 617 633 648 663 677 688 698 706 715 723 723 723 723 723 723 723 351 TIPSY 0 0 1 16 46 79 111 138 167 194 220 241 259 278 296 312 325 337 348 357 365 373 381 388 395 401 407 412 416 420 420 420 420 420 420 420 354 TIPSY 0 0 5 42 93 141 191 239 277 315 350 380 404 426 446 465 481 497 510 522 532 541 549 556 563 570 576 581 586 591 591 591 591 591 591 591 355 TIPSY 0 0 2 26 69 111 150 188 225 256 285 314 337 359 378 394 408 422 434 445 454 463 473 482 490 496 501 505 510 514 514 514 514 514 514 514 358 TIPSY 0 0 6 45 95 145 195 237 280 317 350 377 402 425 446 464 481 495 506 516 525 534 544 552 560 566 571 577 581 585 585 585 585 585 585 585 362 TIPSY 0 0 1 17 75 167 262 351 431 505 573 634 690 739 785 828 870 906 940 970 998 1,023 1,047 1,069 1,090 1,109 1,128 1,144 1,160 1,174 1,183 1,183 1,183 1,183 1,183 1,183 363 TIPSY 0 0 1 14 61 124 192 254 314 372 426 473 516 555 590 625 657 685 711 734 754 774 794 812 829 844 858 872 884 895 899 899 899 899 899 899 364 TIPSY 0 0 0 12 65 147 230 308 380 444 503 558 611 658 700 738 772 803 833 861 887 911 934 955 974 991 1,007 1,022 1,035 1,047 1,054 1,054 1,054 1,054 1,054 1,054 367 TIPSY 0 0 0 0 2 7 19 31 49 66 81 96 110 123 135 147 157 167 177 186 194 202 210 217 225 232 238 243 247 252 252 252 252 252 252 252 369 TIPSY 0 0 0 0 1 6 18 29 45 61 76 89 103 115 126 137 146 156 165 173 181 188 196 203 209 216 222 226 230 235 235 235 235 235 235 235 401 TIPSY 0 0 2 32 111 197 292 370 445 521 591 654 705 749 788 833 874 911 945 970 993 1,017 1,041 1,063 1,083 1,102 1,120 1,137 1,154 1,168 1,169 1,169 1,169 1,169 1,169 1,169 402 TIPSY 0 0 4 58 157 269 371 470 564 648 722 792 857 917 970 1,016 1,057 1,093 1,125 1,154 1,180 1,207 1,235 1,260 1,284 1,306 1,326 1,344 1,362 1,377 1,379 1,379 1,379 1,379 1,379 1,379 403 TIPSY 0 0 4 45 130 229 325 415 500 577 648 713 772 826 875 917 956 991 1,022 1,050 1,075 1,100 1,126 1,150 1,172 1,191 1,209 1,226 1,241 1,254 1,259 1,259 1,259 1,259 1,259 1,259 404 TIPSY 0 0 1 46 160 285 403 513 613 703 788 864 934 996 1,051 1,103 1,151 1,193 1,229 1,263 1,294 1,322 1,350 1,376 1,399 1,419 1,438 1,456 1,472 1,487 1,498 1,498 1,498 1,498 1,498 1,498 405 TIPSY 0 0 2 39 153 279 399 507 602 692 777 851 917 978 1,035 1,088 1,137 1,181 1,218 1,252 1,282 1,309 1,337 1,362 1,386 1,406 1,426 1,443 1,458 1,473 1,482 1,482 1,482 1,482 1,482 1,482 406 TIPSY 0 0 1 33 142 264 380 486 579 668 752 824 886 947 1,005 1,057 1,107 1,152 1,187 1,218 1,247 1,275 1,302 1,327 1,351 1,372 1,389 1,406 1,421 1,435 1,445 1,445 1,445 1,445 1,445 1,445 410 TIPSY 0 0 23 126 250 376 502 608 715 806 884 949 1,012 1,069 1,123 1,168 1,203 1,234 1,262 1,289 1,313 1,336 1,359 1,378 1,395 1,410 1,424 1,437 1,449 1,461 1,461 1,461 1,461 1,461 1,461 1,461 411 TIPSY 0 0 2 31 94 173 251 327 398 460 519 576 627 672 713 749 782 811 837 861 882 904 928 950 971 990 1,007 1,022 1,037 1,050 1,051 1,051 1,051 1,051 1,051 1,051
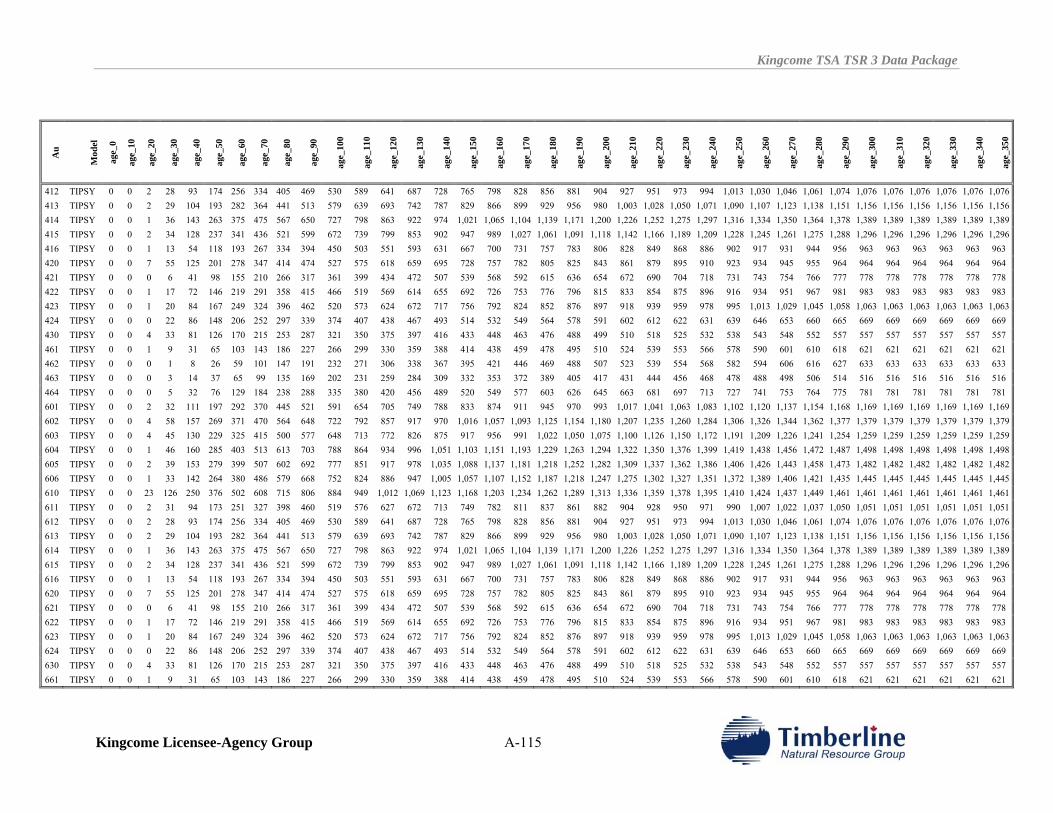
Kingcome TSA TSR 3 Data Package
Kingcome Licensee-Agency Group A-115
Au
Mod
el
age_
0
age_
10
age_
20
age_
30
age_
40
age_
50
age_
60
age_
70
age_
80
age_
90
age_
100
age_
110
age_
120
age_
130
age_
140
age_
150
age_
160
age_
170
age_
180
age_
190
age_
200
age_
210
age_
220
age_
230
age_
240
age_
250
age_
260
age_
270
age_
280
age_
290
age_
300
age_
310
age_
320
age_
330
age_
340
age_
350
412 TIPSY 0 0 2 28 93 174 256 334 405 469 530 589 641 687 728 765 798 828 856 881 904 927 951 973 994 1,013 1,030 1,046 1,061 1,074 1,076 1,076 1,076 1,076 1,076 1,076 413 TIPSY 0 0 2 29 104 193 282 364 441 513 579 639 693 742 787 829 866 899 929 956 980 1,003 1,028 1,050 1,071 1,090 1,107 1,123 1,138 1,151 1,156 1,156 1,156 1,156 1,156 1,156 414 TIPSY 0 0 1 36 143 263 375 475 567 650 727 798 863 922 974 1,021 1,065 1,104 1,139 1,171 1,200 1,226 1,252 1,275 1,297 1,316 1,334 1,350 1,364 1,378 1,389 1,389 1,389 1,389 1,389 1,389 415 TIPSY 0 0 2 34 128 237 341 436 521 599 672 739 799 853 902 947 989 1,027 1,061 1,091 1,118 1,142 1,166 1,189 1,209 1,228 1,245 1,261 1,275 1,288 1,296 1,296 1,296 1,296 1,296 1,296 416 TIPSY 0 0 1 13 54 118 193 267 334 394 450 503 551 593 631 667 700 731 757 783 806 828 849 868 886 902 917 931 944 956 963 963 963 963 963 963 420 TIPSY 0 0 7 55 125 201 278 347 414 474 527 575 618 659 695 728 757 782 805 825 843 861 879 895 910 923 934 945 955 964 964 964 964 964 964 964 421 TIPSY 0 0 0 6 41 98 155 210 266 317 361 399 434 472 507 539 568 592 615 636 654 672 690 704 718 731 743 754 766 777 778 778 778 778 778 778 422 TIPSY 0 0 1 17 72 146 219 291 358 415 466 519 569 614 655 692 726 753 776 796 815 833 854 875 896 916 934 951 967 981 983 983 983 983 983 983 423 TIPSY 0 0 1 20 84 167 249 324 396 462 520 573 624 672 717 756 792 824 852 876 897 918 939 959 978 995 1,013 1,029 1,045 1,058 1,063 1,063 1,063 1,063 1,063 1,063 424 TIPSY 0 0 0 22 86 148 206 252 297 339 374 407 438 467 493 514 532 549 564 578 591 602 612 622 631 639 646 653 660 665 669 669 669 669 669 669 430 TIPSY 0 0 4 33 81 126 170 215 253 287 321 350 375 397 416 433 448 463 476 488 499 510 518 525 532 538 543 548 552 557 557 557 557 557 557 557 461 TIPSY 0 0 1 9 31 65 103 143 186 227 266 299 330 359 388 414 438 459 478 495 510 524 539 553 566 578 590 601 610 618 621 621 621 621 621 621 462 TIPSY 0 0 0 1 8 26 59 101 147 191 232 271 306 338 367 395 421 446 469 488 507 523 539 554 568 582 594 606 616 627 633 633 633 633 633 633 463 TIPSY 0 0 0 3 14 37 65 99 135 169 202 231 259 284 309 332 353 372 389 405 417 431 444 456 468 478 488 498 506 514 516 516 516 516 516 516 464 TIPSY 0 0 0 5 32 76 129 184 238 288 335 380 420 456 489 520 549 577 603 626 645 663 681 697 713 727 741 753 764 775 781 781 781 781 781 781 601 TIPSY 0 0 2 32 111 197 292 370 445 521 591 654 705 749 788 833 874 911 945 970 993 1,017 1,041 1,063 1,083 1,102 1,120 1,137 1,154 1,168 1,169 1,169 1,169 1,169 1,169 1,169 602 TIPSY 0 0 4 58 157 269 371 470 564 648 722 792 857 917 970 1,016 1,057 1,093 1,125 1,154 1,180 1,207 1,235 1,260 1,284 1,306 1,326 1,344 1,362 1,377 1,379 1,379 1,379 1,379 1,379 1,379 603 TIPSY 0 0 4 45 130 229 325 415 500 577 648 713 772 826 875 917 956 991 1,022 1,050 1,075 1,100 1,126 1,150 1,172 1,191 1,209 1,226 1,241 1,254 1,259 1,259 1,259 1,259 1,259 1,259 604 TIPSY 0 0 1 46 160 285 403 513 613 703 788 864 934 996 1,051 1,103 1,151 1,193 1,229 1,263 1,294 1,322 1,350 1,376 1,399 1,419 1,438 1,456 1,472 1,487 1,498 1,498 1,498 1,498 1,498 1,498 605 TIPSY 0 0 2 39 153 279 399 507 602 692 777 851 917 978 1,035 1,088 1,137 1,181 1,218 1,252 1,282 1,309 1,337 1,362 1,386 1,406 1,426 1,443 1,458 1,473 1,482 1,482 1,482 1,482 1,482 1,482 606 TIPSY 0 0 1 33 142 264 380 486 579 668 752 824 886 947 1,005 1,057 1,107 1,152 1,187 1,218 1,247 1,275 1,302 1,327 1,351 1,372 1,389 1,406 1,421 1,435 1,445 1,445 1,445 1,445 1,445 1,445 610 TIPSY 0 0 23 126 250 376 502 608 715 806 884 949 1,012 1,069 1,123 1,168 1,203 1,234 1,262 1,289 1,313 1,336 1,359 1,378 1,395 1,410 1,424 1,437 1,449 1,461 1,461 1,461 1,461 1,461 1,461 1,461 611 TIPSY 0 0 2 31 94 173 251 327 398 460 519 576 627 672 713 749 782 811 837 861 882 904 928 950 971 990 1,007 1,022 1,037 1,050 1,051 1,051 1,051 1,051 1,051 1,051 612 TIPSY 0 0 2 28 93 174 256 334 405 469 530 589 641 687 728 765 798 828 856 881 904 927 951 973 994 1,013 1,030 1,046 1,061 1,074 1,076 1,076 1,076 1,076 1,076 1,076 613 TIPSY 0 0 2 29 104 193 282 364 441 513 579 639 693 742 787 829 866 899 929 956 980 1,003 1,028 1,050 1,071 1,090 1,107 1,123 1,138 1,151 1,156 1,156 1,156 1,156 1,156 1,156 614 TIPSY 0 0 1 36 143 263 375 475 567 650 727 798 863 922 974 1,021 1,065 1,104 1,139 1,171 1,200 1,226 1,252 1,275 1,297 1,316 1,334 1,350 1,364 1,378 1,389 1,389 1,389 1,389 1,389 1,389 615 TIPSY 0 0 2 34 128 237 341 436 521 599 672 739 799 853 902 947 989 1,027 1,061 1,091 1,118 1,142 1,166 1,189 1,209 1,228 1,245 1,261 1,275 1,288 1,296 1,296 1,296 1,296 1,296 1,296 616 TIPSY 0 0 1 13 54 118 193 267 334 394 450 503 551 593 631 667 700 731 757 783 806 828 849 868 886 902 917 931 944 956 963 963 963 963 963 963 620 TIPSY 0 0 7 55 125 201 278 347 414 474 527 575 618 659 695 728 757 782 805 825 843 861 879 895 910 923 934 945 955 964 964 964 964 964 964 964 621 TIPSY 0 0 0 6 41 98 155 210 266 317 361 399 434 472 507 539 568 592 615 636 654 672 690 704 718 731 743 754 766 777 778 778 778 778 778 778 622 TIPSY 0 0 1 17 72 146 219 291 358 415 466 519 569 614 655 692 726 753 776 796 815 833 854 875 896 916 934 951 967 981 983 983 983 983 983 983 623 TIPSY 0 0 1 20 84 167 249 324 396 462 520 573 624 672 717 756 792 824 852 876 897 918 939 959 978 995 1,013 1,029 1,045 1,058 1,063 1,063 1,063 1,063 1,063 1,063 624 TIPSY 0 0 0 22 86 148 206 252 297 339 374 407 438 467 493 514 532 549 564 578 591 602 612 622 631 639 646 653 660 665 669 669 669 669 669 669 630 TIPSY 0 0 4 33 81 126 170 215 253 287 321 350 375 397 416 433 448 463 476 488 499 510 518 525 532 538 543 548 552 557 557 557 557 557 557 557 661 TIPSY 0 0 1 9 31 65 103 143 186 227 266 299 330 359 388 414 438 459 478 495 510 524 539 553 566 578 590 601 610 618 621 621 621 621 621 621
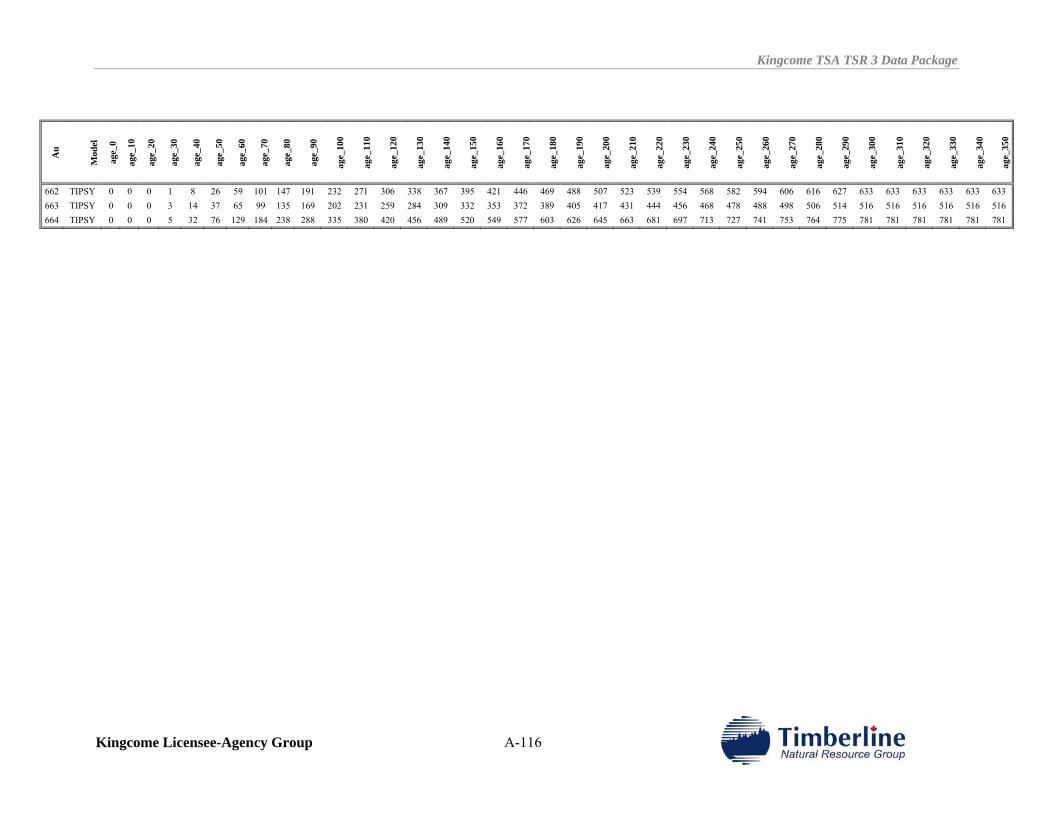
Kingcome TSA TSR 3 Data Package
Kingcome Licensee-Agency Group A-116
Au
Mod
el
age_
0
age_
10
age_
20
age_
30
age_
40
age_
50
age_
60
age_
70
age_
80
age_
90
age_
100
age_
110
age_
120
age_
130
age_
140
age_
150
age_
160
age_
170
age_
180
age_
190
age_
200
age_
210
age_
220
age_
230
age_
240
age_
250
age_
260
age_
270
age_
280
age_
290
age_
300
age_
310
age_
320
age_
330
age_
340
age_
350
662 TIPSY 0 0 0 1 8 26 59 101 147 191 232 271 306 338 367 395 421 446 469 488 507 523 539 554 568 582 594 606 616 627 633 633 633 633 633 633 663 TIPSY 0 0 0 3 14 37 65 99 135 169 202 231 259 284 309 332 353 372 389 405 417 431 444 456 468 478 488 498 506 514 516 516 516 516 516 516 664 TIPSY 0 0 0 5 32 76 129 184 238 288 335 380 420 456 489 520 549 577 603 626 645 663 681 697 713 727 741 753 764 775 781 781 781 781 781 781


![Timberline [Compatibility Mode]](https://img.pdfslide.us/doc/110x75/577d245d1a28ab4e1e9c4dbb/timberline-compatibility-mode.jpg)