Embed Size (px)
Citation preview
Iran. J. Chem. Chem. Eng. Vol. 31, No. 1, 2012
57
Kinetic Study, Modeling and Simulation of
Homogeneous Rhodium-Catalyzed Methanol Carbonylation
to Acetic Acid
Golhosseini Bidgoli, Reza; Naderifar, Abas*+
Faculty of Chemical Engineering, Amirkabir University of Technology, Tehran, I.R. IRAN
Mohammadrezaei, Ali Reza; Jafari Nasr, Mohammad Reza
Petrochemical Research & Technology Company (NPC-RT), Tehran, I.R. IRAN
ABSTRACT: Thermodynamic restrictions and simultaneous effects of operational conditions
on the homogeneous rhodium-catalyzed carbonylation of methanol are studied in this line of research.
It is shown that the general NRTL-Virial model can be appropriated to study thermodynamics of
the carbonylation. It is obtained that the reaction is kinetically and thermodynamically reasonable
at temperatures above 420K and below 520K, respectively. Moreover, at carbon monoxide partial
pressures above 10 bar, the reaction rate is independent of the partial pressure. These results are
in full accord with those reported in the literature. In addition, PCO > 2 bar is necessary for
initializing the reaction. The parameters involved in the rate expression, equilibrium constants,
CO solubility, and rate constant, are determined. The equilibrium constants are calculated with
B3LYP/SDD ab initio method, and the value of Henry’s coefficient for CO (HCO) is determined
as a function of temperature and methyl acetate conversion. The results predicted by this function agree
well with those proposed by the general NRTL-Virial model with the errors below 11%.
The Variation of CO solubility with acetic acid and methyl acetate concentrations is in good agreement
with that obtained by others. It is found that the determined parameters give satisfactory predictions
in modeling and simulation of the reaction.
KEY WORDS: Kinetic study, Modeling, Simulation, Homogeneous methanol carbonylation,
Rhodium, ab initio method.
INTRODUCTION
Acetic acid, an important industrial product, is widely
used as a raw material for the production of Vinyl Acetate
Monomer (VAM) and acetic anhydride. It is also used
as a solvent for Purified Terephthalic Acid (PTA) production.
Though various routes for synthesis of acetic acid
are known, the most important route for large-scale
manufacturing of acetic acid is homogeneous methanol
carbonylation through the chemical Eq. (1). The Monsanto
process (Rh: catalyst; CH3I: promoter; 423 - 473K;
30 - 60 bar), which is a high selective methanol
* To whom correspondence should be addressed.
+ E-mail: [email protected]
1021-9986/12/1/57 17/$/3.70
Iran. J. Chem. Chem. Eng. Golhosseini Bidgoli R. Et al. Vol. 31, No. 1, 2012
58
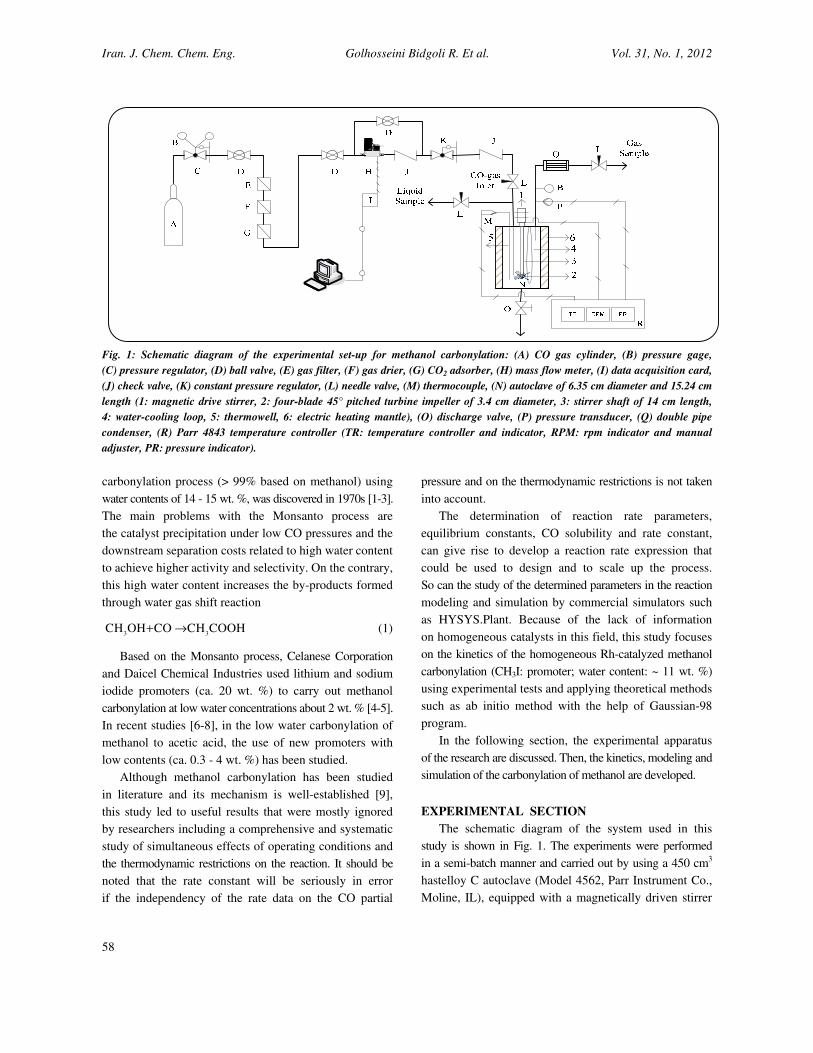
Fig. 1: Schematic diagram of the experimental set-up for methanol carbonylation: (A) CO gas cylinder, (B) pressure gage,
(C) pressure regulator, (D) ball valve, (E) gas filter, (F) gas drier, (G) CO2 adsorber, (H) mass flow meter, (I) data acquisition card,
(J) check valve, (K) constant pressure regulator, (L) needle valve, (M) thermocouple, (N) autoclave of 6.35 cm diameter and 15.24 cm
length (1: magnetic drive stirrer, 2: four-blade 45° pitched turbine impeller of 3.4 cm diameter, 3: stirrer shaft of 14 cm length,
4: water-cooling loop, 5: thermowell, 6: electric heating mantle), (O) discharge valve, (P) pressure transducer, (Q) double pipe
condenser, (R) Parr 4843 temperature controller (TR: temperature controller and indicator, RPM: rpm indicator and manual
adjuster, PR: pressure indicator).
carbonylation process (> 99% based on methanol) using
water contents of 14 - 15 wt. %, was discovered in 1970s [1-3].
The main problems with the Monsanto process are
the catalyst precipitation under low CO pressures and the
downstream separation costs related to high water content
to achieve higher activity and selectivity. On the contrary,
this high water content increases the by-products formed
through water gas shift reaction
3 3CH OH CO CH COOH+ → (1)
Based on the Monsanto process, Celanese Corporation
and Daicel Chemical Industries used lithium and sodium
iodide promoters (ca. 20 wt. %) to carry out methanol
carbonylation at low water concentrations about 2 wt. % [4-5].
In recent studies [6-8], in the low water carbonylation of
methanol to acetic acid, the use of new promoters with
low contents (ca. 0.3 - 4 wt. %) has been studied.
Although methanol carbonylation has been studied
in literature and its mechanism is well-established [9],
this study led to useful results that were mostly ignored
by researchers including a comprehensive and systematic
study of simultaneous effects of operating conditions and
the thermodynamic restrictions on the reaction. It should be
noted that the rate constant will be seriously in error
if the independency of the rate data on the CO partial
pressure and on the thermodynamic restrictions is not taken
into account.
The determination of reaction rate parameters,
equilibrium constants, CO solubility and rate constant,
can give rise to develop a reaction rate expression that
could be used to design and to scale up the process.
So can the study of the determined parameters in the reaction
modeling and simulation by commercial simulators such
as HYSYS.Plant. Because of the lack of information
on homogeneous catalysts in this field, this study focuses
on the kinetics of the homogeneous Rh-catalyzed methanol
carbonylation (CH3I: promoter; water content: ~ 11 wt. %)
using experimental tests and applying theoretical methods
such as ab initio method with the help of Gaussian-98
program.
In the following section, the experimental apparatus
of the research are discussed. Then, the kinetics, modeling and
simulation of the carbonylation of methanol are developed.
EXPERIMENTAL SECTION
The schematic diagram of the system used in this
study is shown in Fig. 1. The experiments were performed
in a semi-batch manner and carried out by using a 450 cm3
hastelloy C autoclave (Model 4562, Parr Instrument Co.,
Moline, IL), equipped with a magnetically driven stirrer
�
Iran. J. Chem. Chem. Eng. Kinetic Study, Modeling and Simulation of ... Vol. 31, No. 1, 2012
59
with a four-blade 45° pitched turbine impeller of 3.4 cm
diameter and a variable speed motor allowing for speeds
up to 1300 rpm along with liquid injection facility and
an internal water-cooling loop. The equipment was provided
with an automatic temperature control and a pressure
transducer with a precision of ±7 kPa. The temperature of
the liquid in the reactor was controlled within ±1K.
The catalyst (RhCl3.3H2O) was analytical reagent grade
and was purchased from Merck. Methyl acetate (MeOAc)
as the substrate, acetic acid (AcOH) as the solvent for
reaction and methyl iodide as promoter with a purity
above 98%, procured from Merck, were used as received.
A carbon monoxide supply (99.5%, Linda) to the
autoclave was provided from a reservoir.
Reaction rate is determined from the consumption rate
of CO which is frequently used to run a kinetic study or
check the activity of the employed catalyst in a gas-liquid
system in the literature [10-12]. In a typical carbonylation
experiment, the autoclave was charged with 250 grams of
reaction solution in Table 1. After sealing, the autoclave
was pressure tested and purged three times with 3 - 5 bar
of CO. The reactor pressure was then raised to 5 bar, and
by slow stirring (150 rpm), was heated to the specified
temperature. Once the reaction temperature was reached,
the autoclave was pressurized to the specified pressure.
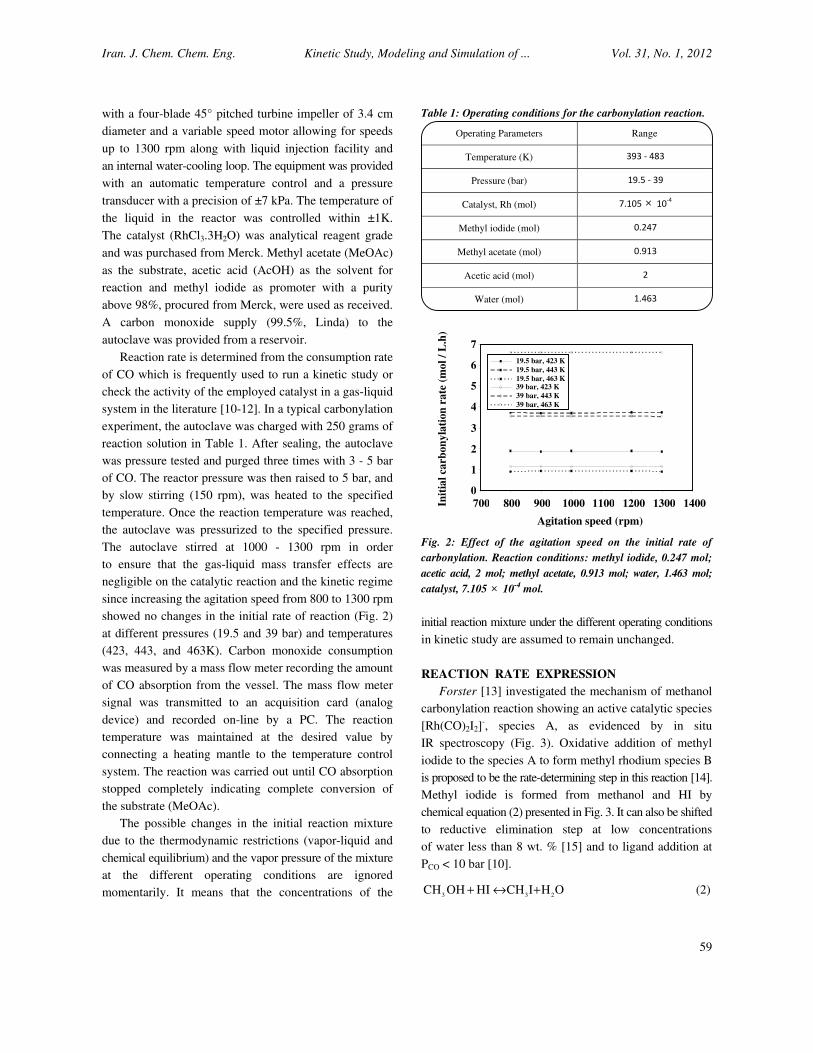
The autoclave stirred at 1000 - 1300 rpm in order
to ensure that the gas-liquid mass transfer effects are
negligible on the catalytic reaction and the kinetic regime
since increasing the agitation speed from 800 to 1300 rpm
showed no changes in the initial rate of reaction (Fig. 2)
at different pressures (19.5 and 39 bar) and temperatures
(423, 443, and 463K). Carbon monoxide consumption
was measured by a mass flow meter recording the amount
of CO absorption from the vessel. The mass flow meter
signal was transmitted to an acquisition card (analog
device) and recorded on-line by a PC. The reaction
temperature was maintained at the desired value by
connecting a heating mantle to the temperature control
system. The reaction was carried out until CO absorption
stopped completely indicating complete conversion of
the substrate (MeOAc).
The possible changes in the initial reaction mixture
due to the thermodynamic restrictions (vapor-liquid and
chemical equilibrium) and the vapor pressure of the mixture
at the different operating conditions are ignored
momentarily. It means that the concentrations of the
Table 1: Operating conditions for the carbonylation reaction.
Operating Parameters Range
Temperature (K) ����������
Pressure (bar) ���������
Catalyst, Rh (mol) ����× ������
Methyl iodide (mol) �����
Methyl acetate (mol) ������
Acetic acid (mol) ��
Water (mol) ��� ��
Fig. 2: Effect of the agitation speed on the initial rate of
carbonylation. Reaction conditions: methyl iodide, 0.247 mol;
acetic acid, 2 mol; methyl acetate, 0.913 mol; water, 1.463 mol;
catalyst, 7.105 × 10⁻⁴ mol.
initial reaction mixture under the different operating conditions
in kinetic study are assumed to remain unchanged.
REACTION RATE EXPRESSION
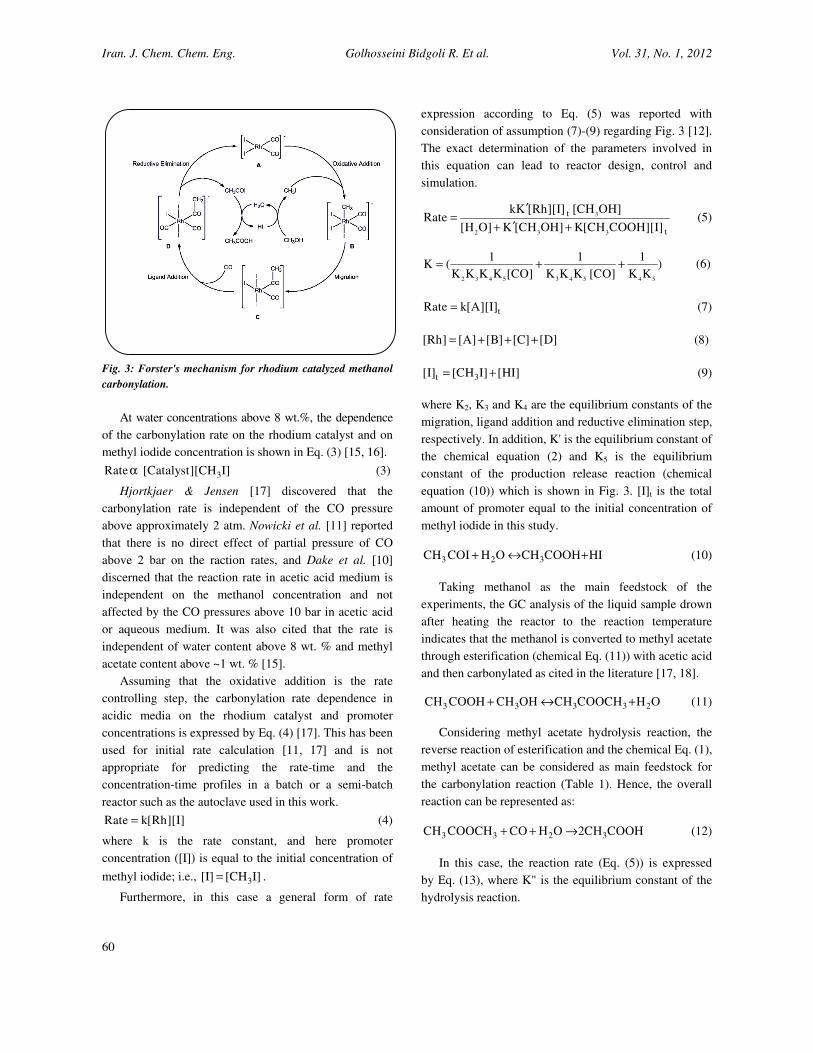
Forster [13] investigated the mechanism of methanol
carbonylation reaction showing an active catalytic species
[Rh(CO)2I2]-, species A, as evidenced by in situ
IR spectroscopy (Fig. 3). Oxidative addition of methyl
iodide to the species A to form methyl rhodium species B
is proposed to be the rate-determining step in this reaction [14].
Methyl iodide is formed from methanol and HI by
chemical equation (2) presented in Fig. 3. It can also be shifted
to reductive elimination step at low concentrations
of water less than 8 wt. % [15] and to ligand addition at
PCO < 10 bar [10].
3 3 2CH OH HI CH I H O+ ↔ + (2)
0
1
2
3
4
5
6
7
700 800 900 1000 1100 1200 1300 1400
Agitation speed (rpm)
Init
ial
carb
on
yla
tion
ra
te (
mo
l /
L.h
)
19.5 bar, 423 K
19.5 bar, 443 K
19.5 bar, 463 K 39 bar, 423 K
39 bar, 443 K
39 bar, 463 K
Iran. J. Chem. Chem. Eng. Golhosseini Bidgoli R. Et al. Vol. 31, No. 1, 2012
60
Fig. 3: Forster's mechanism for rhodium catalyzed methanol
carbonylation.
At water concentrations above 8 wt.%, the dependence
of the carbonylation rate on the rhodium catalyst and on
methyl iodide concentration is shown in Eq. (3) [15, 16].
3Rate [Catalyst][CH I]α (3)
Hjortkjaer & Jensen [17] discovered that the
carbonylation rate is independent of the CO pressure
above approximately 2 atm. Nowicki et al. [11] reported
that there is no direct effect of partial pressure of CO
above 2 bar on the raction rates, and Dake et al. [10]
discerned that the reaction rate in acetic acid medium is
independent on the methanol concentration and not
affected by the CO pressures above 10 bar in acetic acid
or aqueous medium. It was also cited that the rate is
independent of water content above 8 wt. % and methyl
acetate content above ~1 wt. % [15].
Assuming that the oxidative addition is the rate
controlling step, the carbonylation rate dependence in
acidic media on the rhodium catalyst and promoter
concentrations is expressed by Eq. (4) [17]. This has been
used for initial rate calculation [11, 17] and is not
appropriate for predicting the rate-time and the
concentration-time profiles in a batch or a semi-batch
reactor such as the autoclave used in this work.
Rate k[Rh][I]= (4)
where k is the rate constant, and here promoter
concentration ([I]) is equal to the initial concentration of
methyl iodide; i.e., 3[I] [CH I]= .
Furthermore, in this case a general form of rate
expression according to Eq. (5) was reported with
consideration of assumption (7)-(9) regarding Fig. 3 [12].
The exact determination of the parameters involved in
this equation can lead to reactor design, control and
simulation.
3
2 3 3
t
t
kK [Rh][I] [CH OH]Rate
[H O] K [CH OH] K[CH COOH][I]
′=
′+ + (5)
2 3 4 5 3 4 5 4 5
1 1 1K ( )
K K K K [CO] K K K [CO] K K= + + (6)
tRate k[A][I]= (7)
[Rh] [A] [B] [C] [D]= + + + (8)
t 3[I] [CH I] [HI]= + (9)
where K2, K3 and K4 are the equilibrium constants of the
migration, ligand addition and reductive elimination step,
respectively. In addition, K' is the equilibrium constant of
the chemical equation (2) and K5 is the equilibrium
constant of the production release reaction (chemical
equation (10)) which is shown in Fig. 3. [I]t is the total
amount of promoter equal to the initial concentration of
methyl iodide in this study.
3 2 3CH COI H O CH COOH HI+ ↔ + (10)
Taking methanol as the main feedstock of the
experiments, the GC analysis of the liquid sample drown
after heating the reactor to the reaction temperature
indicates that the methanol is converted to methyl acetate
through esterification (chemical Eq. (11)) with acetic acid
and then carbonylated as cited in the literature [17, 18].
3 3 3 3 2CH COOH CH OH CH COOCH H O+ ↔ + (11)
Considering methyl acetate hydrolysis reaction, the
reverse reaction of esterification and the chemical Eq. (1),
methyl acetate can be considered as main feedstock for
the carbonylation reaction (Table 1). Hence, the overall
reaction can be represented as:
3 3 2 3CH COOCH CO H O 2CH COOH+ + → (12)
In this case, the reaction rate (Eq. (5)) is expressed
by Eq. (13), where K" is the equilibrium constant of the
hydrolysis reaction.
Iran. J. Chem. Chem. Eng. Kinetic Study, Modeling and Simulation of ... Vol. 31, No. 1, 2012
61
3
3CH COOH
d([CH COOH])Rate
dt= = (13)
3 3 2
2
2 3 2 3 3 3
t
t
kKK[CHCOOCH ][H O][Rh][I]
([H O][CHCOOH] KK[H O][CH COOCH ] K[CHCOOH] [I] )
′ ′′
′ ′′+ +
RESULTS AND DISCUSSION
Thermodynamic study of the reaction
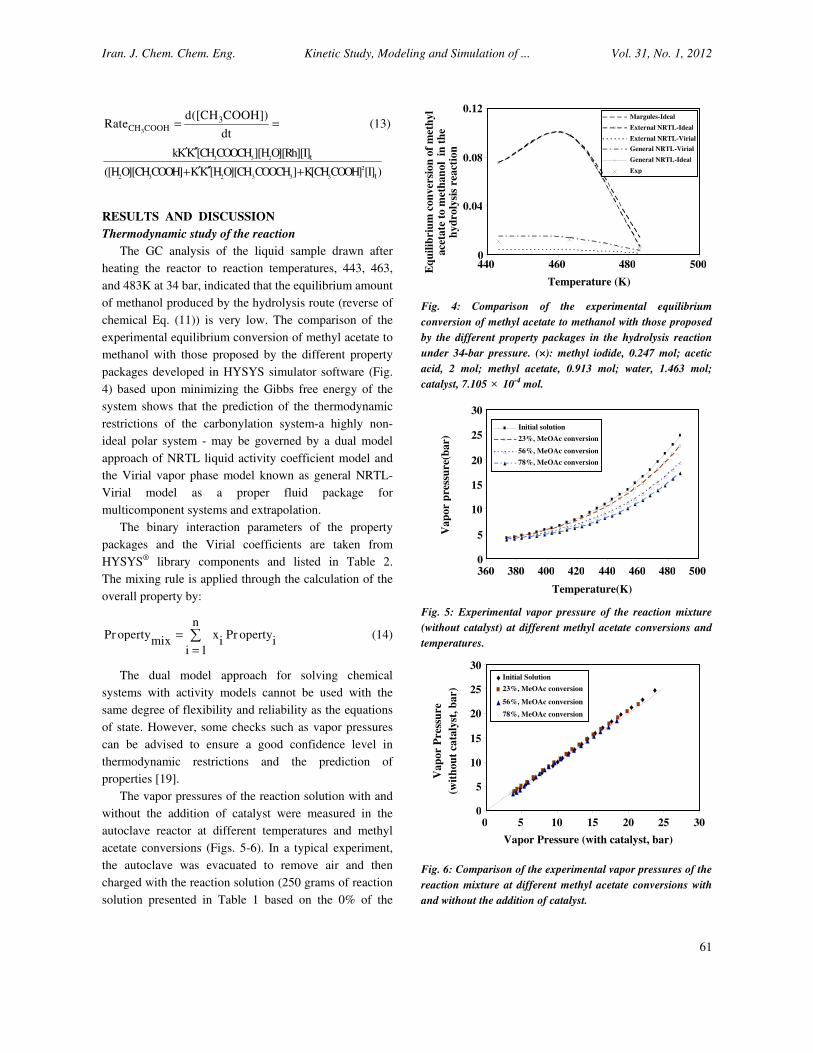
The GC analysis of the liquid sample drawn after
heating the reactor to reaction temperatures, 443, 463,
and 483K at 34 bar, indicated that the equilibrium amount
of methanol produced by the hydrolysis route (reverse of
chemical Eq. (11)) is very low. The comparison of the
experimental equilibrium conversion of methyl acetate to
methanol with those proposed by the different property
packages developed in HYSYS simulator software (Fig.
4) based upon minimizing the Gibbs free energy of the
system shows that the prediction of the thermodynamic
restrictions of the carbonylation system-a highly non-
ideal polar system - may be governed by a dual model
approach of NRTL liquid activity coefficient model and
the Virial vapor phase model known as general NRTL-
Virial model as a proper fluid package for
multicomponent systems and extrapolation.
The binary interaction parameters of the property
packages and the Virial coefficients are taken from
HYSYS® library components and listed in Table 2.
The mixing rule is applied through the calculation of the
overall property by:
nPr operty x Pr operty
mix i ii 1
=
=� (14)
The dual model approach for solving chemical
systems with activity models cannot be used with the
same degree of flexibility and reliability as the equations
of state. However, some checks such as vapor pressures
can be advised to ensure a good confidence level in
thermodynamic restrictions and the prediction of
properties [19].
The vapor pressures of the reaction solution with and
without the addition of catalyst were measured in the
autoclave reactor at different temperatures and methyl
acetate conversions (Figs. 5-6). In a typical experiment,
the autoclave was evacuated to remove air and then
charged with the reaction solution (250 grams of reaction
solution presented in Table 1 based on the 0% of the
Fig. 4: Comparison of the experimental equilibrium
conversion of methyl acetate to methanol with those proposed
by the different property packages in the hydrolysis reaction
under 34-bar pressure. (×): methyl iodide, 0.247 mol; acetic
acid, 2 mol; methyl acetate, 0.913 mol; water, 1.463 mol;
catalyst, 7.105 × 10⁻⁴ mol.
Fig. 5: Experimental vapor pressure of the reaction mixture
(without catalyst) at different methyl acetate conversions and
temperatures.
Fig. 6: Comparison of the experimental vapor pressures of the
reaction mixture at different methyl acetate conversions with
and without the addition of catalyst.
440 460 480 500
Temperature (K)
Eq
uil
ibri
um
con
ver
sio
n o
f m
eth
yl
ace
tate
to m
eth
an
ol
in
th
e
hyd
roly
sis
react
ion
0
0.04
0.08
0.12 Margules-Ideal
External NRTL-Ideal
External NRTL-Virial
General NRTL-Virial
General NRTL-Ideal
Exp
0
10
15
20
25
30
360 380 400 420 440 460 480 500
Temperature(K)
Va
por
pre
ssu
re(b
ar)
5
Initial solution
23%, MeOAc conversion
56%, MeOAc conversion
78%, MeOAc conversion
20
25
30
Vapor Pressure (with catalyst, bar)
Vap
or
Pre
ssu
re
(wit
hou
t ca
taly
st, b
ar)
10
15
0 5 10 15 20 25 30
Initial Solution
23%, MeOAc conversion
56%, MeOAc conversion
78%, MeOAc conversion
0
5

Iran. J. Chem. Chem. Eng. Golhosseini Bidgoli R. Et al. Vol. 31, No. 1, 2012
62
Table 2: Parameters of the property packages used in the determination of the equilibrium conversion
of methyl acetate to methanol. aGeneral NRTL model, bExtended NRTL model, cMargules model, dVirial model. i
j
AcOH MeOAc MeOH CH3I H2O CO
A B �1 A B �1 A B �1 A B �1 A B �1 A B �1
AcOH
a 0 0 0 0 -320.073 0.360 0 -109.290 0.305 0 0 0 0 -110.597 0.300 0 0 0
b 0 0 0 -635.890 0 0.360 -217.126 0 0.305 0 0 0 -219.724 0 0.300 0 0 0
c 0 0 - 0.4074 0 - -0.4183 0 - 0 0 - 0.7819 0 - 0 0 -
d - 4.5 - - 2 - - 2.5 - - 0 - - 2.5 - - 0 -
MeOAc
a 0 613.514 0.360 0 0 0 0 146.148 0.296 0 0 0 0 442.511 0.383 0 0 0
b 1218.869 0 360 0 0 0 290.353 0 0.296 0 0 0 879.137 0 0.383 0 0 0
c 0.003 0 - 0 0 - 1.056 0 - 0 0 - 3.121 0 - 0 0 -
d - 2 - - 0.85 - - 1.3 - - 0 - - 1.3 - - 0 -
MeOH
a 0 8.379 0.305 0 223.432 0.296 0 0 0 0 0 0 0 -24.499 0.300 -4.052 -0.004 0
b 16.646 0 0.305 443.893 0 0.296 0 0 0 0 0 0 -48.673 0 0.300 -4.052 -0.004 0
c -0.2101 0 - 0.9988 0 - 0 0 - 0 0 - 0.7611 0 - 0 0 -
d - 2.5 - - 1.3 - - 1.6297 - - 0 - - 1.55 - - 0 -
CH3I
a 0 0 0 0 0 0 0 0 0 0 0 0 0 0 0 0 0 0
b 0 0 0 0 0 0 0 0 0 0 0 0 0 0 0 0 0 0
c 0 0 - 0 0 - 0 0 - 0 0 - 0 0 - 0 0 -
d - 0 - - 0 - - 0 - - 0 - - 0 - - 0 -
H2O
a 0 424.124 0.300 0 860.466 0.383 0 307.245 0.300 0 0 0 0 0 0 -12385 0 0
b 842.608 0 0.300 1709.488 0 0.383 610.403 0 0.300 0 0 0 0 0 0 -12385 0 0
c 0.4748 0 - 2.110 0 - 0.6207 0 - 0 0 - 0 0 - 0 0 -
d - 2.5 - - 1.3 - - 1.55 - - 0 - - 1.7 - - 0 -
CO
a 0 0 0 0 0 0 13.873 -0.029 0 0 0 0 266.360 -36.713 0 0 0 0
b 0 0 0 0 0 0 13.873 -0.029 0 0 0 0 266.360 -36.713 0 0 0 0
c 0 0 - 0 0 - 0 0 - 0 0 - 0 0 - 0 0 -
d - 0 - - 0 - - 0 - - 0 - - 0 - - 0 -
a, b)
exp(-
exp(-
(
exp(-
exp(-
exp(-
exp(-
ln
1
1
1
11
1
�
����
�
=
=
=
==
=
)
)
−
)
)+
)
)
=n
k
kjkjk
n
m
mjmjmmj
ij
n
jn
k
kjkjk
ijijj
n
k
kikik
n
j
jijijji
i
x
x
x
x
x
x
ατ
αττ
τ
ατ
ατ
ατ
αττ
γ, c ))(2(
2)1(ln
iA
iB
ixiA
ixi −+−=γ ,
dB = second Virial coefficient (m3/mol).
where:
a
T
ijB
ijAij +=τ , ij1ij α=α . (Aij: cal/gmol, Bij: cal K/gmol)
b)15.273T(ijBijAij −+=τ , ij1ij α=α . (Aij: cal/gmol, Bij: cal/gmol K)
c�= −
+=
n
1j )ix1(
)TijBijA(
jxiA , �= −
+=
n
1j )ix1(
)TjiBjiA(
jxiB . (Bij, Bji: 1/K
Iran. J. Chem. Chem. Eng. Kinetic Study, Modeling and Simulation of ... Vol. 31, No. 1, 2012
63
methyl acetate conversion and the rest conversion
percentages, i.e., 23%, 56%, and 78%, based on the
stoichiometry of overall reaction). After sealing,
the contents were heated to the desired temperature
and then stirred at 1000 rpm for about 10 min
to equilibrate the liquid phase with the vapor. The changes
of pressure in the autoclave were recorded on-line
as a function of time until it remained constant, indicating
vapor pressure of the solution. At the end of the
experiments and cooling of the reactor, GC analysis
of the liquid and gas phases was carried out which
indicated nearly the same weight percentages of the
initial liquid reaction solutions (±0.2%) and traces
less than 0.5% of air in the gas phase. The weight of the
reactor contents in the experiments was also nearly the same
as those values of the initial solution (-1%).
Since the effect of catalyst on the vapor pressure of
the reaction mixture is negligible at different
temperatures and methyl acetate conversions (shown in
Fig. 6), the solid catalyst is not considered in vapor
pressure calculations by the general NRTL-Virial model.
A good agreement between the experimental and
proposed data was found (see Fig. 7) by checking the
vapor pressure of the reaction mixture over different
temperatures and conversions of methyl acetate.
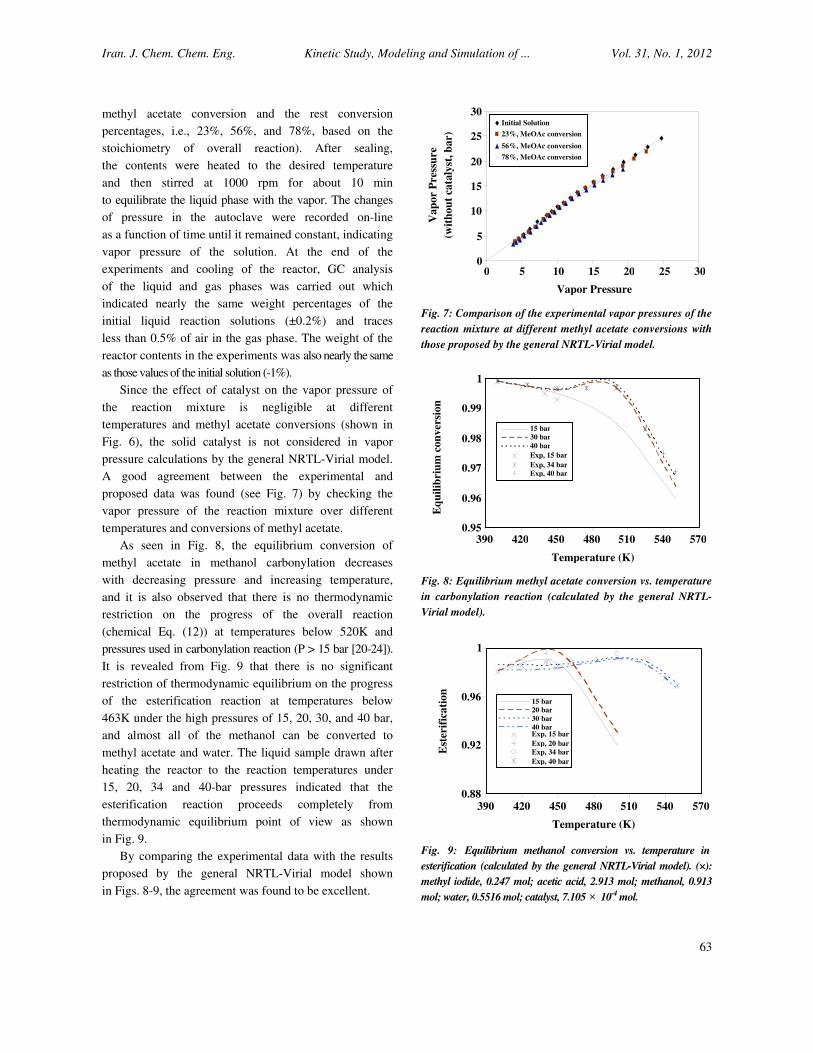
As seen in Fig. 8, the equilibrium conversion of
methyl acetate in methanol carbonylation decreases
with decreasing pressure and increasing temperature,
and it is also observed that there is no thermodynamic
restriction on the progress of the overall reaction
(chemical Eq. (12)) at temperatures below 520K and
pressures used in carbonylation reaction (P > 15 bar [20-24]).
It is revealed from Fig. 9 that there is no significant
restriction of thermodynamic equilibrium on the progress
of the esterification reaction at temperatures below
463K under the high pressures of 15, 20, 30, and 40 bar,
and almost all of the methanol can be converted to
methyl acetate and water. The liquid sample drawn after
heating the reactor to the reaction temperatures under
15, 20, 34 and 40-bar pressures indicated that the
esterification reaction proceeds completely from
thermodynamic equilibrium point of view as shown
in Fig. 9.
By comparing the experimental data with the results
proposed by the general NRTL-Virial model shown
in Figs. 8-9, the agreement was found to be excellent.
Fig. 7: Comparison of the experimental vapor pressures of the
reaction mixture at different methyl acetate conversions with
those proposed by the general NRTL-Virial model.
Fig. 8: Equilibrium methyl acetate conversion vs. temperature
in� carbonylation reaction (calculated by the general NRTL-
Virial model).
Fig. 9: Equilibrium methanol conversion vs. temperature in�
esterification (calculated by the general NRTL-Virial model). (×):
methyl iodide, 0.247 mol; acetic acid, 2.913 mol; methanol, 0.913
mol; water, 0.5516 mol; catalyst, 7.105 × 10⁻⁴ mol.
0 5 10 15 20 25 30
Vapor Pressure
Va
po
r P
ress
ure
(wit
ho
ut
cata
lyst
, b
ar)
20
25
30 Initial Solution
23%, MeOAc conversion
56%, MeOAc conversion
78%, MeOAc conversion
0
5
10
15
0.95
0.96
0.97
0.98
0.99
390 420 450 480 510 540 570
Temperature (K)
Eq
uil
ibri
um
con
ver
sio
n
1
15 bar
30 bar
40 bar
Exp, 15 bar
Exp, 34 bar
Exp, 40 bar
0.88
0.92
0.96
1
390 420 450 480 510 540 570
Temperature (K)
Est
erif
ica
tio
n
30 bar
40 bar Exp, 15 bar
Exp, 20 bar
Exp, 34 bar
Exp, 40 bar
15 bar
20 bar
Iran. J. Chem. Chem. Eng. Golhosseini Bidgoli R. Et al. Vol. 31, No. 1, 2012
64
Table 3: Normal operating range of the carbonylation process cited in the patents.
Operating Conditions Reference
Temperature (K) Pressure CO Partial Pressure
443 - 473 28 – 70 (bar) 11 – 56 (bar) [20]
453 - 493 15 – 45 (atm) 2 – 30 (atm) , preferably: 4 – 15 [21-23]
453 - 493 15 – 40 (atm) 2 – 30 (atm) , preferably: 3 – 10 [24]
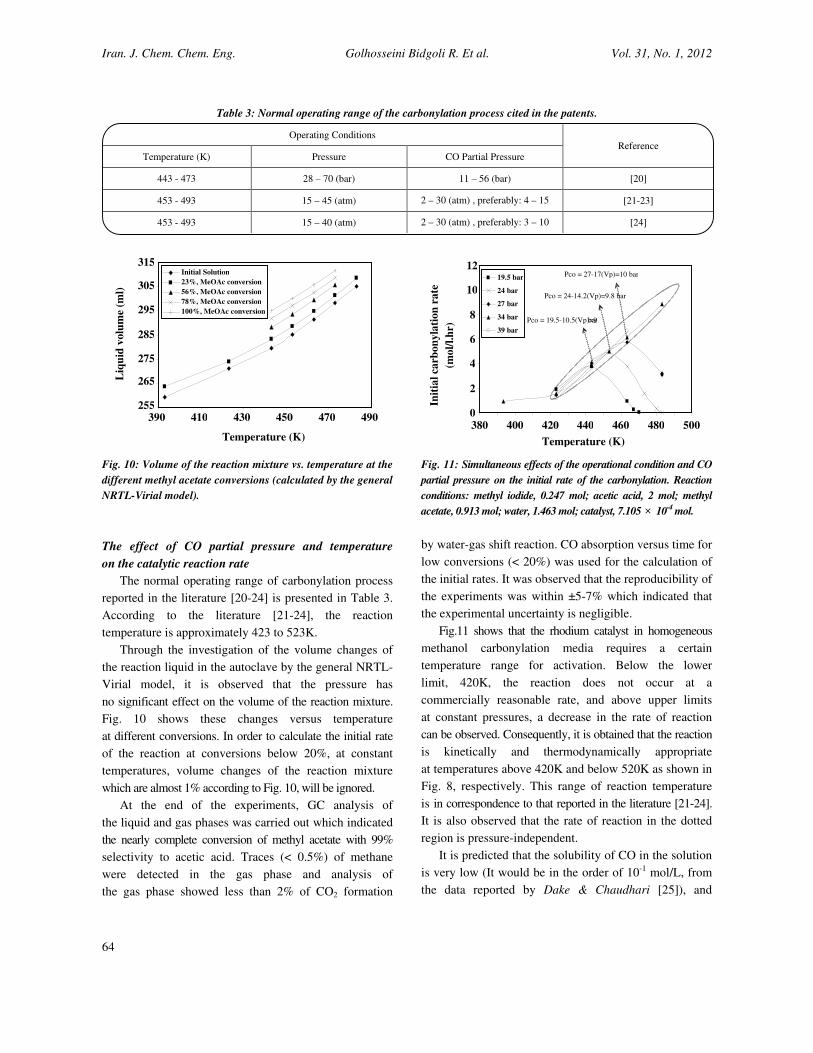
Fig. 10: Volume of the reaction mixture vs. temperature at the
different methyl acetate conversions (calculated by the general
NRTL-Virial model).
The effect of CO partial pressure and temperature
on the catalytic reaction rate
The normal operating range of carbonylation process
reported in the literature [20-24] is presented in Table 3.
According to the literature [21-24], the reaction
temperature is approximately 423 to 523K.
Through the investigation of the volume changes of
the reaction liquid in the autoclave by the general NRTL-
Virial model, it is observed that the pressure has
no significant effect on the volume of the reaction mixture.
Fig. 10 shows these changes versus temperature
at different conversions. In order to calculate the initial rate
of the reaction at conversions below 20%, at constant
temperatures, volume changes of the reaction mixture
which are almost 1% according to Fig. 10, will be ignored.
At the end of the experiments, GC analysis of
the liquid and gas phases was carried out which indicated
the nearly complete conversion of methyl acetate with 99%
selectivity to acetic acid. Traces (< 0.5%) of methane
were detected in the gas phase and analysis of
the gas phase showed less than 2% of CO2 formation
Fig. 11: Simultaneous effects of the operational condition and CO
partial pressure on the initial rate of the carbonylation. Reaction
conditions: methyl iodide, 0.247 mol; acetic acid, 2 mol; methyl
acetate, 0.913 mol; water, 1.463 mol; catalyst, 7.105 × 10⁻⁴ mol.
by water-gas shift reaction. CO absorption versus time for
low conversions (< 20%) was used for the calculation of
the initial rates. It was observed that the reproducibility of
the experiments was within ±5-7% which indicated that
the experimental uncertainty is negligible.
Fig.11 shows that the rhodium catalyst in homogeneous
methanol carbonylation media requires a certain
temperature range for activation. Below the lower
limit, 420K, the reaction does not occur at a
commercially reasonable rate, and above upper limits
at constant pressures, a decrease in the rate of reaction
can be observed. Consequently, it is obtained that the reaction
is kinetically and thermodynamically appropriate
at temperatures above 420K and below 520K as shown in
Fig. 8, respectively. This range of reaction temperature
is in correspondence to that reported in the literature [21-24].
It is also observed that the rate of reaction in the dotted
region is pressure-independent.
It is predicted that the solubility of CO in the solution
is very low (It would be in the order of 10-1 mol/L, from
the data reported by Dake & Chaudhari [25]), and
255
265
275
285
295
305
315
390 410 430 450 470 490
Temperature (K)
Liq
uid
volu
me
(ml)
Initial Solution
23%, MeOAc conversion
56%, MeOAc conversion
78%, MeOAc conversion
100%, MeOAc conversion
10
12
380 400 420 440 460 480 500
Temperature (K) In
itia
l ca
rbon
yla
tion
ra
te
(mo
l/l.
hr)
0
2
4
6
8
19.5 bar 24 bar 27 bar 34 bar 39 bar
Pco = 27-17(Vp)=10 bar
Pco = 19.5-10.5(Vp)=9 bar
Pco = 24-14.2(Vp)=9.8 bar
Iran. J. Chem. Chem. Eng. Kinetic Study, Modeling and Simulation of ... Vol. 31, No. 1, 2012
65
the activity coefficient of the solution is assumed very close
to unity at low solubilities. Hence, CO partial pressure
can be calculated from the total pressure (P), vapor
pressure of the pure solution (P*, measured and shown in
Fig. 5) and the mole fraction of dissolved carbon
monoxide (x, which is minor) with the aid of Raoult’s
law. Thus, the CO partial pressure (PCO) is given by:
COP P P*(1 x) P P*= − − ≈ − (15)
As seen in Fig. 11, the temperatures of the maximum
rate points at total pressures 19.5, 24, and 27 bar are 443,
453, and 463K, respectively. At these points, if the vapor
pressures of the initial reaction mixture shown in Fig. 5,
10.5, 14.2, and 17 bar, respectively, are deducted from
the corresponding total pressures, according to Eq. (15),
it is estimated that the CO partial pressure varies from
9 to 10 bar. At temperatures below the maximum rate
temperatures, with the PCO > 9 - 10 bar, the reaction rate
is independent of the pressure. Consequently, the reaction
rate is independent of the CO partial pressure above
approximately 10 bar as reported by Dake et al. [10]
(PCO > 10 bar at T = 423, 433, and 444K). It is also
observed from Fig. 11 that the decrease in rate of reaction
with an increase in the temperature at constant total
pressures, is due to the reduction in CO partial pressure
which changes the rate-determining step (ligand addition
step at PCO < 10 bar and oxidative addition at PCO > 10 bar) [10].
Fig. 11 shows that the rate is zero at 19.5 and 24 bar total
pressures at 470 and 483K temperatures, respectively.
As shown in Fig. 5, vapor pressures of the initial reaction
mixture at 470 and 483K are 17.5 bar and 22 bar,
respectively. Thus, in accordance with Eq. (15),
the minimum amount of CO pressure to initialize
the reaction is above 2 bar. It was observed in this case,
if the minimum amount of CO is not satisfied,
precipitating and hence deactivating of the catalyst will
occur. Enough CO addition or temperature decrease
results in catalyst reactivation. The catalyst precipitation
(RhI3) in the pristine industrial carbonylation process
(Monsanto) has been observed in CO deficient areas of
the plant (see chemical equations. (16) and (17)) [15].
3 3 4 3
- -[RhI (CO)(COCH )] HI [RhI (CO)] CH CHO+ → + (16)
4 3
- -[RhI (CO)] RhI I CO→ + + (17)
Fig. 11 is useful to realize the CO partial pressure-
independent behavior of the experiments to determine
the intrinsic rate constant. It should be noted that for
commercial utility, the deactivation rate must be as low
as possible dictating the maximum temperature of the
reaction [26]. Determination of maximum operating
temperature requires a more detailed study beyond the
scope of this paper.
As it was noted before, the use of metal salts in low
contents (ca. 0.3 - 4 wt. %) as new promoters in
carbonylation process has been proposed [6-8]. There is
a strong possibility that the promoters may influence the
way that the pressure and CO partial pressure affect the
rate of reaction. This subject is under investigation.
Determination of the equilibrium, rate and Henry’s law
constants
The Density Functional Theory (DFT) previously used
in methanol carbonylation [27-30] with the hybrid
B3LYP exchange and correlation functional [31,32]
is used to obtain the K2, K3, K4, and K5 equilibrium
constants (see Eq. (6)) under Effective Core Potential (ECP)
approximation [33]. The geometries of the reactants,
intermediates, transition states and the product for
carbonylation catalyzed by cis-[Rh(CO)2I2]-, as shown in
Fig. 3, were optimized by B3LYP/SDD level chemistry.
The SDD basis set includes D95V for carbon, oxygen and
hydrogen atoms. The Stuttgart/Dresden effective core
potentials along with the scalar relativistic corrections
have been used for rhodium and the halogen. Changes of
the Gibbs free reaction energy (�G) of the gas phase were
calculated considering zero-point energies, thermal
motion, and entropy contributions at 443, 463, and 473K
temperatures under 34 bar pressure. All of the
calculations were performed using Gaussian 98 suite
program package [34]. The theoretical results of the
equilibrium constants were fitted with temperature and
are presented in Table 4.
It should be noted that to calculate the thermodynamic
properties from the computational calculations, there are
different Level Chemistries such as DFT, Post-HF (MP2,
MP4, …), HF and etc. From which the DFT method
as one of the most up to date and developed ones in the
recent decade was used in our study. Among basis
functions, SDD was chosen thanks to its closeness to our
studied catalysis cycle (Fig. 3), though other basis
functions such as LANL2DZ could be used.
Iran. J. Chem. Chem. Eng. Golhosseini Bidgoli R. Et al. Vol. 31, No. 1, 2012
66
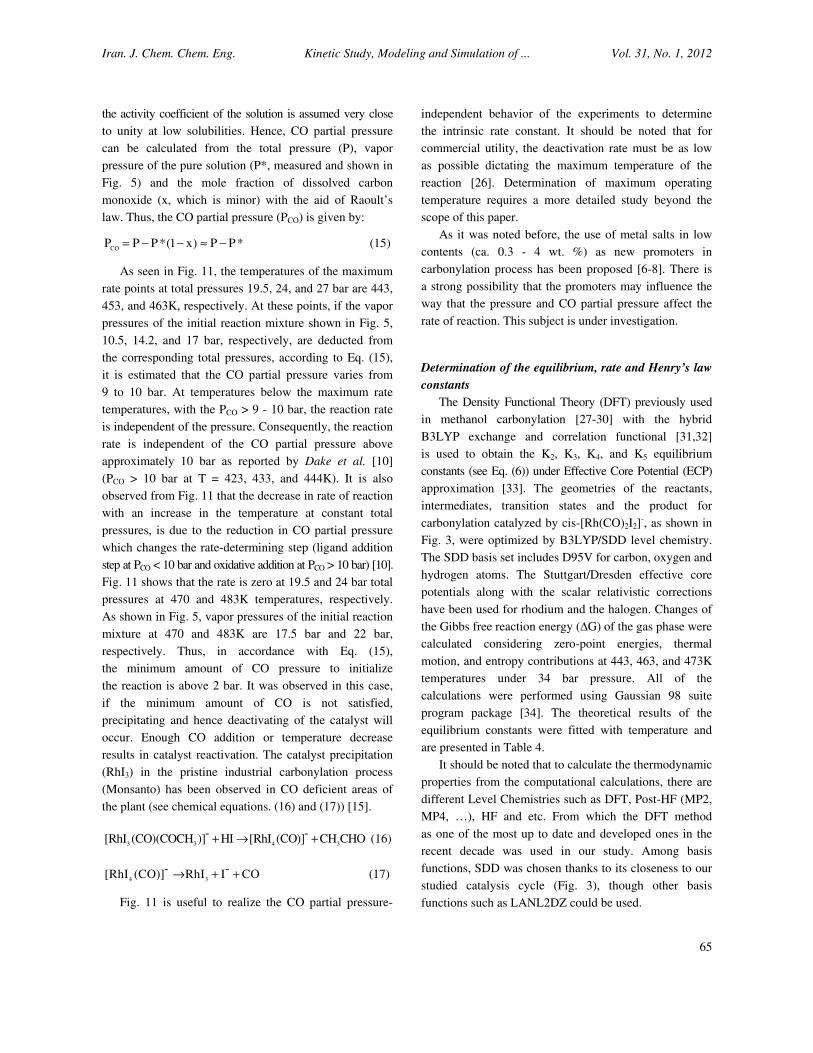
Table 4: Equilibrium constants of the migration (K2 ), ligand addition (K3), reductive elimination (K4) and the production release
reaction (K5) steps estimated by Gaussian 98 suite program package. (�G = �H – T�S, K = exp (-�G/RT)).
Equilibrium
constants
T(K) Logarithmic function of the equilibrium constants
443 463 473
K2 691686.40 407022.90 317310.80 3.19 exp(45266.15/ RT)
K3 5.06 2.60 1.91 (1.08 × 10⁻⁶) exp(56588.12/ RT)
K4 1844.74 2432.90 2761.26 (1.07 × 10 6) exp(-23435.92/ RT)
K5 179473.90 111566.20 89387.83 3 exp(40525.22/ RT)
Table 5: Initial rates of the carbonylation reaction of methanol at 34 bar. Reaction conditions: methyl iodide, 0.247 mol;
acetic acid, 2 mol; methyl acetate, 0.913 mol; water, 1.463 mol; catalyst, 7.105 × 10⁻⁴ mol.
No. [AcOH](mol/l) [MeOAc](mol/l) [H2O](mol/l) [Rh]*104(mol/l) [CH3I](mol/l) X PCO(kPas) T(K) Rate(mol/l.hr)
1 7.16 3.27 5.23 25.33 0.88 0 2156 443 3.8
2 7.29 3.21 5.17 25.33 0.88 0.02 2168 443 3.79
3 7.42 3.14 5.10 25.33 0.88 0.04 2180 443 3.78
4 7.55 3.08 5.04 25.33 0.88 0.06 2191 443 3.76
5 7.68 3.01 4.97 25.33 0.88 0.08 2203 443 3.74
6 7.81 2.95 4.91 25.33 0.88 0.1 2214 443 3.74
7 7.94 2.88 4.84 25.33 0.88 0.12 2225 443 3.73
8 8.07 2.82 4.78 25.33 0.88 0.14 2236 443 3.72
9 8.20 2.75 4.71 25.33 0.88 0.16 2246 443 3.71
10 8.33 2.69 4.65 25.33 0.88 0.18 2257 443 3.69
11 6.87 3.13 5.02 24.41 0.85 0 1730 463 6.14
12 7.08 3.03 4.92 24.41 0.85 0.03 1753 463 6.11
13 7.28 2.92 4.81 24.41 0.85 0.07 1783 463 6.09
14 7.49 2.82 4.71 24.41 0.85 0.1 1804 463 6.09
15 7.69 2.72 4.61 24.41 0.85 0.13 1826 463 6.06
16 7.90 2.62 4.51 24.41 0.85 0.16 1847 463 6.04
17 8.10 2.51 4.40 24.41 0.85 0.2 1873 463 6.03
18 6.71 3.06 4.91 23.59 0.82 0 1483 473 7.39
19 6.95 2.94 4.79 23.59 0.82 0.04 1517 473 7.4
20 7.20 2.82 4.67 23.59 0.82 0.08 1550 473 7.38
21 7.44 2.69 4.54 23.59 0.82 0.12 1582 473 7.35
22 7.69 2.57 4.42 23.59 0.82 0.16 1613 473 7.32
To determine the solubility of CO in liquid mixture,
Henry’s law was used as Eq. (18).
CO CO[CO] H P= × (18)
Henry’s coefficient for CO (HCO) at different methyl
acetate conversions (X) and temperatures (T) was
determined by using equation (19), previously used by
Dake & Chaudhari [25]:
B 1ln(H ) A C (X) ( ) E ln(1 X)CO T T
= + + + + (19)
To calculate the partial pressure of CO (PCO)
at different methyl acetate conversions and temperatures
in the autoclave, the vapor pressure of the reaction solution
(P*) was measured (shown in Fig. 5). P* in kPas is
expressed by:
P* 8615.172 -39.328 T - 420.331 X= + (20)
2 2 2 5 3- -2.18 10 T - 722.412 X 7.38 X T 6.64 10 T -× + + ×
3 2 2 2-126.03 X 2.27 T X -1.76 10 X T+ ×
By studying (i) the rates of the carbonylation reaction
conducted at 443, 463, and 473K under 34-bar pressure,
(ii) CO partial pressures from Eqs. of (15) and (20),
(iii) determined concentrations of the components during
the reaction based on the stoichiometry of the overall
reaction presented in Table 5 and (iv) the equilibrium
constants obtained by Gaussian 98 presented in Table 4,
the parameters involved in the non-linear rate Eq. (13)
Iran. J. Chem. Chem. Eng. Kinetic Study, Modeling and Simulation of ... Vol. 31, No. 1, 2012
67
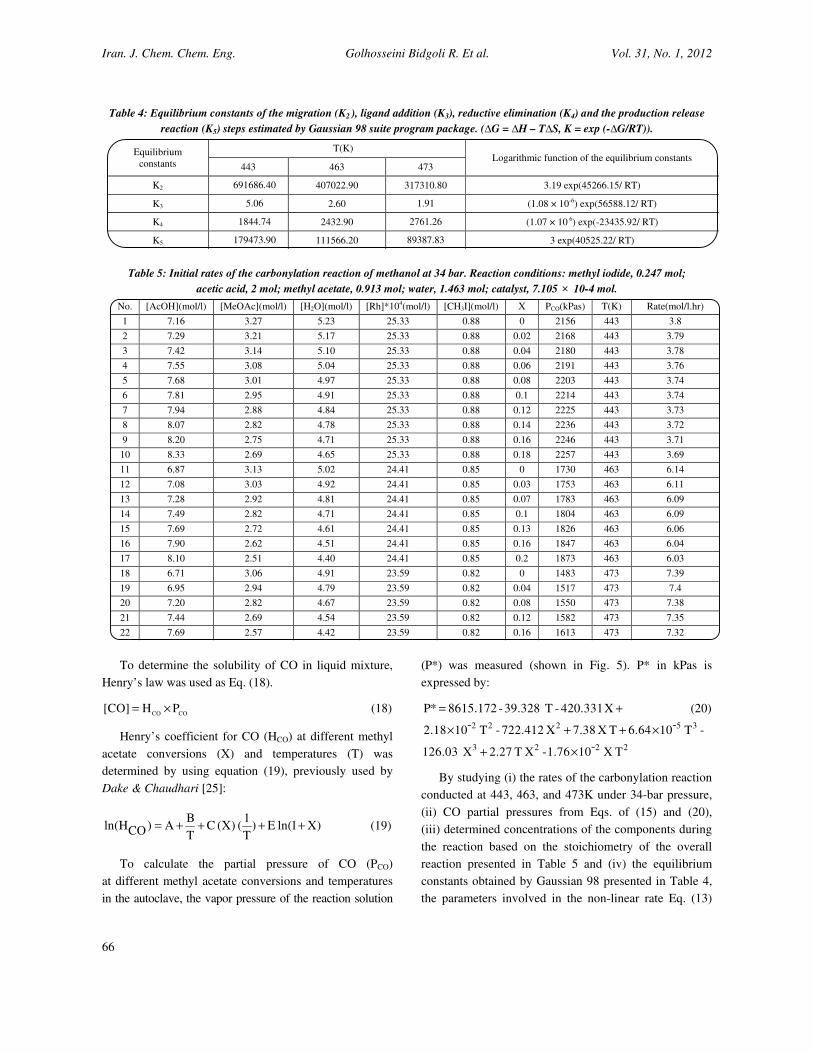
Table 6: The Arrhenius parameters of the rate constant for the carbonylation.
Parameters This work Nowicki et al.�[11]
(raw data) (1992) Nowicki et al.�[11]
(corrected data) (1992) Dake et al. [10]
(1989) Hjortkjaer & Jensen [17]
(1976)
10-6 × k� 859.412 (L/mol. h) 16200 (L/mol. h) 571680 (L/mol. h) 14 (L2/mol2.h) 12600 (L/mol2. h)
E, kJ/mol 48.271 61.2 72.2 68.5 61.7
T, K 443-473 443-470 443-470 423-443 423-498
P, bar 34 22-50 22-50 PCO > 10 -
Fig. 12: Comparison of the experimental and calculated initial
reaction rates.
accompanied with Eqs. (6), (18) and (19) were estimated
via non-linear regression method. Due to the reliability of
the rate Eq. (13) in water contents more than 8 wt. % -
the chemical Eq. (12) consumes water, the data
of the initial rates were used to calculate the parameters.
The data reported by Dake & Chaudhari [25] and
proposed by the general NRTL-Virial model were used to
provide initial guesses for the constants of Eq. (19) and
K�K�, respectively. There is a good agreement between
the experimental and calculated rates as shown in Fig. 12.
The errors between the predicted and experimental rates
were found to be ±%1. Consequently:
6k 859.412 10 exp(-48271.525 / R T)= × (21)
-1K K 6.551 10 exp(2044.439 / T)′ ′′ = × (22)
-)T
1( (X) 237.533 -
T
905.493 - 7.2- =)ln(H
CO (23)
X)+ln(1 0.366
It should be noted that the calculated activation
energy of the reaction (48.271 kJ/mol) is almost the same
as the reported experimental results (50 - 71 kJ/mol [28]).
Table 6 shows a comparison of the pre-exponential
factors (k�) and the activation energies (E) calculated
in the present work with those found in the literature.
The reaction rates given by Nowicki et al. [11]
have been calculated according to temperature from Eq. (4),
and the pressure of none of the tests is clear. The
corrected parameters in the work of Nowicki et al. [11]
(see Table 6) have been determined on the basis of their
result that methyl iodide is almost equimolarly distributed
between the gaseous and liquid phases, but with regard to
our studies by using the general NRTL-Virial model,
it was clear that almost all of the methyl iodide remains
in the liquid phase, reaction phase, in the pressures above
20 bar at the reaction temperatures. In addition, when
water is used as the solvent, the methyl iodide
is distributed between the gaseous and the liquid phases
depending on the vapor-liquid equilibrium [10], but
Nowicki et al. used acetic acid as the solvent which
methyl iodide is infinitely soluble in it [10].
Besides, by using the general NRTL-Virial model,
it was found that at the beginning of the reaction (at 19.5 -
39 bar and 393 - 483K) the weight of vapor phase in the
reactor headspace volume is 4.5 - 7.5 grams. It was also
found that nearly 25 - 85 wt. % is liquid contents
(i.e., ~ 1 - 2.5 wt. % of the initial charge). This amount of
change in the initial charge of the liquid phase will not be
caused to any worth mentioning error in the kinetic study.
As it may be seen from Table 6, the activation energy
given by Dake et al. [10] determined at 423 - 443K
is higher than those obtained by other authors. The normal
operating range as cited in the patents is 443 to 473K [20].
At these conditions, it is observed from Fig. 11 that the
reaction rate is more commercially reasonable.
Unfortunately, Hjortkjaer & Jensen [17] have not
precisely described the pressure conditions of any of the
tests to calculate the values of the reaction rate
parameters from Eq. (4). On the basis of Hjortkjaer and
Jensen’s finding�that the carbonylation rate is
8
1 5 9 13 17 21 25
No.
Init
ial
rea
ctio
n r
ate
(m
ol/
l.h
r)
3
4
5
6
7 Exp
Calculated
Iran. J. Chem. Chem. Eng. Golhosseini Bidgoli R. Et al. Vol. 31, No. 1, 2012
68
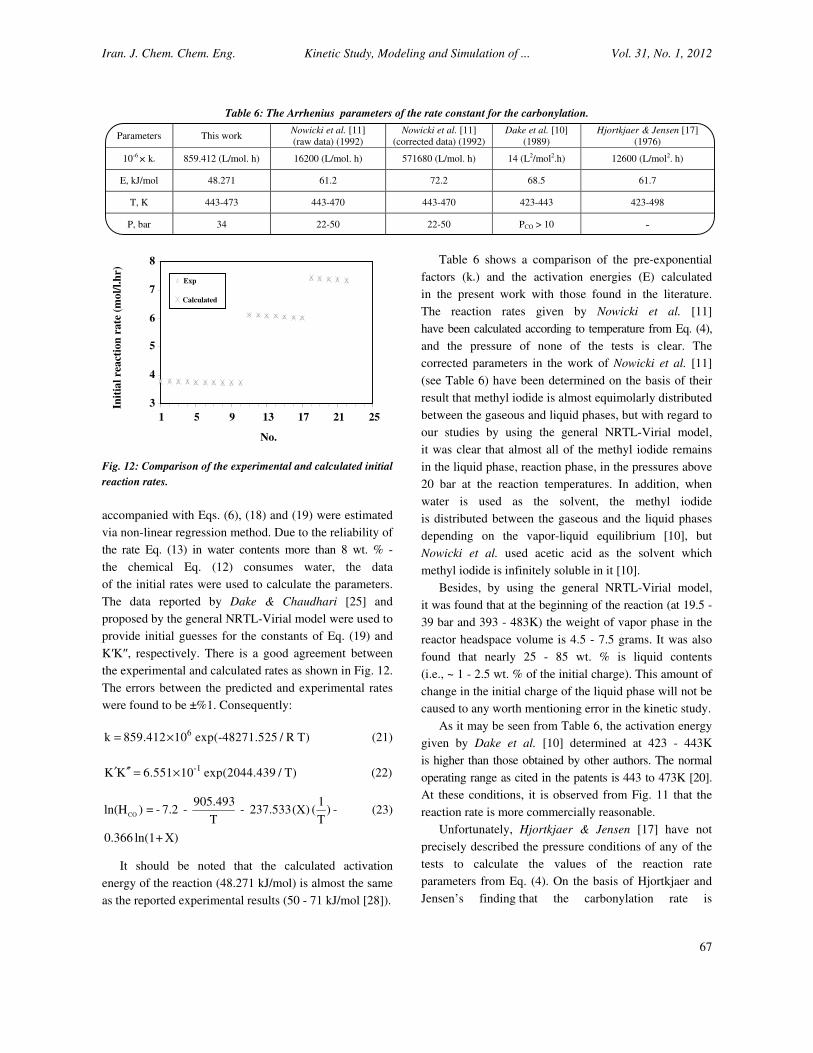
Fig. 13: The reaction rate constants (k) achieved from
the reported raw data by Nowicki et al. (Nowicki et al., 1992).
independent of the CO partial pressure above
approximately 2 atm, their reported parameters may not
be inherent.
As it is seen in Fig. 11, in a constant pressure the
reaction rate is affiliated to the CO partial pressure above
a specific temperature.� In this region, the reaction rate
decreases with increasing the temperature. Therefore,
without paying attention to the CO partial pressure
independency, it may lead to lower rate constant (k) than
the real value. Furthermore, in experiments run under
different total pressures at a constant temperature, with
no regard to the CO partial pressure independency, different
rate constants are found that are related to two different
rate-controlling steps. It is observed in Fig. 13 based on
the reported raw data by Nowicki et al. [11] that this fact
is not noticed at 453 and 456K temperatures. Therefore,
according to the above mentioned issues and their saying�
that the partial pressure of CO has no direct effect on the
reaction rate above 2 bar, their reported parameters
can not be inherent.
Additionally, at the high pressures (P = 30 and 40 bar),
it is clear from Fig. 9 that the equilibrium proceeding of
the esterification reaction is almost independent of
pressure and it can proceed to the right at temperatures
below 520K without any significant restriction, but at
lower pressures, at temperatures above 463K the
proceeding of the reaction is dependent on the pressure
and temperature. In the last operating conditions, after
warming the entering reaction mixture into the reactor,
different amounts of methyl acetate and water
are produced with respect to pressure and temperature.
Consequently, the assumption of equality of the initial
reaction mixture under different operating conditions
cannot still hold in kinetic studies here. However, this
result may not seem so troubling in carbonylation in
acidic media due to the facts that (i) the reaction rate
is independent of methyl acetate at contents above
~ 1 wt. % [15] and not affected by methanol concentration
(reported by Dake et al. [10]) and also (ii) the methanol
is first converted to methyl acetate and water through
esterification with acetic acid and then carbonylated.
Additionally, the concentration of methyl iodide could
possibly change in accordance with the chemical
equilibrium Eq. (2) [10]. The difference in kinetics can be
attributed to changes in the concentration of methyl
iodide as the only reactant which directly affects the
reaction rate in the bulk liquid due to the thermodynamic
restrictions i.e. solubility, vapor-liquid equilibria and
chemical equilibrium. As it was noted, solubility of
methyl iodide and its vapor-liquid equilibrium are not
among thermodynamic restrictions in the kinetic studies
of carbonylation system in acidic media. Moreover,
it has been found that the equilibrium constant of the
reaction strongly favors methyl iodide [35].
Considering the results, it can be concluded that the
effects of the chemical equilibriums under different
operating conditions in our kinetic studies can be safely
assumed negligible.
Comparison of the predicted CO solubility with that
proposed by the general NRTL-virial model
Dake & Chaudhari [25] have reported CO solubility
data over a wide range of temperatures (298K to 448K)
and pressures (10 bar to 80 bar) in different aqueous
mixtures. Kelkar et al. [36] have obtained the solubility
data for CO in acetic acid, methyl acetate, and acetic
acid/methyl acetate mixtures in the temperature range of
433 - 463K at 4.7 - 55 bar partial pressure of CO.
By comparing the CO solubility data predicted by
Eqs. (15), (18), (20) and (23) with those resulted by the
general NRTL-Virial model presented in Table 7,
the agreement was found to be excellent, with the errors
below 11%, even at high conversions where the water
content is lower than 8 wt. %, suggesting that the proposed
formula here for CO solubility can be reliably used for
design and scale up purposes. As expected, the solubility of
CO in the reaction solution is in the order of 10-1 mol/L.
800
1200
1600
2000
2400
2800
440 445 450 455 460 465 470
Temperature (K)
Rate
co
nst
an
t (
k (
l/m
ol.
hr)
)
Iran. J. Chem. Chem. Eng. Kinetic Study, Modeling and Simulation of ... Vol. 31, No. 1, 2012
69
Table 7: Comparison of the predicted CO solubility with that proposed by the general NRTL-Virial model under 34-bar pressure.
MeOAc
Conversion
[CO] (mol/l)
443K 453K 463K 473K
predicted model predicted model predicted model predicted model
0 0.2085 0.1967 0.1977 0.1842 0.1827 0.1702 0.1632 0.1469
0.23 0.1850 0.1869 0.1789 0.1798 0.1695 0.17 0.1566 0.1532
0.56 0.1669 0.1724 0.1659 0.1704 0.1625 0.1667 0.1565 0.1556
0.73 0.1628 0.1628 0.1635 0.1616 0.1621 0.1612 0.1586 0.1544
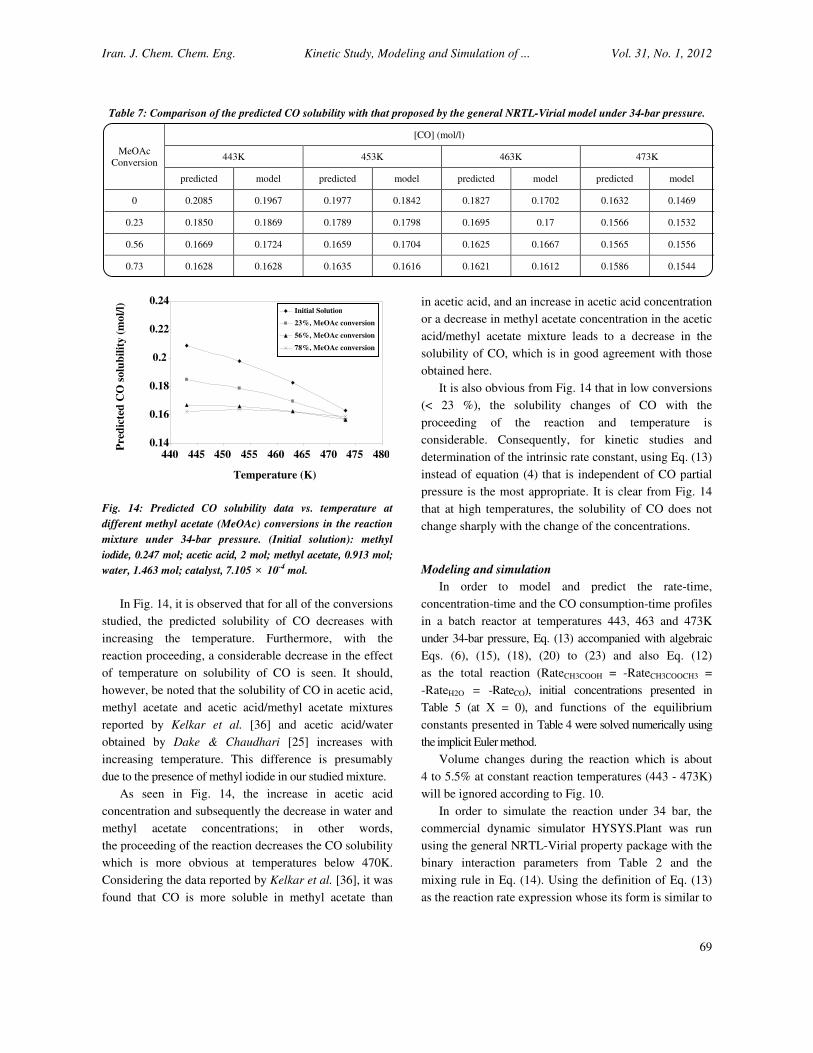
Fig. 14: Predicted CO solubility data vs. temperature at
different methyl acetate (MeOAc) conversions in the reaction
mixture under 34-bar pressure. (Initial solution): methyl
iodide, 0.247 mol; acetic acid, 2 mol; methyl acetate, 0.913 mol;
water, 1.463 mol; catalyst, 7.105 × 10⁻⁴ mol.
In Fig. 14, it is observed that for all of the conversions
studied, the predicted solubility of CO decreases with
increasing the temperature. Furthermore, with the
reaction proceeding, a considerable decrease in the effect
of temperature on solubility of CO is seen. It should,
however, be noted that the solubility of CO in acetic acid,
methyl acetate and acetic acid/methyl acetate mixtures
reported by Kelkar et al. [36] and acetic acid/water
obtained by Dake & Chaudhari [25] increases with
increasing temperature. This difference is presumably
due to the presence of methyl iodide in our studied mixture.
As seen in Fig. 14, the increase in acetic acid
concentration and subsequently the decrease in water and
methyl acetate concentrations; in other words,
the proceeding of the reaction decreases the CO solubility
which is more obvious at temperatures below 470K.
Considering the data reported by Kelkar et al. [36], it was
found that CO is more soluble in methyl acetate than
in acetic acid, and an increase in acetic acid concentration
or a decrease in methyl acetate concentration in the acetic
acid/methyl acetate mixture leads to a decrease in the
solubility of CO, which is in good agreement with those
obtained here.
It is also obvious from Fig. 14 that in low conversions
(< 23 %), the solubility changes of CO with the
proceeding of the reaction and temperature is
considerable. Consequently, for kinetic studies and
determination of the intrinsic rate constant, using Eq. (13)
instead of equation (4) that is independent of CO partial
pressure is the most appropriate. It is clear from Fig. 14
that at high temperatures, the solubility of CO does not
change sharply with the change of the concentrations.
Modeling and simulation
In order to model and predict the rate-time,
concentration-time and the CO consumption-time profiles
in a batch reactor at temperatures 443, 463 and 473K
under 34-bar pressure, Eq. (13) accompanied with algebraic
Eqs. (6), (15), (18), (20) to (23) and also Eq. (12)
as the total reaction (RateCH3COOH = -RateCH3COOCH3 =
-RateH2O = -RateCO), initial concentrations presented in
Table 5 (at X = 0), and functions of the equilibrium
constants presented in Table 4 were solved numerically using
the implicit Euler method.
Volume changes during the reaction which is about
4 to 5.5% at constant reaction temperatures (443 - 473K)
will be ignored according to Fig. 10.
In order to simulate the reaction under 34 bar, the
commercial dynamic simulator HYSYS.Plant was run
using the general NRTL-Virial property package with the
binary interaction parameters from Table 2 and the
mixing rule in Eq. (14). Using the definition of Eq. (13)
as the reaction rate expression whose its form is similar to
0.14
0.16
0.18
0.2
0.22
0.24
440 445 450 455 460 465 470 475 480
Temperature (K)
Pre
dic
ted
CO
solu
bil
ity (
mo
l/l) Initial Solution
23%, MeOAc conversion
56%, MeOAc conversion
78%, MeOAc conversion
Iran. J. Chem. Chem. Eng. Golhosseini Bidgoli R. Et al. Vol. 31, No. 1, 2012
70
the heterogeneous catalytic reaction kinetics model
provided by the simulator and the Eqs. (21) and (23)
as the functions of the equilibrium constants presented
in Table 4 along with Eq. (12) as the total reaction in the
450 cm3 reactor as described in experimental section,
the reaction will be simulated. Since the effect of catalyst
on the vapor pressure of the reaction mixture at different
methyl acetate conversions and temperatures (shown in
Fig. 6) is negligible, the solid catalyst does not take part
in VLE calculations in simulation media, and its vapor
pressure information is, by default, set to zero. Hysys
was used to solve all of the equations using the fully
implicit Euler integration method.
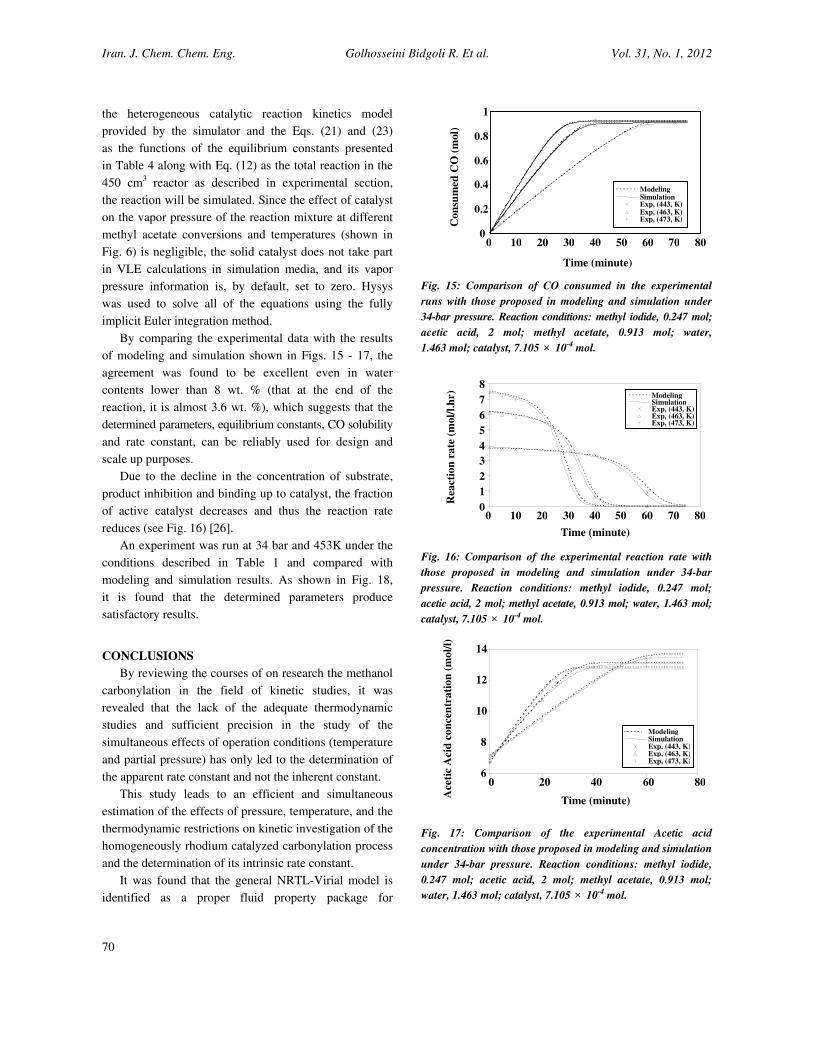
By comparing the experimental data with the results
of modeling and simulation shown in Figs. 15 - 17, the
agreement was found to be excellent even in water
contents lower than 8 wt. % (that at the end of the
reaction, it is almost 3.6 wt. %), which suggests that the
determined parameters, equilibrium constants, CO solubility
and rate constant, can be reliably used for design and
scale up purposes.
Due to the decline in the concentration of substrate,
product inhibition and binding up to catalyst, the fraction
of active catalyst decreases and thus the reaction rate
reduces (see Fig. 16) [26].
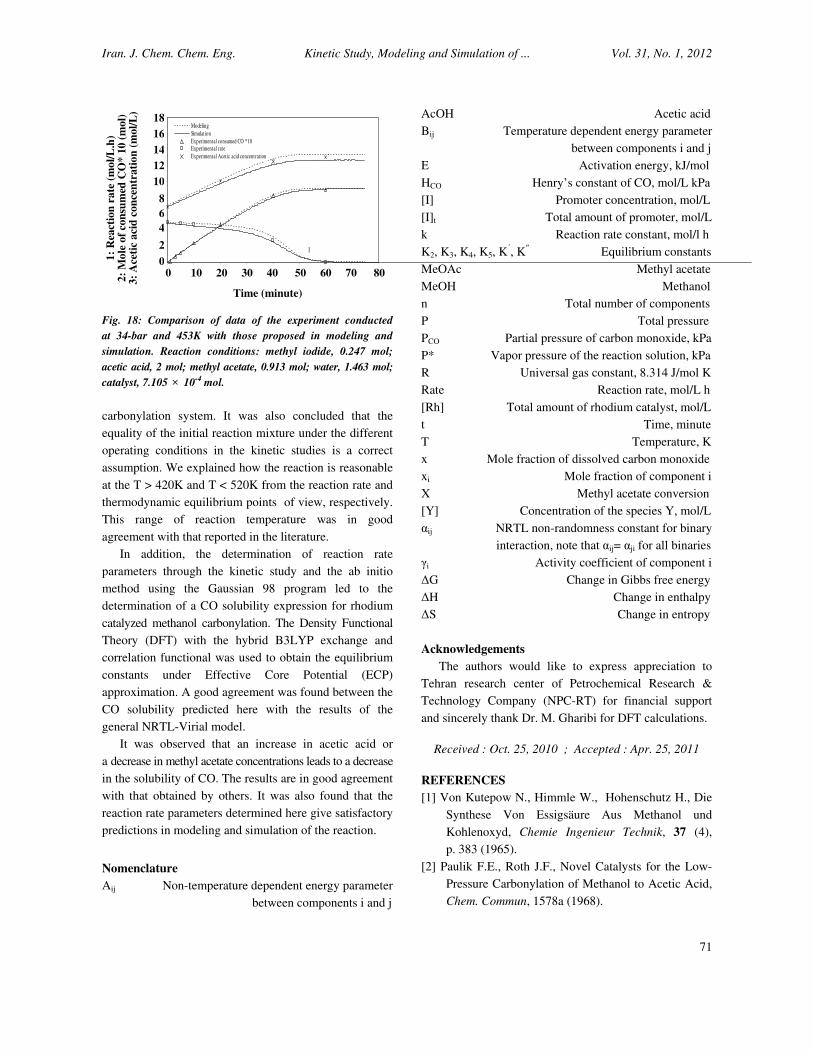
An experiment was run at 34 bar and 453K under the
conditions described in Table 1 and compared with
modeling and simulation results. As shown in Fig. 18,
it is found that the determined parameters produce
satisfactory results.
CONCLUSIONS
By reviewing the courses of on research the methanol
carbonylation in the field of kinetic studies, it was
revealed that the lack of the adequate thermodynamic
studies and sufficient precision in the study of the
simultaneous effects of operation conditions (temperature
and partial pressure) has only led to the determination of
the apparent rate constant and not the inherent constant.
This study leads to an efficient and simultaneous
estimation of the effects of pressure, temperature, and the
thermodynamic restrictions on kinetic investigation of the
homogeneously rhodium catalyzed carbonylation process
and the determination of its intrinsic rate constant.
It was found that the general NRTL-Virial model is
identified as a proper fluid property package for
Fig. 15: Comparison of CO consumed in the experimental
runs with those proposed in modeling and simulation under
34-bar pressure. Reaction conditions: methyl iodide, 0.247 mol;
acetic acid, 2 mol; methyl acetate, 0.913 mol; water,
1.463 mol; catalyst, 7.105 × 10⁻⁴ mol.
Fig. 16: Comparison of the experimental reaction rate with
those proposed in modeling and simulation under 34-bar
pressure. Reaction conditions: methyl iodide, 0.247 mol;
acetic acid, 2 mol; methyl acetate, 0.913 mol; water, 1.463 mol;
catalyst, 7.105 × 10⁻⁴ mol.
Fig. 17: Comparison of the experimental Acetic acid
concentration with those proposed in modeling and simulation
under 34-bar pressure. Reaction conditions: methyl iodide,
0.247 mol; acetic acid, 2 mol; methyl acetate, 0.913 mol;
water, 1.463 mol; catalyst, 7.105 × 10⁻⁴ mol.
0
0.2
0.4
0.6
0.8
1
0 10 20 30 40 50 60 70 80
Time (minute)
Con
sum
ed C
O (
mol)
ModelingSimulationExp, (443, K)Exp, (463, K)Exp, (473, K)
0
1
2
3
4
5
6
7
8
0 10 20 30 40 50 60 70 80
Time (minute)
Rea
ctio
n r
ate
(m
ol/
l.h
r)
ModelingSimulation Exp, (443, K) Exp, (463, K) Exp, (473, K)
8
10
12
14
0 20 40 60 80
Time (minute)
Ace
tic
Aci
d c
on
cen
tra
tion
(m
ol/
l)
ModelingSimulationExp, (443, K)Exp, (463, K)Exp, (473, K)
6
Iran. J. Chem. Chem. Eng. Kinetic Study, Modeling and Simulation of ... Vol. 31, No. 1, 2012
71
Fig. 18: Comparison of data of the experiment conducted
at 34-bar and 453K with those proposed in modeling and
simulation. Reaction conditions: methyl iodide, 0.247 mol;
acetic acid, 2 mol; methyl acetate, 0.913 mol; water, 1.463 mol;
catalyst, 7.105 × 10⁻⁴ mol.
carbonylation system. It was also concluded that the
equality of the initial reaction mixture under the different
operating conditions in the kinetic studies is a correct
assumption. We explained how the reaction is reasonable
at the T > 420K and T < 520K from the reaction rate and
thermodynamic equilibrium points of view, respectively.
This range of reaction temperature was in good
agreement with that reported in the literature.
In addition, the determination of reaction rate
parameters through the kinetic study and the ab initio
method using the Gaussian 98 program led to the
determination of a CO solubility expression for rhodium
catalyzed methanol carbonylation. The Density Functional
Theory (DFT) with the hybrid B3LYP exchange and
correlation functional was used to obtain the equilibrium
constants under Effective Core Potential (ECP)
approximation. A good agreement was found between the
CO solubility predicted here with the results of the
general NRTL-Virial model.
It was observed that an increase in acetic acid or
a decrease in methyl acetate concentrations leads to a decrease
in the solubility of CO. The results are in good agreement
with that obtained by others. It was also found that the
reaction rate parameters determined here give satisfactory
predictions in modeling and simulation of the reaction.
Nomenclature
Aij Non-temperature dependent energy parameter
between components i and j
AcOH Acetic acid
Bij Temperature dependent energy parameter
between components i and j
E Activation energy, kJ/mol
HCO Henry’s constant of CO, mol/L kPa
[I] Promoter concentration, mol/L
[I]t Total amount of promoter, mol/L
k Reaction rate constant, mol/l h
K2, K3, K4, K5, K�, K� Equilibrium constants
MeOAc Methyl acetate
MeOH Methanol
n Total number of components
P Total pressure
PCO Partial pressure of carbon monoxide, kPa
P* Vapor pressure of the reaction solution, kPa
R Universal gas constant, 8.314 J/mol K
Rate Reaction rate, mol/L h
[Rh] Total amount of rhodium catalyst, mol/L
t Time, minute
T Temperature, K
x Mole fraction of dissolved carbon monoxide
xi Mole fraction of component i
X Methyl acetate conversion
[Y] Concentration of the species Y, mol/L
�ij NRTL non-randomness constant for binary
interaction, note that �ij= �ji for all binaries
�i Activity coefficient of component i
G Change in Gibbs free energy
H Change in enthalpy
S Change in entropy
Acknowledgements
The authors would like to express appreciation to
Tehran research center of Petrochemical Research &
Technology Company (NPC-RT) for financial support
and sincerely thank Dr. M. Gharibi for DFT calculations.
Received : Oct. 25, 2010 ; Accepted : Apr. 25, 2011
REFERENCES
[1] Von Kutepow N., Himmle W., Hohenschutz H., Die
Synthese Von Essigsäure Aus Methanol und
Kohlenoxyd, Chemie Ingenieur Technik, 37 (4),
p. 383 (1965).
[2] Paulik F.E., Roth J.F., Novel Catalysts for the Low-
Pressure Carbonylation of Methanol to Acetic Acid,
Chem. Commun, 1578a (1968).
0 10 20 30 40 50 60 70 80
Time (minute)
18
16
14
12
10
8
6
4
2
0 1:
Rea
ctio
n r
ate
(m
ol/
L.h
) 2
: M
ole
of
con
sum
ed C
O*
10
(m
ol)
3:
Ace
tic
aci
d c
on
cen
trati
on
(m
ol/
L)
3
2
1 1
Modeling
Simulat ion
Experimental consumed CO *10Experimental rate
Experimental Acetic acid concentration
Iran. J. Chem. Chem. Eng. Golhosseini Bidgoli R. Et al. Vol. 31, No. 1, 2012
72
[3] Roth J.F., Craddock J.H., Hershman A., Paulik F.E.,
Low Pressure Process for Acetic Acid Via
Carbonylation, Chem. Techn, 1, p. 600 (1971).
[4] Murphy M.A., Smith B.L., Torrence G.P., Aguilo A.,
Iodide and Acetate Promotion of Carbonylation of
Methanol to Acetic Acid: Model and Catalytic
Studies, J. Organomet. Chem, 303, p. 257 (1986).
[5] Smith B.L., Torrence G.P., Murphy M.A., Aguilo A.,
The Rhodium-Catalyzed Methanol Carbonylation
to Acetic Acid at Low Water Concentrations:
the Effect of Iodide and Acetate on Catalyst Activity
and Stability, J. Mol. Catal, 39 (1), p. 115 (1987).
[6] Qian Q., Li F., Yuan G., Promoting Effect of
Phosphates Upon Homogeneous Methanol
Carbonylation, Catal. Commun, 6, p. 446 (2005).
[7] Zhang S., Qian Q., Yuan G., Promoting Effect of
Transition Metal Salts on Rhodium Catalyzed
Methanol Carbonylation, Catal. Commun, 7, p. 885
(2006).
[8] Qian Q., Zhang S., Yuan G., Promoting Effect of
Oxometallic Acids, Heteropoly Acids of Mo, W and
Their Salts on Rhodium Catalyzed Methanol
Carbonylation, Catal. Commun, 8, p. 483 (2007).
[9] Maitlis P.M., Haynes A., Sunley G.J., Howard M.J.,
Methanol Carbonylation Revisited: Thirty Years on,
J. Chem. Soc, Dalton Trans, 11, p. 2187 (1996).
[10] Dake S.B., Jaganathan R., Chaudhari R.V., New
Trends in the Rate Behavior of Rhodium-Catalyzed
Carbonylation of Methanol, J. Ind. Eng. Chem. Res,
28, 1107 (1989).
[11] Nowicki L., Ledakowicz S., Zarzycki R., Kinetics of
Rhodium-Catalyzed Methanol Carbonylation, Ind. Eng.
Chem. Res, 31, 2472 (1992).
[12] Kim J.S., Ro K.S., Woo S.I., Computer Simulation
of Reaction Rate Expression for Methanol
Carbonylation Reaction Catalyzed Over RhC13-
3H2O/HI, J. Mol. Catal, 69, 15 (1991).
[13] Forster D.J., On the Mechanism of a Rhodium-
Complex-Catalyzed Carbonylation of Methanol to
Acetic acid, J. Am. Chem. Soc, 98, 846 (1976).
[14] Forster D.J., Mechanistic Pathways in the Catalytic
Carbonylation of Methanol by Rhodium and Iridium
Complexes, Adv. Organomet. Chem, 17, 255 (1979).
[15] Jones J.H., The CativaTM Process for the
Manufacture of Acetic acid, Platinum metals Rev,
44 (3), 94 (2000).
[16] Tonde S.S., "Carbonylation of Alcohols and Olefins
Using Soluble Transition Metal Catalysts", Ph.D.
Dissertation, Homogeneous Catalysis Division
National Chemical Laboratory, University of Pune,
Pune, (2004) [Online]. Available: http://dspace.ncl.
res.in/dspace/bitstream/2048/138/1/th1382.pdf
[17] Hjortkjaer J., Jensen V.W., Rhodium Complex
Catalyzed Methanol Carbonylation, Ind. Eng. Chem.
Prod. Res. Dev, 15 (1), p. 46 (1976).
[18] Kelkar A.A., Ubale R.S., Deshpande R.M.,
Chaudhari R.V., Carbonylation of Methanol Using
Nickel Complex Catalyst: a Kinetic Study, J. Cata,
156, p. 290 (1995).
[19] HYSYS 3.2 simulation basis, Hyprotech Ltd.,
Calgary, Canada, (2003) [Online]. Available:
http://yunus.hacettepe.edu.tr/~ealper/kmu346/tutoria
l/SimBasis.pdf
[20] James J.L.M., Jeffrey C.F.C., Acetic Acid by Low
Pressure Carbonylation of Methanol, PEP Review
78-3-4. (1980) [Online abstract]. Available:
http://www.sriconsulting.com/PEP/Public/Reports/Phase
_78/RW78-3-4/
[21] Smith B.L., Torrence G.P., Aguilo A., Alder J.S.,
Methanol Carbonylation Process, U.S. Patent
5,026,908, (1991).
[22] Smith, B.L., Torrence, G.P., Aguilo, A., Alder, J.S.,
Methanol Carbonylation Process, U.S. Patent
5,001,259, (1991).
[23] Smith B.L., Torrence G.P., Aguilo A., Alder J.S.,
Methanol Carbonylation Process, U.S. Patent
5,144,068, (1992).
[24] Trueba D.A., Kulkarni S., Control Method for
Process of Removing Permanganate Reducing
Compounds from Methanol Carbonylation Process,
U.S. Patent 7,271,293, (2007).
[25] Dake S.B., Chaudhari R.V., Solubility of CO in
Aqueous Mixtures of Methanol, Acetic Acid, Ethanol,
and Propionic acid, J. Chem. Eng. Data, 30, p. 400 (1985).
[26] Garland M., Transport Effects in Homogeneous
Catalysis, In "Encyclopedia of Catalysis", Horvath I.T.,
Ed.; Wiley: Eötvös university, Budapest, Hungary,
Vol. 3, pp. 480-490 (2003).
[27] Ming L., Wenlin F., Maorong H., Yongqiang J.,
Zhenfeng X., Ab initio study on the Mechanism of
Rhodium-Complex Catalyzed Carbonylation of Methanol
to Acetic acid, Sci China Ser B-Chem, 44 (5), p. 465 (2001).
Iran. J. Chem. Chem. Eng. Kinetic Study, Modeling and Simulation of ... Vol. 31, No. 1, 2012
73
[28] Kinnunen T., Laasonen K., DFT-Studies of Cis- and
Trans-[Rh(CO)2X2]+ (X=/PH3, PF3, PCl3, PBr3, PI3
or P(CH3)3) and Oxidative Addition of CH3I to
Them, J. Organomet. Chem, 665, p. 150 (2003).
[29] Ivanova E.A., Nasluzov V.A., Rubaylo A.I.,
Rösch N., Theoretical Investigation of the
Mechanism of Methanol Carbonylation Catalyzed
by Dicarbonyldiiodorhodium Complex, Chemistry
for Sustainable Development, 11, p. 101 (2003).
[30] Maorong H., Wenlin F., Yongqiang J., Ming L.,
IRC Analysis of Methanol Carbonylation Reaction
Catalyzed by Rhodium Complex, Sci China Ser
B-Chem, 47 (1), p. 41 (2004).
[31] Lee C., Yang W., Parr R.G., Development of the
Colle-Salvetti Correlation-Energy Formula into a
Functional of the Electron Density, Phys. Rev. B, 37,
p. 785 (1988).
[32] Becke A.D., Density-Functional Thermochemistry.
III. The Role of Exact Exchange, Chem. Phys,
98 (7), p. 5648 (1993).
[33] Hay P.J., Wadt W.R., Ab Initio Effective Core
Potentials for Molecular Calculations. Potentials for
the Transition Metal Atoms Sc to Hg, Chem. Phys,
82 (1), p. 270 (1985).
[34] Frisch M.J., Trucks G.W., Schlegel H.B., Scuseria M.A.,
Robb M.A., Zakrzewski V.G., Montgomery J.A.,
Stratman R.E., Burant J.C., Daprich S., Millam J.M.,
Daniels A.D., Kudin K.N., Strain M.C., Farkas O.,
Tomasi J., Barone V., Cossi M., Cammi R.,
Mennucci B., Pomelli C., Adamo C., Clifford S.,
Ochterski J., Petersson G.A., Ayal P.Y., Ciu Q.,
Morokuma K., Malick D.K., Rabuck A.D.,
Raghavachari K., Foresman J.B., Cioslowski J.,
Oritz J.V., Stefanov B.B., Liu G., Liashenko A.,
Piskorz P., Komaromi I., Gomperts R., Martin R.L.,
Fox D.J., Keith T.A., Al-Laham M.A., Peng C.Y.,
Nanayakkara A., Gonzales C.A., Challacombe M.,
Gill P.M.W., Johnson B.G., Chen W., Wong M.W.,
Andres J.L., Head-Gordon M., Replogle E.S.,
Pople J.A., Gaussian 98, Revision A.7, Gaussian, Inc.:
Pittsburgh, PA (1995).
[35] Forster D., Advances in Organometallic Chemistry,
In: "Catalysis and Organic Syntheses", Stone F.G.A.,
West R., Eds.; Academic Press: New York, San
Francisco, London, Vol. 17, pp. 262 (1979).
[36] Kelkar, A.A., Jaganathan, R., Chaudhari, R.V.,
Hydrocarbonylation of Methyl Acetate Using a
Homogeneous Rh(CO)Cl(PPh3)2 Complex as a
Catalyst Precursor: Kinetic Modeling, Ind. Eng.
Chem. Res, 40, 1608 (2001).