Embed Size (px)
Citation preview
f() L!RNAI. or APPLIED BIOM LLIIAN ICS, f<Jq] 1J , 24 -4-1
~ l ll11- hv Hum.in k.m{·t11.:-. Pubh.,h('r,. Im
Kinesiological Factors in Vertical Jump Performance: Differences Among Individuals
Luis F. Aragon-Vargas and M. Melissa Gross
The purpo,e of this ,ludy wa, to invcs1iga1e 1he kinesiological factor, that distinguish good jumperi. from pour ones. in an attcmpl 10 undersiand Lhe critical facton. in vertical jump performance (VJPJ. Fifly-1wo normal, physically ac1ive male college studem, each performed five maximul venical jumps with arms akimbo. Ground reaction forces and video data were collected during the jumps. Subject, ' ~!reng1h wa., tested isometrically. Thirty-five po1en1ial predictor variables were calculated for statistical modeling by multiple-regre~,ion analy,b . At 1he whole-body level or anaJysb. the best model, (which included peuk and average mechanical power) accounted ror 88<;. of \I JP variation (p < .0005). At the segmental level. the best model, ttccounted for 60% or variation in VJP (p < .0005). Uncxpcc1edly. coordination variables were 1101 related to VJP. The,e data suggeMed that VJP wa. mo,t strongly associated with 1hc mechanical pm\er developed duringjump execution.
Vertical jump perfo1111am:e (VJ P) has been studied by researchers for decades. Early interest was relaled lo jumping in sports such as basketball and volleyball. More recently. as a simple task where maximum performam:e is dearly and objectively defined, 1he vertical jump has been applied to understanding human motor control of a multiarticular movement. One major practical question. however. remains the same: Which kincsiological factors are critical for vertical jump performance? Coaches and trainers have tended to focus on lower limb mw,cular strength training as a means to improve VJP, but it seems that other factors can affect vertical jump performance a well.
Early research on the vertical jump focused on the role of muscular strength and the effects of various methods of strength training on V.IP (Ball. Rich. & Wallis. 196-1: Bangerter. 1968: Blattner & Noble. 1979: Brown, Mayhew, & Boleach, 1986: Eisenman. 1978; Genuario & Dolgener. 1980: McKethan & Mayhew, I 974). In general. these studie:.. repllrt a moderate as~ociation of mu~cular strength and VJP (r = .50: Genuario & Dolgener. I 980) and relatively small improvements (8- 12%) in jump performance with strength training (Blattner & Noble, 1979: Brown et al., 1986).
There was also some early interest in storage and utilization of elastic energy and its effect~ on VJP (A~mus!>en & Bondc-Peten,en. 1974: Komi & Bo. co. 1978). These papers
Lub 1-. Arng611-Vm-gu, is wi1h lht! facuda Jc Educacion Ff,ica y Deport<',. Un1versidad dt! Co,la Rica. San Jose, Cos1a Rica. M. Melissa Gross i~ with 1hc Dcpai1111cn1 of Movcmem Science. The Universit) 111' Michigan, Ann Arbor, Ml --18109. Rc4ues1 n:prin1, rrom Lui, F. Arngon-Vargm.. Apdo. 686, 2350 San Jo,e. Co,ut Rica. !::-mail: laragon<!l'cariari .ucr.ac.cr
Vertical Jump I
Glossary of Terms
AMEC/IP AMP
Average mechanical power of Lhc whole body. Amplitude of the movement.
AVA Average venical acceJeraLion. BCOMNET Net vcnical position (position at takeoff minus standing pn~ition) of the body
center of mass at takeoff. See Equation 11 . DISTAPRO Distal-to-proximal ~equence of the maximum velocity difference~ between proxi-
mal and distal joints for each 5egmenl. DISTOPRO DiMal-to-proximal sequence of the joint reversals. Height Body height. j Denotes a joint. ANK is ankle~. KN£ is li.nees. and HIP is hips. jACCP K Peak joint acceleration during the negative phase. jANG TO Joinl angle al takeoff. jE XTIS Joint extension isometric strength. j FLXIS Joint nexion isometric ~Lrength. jM MAX Maximum net joinl torque. jM REV Net joint torque at the time of jo int reven,al. j PFXIS Joim plantar ncxion isometric strength. j PWRMAX Peak joint power. j l?EVTDIF Time difference between first and last j oint reversals. JUMP2 Jump height calculated from BCOMNET and TOYEL. MMTDIFF Time difference between the first and last maximal jo inl torques. NEGIMMAX Peak negative impuhe of the body center of mass. PEAKPWR Peak mechanical power of the whole body. PROD/STA Proximal-to-distal ~equence of the maximum velocity differencel-between proxi
PROTODIS TOVEL TPROP VJP
mal and distal joints for each scgmenl. Proximal-Lo-distal ~equcnce of the joint rever~als. Vertical takeoff velocity of the body cemer of ma~s. Time of propulsion. Vertical j ump performance. Body weight.
------ ----------- -----
and others on the u~e or stored e lastic energy in skeletal muscle (Cavagna. Dusman. & Margaria. 1968). on motor cont rol of the locust jum p (Heitler & Burrows, 1977a. 1977b), and on various manipulations of the vertica l jump (Yamazaki. Su1uki. & Mano. I 989) suggest that high musculotendinous forces al the onset or the concentric action enham:e jumping performance. Researchers have also studied the relative contribut ions ofj oinl or ~egment actions to the jum p (Fukashiro & Komi. I 987: Hubley & Wells, 1983: Pandy & Zajac, 199 1: Robertson & Fleming. 1987), the role of bianicular muscles in venical jump ing (Bobben & van lngen Schenau. I 990: Pandy & Zajac. 199 1: van lngen Schenau. Bobbert. Huijin g, & Woittiez. 1985), and specific mo1or control issues such as coordination of. egmental actions (Bobbert & van fngen Schenau. 1988: Hudson. 1986: Jensen & Phillips. 1991: Pandy & Zajac, 1991).
The work of these scientists has allowed a considerable refinement or the biomechan ical techniques and models used to study VJP and has identified seve ral variables common to maximum vertical ju mp perfom, ance: high musculotendinous forces and joint torques at the on~et of the po~itive phase: high jo int power:-, especially toward the time nf
26 Aragon-V.uga~ ;ind Cross
takeoff: close occurrence of a proximal-to-distal sequence of activation of muscle groups: close occurrence of a proximal-to-distal sequence ofj(lint reversals; and an optimization of the vertical position of the body center of mass at the instant of takeoff. Most or these studies. however, have focused on similarities among good perfonne rs. and few compari~ons have been made between good and bad jumpers. Identifying the variables associated with good but not with bad perfomrnnce is necessary to determine which factors are most important for V.IP.
Since most of the factors proposed as relevant tu VJP arc interrelated in a complex fashion, a ~cnsible approach to their study is the use of multiple-regression analysis techniques. Multiple regression has been used previously in the study or \/JP (Dowling & Vamos, 1993; Hay, Dapena. Wilson. Andrews, & Woodward, 1978; Jaric, Ristanovic. & Corcos, 1989; Podolsky. Kaufman. Cahalan, Aleshinsky. & Chao. I 990). bul the variables studied were somewhat limited. The papers by Jaric and colleagues and Podolsky and colleagues focused on muscular strength measures, while Dowling and Vamos restricted their study lo whole-body mechanics and timing issues. Hay and colleagues focused on average joint torques at particular intervals using a rather complex ( I I-segment) model: they did not include any of the coordinalion-relatcd predictor variables thaL have been identified more recently. In the present study we collect those var.iables proposed in the literature as potential predictors, organiLe them according LO a theoretical model. and study them in a group of men with a wide range of jumping abilities. in an auempt to identify the kinesiological factors critical for vertical jump pcrfomiance.
Methods
Theoretical Model and Potential Predictor Variables
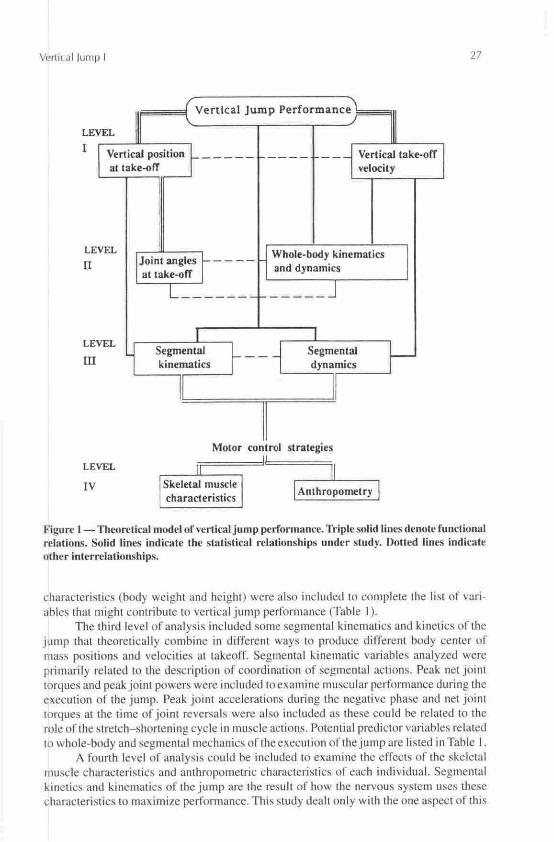
Figure I shows a theoretical model of the relevant factors in vertical jump performance. This model recognize~ that variables are highly interrelated. while allowing for different leveb or analysis.
The first level of analysis was concerned with a functional relation: The vertical position and vertical takeoff velocity of the body center or mass mathematically define VJP, as shown in Equation 11. This step in the analysis allowed us to verify the consistency of the result~. by comparing ihe jump height results obtained from two different methods (i.e., VJP and JUMP2). IL also allowed us Lo evaluate the relative importance of each of the two predictors, since a greater mathematical relevance (i.e .. a squared term) docs not necessarily imply a greater statistical relevance (i.e., a greater variance among jumpers).
The seconLI level or analy. i:. dealt with the va1iables that should conuibut e more Llirectly lo the vertical position of the body center of mas!> at takeoff (joint angles at takeoff) and to the vertical takeoff velocity (whole-body dynamics of the jump). Theoretically, the best jumpers could enhance takeoff velocity by maximizing the average force applied to the body center of mass. or by maximi1.ing the distance over which this force is applied. or by selecting the best compromise between these options. Similarly (considering differences in body mass), the jump er could maximize average vertica l acceleration, coulLI maximi:,,:e the time this accelerati(lll was maintained. or could rind a compromise. Another strategy might be to generate a greater negative impulse of the body center of mass, which could re:.ulr in a greater ground reaction force from the onset of the positive phase of the jump, increasing the average force applied to the body center of mass. Two independent measures of power (mean and peak mechanical power) and two general anthropometric
Vertical Jump I
Vertical Jump Performance l====~II
LEVEL I Vertical position
at take--0rr
LEVEL a
LEVEL
rn
Joint angles - - - -at take-off
Segmental kinematics
II
Vertical take-off velocity
Whole-body kinematics and dynamics
Segmen tal dynamics
Motor control strategies
LEVEL
IV Skeletal muscle characteristics
Anlhropometry
27
Figure I - Theoretical model of vertical jump performance. Triple so lid lines denote functional relations. Solid lines indicate the statistical relations hips under study. Dotted li.ncs indicat e other interr elationships.
charac teris tics (body weight and height) were also included to comp lete the list of variab les that might co ntribute to ve11ica l j um p performan ce (Table I).
Th e third level of analysis inc luded some seg mental kinema tics and kinetics of the ju mp that theore tica lly co mbine in diffe re nt ways to produce different body center of mass positions and veloc ities at takeoff. Segmental kinematic variables analyzed were prima rily related to the desc ription of coor dinati on of seg mental actions. Peak net joint torque s and peak jo int powers were included to exa mine muscular perfor mance during the exec ution of the jump. Peak j oint acce lerations duri ng the negative phase and net joint torques at the time of joint reversals were also included as these could be related to the role of the stretc h-s honenin g cyc le in muscle actions. Potential pred icLOr var iables related to who le-body and seg mental mechanics of the exec ution of the jump are listed in Table I .
A fourth leve l of analys is could be included to examine the effec ts or the ske leta l mul.cle characteris tics and anthropome tric characteri stics of eac h indi vidual. Seg mental kinetics and kinematics o f the jump arc the result. of how the nervous syste m uses these charac teristics LO maxim ize performance. This study dealt only with the one aspect of this
28 Aragcin-¼irga~ ,me/ GrO)>
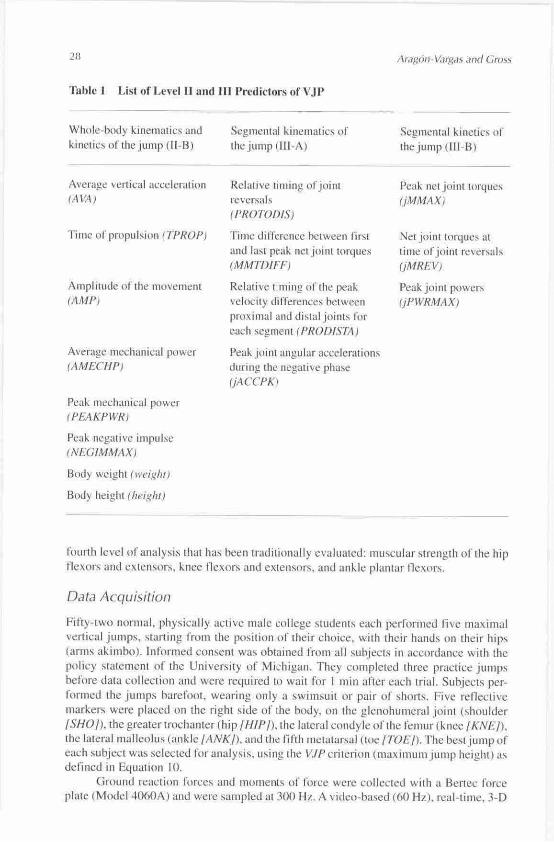
Table I Lisi of Level U and ll1 Predictors of VJ P
Whole-body kinematics and kinetic~ of the jump (11-B)
Average venical acceleration IA l'l\J
Time ofpr opub1cm (Tl'ROP)
Amplitude of the movement (A/v/PJ
Average mechanical power (AMECHP)
Peak mechani<.:al power (PEAKPWRJ
Peal.. negative impulse (NEGIMMAX)
Body weight (ll'eiJ.:ht)
Body height /heig ht )
Segmental kinematic~ of the jump (Ill-A)
Relative timing of joint reversal~ ( PROTODI S)
Time difference between first and last peak net join I torques (MMTDIFF )
Relulive timing of the peuk velocity differences hetween proximal and di~tal join,~ for each ~cgment (PROD/STA)
Peal.. j oint angular accelera1 ion~ during the negative phase (jACCPKJ
Segmental kinetic~ of the jump (111-B)
Peal.. net joint torque~ (jMM /\X)
Netjoinl torques a l
time of joint rever~ab (jMREVJ
Peak joint power, ()P\VRMAX)
rounh level of analysi,. that ha,. been traditionally evaluated: mw,cular strength of the hip nexors and extensors. !..nee flcxors and cx1ensors, and ankle plantar llcxors.
Data Acqu isition
Fifty-two normal, physically active male college studems each performed live maximal ve11ical jumps, starting from 1he position of their choice. with their hand. on their hips (ann s akimbo). Informed consent was obtained from all subjects in accordance with the policy statement of the University of Michigan. They completed lhrce practice jumps before data collection anti were required lt> wait for I min after each trial. Subjects performed the jumps barefoot. wearing only a swimsuit or pair or shorts. f.ive reflective marker;. were plm;cd on the right side of the body. on 1he glenohumeral joint (shou lder I S/-10 }). the greater trod rnnter (hip/ HIP} ). 1he la1cral condyle of the femur (knt!e / KN£/). the lateral malleo lus (ankle /ANK/) , and the fiflh metatarsa l (we [TOE!). The best j ump of each subject was selected for analysis, using the V.IP criterion (maximum jump height) a~ defined in Equation l 0.
Ground reaction forces and momenu, or ltirce were co llected with a Bertec force plate (Model 4060A ) and were ~am pied al 300 Ht../\ video-based (60 Hz.). real-time. 3-D
Vertical Jump I 29
motion analysis system (Motion Analysis Corp.) was used to collect and process kinematic data. Kinematic data were filtered with a low-pass. fourth-order Butterworth filter wilh an effective cutoff frequency of 8 Hz.
Strength of the lower body was tested isometrically at the hip, knee. and ankle joints. at a separate session. using a Biodex machine. Standard Biodex procedure~ were used for the knee and ankle joi m tests (Biodex Corporation. n.d.). The hip joint test was adapt..:d from the procedures described in the Cybex II operation manual (Cybcx. n.d.). Subjects had a brief warm-up period and three practice trials p1ior 10 each test. They were instructed to exert maximum force for 5 s. with 15 s rest between trials. Maximum torque averaged over three trials was obtained. Joim strength was defined as 1he average of both the right and left jo ints. Joint angles during testing were Mandardiled according 10 Table ..,
Ba. il: anthropometric daLa were obtained using standard sliding calipers. Lape mea~Llrcs. and the force platform. Body mass and body height were measured according lO the procedures of Lohman. Roche, and Martorell ( 1988). Thigh length. midthigh circumference. shank length. calf circumference. malleolus width, malleolus height, and foot length were obtained according to the procedures of Vaughan, Davis, and ff Connor { 1992). The\e data were used to calculate segmental center of mass and moment or inertia values.
Data Analysis
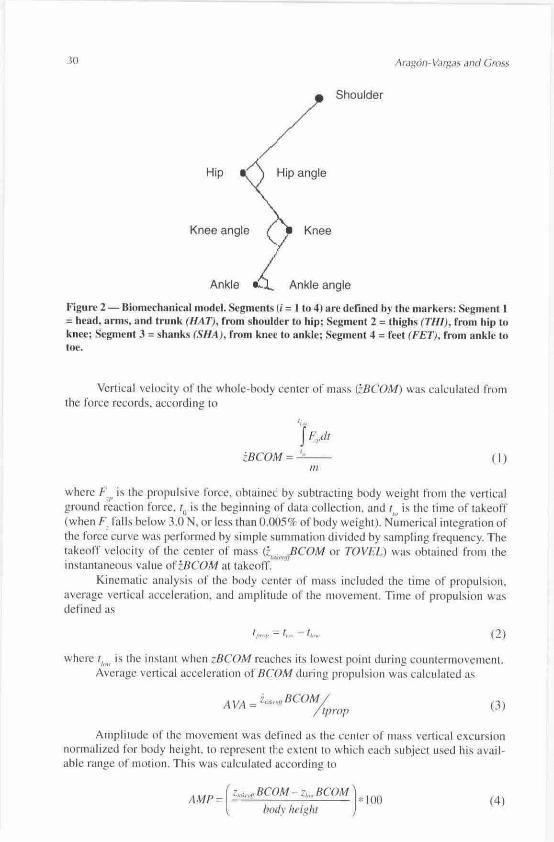
The body was modeled as a planar. rigid-body :,y!-.tem consisting of four segmcms linl,.cd by frictionless. hinge joims (Figure 2). Although the effecL~ or an arm swing on VJP are relevant (Jensen, 1989). the utility of a four-segment model for the study of vertical jumping i:, well documented (Bobbcrt. Huijing, & van lngen Schenau. 1987a. 1987b: Bobbcn & van lngen Schenau, 1988; Pandy, Zajac, Sim, & Levine, 1990: Pandy & Zajac. I 99 1: Zajac, Zomlet'er, & Levine. 1981) and such a model allows a more specific l'ol:us on the lower limb muscle actions.
Segmental (COM,) and whole-body (BCOM) center of mass po~itions in the hori-1ontal {x) and vertical (l) axes were calculated from the video records. according to Vaughan ct al. ( 1992). The procedure used for calculating the HAT parameters wa~ b,L~ed on data from Clauser, McConville. and Young ( 1969) and Hinrichs ( 1990). Segmental moments of inertia about the center of mass were l:alcul:ned according to Vaughan ct al. ( 1992), using their formulas for the sagitwl plane.
Table 2 Joint Angles (in Degrees) Used for Isometric Strength Tests
Hip Knee Ankle
- --- ---Hip extension• 90 90 Hip tlexion' 90 90 Knee cxtcn~ion" 120 120 Knee nexion" 120 120 Ankle plantar ncxion• 110 140 80
··13aseu on Nemeth el al. ( 1983) and Waters et al. (I 97-1-). "From Lindahl cl al. <I 969) and Scudder ( 1980). ' Based on Fugl-Meyer c l ,11. ( 1980) and Sak <!l al. ( 1982).
30
Hip
Knee angle
Ankle
/ Shoulder
Hip angle
Knee
._( Ankle angle
Araucjn-V.1rgas and Cro~~
Figure 2- Biomechanical model. Segments (i = 1 to 4) are defined by the markers: Segment I = head.arms , and trunk (HAT), from shoulder to hip; Segment 2 = thighs (Till). from hip to knee; Segment 3 = shanks (SHA), from knee to ankle; Segme nt 4 = feet (f'ET). from ankle to toe.
Vertical velocity of the whole-body center of mas~ (:BCOMJ was caku lated from the force records. according to
'1 f°.i,dl
:.BCOM = -1"--
111 ( I )
where F,1, is the propulsive force, obtai ned by subtracting body weight from the ve1tical
ground reaction force. 10 is the beginning of data collection, and, i. the time of takeoff (when F falb below 3.0 N, or less than 0~005% of body weight). N
1
;~merical integration of the force curve was performed by simpl e summation divided by samplin g frequency. The takeoff velocity of the center of mass (f:.,,,.,.,,
1lCOM or TOVEL) was obtained from the
in~tantaneous value of ;:.BCOM at takeoff . Kinematic analysis of the body center of ma~s included the tim e of propulsion,
average vertical acceleration . and amplitud e of the movement. Time of propulsion was del'ined as
{2)
where 11,.,, is the instant when :JJCOM reaches its lowest point during countermovement. Average verti cal acceleration of BCOM during propul sion was calculated as
AV.\ =:,,,,,.,, BCOM I I jl pmp (3)
Amp litud e of the movement wa~ defined as til l! center or mass vert ical excursion normali zed for body height, lo represent the extent to wh ich each subjec1 used his avai lable range of moti on. Thi s wm, calculated accordin g to
AMP =(~,.,,, .. 11BCOM -:: 1 .. , BCOM )* JOO body heigh/
(4)
Vertic,:11 Jump I J I
Whole-body mechanical power was calculated in two separate ways. Average mechanical power during propul sion was derived l'rom the change in potential energy of lhe whole body. m:cordi ng to
mg(;:,,,,,,BCOM -;:,_ BCOM) AMEC I-IP = -~--------'- (5)
where III is body mass and g = 9.81 m · s 1• Peak mechanical power (PEAKPWRJ was obtained from the instantaneous mechanical power of the whole body (W) calcu lated according to Dowling and Vamos ( 1993):
\¥ = F,_ * i.BCOM (6)
Peak negati ve impulse was calculated from the peak downward velocity of the body center of mass:
NEGIMMAX = m(i ,,,,.BCOM) (7)
Angular velocitie s and m:celerations were obtained by differentiating joint angular displacement data, using finit e differences. Joint angles arc defined in Figure 2. According to thi. convemion. when ajoilll is fl exing lhe angular velocity is negative; it is positiv e when the joint extends.
Vertical velocity differen ces between proximal and distal joims for each segment tsee Bobbert & van lngen Schenau. 1988) were calculated from the fir st derivative of vertical joint di splacements. according to
VdijJ. = ( z,,,., - ~'"" ), (8)
using the instants of peak velocity differ ences of the segmems to determine whether the sequence was proximal to distal (PROD/STA: HAT. THI, KN£ , FET). distal to proxi mal (DISTAPRO ), or something else.
Kinemati c and kinetic data were u ed to obtain the instantaneous net joint torque~ using Newtonian equation of motion (W inter. 1990). Joint extensor torques are presented as positive and joint nexor torques as negative.
Instantaneous joim powers were calculated according to Robertson and Wint er l 1980):
w; = M,* W, (9)
where \1/ is the power for jointj at each point in time, M is the instantaneous torque for I I
JOintj. and ffii is the instantaneous angular veloci ty atjointj . The performance cri teri on was vertica l jump performance (VJP/. delined as the
peak verti cal position cJf the center of body mass during ni ght, minus the center of body mass height w hile standing:
VJ P = :.,~,, BCOM - ::..,,,,,.,,., BCOM ( I 0)
Jump height was also calculated from the vert ical velocit y and net positi on of the who lebody center of mass at takeoff (TOVEL and BCOMNET , respectively):
JUMP2 = [(;:,,,,'",rBCOM l * (2g) ' ] + '-tai""1 BCOM - -:.,,.,, ... .,BCOM ( 11)
l2 Ara!i6n - Vaf8as and Gms.s
Statistical Analysis
Multiplc-regre~sion analysis techniques were applied al each level of the model in Figure 1 to idemify the major predictor variables. The basic model used was the general linear model:
( 12)
where y , the dependenL variable. is normally distributed: x, is the i'h predictor. p- 1 is the number of predictor!. in the model. I.\, is the imcrcepl. and E, are the error terms. which are independent and normally distributed. Descriptive Mmistics were used to verify that the ba$ic assumption of nomiality of the dependent variables wa.., met and to investigate whether there was a re,mmable variability of both dependent and predictor variables.
For each level of analysis. several statistical models were developed. using "all po[,,sible subsets'" and "stepwise·· regression techniques. and were compared. The '·best" models were selected according 10 commonly used criteria. that is, Mallow's Cp (Cp =.p). and R~ (highest adjusted r-squarcd values). The adjusted r-squared lakei, into account how many predictors are included in the model, since additional variables will usually improve r-squared but al the expense of complicating the model. Interactive s1epwi5e regression was used to verify the significance and the relative imponan ce of each predictor in the models. Since the purpose of l11is i:tudy was to identify the relevant predictors and 1101 nece~sarily to build the most accurate model possible. selection of several different models is a reasonable approach. These models were relined using re~idual analysis techniques. to check for the omission o f important variables or the need for interaction terms or a curvilinear function. The presence of outliers was dete1111ined using leverage and Studcnti7ed deleted residuals; their influence was assessed using Cook"s D. In addi1ion. the aptness of each model in terms of the normality of £
1 was evaluated using normal
probability plots. Finally. specilic levels of significance (p values) achieved by each model were obtained and reported, to allow u~ to evaluate the probability of selecting relevant predictors by chance alone.
Results
Gem:ral characteristics of the subjec1s are presented in Table 3. Tables 4 and 5 list the jump execution results. Average body weight (74.3 kg) was slightly above the U.S. population average for a body height of 1.78 m (7 1.8 1'.g) (Metropolitan Life Insurance Company, 1959). Jump heights (VJP) ranged from 0.372 to 0.663 111 (mean = 0.520 m) and had a coerficicnt of variation of 13.4%. There were 16 subjec ts. or 3 I 9'r of the sample. out!'>ide ± I SD of the average VJP. This average jump height is higher 1han reported in rhe literature for male college students jumping without an arm swing (i.e .. 0.49 m. Brown ct al., 1986; 0.42 rn, Bosco & Komi, J 979) but is lower than reported for trained bnskctball player~ (0.55 m, Brown et al.. 1986) or trained volleyball players (0.54 111. Bobben et al., 1987a). Of special relevance lO the present study i1-the fact that the group represen1ed a wide range of jump ing abilities and physical activity levels. At the higher end of physical activity. 7 subject, were members of the university's volleyball club. 4 were aclive in strength-related sports (college wrestling, recreational bodybuilding. and professional baseball), and 2 were endurance athletes (rowing. cros~-country running). At the lower end were about 20 subjects who were only occasionally active in recreational basketball, jogging. or weight lifting.
Vertical lump I 33
Table3 Subject Characteristi cs (N = 52)
Variable [variable name! (unit.-;) Mean SD CV(%)
Age /age/ (years) 20.2 2.1 10.4 Weight /ll'eig hr / (kg) 74.27 8.65 11.6 Height / heigh!} (m) 1.79 0.06 3.4 ll ip extension strength [ /-1/l'EXTIS/ (N · m) 160.46 34.55 2 1.5 Hip llexion strength / /-II PFLXIS/ (N · m) 101.57 18.79 18.5 Knee extenbion strength/ KNEEXTISJ (N · m) 230.03 43.90 19. 1 Knee ll exion strength { KNEFLX IS/ (N · m) 12 1.05 24.'.!0 20.0 Ank le pint. ll exion i.trength JANK PFXI SJ (N · 111) 130.66 19.9 1 15.2
Table 4 Jump Execution Characteristics (N = 52)
Variable name (units) Mean SD CV (o/r)
VJP (m ) 0.520 0.070 13.4 rOVEL cm· s 1
) 2.65 1 0.2-16 9.3 BCO M NET( m) 0. 144 0.027 18.9 HIPANGTO (rad) 3.0 1 0.09 3.0 KNEANCTO (rad) 3.08 0.09 '.!.9 ANKANGTO (rad) 2.52 0. 10 4.2 TPROP( s) 0.3 16 0.062 19.6 A\/A( m ·s ") 8.74 2.04 23.3 AMP( % body height) 31.33 5.44 17.4 AMEC HP (W) 2,212.9 455.1 20.6 PEAKP WR (W) 3,863.2 687.7 17.8 NEGI MMA X (kg · m · \ 1
) - 87.8 36.6 41.7 HIPACC PK (rad· s 2} 56.79 17.44 30.7 KNEACCPK (rad · s "J 34.66 15.31 44.2 ANKACCPK (rac.J · s ' ) 52.07 41.66 80.0 MMTDIFF( s) 0. 158 0.()93 58.8 JREVTD I F (s) 0. 113 0.077 68.6 H f PMMAX (N · m) 295.5 1 74.26 25. 1 KN EM MAX (N · m) 220.84 77.5-1 35.1 ANKMMAX (N · 111) 244.80 48.25 19.7 /-1/PMREV (N · rn) 280.32 86.46 30.8 KNEM REV (N · m) 206.07 80.4-1 39.0 ANK MR EV (N · m) 2 15.32 64.24 29.8 HIP PWRMAX CW) 1.203.7 341.9 28.-1 KNEPWRMI\X(W) 1,487.5 447.4 30.1 ANKPWRMAX (W) 1.916.5 558.6 29.1
34 l\ragon-Varnas and Gross
Table S Jump Execution Characteristics: Seque nce Variables (N = 52)
Variable name
PROTODIS DISTOPRO Other sequences of joint re versa ls PROnJSTA DJSTAPRO Other sequences of peak velocity differences
23 I
28 42 0
10
Both VJP and takeoff velocity (TOVEL) were normally distributed, but the net position of BCOM at takeoff (BCOMNET) was positively skewed. We transformed the latter (base IO logarithm) before completing the analyses. Variability was higher for BCOMNET (coefficient of vaiiation [CV] = 18.9%) than for TOVEL (CV= 9.3%). Average values reported in Table 4 are comparable 10 those reported in other studies (Bobben et al.. 1987a: B0bbe11 & van Ingen Schenau. 1988; Hudson. 1986). Most subjects chose 10 perform a ·'countcrmovement jump" (Asmussen & Bonde-Petersen, I 974 ): the few who tried 10 do a ··, quai jump" actually used a small countermovement.
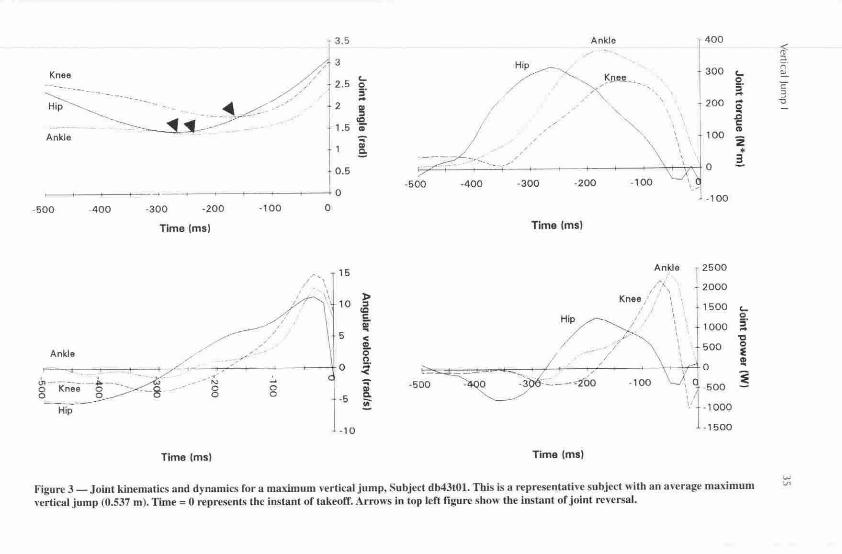
Figure 3 ~hows representative curves of join t angles, joint angular velocities, net joint torques, and joint powers. The curves were obtained from I subject with an average VJP (0.537 m): other average jumpers (within 0.25 SD of the average, 11 = 11) showed similar curves. These curves arc comparable to those reported by Bobbert and van lngen Schenau ( 1988). This subject shows a hip- ankle-k nee sequence of join! reversals, a common pattern (2 1 out of 28) among subjects in the "other sequences of joint reversals .. category (cf. Table 5).
Table 6 shows a summary of the best prediction models developed for the dependent variables, organized by levels of analy~is. Up to three s1atis1ically significant multivariate models are included at each level. Best single predictors are also included at each level. Both R2 and R/ values are reported. since each could point to a different model as the best one and to allow comparisons among models with different numbers of predictors. Within each model, variables are presented in order of importance. according to their partial con-elation coefficients. Several models not included in this table may have been reasonably good but not good enough 10 be among the best. Table 6 includes information about how many significant models were 1101 included in the table and whal their best R2
values were. In addition, when a variable is discussed as not being relevant. additional information is provided about whether it was a significant predictor in any of the absent models.
At Level I. takeoff velocity (TOVEL) was a much more powerful predictor of VJP than the position of BCOM at takeoff (BCOMNET) : The partial coefficients of determination when the other vaiiablc was already in the model were .937 for TOVEL and .256 for BCOMNET (total R1 = .95). Level II models show that it was possible to account for about 91 % of the variation in TOVEL and 89% ofihe variation in VJP. using whole-body kinermuics and kinetics of the jump. The two best sjngle predictors of both dependent variables were peal- mechanical power and average mechanical power.
Models at Levels 3 and 4 show smaller coefficients of determination. The best pre-
3 Knee , --- . --- ---Hip
/13.5
<.... ~ 2.5 ~
- -. ~ / = ~ ;::.::-- · - ·- • • - 2 ! 1,.5 1 Ankle
0.5
i» E:
t---1--1--...---- -- - ~ --- ~- --" 0
-500 -400 -300 -200
Time (ms)
,''"'' 'A L~ th--- - ;.., .. g Knee -g=::=; -
Hip
~ . "' 0 0
Time (ms)
/ ,,
-100
, ,.,,
0
15
10 ~
5
cc C
i < !2. 0
, 0 j· ~
0 0 ~
;;;--5
-10
Ankle
H~ ~!1AlL . •• ,
/ ~" ·,, ,
, , ,
,' ' "'
1 40 0
roo l r 200 ~
D C (D
100 -z • 3
~ 0
-500 -400 -300 - 200
Time (ms)
Hip
-100
Ankle
", , \ I \
Knee , \
' I /
r· -? /
I \ I I I
J . 100
11:::: 1500 [
1000 ~ 'O
/ 500 i
~ i'> --~ _..,,_-..1._ ( / -'!' ~ '- · r .r. / ' '4 -----: LOO \
1
1J 0 ~ -500 -100
Time (ms)
I I I
I.
500
-1000
- 1500
Figure 3 -.Joint kinematics and dynamics for a maximum vertical jump, Subj ect db43t01. This is a representati ve subject with an average maximum vertical jump (0.537 m). Time = 0 represents the instant of takeoff. Arrow s in top left figur e show the instant of joint reversa l.
< ~ i'i' "' c 3
'"O
...., ""
16 Ara~on- V.:117:as am.I Gros~
Table 6 "Best " Prediction Model s at Each Leve l of Analysis (All Models , Except When Noted , Were Sig nificant atp < .0005)
Prediction model for V./P
Lcvel I I. V./P = k + TOVEL + BCOMNET 2. V.IP = J.. + TOVEL
Level II 3. BCOMNET= k + ANKANGTO + HIPANGTO 4. BCOMNET= J.. + KNEANGTO 5. TOVEL = J.. - ll'eight + PEAKPWR +AMP+ AMECHP 6. TOVEL = k + PEAKPWR - weight +A MI'+ A \IA 7. TOVEL = k + PEAKPWR - 11·eigh1 + AMP - TPROP'' 8. TOVEL = k + PEAKPWR 9. TOVE/,= k +AMECHP 10. V./P = k - ll'eiglit - AVA+ AMEC/IP+ PEAKPWR 11. VJP = J.. - weight + AMP+ PEIIKP\VR + AMEC HP 12. V.!P = k + PEAKPWR - u·eighr ' 13. \!JP= k + PEAKPWR 14. V.IP = k + AMECflf'
Levels Il l and IV 15. VJP = k + HIPPWRMAX + HIPACCPK + KNEEXTIS -
KNEFLXIS - Hf PM REV + KNEPWRMAX 16. V./P = k + HIPPWRMAX + KNEEXT!S + KNEPWRMAX +
HIPACCPK - KNEFLXIS - HIPMMAX 17. VJP = J.. + HIPPWRMAX - HIPMREV + KNEACCPK +
HIPACCPK + KNEEXTIS 18. VJP = k + HIPPWRMAX 19. V./P = k + HIPMMAX 10. TOVEL = k + HIPP\VRMAX + KNEPWRMAX 21. TOVEL = k + HIPACCPK,, 22. TOVEL = k + 11/PPWRMAX 23. BCOMNET = k + ANKPFXIS + /-IIPPWRMAX' 24. BCOMNl:..T= k + HIPACCPK1
25. BCOMNET = k +ANKPFX IS
.95
.93
.32
.24
.91
.91
.91
.51
.44
.89
.88
.72
.46
.43
.6 1
.6 1
.59
.44
.28
.48
.2 1
.4]
.30
.(l7
.25
.94
.93
.19
.23
.90
.90
.90
.5 I
.42
.88
.87
.70
.45
.42
.56
.56
.55
.4]
.26
.46
. 19
.42
.27
.OS
.23
'Othcr modeb not included (11 > I 0) were staLi~tically ~ign ificam. with R1 = .89 am.I lower. "Other model~ not included (11 > I Cl) were stati~tically ~ignilk am, with R1 = .87 and lower. This panicular model was included to illu~trate the effect of these two variables alone. •Other modcb not included (11 = 3) wi:re ,ta tisLically significant, with /?1 = .5 I and lower. ~,1 = .00 I. 'HIPPWRMJ\X i~ borderline non~ignificam in this model (/1 = .05). 1p = .06].
dicti1,n mode ls f'or VJP had a large number or pn:dicto rs, all of which had a sign ificant effec t on V./P (p < .05). Th e three bes t mode ls induded peah. hip power (HI PPv\lRMAX). knee extension streng th (KNEEXT /S). and a hip torque variable (HIPMMAX or HIPMR l:..V); these mode ls acco unt ed for abou t 60 % or the varia tion in V.!P. Peak knee power
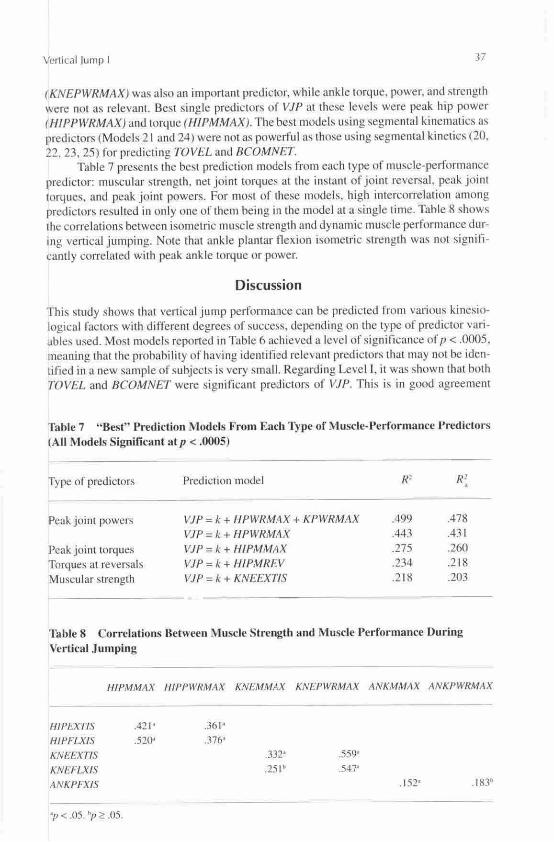
Vertical Jurnp I 37
( KNEPWRMAX) was also an important predictor, while ankle torque, power. and strength were not as relevant. Best single predictors of VJP at these levels were peak hip power ( HIPPWRMAX ) and torque ( HI PM MAX). The best modeb using segmental kinematics a, predictors (Models 21 and 24) were not as powerful as those using segmental kinetics (20. 22. 23, 25) for predicting TOVEL and BCOMNET.
Table 7 presents the best prediction models from each type of muscle-performance predictor: muscular strength. net joint torques at the instanl of joint reversal, peak joint 1.orques, and peak joint powers. For most of these models. high intercorrelation among predictors resulted in only one of them being in the model at a single time. Tabl.e 8 hows the correlations between isometric muscle strength and dynamic muscle performance clurmg vertical jumpin g. Note that ankle plamar flex ion isometric strength was 1101 signilicamly correlated with peak ankle torque or power.
Discussion
This sLUdy shows 1ha1 vertical jump performance can be predicted from various kinesiological factors with different degrees of success, depending on the type of predictor vari.iblc used. Most models reported in Table 6 achieved a level of significance or p < .0005, meaning that the probability of having identified relevant predictors that may 1101 be identified in a new sample of subjects is very small. Regarding Level J, it was shown Lhat both TOVEL and BCOMNET were significant predictors or VJP. This is in good agreemenr
Table 7 "Best'' Pred.iction Models From Each Type of Muscle-Performan ce l'rcdictor s (AIJ Model s SigniCicant at p < .0005)
Type or predictors Prediction model R~ R:
Peak joint power~ VJP = k + HPWRMAX + KPWRMAX .499 .478
VJP = k + HPWRMAX .443 .431
Peak joint torques VJP= k + HIPMMAX .275 .260
Torques at reversals VJP= k + HIPMREV .234 .218
Muscular strength VJP=k+ KNEEXTIS .2 18 .203
Table 8 Correlati ons Between Muscle Strength and Muscle Performance During Vertical Jumpin g
NIPMMAX /-1/PPWRMAX KNEMMAX KNEPWRMAX ANKMMAX ANKPWRMAX
HIPEXTIS
Hlf'Ff..XIS
KNEEXTJS
KNEFLXIS
ANKPFXIS
·11 < .05. 1·r ?. .os.
.421'
.52(}'
.361·
.376' .332' .251"
.559' .5-t7"
. 152' . 1831'
313 Aragon-Vargas ,111d Gross
with the findings of Bobbert and van Ingen Schenau ( 1988), who stated that the optimization of VJP involves optimization of both TOVELand BCOMNET. It is possible that some subjects' strategies would favor one in detriment of the other. but subjects with a higher takeoff velocity did not seem to achieve this velocity at the expense of BCOM position at takeoff (or vice versa): the correlation between TOVEL and BCOMNET was .247 (p = .078), indicating a nonsignificant tendency for subjects with a higher TOVEL to show a higher BCOMNETa s well. These results, together with U1e high predictive power ofTOVEL. suggest that little information is added by studying the BCOMNET part of the vertical jump performance equalion. at least when making between-subject comparisons.
Joint angles at takeoff were significant but poor predictors or BCOMNET . Bobbert and van Ingen Schenau ( 1988) proposed that a greater ankle angle at takeoff may distinguish those jumpers who leave the ground with a higher BCOM position. The present data ~how that ANKANGTO was a significant predictor of BCOMNET (p = .00 I) but could only accoum for about 2 1 % of the variation in BCOMNET . KNEANGTO had a similar predictive ability (24%). Because joint angles at takeoff were highly intercorrelated, the best model (Model 3) could only account for 32.2% of the variation in BCOMNET. Much higher coefficients of simple and multiple determination were obtained when studying individual subjects (see companion paper).
Whole-body kinematics and kinetics were good predictors, not only of TOVEL but of VJP a.~ well. Peak power, body weight. and amplitude of the movement were common to almost all the best predictive models of TOVEL and VJP (Models 5-7 and 10-12. Table 6). The regression coefficients for weight anti time of propulsion (TPROP) were negative, indicating an inverse relationship between Lhese variables and the dependent variables. Surprisingly. peak negative impulse of BCOM (NEGIMMAX ) was not present in the best models. NEG IMMAX has been proposed to influence \/JP by allowing greater joint torques during propulsion (Cavagna. 1977; Komi & Bosco. 1978). Tn the present study, NEGlMMA X was moderately correlated with peak joint torques (.35 < r < .70) and had a significant effec.:t on V.IP (p = .023), but its coefficient of simple determination was rather low (1.! = . 10). With two exceptions (VJP = k +AMP+ PEAKPWR - weight - NEGI MMA X, R1 = .85; VJP = k + TPROP + AMEC HP - weigltr - NEGIMMAX . R2 = .85, not reported among best models in Table 6), NEGIMMA X was not a significant predictor of V./P when other whole-body variables were in the model. Apparemly, negative pha.~e impulse strategy is not a critical factor for vertica l jump performance. It i:,, possible that the timing of NEGTMMAX relative to the instant of lowest position of BCOM /',,.,) had an effect on the association between NEGIMMAX and VJP, since timing issues are important in ~trctchshonening cycle movemellls (Cavagna. 1977). Thii; possibility warrants further swdy.
Other researchers have identified peak mechanical power as the best predictor of V.IP (Dowling & Vamos. 1993; Harman. Rosen~tein, Fryk.man. & Rosenstein, 1990). In those studies. PEAKPWR accounted for about 86.5~ and 89% of the variation in jump height. respectively, compared with 46.4% in the present study. The difference may be explained by the fact that both Dowling and Vamos and Harman et al. included body mas~ in their calculations. They also obtained their jump height rrom takeoff velocity alone. A prediction model with our data including both PEAKPWR and weight accounL~ for 81.9% of the variation in TOVEL. which is more in agreement with the papers cited.
Bobbcrt and colleagues ( 1987a) ~howed that when a particular subject uses uifferent jumping techniques, peak mechanical power during the jumps can vary significantly. while vertical jump performance (and exrernal work done) remains comtant. This suggests Lhat while mechanical power is strongly c.:orrelated with VJP. it i~ not necessarily a limiting factor of VJP. Furthermore, whole-bouy peak. power ulone does not give insight
Vertical Jump I 39
into the specific aspects of performance that distinguish one jumper from another. How do good jumpers accomplish a greater power and a higher jump? Even Lhough our models from Levels 1.11 and IV di.d not show such high coefficients of determination and tended to have a large number of predictors when VJP was the dependent variable, they are closer to the mechanical and physiological bac;es of performance than whole-body mechanical power (cf. Table I).
Models from Levels Ill and IV show that when predicting V.IP, joint strength measures were not as important as joint torques and powers during the jump. Table 7 shows bow predictive ability improves moving from the muscular strength measures to the actual nel joint torques during the jump, and then to the peak joint powers during the jumps. Bobben and van lngcn Schenau ( 1990) showed how skeletal muscle performance is very different in the ankle plantar flexors during a vertical jump, compared to performance during uniarticular actions such a5 those commonly used during strength testing.
Skeletal muscles are expected 10 be able to generate greater torques during isometric than concentric actions, provided the isometric test is performed at the optimum joint angl.c (Lieber. 1992). Furthermore, during multiarlicular movements, net joint torque measure may include the action of "antagonists ... When that happens, the agonist torque is greater than the net joint torque indicates (Zajac & Gordon. J 989). Finally. unilateral strength has been shown to be greater than half the bilateral strengLh of leg muscles (van Soest. Roebroeck. Bobbert, Huijing. & van lngen Schenau, 1985). All of the above factors ~hould result in the peak net joint torques measured during the vertical jump being sub. tantially lower than the strength test torques multiplied by 2 (cf. Table!> 3 and 4). Our data ~how that this wa..~ not the case for hip extension (average difference wa~ - 25.4 N · 111. p = .02 1) or for ankle plantar llexion (- 16.5 N · m, p = .044). but iL was for knee extension (- 239.2 N · m. p < .00 I). Tn addition, Table 8 shows low to moderate correlaLions between muscle strength and muscle performance during vertical jumping. The present datu !>Upport the view that one reason why lower body strength is normally not a strong predictor of VJP may be because skeletal muscle behavior during a ve11ical jump is very different from the actions involved in isometric. isotonic. and isokinetic strength tests.
Table 7 also shows the lower predictive ability of peak hip torque (HIPMMAX) when compared to peak hip power (HIPPWRMAX). This illustrates the importance of the muscle's ability to combine high torques with reasonably high joint angular velocities. Differences in HIPPWRMAX among subjects may be due not only lo differences in muscle fiber type composition (Bosco & Komi. I 979) but to differences in coordination strategies that allow the relevant muscles to act at a more advantageous range of the force/velociLy curve (a lower muscle-fibe r shortening velocity at the same joint angular velocity would allow the muscle to generate more force: Bobbert. Huijing, & van lngen Schenau, 1986).
Among the different muscle groups, performance of the hip muscles seems to be the most closely related to VJP. as seen in Table 7. Only knee muscle strength was a stronger predictor than its hip counterpart. This is in agreemem with the findings of Pandy and Zajac ( 1991 ), who showed that gluteus maximus muscles. together with the vastii muscles, are the major energy generators during maximum ve11ical jumping.
Table 6 shows that the sequence of joint reversals (PROTODIS, D/STOPRO, other) and the sequence of segmental peak velocity differences (PROD/STA, DISTAPRO, other) were not included in the best prediction models for V.!P. Several authors have confirmed the existence of a proximal-to-distal sequence of activation of muscle groups and sequence of joint reversals during maximum VJP (Bobben & van lngen Schenau, 1988; Hudson. 1986: Pandy & Zajac, 1991 ). More recemly. Bobbert and van Soest ( 1994 ). using a dynamic simulation of the venical jump , also found muscle activation patterns that show
40 AraR611-Vaqia.s ,111d Gm.,.s
a prox im al-lo -distal tendency. They concluded tha1 actua l jumping achievement depends largely on the precise timin g of muscle actions. but tha1 the ideal timin g of muscle activati on may differ from one subj ect to ano1her dependi ng on the relati ve strength of 1hc differ ent muscle groups invol ved. ln our study. we did not measure muscle activat ion sequence per se but looked at the kin ematic result s of 1he ··coo rdin ati on" of muscle acti ons. Bobb en and van Soesl suggested that '"it seems as if a kinema tically optim al soluti on ex ists for the jumping moti on. regardless or muscle propertie s" ( l 994. p. l O 19). Furthermore. Bobben and van lngen Sehenau ( 1988) suggested that a c lose occurrence of prox imal-Lo-distal j oint reversals is desirabl e i n order to opt imi ze lhe eff ecti ve energy of BCOM at takeoff. lt does not necessarily follow that the best j umpers use this approach and the worst do not. Tn fact. Jem.en, Phillip s, and Clark ( 1994) proposed that thi s proximal-to-dis tal sequence of j oint reversals is a rather stable feature of verti cal jumpi ng i n humans of all ages. ln the present stud y, neither the sequence of joint reversals([>= .93) nor the sequence o f segmenlal peak veloci ty diff erences (p = .70) was signifi cantly rel med to VJP. II would be interesting to see whether VJP changes in a sing le subject as a result of changes in coo rdinati on patterns as defined herein .
Similarl y. the tim e differenc e of joint reversals (JREVTDIF ) was not an imp ortant predict or. It was signifi cant neith er as a single predi ctor of VJP (.p = .48). TOVEL (.p = .48), and BCOMNET (p = .64) nor when other variable s were pre. ent in the mode ls. Thi s is in disagreeme nt w ith the data from Hud son ( 1986). who reported a diff erence in sequence and timin g of j o int reversals ('' initiati on of segment extension·· in her study ) between the 5 most skill ed and the 5 least ski lled subj ects. However, the definiti on of ''skill ed" jump ers i n Hud son's study was related not to vertical j ump perform ance as defined herein but to the rati o o f count ermove ment jump height to squat jump height. In addition, the present study looked at the toial time diff erence from fir st 10 last j oint rev ersals. whil e Hud son looked at Lime diff erences between initiati on of extension of adjacent segmenth. Jensen et al. ( 1994). on the other hand, looked at the absolute timin g of each joint reversal with respect to the in~tant of takeoff and found no diff erences between adults and childr en or betwee n groups of childr en with differe nt jumpin g skill levels. Unfortunatel y, the way their data arc reported docs not all ow for evaluati on or joint reversal tim e diff erences.
Other segmental kin emati cs vari ables not includ ed in this study may prove to be more strongly associated wit h VJP. Mor e recent analyses show that the absolu te va lues (not their timin g) of peak veloci ty diff erences between the proxi mal and disraJ ends or HAT . T/-11, and SHA are signili canll y correlated w ith VJP (single ,~ values o f .19, .56. and .22, respecti vely). Interpretation of these result s is not possible at thi s point due to the nature of our statist ical model development procedures.
Th is swdy presents several ·'best" models for each level of analy~is. but no general. overall stati stica l model is reported. The theoreti cal model of VJP. presented in Figure l, suggests that predictors from one level already i nclude most o r 1he information that could be prov ided by predicto rs from lowe r levels o f analysis. We tested thi s assumption by buildin g models using the best predictors from all levels of analysi~. All possib le subst:ts regression proced ures were usetl to identif y the best ove rall models. It was possibl e to find models thal included variabl es rrom Levels II and 111 in additi on Lo TOVEL and BCOMNET (the best model fr om Level I), but addin g up to four variabl es at a t ime to VJP = k + TOVEL + BCOMNET (R! = .95) only im proved overall R! by .02. It was not possib le to add any predictors from Level 111 to the best mode ls fr om Level 11 (i .e .. none of the predictors from Leve l Ill were stati sti call y significant under tho se conditi ons). Furthermore. no combination of preuictors from diff erent levels was better than the best models fr om 1J1e higher level alone. Since signifi cant models were developed even at the lowest level of
Vertical Jump I 41
analysis, it is apparent that the best models from a particular level include most of the information that could be provided by predictors from lower levels of analysis.
The horizomal takeoff velocity of BCOM could have contaminated the results of this study. Subjects did not necessarily jump directly upward. anti the horizontal component o f the takeoff velocity may have affected overall vertical jump performance. The absolute value or the horizontal velocity at takeoff was relatively small but varied considerably from subject LO subject (mean = 0.098 m · s 1
, SD= 0.076. CV= 77 .9%). The single coefficients of con-elation between horizontal takeoff velocity and the dependent variables were poor (VJP. r = .23; BCOMN ET, r = .26; TOVEL, r = .36), and only the latter was significant ma = .05. Furthermore, hori7ontal velocity at takeoff was not staListically significant when added 10 any one or the models in Table 6. Therefore, there is no reason 10 believe that horizontal takeoff velocity had a significant effect in this swdy.
The conclusions from this study may be limited by our choice of 8 H1 as the filter cutoff frequency ror the kinematic data. Although this filter retained 85'7f' of the signal at all markers. it may have reduced the peak values of the join t powers. joint torques, anti Joint acceleration~ during the negative phase and the joint angles at takeoff. This effect should be about the same for all subjects, bowcver, and Lhe focus or Lhis swtly was noL on the absoluLe values but on comparisons among subjects. Some authors believe that a higher sampling frequency ( I 00 Ht) anti a higher filter cutoff frequency ( 16 Ht) are necessary to measure c<>rrectly the vaiiables or interest during human vertical jumping (Bobben ct al.. 1987a. 1987b). We recommend using these higher frequencies in future studies in an attempt to reduce ~ynchronization errors and excessive smoothing of the data.
A final comment is ncces. ary regarding the four-segment biomechtlllical model used. This model docs not account for the effects of ul.ing an arm swing, which is the way humans normally jump . Among other things. the ..irm swing all<>w~ individuals to jump about IO cm higher (Brown eL al.. I 986; Harman ct al.. 1990). Part of Lhis improvement comes from the direct cont1ib u1ion of the arm swing to positive vertical impulse, but pan of it comes from allowing a greater force production by the lower limbs (Jensen. 1989). We believe there is a tradcoff between the limitalions of excluding the arms and the greater confidence that comes from using a well-tested model. Although the presemly identified predicwr variables would probably change in magnitude ifan arm swing were included in the jumping Lask. their relative importance for \/JP would probably remain the same. Future ~LUdies can look at the predictive ability of our statistical models under that condition.
It was possible to predict differences in VJP among a group of normal, healthy males. using different subsets M kinesiological variables as predictors. The net position of the body center of ma~s at takeoff contributed little information to the prediction of VJP compared to the vertical takeoff velocity. Whole-body peak mechanical power was the best single predictor of \/JP. bul it provided no insight into the segmental actions 1hat result in higher jumps. At a segmental level of analysis. the present data offer little supporl for the relevance of some coordination variables as defined in previous stlldies, such as the ~equence and timing of joint reversals. Peak joi nt powers and joint lOrques, particularly those at the hip, were the main factors that distinguished good and bad j umper:,. How to modify these factors by training and practice. and how much of an effect that modification can have on VJP. are questions 1hat warrant further study.
References
Asmussen. E .. & Bonde-Petersen. F. ( 1974) . Storage of cla~lic ene rgy in ~keletal muscles in man. Acta Phy.\iolo~irn Srn/ldi/lcll 'irn. 9 1(3), 385-392.
42 Arag6n-Va,gas and Cross
Bnll. J.R .. Rich. Q.G., & Wallis, E.L. (1964). Effects of isometric trnining on vertical jumping. Research Quanerly, 35. 231-235.
Bangerter. B.L. ( 1968). Con1ributive compone111s in 1he vertical jump. Resea,d1 Quarterly. 39(3), 432-436.
Biodex Corpora1ion. (n.d.J. Operariorislapplicatio11.1· 111a11ualfor the Biodex system (2nd ed.). (P.O. Drawer S, Shirley, NY 11967)
Blanner, S .. & Noble. L. (1979). Relative effects of isokinetic and plyometric training on vertical jumping perfoonaDce. Research Quarterly, 50(4), 583-588.
Bobbe 11. M .F .. Huijing. P.A .• & v11n lngen Schenau, G.J. ( 1986). A model of the human triceps surae muscle-tendon complex applied to jumping. Jou ma/ of /Jiomedwnics. 19( 11 ). 887-898.
Bobben. M.F., Huijing. P.A .. & van lngen Schenau, G.J. ( 1987a). Drop jumping: I. The inlluence of jumping technique on the biomechanic~ of jumping. Mediti11e a11d Science in Sports a11d Exercise, 19(4). 332-338.
Bobben, M.F.. Huijing, P.A .. & van In gen Schenau, G.J. ( 1987b). Drop jumping: II. The influence of dropping height on the biomechanics of drop jumping. Medicine and Science in Spam and Exercise, 19(4), 339-346.
Bobben. M.F., & van lngen Schenau. G.J. (1988). Coordination in vertical jumping. Joumal of Bio111eclrc111ics. 21(3), 249-262.
Bobbert, M.F.. & van In gen Schenau. G.J. ( 1990). Mechanical output about the ankle joint in isokinetic plantar flex ion and jumping. Medicine a11d Science in Spons and Exercise. 22(5), 660-668.
Bobben. M.F .. & van Soest, A.J. ( 1994). Effects of muscle strengthening on venical jump height: A simulation study. Medicine and Science in Sports and Exercise, 26(8), 1012-1020.
Bosco. C .. & Komi. P. V. ( 1979). Mechanical characteristics and fiber composition of human leg extensor muscles. European .lmmwl of Applied Pliysiology. 41. 275-284.
Brown. M.E .. Mayhew, J.L., & Boleach. L.W. ( 1986). Effect of plyometric training on venicalju mp perfonnance in high school basketball players. Jo11mal of Sports Medicine and Physical Fitness, 26( I), 1-4.
Cavagna, G.A. ( 1977). Storage and utilization of el.u;tic energy in skeletal muscle. Exercise and Spon Scie11ce.v Reviews, 5, 89-129.
Cavagna. G.A .. Dusman. B .. & Margaria, R. ( 1968). Positive work done by a previously stretched muscle. Jo11mal of App/ic•d Physiology, 24( I). 2 1-32.
Clau1-er. C.E., Mcconville. J.T .. & Young. J.W. ( 1969). Weig/it. 110/rune. and center of mass ofsegmems of the h11111a11 body. Wright-Patterson Air Force Base. Ohio.
Cybex. (n.d.). /solaredjoim 1esri11g and exercise ha11dboakfor using Cybex II and U.8.X. T. (Cybex. A Division or Lumex. Inc., 100 Spence St.. Bay Shore, NY 11706)
Dowling, J.J .. & Yamos. L. (1993). Identification of kinetic and temporal factors related to venical jump performance. Jo11mal of Applied Bio111eclw11ics, 9. 95- 110.
Ei,enma n, P.A. ( 1978). The innuence of initial strength levels on r~sponses to vertical jump training. Jo11mal of Sports Medicine and Physical Fi111ess, 18(3), 277-282.
Fugl-Meyer, A.R .. Gu~tafsson. L., & Burstedt, Y. ( 1980). fsokinetic and static plantar nexion characteristics. E11ropem1 Journal of Applied Physiology. 45. 221-234.
Fukashiro. S .. & Komi, P. V. ( 1987). Joint moment anti rnechanicitl power flow of the lower limb during vertical jump. !11rernatio11al Jou ma/ of Sports Medici11e, 8(Suppl. I). 15-2 1.
Genuario. S.E.. & Dol.gener, F.A. ( 1980). The relationship of isokinetic torque at two speeds to the venical jump. Re.1·ew'('/1 Quarterly for Exercise and Sport. 51(4), 593-598.
Ham1an, E.A., Rosenstein, M.T., Frykman, P.N., & Rosenstein. R.M. ( 1990). The effects of anns and countermovement on venical jumping. Medici11e and Science in Sports and Exeir-ise. 22(6). 825-833.
Hay. J.G .. Dapena. J .. Wilson. B.D .. Andrews, J., & WooJward. G. (1978). An analysi~ uf join1 contribution~ 10 perfonnance of a gros~ motor skill. ln E. Asmussen & K. Jorgensen (Etls.). Biomeclumics V/-8 (pp. 64-70). Balli more: University Park Press.
Heitler. W.J .. & Burrows. M. ( 1977a). The locust jump: I. The motor programme. Jo11mal of Experi-111e11tal Biology. 66( I), 203-219.
Vertical Jump I 41
1-leitler, W.J .. & Burrows, M. ( 1977b). The locust jump: IL Neural circuits of lhc motor programme. Jo11mol of Experimelllnl Biologv, 66( I ), 22 1-241.
lli nrichs, R.N. ( 1990). Adjusuncnts to the segment center of mass proponion~ of Clauser et al. ( 1969). Journal of Biomeclumics. 23(9), 949-951.
Hubley, C.L., & Well~. R.P. ( 1983). A work-energy approach to dctcnninc individual joint contributions to venicaljump performance. European Joumal of Applied Physiology. 50(2), 247-254.
Hud~on, J .L. ( 1986). Coordination of segments in the vertical jump . Medicine and Science in Sports and Erercise. 18(2), 242-251.
Jaric. S .. Ristanovic, D., & Corco~. D.M. ( 1989). l11e relationship between muscle kinetic parameters ,utd kinetic variable~ in a complex movement. European Joumal of Applied Plzysiolo11y. 59, 370-376.
Jensen, J.L. (1989). Contribution of the annswing to propulsion mechanics in the vertical jump (Doctoral dissenation , University of Maryland. College Park). Dissertation Abstm ct.1· lnternatio,wl , SO, 1978A.
Jensen, J.L.. & Phillips. S.J. ( 1991 ). Variations on the venicaljump : Individual adaptations 10 changing task demands. Joumal of Motor Behal'ior, 23( I). 63-74.
Jensen, J.L., Phillips, S.J., & Clark. J .E. ( 1994). For youngjurnpcrs, differences are in the movement's control. not its coordination. Research Quanerlyfo r Exe,dse and Spon. 65(3), 258-268.
Komi, P.V.. & Bosco. C. ( 1978). Utilization of stored elastic energy in leg exten or muscles by men and women. Medicine and Science in Spom . 10(4). 26 1-265.
Lieber, R.L. ( 1992). Skelewl muscle slructure and f1111ctior,. Baltimore: Williams & Wilkins. Lindahl. 0 .. Movin. A., & Ringqvist. J. (1969). Knee extension: Measuremem of the isometric force
in different positions of the knee joint. Acta Orthopaedica Scandinavica. 40, 79-85. Lohman, T.G .. Roche,A.F., & Manorell. R. ( 1988). A11thropo111etric standardiwtion reference 111c111rwl.
Ch.impaign. IL: Human Kinetics. McKethan. J .F.. & Mayhew, J.L. ( 1974). Effects of isometrics, isownics, and combined isometrics
isotonics on qu(ldriceps strength and venical jump . .loumal of Sports Medicine and Physical Fitness, 14(3) , 224-229.
Metropolitan Life Insurance Company. ( 1959). Acwarial whles. New York: Metropolitan Life Insurance Company.
Netmeth. G .. Ekholm. J., Arborelius. U.P., Harms-Ringdahl, K., & Schuldt. K. ( 1983). lnlluence of knee llexion on isometric hip extensor strength. Srnndi11m•ian .loumal of Reha/Jiliwtion Medicine. IS, 97-101.
Pandy, M.G., Zajac. F.E., Sim, E .. & Levine. W.S. ( 1990). An optimal control model for maximumheight human jumping. Jo11rna/ of lliomeclwnics, 23( 12). 1185- 1198.
Pandy, M.G., & Zajac, F.E. ( 1991 ). Optimal muscular coordination strutegies for jumping. Joumal of Bio111eclwnics, 24 ( I), 1- 10.
Podolsky. A .. Kaufman, K.R .. Cahalan, TD .. Aleshinsky, S.Y.. & Chao, E.Y. ( 1990). The relationship or strength .ind jump height in figure skaters. American }l/llmal of s;,orts Medicine. 18(4) . 400-405.
Robenson. D.G., & Fleming. D. ( 1987). Kinetics or standing broad and venica l jumping . Ca11atlia11 Jou ma/ of Sport Sciences. I2( I ). 19-23.
Robet1son. D.G.E., & Winter. D.A. ( 1980). Mechanical energy generation. absorption and transfer amongst segments during walking. Jo11mal of Biomeclumics. 13, 845-854.
Sale. D .. Quinlan, J .. Marsh. E .• McComas. A.J., & Belanger, A. Y. ( 1982). lnt1ucnce of joint position on ankle plantarflexion in humans. Journal nf Applied Physiology. 52(6). 1636- 1642.
Scudder, G.N. ( 1980). Torque curves produced at the knee during i~ometric and isokinetic exercise. An:/rives nf Physical Medicine and Re/rt1bilitwio11, 61. 68-73.
van lngen Schenau. G.J .. Bobben. M.F.. Huijing. P.A .. & Woiuie1.. R.D. (1985). The instantaneous torque-angular velocit.y relation in plantar flexion during jumpin g. Medil'ine and Scimce i11 Sports mu! £tert"ise, 17(4). 422-426.
van Soest. A.J .. Roebroeck. M.E .. Bobben, M.F.. Huijing, P.A., & van lngen Schenau. G.J. ( 1985). A compari~on of one-legged and two-legged countermovement jumps. Medicine and Science in Sports and Exercise, 17. 635-639.
44 /\rag6n-Varga~ and Cross
Vaughan, C.L., Davis. B.L .. &. O'Connor, J.C. ( 1992). /)y11a111ic.1· of h11111an gait (Chapter 3, Appendix B). Champaign. IL: Human Kinctil:s.
Waters, R.L.. Pen·y. J.. McDanieb. J.. & House. K. ( 1974). The relative strength of the hmiistrings during hip exten~ion. Jou ma/ of Bone a11cl Joi111 Surgery. 56-A( 8). 1592-1597.
Winter. D.A. ( J 990). Biomecha11ics n11d motor rn111ro/ of hw11m1 11w1•e111ent (2nd ed.). New York: Wiley.
Yamazaki, Y., Suzuki. M., & Mano, T. ( 1989). Perfom1ancc of noncountermovementjurnp with both knee and hip joints fully extended . .loumul of Applied Phy.1iology. 66(4 ). 1976-1983.
Zajac, F.E .. & Gordon. M.E. ( 1989). Determining rnu~cte·s force and action in mulli-anicular movernenl. E.re,dse and Sport Sciences Re11iews, 17. 187-230.
Zajac. F.fi , Zomlefer, M.R .. & Levine. W.S. ( 198 1 ). Hind limb muscular activity. kinetic~ and kinematics of cats jumping to their maximum achievable heights. Jo11mal of Experi111e111al Biology. 91. 73-86.
Acknowledgment s
This research project was made pm.,ible by a Rad .ham Dissertation Grant and a Rackham Predoctoral Fellowship from the Universi1y of Michigan. Suppon wa~ al~o obtained from Gntnl No. 245-95-276 from the University or Co~w Rica.
We appreciate the valuahle input from Vicwr L. Kmch, M. Anthony Schork. and Charles J. Worringham during 1he design and co111ple1ion of the project. We also appreciate 1hc collahormion or Sharon Smith and the personnel al the Depanmcnt of Phy~ical Therapy of the Uni versify of Michigan Health Sen ice during streng1h te~ling.

Copyright of Journal of Applied Biomechanics is the property of Human Kinetics Publishers, Inc. and its
content may not be copied or emailed to multiple sites or posted to a listserv without the copyright holder's
express written permission. However, users may print, download, or email articles for individual use.


![Jump to content [s] • Jump to site navigation [0] • Jump ... · Page 1 of 22 Untitled 2 24 2006 2 12 21 55 4:55 AM • Jump to content [s] • Jump to site navigation [0] •](https://img.pdfslide.us/doc/110x75/60632e5d2e4a9920bc5588e3/jump-to-content-s-a-jump-to-site-navigation-0-a-jump-page-1-of-22-untitled.jpg)