Embed Size (px)
Citation preview
SubprimeJump Risk
Bruce Mizrach
Markets andInstruments
JumpProcesses
Daily JumpRisk Estimates
Does NewsExplain JumpRisk?
Cojumps andA PredictiveModel
The FinancialCrisis: Pricesand Quantities
Jump and Cojump Risk in Subprime HomeEquity Derivatives
Bruce Mizrach
Rutgers University
Conference on Risk AnalysisOctober 2008
1 / 67

SubprimeJump Risk
Bruce Mizrach
Markets andInstruments
JumpProcesses
Daily JumpRisk Estimates
Does NewsExplain JumpRisk?
Cojumps andA PredictiveModel
The FinancialCrisis: Pricesand Quantities
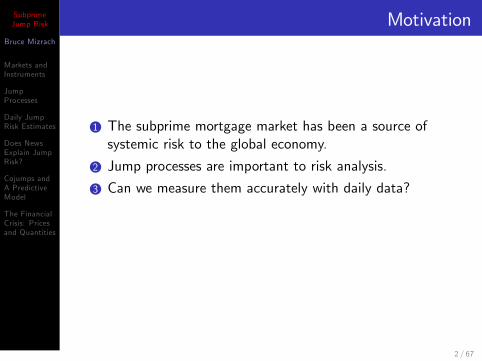
Motivation
1 The subprime mortgage market has been a source ofsystemic risk to the global economy.
2 Jump processes are important to risk analysis.
3 Can we measure them accurately with daily data?
4 What causes jumps in the housing derivatives market?
5 Can we predict them and perhaps avoid future crises?
2 / 67

SubprimeJump Risk
Bruce Mizrach
Markets andInstruments
JumpProcesses
Daily JumpRisk Estimates
Does NewsExplain JumpRisk?
Cojumps andA PredictiveModel
The FinancialCrisis: Pricesand Quantities
Motivation
1 The subprime mortgage market has been a source ofsystemic risk to the global economy.
2 Jump processes are important to risk analysis.
3 Can we measure them accurately with daily data?
4 What causes jumps in the housing derivatives market?
5 Can we predict them and perhaps avoid future crises?
2 / 67
SubprimeJump Risk
Bruce Mizrach
Markets andInstruments
JumpProcesses
Daily JumpRisk Estimates
Does NewsExplain JumpRisk?
Cojumps andA PredictiveModel
The FinancialCrisis: Pricesand Quantities
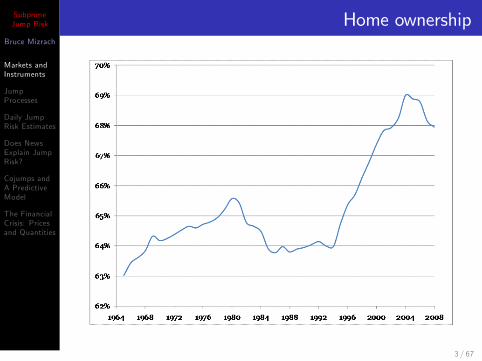
Home ownership
3 / 67
SubprimeJump Risk
Bruce Mizrach
Markets andInstruments
JumpProcesses
Daily JumpRisk Estimates
Does NewsExplain JumpRisk?
Cojumps andA PredictiveModel
The FinancialCrisis: Pricesand Quantities
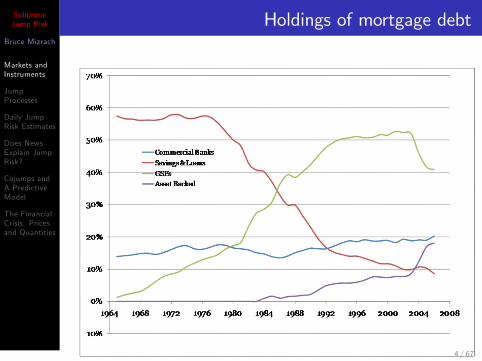
Holdings of mortgage debt
4 / 67
SubprimeJump Risk
Bruce Mizrach
Markets andInstruments
JumpProcesses
Daily JumpRisk Estimates
Does NewsExplain JumpRisk?
Cojumps andA PredictiveModel
The FinancialCrisis: Pricesand Quantities
Subprime, Alt. A, Jumbo
Subprime borrowers who have Fair Isaac & Co. (FICO) creditscores in the low 600s, high loan to value (LTV) ratios, andthey may lack documentation of their income or assets.Schloemer, Li, Ernst, and Keist (2006) estimate that thesubprime share of mortgage originations reached 23% in 2006,up from only 10% in 1998
Alt A mortgages are loans where the borrower possesses astrong credit history, but is in need of non-traditionalunderwriting and processing guidelines. Examples of suchnon-traditional guidelines are the Trustcorp Mortgage: NINA �No Income No Assets.
A jumbo loan exceeds the borrowing limits of Federal HousingAministration (FHA) conforming mortgates. Until recently, thelimit was $417; 000, but it was raised in March 2008 to$729; 750.
5 / 67
SubprimeJump Risk
Bruce Mizrach
Markets andInstruments
JumpProcesses
Daily JumpRisk Estimates
Does NewsExplain JumpRisk?
Cojumps andA PredictiveModel
The FinancialCrisis: Pricesand Quantities
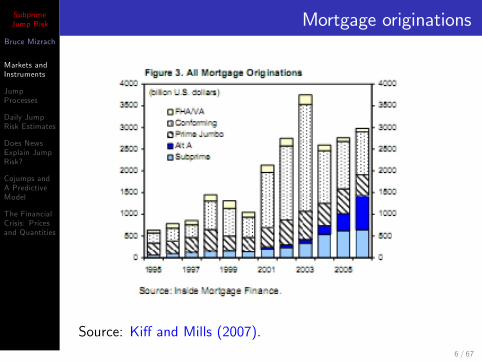
Mortgage originations
Source: Ki¤ and Mills (2007).6 / 67
SubprimeJump Risk
Bruce Mizrach
Markets andInstruments
JumpProcesses
Daily JumpRisk Estimates
Does NewsExplain JumpRisk?
Cojumps andA PredictiveModel
The FinancialCrisis: Pricesand Quantities
Housing indices and futures
The Case-Shiller indices (CSI) use a repeat sale methodology.The index computes a three-month moving average of therepeat sales of single family houses in 20 metropolitan areas.The use of repeat sales is preferable to using a hedonic index tocompensate for changes in quality, but obviously does not avoidit due to home improvements (or lack thereof). The methodproduces a cap-weighted index for residential real estate in aparticular region. A national composite in then produced fromthe regional indices using census weights.
In May 2006, the Chicago Mercantile exchange began tradingfutures on the CSI indices for 10 metropolitan areas: Boston;Chicago; Denver; Las Vegas; Los Angeles; Miami; New York;San Diego; San Francisco; and Washington, D.C. There arealso options on the futures.
7 / 67
SubprimeJump Risk
Bruce Mizrach
Markets andInstruments
JumpProcesses
Daily JumpRisk Estimates
Does NewsExplain JumpRisk?
Cojumps andA PredictiveModel
The FinancialCrisis: Pricesand Quantities
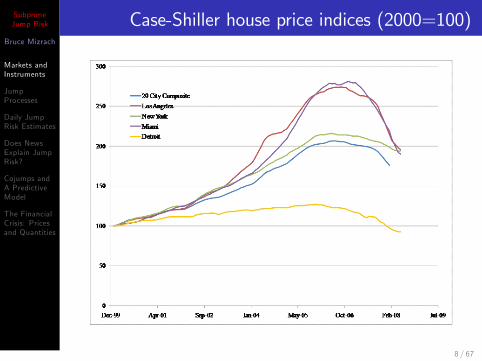
Case-Shiller house price indices (2000=100)
8 / 67
SubprimeJump Risk
Bruce Mizrach
Markets andInstruments
JumpProcesses
Daily JumpRisk Estimates
Does NewsExplain JumpRisk?
Cojumps andA PredictiveModel
The FinancialCrisis: Pricesand Quantities
Foreclosures concentrated in subprime
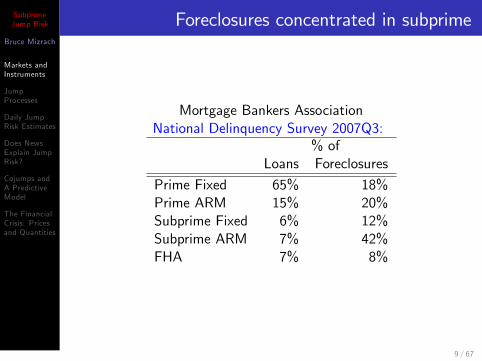
Mortgage Bankers AssociationNational Delinquency Survey 2007Q3:
% ofLoans Foreclosures
Prime Fixed 65% 18%Prime ARM 15% 20%Subprime Fixed 6% 12%Subprime ARM 7% 42%FHA 7% 8%
9 / 67
SubprimeJump Risk
Bruce Mizrach
Markets andInstruments
JumpProcesses
Daily JumpRisk Estimates
Does NewsExplain JumpRisk?
Cojumps andA PredictiveModel
The FinancialCrisis: Pricesand Quantities
HEL ABS
This paper does not study the residential mortgage backedsecurities market (RMBS), but rather a set of home equityloans (HEL) which the market considers to be asset backedsecurities (ABS).
Ashcraft and Schuermann (2008): �First-lien subprimemortgage loans as well as second-lien home equity loans andhome equity lines of credit (HELCOs) are all part of the HELABS sector.�
Other non-conventional mortgages, including Alt-A and Jumboloans, are classi�ed as RMBS.
10 / 67

SubprimeJump Risk
Bruce Mizrach
Markets andInstruments
JumpProcesses
Daily JumpRisk Estimates
Does NewsExplain JumpRisk?
Cojumps andA PredictiveModel
The FinancialCrisis: Pricesand Quantities
Subprime HEL
For more than a decade, HEL have been made available tosubprime borrowers.
According to Fitch, the subprime market originated as much asUSD1.4 trillion of loans in 2005-2007.
As the credit crunch unfolded in 2007, HEL securities facedgrowing credit spreads, deteriorating collateral, and theinevitable ratings downgrades from the credit rating agencies.According to SIFMA, �in excess of 95 percent of ABSdowngrades in the 2005-2007 vintages sector were HEL.�
11 / 67
SubprimeJump Risk
Bruce Mizrach
Markets andInstruments
JumpProcesses
Daily JumpRisk Estimates
Does NewsExplain JumpRisk?
Cojumps andA PredictiveModel
The FinancialCrisis: Pricesand Quantities
ABS credit default swaps
Credit default swaps are derivative securities that pay securityholders contingent upon a credit event. Typically, these aretriggered by some failure to deliver the underlying cash �owspromised to the security pool. There are now very liquidmarkets in credit default swaps on corporate and sovereignbonds.
Credit default swaps on ABS reference individual tranches froma special purpose vehicle (SPV) because they are likely to havea wide range of default probabilities. Protection sellers willcompensate for losses in principal and any interest shortfall.These di¤er from corporate credit default swaps which usuallyinvolve a single payment after a credit event.
ABS credit default swaps can have long maturities. Corporatebond contracts typically last only 5 years.
12 / 67
SubprimeJump Risk
Bruce Mizrach
Markets andInstruments
JumpProcesses
Daily JumpRisk Estimates
Does NewsExplain JumpRisk?
Cojumps andA PredictiveModel
The FinancialCrisis: Pricesand Quantities
Construction of ABX
The ABX indices are aggregators of the performance of avariety of credit default swaps on asset backed securities.
MarkIt Ltd., a London based source of credit derivativesinformation, collects information on individual credit defaultswaps and produces a series of indices that have becomebenchmarks for the industry.
This paper studies the ABX.HE indices which track homeequity loans.
13 / 67
SubprimeJump Risk
Bruce Mizrach
Markets andInstruments
JumpProcesses
Daily JumpRisk Estimates
Does NewsExplain JumpRisk?
Cojumps andA PredictiveModel
The FinancialCrisis: Pricesand Quantities
ABX rolls and tranches
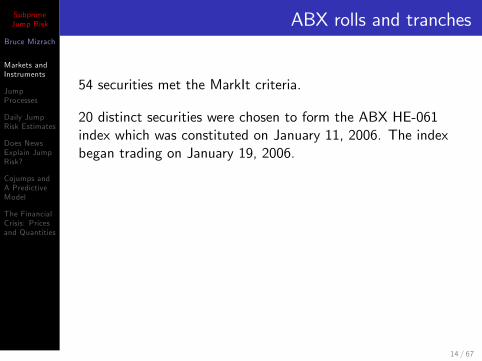
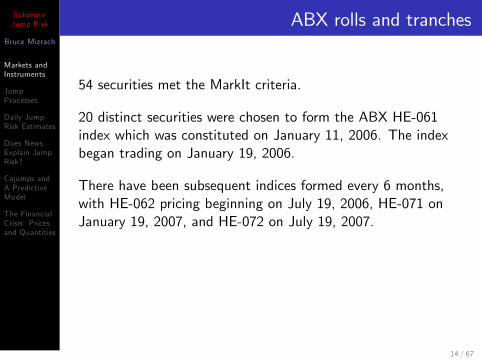
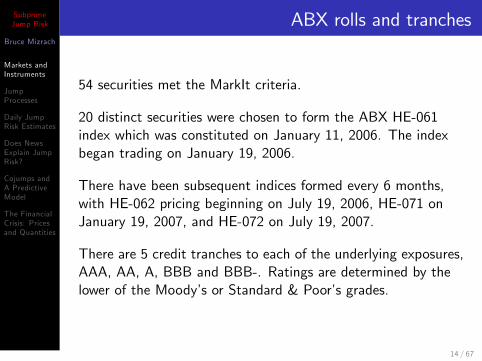
54 securities met the MarkIt criteria.
20 distinct securities were chosen to form the ABX HE-061index which was constituted on January 11, 2006. The indexbegan trading on January 19, 2006.
There have been subsequent indices formed every 6 months,with HE-062 pricing beginning on July 19, 2006, HE-071 onJanuary 19, 2007, and HE-072 on July 19, 2007.
There are 5 credit tranches to each of the underlying exposures,AAA, AA, A, BBB and BBB-. Ratings are determined by thelower of the Moody�s or Standard & Poor�s grades.
14 / 67
SubprimeJump Risk
Bruce Mizrach
Markets andInstruments
JumpProcesses
Daily JumpRisk Estimates
Does NewsExplain JumpRisk?
Cojumps andA PredictiveModel
The FinancialCrisis: Pricesand Quantities
ABX rolls and tranches
54 securities met the MarkIt criteria.
20 distinct securities were chosen to form the ABX HE-061index which was constituted on January 11, 2006. The indexbegan trading on January 19, 2006.
There have been subsequent indices formed every 6 months,with HE-062 pricing beginning on July 19, 2006, HE-071 onJanuary 19, 2007, and HE-072 on July 19, 2007.
There are 5 credit tranches to each of the underlying exposures,AAA, AA, A, BBB and BBB-. Ratings are determined by thelower of the Moody�s or Standard & Poor�s grades.
14 / 67
SubprimeJump Risk
Bruce Mizrach
Markets andInstruments
JumpProcesses
Daily JumpRisk Estimates
Does NewsExplain JumpRisk?
Cojumps andA PredictiveModel
The FinancialCrisis: Pricesand Quantities
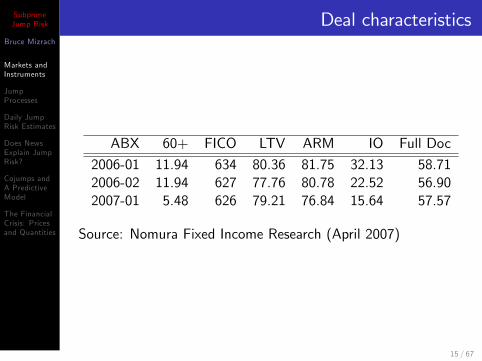
Deal characteristics
ABX 60+ FICO LTV ARM IO Full Doc
2006-01 11.94 634 80.36 81.75 32.13 58.712006-02 11.94 627 77.76 80.78 22.52 56.902007-01 5.48 626 79.21 76.84 15.64 57.57
Source: Nomura Fixed Income Research (April 2007)
15 / 67
SubprimeJump Risk
Bruce Mizrach
Markets andInstruments
JumpProcesses
Daily JumpRisk Estimates
Does NewsExplain JumpRisk?
Cojumps andA PredictiveModel
The FinancialCrisis: Pricesand Quantities
Observations about the issuers
Nearly every major (former!) investment bank is representedincluding Barclays, Goldman Sachs, JP Morgan, Merrill Lynch,Morgan Stanley and UBS.
Non-bank �nancial intermediaries include GMAC.
There are also mortgage originators like Ameriquest,Countrywide, First Franklin, and New Century.
16 / 67
SubprimeJump Risk
Bruce Mizrach
Markets andInstruments
JumpProcesses
Daily JumpRisk Estimates
Does NewsExplain JumpRisk?
Cojumps andA PredictiveModel
The FinancialCrisis: Pricesand Quantities
Cash �ows: coupons
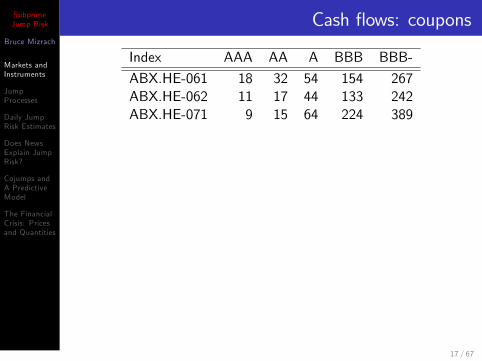
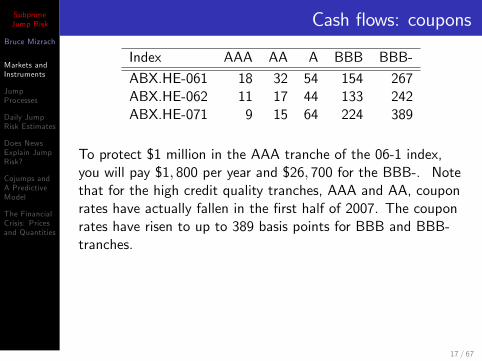
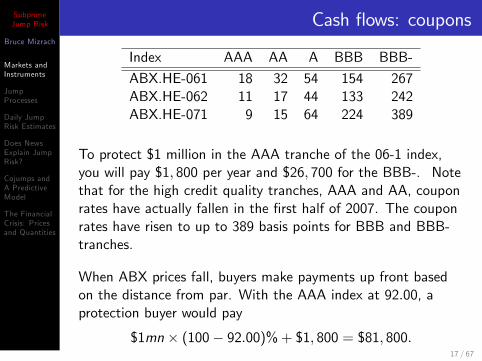
Index AAA AA A BBB BBB-
ABX.HE-061 18 32 54 154 267ABX.HE-062 11 17 44 133 242ABX.HE-071 9 15 64 224 389
To protect $1 million in the AAA tranche of the 06-1 index,you will pay $1; 800 per year and $26; 700 for the BBB-. Notethat for the high credit quality tranches, AAA and AA, couponrates have actually fallen in the �rst half of 2007. The couponrates have risen to up to 389 basis points for BBB and BBB-tranches.
When ABX prices fall, buyers make payments up front basedon the distance from par. With the AAA index at 92:00, aprotection buyer would pay
$1mn � (100� 92:00)% + $1; 800 = $81; 800:
17 / 67
SubprimeJump Risk
Bruce Mizrach
Markets andInstruments
JumpProcesses
Daily JumpRisk Estimates
Does NewsExplain JumpRisk?
Cojumps andA PredictiveModel
The FinancialCrisis: Pricesand Quantities
Cash �ows: coupons
Index AAA AA A BBB BBB-
ABX.HE-061 18 32 54 154 267ABX.HE-062 11 17 44 133 242ABX.HE-071 9 15 64 224 389
To protect $1 million in the AAA tranche of the 06-1 index,you will pay $1; 800 per year and $26; 700 for the BBB-. Notethat for the high credit quality tranches, AAA and AA, couponrates have actually fallen in the �rst half of 2007. The couponrates have risen to up to 389 basis points for BBB and BBB-tranches.
When ABX prices fall, buyers make payments up front basedon the distance from par. With the AAA index at 92:00, aprotection buyer would pay
$1mn � (100� 92:00)% + $1; 800 = $81; 800:17 / 67
SubprimeJump Risk
Bruce Mizrach
Markets andInstruments
JumpProcesses
Daily JumpRisk Estimates
Does NewsExplain JumpRisk?
Cojumps andA PredictiveModel
The FinancialCrisis: Pricesand Quantities
ABX as benchmark
Motivated by the new accounting rule FASB 157, banks arebeing prompted to mark their securities to market prices ratherthan models. The ABX, according to Reuters, is being used toprice up to $1 trillion dollars in subprime mortgage securities.
The ABX indices constitute the best available aggregateindicator of subprime asset backed security valuation.
18 / 67
SubprimeJump Risk
Bruce Mizrach
Markets andInstruments
JumpProcesses
Daily JumpRisk Estimates
Does NewsExplain JumpRisk?
Cojumps andA PredictiveModel
The FinancialCrisis: Pricesand Quantities
Jumps, event risk and VaR
Basel II (2006, p.163) requires that VaR capture �speci�c risk[which] includes the risk that an individual debt or equitysecurity moves by more or less than the general market inday-to-day trading (including periods when the whole market isvolatile) and event risk (where the price of an individual debtor equity security moves precipitously relative to the generalmarket, e.g. on a takeover bid or some other shock event; suchevents would also include the risk of �default�).
Gibson (2001): �incorporating event risk has a large e¤ect onVaR for the long-short [equity] portfolio. The mean [99%1-day] Jump-VaR is as much as 12 percent higher than themean no-jump VaR.�
Bhar and Wang (2008): CDS jump risk is non-diversi�able.
19 / 67
SubprimeJump Risk
Bruce Mizrach
Markets andInstruments
JumpProcesses
Daily JumpRisk Estimates
Does NewsExplain JumpRisk?
Cojumps andA PredictiveModel
The FinancialCrisis: Pricesand Quantities
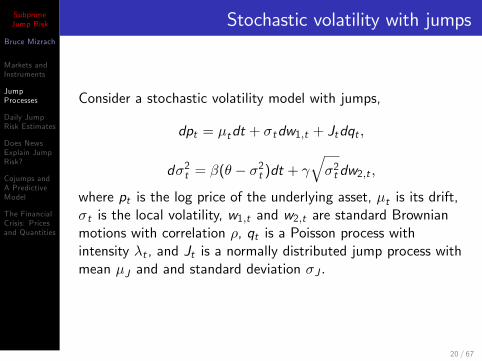
Stochastic volatility with jumps
Consider a stochastic volatility model with jumps,
dpt = �tdt + �tdw1;t + Jtdqt ;
d�2t = �(� � �2t )dt + q�2t dw2;t ;
where pt is the log price of the underlying asset, �t is its drift,�t is the local volatility, w1;t and w2;t are standard Brownianmotions with correlation �, qt is a Poisson process withintensity �t , and Jt is a normally distributed jump process withmean �J and and standard deviation �J :
20 / 67
SubprimeJump Risk
Bruce Mizrach
Markets andInstruments
JumpProcesses
Daily JumpRisk Estimates
Does NewsExplain JumpRisk?
Cojumps andA PredictiveModel
The FinancialCrisis: Pricesand Quantities
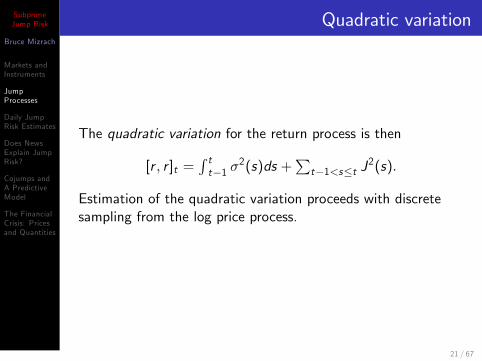
Quadratic variation
The quadratic variation for the return process is then
[r ; r ]t =R tt�1 �
2(s)ds +Pt�1<s�t J
2(s):
Estimation of the quadratic variation proceeds with discretesampling from the log price process.
21 / 67
SubprimeJump Risk
Bruce Mizrach
Markets andInstruments
JumpProcesses
Daily JumpRisk Estimates
Does NewsExplain JumpRisk?
Cojumps andA PredictiveModel
The FinancialCrisis: Pricesand Quantities
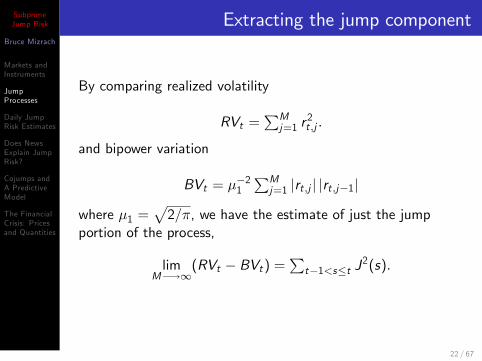
Extracting the jump component
By comparing realized volatility
RVt =PMj=1 r
2t ;j :
and bipower variation
BVt = ��21PMj=1 jrt ;j j jrt ;j�1j
where �1 =p2=�, we have the estimate of just the jump
portion of the process,
limM�!1
(RVt � BVt) =Pt�1<s�t J
2(s):
22 / 67
SubprimeJump Risk
Bruce Mizrach
Markets andInstruments
JumpProcesses
Daily JumpRisk Estimates
Does NewsExplain JumpRisk?
Cojumps andA PredictiveModel
The FinancialCrisis: Pricesand Quantities
Daily returns
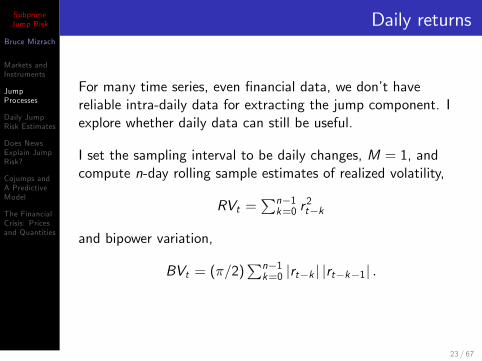
For many time series, even �nancial data, we don�t havereliable intra-daily data for extracting the jump component. Iexplore whether daily data can still be useful.
I set the sampling interval to be daily changes, M = 1, andcompute n-day rolling sample estimates of realized volatility,
RVt =Pn�1k=0 r
2t�k
and bipower variation,
BVt = (�=2)Pn�1k=0 jrt�k j jrt�k�1j :
23 / 67
SubprimeJump Risk
Bruce Mizrach
Markets andInstruments
JumpProcesses
Daily JumpRisk Estimates
Does NewsExplain JumpRisk?
Cojumps andA PredictiveModel
The FinancialCrisis: Pricesand Quantities
Daily returns
For many time series, even �nancial data, we don�t havereliable intra-daily data for extracting the jump component. Iexplore whether daily data can still be useful.
I set the sampling interval to be daily changes, M = 1, andcompute n-day rolling sample estimates of realized volatility,
RVt =Pn�1k=0 r
2t�k
and bipower variation,
BVt = (�=2)Pn�1k=0 jrt�k j jrt�k�1j :
23 / 67
SubprimeJump Risk
Bruce Mizrach
Markets andInstruments
JumpProcesses
Daily JumpRisk Estimates
Does NewsExplain JumpRisk?
Cojumps andA PredictiveModel
The FinancialCrisis: Pricesand Quantities
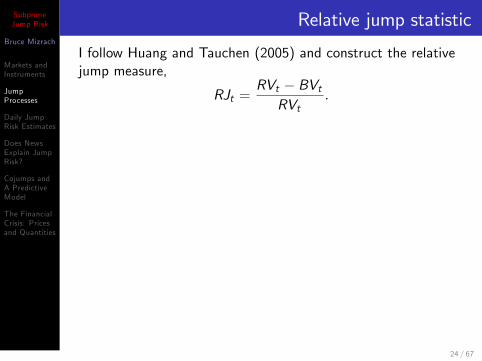
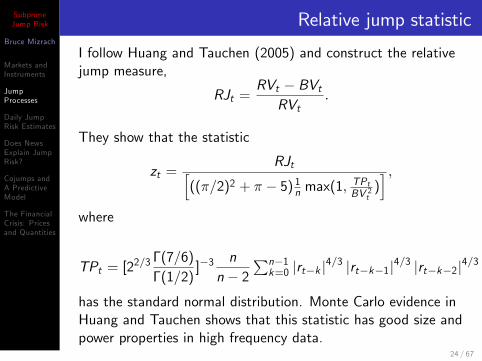
Relative jump statistic
I follow Huang and Tauchen (2005) and construct the relativejump measure,
RJt =RVt � BVtRVt
:
They show that the statistic
zt =RJth
((�=2)2 + � � 5) 1n max(1;TPtBV 2t
)i ;
where
TPt = [22=3�(7=6)�(1=2)
]�3n
n � 2Pn�1k=0 jrt�k j
4=3 jrt�k�1j4=3 jrt�k�2j4=3 ;
has the standard normal distribution. Monte Carlo evidence inHuang and Tauchen shows that this statistic has good size andpower properties in high frequency data.
24 / 67
SubprimeJump Risk
Bruce Mizrach
Markets andInstruments
JumpProcesses
Daily JumpRisk Estimates
Does NewsExplain JumpRisk?
Cojumps andA PredictiveModel
The FinancialCrisis: Pricesand Quantities
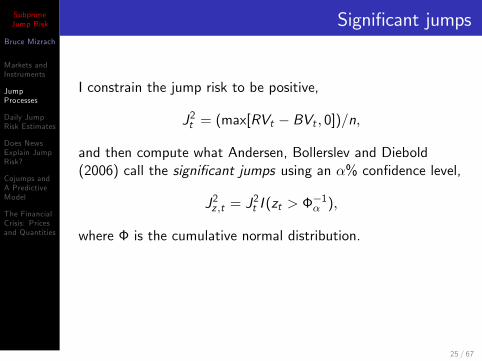
Signi�cant jumps
I constrain the jump risk to be positive,
J2t = (max[RVt � BVt ; 0])=n;
and then compute what Andersen, Bollerslev and Diebold(2006) call the signi�cant jumps using an �% con�dence level,
J2z ;t = J2t I (zt > �
�1� );
where � is the cumulative normal distribution.
Empiricists typically �nd �too many� jumps in intradaily datawhich they compensate for by adjusting �:
25 / 67
SubprimeJump Risk
Bruce Mizrach
Markets andInstruments
JumpProcesses
Daily JumpRisk Estimates
Does NewsExplain JumpRisk?
Cojumps andA PredictiveModel
The FinancialCrisis: Pricesand Quantities
Monte Carlo: DGP
Drift: �(t) = 0
Volatility mean reversion: � = 0:10
Volatility of volatility = 0:05:
Jump frequency �dt = 0:05dt.
Average jump size �J = 0:20 with a standard deviation of�J = 1:40.
The return and volatility shocks have a correlation of� = �0:5:
26 / 67
SubprimeJump Risk
Bruce Mizrach
Markets andInstruments
JumpProcesses
Daily JumpRisk Estimates
Does NewsExplain JumpRisk?
Cojumps andA PredictiveModel
The FinancialCrisis: Pricesand Quantities
Implications for relative jumps
Tauchen and Zhou (2007) note that as you raise the long runmean of volatility �, you lower the jump contribution to thetotal variance. At � = 0:9, the jump contributes only 10%, butat � = 0:025, the jump contribution rises to 76%: I alsoconsider an intermediate case with � = 0:2 where the jumpcontributes 33%:
I use 400 days of simulated 1-minute data which are sampledat 5-minute and daily intervals: For the daily estimator, I setthe moving average to n = 50: The tick frequency and samplelength approximate those of the ABX sample.
27 / 67
SubprimeJump Risk
Bruce Mizrach
Markets andInstruments
JumpProcesses
Daily JumpRisk Estimates
Does NewsExplain JumpRisk?
Cojumps andA PredictiveModel
The FinancialCrisis: Pricesand Quantities
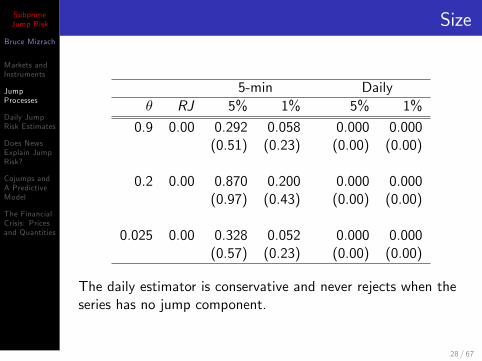
Size
5-min Daily� RJ 5% 1% 5% 1%
0.9 0.00 0.292 0.058 0.000 0.000(0.51) (0.23) (0.00) (0.00)
0.2 0.00 0.870 0.200 0.000 0.000(0.97) (0.43) (0.00) (0.00)
0.025 0.00 0.328 0.052 0.000 0.000(0.57) (0.23) (0.00) (0.00)
The daily estimator is conservative and never rejects when theseries has no jump component.
28 / 67
SubprimeJump Risk
Bruce Mizrach
Markets andInstruments
JumpProcesses
Daily JumpRisk Estimates
Does NewsExplain JumpRisk?
Cojumps andA PredictiveModel
The FinancialCrisis: Pricesand Quantities
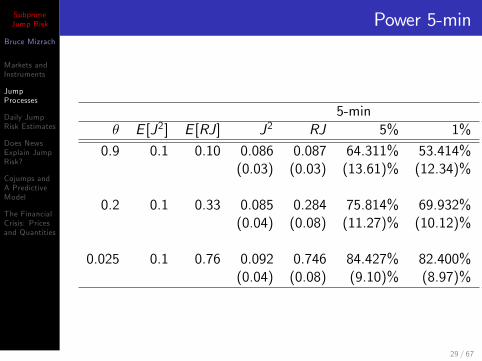
Power 5-min
5-min� E [J2] E [RJ] J2 RJ 5% 1%
0.9 0.1 0.10 0.086 0.087 64.311% 53.414%(0.03) (0.03) (13.61)% (12.34)%
0.2 0.1 0.33 0.085 0.284 75.814% 69.932%(0.04) (0.08) (11.27)% (10.12)%
0.025 0.1 0.76 0.092 0.746 84.427% 82.400%(0.04) (0.08) (9.10)% (8.97)%
29 / 67
SubprimeJump Risk
Bruce Mizrach
Markets andInstruments
JumpProcesses
Daily JumpRisk Estimates
Does NewsExplain JumpRisk?
Cojumps andA PredictiveModel
The FinancialCrisis: Pricesand Quantities
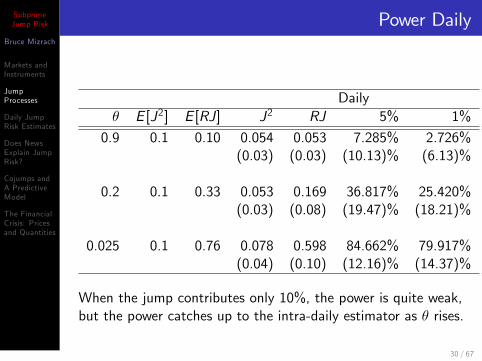
Power Daily
Daily� E [J2] E [RJ] J2 RJ 5% 1%
0.9 0.1 0.10 0.054 0.053 7.285% 2.726%(0.03) (0.03) (10.13)% (6.13)%
0.2 0.1 0.33 0.053 0.169 36.817% 25.420%(0.03) (0.08) (19.47)% (18.21)%
0.025 0.1 0.76 0.078 0.598 84.662% 79.917%(0.04) (0.10) (12.16)% (14.37)%
When the jump contributes only 10%, the power is quite weak,but the power catches up to the intra-daily estimator as � rises.
30 / 67
SubprimeJump Risk
Bruce Mizrach
Markets andInstruments
JumpProcesses
Daily JumpRisk Estimates
Does NewsExplain JumpRisk?
Cojumps andA PredictiveModel
The FinancialCrisis: Pricesand Quantities
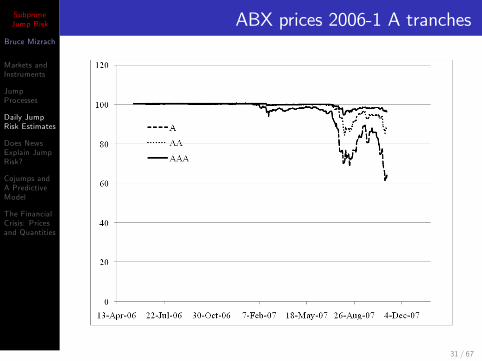
ABX prices 2006-1 A tranches
31 / 67
SubprimeJump Risk
Bruce Mizrach
Markets andInstruments
JumpProcesses
Daily JumpRisk Estimates
Does NewsExplain JumpRisk?
Cojumps andA PredictiveModel
The FinancialCrisis: Pricesand Quantities
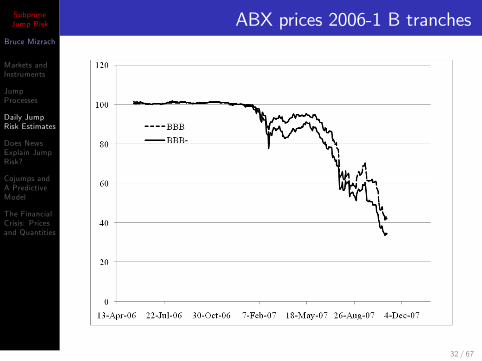
ABX prices 2006-1 B tranches
32 / 67
SubprimeJump Risk
Bruce Mizrach
Markets andInstruments
JumpProcesses
Daily JumpRisk Estimates
Does NewsExplain JumpRisk?
Cojumps andA PredictiveModel
The FinancialCrisis: Pricesand Quantities
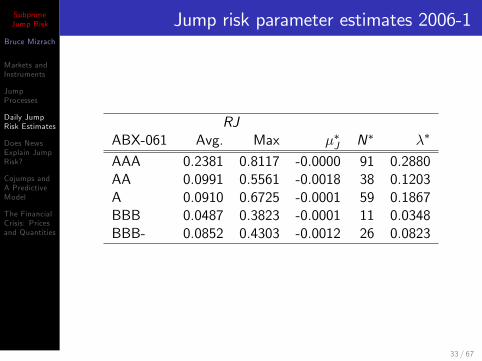
Jump risk parameter estimates 2006-1
RJABX-061 Avg. Max ��J N� ��
AAA 0.2381 0.8117 -0.0000 91 0.2880AA 0.0991 0.5561 -0.0018 38 0.1203A 0.0910 0.6725 -0.0001 59 0.1867BBB 0.0487 0.3823 -0.0001 11 0.0348BBB- 0.0852 0.4303 -0.0012 26 0.0823
33 / 67
SubprimeJump Risk
Bruce Mizrach
Markets andInstruments
JumpProcesses
Daily JumpRisk Estimates
Does NewsExplain JumpRisk?
Cojumps andA PredictiveModel
The FinancialCrisis: Pricesand Quantities
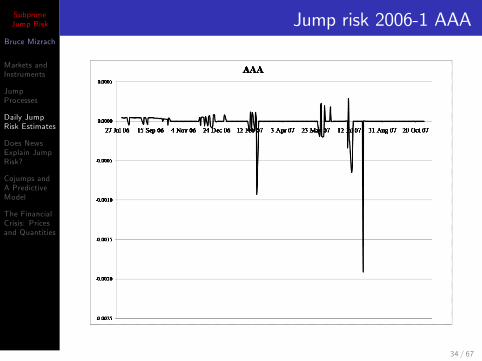
Jump risk 2006-1 AAA
34 / 67
SubprimeJump Risk
Bruce Mizrach
Markets andInstruments
JumpProcesses
Daily JumpRisk Estimates
Does NewsExplain JumpRisk?
Cojumps andA PredictiveModel
The FinancialCrisis: Pricesand Quantities
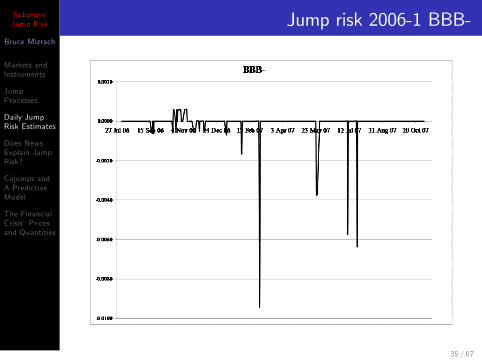
Jump risk 2006-1 BBB-
35 / 67
SubprimeJump Risk
Bruce Mizrach
Markets andInstruments
JumpProcesses
Daily JumpRisk Estimates
Does NewsExplain JumpRisk?
Cojumps andA PredictiveModel
The FinancialCrisis: Pricesand Quantities
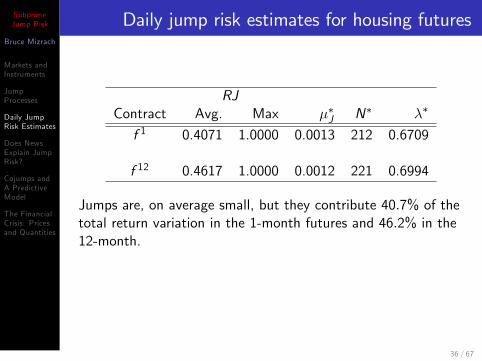
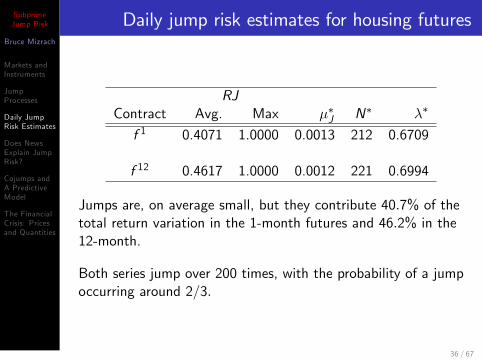
Daily jump risk estimates for housing futures
RJContract Avg. Max ��J N� ��
f 1 0.4071 1.0000 0.0013 212 0.6709
f 12 0.4617 1.0000 0.0012 221 0.6994
Jumps are, on average small, but they contribute 40:7% of thetotal return variation in the 1-month futures and 46:2% in the12-month.
Both series jump over 200 times, with the probability of a jumpoccurring around 2=3:
36 / 67
SubprimeJump Risk
Bruce Mizrach
Markets andInstruments
JumpProcesses
Daily JumpRisk Estimates
Does NewsExplain JumpRisk?
Cojumps andA PredictiveModel
The FinancialCrisis: Pricesand Quantities
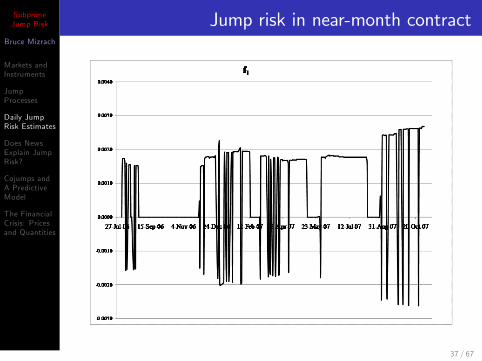
Jump risk in near-month contract
37 / 67
SubprimeJump Risk
Bruce Mizrach
Markets andInstruments
JumpProcesses
Daily JumpRisk Estimates
Does NewsExplain JumpRisk?
Cojumps andA PredictiveModel
The FinancialCrisis: Pricesand Quantities
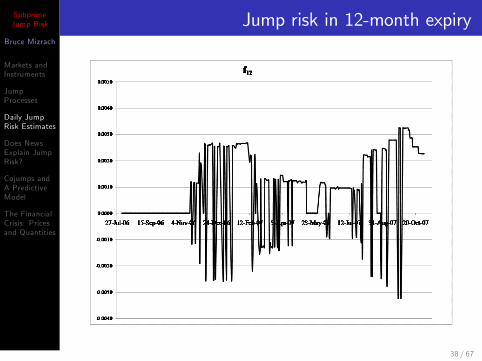
Jump risk in 12-month expiry
38 / 67
SubprimeJump Risk
Bruce Mizrach
Markets andInstruments
JumpProcesses
Daily JumpRisk Estimates
Does NewsExplain JumpRisk?
Cojumps andA PredictiveModel
The FinancialCrisis: Pricesand Quantities
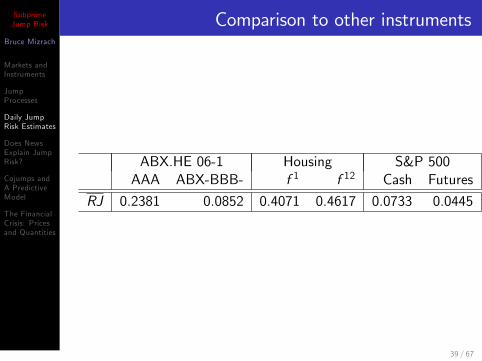
Comparison to other instruments
ABX.HE 06-1 Housing S&P 500AAA ABX-BBB- f 1 f 12 Cash Futures
RJ 0.2381 0.0852 0.4071 0.4617 0.0733 0.0445
39 / 67
SubprimeJump Risk
Bruce Mizrach
Markets andInstruments
JumpProcesses
Daily JumpRisk Estimates
Does NewsExplain JumpRisk?
Cojumps andA PredictiveModel
The FinancialCrisis: Pricesand Quantities
Subprime comes onto the radar
The Wall Street Journal noted in January 8, 2008, that in thenewspaper, there were 75 mentions of the word subprime in thesecond half of 2006. In the second half of 2007, there were1; 561: The question before us here is whether jump risk didany better anticipating it.
40 / 67

SubprimeJump Risk
Bruce Mizrach
Markets andInstruments
JumpProcesses
Daily JumpRisk Estimates
Does NewsExplain JumpRisk?
Cojumps andA PredictiveModel
The FinancialCrisis: Pricesand Quantities
News timelines
I utilize three time lines that have been published since thesubprime crisis hit. (1) BBC; (2) JEC; (3) PIMCO;
I gathered news stories from the three timelines about (1)Federal Reserve actions; (2) Materials news from subprimelenders like Countrywide and investment banks like MerrillLynch; (3) I excluded macroeconomic news unless it appearedon at least 2 of 3 timelines. The stories caught by these �ltersare listed in Table 6.
41 / 67
SubprimeJump Risk
Bruce Mizrach
Markets andInstruments
JumpProcesses
Daily JumpRisk Estimates
Does NewsExplain JumpRisk?
Cojumps andA PredictiveModel
The FinancialCrisis: Pricesand Quantities
Measuring news �ow
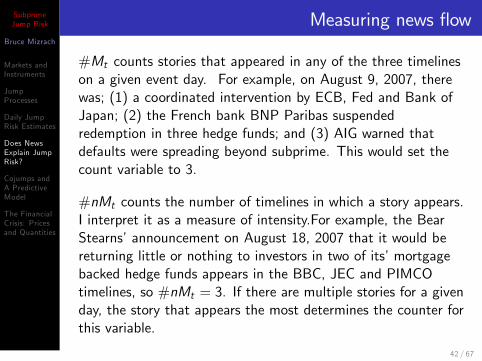
#Mt counts stories that appeared in any of the three timelineson a given event day. For example, on August 9, 2007, therewas; (1) a coordinated intervention by ECB, Fed and Bank ofJapan; (2) the French bank BNP Paribas suspendedredemption in three hedge funds; and (3) AIG warned thatdefaults were spreading beyond subprime. This would set thecount variable to 3.
#nMt counts the number of timelines in which a story appears.I interpret it as a measure of intensity.For example, the BearStearns�announcement on August 18, 2007 that it would bereturning little or nothing to investors in two of its�mortgagebacked hedge funds appears in the BBC, JEC and PIMCOtimelines, so #nMt = 3. If there are multiple stories for a givenday, the story that appears the most determines the counter forthis variable.
42 / 67
SubprimeJump Risk
Bruce Mizrach
Markets andInstruments
JumpProcesses
Daily JumpRisk Estimates
Does NewsExplain JumpRisk?
Cojumps andA PredictiveModel
The FinancialCrisis: Pricesand Quantities
Measuring news �ow
#Mt counts stories that appeared in any of the three timelineson a given event day. For example, on August 9, 2007, therewas; (1) a coordinated intervention by ECB, Fed and Bank ofJapan; (2) the French bank BNP Paribas suspendedredemption in three hedge funds; and (3) AIG warned thatdefaults were spreading beyond subprime. This would set thecount variable to 3.
#nMt counts the number of timelines in which a story appears.I interpret it as a measure of intensity.For example, the BearStearns�announcement on August 18, 2007 that it would bereturning little or nothing to investors in two of its�mortgagebacked hedge funds appears in the BBC, JEC and PIMCOtimelines, so #nMt = 3. If there are multiple stories for a givenday, the story that appears the most determines the counter forthis variable.
42 / 67
SubprimeJump Risk
Bruce Mizrach
Markets andInstruments
JumpProcesses
Daily JumpRisk Estimates
Does NewsExplain JumpRisk?
Cojumps andA PredictiveModel
The FinancialCrisis: Pricesand Quantities
Triple XXX news �ow
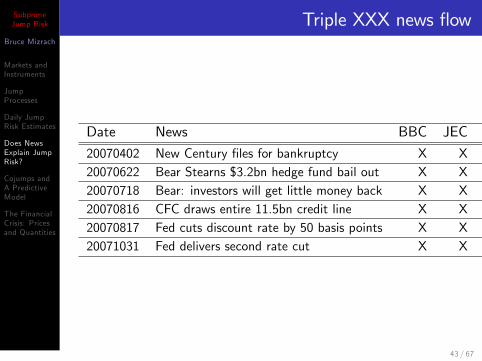
Date News BBC JEC PIMCO
20070402 New Century �les for bankruptcy X X X20070622 Bear Stearns $3.2bn hedge fund bail out X X X20070718 Bear: investors will get little money back X X X20070816 CFC draws entire 11.5bn credit line X X X20070817 Fed cuts discount rate by 50 basis points X X X20071031 Fed delivers second rate cut X X X
43 / 67

SubprimeJump Risk
Bruce Mizrach
Markets andInstruments
JumpProcesses
Daily JumpRisk Estimates
Does NewsExplain JumpRisk?
Cojumps andA PredictiveModel
The FinancialCrisis: Pricesand Quantities
News �ow regressions
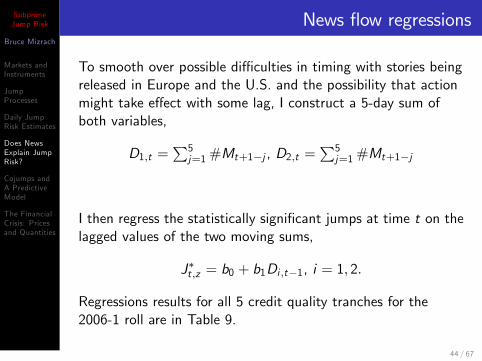
To smooth over possible di¢ culties in timing with stories beingreleased in Europe and the U.S. and the possibility that actionmight take e¤ect with some lag, I construct a 5-day sum ofboth variables,
D1;t =P5j=1#Mt+1�j , D2;t =
P5j=1#Mt+1�j
I then regress the statistically signi�cant jumps at time t on thelagged values of the two moving sums,
J�t ;z = b0 + b1Di ;t�1, i = 1; 2:
Regressions results for all 5 credit quality tranches for the2006-1 roll are in Table 9.
44 / 67
SubprimeJump Risk
Bruce Mizrach
Markets andInstruments
JumpProcesses
Daily JumpRisk Estimates
Does NewsExplain JumpRisk?
Cojumps andA PredictiveModel
The FinancialCrisis: Pricesand Quantities
News �ow regressions
To smooth over possible di¢ culties in timing with stories beingreleased in Europe and the U.S. and the possibility that actionmight take e¤ect with some lag, I construct a 5-day sum ofboth variables,
D1;t =P5j=1#Mt+1�j , D2;t =
P5j=1#Mt+1�j
I then regress the statistically signi�cant jumps at time t on thelagged values of the two moving sums,
J�t ;z = b0 + b1Di ;t�1, i = 1; 2:
Regressions results for all 5 credit quality tranches for the2006-1 roll are in Table 9.
44 / 67
SubprimeJump Risk
Bruce Mizrach
Markets andInstruments
JumpProcesses
Daily JumpRisk Estimates
Does NewsExplain JumpRisk?
Cojumps andA PredictiveModel
The FinancialCrisis: Pricesand Quantities
News explains subprime jump risk
News explains the jumps best in the AAA and BBB- tranches.The best �t is with the D2 variable for the AAA, where newsexplains 56% of the jump risk. For the BBB-, the same variableexplains nearly 53%.
In the middle tranches, the �ts are respectable to poor. For theA and AA, news explains between 9% and 23% of the jumps.The BBB tranche, which has only 11 jumps, is uncorrelatedwith the news �ow.
45 / 67
SubprimeJump Risk
Bruce Mizrach
Markets andInstruments
JumpProcesses
Daily JumpRisk Estimates
Does NewsExplain JumpRisk?
Cojumps andA PredictiveModel
The FinancialCrisis: Pricesand Quantities
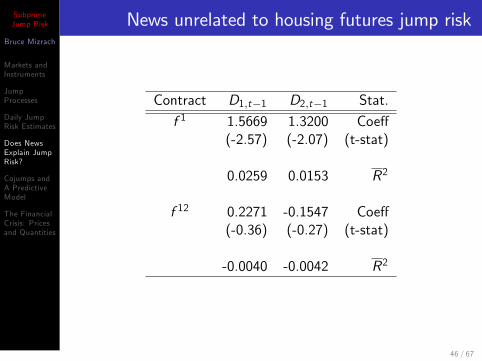
News unrelated to housing futures jump risk
Contract D1;t�1 D2;t�1 Stat.
f 1 1.5669 1.3200 Coe¤(-2.57) (-2.07) (t-stat)
0.0259 0.0153 R2
f 12 0.2271 -0.1547 Coe¤(-0.36) (-0.27) (t-stat)
-0.0040 -0.0042 R2
46 / 67
SubprimeJump Risk
Bruce Mizrach
Markets andInstruments
JumpProcesses
Daily JumpRisk Estimates
Does NewsExplain JumpRisk?
Cojumps andA PredictiveModel
The FinancialCrisis: Pricesand Quantities
Jumps in multiple markets
Bollerslev, Law and Tauchen (BLT, 2007) have proposed ameasure of the cross correlation of markets to look at jumpsoccurring simultaneously in more than one market, calledcojumps. I restrict the analysis here to the contemporaneousdaily correlation,
cpt =Pn�1k=0 r1;t�k r2;t�k ;
where r1;t and r2;t are the returns in markets 1 and 2.
47 / 67
SubprimeJump Risk
Bruce Mizrach
Markets andInstruments
JumpProcesses
Daily JumpRisk Estimates
Does NewsExplain JumpRisk?
Cojumps andA PredictiveModel
The FinancialCrisis: Pricesand Quantities
Studentized statistic
There is, as of this writing, no formal asymptotic theory forcojumps, so I follow BLT and use the studentized statistic,
zcp;t =cpt � cpscp
;
wherecp =
1TPTt=1 cpt ;
and
scp =�
1T � 1
PTt=1(cpt � cp)
2�1=2
:
I will designate the signi�cant cojumps as
cp�t ;z = sign(r1;t r2;t)� cpt I (jzt j > ��1� ):
I use the absolute value because the cojump test is two-sided. Iexplore the �nite sample performance in the next section.
48 / 67

SubprimeJump Risk
Bruce Mizrach
Markets andInstruments
JumpProcesses
Daily JumpRisk Estimates
Does NewsExplain JumpRisk?
Cojumps andA PredictiveModel
The FinancialCrisis: Pricesand Quantities
Cojump power simulation
� = 0:1 � = 0:5�J 5% 1% 5% 1%
0:50 92:532% 90:442% 90:103% 88:502%(19:68)% (23:25)% (22:73)% (25:13)%
0:75 88:810% 87:088% 87:710% 86:118%(17:99)% (19:54)% (20:15)% (21:24)%
At �J = 0:5. The test is quite powerful and seems una¤ectedby the jump contribution to the variance. We reject between90 and 92:5% at the 5% signi�cance level. As we increase thenumber of cojumps by setting �J = 0:75; the detection ratefalls o¤ just a little, to 87:7% at the 5% level for the case� = 0:5
49 / 67
SubprimeJump Risk
Bruce Mizrach
Markets andInstruments
JumpProcesses
Daily JumpRisk Estimates
Does NewsExplain JumpRisk?
Cojumps andA PredictiveModel
The FinancialCrisis: Pricesand Quantities
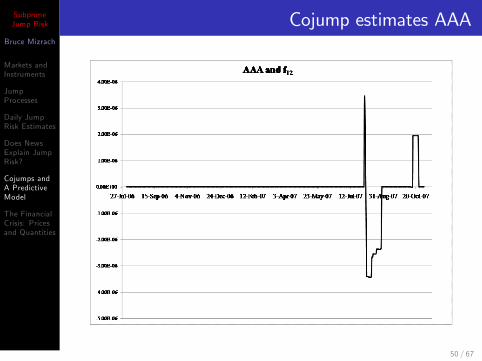
Cojump estimates AAA
50 / 67
SubprimeJump Risk
Bruce Mizrach
Markets andInstruments
JumpProcesses
Daily JumpRisk Estimates
Does NewsExplain JumpRisk?
Cojumps andA PredictiveModel
The FinancialCrisis: Pricesand Quantities
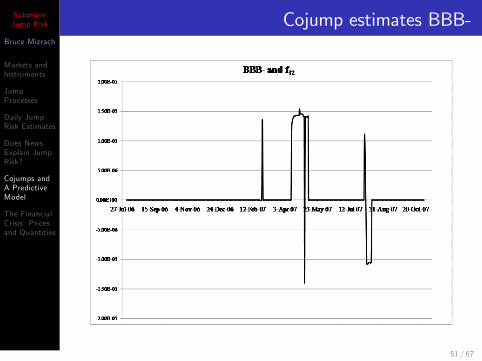
Cojump estimates BBB-
51 / 67
SubprimeJump Risk
Bruce Mizrach
Markets andInstruments
JumpProcesses
Daily JumpRisk Estimates
Does NewsExplain JumpRisk?
Cojumps andA PredictiveModel
The FinancialCrisis: Pricesand Quantities
Discussion of cojump risk
There are 25 signi�cant cojumps in the AAA tranche/12-monthfutures pair. All of these episodes occur in the summer of 2007once the subprime crisis was well under way. There is asigni�cant negative period in August 2007 followed by a shorterpositive episode in mid-to-late October.
I identify 27 signi�cant cojumps in the BBB- pairing. There isa strong positive spike on February 27, 2007 which is the daythat jump risk spikes in the BBB- ABX tranche. There aresome positive moves in the ABX index in late May and earlyJune 2007. Cojump risk is negative again in the �rst part ofAugust. The BBB- remains insigni�cant for the rest of thesample after August 13.
52 / 67
SubprimeJump Risk
Bruce Mizrach
Markets andInstruments
JumpProcesses
Daily JumpRisk Estimates
Does NewsExplain JumpRisk?
Cojumps andA PredictiveModel
The FinancialCrisis: Pricesand Quantities
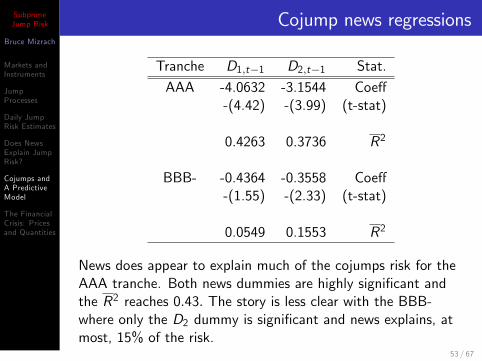
Cojump news regressions
Tranche D1;t�1 D2;t�1 Stat.
AAA -4.0632 -3.1544 Coe¤-(4.42) -(3.99) (t-stat)
0.4263 0.3736 R2
BBB- -0.4364 -0.3558 Coe¤-(1.55) -(2.33) (t-stat)
0.0549 0.1553 R2
News does appear to explain much of the cojumps risk for theAAA tranche. Both news dummies are highly signi�cant andthe R2 reaches 0:43: The story is less clear with the BBB-where only the D2 dummy is signi�cant and news explains, atmost, 15% of the risk.
53 / 67
SubprimeJump Risk
Bruce Mizrach
Markets andInstruments
JumpProcesses
Daily JumpRisk Estimates
Does NewsExplain JumpRisk?
Cojumps andA PredictiveModel
The FinancialCrisis: Pricesand Quantities
Predictive model of jump risk
To capture jump risk persistence, I will include lagged jumpsJ�1;t�1;z in the empirical model. Extreme events are modeledusing lagged squared values of the ABX jumps, J2�1;t�1;z :
The cojump risk from the housing market J�2;t�1;z is in ourspeci�cation as well.
Finally, there may be risks to the ABX index from changes inhome prices in the near future. I include the slope of thehousing futures curve (f 12t�1 � f 1t�1) as the �nal explanatoryvariable,
J�1;t ;z = b0+b1J�1;t�1;z+b2J
2�1;t�1;z+b3J
�2;t�1;z+b4(f
12t�1� f 1t�1):
54 / 67
SubprimeJump Risk
Bruce Mizrach
Markets andInstruments
JumpProcesses
Daily JumpRisk Estimates
Does NewsExplain JumpRisk?
Cojumps andA PredictiveModel
The FinancialCrisis: Pricesand Quantities
Predictive model of jump risk
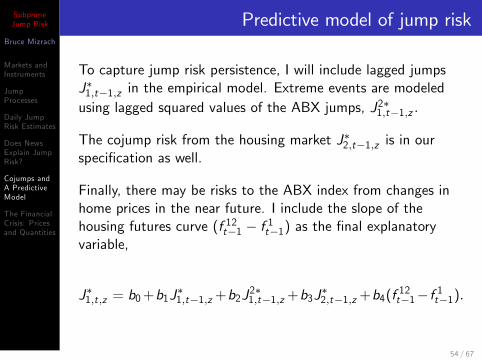
To capture jump risk persistence, I will include lagged jumpsJ�1;t�1;z in the empirical model. Extreme events are modeledusing lagged squared values of the ABX jumps, J2�1;t�1;z :
The cojump risk from the housing market J�2;t�1;z is in ourspeci�cation as well.
Finally, there may be risks to the ABX index from changes inhome prices in the near future. I include the slope of thehousing futures curve (f 12t�1 � f 1t�1) as the �nal explanatoryvariable,
J�1;t ;z = b0+b1J�1;t�1;z+b2J
2�1;t�1;z+b3J
�2;t�1;z+b4(f
12t�1� f 1t�1):
54 / 67
SubprimeJump Risk
Bruce Mizrach
Markets andInstruments
JumpProcesses
Daily JumpRisk Estimates
Does NewsExplain JumpRisk?
Cojumps andA PredictiveModel
The FinancialCrisis: Pricesand Quantities
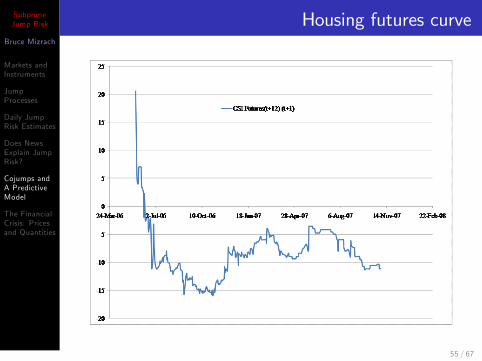
Housing futures curve
55 / 67
SubprimeJump Risk
Bruce Mizrach
Markets andInstruments
JumpProcesses
Daily JumpRisk Estimates
Does NewsExplain JumpRisk?
Cojumps andA PredictiveModel
The FinancialCrisis: Pricesand Quantities
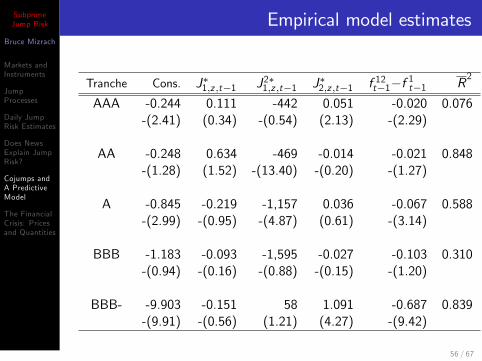
Empirical model estimates
Tranche Cons. J�1;z ;t�1 J2�1;z ;t�1 J�2;z ;t�1 f 12t�1�f 1t�1 R2
AAA -0.244 0.111 -442 0.051 -0.020 0.076-(2.41) (0.34) -(0.54) (2.13) -(2.29)
AA -0.248 0.634 -469 -0.014 -0.021 0.848-(1.28) (1.52) -(13.40) -(0.20) -(1.27)
A -0.845 -0.219 -1,157 0.036 -0.067 0.588-(2.99) -(0.95) -(4.87) (0.61) -(3.14)
BBB -1.183 -0.093 -1,595 -0.027 -0.103 0.310-(0.94) -(0.16) -(0.88) -(0.15) -(1.20)
BBB- -9.903 -0.151 58 1.091 -0.687 0.839-(9.91) -(0.56) (1.21) (4.27) -(9.42)
56 / 67

SubprimeJump Risk
Bruce Mizrach
Markets andInstruments
JumpProcesses
Daily JumpRisk Estimates
Does NewsExplain JumpRisk?
Cojumps andA PredictiveModel
The FinancialCrisis: Pricesand Quantities
Discussion of model estimates 1/2
The model �ts the data quite well, explaining 31% to 85% ofthe jumps.
b1, the coe¢ cient on lagged jumps, is statistically insigni�cantin each speci�cation, but the lagged squared jump risk, b2, issigni�cant for the AA and A tranches. The extreme jumpsappear to be climatic for the market and lower the jump riskthe next day, b2 < 0:
Jump risk from the housing futures appears to matter only forthe highest and lowest rated tranches, and it tends to increasethe jump size, b3 > 0.
57 / 67

SubprimeJump Risk
Bruce Mizrach
Markets andInstruments
JumpProcesses
Daily JumpRisk Estimates
Does NewsExplain JumpRisk?
Cojumps andA PredictiveModel
The FinancialCrisis: Pricesand Quantities
Discussion of model estimates 2/2
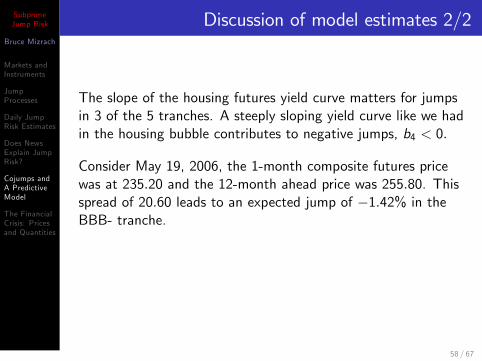
The slope of the housing futures yield curve matters for jumpsin 3 of the 5 tranches. A steeply sloping yield curve like we hadin the housing bubble contributes to negative jumps, b4 < 0:
Consider May 19, 2006, the 1-month composite futures pricewas at 235:20 and the 12-month ahead price was 255:80. Thisspread of 20:60 leads to an expected jump of �1:42% in theBBB- tranche.
A possibly hopeful sign is that the inversion of the futurescurve since June 19, 2006 makes jumps up more likely.
58 / 67
SubprimeJump Risk
Bruce Mizrach
Markets andInstruments
JumpProcesses
Daily JumpRisk Estimates
Does NewsExplain JumpRisk?
Cojumps andA PredictiveModel
The FinancialCrisis: Pricesand Quantities
Discussion of model estimates 2/2
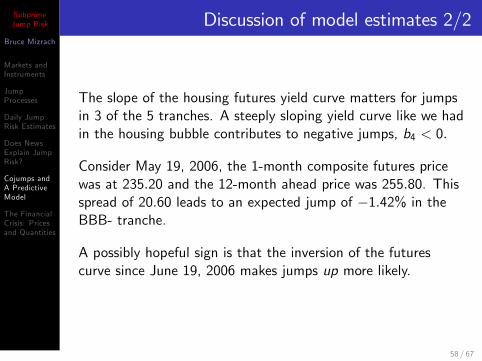
The slope of the housing futures yield curve matters for jumpsin 3 of the 5 tranches. A steeply sloping yield curve like we hadin the housing bubble contributes to negative jumps, b4 < 0:
Consider May 19, 2006, the 1-month composite futures pricewas at 235:20 and the 12-month ahead price was 255:80. Thisspread of 20:60 leads to an expected jump of �1:42% in theBBB- tranche.
A possibly hopeful sign is that the inversion of the futurescurve since June 19, 2006 makes jumps up more likely.
58 / 67
SubprimeJump Risk
Bruce Mizrach
Markets andInstruments
JumpProcesses
Daily JumpRisk Estimates
Does NewsExplain JumpRisk?
Cojumps andA PredictiveModel
The FinancialCrisis: Pricesand Quantities
Discussion of model estimates 2/2
The slope of the housing futures yield curve matters for jumpsin 3 of the 5 tranches. A steeply sloping yield curve like we hadin the housing bubble contributes to negative jumps, b4 < 0:
Consider May 19, 2006, the 1-month composite futures pricewas at 235:20 and the 12-month ahead price was 255:80. Thisspread of 20:60 leads to an expected jump of �1:42% in theBBB- tranche.
A possibly hopeful sign is that the inversion of the futurescurve since June 19, 2006 makes jumps up more likely.
58 / 67
SubprimeJump Risk
Bruce Mizrach
Markets andInstruments
JumpProcesses
Daily JumpRisk Estimates
Does NewsExplain JumpRisk?
Cojumps andA PredictiveModel
The FinancialCrisis: Pricesand Quantities
Market losers
Mortgage originators: New Century (Apr. 2, 2007) andCountrywide (Jan. 11, 2008); RMBS guarantors: Fannie andFreddie (Sept. 7, 2008).
IndyMac (July 12, 2008) and Washington Mutual (Sep. 26,2008), the nation�s largest thrift, seized by the FDIC. Therehave been 12 failures as of September 2008.
The investment banking landscape has been permanentlytransformed: Bear (Mar 16, 2008), Lehman (Sep 15, 2008),Merrill (Sep. 15, 2008).
59 / 67
SubprimeJump Risk
Bruce Mizrach
Markets andInstruments
JumpProcesses
Daily JumpRisk Estimates
Does NewsExplain JumpRisk?
Cojumps andA PredictiveModel
The FinancialCrisis: Pricesand Quantities
Market winners
The Wall Street Journal reported in December 14, 2007 thatGoldman Sachs�structured products trading group earned morethan $4bn in pro�ts in 2007 from shorting subprime securitiesusing the ABX.
John Paulson�s Credit Opportunities hedge fund returned589:9% in 2007 betting on a decline in subprime mortgages,generating Paulson $3:7bn. Andrew Lahde�s US ResidentialReal Estate Hedge V Class A was up more than 1000% in 2007.
60 / 67
SubprimeJump Risk
Bruce Mizrach
Markets andInstruments
JumpProcesses
Daily JumpRisk Estimates
Does NewsExplain JumpRisk?
Cojumps andA PredictiveModel
The FinancialCrisis: Pricesand Quantities
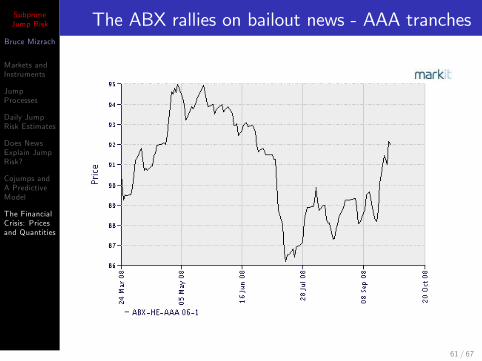
The ABX rallies on bailout news - AAA tranches
61 / 67
SubprimeJump Risk
Bruce Mizrach
Markets andInstruments
JumpProcesses
Daily JumpRisk Estimates
Does NewsExplain JumpRisk?
Cojumps andA PredictiveModel
The FinancialCrisis: Pricesand Quantities
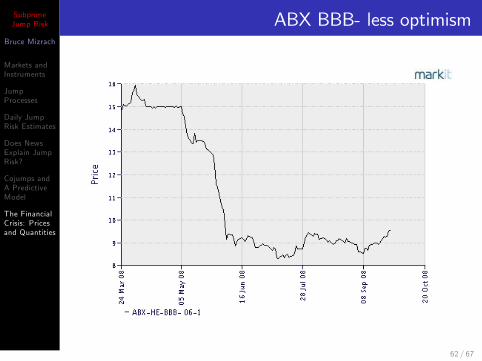
ABX BBB- less optimism
62 / 67
SubprimeJump Risk
Bruce Mizrach
Markets andInstruments
JumpProcesses
Daily JumpRisk Estimates
Does NewsExplain JumpRisk?
Cojumps andA PredictiveModel
The FinancialCrisis: Pricesand Quantities
Foreclosures spread beyond subprime
Mortgage Bankers Association Report 2008Q2: �SubprimeARM loans accounted for 36 percent of all foreclosures startedand prime ARMs, which include option ARMs, represented 23percent. However, the increase in prime ARMs foreclosurestarts was greater than the combined increase in �xed-rate andARM subprime loans. Thus the foreclosure start numbers willlikely be increasingly dominated increasingly by prime ARMloans.�
Conclusion: If residential real estate prices continue to fall,losses on prime loans will exceed losses on subprime.
63 / 67
SubprimeJump Risk
Bruce Mizrach
Markets andInstruments
JumpProcesses
Daily JumpRisk Estimates
Does NewsExplain JumpRisk?
Cojumps andA PredictiveModel
The FinancialCrisis: Pricesand Quantities
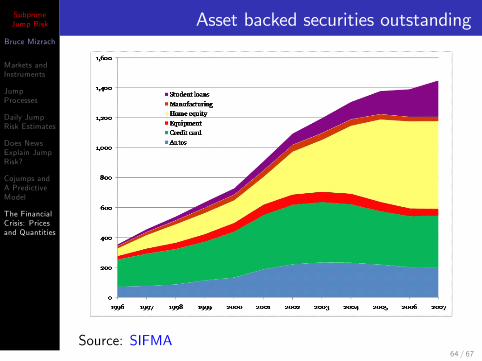
Asset backed securities outstanding
Source: SIFMA64 / 67
SubprimeJump Risk
Bruce Mizrach
Markets andInstruments
JumpProcesses
Daily JumpRisk Estimates
Does NewsExplain JumpRisk?
Cojumps andA PredictiveModel
The FinancialCrisis: Pricesand Quantities
Subprime issuance drops o¤
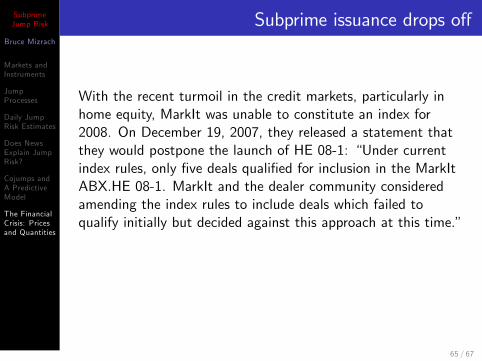
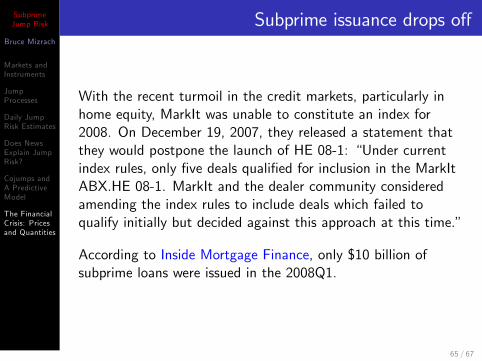
With the recent turmoil in the credit markets, particularly inhome equity, MarkIt was unable to constitute an index for2008. On December 19, 2007, they released a statement thatthey would postpone the launch of HE 08-1: �Under currentindex rules, only �ve deals quali�ed for inclusion in the MarkItABX.HE 08-1. MarkIt and the dealer community consideredamending the index rules to include deals which failed toqualify initially but decided against this approach at this time.�
According to Inside Mortgage Finance, only $10 billion ofsubprime loans were issued in the 2008Q1.
65 / 67
SubprimeJump Risk
Bruce Mizrach
Markets andInstruments
JumpProcesses
Daily JumpRisk Estimates
Does NewsExplain JumpRisk?
Cojumps andA PredictiveModel
The FinancialCrisis: Pricesand Quantities
Subprime issuance drops o¤
With the recent turmoil in the credit markets, particularly inhome equity, MarkIt was unable to constitute an index for2008. On December 19, 2007, they released a statement thatthey would postpone the launch of HE 08-1: �Under currentindex rules, only �ve deals quali�ed for inclusion in the MarkItABX.HE 08-1. MarkIt and the dealer community consideredamending the index rules to include deals which failed toqualify initially but decided against this approach at this time.�
According to Inside Mortgage Finance, only $10 billion ofsubprime loans were issued in the 2008Q1.
65 / 67
SubprimeJump Risk
Bruce Mizrach
Markets andInstruments
JumpProcesses
Daily JumpRisk Estimates
Does NewsExplain JumpRisk?
Cojumps andA PredictiveModel
The FinancialCrisis: Pricesand Quantities
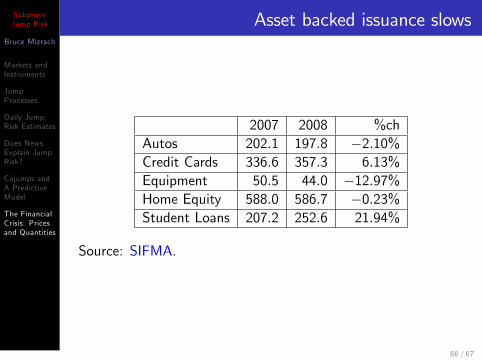
Asset backed issuance slows
2007 2008 %chAutos 202:1 197:8 �2:10%Credit Cards 336:6 357:3 6:13%Equipment 50:5 44:0 �12:97%Home Equity 588:0 586:7 �0:23%Student Loans 207:2 252:6 21:94%
Source: SIFMA.
66 / 67
SubprimeJump Risk
Bruce Mizrach
Markets andInstruments
JumpProcesses
Daily JumpRisk Estimates
Does NewsExplain JumpRisk?
Cojumps andA PredictiveModel
The FinancialCrisis: Pricesand Quantities
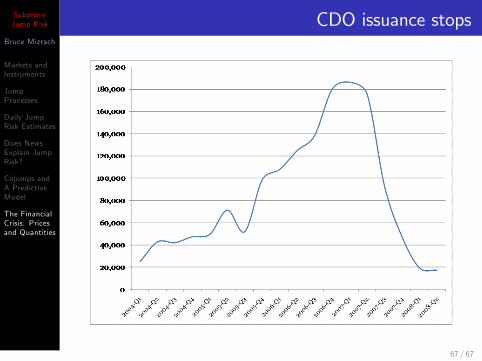
CDO issuance stops
67 / 67


![Determining delay times for phase space reconstruction ...econweb.rutgers.edu/mizrach/pubs/[21]-1996_JEBO.pdf(1989) examine precious metals prices. Scheinkman and LeBaron (1989) and](https://img.pdfslide.us/doc/110x75/60133cb6b8139514fd089485/determining-delay-times-for-phase-space-reconstruction-21-1996jebopdf-1989.jpg)
![Quantitative Finance - Rutgers Universityeconweb.rutgers.edu/mizrach/pubs/[30]-2008_QF.pdfTo cite this Article: Mizrach, Bruce (2008) 'The next tick on Nasdaq', Quantitative Finance,](https://img.pdfslide.us/doc/110x75/5f0c2c287e708231d43418c4/quantitative-finance-rutgers-30-2008qfpdf-to-cite-this-article-mizrach-bruce.jpg)
![[moves] - Neo-Arcadianeo-arcadia.com/neoencyclopedia/garou_mark_of_the_wolves_moves.pdf · close Tai-otoshi jump close Tai-hineri Command Moves then quickly jump Super Jump jump on](https://img.pdfslide.us/doc/110x75/5c11acf309d3f2b60f8c601d/moves-neo-arcadianeo-close-tai-otoshi-jump-close-tai-hineri-command-moves.jpg)