Embed Size (px)
Citation preview

Kindergarten BMI Surveillance Report 2014-2016 Alexandria, VA Alexandria City Public Schools
Alexandria Health Department

Kindergarten BMI Surveillance Report, 2014 - 2016 Page 2
Table of Contents Executive Summary ........................................................................................................................ 3
Introduction .................................................................................................................................. 4
Goals ............................................................................................................................................ 4
Methodology .................................................................................................................................. 5
Limitations .................................................................................................................................... 5
Results ......................................................................................................................................... 6
A. Comparison to National Benchmarks ......................................................................................................................... 6
Figure 1: Incoming ACPS Kindergarten Obese Weight Status, 2014 – 2016, compared to NHANES 2011 – 2014 and
HP 2020 Goal ................................................................................................................................................................... 6
B. Yearly ........................................................................................................................................................................... 7
Figure 2: Incoming ACPS Kindergarten Obese Weight Status, 2014 - 2016, compared to NHANES, Obese Weight
Status, 2011 – 2012 ......................................................................................................................................................... 7
Figure 3: Incoming ACPS Kindergarten Weight Status, 2014 – 2016 .............................................................................. 7
C. Gender ........................................................................................................................................................................ 8
Figure 4a: Incoming ACPS Kindergarten Weight Status for Males, 2014 - 2016 ............................................................ 8
Figure 4b: Incoming ACPS Kindergarten Weight Status for Females, 2014 - 2016 ......................................................... 8
D. Race/Ethnicity ............................................................................................................................................................. 9
Figure 5: Incoming ACPS Kindergarten Weight Status, 2014 - 2016, by Race/Ethnicity................................................. 9
E. Zip Code ...................................................................................................................................................................... 9
Figure 6: Incoming ACPS Kindergarten Weight Status for Overweight and Obese, 2014 - 2016, by Zip Code ............ 10
Figure 7: Incoming ACPS Kindergarten Weight Status for Overweight and Obese, 2014 - 2016, by Zip Code ............ 10
F. School ........................................................................................................................................................................ 11
Figure 8: Incoming ACPS Kindergarten Weight Status for Obese Kindergarteners, 2014-2016, by School, Compared
to HP2020 Goal for Obese 2-19 Year Olds .................................................................................................................... 11
Conclusion................................................................................................................................... 12
Resources ................................................................................................................................... 13
Acknowledgments ........................................................................................................................ 13
Appendix ..................................................................................................................................... 14
Table 1: CDC Weight Status Categories for Children ....................................................................................................................... 14
Table 2: Weight Status Categories for ACPS Incoming Kindergarten Classes, 2014 - 2016 ............................................................ 14
Table 3: Weight Status Categories for ACPS Incoming Kindergarten Classes, 2014 - 2016, by Gender .......................................... 14
Table 4: Weight Status Categories for ACPS Incoming Kindergarten Classes, 2014 - 2016, by Race/Ethnicity .............................. 15
Table 5: Weight Status Categories for ACPS Incoming Kindergarten Classes, 2014 - 2016, by Zip Code ........................................ 16
Table 6: School by Weight Status Categories for ACPS Incoming Kindergarten Classes, 2014 - 2016 ............................................ 17
References .................................................................................................................................. 20

Kindergarten BMI Surveillance Report, 2014 - 2016 Page 3
Kindergarten BMI Surveillance Report
2014-2016
Executive Summary
Purpose
The purpose of this report is to assess obesity in Alexandria City youth, utilizing the body mass index (BMI) measures, for incoming kindergarteners at Alexandria City Public Schools (ACPS) during the 2014-2015, 2015-2016 and 2016-2017 school years. By identifying demographic
and geographic areas at greater risk of obesity, Alexandria may better target prevention and treatment programs and improve awareness among school and health personnel, community
members and policy makers. Methodology
Data from school registration documents were used to obtain race, ethnicity, zip code, school, date of birth and date of examination as well as height and weight for calculation of a BMI for
each child. For the 2014 – 2016 school years, 17.8 percent of ACPS kindergarteners were obese which was close to the national average of 17.0 percent, but well above the Healthy People 2020 goal of less than 14.5 percent. There were no statistically significant differences found
between the incoming kindergarteners’ weight status from years 2014 to 2016 or between genders.
Results
Approximately 32.8 percent of 2014 - 2016
incoming kindergarteners attending public school in the City of Alexandria were categorized as overweight or obese, with
17.8 percent being obese. The highest rate of overweight or obese was found in Hispanic
youth (45.9%), students residing in zip codes 22305 (42.1%), 22312 (35.0%) and
22311 (34.1%), and attending Cora Kelly (53.7%), Patrick Henry (40.4%) and Mount Vernon (39.6%) elementary schools.
Considerations
The data presented in this report will serve as a baseline for identifying the current magnitude
of childhood obesity for incoming kindergarten students. Continued surveillance of childhood and adolescent BMI to track trends in obesity will be important in understanding and evaluating
existing interventions implemented by community organizations and how to target resources within the City of Alexandria.
17.8%
0%
5%
10%
15%
20%
Obese Weight Status Category
ACPS (2014-2016)
NHANES (2011-2014)
HP 2020 Goal
17.0% 14.5%

Kindergarten BMI Surveillance Report, 2014 - 2016 Page 4
Introduction
Childhood obesity is an established high priority health issue and an area of public health
concern and intervention. From 2011-2014, the national prevalence of obesity in the United States for children 2-19 years old was 17.0 percent (1). According to the Centers for Disease
Control and Prevention (CDC), overweight children are more likely to become overweight or obese as adults and experience the same disease risks as obese adults, including coronary heart disease, hypertension, type-2 diabetes and increased risk for cancers and chronic diseases (2,3).
According to the CDC’s national data from 2009-2010, the rates of obesity in children have tripled in the last two generations in the United States (4). Although Northern Virginia
consistently maintains the lowest rate of obesity in the state, in 2011, Virginia was ranked 23rd highest nationally for its percentage of overweight and obese children according to the National Survey of Children’s Health (5).
There are currently limited methods of surveillance nationally, and more specifically in Alexandria City, for tracking obesity. Weight status is calculated in the Youth Risk Behavior
Survey (YRBS), for 8th, 10th and 12th graders in Alexandria City Public Schools (ACPS), but this is limited by the accuracy of self-reporting. Women Infant and Children (WIC) data is accessible at
the state level, but is not generalizable. As a mechanism for tracking and assessing the obesity rates of Alexandria’s youth, the Kindergarten BMI Surveillance Report, will be completed yearly by Alexandria Health Department (AHD) in collaboration with ACPS and the School Health
Advisory Board (SHAB).
The Alexandria Children and Youth Master Plan 2014’s first goal is to assure that “Every Child
Will Be Physically Safe & Healthy” and includes numerous strategies that relate to preventing and reducing obesity among Alexandria children and youth (6). The SHAB, the Partnership for a
Healthier Alexandria, ACPS and AHD initiated this work in 2014 to inform prevention programs, prioritize policy initiatives and assist in the allocation of resources toward decreasing childhood obesity in our city. The surveillance and reporting of incoming kindergarteners’ weight status
aligns with the Health and Wellness goals as outlined in the ACPS 2020 Strategic Plan, the Alexandria Children and Youth Master Plan 2014 and the Alexandria Community Health
Improvement Plan (CHIP) 2014 – 2019 (7,6,8).
Goals
The purpose of this report is to assess obesity in Alexandria City youth, utilizing the body mass index (BMI) measures, for incoming kindergarteners at ACPS during the 2014 - 2015, 2015 -2016 and 2016 - 2017 school years. By identifying demographic or geographic subgroups at
greater risk of obesity, Alexandria may better target prevention and treatment programs and improve awareness among school and health personnel, community members and policy
makers.
The data presented in this report will serve as a baseline for identifying the current magnitude of childhood obesity for incoming kindergarten students. BMI surveillance programs aim to assess
the weight status of a specific population to identify population trends and monitor intervention outcomes. This report intends to inform and educate City of Alexandria stakeholders on weight
status of incoming kindergarteners in the 2014-2015, 2015-2016 and 2016-2017 school years by identifying weight disparities that may exist by:
Gender Race/ Ethnicity Zip-code
School
Kindergarten BMI Surveillance Report, 2014 - 2016 Page 5
Methodology
ACPS school health staff obtained information from the Commonwealth of Virginia School
Entrance Health Form, MCH 213G, or its equivalent, provided at kindergarten enrollment. All data obtained was presented in aggregate without personal identifiers and follows the rules
established by the ACPS Accountability Office to assure confidentiality. ACPS collected and entered the anthropometric data into school registration documents for incoming ACPS kindergarteners for the 2014 - 2016 academic years to obtain height and weight for calculation
of a Body Mass Index (BMI) for each child. Data is outlined below, and includes: race, ethnicity, height, weight, zip code, school, date of birth and date of examination. Once a complete dataset
was compiled and entered by ACPS staff, an anonymous identity number was assigned to each student and personal identifying information was removed prior to providing the data to AHD.
AHD calculated the BMI and assigned appropriate weight status categories, using STATA statistical analysis software. BMI was calculated using the English formula (BMI=[weight in
pounds/(height in inches)2 ] x 703) for each child. Each calculated BMI was then compared to the standard percentile distribution as defined by the gender-specific CDC growth charts and assigned to a weight status category (Table 1). Data storage and analysis were completed using
PowerSchool, Excel 2010, STATA and ArcGIS.
For children and teens, BMI is age and sex specific and is often referred to as BMI-for-age. Although BMI does not measure body fat directly, research has shown that it is correlated with
direct measures of body fat (9). BMI is not a diagnostic tool, but serves as a useful screening tool to determine weight categories, as well as who may be overweight or obese and at risk for health problems (9). Furthermore, childhood obesity is a predictor of adulthood obesity (2).
The chi-squared test was used to determine the statistical significance of differences in the
proportion estimates for weight status category for: incoming classes, gender, race/ethnicity and sex. The chi-square test is intended to test how likely it is that an observed distribution is due to chance. When the p-value of a chi-square test for difference is < 0.05 there is strong evidence
against the null hypothesis of no difference between the categorical prevalence data. If the initial chi-square test was found significant (p-value < 0.05), an additional chi-square test was done to
identify the differences within the category.
Limitations
There are several limitations to these studies. Health data for incoming students, including measures such as height and weight, are not uniformly collected. Incoming students are seen by
private healthcare providers whose tools for measuring height and weight are uniquely calibrated.
Of the 1,424 children registered as incoming ACPS kindergartners for the 2014 - 2015 school year, 1,146 (80.4%) completed health records were available for analysis. Numbers for 2015 -
2016 and 2016 - 2017 were higher, with 1,378 (93.9%) and 1,362 (93.7%), respectively, with completed health records. The students for whom records were not available may be missing for a number of reasons, including registering but not attending school. Differences in weight
categories for students not available are unknown. The percentage of students included in analysis categorized as economically disadvantaged is unknown, only the total kindergarten
class as reported by the Department of Education. This report only provides surveillance data for ACPS and therefore does not include private school or home schooled students in Alexandria
City.
Kindergarten BMI Surveillance Report, 2014 - 2016 Page 6
Results
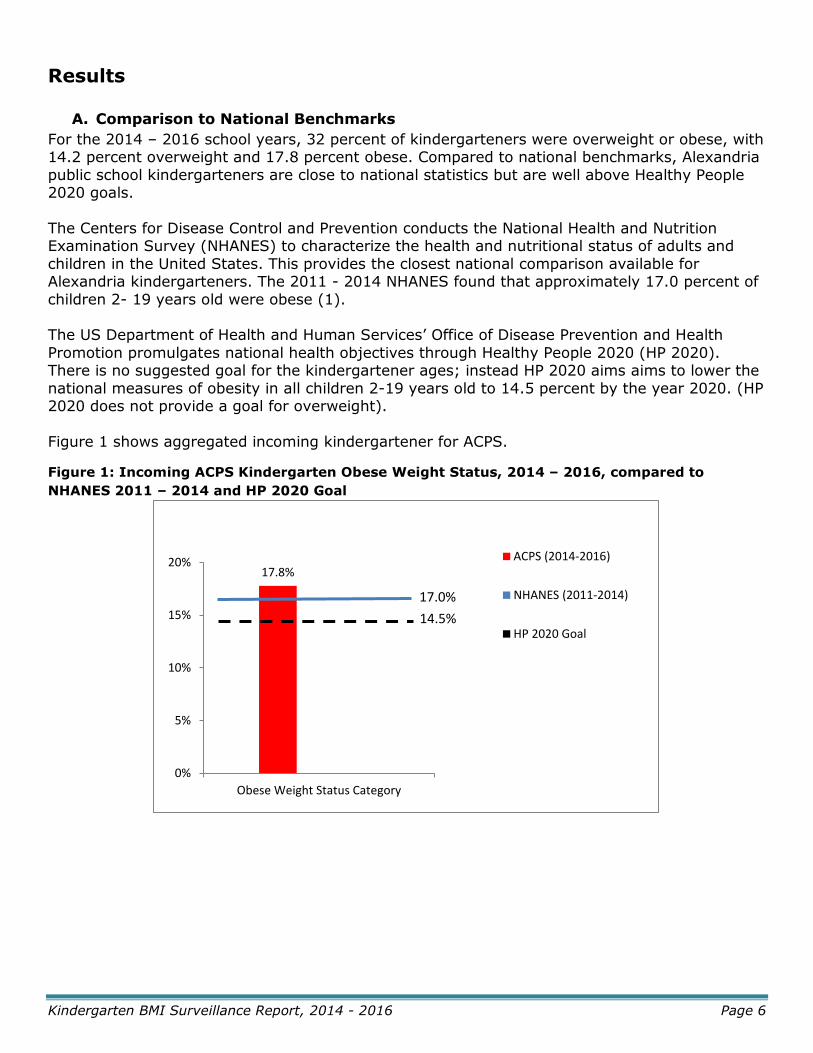
A. Comparison to National Benchmarks
For the 2014 – 2016 school years, 32 percent of kindergarteners were overweight or obese, with 14.2 percent overweight and 17.8 percent obese. Compared to national benchmarks, Alexandria
public school kindergarteners are close to national statistics but are well above Healthy People 2020 goals.
The Centers for Disease Control and Prevention conducts the National Health and Nutrition Examination Survey (NHANES) to characterize the health and nutritional status of adults and
children in the United States. This provides the closest national comparison available for Alexandria kindergarteners. The 2011 - 2014 NHANES found that approximately 17.0 percent of
children 2- 19 years old were obese (1). The US Department of Health and Human Services’ Office of Disease Prevention and Health
Promotion promulgates national health objectives through Healthy People 2020 (HP 2020). There is no suggested goal for the kindergartener ages; instead HP 2020 aims aims to lower the
national measures of obesity in all children 2-19 years old to 14.5 percent by the year 2020. (HP 2020 does not provide a goal for overweight).
Figure 1 shows aggregated incoming kindergartener for ACPS.
Figure 1: Incoming ACPS Kindergarten Obese Weight Status, 2014 – 2016, compared to
NHANES 2011 – 2014 and HP 2020 Goal
17.8%
0%
5%
10%
15%
20%
Obese Weight Status Category
ACPS (2014-2016)
NHANES (2011-2014)
HP 2020 Goal
17.0%
14.5%

Kindergarten BMI Surveillance Report, 2014 - 2016 Page 7
B. Yearly
There was no statistically significant difference found between the incoming kindergarteners’
weight status from years 2014 to 2016. Figure 2 reveals the percentage of obese ACPS kindergarteners by year. Figure 3, below, shows the weight status category distribution over the
same years.
Figure 2: Incoming ACPS Kindergarten Obese Weight Status, 2014 - 2016, compared to
NHANES, Obese Weight Status, 2011 – 2012
Figure 3: Incoming ACPS Kindergarten Weight Status, 2014 – 2016
Table 2, in the appendix, displays the distribution of incoming kindergarten class weight status
distribution by year, as well as the aggregated weight status distribution for all three years of incoming kindergarteners, 2014 – 2016.
17.2% 17.8% 18.3%
0%
5%
10%
15%
20%
25%
30%
2014 2015 2016
% o
f in
com
ing
kin
de
rgar
ten
ers
Year
ACPS
NHANES(2011-2014)
17.0%
0%
10%
20%
30%
40%
50%
60%
70%
80%
Underweight Healthy Weight Overweight Obese
% o
f in
com
ing
kin
derg
arte
ners
Weight Status Category
2014
2015
2016

Kindergarten BMI Surveillance Report, 2014 - 2016 Page 8
C. Gender
When stratified by gender, no statistically significant differences in weight status category were
found for overweight and obese (p=0.201) or obese (p=0.937) incoming kindergarteners from 2014 – 2016. Aggregating the three incoming classes, 15.2 percent of females were overweight
and 17.7 percent of females were obese, compared to 13.2 percent of males being overweight and 13.7 percent of males being obese (N=3,887). A higher proportion of males, as compared to females, were underweight, at 6.29 percent compared to 4.89 percent and this difference was
observed throughout the three years of incoming kindergarten data, (Table 3, a-c).
Figure 4a: Incoming ACPS Kindergarten Weight Status for Males, 2014 - 2016
Figure 4b: Incoming ACPS Kindergarten Weight Status for Females, 2014 - 2016
0%
10%
20%
30%
40%
50%
60%
70%
Underweight Healthy Weight Overweight Obese
% o
f in
com
ing
kin
derg
arte
ners
Weight Status Category
2014
2015
2016
0%
10%
20%
30%
40%
50%
60%
70%
Underweight Healthy Weight Overweight Obese% o
f in
co
min
g k
ind
erg
arte
ners
Weight Status Category
2014
2015
2016

Kindergarten BMI Surveillance Report, 2014 - 2016 Page 9
D. Race/Ethnicity
When stratified by race/ethnicity, statistically significant differences were observed between
weight status category for overweight and obese (p<0.001) and obese (p<0.001) incoming kindergarteners from 2014 – 2016. A higher proportion of obese students was observed among
Hispanic students at 28.0 percent; this was statistically significant when performing additional chi-square tests for differences of proportions with whites, blacks, and Asians, separately. Additionally, statistically significant differences were consistent across all three years. Lowest
proportions of obese students were observed in whites (8.3%), multiracial (6.2%) and Asians (8.0%) for aggregated 2014 – 2016 school years, (Table 4, a-c).
Figure 5: Incoming ACPS Kindergarten Weight Status, 2014 - 2016, by Race/Ethnicity*
* Race and ethnicity are self-reported by parents when completing ACPS forms.
E. Zip Code
When stratified by zip code, statistically significant differences were observed between weight status category for overweight and obese (p<0.001) and obese (p<0.001) incoming
kindergarteners from 2014 – 2016. The zip codes with the highest proportion of overweight and obese students were 22305 (42.1%), 22312 (35.0%) and 22311 (34.1%) for aggregated 2014 – 2016 incoming kindergartners. Zip code 22305 had the highest proportions of overweight and
obese incoming kindergarteners across all three years of data. Conversely, zip codes with lowest proportions of overweight and obese students from 2014 - 2016 were 22302 (23.0%) 22314
(23.6%) and 22301 (22.5%), (Table 4, a-c).
13.6%12.4%
17.9%
11.5% 12.3%14.2%
8.0%
19.3%
28.0%
6.2%
8.3%
17.8%
0%
5%
10%
15%
20%
25%
30%
Asian Black Hispanic Multiracial White Total% o
f in
com
ing
kin
derg
arte
ners
Race/Ethnicity
Overweight
Obese

Kindergarten BMI Surveillance Report, 2014 - 2016 Page 10
Figure 6: Incoming ACPS Kindergarten Weight Status for Overweight and Obese, 2014 - 2016,
by Zip Code
Figure 7: Incoming ACPS Kindergarten Weight Status for Overweight and Obese, 2014 - 2016,
by Zip Code
0%
5%
10%
15%
20%
25%
30%
35%
40%
45%
50%
22301 22302 22304 22305 22311 22312 22314
% o
f in
com
ing
AC
PS
Kin
derg
arte
ners
Zip Code
2014 2015 2016

Kindergarten BMI Surveillance Report, 2014 - 2016 Page 11
F. School
When stratified by school, statistically significant differences were observed for overweight and
obese (p<0.001) and obese (p<0.001) incoming kindergarteners from 2014 - 2016. Schools, in Figure 5, are ranked by highest to lowest proportions of students in the obese weight status
category. From the available data, incoming kindergarteners from Cora Kelly had the highest percentage of obese (34.8%) students from aggregated 2014 – 2016 data, followed by Patrick Henry (23.1%) and Mount Vernon (24.5%). Students from Lyles Crouch (10.4%) and Mathew
Maury (8.8%) Elementary Schools have the lowest proportions of incoming kindergarteners with obese weight statuses from 2014 - 2016, (Table 6, a-c).
Note: Healthy People 2020 goals are based on percent of obese students; the data in Figure 1 is for obese kindergarteners (and does not include overweight kindergarteners).
Figure 8: Incoming ACPS Kindergarten Weight Status for Obese Kindergarteners, 2014-2016,
by School, Compared to HP2020 Goal for Obese 2-19 Year Olds
From 2014 - 2016, approximately 52 percent of the incoming kindergarten class at ACPS was categorized as ‘economically disadvantaged’. Students are categorized as economically disadvantaged if they are eligible for Free/Reduced Meals, receive TANF, are eligible for Medicaid
or become identified as migrant at any time during the school year. The elementary schools with the highest proportions of students categorized as economically disadvantaged are Cora Kelly
(72.3%) and Patrick Henry Elementary School (70.9%); the lowest proportions are Mathew Maury (27.0%) and Lyles Crouch (23.8%) according to the Virginia Department of Education.
0%
10%
20%
30%
40%
50%
% o
f in
com
ing
AC
PS
Kin
derg
arte
ners
ACPS Schools
2014 2015 2016
HP 2020 Goal 14.5%

Kindergarten BMI Surveillance Report, 2014 - 2016 Page 12
Conclusion
Thirty two percent of 2014 - 2016 incoming kindergarteners attending public school in the City
of Alexandria were categorized as overweight or obese.
The highest rate of overweight or obesity was found in Hispanic youth (45.9%), students residing in zip codes 22305 (42.1%), 22312 (35.0%) and 22311 (34.1%) and attending Cora Kelly (53.7%), Patrick Henry (40.4%) and Mount Vernon (39.6%) elementary schools. Similarly,
elementary schools with the highest proportions of students categorized as economically disadvantaged are Cora Kelly (72.3%) and Patrick Henry (70.9%). These findings align with
national data, as reported by the CDC, which indicate a higher prevalence of obesity in pre-school children from low-income families and in Hispanic children, compared to non-Hispanic, non-low-income children (10,11).
As indicated earlier in the report, support for BMI assessment for weight status surveillance is
fairly robust. Continuing to monitor incoming kindergartners in the future, as well as surveillance of obesity prevalence in students at one or more points in higher grades is important. There is a need to continue surveillance of childhood and adolescent BMI to track trends in obesity and to
evaluate existing interventions implemented by community organizations in order to best understand how to target resources.

Kindergarten BMI Surveillance Report, 2014 - 2016 Page 13
Resources
The following are resources to help take action to improve the health and wellbeing of Alexandria
City in relation to decreasing childhood obesity
Health Matters in Alexandria This is a web-based resource through which the Alexandria community can learn about community health and wellbeing within the City of Alexandria. The site, which is maintained by
the Alexandria Health Department, provides information on topics including local health, promising best practices, and community news & events.
http://www.healthmattersalexandria.org/ Northern Virginia Healthy Kids Coalition
A community partnership to get kids healthy and to fight obesity, the Northern Virginia Healthy Kids Coalition (NVHKC) is a grassroots coalition of local organizations including Inova Health
System, area school districts and others joined in a common goal: to promote better health for children of all ages. http://www.inova.org/inova-in-the-community/nvhkc/index.jsp
Partnership for a Healthier Alexandria
This is a citizen-led coalition of non-profit organizations, schools, municipal agencies, local businesses, government, community leaders, and concerned citizens who come together to
promote and preserve a healthy Alexandria. The partnership emerged in 2006 to address major health priorities that were identified from the first Community Health Assessment in Alexandria. http://healthieralexandria.org
Public Health Advisory Commission
This commission provides information about and evaluation of health-related matters and investigates specific health problems. The Commission meets on the third Thursday of the month at 5:30 p.m.
https://www.alexandriava.gov/health/info/default.aspx?id=14870
School Health Advisory Board This board works on health access and outreach for ongoing programs and implementation of school-based healthcare initiatives. In 2016 they reviewed new Federal Food and Nutrition
Services guidelines and Smart Snacks and drafted relevant policy. https://www.acps.k12.va.us/Page/1232
Acknowledgments
This report was a collaborative effort by the School Health Advisory Board, the Partnership for a
Healthier Alexandria, Alexandria City Public Schools and Alexandria Health Department. Special thanks to Dr. Barbara Nowak, Erika Gulick and Candace Hill for their guidance, data and
mapping. Data analysis was conducted by, and this report was prepared by, AHD Epidemiologist Melissa Arons MS, RN. The analyses and report were approved by AHD Deputy Health Director Tina Singh, MD, MPH and Director Stephen A. Haering, MD, MPH, FACPM; any errors in the
analysis are the responsibility of AHD.

Kindergarten BMI Surveillance Report, 2014 - 2016 Page 14
Appendix
Table 1: CDC Weight Status Categories for Children
Weight Status Category Percentile Range
Underweight Less than the 5th percentile
Healthy weight 5th percentile to less than the 85th percentile
Overweight 85th to less than the 95th percentile
Obese Equal to or greater than the 95th percentile
Table 2: Weight Status Categories for ACPS Incoming Kindergarten Classes, 2014 - 2016
Weight Status Category 2014 2015 2016 Total
Underweight 5.1% 6.0% 5.7% 5.6%
Healthy Weight 62.7% 62.7% 61.9% 62.4%
Overweight 15.1% 13.5% 14.2% 14.2%
Obese 17.2% 17.8% 18.3% 17.8%
Overweight or Obese 32.3% 31.3% 32.5% 32.0%
Table 3: Weight Status Categories for ACPS Incoming Kindergarten Classes, 2014 - 2016, by
Gender
Weight Status Category Boys Girls Total
Underweight 6.3% 4.9% 5.6%
Healthy Weight 62.6% 62.1% 62.4%
Overweight 13.2% 15.3% 14.2%
Obese 17.8% 17.7% 17.8%
Overweight or Obese 31.1% 33.0% 32.0%
Table 3a: Weight Status Categories for ACPS Incoming Kindergarten Class, 2014, by Gender
Weight Status Category Boys Girls Total
Underweight 6.4% 4.0% 5.1%
Healthy Weight 64.6% 60.7% 62.7%
Overweight 13.8% 13.4% 15.1%
Obese 15.3% 19.0% 17.2%
Overweight or Obese 29.1% 35.3% 32.3%
Table 3b: Weight Status Categories for ACPS Incoming Kindergarten Class, 2015, by Gender
Weight Status Category Boys Girls Total
Underweight 6.9% 5.1% 6.0%
Healthy Weight 63.3% 62.1% 62.7%
Overweight 11.3% 15.7% 13.5%
Obese 18.5% 17.1% 17.8%
Overweight or Obese 29.8% 32.8% 31.3%

Kindergarten BMI Surveillance Report, 2014 - 2016 Page 15
Table 3c: Weight Status Categories for ACPS Incoming Kindergarten Class, 2016, by Gender
Weight Status Category Boys Girls Total
Underweight 5.8% 5.5% 5.7%
Healthy Weight 60.5% 63.5% 61.9%
Overweight 14.6% 13.7% 14.2%
Obese 19.1% 17.3% 18.3%
Overweight or Obese 33.7% 31.0% 32.5%
Table 4: Weight Status Categories for ACPS Incoming Kindergarten Classes, 2014 - 2016, by
Race/Ethnicity
Weight Status Category Asian Black Hispanic Multi White
Underweight 14.2% 7.1% 3.7% 7.1% 5.2%
Healthy Weight 64.2% 61.2% 50.4% 75.2% 74.3%
Overweight 13.6% 12.4% 17.9% 11.5% 12.3%
Obese 8.0% 19.3% 28.0% 6.2% 8.3%
Overweight or Obese 21.6% 31.7% 45.9% 17.7% 20.5%
Table 4a: Weight Status Categories for ACPS Incoming Kindergarten Class, 2014, by
Race/Ethnicity
Weight Status Category Asian Black Hispanic Multi White
Underweight 4.6% 7.9% 3.8% 2.9% 4.4%
Healthy Weight 70.5% 61.7% 51.6% 74.3% 73.3%
Overweight 13.6% 11.6% 19.7% 11.4% 13.6%
Obese 11.4% 18.8% 24.9% 11.4% 8.7%
Overweight or Obese 25.0% 30.4% 44.6% 22.9% 22.3%
Table 4b: Weight Status Categories for ACPS Incoming Kindergarten Class, 2015, by
Race/Ethnicity
Weight Status Category Asian Black Hispanic Multi White
Underweight 15.5% 7.9% 3.1% 11.1% 5.8%
Healthy Weight 69.0% 62.0% 51.0% 66.7% 73.9%
Overweight 8.6% 11.9% 17.6% 16.7% 11.1%
Obese 6.9% 18.2% 28.4% 5.6% 9.1%
Overweight or Obese 15.5% 30.1% 45.9% 22.2% 20.3%
Table 4c: Weight Status Categories for ACPS Incoming Kindergarten Class, 2016, by
Race/Ethnicity
Weight Status Category Asian Black Hispanic Multi White
Underweight 20.0% 5.8% 4.0% 7.1% 5.2%
Healthy Weight 55.0% 60.0% 48.8% 83.3% 75.5%
Overweight 18.3% 13.3% 16.9% 7.1% 12.4%
Obese 6.7% 20.8% 30.4% 2.4% 7.0%
Overweight or Obese 25.0% 34.2% 47.2% 9.5% 19.3%

Kindergarten BMI Surveillance Report, 2014 - 2016 Page 16
Table 5: Weight Status Categories for ACPS Incoming Kindergarten Classes, 2014 - 2016, by Zip
Code
Weight Status Category 22301 22302 22304 22305 22311 22312 22314
Underweight 5.0% 7.0% 6.0% 4.4% 5.2% 7.5% 5.3%
Healthy Weight 72.5% 70.0% 60.9% 53.5% 60.7% 57.5% 71.1%
Overweight 14.4% 11.1% 14.7% 16.1% 15.7% 14.3% 11.1%
Obese 8.1% 11.9% 18.4% 26.1% 18.4% 20.7% 12.5%
Overweight or Obese 22.5% 23.0% 33.1% 42.1% 34.1% 35.0% 23.6%
Table 5a: Weight Status Categories for ACPS Incoming Kindergarten Class, 2014, by Zip Code
Weight Status Category 22301 22302 22304 22305 22311 22312 22314
Underweight 3.5% 6.8% 5.3% 4.7% 6.1% 4.3% 6.5%
Healthy Weight 75.9% 65.3% 63.7% 51.3% 57.6% 52.1% 71.8%
Overweight 16.1% 13.6% 14.5% 13.7% 15.2% 20.2% 8.8%
Obese 4.6% 14.4% 16.5% 30.3% 21.2% 23.4% 12.9%
Overweight or Obese 20.7% 28.0% 31.0% 44.0% 36.4% 43.6% 21.8%
Table 5b: Weight Status Categories for ACPS Incoming Kindergarten Class, 2015, by Zip Code
Weight Status Category 22301 22302 22304 22305 22311 22312 22314
Underweight 6.6% 5.2% 5.9% 4.4% 7.0% 9.9% 6.2%
Healthy Weight 73.0% 74.8% 59.4% 53.0% 60.8% 58.0% 71.9%
Overweight 12.3% 5.2% 15.0% 17.1% 14.1% 13.6% 11.8%
Obese 8.2% 14.8% 19.7% 25.5% 18.1% 18.5% 10.1%
Overweight or Obese 20.5% 20.0% 34.7% 42.6% 32.2% 32.1% 21.9%
Table 5c: Weight Status Categories for ACPS Incoming Kindergarten Class, 2016, by Zip Code
Weight Status Category 22301 22302 22304 22305 22311 22312 22314
Underweight 4.5% 9.0% 5.1% 4.7% 6.1% 4.3% 6.5%
Healthy Weight 69.4% 69.4% 63.9% 51.3% 57.6% 52.1% 71.8%
Overweight 15.3% 14.9% 14.5% 13.7% 15.2% 20.2% 8.8%
Obese 10.8% 6.7% 16.5% 30.3% 21.2% 23.4% 12.9%
Overweight or Obese 26.1% 21.6% 31.0% 44.0% 36.4% 43.6% 21.8%

Kindergarten BMI Surveillance Report, 2014 - 2016 Page 17
Table 6: School by Weight Status Categories for ACPS Incoming Kindergarten Classes, 2014 -
2016
School Underweight Healthy Weight Overweight Obese Over/ Obese
Cora Kelly 4.5% 41.8% 18.9% 34.8% 53.7%
Patrick Henry 5.4% 54.2% 17.3% 23.1% 40.4%
Mount Vernon 4.7% 55.7% 15.1% 24.5% 39.6%
James K Polk 5.4% 59.8% 19.0% 15.9% 34.8%
William Ramsay 7.1% 58.6% 15.2% 19.0% 34.3%
John Adams 6.7% 62.7% 12.7% 17.9% 30.6%
Jefferson Houston 3.9% 66.0% 14.7% 15.4% 30.1%
Samuel Tucker 6.5% 64.1% 10.2% 19.2% 29.4%
Charles Barrett 6.9% 66.5% 11.0% 15.5% 26.5%
George Mason 3.1% 71.2% 13.9% 11.8% 25.7%
Douglas MacArthur 5.1% 70.1% 14.1% 10.8% 24.9%
Lyles Crouch 5.2% 73.4% 10.9% 10.4% 21.4%
Matthew Maury 6.9% 72.6% 11.8% 8.8% 20.6%
Table 6a: School by Weight Status Categories for ACPS Incoming Kindergarten Class, 2014
School Underweight Healthy Weight Overweight Obese Over/Obese
Cora Kelly 1.9% 51.9% 15.4% 30.8% 46.2%
Patrick Henry 4.9% 58.4% 15.9% 20.7% 36.6%
Mount Vernon 4.6% 56.5% 18.3% 20.6% 38.9%
James K Polk 6.0% 89.0% 18.0% 17.0% 35.0%
William Ramsay 6.6% 61.2% 13.2% 19.0% 35.2%
John Adams 3.9% 63.8% 14.9% 17.3% 32.3%
Jefferson Houston 5.6% 61.1% 22.2% 11.1% 33.3%
Samuel Tucker 10.6% 56.7% 10.6% 22.1% 32.7%
Charles Barrett 2.8% 73.6% 12.5% 11.1% 23.6%
George Mason 4.2% 67.4% 15.8% 12.6% 28.4%
Douglas MacArthur 3.9% 65.7% 18.6% 11.8% 30.4%
Lyles Crouch 1.8% 74.6% 10.9% 12.7% 23.6%
Matthew Maury 5.8% 71.0% 10.1% 13.0% 23.2%

Kindergarten BMI Surveillance Report, 2014 - 2016 Page 18
Table 6b: School by Weight Status Categories for ACPS Incoming Kindergarten Class, 2015
School Underweight Healthy Weight Overweight Obese Over/Obese
Cora Kelly 6.9% 44.8% 25.9% 22.4% 48.3%
Patrick Henry 4.4% 51.1% 16.7% 27.8% 44.4%
Mount Vernon 5.4% 54.7% 12.2% 27.7% 39.9%
James K Polk 5.0% 58.8% 16.8% 19.3% 36.3%
William Ramsay 7.4% 60.3% 16.9% 15.4% 32.4%
John Adams 9.0% 62.1% 8.4% 20.5% 28.9%
Jefferson Houston 4.4% 62.3% 7.4% 15.9% 33.3%
Samuel Tucker 5.8% 62.3% 12.3% 19.6% 37.9%
Charles Barrett 7.1% 65.9% 9.4% 17.7% 27.1%
George Mason 9.8% 70.6% 14.7% 13.7% 28.4%
Douglas MacArthur 7.2% 76.0% 8.0% 8.8% 16.8%
Lyles Crouch 4.5% 71.6% 14.9% 9.0% 23.9%
Matthew Maury 8.0% 74.7% 12.0% 5.3% 17.3%
Table 6c: School by Weight Status Categories for ACPS Incoming Kindergarten Class, 2016
School Underweight Healthy Weight Overweight Obese Over/Obese
Cora Kelly 4.4% 34.1% 16.5% 45.1% 61.5%
Patrick Henry 6.7% 53.3% 19.1% 21.0% 40.1%
Mount Vernon 4.1% 55.9% 15.2% 24.8% 40.0%
James K Polk 5.2% 61.2% 21.6% 11.9% 33.6%
William Ramsay 6.6% 55.2% 15.4% 22.8% 38.2%
John Adams 7.2% 61.6% 16.0% 15.2% 31.2%
Jefferson Houston 2.0% 74.5% 5.9% 17.7% 23.5%
Samuel Tucker 4.4% 70.4% 8.2% 17.0% 25.1%
Charles Barrett 10.2% 61.4% 11.4% 17.1% 28.4%
George Mason 4.4% 75.8% 11.0% 8.8% 19.8%
Douglas MacArthur 3.7% 67.3% 16.8% 12.2% 29.0%
Lyles Crouch 8.6% 74.3% 7.1% 10.0% 17.1%
Matthew Maury 6.7% 73.3% 11.7% 8.3% 20.0%

Kindergarten BMI Surveillance Report, 2014 - 2016 Page 19
References
1. Ogden CL, Carroll MD, Kit BK, Fryar CD. Prevalence of Obesity Among Adults and Youth: United States, 2011-2014. NCHS Data Brief, No. 219. Atlanta, GA: National Center for Health
Statistics, 2015. 2. Singh AS, Mulder C, Twisk JW, Van Mechelen V, Chinapaw MJ. Tracking of childhood
overweight into adulthood: a systematic review of the literature. Obesity reviews, 2008. 9(5): p. 474-488.
3. Overweight and Obesity Statistics. National Institutes of Health, National Institute of Diabetes and Digestive and Kidney Disorders. Available at
http://win.niddk.nih.gov/publications/PDFs/stat904z.pdf. Updated October, 2012. Accessed April 20, 2017.
4. Fryar CD, Carroll MD, Ogden CL, Prevalence of overweight and obesity among children and adolescents: United States, 1963-1965 through 2011-2012. Atlanta, GA: National Center for
Health Statistics, 2014.
5. Virginia Performs: Obesity. Council on Virginia’s Future. Available at http://vaperforms.virginia.gov/indicators/healthFamily/obesity.php. Updated 2017. Accessed
April 21, 2017. 6. Alexandria City and Youth Master Plan. Children Youth and Families Collaborative
Commission. Available at https://www.alexandriava.gov/uploadedFiles/dchs/info/AlexandriaChildrenYouthMasterPlanFinal.
pdf. Updated March 14, 2014.Accessed April 6, 2017. 7. ACPS 2020 Strategic Plan. Available at https://www.acps.k12.va.us/domain/798. Updated
2015. Accessed June 9, 2017.
8. Community Health Improvement Plan: City of Alexandria, Virginia, 2014-2019. Partnership for a Healthier Alexandria. Available at http://healthieralexandria.org/uploadedFiles/healthieralexandriawwwroot/FINAL%20CHIP%20Ja
n%202015.pdf. Updated 2014. Accessed June 9, 2017.
9. Adult Child and Teen BMI. Centers for Disease Control and Prevention. Available at https://www.cdc.gov/healthyweight/assessing/bmi/childrens_bmi/about_childrens_bmi.html. Updated May 15, 2015. Accessed April 11, 2017.
10. Ogden CL, Carroll MD, Kit BK, Flegal KM. Prevalence of Obesity Among Adults and Youth.
United States, 2011-2014. NCHS Data Brief, 2015. 219. 11. Pan L, Freedman DS, Sharma AJ, Castellanos-Brown K; Park, Smith, RB, Blanck HM. Trends
in Obesity Among Participants Aged 2-4 Years in the Special Supplemental Nutrition Program for Women, Infants, and Children- United States, 2000-2014. 2016. 65(45); 1256–1260.