Embed Size (px)
Citation preview

Kier Group plc Annual Report and Accounts 2018
OUR
LEADING POSITIONS
Kier G
roup plc Annual R
eport and Accounts 2018

BuildingsTurn to pages 6 to 7 for more information.
Developments & HousingTurn to pages 8 to 9 for more information.
Infrastructure ServicesTurn to pages 4 to 5 for more information.
CONTRIBUTING TO
THE UK’S GROWTHKier invests in, builds and maintains the UK’s essential assets. We operate across a wide range of sectors including bioscience, education, health, highways, housing, power and energy, property, transport and utilities.
Our market-leading positions in Infrastructure Services, Buildings and Developments & Housing allow us to capitalise on a number of opportunities in these growing markets.
WE PROVIDE ESSENTIAL INFRASTRUCTURE SERVICES
WE ARE THE UK’S LARGEST REGIONAL BUILDER
WE ARE A LEADING PROVIDER OF AFFORDABLE HOUSING
Strategic Report2 At a glance4 Market positions 10 Investment case 12 Chairman’s statement14 Chief Executive’s strategic review20 Business model22 Our markets28 Strategy dashboard30 Key performance indicators32 Corporate responsibility36 Risk management framework38 Principal risks and uncertainties44 Divisional review: Property45 Divisional review: Residential46 Divisional review: Construction48 Divisional review: Services50 Financial review
Governance57 Corporate Governance Statement57 Chairman’s introduction59 Governance in action60 Board statements62 Leadership64 Board of Directors66 Effectiveness69 Nomination Committee report 71 Accountability 73 Risk Management and Audit Committee report 81 Safety, Health and Environment Committee report 83 Relations with shareholders and other stakeholders 86 Directors’ Remuneration Report 86 Annual statement of the Chair of the
Remuneration Committee89 Remuneration at a glance92 Annual report on remuneration 102 Directors’ remuneration policy – summary108 Directors’ Report110 Statements of Directors’ responsibilities
Financial Statements111 Independent auditor’s report118 Consolidated income statement119 Consolidated statement of comprehensive income120 Consolidated statement of changes in equity121 Consolidated balance sheet122 Consolidated cash flow statement123 Notes to the consolidated financial statements176 Principal operating subsidiaries and business units183 Company balance sheet184 Company statement of changes in equity185 Notes to the Company financial statements
Other Information189 Financial record190 Corporate information
Contents
Top left image: Sensor City, Liverpool.

Financial highlights
Strong market-leading positions and record order books of £10.2bn providing confidence for the future.
Order book (£bn)
£10.2bn18 10.2
8.9
8.5
9.1
6.2
17
16
15
14
Net debt balances (£m)
£(185.7)m(185.7) 18
17
16
15
14
(110.1)
(98.9)
(140.8)
(122.8)
Dividend per share (p)
69.0p18 69.0
67.5
64.5
55.2
57.6
17
16
15
14
Average net debt (£m)
£375m18 375
320
280
243
140
17
16
15
14
Group revenue1, 2 (£bn)
£4.5bn18 4.5
4.3
4.1
3.3
2.9
17
16
15
14
Underlying earnings per share (p)
116.7p18 116.7
106.8
99.5
101.6
88.1
17
16
15
14
Underlying profit before tax1, 2 (£m)
£136.9m18 136.9
126.1
116.4
89.8
74.1
17
16
15
14
1 Continuing operations. Group and share of joint ventures.2 Continuing operations. Stated before non-underlying items.
See note 4 to the consolidated financial statements.3 Restated to reclassify the profit on disposal of Mouchel Consulting
within discontinued operations.
Reported profit/(loss) before tax1, 3 (£m)
£106.2m18 106.2
(14.2)
16
17
(34.9)
19.9
15.2
15
14
Reported basic earnings/(loss)per share1, 3 (p)
90.8p18 90.8
(25.7)
12.6
15.3
17
16
15
14
(27.2)
Strategic R
eportG
overnanceFinancial S
tatements
Kier Group plc | Report and Accounts 2018 1
Strategic Report
At a glance
We offer our clients access to specialist expertise supported by a breadth of capabilities.
WE ARE
KIER GROUP
Our values
CollaborativeWe work together: we consult to reach the right solution and achieve more as a team.
EnthusiasticWe make things happen: we are resourceful problem-solvers, who enjoy what we do and get the job done.
Forward-thinkingWe look ahead: we positively challenge the way we do things to excel, and we care about our clients and customers and the service we provide.
Our vision
Our vision is to be a world-class, customer-focused company that invests in, builds, maintains and renews the places where we live, work and play.
What we do
We create spaces and places that generate opportunity and prosperity.
How we deliver
We bring specialist knowledge, sector-leading experience and fresh thinking to create workable solutions.
Go online to find out more at www.kier.co.ukOur corporate website has key information covering our sector capabilities, markets, corporate responsibility and investor relations.
2 Kier Group plc | Report and Accounts 2018
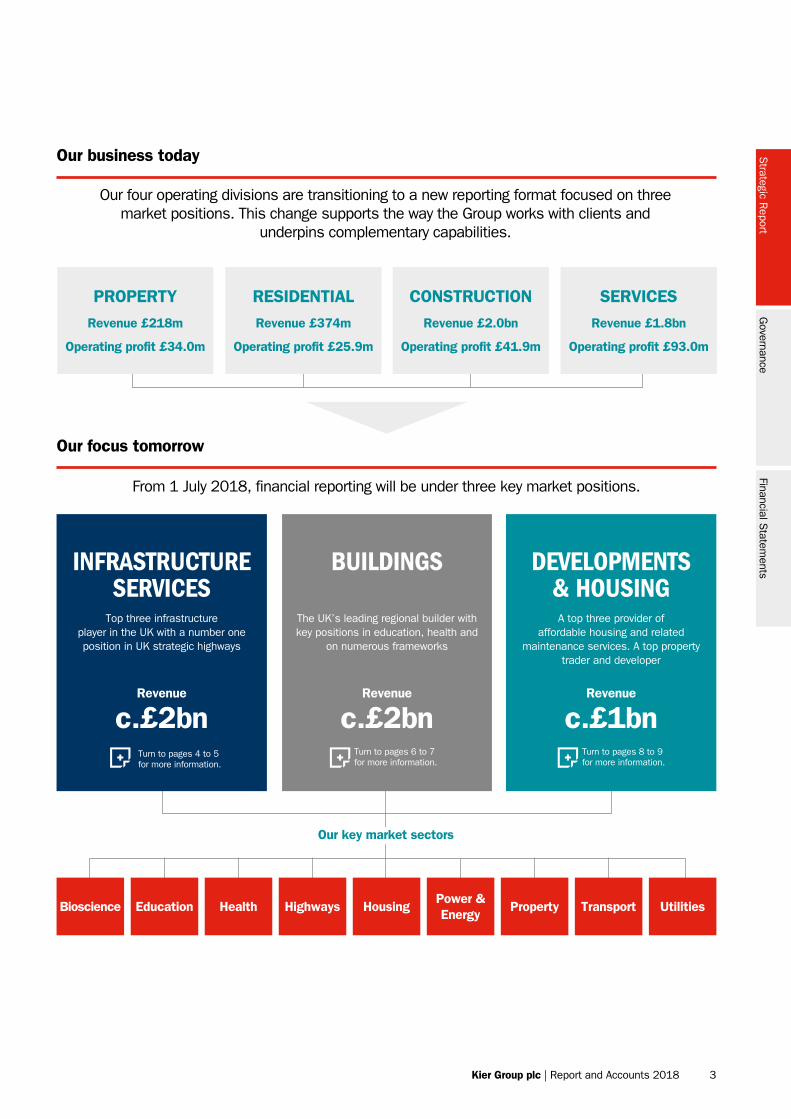
Our business today
Our four operating divisions are transitioning to a new reporting format focused on three market positions. This change supports the way the Group works with clients and
underpins complementary capabilities.
PROPERTYRevenue £218m
Operating profit £34.0m
CONSTRUCTIONRevenue £2.0bn
Operating profit £41.9m
RESIDENTIALRevenue £374m
Operating profit £25.9m
SERVICESRevenue £1.8bn
Operating profit £93.0m
Transport UtilitiesHighwaysHealthEducationBioscience PropertyHousingPower & Energy
INFRASTRUCTURE SERVICES
Top three infrastructure player in the UK with a number one position in UK strategic highways
Revenue
c.£2bn
BUILDINGS
The UK’s leading regional builder with key positions in education, health and
on numerous frameworks
Revenue
c.£2bn
DEVELOPMENTS & HOUSINGA top three provider of
affordable housing and related maintenance services. A top property
trader and developer
Revenue
c.£1bnTurn to pages 4 to 5 for more information.
Turn to pages 8 to 9 for more information.
Turn to pages 6 to 7 for more information.
Our focus tomorrow
From 1 July 2018, financial reporting will be under three key market positions.
Our key market sectors
Strategic R
eportG
overnanceFinancial S
tatements
Kier Group plc | Report and Accounts 2018 3

WE PROVIDE
ESSENTIAL INFRASTRUCTURE
SERVICES
Strategic Report
Infrastructure Services
The barrel-vaulted glass roof at King’s Cross, London, refurbished by Kier.
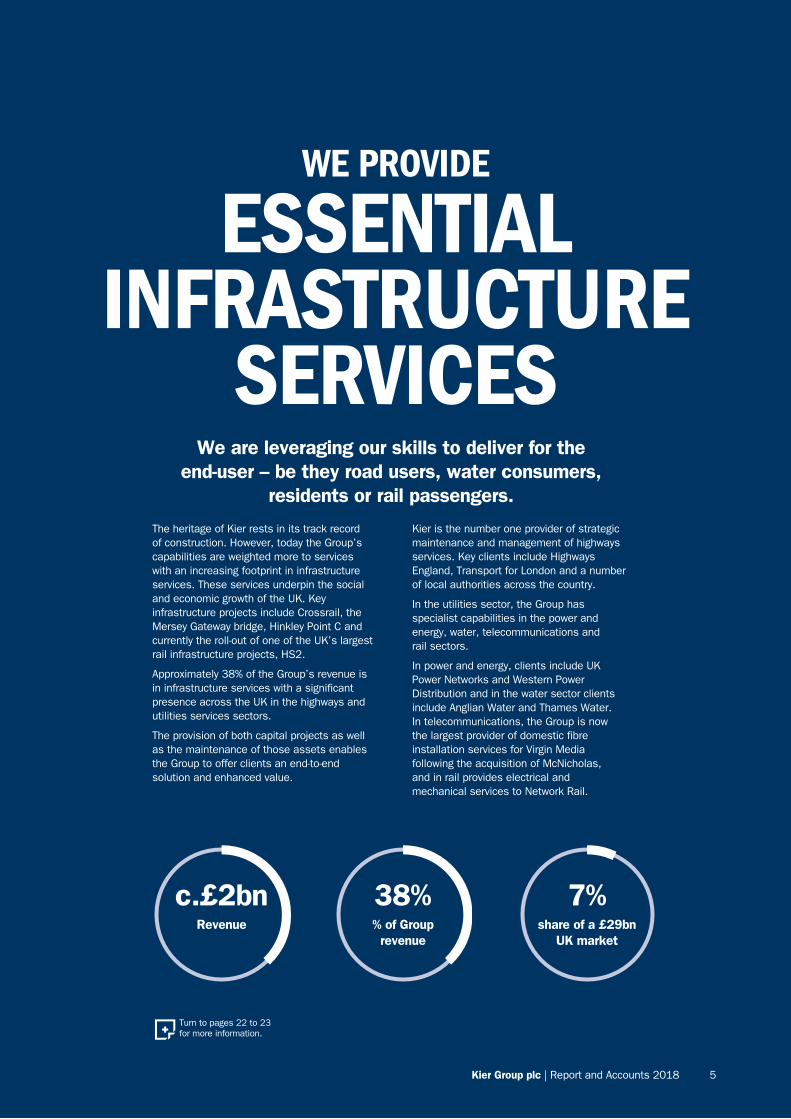
The heritage of Kier rests in its track record of construction. However, today the Group’s capabilities are weighted more to services with an increasing footprint in infrastructure services. These services underpin the social and economic growth of the UK. Key infrastructure projects include Crossrail, the Mersey Gateway bridge, Hinkley Point C and currently the roll-out of one of the UK’s largest rail infrastructure projects, HS2.
Approximately 38% of the Group’s revenue is in infrastructure services with a significant presence across the UK in the highways and utilities services sectors.
The provision of both capital projects as well as the maintenance of those assets enables the Group to offer clients an end-to-end solution and enhanced value.
Kier is the number one provider of strategic maintenance and management of highways services. Key clients include Highways England, Transport for London and a number of local authorities across the country.
In the utilities sector, the Group has specialist capabilities in the power and energy, water, telecommunications and rail sectors.
In power and energy, clients include UK Power Networks and Western Power Distribution and in the water sector clients include Anglian Water and Thames Water. In telecommunications, the Group is now the largest provider of domestic fibre installation services for Virgin Media following the acquisition of McNicholas, and in rail provides electrical and mechanical services to Network Rail.
WE PROVIDE
ESSENTIAL INFRASTRUCTURE
SERVICESWe are leveraging our skills to deliver for the
end-user – be they road users, water consumers, residents or rail passengers.
7%share of a £29bn
UK market
38%% of Group revenue
c.£2bnRevenue
Turn to pages 22 to 23 for more information.
Kier Group plc | Report and Accounts 2018 5

Strategic Report
Buildings
The Elekta building, Crawley, Sussex.

Kier is a national builder with a network of regional offices which ensures that every project contributes to the local economy, utilising local skills and drawing on the local supply chain.
Our portfolio covers local and regional projects as well as major projects. We have the flexibility and expertise to build across a range of projects from a £250k extension to a strategic asset costing hundreds of millions of pounds.
Our activities support local economies with work including town centre regenerations, refurbishing transport hubs and interchanges, building schools, civic and leisure facilities
such as museums and hotels, and developing commercial sites. Over 400 projects are undertaken each year.
With a focus on new building methods, Kier has delivered over the last five years more than £2bn of projects that have included using off-site construction and modern methods of construction.
Kier is a leader in the education and health sectors and has an established position on public frameworks and growing positions in the private sector.
WE ARE
THE UK’S LARGEST REGIONAL BUILDER
With growth in the UK’s population, more public facilities including hospitals and schools are needed
as well as places to work, rest and play.
Turn to pages 24 to 25 for more information.
c.£2bnRevenue
40%% of Group revenue
3%share of a c.£67bn
market
Kier Group plc | Report and Accounts 2018 7

Strategic Report
Developments & Housing
A Kier affordable home.
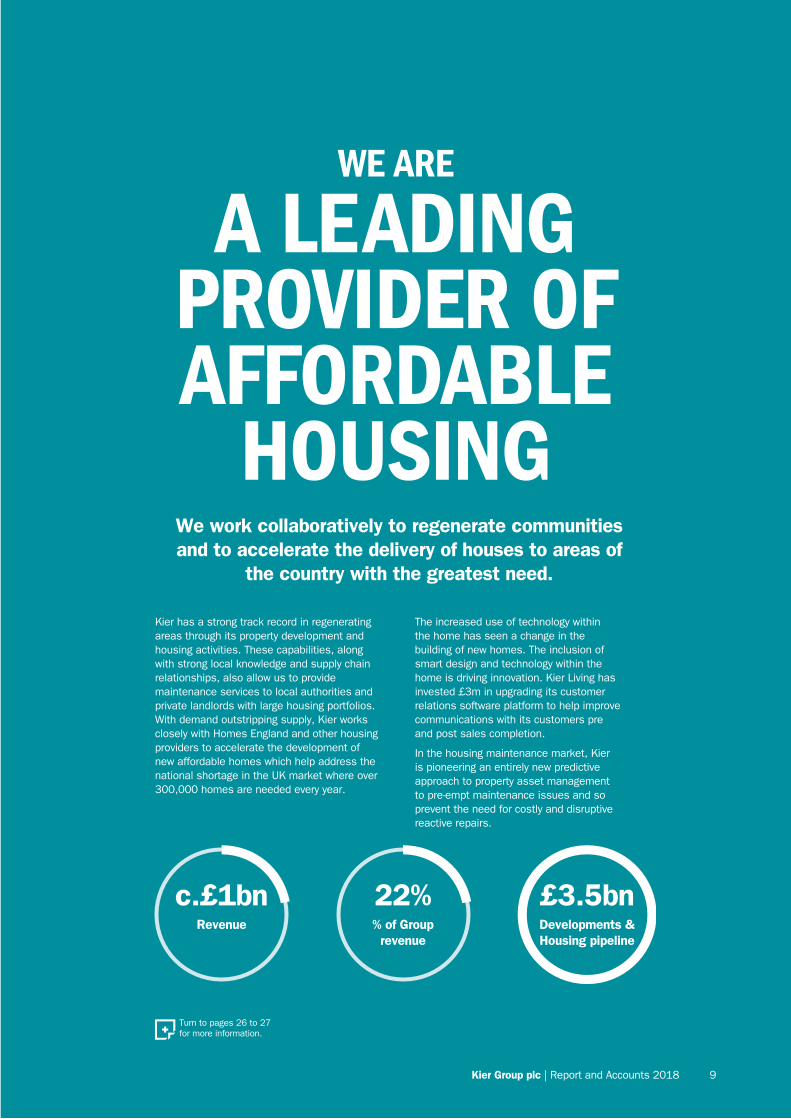
Kier has a strong track record in regenerating areas through its property development and housing activities. These capabilities, along with strong local knowledge and supply chain relationships, also allow us to provide maintenance services to local authorities and private landlords with large housing portfolios. With demand outstripping supply, Kier works closely with Homes England and other housing providers to accelerate the development of new affordable homes which help address the national shortage in the UK market where over 300,000 homes are needed every year.
The increased use of technology within the home has seen a change in the building of new homes. The inclusion of smart design and technology within the home is driving innovation. Kier Living has invested £3m in upgrading its customer relations software platform to help improve communications with its customers pre and post sales completion.
In the housing maintenance market, Kier is pioneering an entirely new predictive approach to property asset management to pre-empt maintenance issues and so prevent the need for costly and disruptive reactive repairs.
We work collaboratively to regenerate communities and to accelerate the delivery of houses to areas of
the country with the greatest need.
WE ARE
A LEADING PROVIDER OF AFFORDABLE
HOUSING
Turn to pages 26 to 27 for more information.
c.£1bnRevenue
22%% of Group revenue
£3.5bnDevelopments & Housing pipeline
Kier Group plc | Report and Accounts 2018 9
Strategic Report
Our investment case
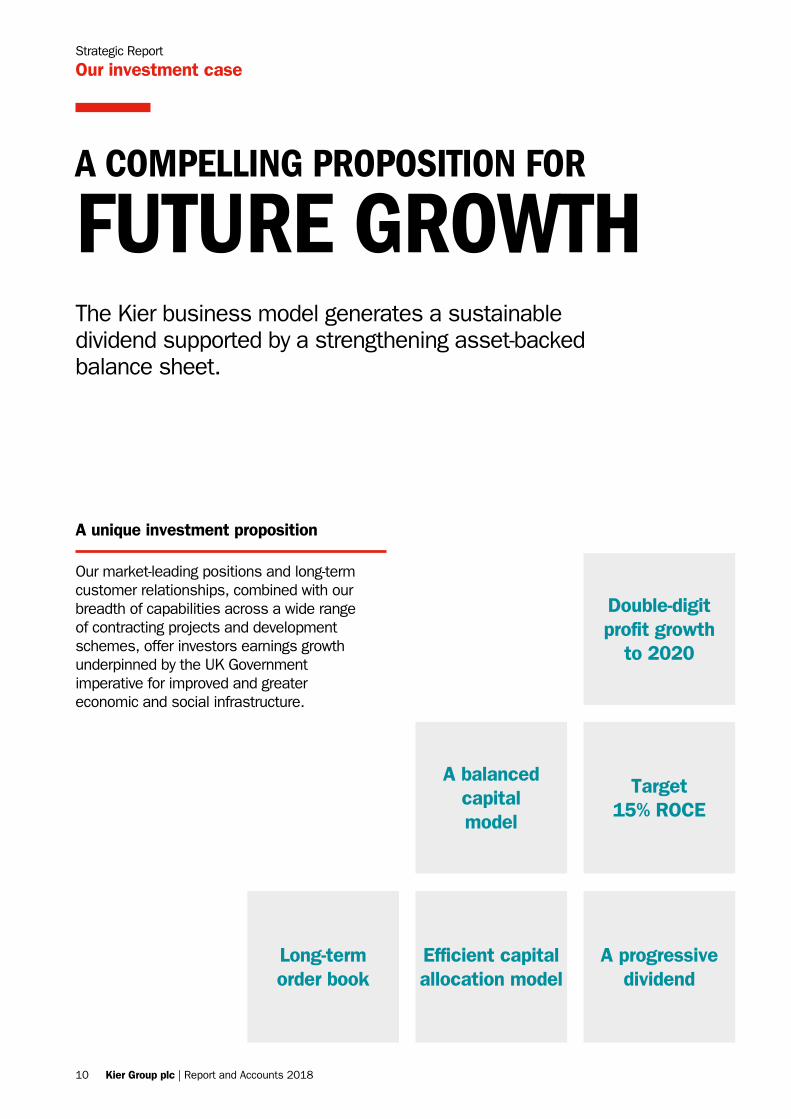
A COMPELLING PROPOSITION FOR
FUTURE GROWTHThe Kier business model generates a sustainable dividend supported by a strengthening asset-backed balance sheet.
A unique investment proposition
Double-digit profit growth
to 2020
A balanced capital model
Target 15% ROCE
A progressive dividend
Efficient capital allocation model
Long-term order book
Our market-leading positions and long-term customer relationships, combined with our breadth of capabilities across a wide range of contracting projects and development schemes, offer investors earnings growth underpinned by the UK Government imperative for improved and greater economic and social infrastructure.
10 Kier Group plc | Report and Accounts 2018
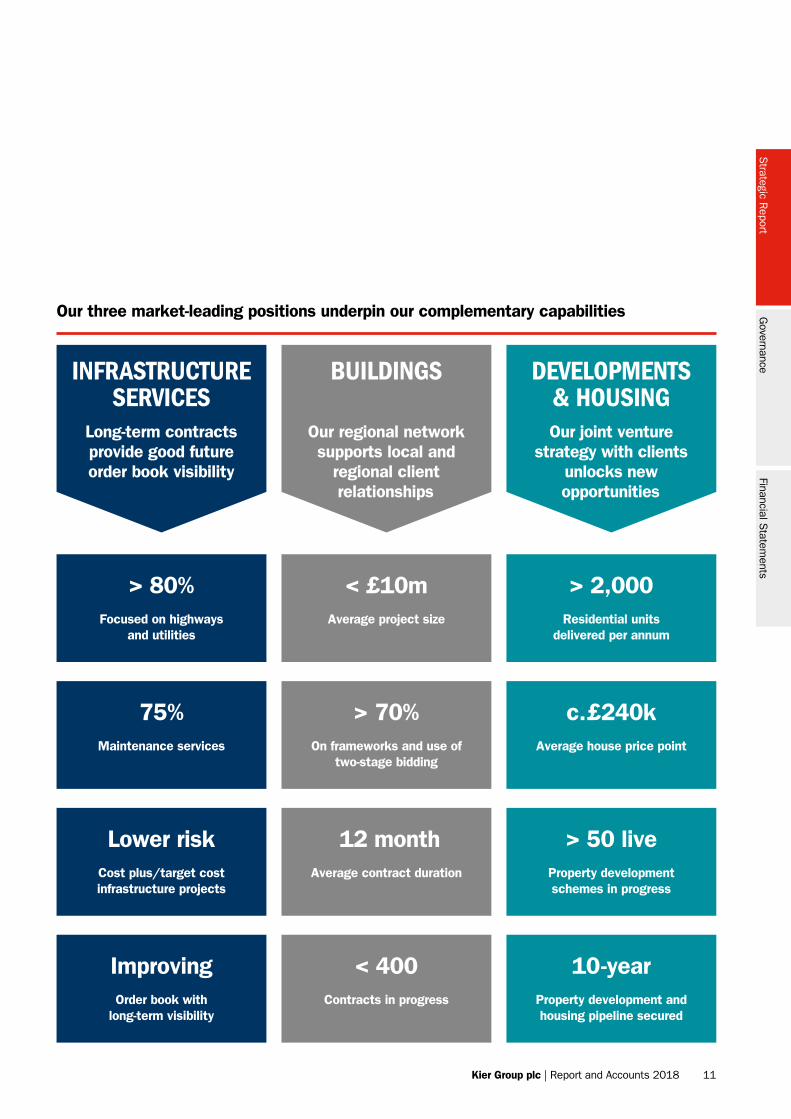
Our three market-leading positions underpin our complementary capabilities
INFRASTRUCTURE SERVICES
Long-term contracts provide good future order book visibility
> 80%Focused on highways
and utilities
Lower risk Cost plus/target cost infrastructure projects
ImprovingOrder book with
long-term visibility
75% Maintenance services
BUILDINGS
Our regional network supports local and
regional client relationships
< £10mAverage project size
> 70% On frameworks and use of
two-stage bidding
12 monthAverage contract duration
< 400Contracts in progress
DEVELOPMENTS & HOUSINGOur joint venture
strategy with clients unlocks new opportunities
c.£240k Average house price point
10-year Property development and housing pipeline secured
> 50 liveProperty development schemes in progress
> 2,000Residential units
delivered per annum
Strategic R
eportG
overnanceFinancial S
tatements
Kier Group plc | Report and Accounts 2018 11
Strategic Report
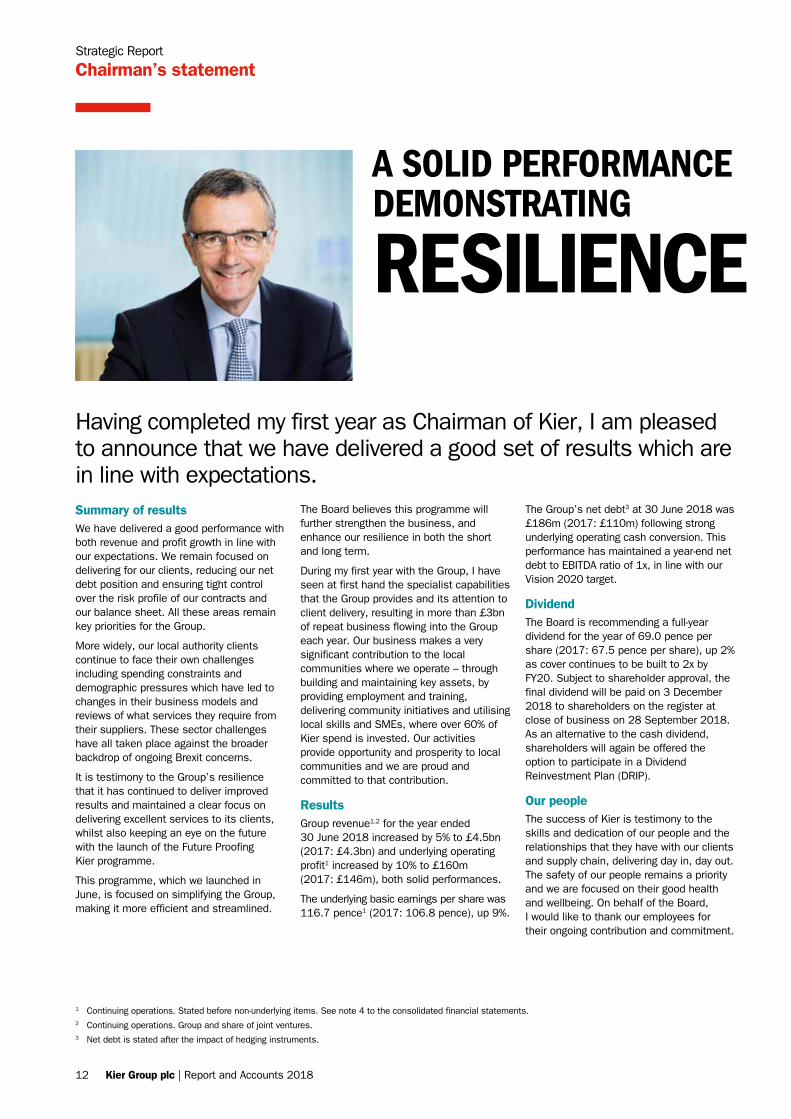
Chairman’s statement
Having completed my first year as Chairman of Kier, I am pleased to announce that we have delivered a good set of results which are in line with expectations.
A SOLID PERFORMANCE DEMONSTRATING
RESILIENCE
Summary of resultsWe have delivered a good performance with both revenue and profit growth in line with our expectations. We remain focused on delivering for our clients, reducing our net debt position and ensuring tight control over the risk profile of our contracts and our balance sheet. All these areas remain key priorities for the Group.
More widely, our local authority clients continue to face their own challenges including spending constraints and demographic pressures which have led to changes in their business models and reviews of what services they require from their suppliers. These sector challenges have all taken place against the broader backdrop of ongoing Brexit concerns.
It is testimony to the Group’s resilience that it has continued to deliver improved results and maintained a clear focus on delivering excellent services to its clients, whilst also keeping an eye on the future with the launch of the Future Proofing Kier programme.
This programme, which we launched in June, is focused on simplifying the Group, making it more efficient and streamlined.
The Board believes this programme will further strengthen the business, and enhance our resilience in both the short and long term.
During my first year with the Group, I have seen at first hand the specialist capabilities that the Group provides and its attention to client delivery, resulting in more than £3bn of repeat business flowing into the Group each year. Our business makes a very significant contribution to the local communities where we operate – through building and maintaining key assets, by providing employment and training, delivering community initiatives and utilising local skills and SMEs, where over 60% of Kier spend is invested. Our activities provide opportunity and prosperity to local communities and we are proud and committed to that contribution.
ResultsGroup revenue1,2 for the year ended 30 June 2018 increased by 5% to £4.5bn (2017: £4.3bn) and underlying operating profit1 increased by 10% to £160m (2017: £146m), both solid performances.
The underlying basic earnings per share was 116.7 pence1 (2017: 106.8 pence), up 9%.
The Group’s net debt3 at 30 June 2018 was £186m (2017: £110m) following strong underlying operating cash conversion. This performance has maintained a year-end net debt to EBITDA ratio of 1x, in line with our Vision 2020 target.
DividendThe Board is recommending a full-year dividend for the year of 69.0 pence per share (2017: 67.5 pence per share), up 2% as cover continues to be built to 2x by FY20. Subject to shareholder approval, the final dividend will be paid on 3 December 2018 to shareholders on the register at close of business on 28 September 2018. As an alternative to the cash dividend, shareholders will again be offered the option to participate in a Dividend Reinvestment Plan (DRIP).
Our peopleThe success of Kier is testimony to the skills and dedication of our people and the relationships that they have with our clients and supply chain, delivering day in, day out. The safety of our people remains a priority and we are focused on their good health and wellbeing. On behalf of the Board, I would like to thank our employees for their ongoing contribution and commitment.
1 Continuing operations. Stated before non-underlying items. See note 4 to the consolidated financial statements.2 Continuing operations. Group and share of joint ventures.3 Net debt is stated after the impact of hedging instruments.
12 Kier Group plc | Report and Accounts 2018
Corporate governance and the BoardThe Board spent a significant amount of time carefully reviewing the risk appetite and risk management of the Group. Given the market developments, there has been a particular focus on contract risk profile and key contract controls.
I am pleased to report that our strong record of repeat business, often within long-term framework agreements and two-stage bidding processes, and a growing order book helps to mitigate any material risk. With the launch of the Future Proofing Kier programme, it was identified that the appointment of a Chief Operating Officer was key to delivering the programme’s objectives and, on 1 August 2018, Claudio Veritiero was appointed to the role of Chief Operating Officer. Claudio was previously the Strategy and Corporate Development Director, joining Kier in 2011 as the Managing Director of the Services division. Prior to joining Kier, he was the Chief Operating Officer of Speedy Hire plc, having spent his early career with the investment banking business of Rothschild. I would like to congratulate Claudio on his new role.
In light of this appointment, Nigel Brook (Executive Director – Construction and Infrastructure Services) and Nigel Turner (Executive Director – Developments and Property Services) stood down from the Board and left the business on 1 August 2018.
I would like to take this opportunity to thank Nigel and Nigel for their contribution over the years to the Group and on behalf of the Board, I wish them well for the future.
Having completed nine years on the Board, Nick Winser has decided not to offer himself for re-election at the November AGM. Nick has played an important role on the Board, in particular as the Chair of the SHE Committee. I would like to express my thanks to Nick for his support following my appointment as Chairman and, on behalf of the Board, wish him well for the future. Kirsty Bashforth will take over the role of Chair of the SHE Committee with effect from the conclusion of the AGM. I look forward to working with Kirsty in her new role.
OutlookWe have launched the Future Proofing Kier programme which will streamline the business thereby enabling us to deliver a more efficient service to clients, respond to changes in our markets and capitalise on growth opportunities, whilst, importantly, also accelerating the reduction of the Group’s net debt position.
Our strong market-leading positions, our record c.£10.2bn Construction and Services order books, and our £3.5bn property development and residential pipelines, will see the Group deliver on its Vision 2020 targets. In addition, the Future Proofing Kier programme positions the Group well for an improvement in operating margins and higher cash generation, culminating in a net cash position for FY21.
Safety, Health and Environment Committee › Reviewed the Group’s performance against safety,
health and environmental KPIs; › Approved the launch of the Group’s health and wellbeing
strategy; and › Monitored progress against the Group’s ’30 by 30’
environmental strategy.
Nomination Committee
› Recommended the appointment of Claudio Veritiero as Chief Operating Officer;
› Challenged management to increase diversity within the organisation and agree KPIs to monitor progress; and
› Monitored progress of the Executive Director/senior management succession plan.
Risk Management and Audit Committee › Oversaw the appointment of Grant Thornton as the
co-sourced internal auditor, succeeding KPMG; › Oversaw the continued development of the Group’s
systems of risk management and internal control; and › Worked with PwC to continue to ensure a rigorous and
robust approach to the annual audit.
Remuneration Committee
› Set the Executive Directors’ 2018/19 base salaries; › Assessed performance against the 2018 bonus targets
and set the 2019 bonus targets; and › Discussed the latest trends in executive remuneration.
Governance highlights
Philip Cox CBEChairman
19 September 2018
Turn to the Nomination Committee report on pages 69 and 70.
Turn to the Safety, Health and Environment Committee report on pages 81 and 82.
Turn to the Risk Management and Audit Committee report on pages 73 to 80 (inclusive).
Turn to the Directors’ Remuneration Report on pages 86 to 107 (inclusive).
Strategic R
eportG
overnanceFinancial S
tatements
Kier Group plc | Report and Accounts 2018 13
Strategic Report
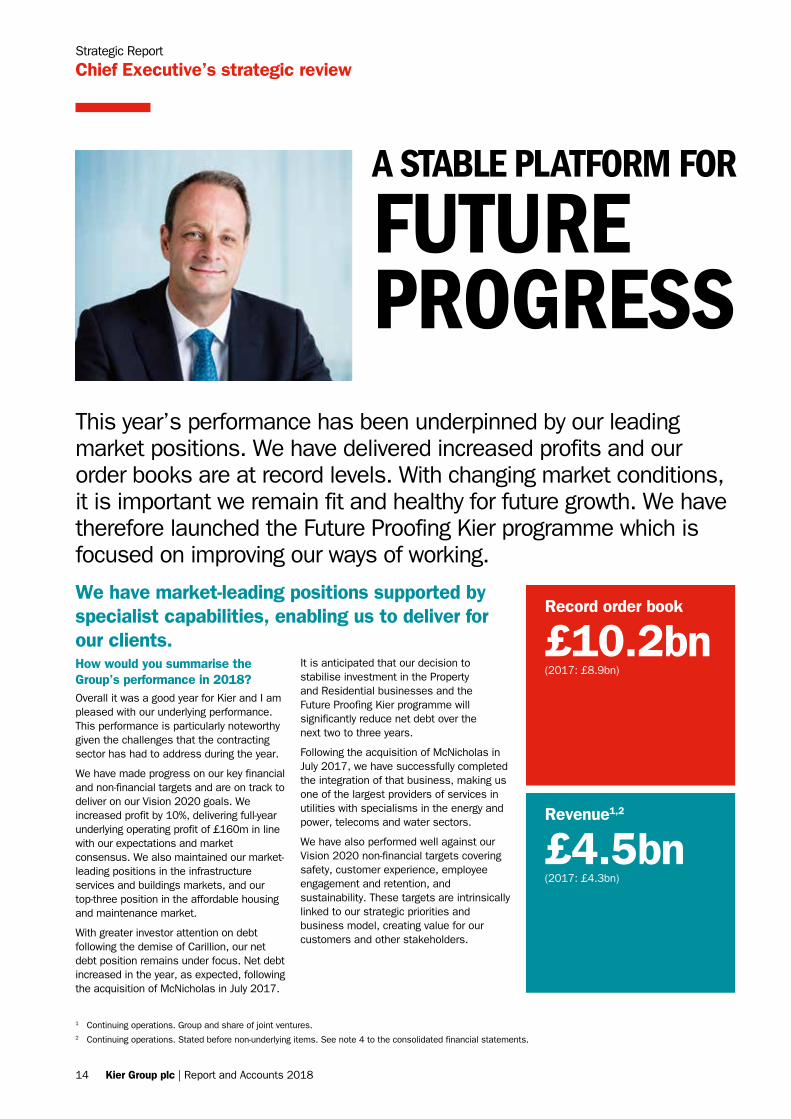
Chief Executive’s strategic review
This year’s performance has been underpinned by our leading market positions. We have delivered increased profits and our order books are at record levels. With changing market conditions, it is important we remain fit and healthy for future growth. We have therefore launched the Future Proofing Kier programme which is focused on improving our ways of working.
A STABLE PLATFORM FOR
FUTURE PROGRESS
We have market-leading positions supported by specialist capabilities, enabling us to deliver for our clients.How would you summarise the Group’s performance in 2018?Overall it was a good year for Kier and I am pleased with our underlying performance. This performance is particularly noteworthy given the challenges that the contracting sector has had to address during the year.
We have made progress on our key financial and non-financial targets and are on track to deliver on our Vision 2020 goals. We increased profit by 10%, delivering full-year underlying operating profit of £160m in line with our expectations and market consensus. We also maintained our market-leading positions in the infrastructure services and buildings markets, and our top-three position in the affordable housing and maintenance market.
With greater investor attention on debt following the demise of Carillion, our net debt position remains under focus. Net debt increased in the year, as expected, following the acquisition of McNicholas in July 2017.
It is anticipated that our decision to stabilise investment in the Property and Residential businesses and the Future Proofing Kier programme will significantly reduce net debt over the next two to three years.
Following the acquisition of McNicholas in July 2017, we have successfully completed the integration of that business, making us one of the largest providers of services in utilities with specialisms in the energy and power, telecoms and water sectors.
We have also performed well against our Vision 2020 non-financial targets covering safety, customer experience, employee engagement and retention, and sustainability. These targets are intrinsically linked to our strategic priorities and business model, creating value for our customers and other stakeholders.
Record order book
£10.2bn(2017: £8.9bn)
Revenue1,2
£4.5bn(2017: £4.3bn)
1 Continuing operations. Group and share of joint ventures.2 Continuing operations. Stated before non-underlying items. See note 4 to the consolidated financial statements.
14 Kier Group plc | Report and Accounts 2018
“OUR CLIENTS’ PRIMARY OBJECTIVES ARE TO SERVICE THEIR END-USERS AND WE NEED TO SUPPORT THAT GOAL”
Turning to safety, which is at the heart of our licence to operate and remains a priority for clients when procuring work, I am delighted to say that our safety performance in 2018 was encouraging. We achieved an accident incidence rate (AIR) of 96, which is UK-leading for the Group as a whole and reflected a 26% improvement on the previous year.
I am pleased with our overall performance for the year.
Can you explain the rationale for the move to the three market positions?The transition to the three market positions of Infrastructure Services, Buildings, and Developments & Housing, reflects the increasing demand in these markets from customers as well as our specialist capabilities.
In adopting this approach, we also aim to address the main challenges facing the UK today. All three of these markets have robust long-term fundamentals which are driven by changing demographics and the increasing use of technology. As part of Future Proofing Kier programme, a re-aligned business model focuses the efforts of our teams and makes it easier for us to deliver for our clients.
Whatever sector they operate in, our clients’ primary objectives are: to service their end-users – be they water consumers, road users, housing tenants or rail passengers – as best they can. Through our three market positions, we aim to leverage our skills, knowledge and innovation to provide solutions which make this happen as efficiently and effectively as possible. We also want to build closer relationships with clients, so we can better understand the challenges they face and find solutions with them.
How will the new Future Proofing Kier programme help to drive efficiency across the Group?Following the launch in June of Future Proofing Kier, our efficiency and streamlining programme, we are currently focused on improving our productivity, removing duplication of processes and non-value activities, and disposing of non-core operations. It is anticipated that the actions taken during FY19 will deliver annual profit and cash flow improvements of 10% of profit from operations, c.£20m from July 2019, with targeted proceeds of £30m-£50m from the disposal of non-core businesses. This programme will help the Group achieve its target of year-end net cash and average net debt of £250m for FY21. The programme activity undertaken in the current financial year will be cash and earnings neutral and I expect the programme to deliver material improvements in operating margins and cash generation in the financial year ending 30 June 2020 and beyond.
Our alignment to three market positions and our significant investment in new systems provides the opportunity to optimise how we operate. We want to be resilient to accommodate changes in the marketplace; our markets continue to evolve, which requires us to be flexible and front-footed to ensure we meet the changing needs of our clients and the markets in which they operate.
Streamlining and transforming the Group in this way will make us more agile and give greater responsibility and accountability to our operations. In procurement, for example, we have created a powerful back-of-house shared services function. The Future Proofing Kier programme will ensure this and other similar back-of-office functions link seamlessly to the operations.
Overall, the programme will improve the resilience of the Group in a changing market and help us to better leverage the system investments we have made while strongly positioning the Group for 2020 and beyond.
What is your balance sheet strategy?Our debt position remains a key area of focus for us and our investors. Historically we have used our asset-backed debt strategy to fund our Property and Residential activities. We have now taken action to accelerate the reduction of our net debt position and stabilise the Group’s investment in our Property and Residential divisions through the use of joint ventures with our clients. Our current average net debt position of £375m is backed by assets at a cost of £500m, which provides significant cover for our net debt position.
The average net debt figure for this year increased on the previous year as a result of the acquisition of McNicholas and the reduced Construction revenues over the winter due to bad weather, which have since returned to levels in line with our expectations. I believe our efforts to reduce net debt will yield results, and these will now be further strengthened by the results of the Future Proofing Kier programme.
Pension surplusLooking more broadly at the balance sheet, our pension schemes are now in surplus. Our current pension scheme is fully funded and we therefore expect our tri-annual valuation discussions in March 2019 to be positive. At the same time, our working capital performance is strong, with operating cash conversion for 2018 at more than 100%, which shows we continue to maintain very good financial discipline. Having reached the end of our major systems investment, we also expect our capital expenditure to return to normalised levels of around £30m per annum, having been around £90m per annum for the last few years.
Strategic R
eportG
overnanceFinancial S
tatements
Kier Group plc | Report and Accounts 2018 15
Strategic Report
Chief Executive’s strategic review continued
How did market developments impact Kier in 2018?There has been a significant level of turbulence in our markets over the past 12 months. Unsurprisingly, this has led to increased scrutiny of the performance and financials of companies in our sectors and the ways in which we operate – for example, how we work with the supply chain and SMEs with particular reference to payment terms.
We are confident that Kier has always had and will continue to have strong financial and operational disciplines particularly in its commercial and risk processes.
For example, in Construction our focus is on high-volume, modest-value contracts, primarily pursuing new work under frameworks or lower risk contract models. We operate over 400 projects at any one time, with an average value of about £7-8m. This helps us spread our operational risk and means we are more agile to respond to market developments.
We are a key supplier to government in the markets in which it is investing in e.g. affordable housing, social and economic infrastructure. Many of our businesses operate through government frameworks and five-year funding periods, which gives us access to more visible pipelines of work.
More specifically, as a result of market developments in the year including the liquidation of Carillion, Kier acquired a greater share of the HS2 project and the Highways England’s Smart Motorways portfolio. We transferred over 150 people into the company to help deliver these increased project requirements and worked closely and collaboratively with our clients during these challenging periods.
CollaborationWe are known for our strong relationships with clients, working collaboratively with them, anticipating issues they face, providing problem-solving solutions and innovation.
A good example of working collaboratively is our work with Highways England, who have long-term, stable budgets and visible future investment plans. As a key supplier to Highways England, we work with them as they develop solutions such as their Routes to Market strategy and are helping them with the transition to this model. Closer working with our clients provides the best outcomes and is critical to securing new work, such as the recently announced extensions to Highways England Areas 3, 6, 8 and 9 contracts.
Sector opportunitiesMore generally in transport, a market sector where Kier has established credentials, there are considerable opportunities arising in local authority roads, and in the rail sector with the launch of its next investment period, CP6. Our credentials in rail have been significantly enhanced following the acquisition of McNicholas and we expect to play an active role in the next review period, CP6.
In infrastructure we anticipate the increase in demand for UK power generation will present opportunities in the nuclear, renewables and gas sectors over the next five-to-ten years. We will continue to monitor these markets closely and we are also in discussion with many of our water company clients as the water cycle, AMP7, starts its procurement phase.
In Buildings, we remain the UK market leader with a focus on key sectors such as education and health. In education, expenditure is driven by a growing population and the need to continually invest in the existing estate.
In health, the Government has recently announced an increase in NHS funding of 3.4% pa. Whilst it is expected that much of this investment will go into front-line services, we expect this will create an additional pipeline of opportunities in related sectors such as bioscience where we have also successfully established a strong presence over the last few years.
In addition, the UK’s investment in aviation, with the approval for expansion at Heathrow airport, will provide a major, multi-year boost to a sector which is seeing growth across in the UK. Meanwhile, public policy is increasingly supporting modern methods of construction (MMC) and we have already delivered over £2bn of projects that include MMC over the past five years.
In our Residential division, we are set to benefit from the UK Government’s Help to Buy scheme that has been extended to 2021, supporting the increase in the building of affordable housing. With a national shortfall of a least one million homes, this is a market with significant growth potential and one we are actively targeting. Our innovative approach to using joint ventures, such as the Homes England joint venture launched in May, is enabling us to accelerate the development of our residential land bank through a capital efficient model. The creation of the Homes England joint venture has created an opportunity for Kier to increase the scale of its affordable house building activities by c.500 units per annum from 2020.
“WE WANT TO USE OUR POSITIONING TO BUILD CLOSER RELATIONSHIPS WITH CLIENTS, SO WE CAN BETTER UNDERSTAND THE CHALLENGES THEY FACE”
16 Kier Group plc | Report and Accounts 2018
How is Brexit affecting your markets and business?We have seen no material impact of Brexit to date. However, the Kier internal Brexit Taskforce team monitors our supply chain-labour mobility and materials availability. With continued uncertainty, we are scenario-planning and working with our clients and others in the industry to ensure we are able to respond to future developments.
We are particularly focused on monitoring the issue of labour mobility. The strength of many of our supply chain partners is directly linked to the flow of people and skills into the UK, particularly in London and the South East, where a larger proportion of our supply chain workforce is made up of non-domestic individuals.
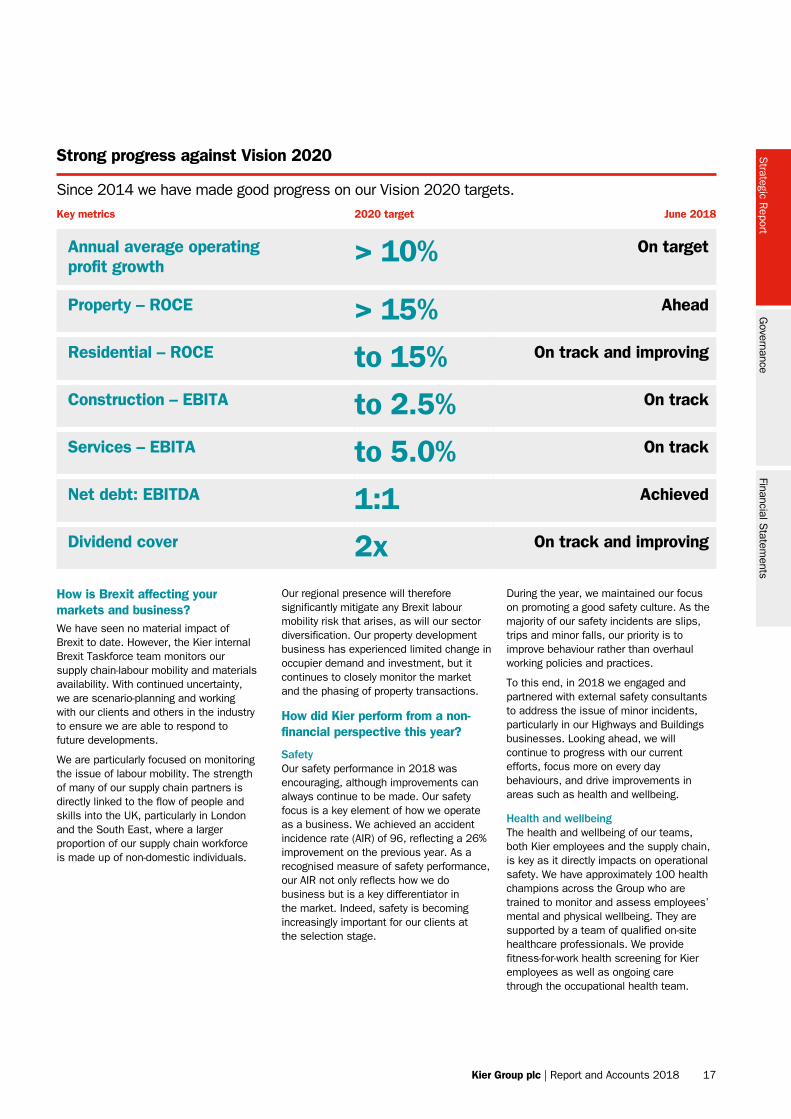
Strong progress against Vision 2020
Since 2014 we have made good progress on our Vision 2020 targets. Key metrics 2020 target June 2018
Annual average operating profit growth
> 10% On target
Property – ROCE > 15% Ahead
Residential – ROCE to 15% On track and improving
Construction – EBITA to 2.5% On track
Services – EBITA to 5.0% On track
Net debt: EBITDA 1:1 Achieved
Dividend cover 2x On track and improving
Our regional presence will therefore significantly mitigate any Brexit labour mobility risk that arises, as will our sector diversification. Our property development business has experienced limited change in occupier demand and investment, but it continues to closely monitor the market and the phasing of property transactions.
How did Kier perform from a non-financial perspective this year?
SafetyOur safety performance in 2018 was encouraging, although improvements can always continue to be made. Our safety focus is a key element of how we operate as a business. We achieved an accident incidence rate (AIR) of 96, reflecting a 26% improvement on the previous year. As a recognised measure of safety performance, our AIR not only reflects how we do business but is a key differentiator in the market. Indeed, safety is becoming increasingly important for our clients at the selection stage.
During the year, we maintained our focus on promoting a good safety culture. As the majority of our safety incidents are slips, trips and minor falls, our priority is to improve behaviour rather than overhaul working policies and practices.
To this end, in 2018 we engaged and partnered with external safety consultants to address the issue of minor incidents, particularly in our Highways and Buildings businesses. Looking ahead, we will continue to progress with our current efforts, focus more on every day behaviours, and drive improvements in areas such as health and wellbeing.
Health and wellbeingThe health and wellbeing of our teams, both Kier employees and the supply chain, is key as it directly impacts on operational safety. We have approximately 100 health champions across the Group who are trained to monitor and assess employees’ mental and physical wellbeing. They are supported by a team of qualified on-site healthcare professionals. We provide fitness-for-work health screening for Kier employees as well as ongoing care through the occupational health team.
Strategic R
eportG
overnanceFinancial S
tatements
Kier Group plc | Report and Accounts 2018 17
Strategic Report
Chief Executive’s strategic review continued
Shaping Your World campaign
350+Kier ambassadors
15,000+Students engaged
Safety: Group Accident Incidence Rate (AIR)
96Improved by 26%(2017: 130)
DiversityDiversity and inclusion is a key priority and one where we are taking meaningful action as a business. Our business and industry already employs people with very diverse socio-economic backgrounds, but we acknowledge we have considerable scope for improvement in the areas relating to ethnic and gender diversity. We have established several internal forums, such as our Balanced Business Network and the LGBT+ and Allies Network. In addition, we have created a Gender Strategy Steering Group which is responsible for driving leadership action on gender. We have a particular focus on gender pay, where our median pay gap reported this year was 20.2%, higher than the national average. We have fewer women in senior roles which means we have proportionately more men earning higher salaries. We are focused on tackling this gap to increase the number of women coming into Kier and progressing to senior roles.
In addition to Group initiatives, our operational businesses support a number of key topics which are of particular importance to their clients. For example, in our Highways business, we have made good progress around disability, and in 2018 we achieved the Disability Confident accreditation for our work, supporting Highways England’s focus on this topic.
We also continued our strong focus on our graduate and apprenticeship programme, where we have maintained more than 5% of our workforce on approved training schemes. As a member of the UK’s 5% Club, we have approximately 1,200 graduates and apprentices currently engaged in training across the business. As a responsible business, it is vital we are in a position to develop the necessary UK skills and expertise to support industry growth in the future. We are actively seeking to encourage the Government and the public sector to make this level of commitment a pre-requisite for tenders. We are continuing to promote our Shaping Your World campaign, launched in September 2017, which encourages 11-15 year olds to consider careers in construction and the built environment. We are proud to report that we have exceeded the targets we put in place for the first year of the campaign with over 350 Shaping Your World ambassadors across the Company who regularly visit schools to explain the industry and to talk about the many and varied career opportunities available. This campaign reached more than 15,000 students in its first year.
EnvironmentIn 2018 we launched the first three environmental initiatives as part of our 30 by 30 strategy, which aims to reduce our energy usage by 30% by 2030. The strategy covers a broad range of activities, from the reduction of construction waste to water consumption and use of plastics. It should begin to deliver financial savings over the next 12 to 18 months, and over time will enable us to make a greater contribution to environmental protection and sustainability.
What sets Kier apart from the competition?The Kier business model is at the heart of our competitive differentiation. Through our three market positions, we aim to leverage our skills, knowledge and innovation to provide solutions which make this happen as efficiently and effectively as possible. Our business model provides stability and certainty when individual markets fluctuate.
In Construction, our high-volume, low-value approach offers a lower risk model which protects us from profit and cash flow volatility. It provides us with long-term visibility, with projects often delivered in framework arrangements, many with five-year terms.
The breadth of our Services business also provides both job interest and career opportunities for our employees, and stable financial performance. We have chosen to work in markets where we provide critical services, such as repairing roads or fixing leaks in water networks – essential everyday maintenance that has to be undertaken, and where future investment is more certain.
We are increasingly using joint ventures across our Property and Residential operations to make more efficient use of our capital. This is evidenced through the Cross Keys and Homes England joint ventures announced over the last year, and the use of joint ventures on many of our property development schemes, such as those with Network Rail and Watford Borough Council.
We provide specialist services to a broad range of sectors, and we have a track record of problem-solving and providing fresh thinking to our clients. For example, we regularly use off-site construction and modern methods of construction on projects. As part of this process, we offer our clients a unique breadth of complementary capabilities to help meet their project requirements.
Supply chainOur focus is truly local, using local resources and talent to benefit the local community. It’s what I call a national footprint with a local flavour. Our regional network of over 80 offices enables us to deliver projects and services anywhere in the UK. Another key differentiator is the fact that, as a result of our average project size and the every day services we provide, we use very local SME supply chains. Around the business, we have a strong regional focus, unique among our peers, having developed robust supplier relationships built on local knowledge and trust over many years. These relationships have helped us establish powerful market positions outside of London and the South East.
Collaboration with our supply chain is also critical, and each year our businesses spend time with our suppliers, working to understand how we can better partner and innovate alongside them. Keen to deepen these relationships and ensure continuity of supply, we offer a variety of contract types and payment mechanisms, including early payments schemes for the supply chain. These are popular, often helping them with their working capital challenges, a typical feature of the sector.
18 Kier Group plc | Report and Accounts 2018

Watch Haydn Mursell’s interview online – www.kier.co.uk
Haydn MursellChief Executive
19 September 2018
These activities are clear recognition of the importance of our suppliers to our long-term business success and sustainability.
In our Highways business, we have brought new technology into the sector. For example, the Kier Highways team has transferred the concept of Roadrake, which is used to clean beaches in Australia, to the UK to clear litter on the Highways England network. This technology is now being rolled out on to other parts of the Highways England network. Working in collaboration with our supply chain, we are responsible for introducing a range of new technology into the highways market which Highways England and other members of their supply chain have adopted. We are proud of our track record in this field.
What are your future priorities?The UK’s demographic trends support our three market positions while our balance sheet will continue to strengthen and benefit further from the implementation of our Future Proofing Kier programme.
We are focused on reducing our net debt, which will also benefit further from the Future Proofing Kier programme. We will continue to pursue growth in our core operations, streamlining the Group’s portfolio of businesses as necessary, and we will increase the operational efficiency of the business, ensuring we continue to deliver for our clients and be their trusted partner. In light of market challenges, we will continue to closely monitor the risk profile of the Group.
We are on track to deliver on our Vision 2020 goals. We have a record order book of c.£10.2bn, and our Construction and Services divisions are 90% secured, with improved visibility of the work they need to undertake in the 2019 financial year. We also have a pipeline of work of £3.5bn in our property and residential businesses. These developments will provide the Group with greater resilience as we progress to 2020 and beyond.
I believe our core businesses are performing well and we have leading positions in our chosen markets. Kier is very well placed for the future.
“THROUGH OUR THREE MARKET POSITIONS, WE AIM TO LEVERAGE OUR SKILLS, KNOWLEDGE AND INNOVATION TO PROVIDE SOLUTIONS WHICH ARE EFFICIENT AND EFFECTIVE”
Strategic R
eportG
overnanceFinancial S
tatements
Kier Group plc | Report and Accounts 2018 19
Strategic Report
Business model
BUILT TO DELIVER
SUSTAINABLE VALUE
Clients
Communities
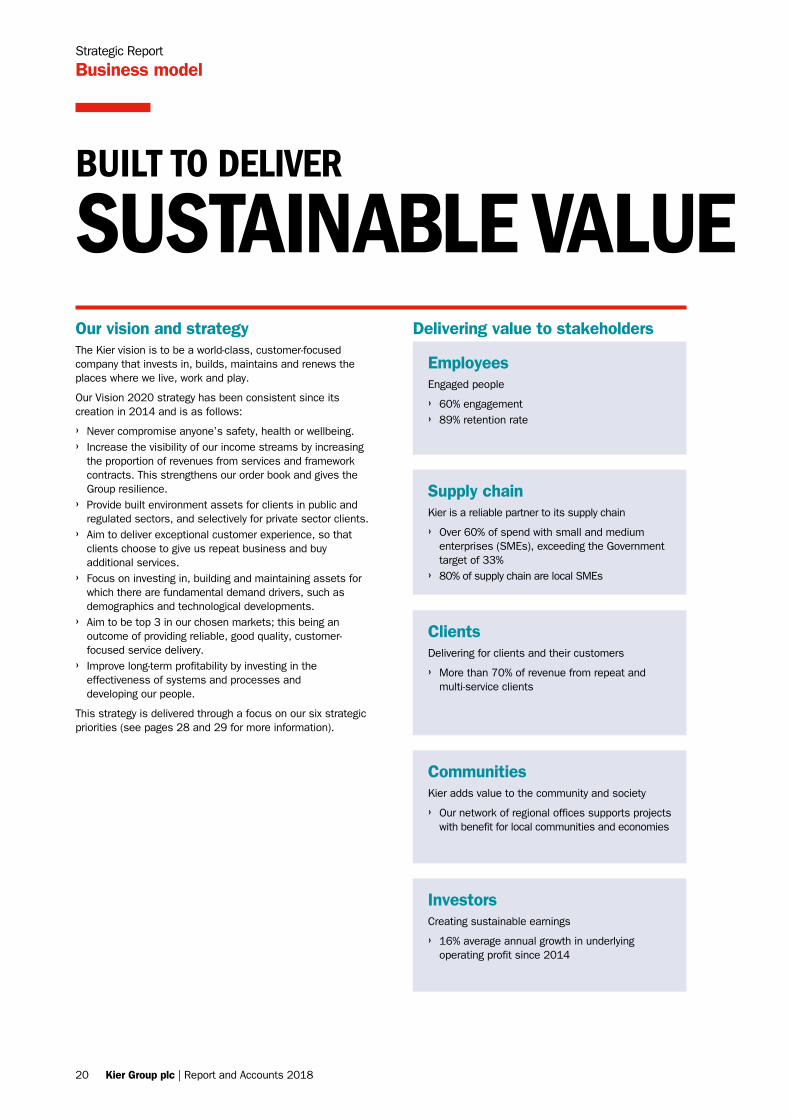
Delivering value to stakeholdersOur vision and strategyThe Kier vision is to be a world-class, customer-focused company that invests in, builds, maintains and renews the places where we live, work and play.
Our Vision 2020 strategy has been consistent since its creation in 2014 and is as follows:
› Never compromise anyone’s safety, health or wellbeing. › Increase the visibility of our income streams by increasing
the proportion of revenues from services and framework contracts. This strengthens our order book and gives the Group resilience.
› Provide built environment assets for clients in public and regulated sectors, and selectively for private sector clients.
› Aim to deliver exceptional customer experience, so that clients choose to give us repeat business and buy additional services.
› Focus on investing in, building and maintaining assets for which there are fundamental demand drivers, such as demographics and technological developments.
› Aim to be top 3 in our chosen markets; this being an outcome of providing reliable, good quality, customer-focused service delivery.
› Improve long-term profitability by investing in the effectiveness of systems and processes and developing our people.
This strategy is delivered through a focus on our six strategic priorities (see pages 28 and 29 for more information).
EmployeesEngaged people
› 60% engagement › 89% retention rate
ClientsDelivering for clients and their customers
› More than 70% of revenue from repeat and multi-service clients
CommunitiesKier adds value to the community and society
› Our network of regional offices supports projects with benefit for local communities and economies
InvestorsCreating sustainable earnings
› 16% average annual growth in underlying operating profit since 2014
Supply chainKier is a reliable partner to its supply chain
› Over 60% of spend with small and medium enterprises (SMEs), exceeding the Government target of 33%
› 80% of supply chain are local SMEs
20 Kier Group plc | Report and Accounts 2018
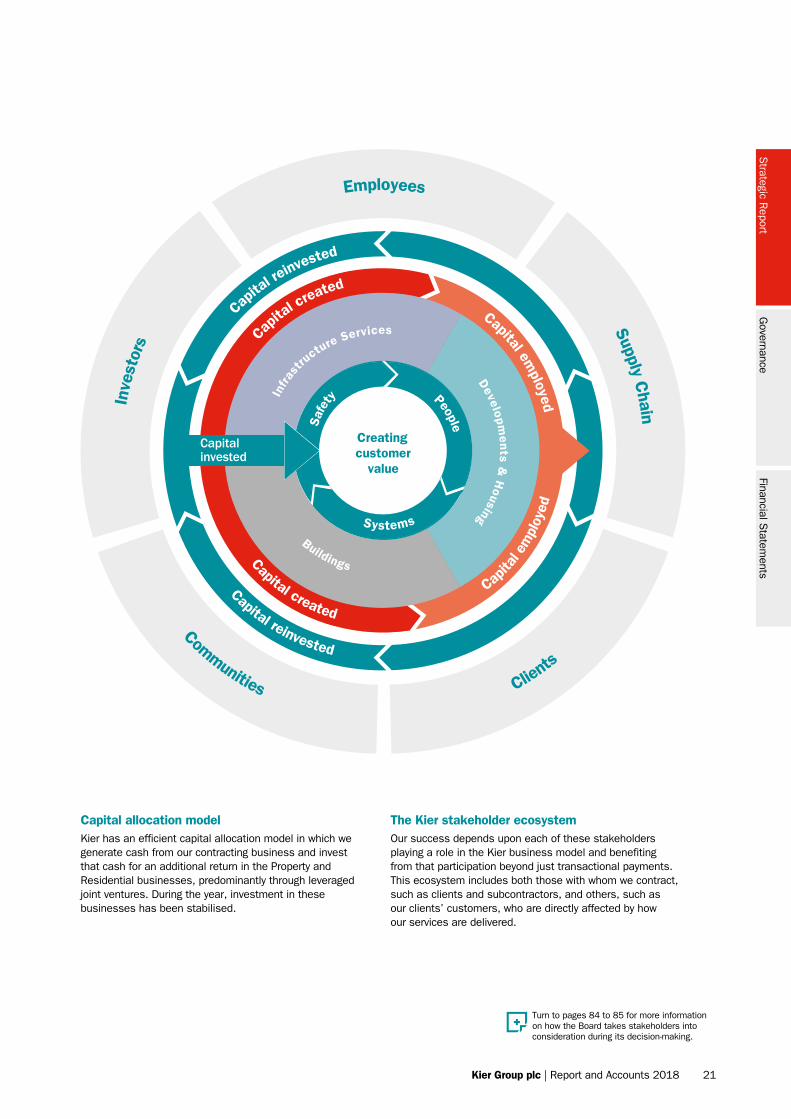
Capital allocation modelKier has an efficient capital allocation model in which we generate cash from our contracting business and invest that cash for an additional return in the Property and Residential businesses, predominantly through leveraged joint ventures. During the year, investment in these businesses has been stabilised.
The Kier stakeholder ecosystemOur success depends upon each of these stakeholders playing a role in the Kier business model and benefiting from that participation beyond just transactional payments. This ecosystem includes both those with whom we contract, such as clients and subcontractors, and others, such as our clients’ customers, who are directly affected by how our services are delivered.
Turn to pages 84 to 85 for more information on how the Board takes stakeholders into consideration during its decision-making.
Inve
stor
s
EmployeesSupply C
hain
Clients
Communities
Infras
tructure Services
Developments &
Housing
Buildings
Capital invested
Capital reinvested
Capita
l reinvested
Capit
al created
People
Systems
Safe
ty
Creatingcustomer
value
Cap
ital e
mpl
oyed
Capital employed
Capital created
Strategic R
eportG
overnanceFinancial S
tatements
Kier Group plc | Report and Accounts 2018 21
PROVIDINGSUSTAINABLE OPPORTUNITIES
Strategic Report
Our markets: Infrastructure Services
Infrastructure services is a robust and sustainable market, in which Kier has a 7% market share. Demographic changes and technological developments combine to provide conditions for the sustained need for new and maintained infrastructure, regardless of economic or political cycles. Long-term investment is further supported by the political consensus that infrastructure supports economic growth, nationally and regionally.
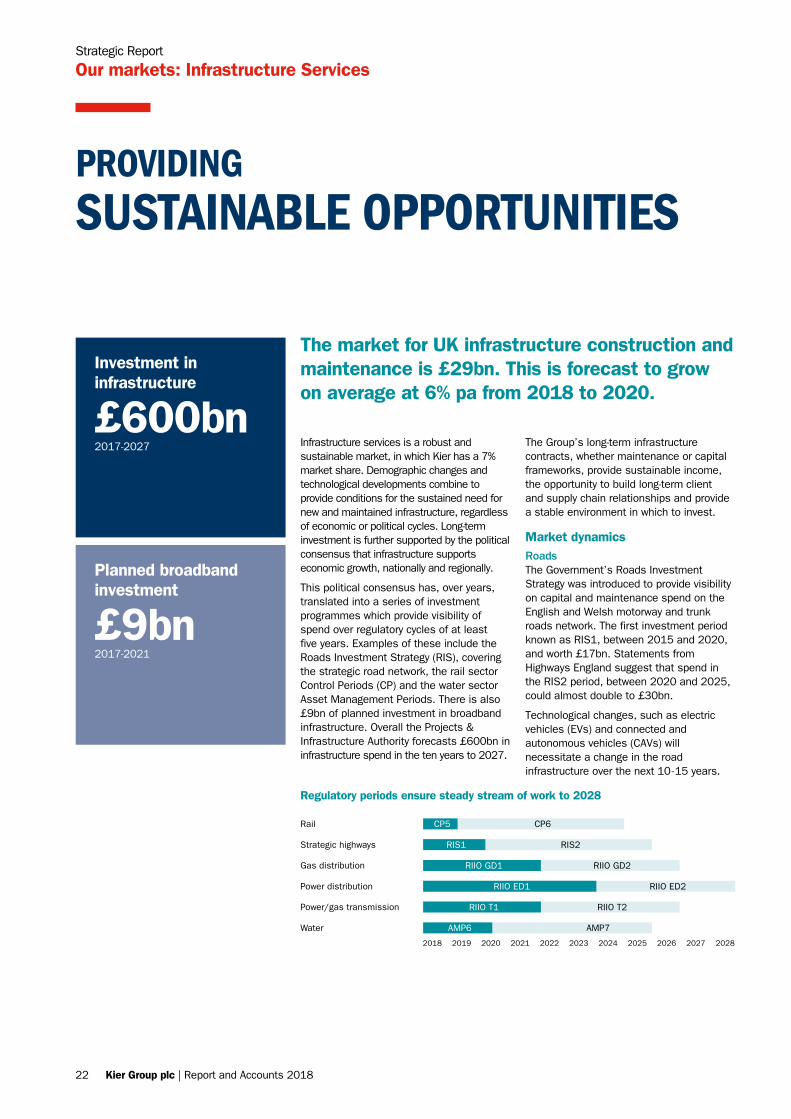
This political consensus has, over years, translated into a series of investment programmes which provide visibility of spend over regulatory cycles of at least five years. Examples of these include the Roads Investment Strategy (RIS), covering the strategic road network, the rail sector Control Periods (CP) and the water sector Asset Management Periods. There is also £9bn of planned investment in broadband infrastructure. Overall the Projects & Infrastructure Authority forecasts £600bn in infrastructure spend in the ten years to 2027.
The Group’s long-term infrastructure contracts, whether maintenance or capital frameworks, provide sustainable income, the opportunity to build long-term client and supply chain relationships and provide a stable environment in which to invest.
Market dynamicsRoadsThe Government’s Roads Investment Strategy was introduced to provide visibility on capital and maintenance spend on the English and Welsh motorway and trunk roads network. The first investment period known as RIS1, between 2015 and 2020, and worth £17bn. Statements from Highways England suggest that spend in the RIS2 period, between 2020 and 2025, could almost double to £30bn.
Technological changes, such as electric vehicles (EVs) and connected and autonomous vehicles (CAVs) will necessitate a change in the road infrastructure over the next 10-15 years.
The market for UK infrastructure construction and maintenance is £29bn. This is forecast to grow on average at 6% pa from 2018 to 2020.
Investment in infrastructure
£600bn2017-2027
Planned broadband investment
£9bn2017-2021
Power distribution
Power/gas transmission
Water
Gas distribution
Strategic highways
Rail CP5 CP6
RIS1 RIS2
RIIO GD1 RIIO GD2
RIIO ED1 RIIO ED2
RIIO T1 RIIO T2
AMP6 AMP7
2018 20282019 2020 2021 2022 2023 2024 2025 2026 2027
Regulatory periods ensure steady stream of work to 2028
22 Kier Group plc | Report and Accounts 2018
The Group is working with Highways England on their planning for these future developments. EVs are powered by electricity and need charging infrastructure; connected vehicles will be able to communicate with other vehicles and external highways systems, such as safety systems; and autonomous vehicles, at their highest level, are driven without human intervention. These developments are all the result of innovation in the automotive sector, and the UK’s use of EVs and CAVs is forecast to grow strongly in the coming years.
UtilitiesPreparations are underway for the AMP7 (2020-2025) water regulatory period. It is expected that spend will be broadly at a similar level to the £44bn spend in AMP6 and that the regulator will continue to put an emphasis on customer service, leakage detection, and value for money for the water customer. Kier has a track record of focusing on customer (end user) service and we are working with water companies on innovative approaches to leakage detection.
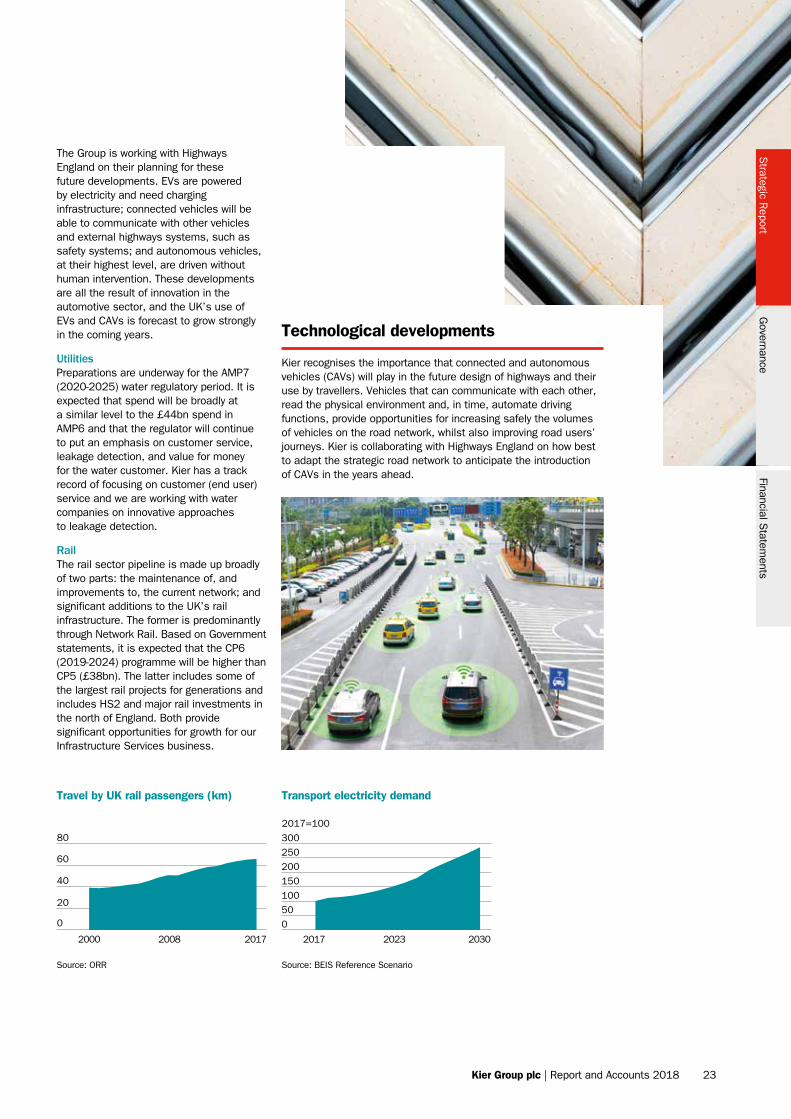
RailThe rail sector pipeline is made up broadly of two parts: the maintenance of, and improvements to, the current network; and significant additions to the UK’s rail infrastructure. The former is predominantly through Network Rail. Based on Government statements, it is expected that the CP6 (2019-2024) programme will be higher than CP5 (£38bn). The latter includes some of the largest rail projects for generations and includes HS2 and major rail investments in the north of England. Both provide significant opportunities for growth for our Infrastructure Services business.
0
2000 2008 2017
0
20
40
60
80
2017 2023 2030
0501001502002503002017=100
Technological developments
Kier recognises the importance that connected and autonomous vehicles (CAVs) will play in the future design of highways and their use by travellers. Vehicles that can communicate with each other, read the physical environment and, in time, automate driving functions, provide opportunities for increasing safely the volumes of vehicles on the road network, whilst also improving road users’ journeys. Kier is collaborating with Highways England on how best to adapt the strategic road network to anticipate the introduction of CAVs in the years ahead.
Source: ORR Source: BEIS Reference Scenario
Travel by UK rail passengers (km) Transport electricity demand
Strategic R
eportG
overnanceFinancial S
tatements
Kier Group plc | Report and Accounts 2018 23
Strategic Report
Our markets: Buildings
BRINGING SOCIALOPPORTUNITY AND PROSPERITY TO LOCAL COMMUNITIES
The UK market for the construction, maintenance and refurbishment of buildings is valued at £67bn.
Growth in the number of school age children
8%2017-2027
Growth in the number of air passengers
11%2017-2027
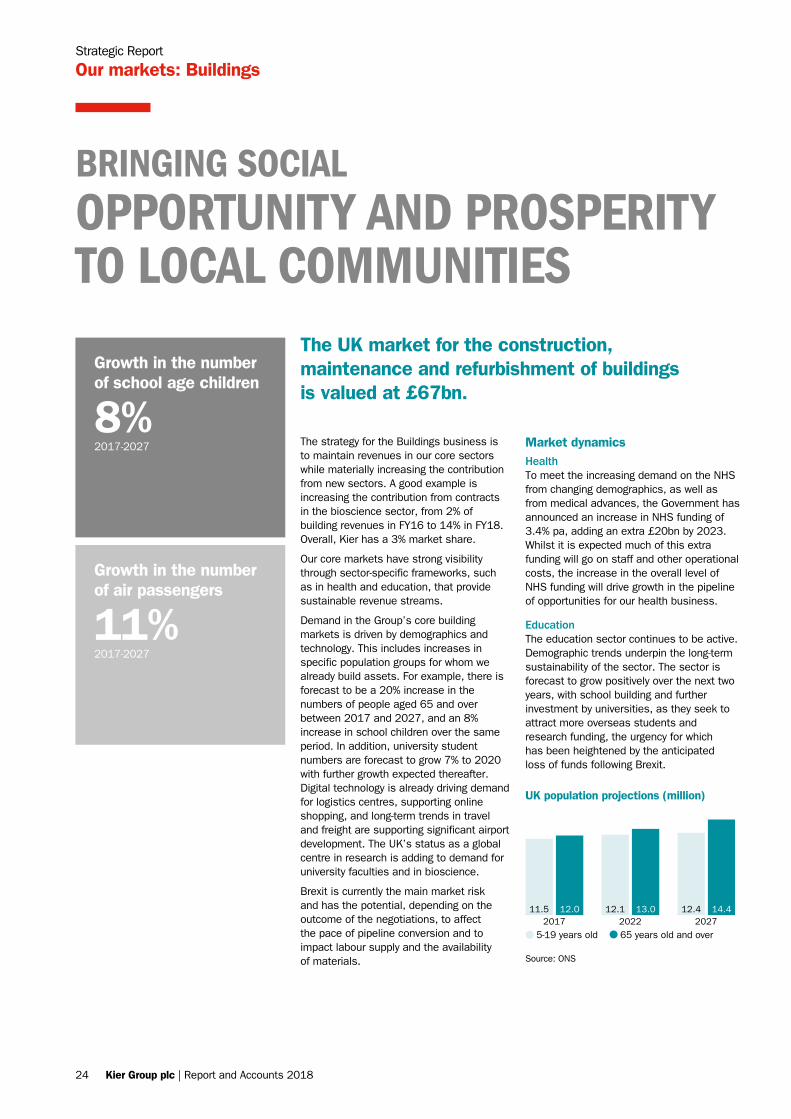
The strategy for the Buildings business is to maintain revenues in our core sectors while materially increasing the contribution from new sectors. A good example is increasing the contribution from contracts in the bioscience sector, from 2% of building revenues in FY16 to 14% in FY18. Overall, Kier has a 3% market share.
Our core markets have strong visibility through sector-specific frameworks, such as in health and education, that provide sustainable revenue streams.
Demand in the Group’s core building markets is driven by demographics and technology. This includes increases in specific population groups for whom we already build assets. For example, there is forecast to be a 20% increase in the numbers of people aged 65 and over between 2017 and 2027, and an 8% increase in school children over the same period. In addition, university student numbers are forecast to grow 7% to 2020 with further growth expected thereafter. Digital technology is already driving demand for logistics centres, supporting online shopping, and long-term trends in travel and freight are supporting significant airport development. The UK’s status as a global centre in research is adding to demand for university faculties and in bioscience.
Brexit is currently the main market risk and has the potential, depending on the outcome of the negotiations, to affect the pace of pipeline conversion and to impact labour supply and the availability of materials.
Market dynamicsHealthTo meet the increasing demand on the NHS from changing demographics, as well as from medical advances, the Government has announced an increase in NHS funding of 3.4% pa, adding an extra £20bn by 2023. Whilst it is expected much of this extra funding will go on staff and other operational costs, the increase in the overall level of NHS funding will drive growth in the pipeline of opportunities for our health business.
EducationThe education sector continues to be active. Demographic trends underpin the long-term sustainability of the sector. The sector is forecast to grow positively over the next two years, with school building and further investment by universities, as they seek to attract more overseas students and research funding, the urgency for which has been heightened by the anticipated loss of funds following Brexit.
5-19 years old 65 years old and over
11.5 12.02017 2022 2027
12.1 13.0 12.4 14.4
Source: ONS
UK population projections (million)
24 Kier Group plc | Report and Accounts 2018
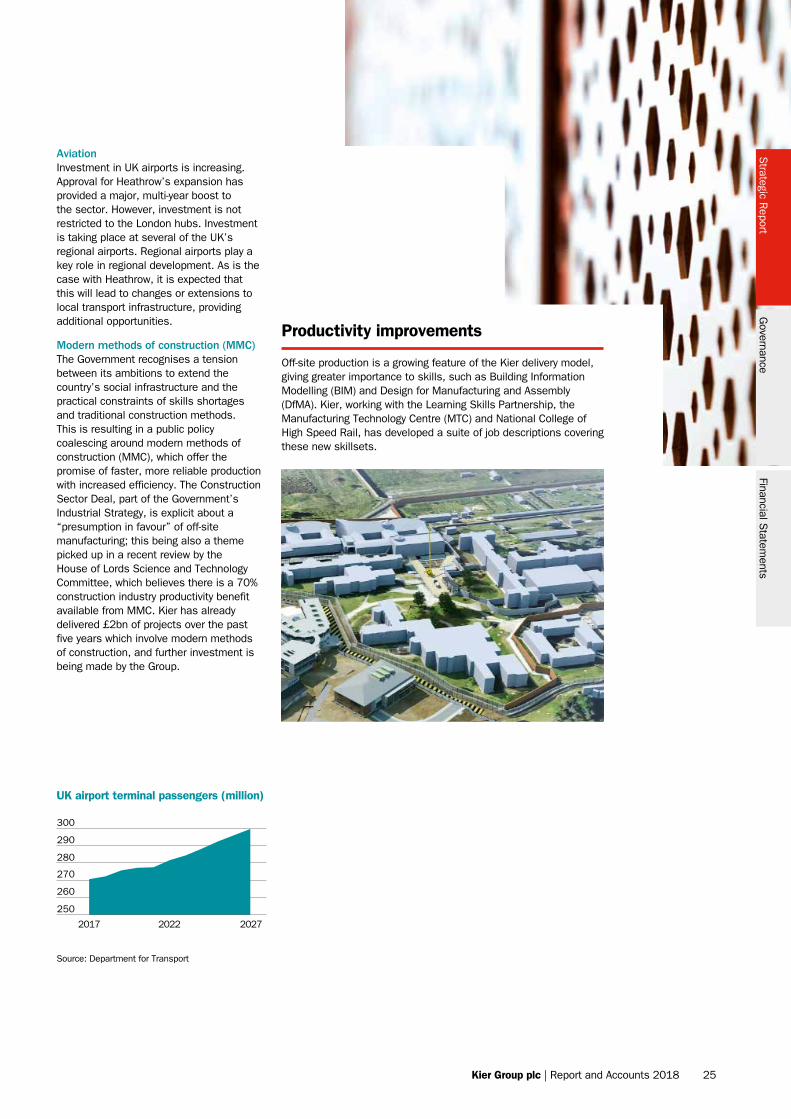
AviationInvestment in UK airports is increasing. Approval for Heathrow’s expansion has provided a major, multi-year boost to the sector. However, investment is not restricted to the London hubs. Investment is taking place at several of the UK’s regional airports. Regional airports play a key role in regional development. As is the case with Heathrow, it is expected that this will lead to changes or extensions to local transport infrastructure, providing additional opportunities.
Modern methods of construction (MMC)The Government recognises a tension between its ambitions to extend the country’s social infrastructure and the practical constraints of skills shortages and traditional construction methods. This is resulting in a public policy coalescing around modern methods of construction (MMC), which offer the promise of faster, more reliable production with increased efficiency. The Construction Sector Deal, part of the Government’s Industrial Strategy, is explicit about a “presumption in favour” of off-site manufacturing; this being also a theme picked up in a recent review by the House of Lords Science and Technology Committee, which believes there is a 70% construction industry productivity benefit available from MMC. Kier has already delivered £2bn of projects over the past five years which involve modern methods of construction, and further investment is being made by the Group.
Productivity improvements
Off-site production is a growing feature of the Kier delivery model, giving greater importance to skills, such as Building Information Modelling (BIM) and Design for Manufacturing and Assembly (DfMA). Kier, working with the Learning Skills Partnership, the Manufacturing Technology Centre (MTC) and National College of High Speed Rail, has developed a suite of job descriptions covering these new skillsets.
2017 2022 2027
250
270
260
280
290
300
Source: Department for Transport
UK airport terminal passengers (million)
Strategic R
eportG
overnanceFinancial S
tatements
Kier Group plc | Report and Accounts 2018 25
Strategic Report
Our markets: Developments and Housing
RESPONDING TO AN INCREASINGPOPULATION AND SOCIETAL DEMAND
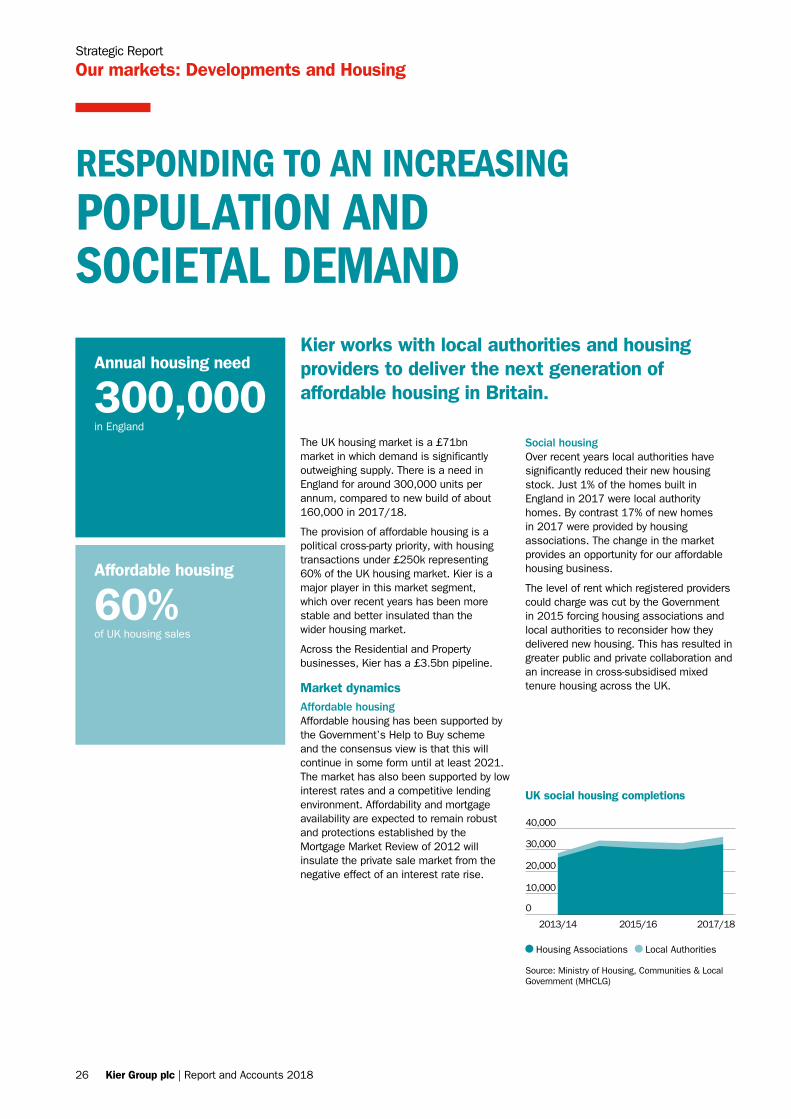
The UK housing market is a £71bn market in which demand is significantly outweighing supply. There is a need in England for around 300,000 units per annum, compared to new build of about 160,000 in 2017/18.
The provision of affordable housing is a political cross-party priority, with housing transactions under £250k representing 60% of the UK housing market. Kier is a major player in this market segment, which over recent years has been more stable and better insulated than the wider housing market.
Across the Residential and Property businesses, Kier has a £3.5bn pipeline.
Market dynamicsAffordable housingAffordable housing has been supported by the Government’s Help to Buy scheme and the consensus view is that this will continue in some form until at least 2021. The market has also been supported by low interest rates and a competitive lending environment. Affordability and mortgage availability are expected to remain robust and protections established by the Mortgage Market Review of 2012 will insulate the private sale market from the negative effect of an interest rate rise.
Social housingOver recent years local authorities have significantly reduced their new housing stock. Just 1% of the homes built in England in 2017 were local authority homes. By contrast 17% of new homes in 2017 were provided by housing associations. The change in the market provides an opportunity for our affordable housing business.
The level of rent which registered providers could charge was cut by the Government in 2015 forcing housing associations and local authorities to reconsider how they delivered new housing. This has resulted in greater public and private collaboration and an increase in cross-subsidised mixed tenure housing across the UK.
Kier works with local authorities and housing providers to deliver the next generation of affordable housing in Britain.
Annual housing need
300,000in England
Affordable housing
60%of UK housing sales
2013/14 2015/16 2017/18
0
10,000
20,000
30,000
40,000
Housing Associations Local Authorities
Source: Ministry of Housing, Communities & Local Government (MHCLG)
UK social housing completions
26 Kier Group plc | Report and Accounts 2018
Public/private collaborationOne outcome of this greater public/private collaboration is an increase in the number of joint ventures such as the Kier Living and Homes England joint venture, which provides the public sector with a capital efficient model able to accelerate the delivery of much needed homes.
Property developmentEconomic factors, such as occupier and investment sentiment, are the biggest influences on the property development market. The uncertainty around Brexit has softened the market in certain sectors, such as office space, and the business is therefore planning prudently. However, to date, tenant demand has remained strong overall, and certain sectors have underlying drivers that create opportunity. For example, the logistics market is growing on the back of the shift in retail to online shopping, and the student accommodation market is responding to a more discerning student population.
WorkforceThe house building and property development industry faces an ageing workforce, creating a long-term issue on labour supply that may be exacerbated by Brexit. It is incumbent upon large companies to find new ways of delivering production with fewer people on site and yet meet the country’s need for housing. Kier is therefore exploring and piloting a range of off-site, including component production, methods.
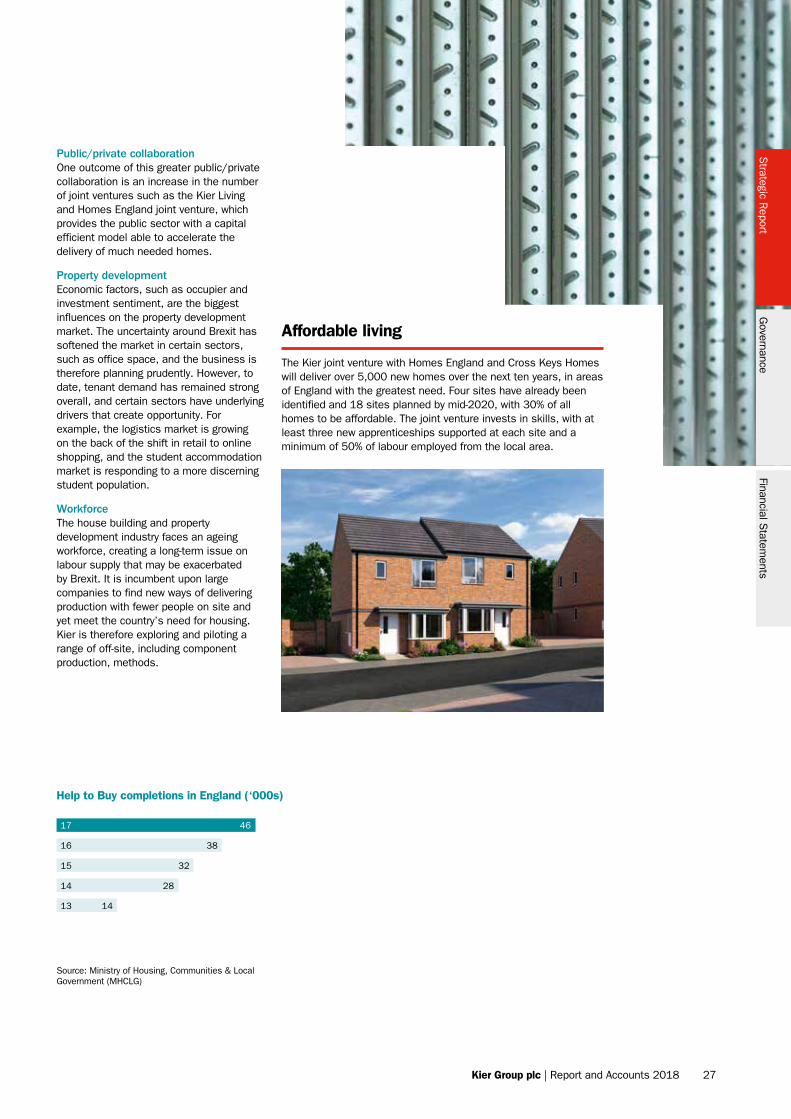
0
13 XX
28
14
32
38
46
16
15
14
17
Affordable living
The Kier joint venture with Homes England and Cross Keys Homes will deliver over 5,000 new homes over the next ten years, in areas of England with the greatest need. Four sites have already been identified and 18 sites planned by mid-2020, with 30% of all homes to be affordable. The joint venture invests in skills, with at least three new apprenticeships supported at each site and a minimum of 50% of labour employed from the local area.
Source: Ministry of Housing, Communities & Local Government (MHCLG)
Help to Buy completions in England (‘000s)
Strategic R
eportG
overnanceFinancial S
tatements
Kier Group plc | Report and Accounts 2018 27
Our strategic priorities Progress in 2018 Priorities for 2019 Key Performance Indicators Key Risks
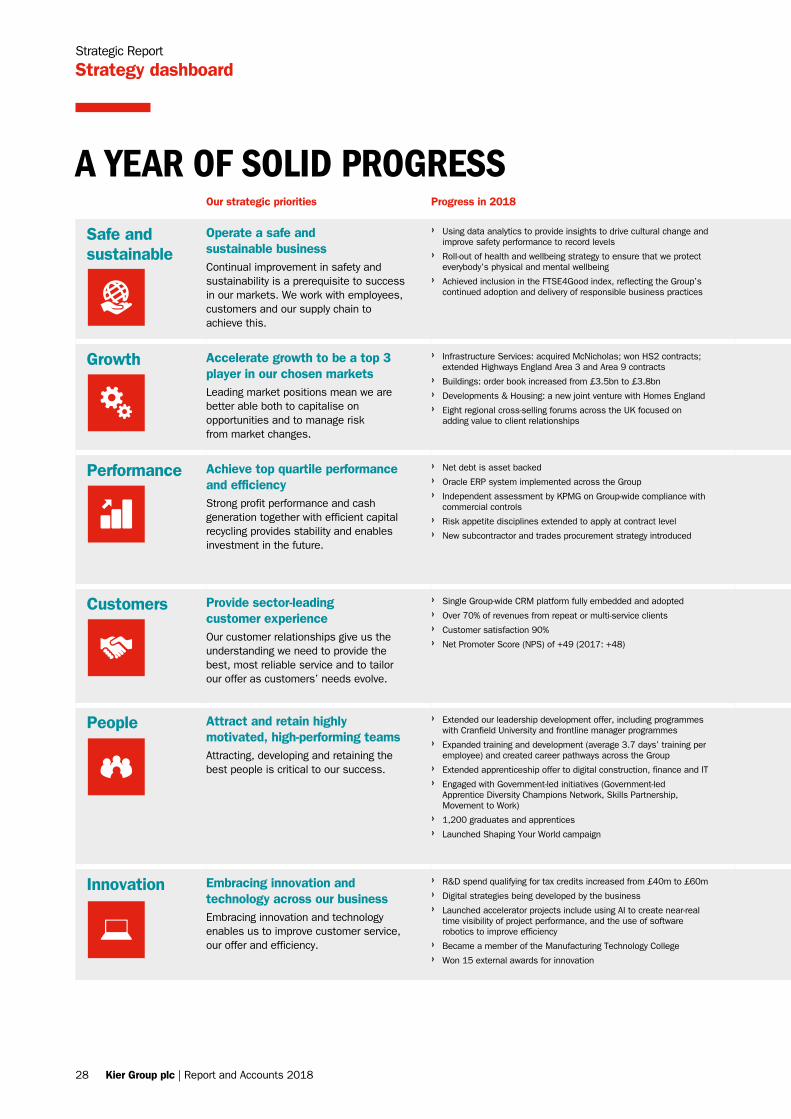
Safe and sustainable
Operate a safe and sustainable businessContinual improvement in safety and sustainability is a prerequisite to success in our markets. We work with employees, customers and our supply chain to achieve this.
› Using data analytics to provide insights to drive cultural change and improve safety performance to record levels
› Roll-out of health and wellbeing strategy to ensure that we protect everybody’s physical and mental wellbeing
› Achieved inclusion in the FTSE4Good index, reflecting the Group’s continued adoption and delivery of responsible business practices
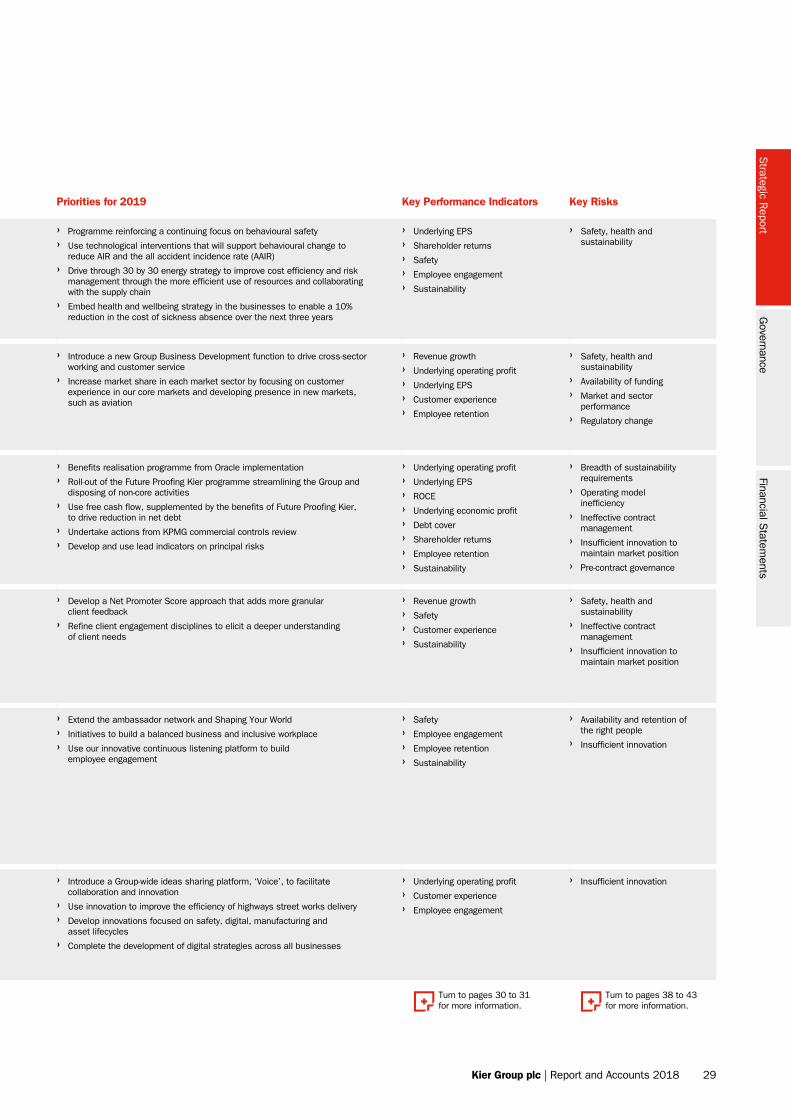
› Programme reinforcing a continuing focus on behavioural safety
› Use technological interventions that will support behavioural change to reduce AIR and the all accident incidence rate (AAIR)
› Drive through 30 by 30 energy strategy to improve cost efficiency and risk management through the more efficient use of resources and collaborating with the supply chain
› Embed health and wellbeing strategy in the businesses to enable a 10% reduction in the cost of sickness absence over the next three years
› Underlying EPS
› Shareholder returns
› Safety
› Employee engagement
› Sustainability
› Safety, health and sustainability
Growth Accelerate growth to be a top 3 player in our chosen marketsLeading market positions mean we are better able both to capitalise on opportunities and to manage risk from market changes.
› Infrastructure Services: acquired McNicholas; won HS2 contracts; extended Highways England Area 3 and Area 9 contracts
› Buildings: order book increased from £3.5bn to £3.8bn
› Developments & Housing: a new joint venture with Homes England
› Eight regional cross-selling forums across the UK focused on adding value to client relationships
› Introduce a new Group Business Development function to drive cross-sector working and customer service
› Increase market share in each market sector by focusing on customer experience in our core markets and developing presence in new markets, such as aviation
› Revenue growth
› Underlying operating profit
› Underlying EPS
› Customer experience
› Employee retention
› Safety, health and sustainability
› Availability of funding
› Market and sector performance
› Regulatory change
Performance Achieve top quartile performance and efficiencyStrong profit performance and cash generation together with efficient capital recycling provides stability and enables investment in the future.
› Net debt is asset backed
› Oracle ERP system implemented across the Group
› Independent assessment by KPMG on Group-wide compliance with commercial controls
› Risk appetite disciplines extended to apply at contract level
› New subcontractor and trades procurement strategy introduced
› Benefits realisation programme from Oracle implementation
› Roll-out of the Future Proofing Kier programme streamlining the Group and disposing of non-core activities
› Use free cash flow, supplemented by the benefits of Future Proofing Kier, to drive reduction in net debt
› Undertake actions from KPMG commercial controls review
› Develop and use lead indicators on principal risks
› Underlying operating profit
› Underlying EPS
› ROCE
› Underlying economic profit
› Debt cover
› Shareholder returns
› Employee retention
› Sustainability
› Breadth of sustainability requirements
› Operating model inefficiency
› Ineffective contract management
› Insufficient innovation to maintain market position
› Pre-contract governance
Customers Provide sector-leading customer experienceOur customer relationships give us the understanding we need to provide the best, most reliable service and to tailor our offer as customers’ needs evolve.
› Single Group-wide CRM platform fully embedded and adopted
› Over 70% of revenues from repeat or multi-service clients
› Customer satisfaction 90%
› Net Promoter Score (NPS) of +49 (2017: +48)
› Develop a Net Promoter Score approach that adds more granular client feedback
› Refine client engagement disciplines to elicit a deeper understanding of client needs
› Revenue growth
› Safety
› Customer experience
› Sustainability
› Safety, health and sustainability
› Ineffective contract management
› Insufficient innovation to maintain market position
People Attract and retain highly motivated, high-performing teamsAttracting, developing and retaining the best people is critical to our success.
› Extended our leadership development offer, including programmes with Cranfield University and frontline manager programmes
› Expanded training and development (average 3.7 days’ training per employee) and created career pathways across the Group
› Extended apprenticeship offer to digital construction, finance and IT
› Engaged with Government-led initiatives (Government-led Apprentice Diversity Champions Network, Skills Partnership, Movement to Work)
› 1,200 graduates and apprentices
› Launched Shaping Your World campaign
› Extend the ambassador network and Shaping Your World
› Initiatives to build a balanced business and inclusive workplace
› Use our innovative continuous listening platform to build employee engagement
› Safety
› Employee engagement
› Employee retention
› Sustainability
› Availability and retention of the right people
› Insufficient innovation
Innovation Embracing innovation and technology across our businessEmbracing innovation and technology enables us to improve customer service, our offer and efficiency.
› R&D spend qualifying for tax credits increased from £40m to £60m
› Digital strategies being developed by the business
› Launched accelerator projects include using AI to create near-real time visibility of project performance, and the use of software robotics to improve efficiency
› Became a member of the Manufacturing Technology College
› Won 15 external awards for innovation
› Introduce a Group-wide ideas sharing platform, ‘Voice’, to facilitate collaboration and innovation
› Use innovation to improve the efficiency of highways street works delivery
› Develop innovations focused on safety, digital, manufacturing and asset lifecycles
› Complete the development of digital strategies across all businesses
› Underlying operating profit
› Customer experience
› Employee engagement
› Insufficient innovation
Strategic Report
Strategy dashboard
A YEAR OF SOLID PROGRESS
28 Kier Group plc | Report and Accounts 2018
Our strategic priorities Progress in 2018 Priorities for 2019 Key Performance Indicators Key Risks
Safe and sustainable
Operate a safe and sustainable businessContinual improvement in safety and sustainability is a prerequisite to success in our markets. We work with employees, customers and our supply chain to achieve this.
› Using data analytics to provide insights to drive cultural change and improve safety performance to record levels
› Roll-out of health and wellbeing strategy to ensure that we protect everybody’s physical and mental wellbeing
› Achieved inclusion in the FTSE4Good index, reflecting the Group’s continued adoption and delivery of responsible business practices
› Programme reinforcing a continuing focus on behavioural safety
› Use technological interventions that will support behavioural change to reduce AIR and the all accident incidence rate (AAIR)
› Drive through 30 by 30 energy strategy to improve cost efficiency and risk management through the more efficient use of resources and collaborating with the supply chain
› Embed health and wellbeing strategy in the businesses to enable a 10% reduction in the cost of sickness absence over the next three years
› Underlying EPS
› Shareholder returns
› Safety
› Employee engagement
› Sustainability
› Safety, health and sustainability
Growth Accelerate growth to be a top 3 player in our chosen marketsLeading market positions mean we are better able both to capitalise on opportunities and to manage risk from market changes.
› Infrastructure Services: acquired McNicholas; won HS2 contracts; extended Highways England Area 3 and Area 9 contracts
› Buildings: order book increased from £3.5bn to £3.8bn
› Developments & Housing: a new joint venture with Homes England
› Eight regional cross-selling forums across the UK focused on adding value to client relationships
› Introduce a new Group Business Development function to drive cross-sector working and customer service
› Increase market share in each market sector by focusing on customer experience in our core markets and developing presence in new markets, such as aviation
› Revenue growth
› Underlying operating profit
› Underlying EPS
› Customer experience
› Employee retention
› Safety, health and sustainability
› Availability of funding
› Market and sector performance
› Regulatory change
Performance Achieve top quartile performance and efficiencyStrong profit performance and cash generation together with efficient capital recycling provides stability and enables investment in the future.
› Net debt is asset backed
› Oracle ERP system implemented across the Group
› Independent assessment by KPMG on Group-wide compliance with commercial controls
› Risk appetite disciplines extended to apply at contract level
› New subcontractor and trades procurement strategy introduced
› Benefits realisation programme from Oracle implementation
› Roll-out of the Future Proofing Kier programme streamlining the Group and disposing of non-core activities
› Use free cash flow, supplemented by the benefits of Future Proofing Kier, to drive reduction in net debt
› Undertake actions from KPMG commercial controls review
› Develop and use lead indicators on principal risks
› Underlying operating profit
› Underlying EPS
› ROCE
› Underlying economic profit
› Debt cover
› Shareholder returns
› Employee retention
› Sustainability
› Breadth of sustainability requirements
› Operating model inefficiency
› Ineffective contract management
› Insufficient innovation to maintain market position
› Pre-contract governance
Customers Provide sector-leading customer experienceOur customer relationships give us the understanding we need to provide the best, most reliable service and to tailor our offer as customers’ needs evolve.
› Single Group-wide CRM platform fully embedded and adopted
› Over 70% of revenues from repeat or multi-service clients
› Customer satisfaction 90%
› Net Promoter Score (NPS) of +49 (2017: +48)
› Develop a Net Promoter Score approach that adds more granular client feedback
› Refine client engagement disciplines to elicit a deeper understanding of client needs
› Revenue growth
› Safety
› Customer experience
› Sustainability
› Safety, health and sustainability
› Ineffective contract management
› Insufficient innovation to maintain market position
People Attract and retain highly motivated, high-performing teamsAttracting, developing and retaining the best people is critical to our success.
› Extended our leadership development offer, including programmes with Cranfield University and frontline manager programmes
› Expanded training and development (average 3.7 days’ training per employee) and created career pathways across the Group
› Extended apprenticeship offer to digital construction, finance and IT
› Engaged with Government-led initiatives (Government-led Apprentice Diversity Champions Network, Skills Partnership, Movement to Work)
› 1,200 graduates and apprentices
› Launched Shaping Your World campaign
› Extend the ambassador network and Shaping Your World
› Initiatives to build a balanced business and inclusive workplace
› Use our innovative continuous listening platform to build employee engagement
› Safety
› Employee engagement
› Employee retention
› Sustainability
› Availability and retention of the right people
› Insufficient innovation
Innovation Embracing innovation and technology across our businessEmbracing innovation and technology enables us to improve customer service, our offer and efficiency.
› R&D spend qualifying for tax credits increased from £40m to £60m
› Digital strategies being developed by the business
› Launched accelerator projects include using AI to create near-real time visibility of project performance, and the use of software robotics to improve efficiency
› Became a member of the Manufacturing Technology College
› Won 15 external awards for innovation
› Introduce a Group-wide ideas sharing platform, ‘Voice’, to facilitate collaboration and innovation
› Use innovation to improve the efficiency of highways street works delivery
› Develop innovations focused on safety, digital, manufacturing and asset lifecycles
› Complete the development of digital strategies across all businesses
› Underlying operating profit
› Customer experience
› Employee engagement
› Insufficient innovation
Turn to pages 30 to 31 for more information.
Turn to pages 38 to 43 for more information.
Strategic R
eportG
overnanceFinancial S
tatements
Kier Group plc | Report and Accounts 2018 29
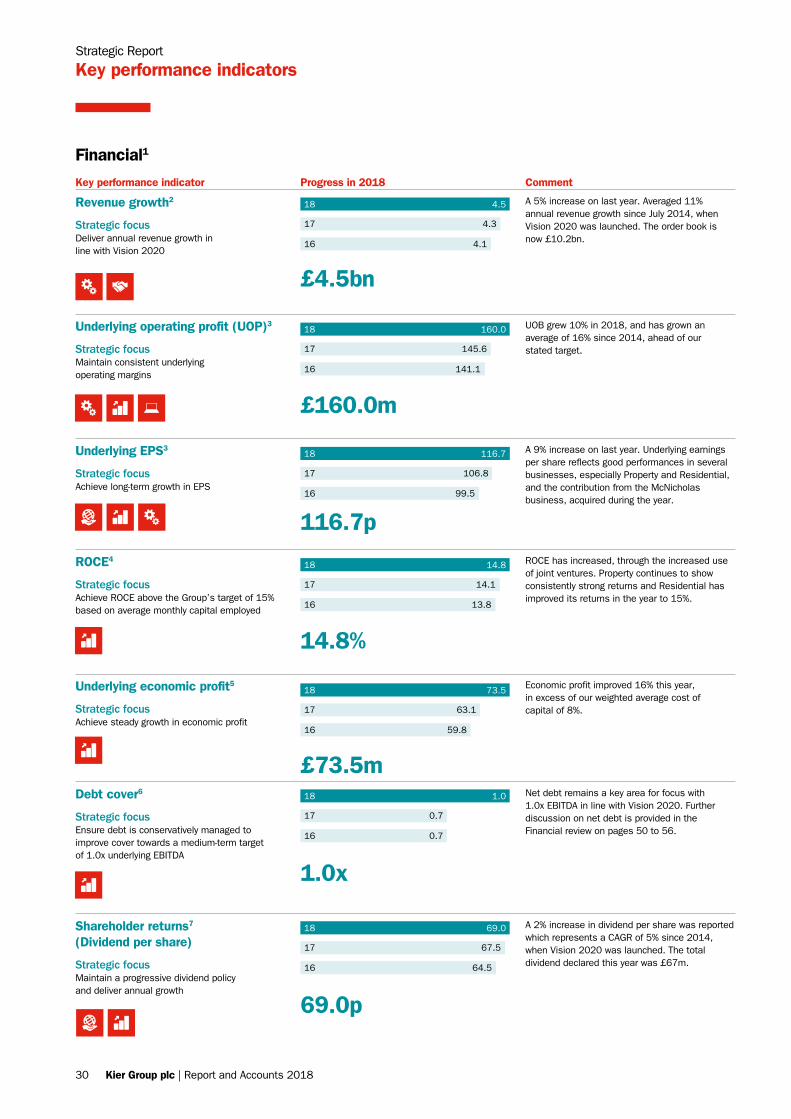
Strategic Report
Key performance indicators
Key performance indicator Progress in 2018 Comment
Underlying operating profit (UOP)3
Strategic focusMaintain consistent underlying operating margins
UOB grew 10% in 2018, and has grown an average of 16% since 2014, ahead of our stated target.
Revenue growth2
Strategic focusDeliver annual revenue growth in line with Vision 2020
A 5% increase on last year. Averaged 11% annual revenue growth since July 2014, when Vision 2020 was launched. The order book is now £10.2bn.
Underlying EPS3
Strategic focusAchieve long-term growth in EPS
A 9% increase on last year. Underlying earnings per share reflects good performances in several businesses, especially Property and Residential, and the contribution from the McNicholas business, acquired during the year.
ROCE4
Strategic focusAchieve ROCE above the Group’s target of 15% based on average monthly capital employed
ROCE has increased, through the increased use of joint ventures. Property continues to show consistently strong returns and Residential has improved its returns in the year to 15%.
Underlying economic profit5
Strategic focusAchieve steady growth in economic profit
Economic profit improved 16% this year, in excess of our weighted average cost of capital of 8%.
Debt cover6
Strategic focusEnsure debt is conservatively managed to improve cover towards a medium-term target of 1.0x underlying EBITDA
Net debt remains a key area for focus with 1.0x EBITDA in line with Vision 2020. Further discussion on net debt is provided in the Financial review on pages 50 to 56.
Shareholder returns7 (Dividend per share)
Strategic focusMaintain a progressive dividend policy and deliver annual growth
A 2% increase in dividend per share was reported which represents a CAGR of 5% since 2014, when Vision 2020 was launched. The total dividend declared this year was £67m.
£4.5bn
£160.0m
116.7p
£73.5m
1.0x
69.0p
14.8%
Financial1
1118 4.5
4.3
4.1
17
16
18 160.0
145.6
141.1
17
16
18 116.7
106.8
99.5
17
16
18 14.8
14.1
13.8
17
16
18 73.5
63.1
59.8
17
16
18 1.0
0.7
0.7
17
16
18 69.0
67.5
64.5
17
16
30 Kier Group plc | Report and Accounts 2018
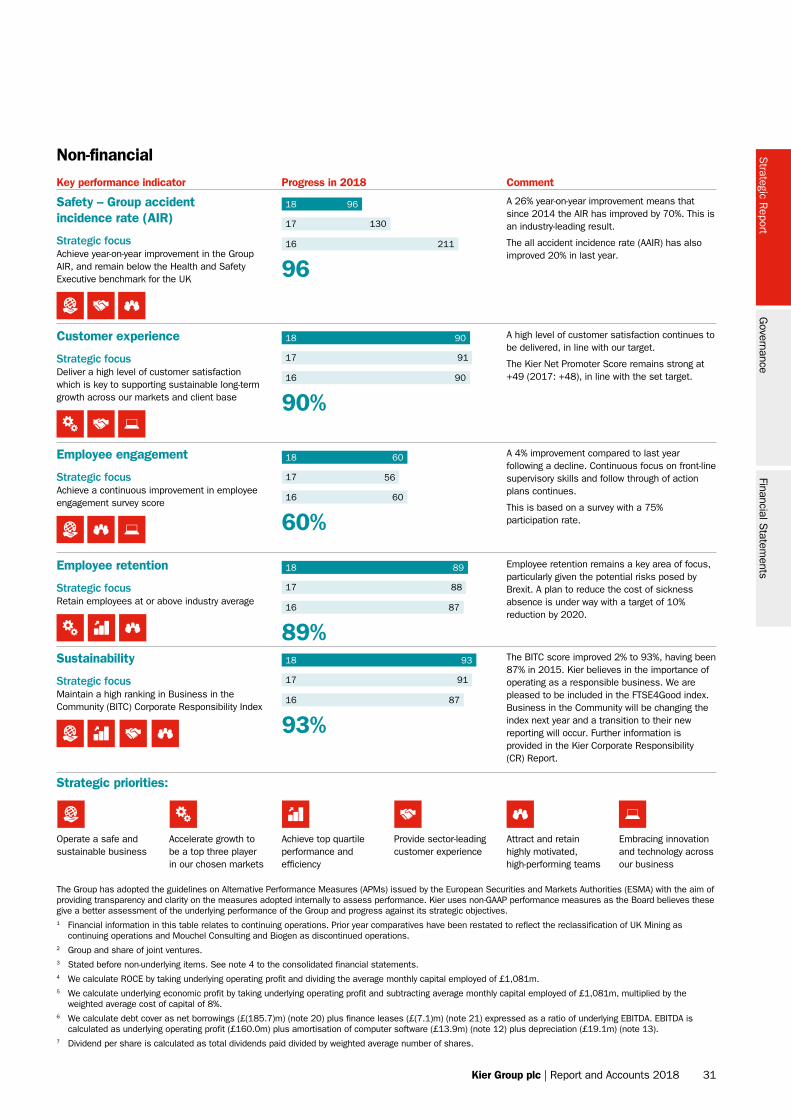
Non-financial
Key performance indicator Progress in 2018 Comment
The Group has adopted the guidelines on Alternative Performance Measures (APMs) issued by the European Securities and Markets Authorities (ESMA) with the aim of providing transparency and clarity on the measures adopted internally to assess performance. Kier uses non-GAAP performance measures as the Board believes these give a better assessment of the underlying performance of the Group and progress against its strategic objectives.1 Financial information in this table relates to continuing operations. Prior year comparatives have been restated to reflect the reclassification of UK Mining as
continuing operations and Mouchel Consulting and Biogen as discontinued operations.2 Group and share of joint ventures.3 Stated before non-underlying items. See note 4 to the consolidated financial statements.4 We calculate ROCE by taking underlying operating profit and dividing the average monthly capital employed of £1,081m.5 We calculate underlying economic profit by taking underlying operating profit and subtracting average monthly capital employed of £1,081m, multiplied by the
weighted average cost of capital of 8%.6 We calculate debt cover as net borrowings (£(185.7)m) (note 20) plus finance leases (£(7.1)m) (note 21) expressed as a ratio of underlying EBITDA. EBITDA is
calculated as underlying operating profit (£160.0m) plus amortisation of computer software (£13.9m) (note 12) plus depreciation (£19.1m) (note 13).7 Dividend per share is calculated as total dividends paid divided by weighted average number of shares.
Operate a safe and sustainable business
Accelerate growth to be a top three player in our chosen markets
Achieve top quartile performance and efficiency
Provide sector-leading customer experience
Attract and retain highly motivated, high-performing teams
Embracing innovation and technology across our business
Safety – Group accident incidence rate (AIR)
Strategic focusAchieve year-on-year improvement in the Group AIR, and remain below the Health and Safety Executive benchmark for the UK
Employee engagement
Strategic focusAchieve a continuous improvement in employee engagement survey score
Sustainability
Strategic focusMaintain a high ranking in Business in the Community (BITC) Corporate Responsibility Index
Employee retention
Strategic focusRetain employees at or above industry average
A 26% year-on-year improvement means that since 2014 the AIR has improved by 70%. This is an industry-leading result.
The all accident incidence rate (AAIR) has also improved 20% in last year.
A high level of customer satisfaction continues to be delivered, in line with our target.
The Kier Net Promoter Score remains strong at +49 (2017: +48), in line with the set target.
A 4% improvement compared to last year following a decline. Continuous focus on front-line supervisory skills and follow through of action plans continues.
This is based on a survey with a 75% participation rate.
The BITC score improved 2% to 93%, having been 87% in 2015. Kier believes in the importance of operating as a responsible business. We are pleased to be included in the FTSE4Good index. Business in the Community will be changing the index next year and a transition to their new reporting will occur. Further information is provided in the Kier Corporate Responsibility (CR) Report.
Employee retention remains a key area of focus, particularly given the potential risks posed by Brexit. A plan to reduce the cost of sickness absence is under way with a target of 10% reduction by 2020.
Customer experience
Strategic focusDeliver a high level of customer satisfaction which is key to supporting sustainable long-term growth across our markets and client base
Strategic priorities:
96
90%
60%
89%
93%
18 96
130
211
17
16
18 90
91
90
17
16
18
56
60
60
17
16
18 89
88
87
17
16
18 93
91
87
17
16
Strategic R
eportG
overnanceFinancial S
tatements
Kier Group plc | Report and Accounts 2018 31
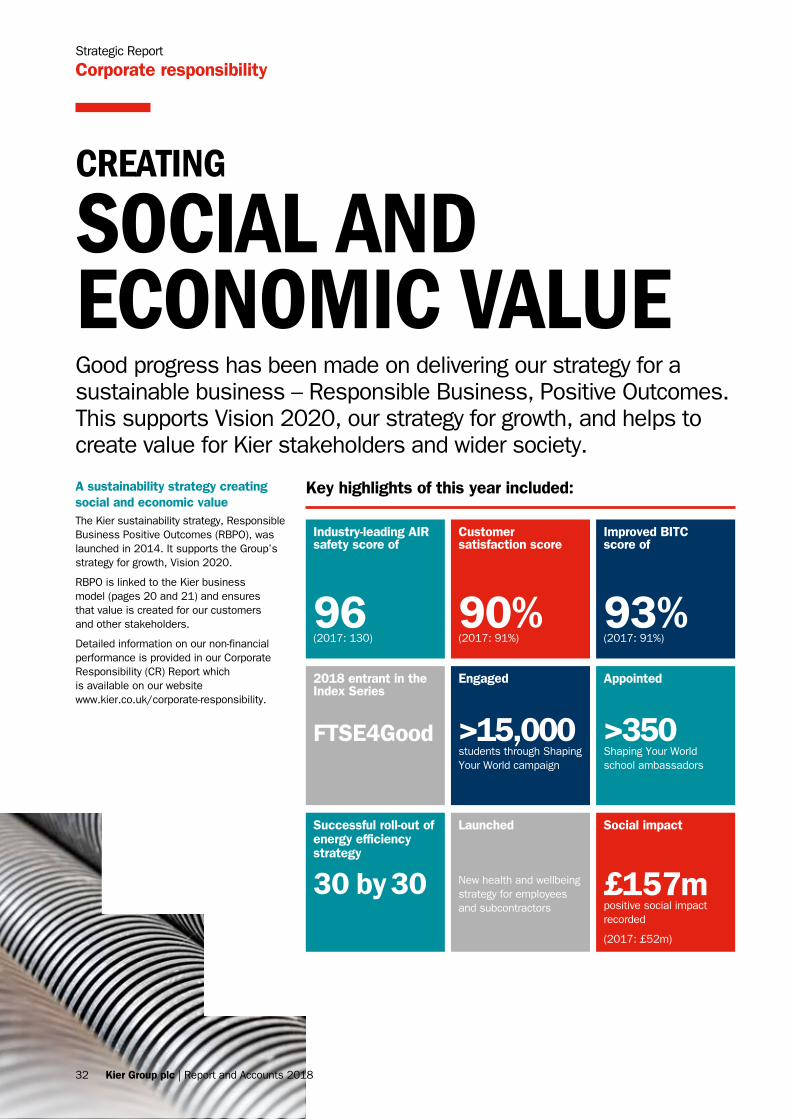
Strategic Report
Corporate responsibility
Good progress has been made on delivering our strategy for a sustainable business – Responsible Business, Positive Outcomes. This supports Vision 2020, our strategy for growth, and helps to create value for Kier stakeholders and wider society.
CREATING
SOCIAL AND ECONOMIC VALUE
A sustainability strategy creating social and economic valueThe Kier sustainability strategy, Responsible Business Positive Outcomes (RBPO), was launched in 2014. It supports the Group’s strategy for growth, Vision 2020.
RBPO is linked to the Kier business model (pages 20 and 21) and ensures that value is created for our customers and other stakeholders.
Detailed information on our non-financial performance is provided in our Corporate Responsibility (CR) Report which is available on our website www.kier.co.uk/corporate-responsibility.
Key highlights of this year included:
Launched
New health and wellbeing strategy for employees and subcontractors
Engaged
>15,000students through Shaping Your World campaign
Customer satisfaction score
90%(2017: 91%)
Successful roll-out of energy efficiency strategy
30 by 30
2018 entrant in the Index Series
FTSE4Good
Industry-leading AIR safety score of
96(2017: 130)
Social impact
£157mpositive social impact recorded
(2017: £52m)
Appointed
>350Shaping Your World school ambassadors
Improved BITC score of
93%(2017: 91%)
32 Kier Group plc | Report and Accounts 2018
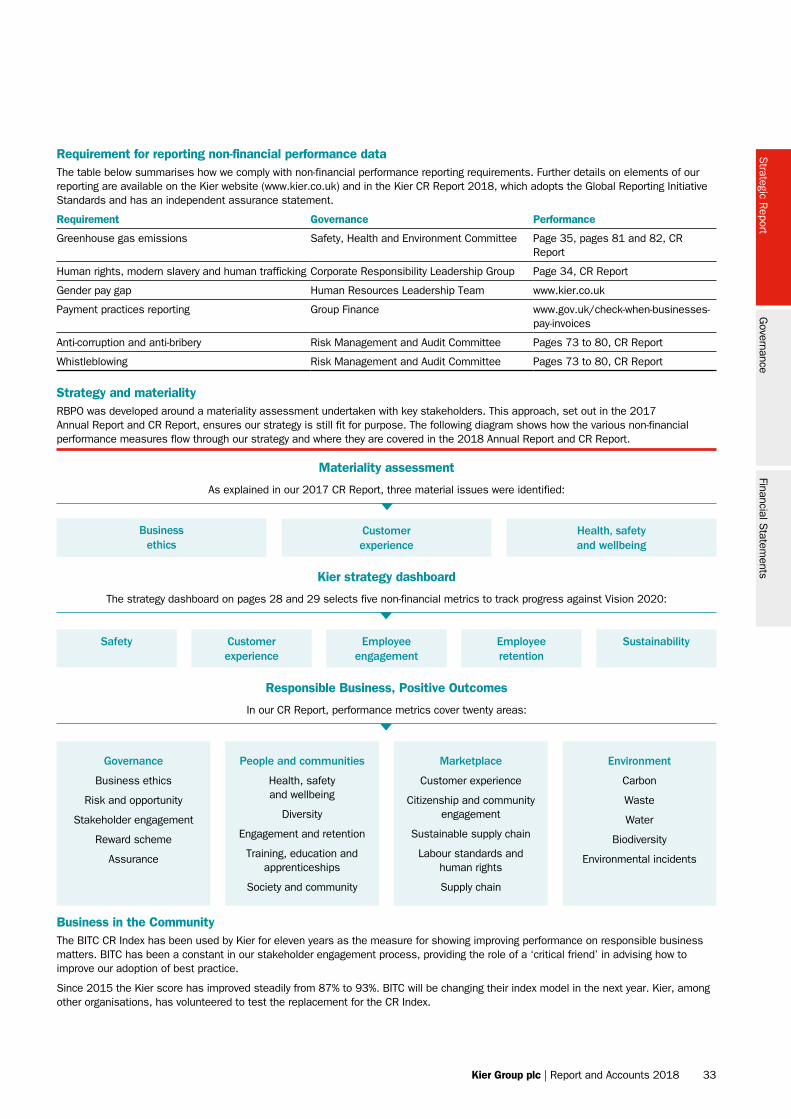
Business ethics
Safety Customer experience
Employee engagement
Employee retention
Sustainability
Customer experience
Health, safety and wellbeing
Requirement for reporting non-financial performance dataThe table below summarises how we comply with non-financial performance reporting requirements. Further details on elements of our reporting are available on the Kier website (www.kier.co.uk) and in the Kier CR Report 2018, which adopts the Global Reporting Initiative Standards and has an independent assurance statement.
Requirement Governance Performance
Greenhouse gas emissions Safety, Health and Environment Committee Page 35, pages 81 and 82, CR Report
Human rights, modern slavery and human trafficking Corporate Responsibility Leadership Group Page 34, CR Report
Gender pay gap Human Resources Leadership Team www.kier.co.uk
Payment practices reporting Group Finance www.gov.uk/check-when-businesses-pay-invoices
Anti-corruption and anti-bribery Risk Management and Audit Committee Pages 73 to 80, CR Report
Whistleblowing Risk Management and Audit Committee Pages 73 to 80, CR Report
Strategy and materialityRBPO was developed around a materiality assessment undertaken with key stakeholders. This approach, set out in the 2017 Annual Report and CR Report, ensures our strategy is still fit for purpose. The following diagram shows how the various non-financial performance measures flow through our strategy and where they are covered in the 2018 Annual Report and CR Report.
Kier strategy dashboard
The strategy dashboard on pages 28 and 29 selects five non-financial metrics to track progress against Vision 2020:
Materiality assessment
As explained in our 2017 CR Report, three material issues were identified:
Responsible Business, Positive Outcomes
In our CR Report, performance metrics cover twenty areas:
Governance
Business ethics
Risk and opportunity
Stakeholder engagement
Reward scheme
Assurance
People and communities
Health, safety and wellbeing
Diversity
Engagement and retention
Training, education and apprenticeships
Society and community
Marketplace
Customer experience
Citizenship and community engagement
Sustainable supply chain
Labour standards and human rights
Supply chain
Environment
Carbon
Waste
Water
Biodiversity
Environmental incidents
Business in the CommunityThe BITC CR Index has been used by Kier for eleven years as the measure for showing improving performance on responsible business matters. BITC has been a constant in our stakeholder engagement process, providing the role of a ‘critical friend’ in advising how to improve our adoption of best practice.
Since 2015 the Kier score has improved steadily from 87% to 93%. BITC will be changing their index model in the next year. Kier, among other organisations, has volunteered to test the replacement for the CR Index.
Strategic R
eportG
overnanceFinancial S
tatements
Kier Group plc | Report and Accounts 2018 33
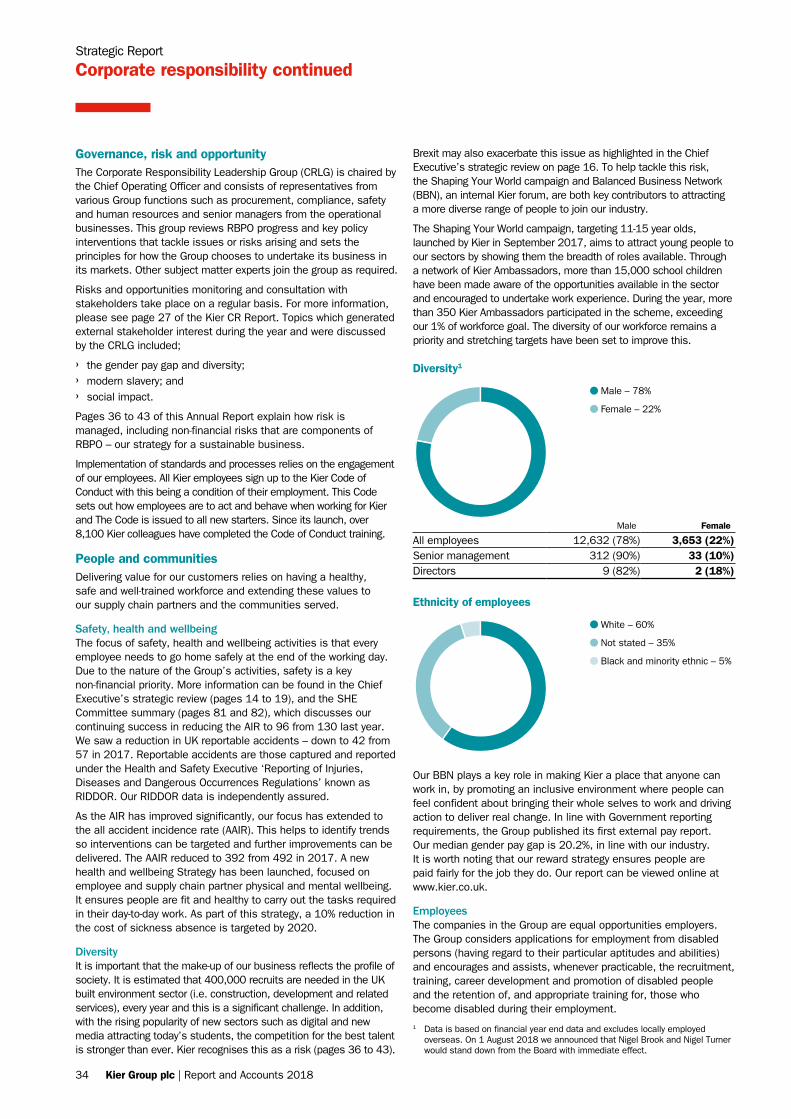
Strategic Report
Corporate responsibility continued
Diversity1
1 Data is based on financial year end data and excludes locally employed overseas. On 1 August 2018 we announced that Nigel Brook and Nigel Turner would stand down from the Board with immediate effect.
Ethnicity of employees
Governance, risk and opportunityThe Corporate Responsibility Leadership Group (CRLG) is chaired by the Chief Operating Officer and consists of representatives from various Group functions such as procurement, compliance, safety and human resources and senior managers from the operational businesses. This group reviews RBPO progress and key policy interventions that tackle issues or risks arising and sets the principles for how the Group chooses to undertake its business in its markets. Other subject matter experts join the group as required.
Risks and opportunities monitoring and consultation with stakeholders take place on a regular basis. For more information, please see page 27 of the Kier CR Report. Topics which generated external stakeholder interest during the year and were discussed by the CRLG included;
› the gender pay gap and diversity; › modern slavery; and › social impact.
Pages 36 to 43 of this Annual Report explain how risk is managed, including non-financial risks that are components of RBPO – our strategy for a sustainable business.
Implementation of standards and processes relies on the engagement of our employees. All Kier employees sign up to the Kier Code of Conduct with this being a condition of their employment. This Code sets out how employees are to act and behave when working for Kier and The Code is issued to all new starters. Since its launch, over 8,100 Kier colleagues have completed the Code of Conduct training.
People and communitiesDelivering value for our customers relies on having a healthy, safe and well-trained workforce and extending these values to our supply chain partners and the communities served.
Safety, health and wellbeingThe focus of safety, health and wellbeing activities is that every employee needs to go home safely at the end of the working day. Due to the nature of the Group’s activities, safety is a key non-financial priority. More information can be found in the Chief Executive’s strategic review (pages 14 to 19), and the SHE Committee summary (pages 81 and 82), which discusses our continuing success in reducing the AIR to 96 from 130 last year. We saw a reduction in UK reportable accidents – down to 42 from 57 in 2017. Reportable accidents are those captured and reported under the Health and Safety Executive ‘Reporting of Injuries, Diseases and Dangerous Occurrences Regulations’ known as RIDDOR. Our RIDDOR data is independently assured.
As the AIR has improved significantly, our focus has extended to the all accident incidence rate (AAIR). This helps to identify trends so interventions can be targeted and further improvements can be delivered. The AAIR reduced to 392 from 492 in 2017. A new health and wellbeing Strategy has been launched, focused on employee and supply chain partner physical and mental wellbeing. It ensures people are fit and healthy to carry out the tasks required in their day-to-day work. As part of this strategy, a 10% reduction in the cost of sickness absence is targeted by 2020.
DiversityIt is important that the make-up of our business reflects the profile of society. It is estimated that 400,000 recruits are needed in the UK built environment sector (i.e. construction, development and related services), every year and this is a significant challenge. In addition, with the rising popularity of new sectors such as digital and new media attracting today’s students, the competition for the best talent is stronger than ever. Kier recognises this as a risk (pages 36 to 43).
Brexit may also exacerbate this issue as highlighted in the Chief Executive’s strategic review on page 16. To help tackle this risk, the Shaping Your World campaign and Balanced Business Network (BBN), an internal Kier forum, are both key contributors to attracting a more diverse range of people to join our industry.
The Shaping Your World campaign, targeting 11-15 year olds, launched by Kier in September 2017, aims to attract young people to our sectors by showing them the breadth of roles available. Through a network of Kier Ambassadors, more than 15,000 school children have been made aware of the opportunities available in the sector and encouraged to undertake work experience. During the year, more than 350 Kier Ambassadors participated in the scheme, exceeding our 1% of workforce goal. The diversity of our workforce remains a priority and stretching targets have been set to improve this.
White – 60%
Not stated – 35%
Black and minority ethnic – 5%
Male – 78%
Female – 22%
Male Female
All employees 12,632 (78%) 3,653 (22%)Senior management 312 (90%) 33 (10%)Directors 9 (82%) 2 (18%)
Our BBN plays a key role in making Kier a place that anyone can work in, by promoting an inclusive environment where people can feel confident about bringing their whole selves to work and driving action to deliver real change. In line with Government reporting requirements, the Group published its first external pay report. Our median gender pay gap is 20.2%, in line with our industry. It is worth noting that our reward strategy ensures people are paid fairly for the job they do. Our report can be viewed online at www.kier.co.uk.
EmployeesThe companies in the Group are equal opportunities employers. The Group considers applications for employment from disabled persons (having regard to their particular aptitudes and abilities) and encourages and assists, whenever practicable, the recruitment, training, career development and promotion of disabled people and the retention of, and appropriate training for, those who become disabled during their employment.
34 Kier Group plc | Report and Accounts 2018
The Group provides information to employees through newsletters, video addresses, the Group’s intranet, social media and formal and informal meetings with various groups of employees and management. The Group also conducts engagement surveys to obtain feedback on matters of importance to employees.
The Group operates sharesave schemes for eligible employees and a share incentive plan for all employees, which includes a share-matching element.
Social impactAcross our market leading positions, our projects deliver significant social, economic and environmental improvements because of the way the Group chooses to do business. Social impact refers to wider financial and non-financial impacts of projects, including the wellbeing of individuals and communities, social capital and the environment. The methods to quantifying these impacts are still being refined but the Kier social impact strategy – Shaping Our Communities – creates a framework to report and improve on the positive outcomes delivered by projects. In the year, Kier recorded £157m of social impact, a significant increase from £52m in 2017. This was due to an improved recording platform and a significant effort on training and awareness. Work with an independent adviser, Social Value Business, indicates the Group is currently significantly underestimating the benefits that arise, the hidden value. This will be a focus area for the current financial year.
During the year, Kier undertook a detailed study of projects with a contract value of £600m and examined the positive impact recorded through charitable giving, donation of time and expertise, supporting training and apprenticeships and impact from the appointment of locally based supply chain partners. Kier had recorded £25m of social impact across these projects. The in-depth analysis estimated the impact on communities through project delivery to be worth £300m. A summary of this research will be found in our CR Report at www.kier.co.uk. Further information on this study will be published later in the year.
MarketplaceThere is increased external stakeholder focus on the subcontract supply chain due to market circumstances and topical issues such as modern slavery and payment practices. Kier has contributed to those discussions through its trade bodies and directly with Government, and works with the supply chain and our customers to ensure that parties work collaboratively to deliver on projects.
Our payment terms and prompt payment performance remains an area for focus following the publication of initial data in February 2018, which is updated every six months. Kier uses an early payment process which ensures our supply chain can choose to be paid at around 21 days and c.60% of transactions use this process.
The UK Government plans to strengthen the Social Value Act by requiring commissioners of public sector procurement to demonstrate how awarding a contract delivers positive social impact. A new Procurement Policy Note, which provides guidance for all central government departments, requires companies delivering contracts to disclose the amount they spend with small and medium-sized businesses (SMEs), social enterprises and voluntary organisations. Kier has always had a strong regional presence through its network of local offices, with well-developed local supply chains. More than 80% of our subcontractors by number are classified as SMEs, accounting for 61% of our subcontract spend. This is significantly higher than the Government guidance on public sector procurement guide level of 33% and creates a boost for local economies and secures local employment.
Kier became one of the first signatories to the Government Gangmasters and Labour Abuse Authority (GLAA) Construction Protocol giving a commitment to work with the GLAA and other signatories to identify and protect vulnerable workers, and to raise awareness of the issue of modern slavery with our supply chain partners. A confidential helpline has been provided so anyone suspecting that they, or someone they know, is the victim of modern slavery, can raise the issue. Through a series of audits based on the Kier procurement standards, the supply chain has been reviewed for the risk of modern slavery, human trafficking or issues concerning human rights. No issues have been identified.
EnvironmentHaving achieved our 2020 target early for reducing carbon dioxide emissions, Kier launched a new strategy, 30 by 30, with the aim of improving the Group’s energy efficiency by 30% by 2030. The strategy also aims to reduce construction waste, water consumption and use of plastics. In 2018 the first three initiatives were launched and it is expected to see financial savings come through in the next twelve to eighteen months. By continuing to reduce our carbon dioxide and other greenhouse gas emissions, Kier is also having a positive environmental impact through a reduced contribution to climate change. More information on our environmental activity is available in our CR Report.
Annual greenhouse gas emissions 2017
Emission type:2016
CO2e tonnes2017
CO2e tonnes
Scope 1: operation of facilities 0 0 Scope 1: combustion 108,831 101,781Total Scope 1 emissions 108,831 101,781 Scope 2: purchased energy 14,467 10,277Scope 2 total emissions 14,467 10,277Total Scope 1 and 2 emissions 123,298 112,058Greenhouse gas emissions intensity ratio
31.4 t/£m revenue
28.2 t/£m revenue
Revenue (£m) – calendar year 3,928 3,915
CO2e = Carbon dioxide equivalent
Our reporting of greenhouse gas emissions is for the calendar year 2017 to mirror our reporting to the Carbon Disclosure Project. Our dataset covers 88% (2016: 94%) of the Kier Group operations by revenue. Our reporting methodology detailing inclusion/exclusion of joint operations and joint ventures is provided in our reporting methodology available at www.kier.co.uk/corporate-responsibility/downloads.aspx. Scope 1 fugitive emissions are not included. Reporting follows the requirements of the Companies Act 2006 (Strategic Report and Directors Report) Regulations 2013, is in line with ISAE 3410, and uses conversion factors published by DEFRA.
For more information please see our Corporate Responsibility Report 2018 at www.kier.co.uk.
Strategic R
eportG
overnanceFinancial S
tatements
Kier Group plc | Report and Accounts 2018 35
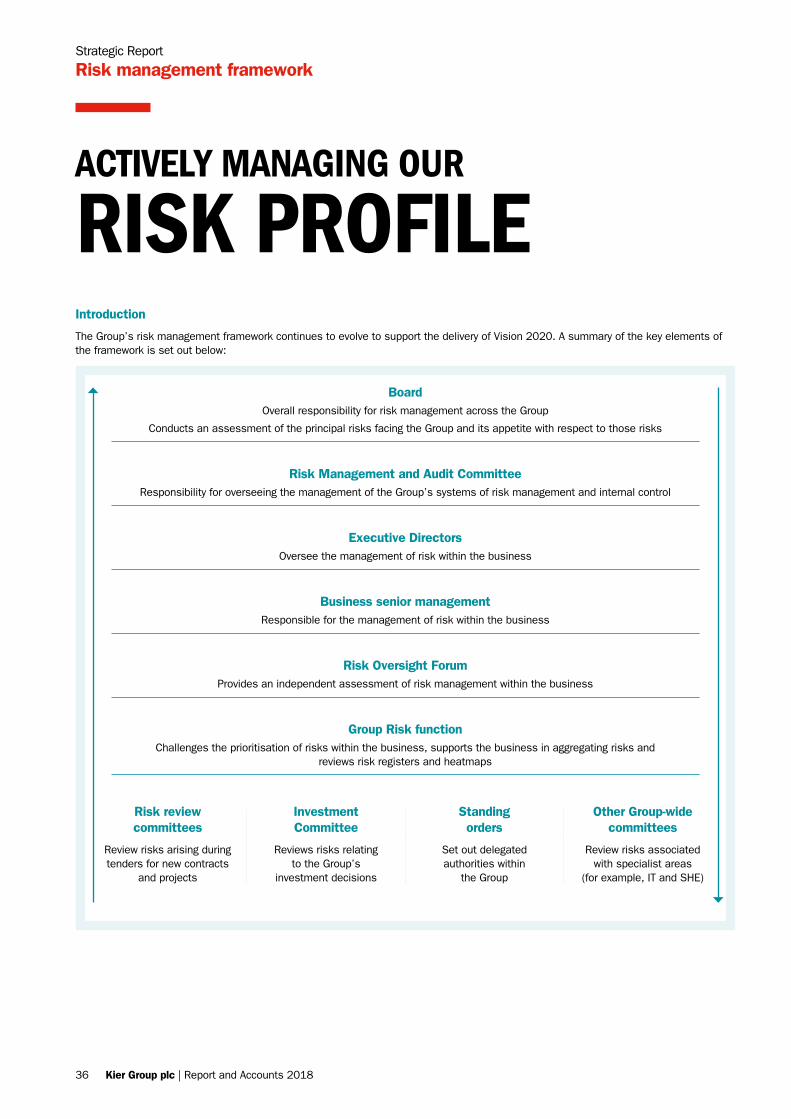
Strategic Report
Risk management framework
ACTIVELY MANAGING OUR
RISK PROFILE
BoardOverall responsibility for risk management across the Group
Conducts an assessment of the principal risks facing the Group and its appetite with respect to those risks
Risk Management and Audit CommitteeResponsibility for overseeing the management of the Group’s systems of risk management and internal control
Executive DirectorsOversee the management of risk within the business
Business senior managementResponsible for the management of risk within the business
Risk Oversight ForumProvides an independent assessment of risk management within the business
Group Risk functionChallenges the prioritisation of risks within the business, supports the business in aggregating risks and
reviews risk registers and heatmaps
Risk review committees
Review risks arising during tenders for new contracts
and projects
Investment Committee
Reviews risks relating to the Group’s
investment decisions
Standing orders
Set out delegated authorities within
the Group
Other Group-wide committees
Review risks associated with specialist areas
(for example, IT and SHE)
Introduction
The Group’s risk management framework continues to evolve to support the delivery of Vision 2020. A summary of the key elements of the framework is set out below:
36 Kier Group plc | Report and Accounts 2018
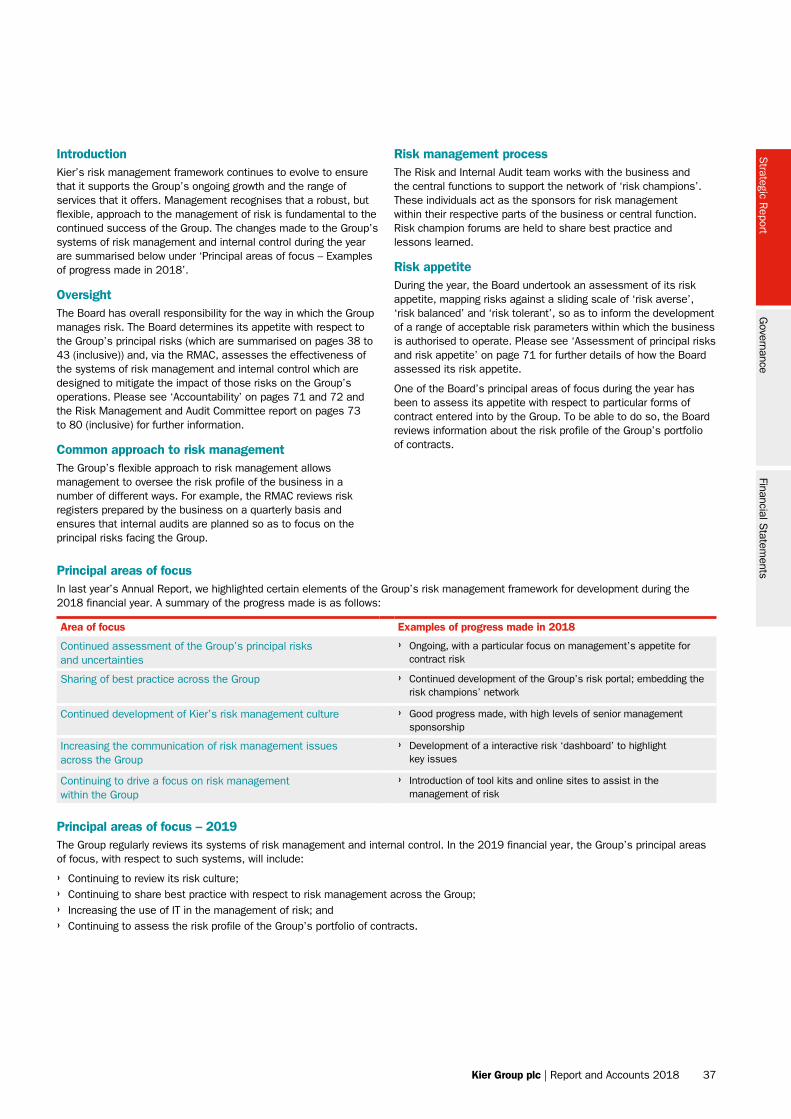
IntroductionKier’s risk management framework continues to evolve to ensure that it supports the Group’s ongoing growth and the range of services that it offers. Management recognises that a robust, but flexible, approach to the management of risk is fundamental to the continued success of the Group. The changes made to the Group’s systems of risk management and internal control during the year are summarised below under ‘Principal areas of focus – Examples of progress made in 2018’.
OversightThe Board has overall responsibility for the way in which the Group manages risk. The Board determines its appetite with respect to the Group’s principal risks (which are summarised on pages 38 to 43 (inclusive)) and, via the RMAC, assesses the effectiveness of the systems of risk management and internal control which are designed to mitigate the impact of those risks on the Group’s operations. Please see ‘Accountability’ on pages 71 and 72 and the Risk Management and Audit Committee report on pages 73 to 80 (inclusive) for further information.
Common approach to risk managementThe Group’s flexible approach to risk management allows management to oversee the risk profile of the business in a number of different ways. For example, the RMAC reviews risk registers prepared by the business on a quarterly basis and ensures that internal audits are planned so as to focus on the principal risks facing the Group.
Risk management processThe Risk and Internal Audit team works with the business and the central functions to support the network of ‘risk champions’. These individuals act as the sponsors for risk management within their respective parts of the business or central function. Risk champion forums are held to share best practice and lessons learned.
Risk appetiteDuring the year, the Board undertook an assessment of its risk appetite, mapping risks against a sliding scale of ‘risk averse’, ‘risk balanced’ and ‘risk tolerant’, so as to inform the development of a range of acceptable risk parameters within which the business is authorised to operate. Please see ‘Assessment of principal risks and risk appetite’ on page 71 for further details of how the Board assessed its risk appetite.
One of the Board’s principal areas of focus during the year has been to assess its appetite with respect to particular forms of contract entered into by the Group. To be able to do so, the Board reviews information about the risk profile of the Group’s portfolio of contracts.
Principal areas of focusIn last year’s Annual Report, we highlighted certain elements of the Group’s risk management framework for development during the 2018 financial year. A summary of the progress made is as follows:
Area of focus Examples of progress made in 2018
Continued assessment of the Group’s principal risks and uncertainties
› Ongoing, with a particular focus on management’s appetite for contract risk
Sharing of best practice across the Group › Continued development of the Group’s risk portal; embedding the risk champions’ network
Continued development of Kier’s risk management culture › Good progress made, with high levels of senior management sponsorship
Increasing the communication of risk management issues across the Group
› Development of a interactive risk ‘dashboard’ to highlight key issues
Continuing to drive a focus on risk management within the Group
› Introduction of tool kits and online sites to assist in the management of risk
Principal areas of focus – 2019The Group regularly reviews its systems of risk management and internal control. In the 2019 financial year, the Group’s principal areas of focus, with respect to such systems, will include:
› Continuing to review its risk culture; › Continuing to share best practice with respect to risk management across the Group; › Increasing the use of IT in the management of risk; and › Continuing to assess the risk profile of the Group’s portfolio of contracts.
Strategic R
eportG
overnanceFinancial S
tatements
Kier Group plc | Report and Accounts 2018 37
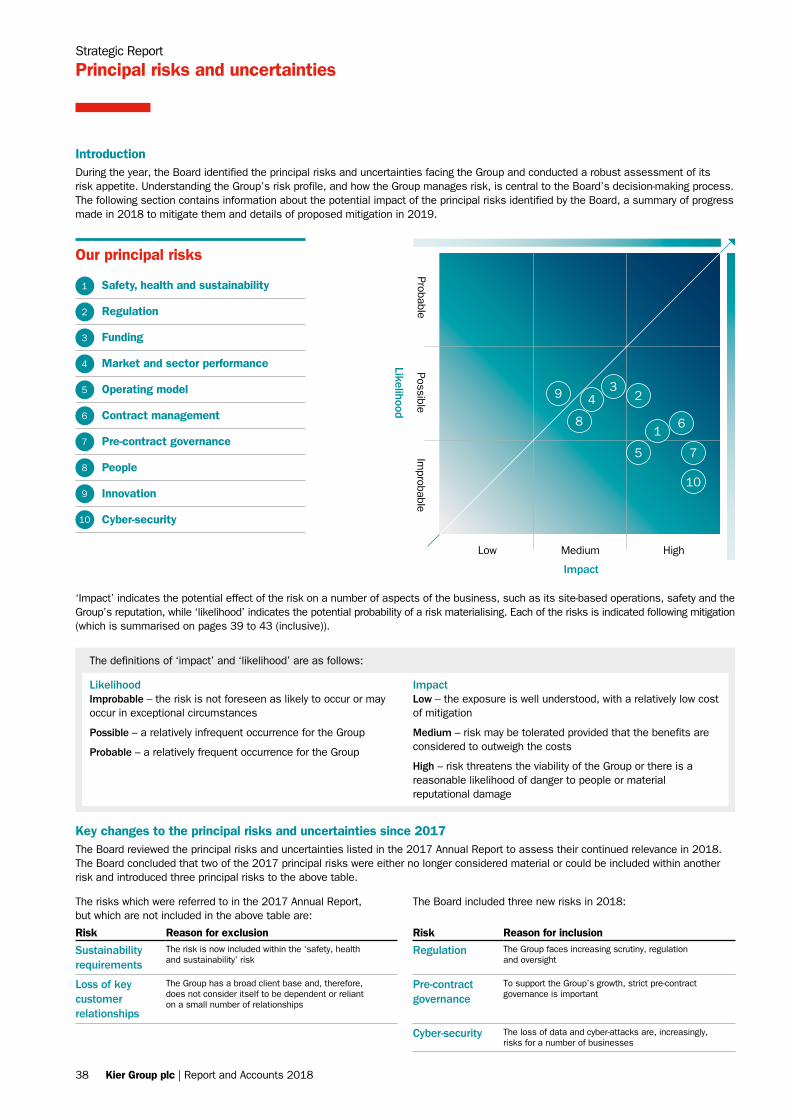
‘Impact’ indicates the potential effect of the risk on a number of aspects of the business, such as its site-based operations, safety and the Group’s reputation, while ‘likelihood’ indicates the potential probability of a risk materialising. Each of the risks is indicated following mitigation (which is summarised on pages 39 to 43 (inclusive)).
Key changes to the principal risks and uncertainties since 2017The Board reviewed the principal risks and uncertainties listed in the 2017 Annual Report to assess their continued relevance in 2018. The Board concluded that two of the 2017 principal risks were either no longer considered material or could be included within another risk and introduced three principal risks to the above table.
Safety, health and sustainability
Regulation
Funding
Market and sector performance
Operating model
Contract management
Pre-contract governance
People
Innovation
Cyber-security
1
2
3
4
5
6
7
8
9
10
Low Medium
Impact
Likelihood
High
Improbable
PossibleProbable
Our principal risks
LikelihoodImprobable – the risk is not foreseen as likely to occur or may occur in exceptional circumstances
Possible – a relatively infrequent occurrence for the Group
Probable – a relatively frequent occurrence for the Group
ImpactLow – the exposure is well understood, with a relatively low cost of mitigation
Medium – risk may be tolerated provided that the benefits are considered to outweigh the costs
High – risk threatens the viability of the Group or there is a reasonable likelihood of danger to people or material reputational damage
2
1
10
5
6
7
4
8
9 3
IntroductionDuring the year, the Board identified the principal risks and uncertainties facing the Group and conducted a robust assessment of its risk appetite. Understanding the Group’s risk profile, and how the Group manages risk, is central to the Board’s decision-making process. The following section contains information about the potential impact of the principal risks identified by the Board, a summary of progress made in 2018 to mitigate them and details of proposed mitigation in 2019.
Strategic Report
Principal risks and uncertainties
The definitions of ‘impact’ and ‘likelihood’ are as follows:
The Board included three new risks in 2018:
Risk Reason for inclusion
Regulation The Group faces increasing scrutiny, regulation and oversight
Pre-contract governance
To support the Group’s growth, strict pre-contract governance is important
Cyber-security The loss of data and cyber-attacks are, increasingly, risks for a number of businesses
The risks which were referred to in the 2017 Annual Report, but which are not included in the above table are:
Risk Reason for exclusion
Sustainability requirements
The risk is now included within the ‘safety, health and sustainability’ risk
Loss of key customer relationships
The Group has a broad client base and, therefore, does not consider itself to be dependent or reliant on a small number of relationships
38 Kier Group plc | Report and Accounts 2018
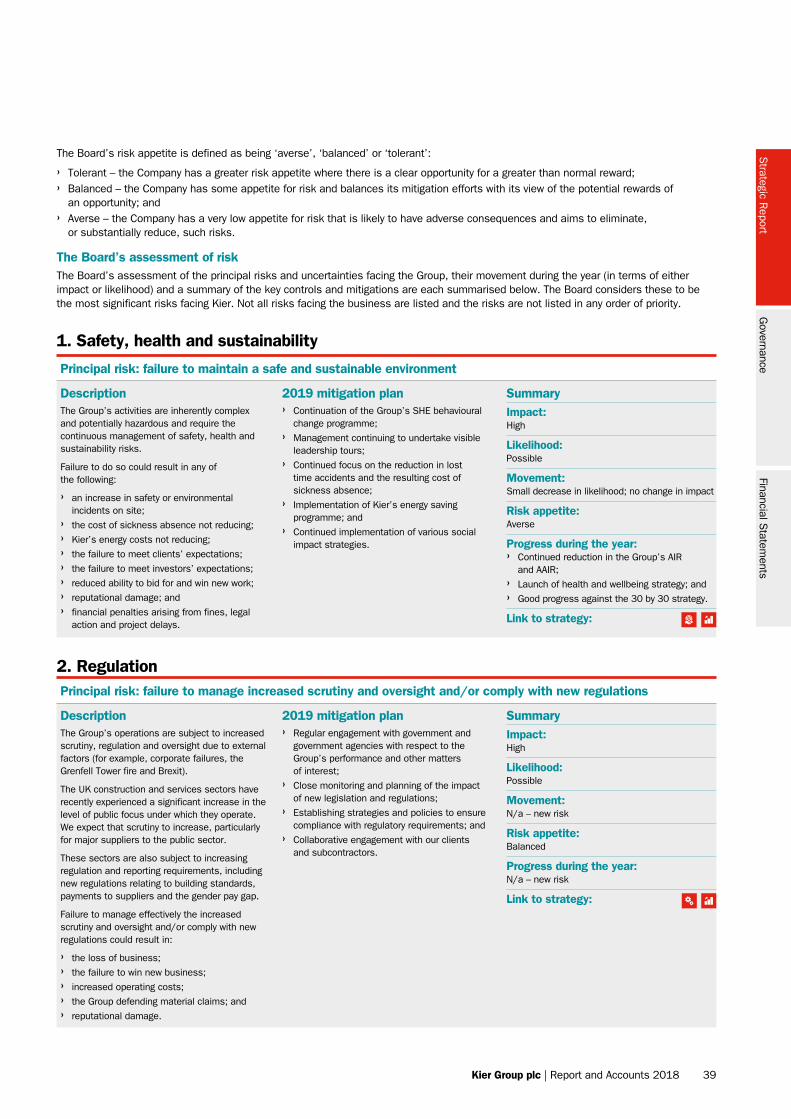
SummaryImpact:High
Likelihood:Possible
Movement:N/a – new risk
Risk appetite:Balanced
Progress during the year:N/a – new risk
Link to strategy:
2. RegulationPrincipal risk: failure to manage increased scrutiny and oversight and/or comply with new regulations
DescriptionThe Group’s operations are subject to increased scrutiny, regulation and oversight due to external factors (for example, corporate failures, the Grenfell Tower fire and Brexit).
The UK construction and services sectors have recently experienced a significant increase in the level of public focus under which they operate. We expect that scrutiny to increase, particularly for major suppliers to the public sector.
These sectors are also subject to increasing regulation and reporting requirements, including new regulations relating to building standards, payments to suppliers and the gender pay gap.
Failure to manage effectively the increased scrutiny and oversight and/or comply with new regulations could result in:
› the loss of business;
› the failure to win new business;
› increased operating costs;
› the Group defending material claims; and
› reputational damage.
2019 mitigation plan › Regular engagement with government and
government agencies with respect to the Group’s performance and other matters of interest;
› Close monitoring and planning of the impact of new legislation and regulations;
› Establishing strategies and policies to ensure compliance with regulatory requirements; and
› Collaborative engagement with our clients and subcontractors.
SummaryImpact:High
Likelihood:Possible
Movement:Small decrease in likelihood; no change in impact
Risk appetite:Averse
Progress during the year: › Continued reduction in the Group’s AIR
and AAIR;
› Launch of health and wellbeing strategy; and
› Good progress against the 30 by 30 strategy.
Link to strategy:
1. Safety, health and sustainability
Principal risk: failure to maintain a safe and sustainable environment
DescriptionThe Group’s activities are inherently complex and potentially hazardous and require the continuous management of safety, health and sustainability risks.
Failure to do so could result in any of the following:
› an increase in safety or environmental incidents on site;
› the cost of sickness absence not reducing;
› Kier’s energy costs not reducing;
› the failure to meet clients’ expectations;
› the failure to meet investors’ expectations;
› reduced ability to bid for and win new work;
› reputational damage; and
› financial penalties arising from fines, legal action and project delays.
2019 mitigation plan › Continuation of the Group’s SHE behavioural
change programme;
› Management continuing to undertake visible leadership tours;
› Continued focus on the reduction in lost time accidents and the resulting cost of sickness absence;
› Implementation of Kier’s energy saving programme; and
› Continued implementation of various social impact strategies.
The Board’s risk appetite is defined as being ‘averse’, ‘balanced’ or ‘tolerant’:
› Tolerant – the Company has a greater risk appetite where there is a clear opportunity for a greater than normal reward; › Balanced – the Company has some appetite for risk and balances its mitigation efforts with its view of the potential rewards of
an opportunity; and › Averse – the Company has a very low appetite for risk that is likely to have adverse consequences and aims to eliminate,
or substantially reduce, such risks.
The Board’s assessment of riskThe Board’s assessment of the principal risks and uncertainties facing the Group, their movement during the year (in terms of either impact or likelihood) and a summary of the key controls and mitigations are each summarised below. The Board considers these to be the most significant risks facing Kier. Not all risks facing the business are listed and the risks are not listed in any order of priority.
Strategic R
eportG
overnanceFinancial S
tatements
Kier Group plc | Report and Accounts 2018 39
SummaryImpact:Medium
Likelihood:Possible
Movement:Small increase in both likelihood and impact
Risk appetite:Averse
Progress during the year: › Maintenance of appropriate liquidity headroom
throughout the year;
› Available bonding facilities demonstrate appropriate headroom; and
› Treasury Committee now fully established.
Link to strategy:
3. Funding
Principal risk: reduced liquidity affects our ability to invest and grow
DescriptionPolitical, market or lender sentiment may affect the Group’s available funding, thereby reducing its liquidity and restricting its ability to invest in the Property and Residential businesses and deliver plans for future growth.
The Group has a number of committed and uncommitted facilities available to meet its funding needs. Any or all of these facilities could be reduced or removed.
A reduction in or removal of the Group’s principal financing facilities could result in:
› a slowdown of investment for future growth, particularly in the Property and Residential businesses;
› reduced profit as a result of the inability to fund growth opportunities; and
› the loss of confidence by stakeholders (for example, investors, clients, subcontractors and employees).
2019 mitigation plan › Focus on cash forecasting and working
capital management to generate positive cash flow;
› Maintenance of appropriate levels of committed bank facilities;
› Maintenance of appropriate bank and surety bonding facilities;
› Collaborative engagement with banks, lenders and sureties; and
› Continue to identify appropriate alternative funding structures.
SummaryImpact:Medium
Likelihood:Possible
Movement:No change in likelihood; decreased impact
Risk appetite:Balanced
Progress during the year: › Market risks were reviewed through the annual
strategy and business planning processes;
› The business’ performance is formally reviewed quarterly; and
› The appointment of the new Group Business Development Director to co-ordinate business development activities across the Group.
Link to strategy:
4. Market and sector performance
Principal risk: market downturn may reduce growth opportunities
DescriptionDelivery of the Group’s strategy depends on the economic performance of the UK, in particular, and the markets and sectors in which the Group operates. Although the Group provides a range of services and operates across a number of diverse market sectors, reduced economic activity and expenditure in public, regulated and private sectors would likely result in lower growth or lower revenue for the Group. In addition, the performance of the Property and Residential businesses relies on successful investments across the market sectors in which they operate.
A downturn in the Group’s markets and/or unsuccessful allocation of investment capital could result in:
› a failure to meet the Group’s financial targets;
› a failure of one or more of the Group’s businesses;
› an increase in the competition for new work; and
› a decrease in stakeholder confidence in the Group.
2019 mitigation plan › Continue to evaluate market performance,
including the impact of macro-economic factors and the associated market risk of specific events (for example, Brexit);
› Review the Group’s portfolio of businesses to enable management to focus on the Group’s core businesses;
› Continue to review its pipeline of future work to identify trends in the Group’s core markets; and
› Via the newly-appointed Group Business Development Director, ensure a focused approach to winning new work.
Strategic Report
Principal risks and uncertainties continued
40 Kier Group plc | Report and Accounts 2018

SummaryImpact:High
Likelihood:Possible
Movement:Small decrease in likelihood; no change in impact
Risk appetite:Averse
Progress during the year: › Increased the rigour of the monthly
operational and financial contract reviews within the business;
› Via the quarterly review process, introduced greater accountability for contract performance; and
› Introduced the Oracle ERP system to simplify and rationalise contract performance data.
Link to strategy:
6. Contract management
Principal risk: ineffective contract management leads to losses
DescriptionEffective contract management is central to the Group’s business model and its continued growth. The Group has a number of large and complex contracts in progress at any one time. Each of these contracts requires careful and effective management, according to a number of factors, including type of work, location, length of contract and form of contract.
Failure to manage contracts effectively could result in:
› a failure to meet the Group’s financial targets;
› the Group incurring losses;
› the Group failing to win new work;
› reputational damage to the Group; and
› a loss of confidence of stakeholders (for example, investors, clients, subcontractors and employees).
2019 mitigation plan › Continued use of metrics to provide early
warnings of under-performing contracts;
› Completion of the review of the Group’s contract risk governance framework; and
› Continued focus on supply-chain procurement.
SummaryImpact:High
Likelihood:Improbable
Movement:Small decrease in likelihood; no change in impact
Risk appetite:Balanced
Progress during the year: › Repositioned the Group to focus on its three
key market positions;
› Completion of a number of disposals;
› Continued progress against our Vision 2020 targets; and
› Continued the implementation of the Oracle ERP system.
Link to strategy:
5. Operating model
Principal risk: efficiency benefits are not achieved
DescriptionThe Group needs to maintain and evolve its operating model so as to build and sustain the long-term confidence of its key stakeholders, deliver sector-leading customer experience and maximise the opportunities for growth. The Group needs to maintain an efficient operating model.
Failure to do so could result in:
› business failure;
› the failure to deliver growth and profitability;
› the failure to remain competitive;
› the failure to reduce costs; and
› the failure to meet the expectations of stakeholders (for example, investors, clients, subcontractors and employees).
2019 mitigation plan › Continue to monitor the long-term prospects,
opportunities and risks associated with our key markets and adapt the operating model accordingly;
› Implement the Future Proofing Kier programme to improve productivity, operating margins and cash generation;
› Seek to dispose of non-core operations; and
› Deliver the benefits of the Oracle ERP implementation.
Strategic R
eportG
overnanceFinancial S
tatements
Kier Group plc | Report and Accounts 2018 41
SummaryImpact:High
Likelihood:Improbable
Movement:N/a – new risk
Risk appetite:Balanced
Progress during the year:N/a – new risk
Link to strategy:
7. Pre-contract governance
Principal risk: inadequate pre-contract governance fails to identify contract risk
DescriptionEffective pre-contract governance is essential to ensure that the Group understands the risks associated with projects and has in place appropriate plans to mitigate those risks.
A failure in the Group’s pre-contract controls could result in:
› poorly performing contracts;
› the Group incurring losses;
› the failure to meet a client’s expectations on cost and quality;
› claims and litigation against the Group;
› a failure to meet the Group’s financial targets; and
› the Group failing to win new work.
2019 mitigation plan › Continue to assess contract risk through the
Group’s standing orders, commercial standards and screening assessment matrix;
› Continue to focus on selective tendering; and
› Share lessons learned across the Group.
SummaryImpact:Medium
Likelihood:Possible
Movement:Small decrease in likelihood; no change in impact
Risk appetite:Tolerant
Progress during the year: › Voluntary attrition reduced in line with targets;
› Engagement survey score increased; and
› Targets in place to drive improvement in early career development and gender diversity.
Link to strategy:
8. People
Principal risk: failure to deliver the Group’s people strategy
DescriptionThe Group recognises the importance of a clear people strategy to the delivery of its overall strategy and the need to identify, retain and motivate people with the right skills, experience and behaviours. In particular, the Group recognises the benefits of a diverse workforce which is representative of society.
Failure to deliver the Group’s people strategy could result in:
› the failure to deliver a specific business need or contract requirement;
› reputational damage, to both the corporate and the employee brand;
› the failure to develop future leaders;
› the over-reliance on key staff; and
› a failure to meet the Group’s financial targets.
2019 mitigation plan › Continue to progress internal targets on
gender diversity at all levels;
› Continue to focus on skills development and retention plans for critical skills and the talent pipeline; and
› Embed visible leadership of the balanced business agenda and engagement actions so as to create a fully inclusive work environment.
Strategic Report
Principal risks and uncertainties continued
42 Kier Group plc | Report and Accounts 2018
SummaryImpact:High
Likelihood:Improbable
Movement:N/a – new risk
Risk appetite:Averse
Progress during the year:N/a – new risk
Link to strategy:
10. Cyber-security
Principal risk: failure to maintain adequate cyber-security measures
DescriptionCyber-attack and data loss is a risk to all organisations and individuals. The Group is at risk because it handles sensitive information of a personal, confidential and commercial nature, its business operations depend upon IT systems and it has an increasing profile with clients, suppliers and other stakeholders.
Failure to manage the cyber-security risk may result in:
› business interruptions and operational delay;
› the loss of data, resulting in confidentiality breaches, financial loss and reputational damage;
› fines from regulatory authorities; and
› reputational damage to the Group.
2019 mitigation plan › Continue to strengthen the Group’s dedicated
cyber-security team;
› Consider outsourcing elements of the Group’s IT systems where it is appropriate to do so; and
› Continue to test information security alongside recognised UK and International standards (for example, ISO27001).
BrexitThe UK will be leaving the EU in March 2019. Kier has established a senior level ‘Brexit Taskforce’ to consider the potential effect of Brexit on the Group, which will be influenced by the outcome of the negotiations between the UK Government and the European Commission.
We have identified potential risks relating to the supply chain, the workforce and the supply and cost of materials, in particular. The Group is developing contingency plans against a range of scenarios, including one in which the UK leaves the EU without an agreement and, potentially, without a transition period. We are monitoring developments and will amend and update these plans accordingly.
SummaryImpact:Medium
Likelihood:Possible
Movement:Small increase in impact; no change in likelihood
Risk appetite:Tolerant
Progress during the year: › Innovative solutions are now at the forefront
of a number of businesses – for example, Highways and Construction;
› Continued to invest in digital platforms to support customer-facing and back-office operations; and
› Continued to support the Group’s innovation forum.
Link to strategy:
9. Innovation
Principal risk: failure to innovate to keep ahead of market and client expectations
DescriptionThe Group operates in an increasingly dynamic and changing environment. To exploit the opportunities that this presents, the Group seeks to embrace innovation and capitalise on technological advancements.
Failure to do so may result in:
› a failure to maintain the Group’s market position;
› the failure to reduce cost or increase the speed of delivery for clients;
› the failure to provide visibility of performance; and
› the failure to attract and retain staff.
2019 mitigation plan › Ensure that employees have access to online
innovation and idea-sharing platforms;
› Further develop the Group’s partnerships with clients and third party organisations to progress its innovation agenda; and
› Monitor, and respond to, prospective market disruptors.
Strategic R
eportG
overnanceFinancial S
tatements
Kier Group plc | Report and Accounts 2018 43
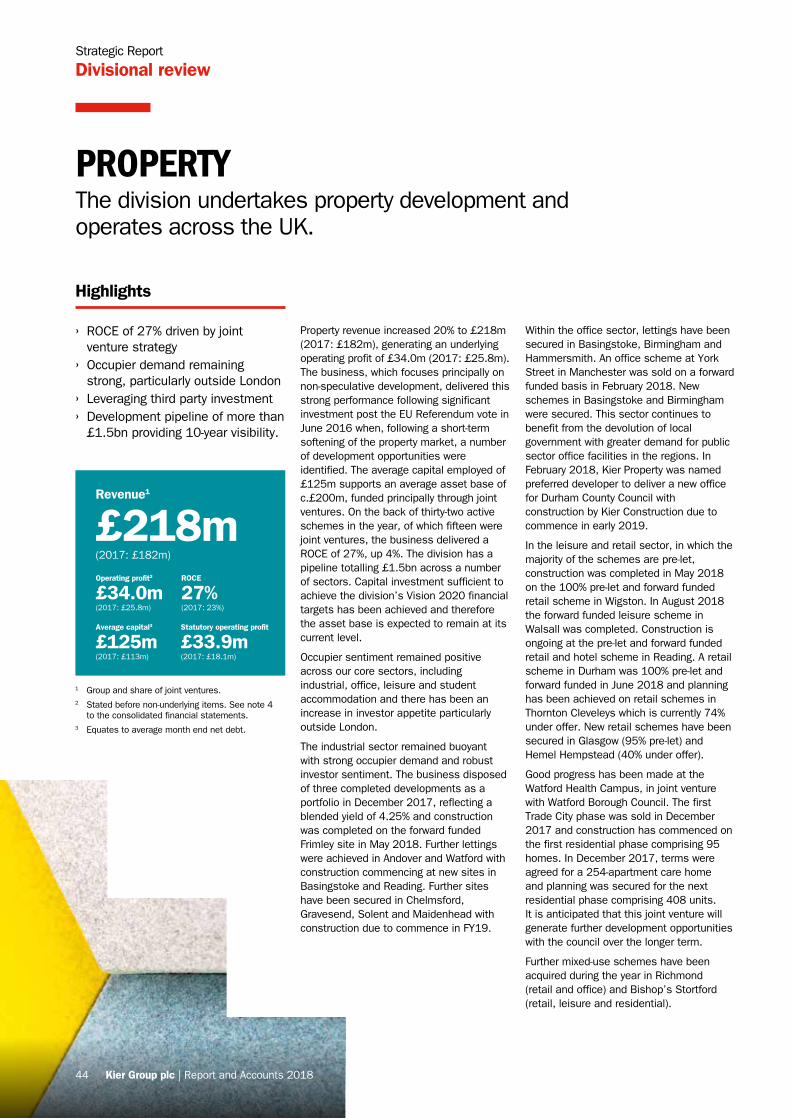
Strategic Report
Divisional review
PROPERTYThe division undertakes property development and operates across the UK.
Highlights
› ROCE of 27% driven by joint venture strategy
› Occupier demand remaining strong, particularly outside London
› Leveraging third party investment › Development pipeline of more than £1.5bn providing 10-year visibility.
Property revenue increased 20% to £218m (2017: £182m), generating an underlying operating profit of £34.0m (2017: £25.8m). The business, which focuses principally on non-speculative development, delivered this strong performance following significant investment post the EU Referendum vote in June 2016 when, following a short-term softening of the property market, a number of development opportunities were identified. The average capital employed of £125m supports an average asset base of c.£200m, funded principally through joint ventures. On the back of thirty-two active schemes in the year, of which fifteen were joint ventures, the business delivered a ROCE of 27%, up 4%. The division has a pipeline totalling £1.5bn across a number of sectors. Capital investment sufficient to achieve the division’s Vision 2020 financial targets has been achieved and therefore the asset base is expected to remain at its current level.
Occupier sentiment remained positive across our core sectors, including industrial, office, leisure and student accommodation and there has been an increase in investor appetite particularly outside London.
The industrial sector remained buoyant with strong occupier demand and robust investor sentiment. The business disposed of three completed developments as a portfolio in December 2017, reflecting a blended yield of 4.25% and construction was completed on the forward funded Frimley site in May 2018. Further lettings were achieved in Andover and Watford with construction commencing at new sites in Basingstoke and Reading. Further sites have been secured in Chelmsford, Gravesend, Solent and Maidenhead with construction due to commence in FY19.
Within the office sector, lettings have been secured in Basingstoke, Birmingham and Hammersmith. An office scheme at York Street in Manchester was sold on a forward funded basis in February 2018. New schemes in Basingstoke and Birmingham were secured. This sector continues to benefit from the devolution of local government with greater demand for public sector office facilities in the regions. In February 2018, Kier Property was named preferred developer to deliver a new office for Durham County Council with construction by Kier Construction due to commence in early 2019.
In the leisure and retail sector, in which the majority of the schemes are pre-let, construction was completed in May 2018 on the 100% pre-let and forward funded retail scheme in Wigston. In August 2018 the forward funded leisure scheme in Walsall was completed. Construction is ongoing at the pre-let and forward funded retail and hotel scheme in Reading. A retail scheme in Durham was 100% pre-let and forward funded in June 2018 and planning has been achieved on retail schemes in Thornton Cleveleys which is currently 74% under offer. New retail schemes have been secured in Glasgow (95% pre-let) and Hemel Hempstead (40% under offer).
Good progress has been made at the Watford Health Campus, in joint venture with Watford Borough Council. The first Trade City phase was sold in December 2017 and construction has commenced on the first residential phase comprising 95 homes. In December 2017, terms were agreed for a 254-apartment care home and planning was secured for the next residential phase comprising 408 units. It is anticipated that this joint venture will generate further development opportunities with the council over the longer term.
Further mixed-use schemes have been acquired during the year in Richmond (retail and office) and Bishop’s Stortford (retail, leisure and residential).
Revenue1
£218m(2017: £182m)
Operating profit2
£34.0m(2017: £25.8m)
Average capital3
£125m(2017: £113m)
ROCE
27%(2017: 23%)
Statutory operating profit
£33.9m(2017: £18.1m)
1 Group and share of joint ventures.2 Stated before non-underlying items. See note 4
to the consolidated financial statements.3 Equates to average month end net debt.
44 Kier Group plc | Report and Accounts 2018
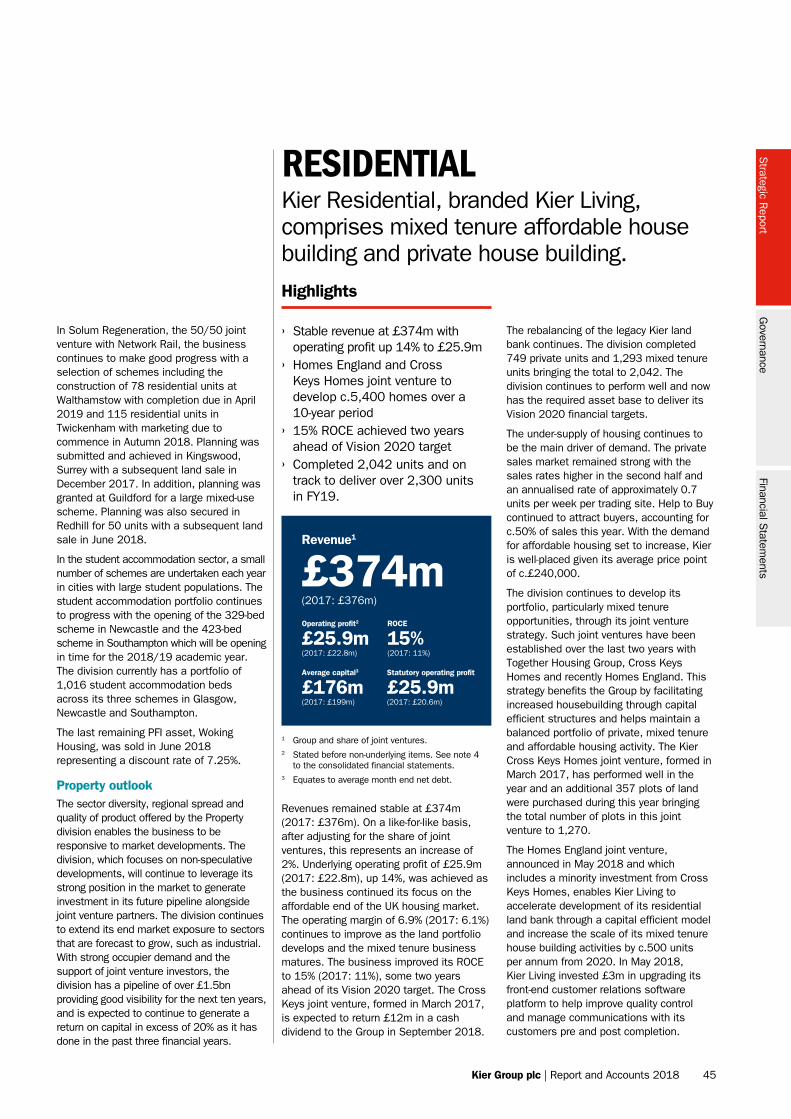
Kier Residential, branded Kier Living, comprises mixed tenure affordable house building and private house building.
Highlights
› Stable revenue at £374m with operating profit up 14% to £25.9m
› Homes England and Cross Keys Homes joint venture to develop c.5,400 homes over a 10-year period
› 15% ROCE achieved two years ahead of Vision 2020 target
› Completed 2,042 units and on track to deliver over 2,300 units in FY19.
RESIDENTIAL
Revenue1
£374m(2017: £376m)
Operating profit2
£25.9m(2017: £22.8m)
Average capital3
£176m(2017: £199m)
ROCE
15%(2017: 11%)
Statutory operating profit
£25.9m(2017: £20.6m)
1 Group and share of joint ventures.2 Stated before non-underlying items. See note 4
to the consolidated financial statements.3 Equates to average month end net debt.
The rebalancing of the legacy Kier land bank continues. The division completed 749 private units and 1,293 mixed tenure units bringing the total to 2,042. The division continues to perform well and now has the required asset base to deliver its Vision 2020 financial targets.
The under-supply of housing continues to be the main driver of demand. The private sales market remained strong with the sales rates higher in the second half and an annualised rate of approximately 0.7 units per week per trading site. Help to Buy continued to attract buyers, accounting for c.50% of sales this year. With the demand for affordable housing set to increase, Kier is well-placed given its average price point of c.£240,000.
The division continues to develop its portfolio, particularly mixed tenure opportunities, through its joint venture strategy. Such joint ventures have been established over the last two years with Together Housing Group, Cross Keys Homes and recently Homes England. This strategy benefits the Group by facilitating increased housebuilding through capital efficient structures and helps maintain a balanced portfolio of private, mixed tenure and affordable housing activity. The Kier Cross Keys Homes joint venture, formed in March 2017, has performed well in the year and an additional 357 plots of land were purchased during this year bringing the total number of plots in this joint venture to 1,270.
The Homes England joint venture, announced in May 2018 and which includes a minority investment from Cross Keys Homes, enables Kier Living to accelerate development of its residential land bank through a capital efficient model and increase the scale of its mixed tenure house building activities by c.500 units per annum from 2020. In May 2018, Kier Living invested £3m in upgrading its front-end customer relations software platform to help improve quality control and manage communications with its customers pre and post completion.
In Solum Regeneration, the 50/50 joint venture with Network Rail, the business continues to make good progress with a selection of schemes including the construction of 78 residential units at Walthamstow with completion due in April 2019 and 115 residential units in Twickenham with marketing due to commence in Autumn 2018. Planning was submitted and achieved in Kingswood, Surrey with a subsequent land sale in December 2017. In addition, planning was granted at Guildford for a large mixed-use scheme. Planning was also secured in Redhill for 50 units with a subsequent land sale in June 2018.
In the student accommodation sector, a small number of schemes are undertaken each year in cities with large student populations. The student accommodation portfolio continues to progress with the opening of the 329-bed scheme in Newcastle and the 423-bed scheme in Southampton which will be opening in time for the 2018/19 academic year. The division currently has a portfolio of 1,016 student accommodation beds across its three schemes in Glasgow, Newcastle and Southampton.
The last remaining PFI asset, Woking Housing, was sold in June 2018 representing a discount rate of 7.25%.
Property outlookThe sector diversity, regional spread and quality of product offered by the Property division enables the business to be responsive to market developments. The division, which focuses on non-speculative developments, will continue to leverage its strong position in the market to generate investment in its future pipeline alongside joint venture partners. The division continues to extend its end market exposure to sectors that are forecast to grow, such as industrial. With strong occupier demand and the support of joint venture investors, the division has a pipeline of over £1.5bn providing good visibility for the next ten years, and is expected to continue to generate a return on capital in excess of 20% as it has done in the past three financial years.
Revenues remained stable at £374m (2017: £376m). On a like-for-like basis, after adjusting for the share of joint ventures, this represents an increase of 2%. Underlying operating profit of £25.9m (2017: £22.8m), up 14%, was achieved as the business continued its focus on the affordable end of the UK housing market. The operating margin of 6.9% (2017: 6.1%) continues to improve as the land portfolio develops and the mixed tenure business matures. The business improved its ROCE to 15% (2017: 11%), some two years ahead of its Vision 2020 target. The Cross Keys joint venture, formed in March 2017, is expected to return £12m in a cash dividend to the Group in September 2018.
Strategic R
eportG
overnanceFinancial S
tatements
Kier Group plc | Report and Accounts 2018 45
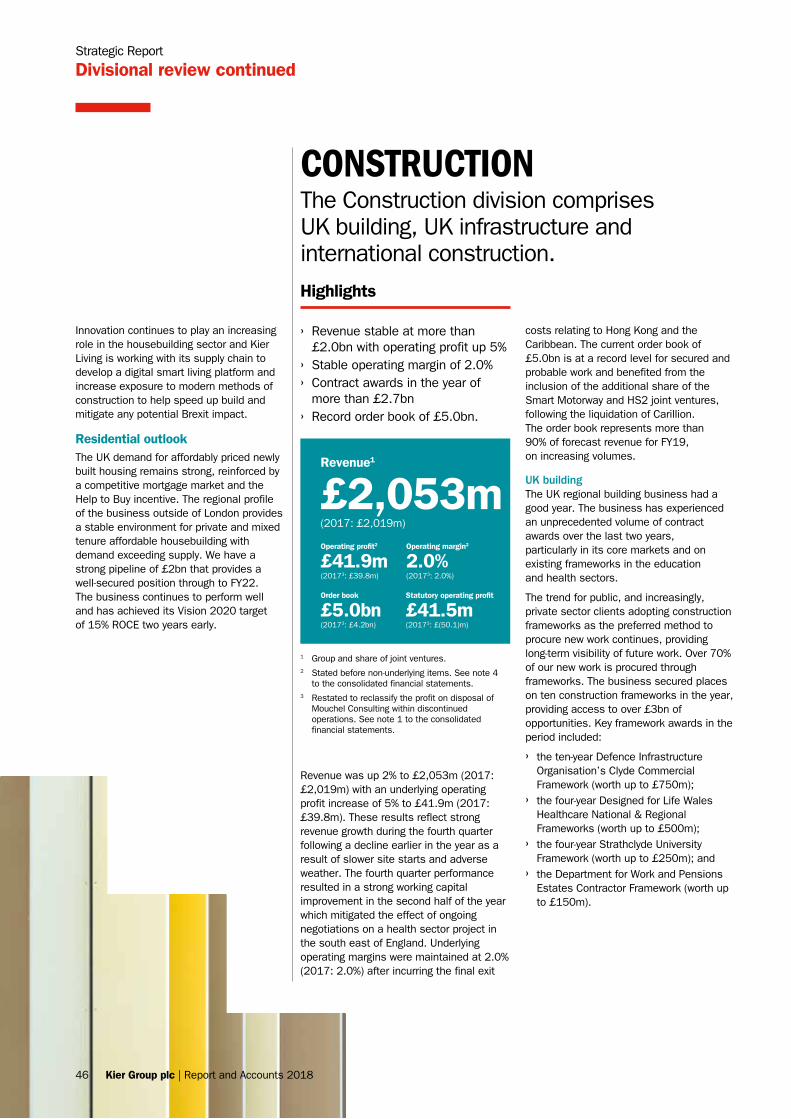
Strategic Report
Divisional review continued
CONSTRUCTIONThe Construction division comprises UK building, UK infrastructure and international construction.
Highlights
› Revenue stable at more than £2.0bn with operating profit up 5%
› Stable operating margin of 2.0% › Contract awards in the year of more than £2.7bn
› Record order book of £5.0bn.
Revenue1
£2,053m(2017: £2,019m)
Operating profit2
£41.9m(20173: £39.8m)
Order book
£5.0bn(20173: £4.2bn)
Operating margin2
2.0%(20173: 2.0%)
Statutory operating profit
£41.5m(20173: £(50.1)m)
1 Group and share of joint ventures.2 Stated before non-underlying items. See note 4
to the consolidated financial statements.3 Restated to reclassify the profit on disposal of
Mouchel Consulting within discontinued operations. See note 1 to the consolidated financial statements.
costs relating to Hong Kong and the Caribbean. The current order book of £5.0bn is at a record level for secured and probable work and benefited from the inclusion of the additional share of the Smart Motorway and HS2 joint ventures, following the liquidation of Carillion. The order book represents more than 90% of forecast revenue for FY19, on increasing volumes.
UK buildingThe UK regional building business had a good year. The business has experienced an unprecedented volume of contract awards over the last two years, particularly in its core markets and on existing frameworks in the education and health sectors.
The trend for public, and increasingly, private sector clients adopting construction frameworks as the preferred method to procure new work continues, providing long-term visibility of future work. Over 70% of our new work is procured through frameworks. The business secured places on ten construction frameworks in the year, providing access to over £3bn of opportunities. Key framework awards in the period included:
› the ten-year Defence Infrastructure Organisation’s Clyde Commercial Framework (worth up to £750m);
› the four-year Designed for Life Wales Healthcare National & Regional Frameworks (worth up to £500m);
› the four-year Strathclyde University Framework (worth up to £250m); and
› the Department for Work and Pensions Estates Contractor Framework (worth up to £150m).
Innovation continues to play an increasing role in the housebuilding sector and Kier Living is working with its supply chain to develop a digital smart living platform and increase exposure to modern methods of construction to help speed up build and mitigate any potential Brexit impact.
Residential outlookThe UK demand for affordably priced newly built housing remains strong, reinforced by a competitive mortgage market and the Help to Buy incentive. The regional profile of the business outside of London provides a stable environment for private and mixed tenure affordable housebuilding with demand exceeding supply. We have a strong pipeline of £2bn that provides a well-secured position through to FY22. The business continues to perform well and has achieved its Vision 2020 target of 15% ROCE two years early.
Revenue was up 2% to £2,053m (2017: £2,019m) with an underlying operating profit increase of 5% to £41.9m (2017: £39.8m). These results reflect strong revenue growth during the fourth quarter following a decline earlier in the year as a result of slower site starts and adverse weather. The fourth quarter performance resulted in a strong working capital improvement in the second half of the year which mitigated the effect of ongoing negotiations on a health sector project in the south east of England. Underlying operating margins were maintained at 2.0% (2017: 2.0%) after incurring the final exit
46 Kier Group plc | Report and Accounts 2018
Education remains a leading sector for the division generating more than £700m revenue per annum of which the majority is delivered through framework arrangements with the Education Skills Funding Agency (ESFA), local authorities, universities and national framework providers such as Scape and the LHC. In the year, positions were secured on ESFA funded schemes which will create over 36,000 pupil places. In the tertiary education sector, universities are developing their accommodation and estate plans which provide new long-term opportunities for Kier.
In the health sector, c.£200m of awards were achieved from the Procure22 framework and more than £1bn of healthcare opportunities are in the pipeline, underpinned further by the recent Government announcement of additional NHS funding. We continue to progress a range of projects in the sector, including one health facility contract, the scope of which has expanded considerably at the request of the client since the original contract was signed. We are in constructive dialogue with that client about the total value of the project.
The business has continued to diversify its presence from the health and education sectors to related complementary sectors such as bioscience and student accommodation. In the industrial sector, Kier is seeing considerable growth with a number of manufacturing opportunities from non-UK based clients looking for new facilities in the Midlands. Other key sectors include defence with the £35m award at MoD Lyneham and a place secured on the ten-year £750m MoD Clyde Commercial Framework in support of the MoD’s future submarine programmes. Further opportunities will be available from the MoD’s future defence estate development requirements and planned capital investment programme. In addition, we continue to support Ministry of Justice projects.
In aviation, new opportunities arising from the Heathrow expansion project and other regional airport growth are expected.
InfrastructureFollowing the publication of the UK National Infrastructure Pipeline in August 2017, key sectors targeted for growth are transport and power and energy where the Group has established credentials and strong relationships.
Our strategy is to focus on projects that deliver sustainable margins and positive cash flow as well as an appropriate risk profile.
The business maintained its position as the lead supplier to Highways England. Following Carillion’s liquidation, its work on the M6 junctions 16 – 19 has transferred to Kier, complementing other Smart Motorway work on the M6 junctions 13 – 15, the M20 and M23. A rationalisation of suppliers on the Smart Motorways programme is underway and Kier is well positioned to continue to be involved.
In transport, the £43m A13 contract commenced and work continues on HS2 where pricing models have been submitted to Government. Works are on schedule to complete during this financial year the Kier Farringdon Crossrail project, despite the broader Crossrail delays. The Mersey Gateway project, which has been challenging, was completed in October 2017 when the bridge opened to traffic. The final landscaping and post completion works are due to complete in 2019 as scheduled. Final account discussions continue whilst a number of claims against third parties are being progressed.
Following the successful integration of McNicholas and utilising our combined rail capabilities, numerous schemes in the power and signalling arena resulting from CP6 are being reviewed whilst delivery of existing Network Rail CP5 contracts are ongoing. Work has commenced on the £120m Luton DART link joint venture.
In the power and energy markets, work is ongoing at Hinkley Point C with additional projects coming on stream. Key targets in this sector include future opportunities in Sizewell C and Wylfa.
InternationalIn the Middle East, operations continue to focus on the United Arab Emirates (UAE) market. A selective approach to bidding has been adopted focusing on UK Export Finance (UKEF) opportunities.
In the year, the five-star Saadiyat Rotana hotel has opened and infrastructure projects for Meraas and Nshama were completed. Ongoing projects include our two Nshama residential projects, the Bluewaters residential and infrastructure work and the Dubai Arena and the Dubai Harbour infrastructure projects.
Construction outlookThe business delivered a consistent 2% operating margin, has a record order book of £5.0bn and has more than 90% of forecast revenue secured for FY19. The business is performing well, driven by its regional office presence, its position on frameworks, growth in infrastructure investment, split of private and public sector clients and sector mix. Frameworks continue to be the preferred method for procurement by the public sector and Kier has a strong pipeline of framework bid opportunities coming to market over the next six months. With established health sector credentials, the Group is well positioned to benefit from the impact of the additional Government investment in the NHS. The infrastructure business provides good medium-term prospects with a solid track record and strong client relationships in its key sectors, for example transport and nuclear in which new opportunities will arise. Increased car usage is seeing new Smart Motorway opportunities coming on stream. The Smart Motorway Programme has significant investment planned over the next five years with the next procurement tranche commencing in late 2018.
Strategic R
eportG
overnanceFinancial S
tatements
Kier Group plc | Report and Accounts 2018 47
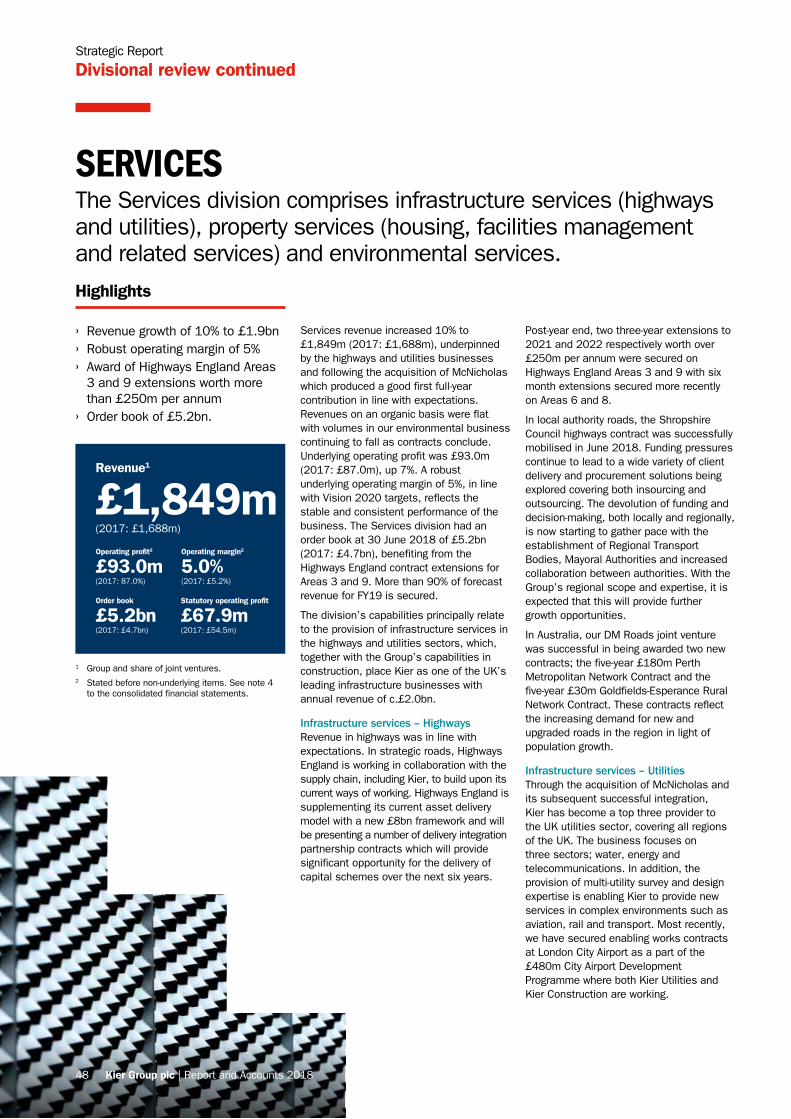
Strategic Report
Divisional review continued
Post-year end, two three-year extensions to 2021 and 2022 respectively worth over £250m per annum were secured on Highways England Areas 3 and 9 with six month extensions secured more recently on Areas 6 and 8.
In local authority roads, the Shropshire Council highways contract was successfully mobilised in June 2018. Funding pressures continue to lead to a wide variety of client delivery and procurement solutions being explored covering both insourcing and outsourcing. The devolution of funding and decision-making, both locally and regionally, is now starting to gather pace with the establishment of Regional Transport Bodies, Mayoral Authorities and increased collaboration between authorities. With the Group’s regional scope and expertise, it is expected that this will provide further growth opportunities.
In Australia, our DM Roads joint venture was successful in being awarded two new contracts; the five-year £180m Perth Metropolitan Network Contract and the five-year £30m Goldfields-Esperance Rural Network Contract. These contracts reflect the increasing demand for new and upgraded roads in the region in light of population growth.
Infrastructure services – Utilities Through the acquisition of McNicholas and its subsequent successful integration, Kier has become a top three provider to the UK utilities sector, covering all regions of the UK. The business focuses on three sectors; water, energy and telecommunications. In addition, the provision of multi-utility survey and design expertise is enabling Kier to provide new services in complex environments such as aviation, rail and transport. Most recently, we have secured enabling works contracts at London City Airport as a part of the £480m City Airport Development Programme where both Kier Utilities and Kier Construction are working.
Services revenue increased 10% to £1,849m (2017: £1,688m), underpinned by the highways and utilities businesses and following the acquisition of McNicholas which produced a good first full-year contribution in line with expectations. Revenues on an organic basis were flat with volumes in our environmental business continuing to fall as contracts conclude. Underlying operating profit was £93.0m (2017: £87.0m), up 7%. A robust underlying operating margin of 5%, in line with Vision 2020 targets, reflects the stable and consistent performance of the business. The Services division had an order book at 30 June 2018 of £5.2bn (2017: £4.7bn), benefiting from the Highways England contract extensions for Areas 3 and 9. More than 90% of forecast revenue for FY19 is secured.
The division’s capabilities principally relate to the provision of infrastructure services in the highways and utilities sectors, which, together with the Group’s capabilities in construction, place Kier as one of the UK’s leading infrastructure businesses with annual revenue of c.£2.0bn.
Infrastructure services – HighwaysRevenue in highways was in line with expectations. In strategic roads, Highways England is working in collaboration with the supply chain, including Kier, to build upon its current ways of working. Highways England is supplementing its current asset delivery model with a new £8bn framework and will be presenting a number of delivery integration partnership contracts which will provide significant opportunity for the delivery of capital schemes over the next six years.
› Revenue growth of 10% to £1.9bn › Robust operating margin of 5% › Award of Highways England Areas 3 and 9 extensions worth more than £250m per annum
› Order book of £5.2bn.
Highlights
SERVICES The Services division comprises infrastructure services (highways and utilities), property services (housing, facilities management and related services) and environmental services.
Revenue1
£1,849m(2017: £1,688m)
Operating profit2
£93.0m(2017: 87.0%)
Order book
£5.2bn(2017: £4.7bn)
Operating margin2
5.0%(2017: £5.2%)
Statutory operating profit
£67.9m(2017: £54.5m)
1 Group and share of joint ventures.2 Stated before non-underlying items. See note 4
to the consolidated financial statements.
48 Kier Group plc | Report and Accounts 2018
In the water sector, procurement for the upcoming AMP7 regulatory period is underway and we are engaging with both new and existing clients on their requirements through their bid processes. In August 2018, Kier was appointed as one of four framework partners carrying out the £45m mechanical and electrical services (MEICA) programme of works to service the three-year requirements of South West Water.
In the power sector, the Group has secured an initial three-year contract with Western Power Distribution to the value of around £30m per year, covering areas in the West and East Midlands. In Northern Ireland, the five-year £35m SGN natural gas eight towns distribution framework has recently been mobilised. The new regulatory period commences in 2021 and early engagement with prospective clients has commenced.
In telecommunications, the market remains buoyant with a number of new alternative fibre providers coming into the market on the back of Government incentives and it is anticipated that further work for Kier will arise. A three-year £100m contract was secured with Gigaclear to build high-speed fibre networks in Devon and Somerset. Kier maintains its position as the single biggest supplier to Virgin Media for both consumer and business connections, network build and maintenance activities.
Infrastructure services outlookThe outlook for our highways maintenance business remains positive with Highways England funding secured through to the end of the £17bn Roads Investment Strategy 1 (RIS1) in 2020 and predicted future funding levels expected to increase. The outlook remains positive for Australia with our key clients in Western Australia and New South Wales increasing spending to meet the predicted population growth.
The integration of McNicholas has enhanced the Group’s breadth of capability in the utilities market and it is expected that new opportunities will arise from the developments in energy generation and storage, particularly following the introduction of EVs and smart infrastructure. The telecommunications market is also growing.
Property services – Housing maintenanceThe housing maintenance sector continues to undergo significant change following budgetary challenges faced by local authorities and the impact of Grenfell. Consequently, the business has extended its mix of clients with increasing focus on housing associations and private sector clients. This change has resulted in a number of new awards and extensions including three new contracts replacing incumbent suppliers. With an increased focus on fire risk assessments, the business has strengthened its capability in this field.
On 29 June 2018 the disposal of Wheldon Contracts and Services Limited for a total consideration of up to £0.4m. It was acquired in July 2017 as part of the McNicholas acquisition.
Property services – Facilities management The Property services team continues to maintain its profile in the public and private sectors. During the year, new contracts were mobilised with the British Red Cross, the Home Office, Moorland and High Peak Councils and The Office Group. On 17 September 2018, the Group exchanged contracts for the sale of its pension administration business, acquired with the Mouchel acquisition. Completion is expected in the first half of this financial year for a total consideration of up to £3.5 million in cash.
Property Services outlookWith continuing pressure on public sector budgets, the merger of housing associations and a greater focus on fire risk compliance, challenges as well as opportunities remain in this sector. The growth of the private rental sector is providing new opportunities for the housing maintenance business.
Environmental ServicesThe operational performance of the environmental services business is stable whilst markets remain challenging as a result of low recyclate prices. The Group is negotiating the termination of one major contract in this business and will continue to reduce its exposure to this market as contracts conclude.
Services outlookThe Services division, which accounts for approximately 50% of the Group’s profits, is performing well. Having secured more than £1.9bn of new work in the year, the Services division now has an order book of £5.2bn providing strong, long-term visibility of our workload and more than 90% of its forecast revenue for FY19.
The market for UK infrastructure construction and maintenance is forecast to grow at 6% per annum until 2020 underpinned by fundamental drivers and political consensus for the continuing investment to stimulate the UK economy and targeted regional economies.
It is also anticipated in Highways that expenditure in the new 2020-2025 RIS2 will be greater than RIS1. The utilities market provides opportunities to grow in the run-up to each new regulatory period. We remain confident that we are well positioned to take advantage of the next round of highways, water and rail regulatory review periods.
Strategic R
eportG
overnanceFinancial S
tatements
Kier Group plc | Report and Accounts 2018 49
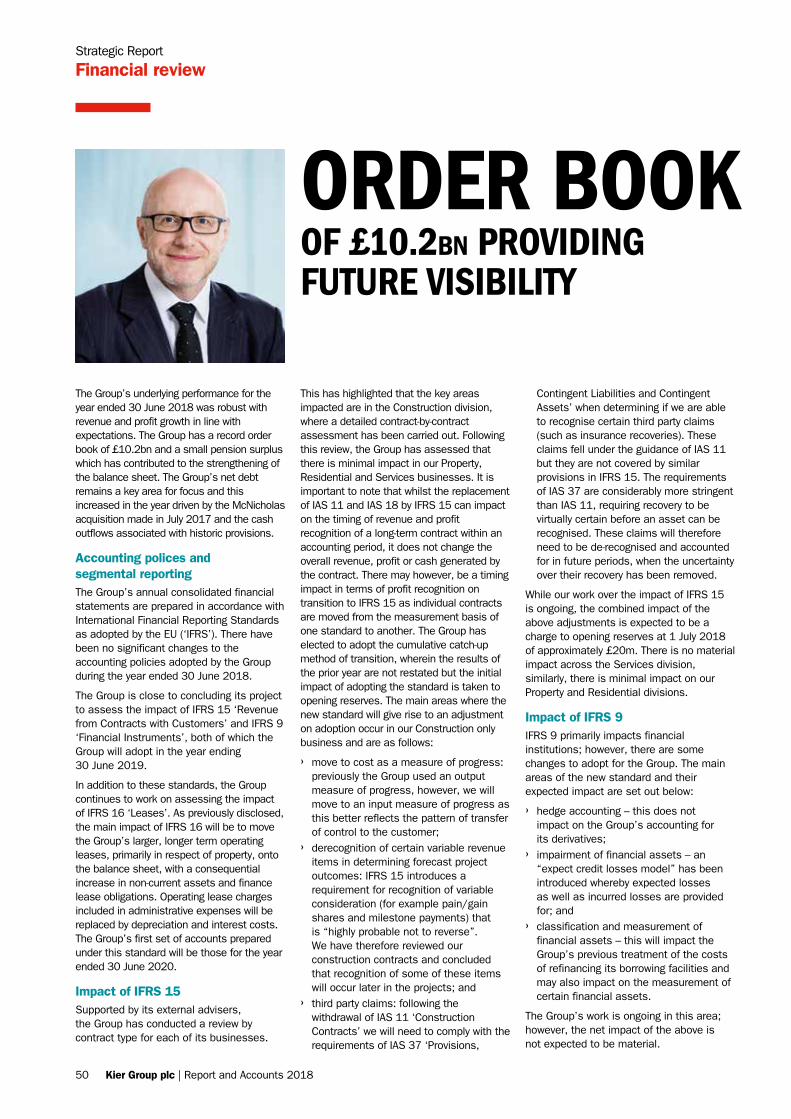
Strategic Report
Financial review
ORDER BOOKOF £10.2bn PROVIDING FUTURE VISIBILITY
The Group’s underlying performance for the year ended 30 June 2018 was robust with revenue and profit growth in line with expectations. The Group has a record order book of £10.2bn and a small pension surplus which has contributed to the strengthening of the balance sheet. The Group’s net debt remains a key area for focus and this increased in the year driven by the McNicholas acquisition made in July 2017 and the cash outflows associated with historic provisions.
Accounting polices and segmental reportingThe Group’s annual consolidated financial statements are prepared in accordance with International Financial Reporting Standards as adopted by the EU (‘IFRS’). There have been no significant changes to the accounting policies adopted by the Group during the year ended 30 June 2018.
The Group is close to concluding its project to assess the impact of IFRS 15 ‘Revenue from Contracts with Customers’ and IFRS 9 ‘Financial Instruments’, both of which the Group will adopt in the year ending 30 June 2019.
In addition to these standards, the Group continues to work on assessing the impact of IFRS 16 ‘Leases’. As previously disclosed, the main impact of IFRS 16 will be to move the Group’s larger, longer term operating leases, primarily in respect of property, onto the balance sheet, with a consequential increase in non-current assets and finance lease obligations. Operating lease charges included in administrative expenses will be replaced by depreciation and interest costs. The Group’s first set of accounts prepared under this standard will be those for the year ended 30 June 2020.
Impact of IFRS 15 Supported by its external advisers, the Group has conducted a review by contract type for each of its businesses.
This has highlighted that the key areas impacted are in the Construction division, where a detailed contract-by-contract assessment has been carried out. Following this review, the Group has assessed that there is minimal impact in our Property, Residential and Services businesses. It is important to note that whilst the replacement of IAS 11 and IAS 18 by IFRS 15 can impact on the timing of revenue and profit recognition of a long-term contract within an accounting period, it does not change the overall revenue, profit or cash generated by the contract. There may however, be a timing impact in terms of profit recognition on transition to IFRS 15 as individual contracts are moved from the measurement basis of one standard to another. The Group has elected to adopt the cumulative catch-up method of transition, wherein the results of the prior year are not restated but the initial impact of adopting the standard is taken to opening reserves. The main areas where the new standard will give rise to an adjustment on adoption occur in our Construction only business and are as follows:
› move to cost as a measure of progress: previously the Group used an output measure of progress, however, we will move to an input measure of progress as this better reflects the pattern of transfer of control to the customer;
› derecognition of certain variable revenue items in determining forecast project outcomes: IFRS 15 introduces a requirement for recognition of variable consideration (for example pain/gain shares and milestone payments) that is “highly probable not to reverse”. We have therefore reviewed our construction contracts and concluded that recognition of some of these items will occur later in the projects; and
› third party claims: following the withdrawal of IAS 11 ‘Construction Contracts’ we will need to comply with the requirements of IAS 37 ‘Provisions,
Contingent Liabilities and Contingent Assets’ when determining if we are able to recognise certain third party claims (such as insurance recoveries). These claims fell under the guidance of IAS 11 but they are not covered by similar provisions in IFRS 15. The requirements of IAS 37 are considerably more stringent than IAS 11, requiring recovery to be virtually certain before an asset can be recognised. These claims will therefore need to be de-recognised and accounted for in future periods, when the uncertainty over their recovery has been removed.
While our work over the impact of IFRS 15 is ongoing, the combined impact of the above adjustments is expected to be a charge to opening reserves at 1 July 2018 of approximately £20m. There is no material impact across the Services division, similarly, there is minimal impact on our Property and Residential divisions.
Impact of IFRS 9IFRS 9 primarily impacts financial institutions; however, there are some changes to adopt for the Group. The main areas of the new standard and their expected impact are set out below:
› hedge accounting – this does not impact on the Group’s accounting for its derivatives;
› impairment of financial assets – an “expect credit losses model” has been introduced whereby expected losses as well as incurred losses are provided for; and
› classification and measurement of financial assets – this will impact the Group’s previous treatment of the costs of refinancing its borrowing facilities and may also impact on the measurement of certain financial assets.
The Group’s work is ongoing in this area; however, the net impact of the above is not expected to be material.
50 Kier Group plc | Report and Accounts 2018
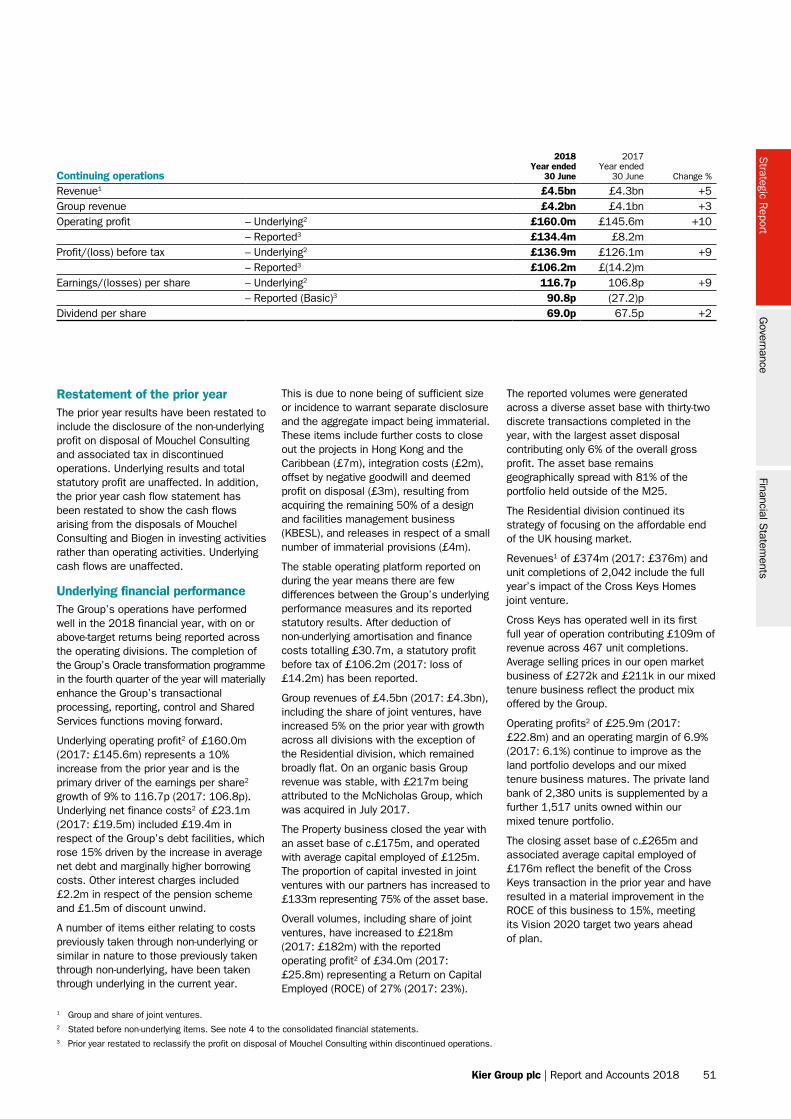
Restatement of the prior yearThe prior year results have been restated to include the disclosure of the non-underlying profit on disposal of Mouchel Consulting and associated tax in discontinued operations. Underlying results and total statutory profit are unaffected. In addition, the prior year cash flow statement has been restated to show the cash flows arising from the disposals of Mouchel Consulting and Biogen in investing activities rather than operating activities. Underlying cash flows are unaffected.
Underlying financial performanceThe Group’s operations have performed well in the 2018 financial year, with on or above-target returns being reported across the operating divisions. The completion of the Group’s Oracle transformation programme in the fourth quarter of the year will materially enhance the Group’s transactional processing, reporting, control and Shared Services functions moving forward.
Underlying operating profit2 of £160.0m (2017: £145.6m) represents a 10% increase from the prior year and is the primary driver of the earnings per share2 growth of 9% to 116.7p (2017: 106.8p). Underlying net finance costs2 of £23.1m (2017: £19.5m) included £19.4m in respect of the Group’s debt facilities, which rose 15% driven by the increase in average net debt and marginally higher borrowing costs. Other interest charges included £2.2m in respect of the pension scheme and £1.5m of discount unwind.
A number of items either relating to costs previously taken through non-underlying or similar in nature to those previously taken through non-underlying, have been taken through underlying in the current year.
This is due to none being of sufficient size or incidence to warrant separate disclosure and the aggregate impact being immaterial. These items include further costs to close out the projects in Hong Kong and the Caribbean (£7m), integration costs (£2m), offset by negative goodwill and deemed profit on disposal (£3m), resulting from acquiring the remaining 50% of a design and facilities management business (KBESL), and releases in respect of a small number of immaterial provisions (£4m).
The stable operating platform reported on during the year means there are few differences between the Group’s underlying performance measures and its reported statutory results. After deduction of non-underlying amortisation and finance costs totalling £30.7m, a statutory profit before tax of £106.2m (2017: loss of £14.2m) has been reported.
Group revenues of £4.5bn (2017: £4.3bn), including the share of joint ventures, have increased 5% on the prior year with growth across all divisions with the exception of the Residential division, which remained broadly flat. On an organic basis Group revenue was stable, with £217m being attributed to the McNicholas Group, which was acquired in July 2017.
The Property business closed the year with an asset base of c.£175m, and operated with average capital employed of £125m. The proportion of capital invested in joint ventures with our partners has increased to £133m representing 75% of the asset base.
Overall volumes, including share of joint ventures, have increased to £218m (2017: £182m) with the reported operating profit2 of £34.0m (2017: £25.8m) representing a Return on Capital Employed (ROCE) of 27% (2017: 23%).
The reported volumes were generated across a diverse asset base with thirty-two discrete transactions completed in the year, with the largest asset disposal contributing only 6% of the overall gross profit. The asset base remains geographically spread with 81% of the portfolio held outside of the M25.
The Residential division continued its strategy of focusing on the affordable end of the UK housing market.
Revenues1 of £374m (2017: £376m) and unit completions of 2,042 include the full year’s impact of the Cross Keys Homes joint venture.
Cross Keys has operated well in its first full year of operation contributing £109m of revenue across 467 unit completions. Average selling prices in our open market business of £272k and £211k in our mixed tenure business reflect the product mix offered by the Group.
Operating profits2 of £25.9m (2017: £22.8m) and an operating margin of 6.9% (2017: 6.1%) continue to improve as the land portfolio develops and our mixed tenure business matures. The private land bank of 2,380 units is supplemented by a further 1,517 units owned within our mixed tenure portfolio.
The closing asset base of c.£265m and associated average capital employed of £176m reflect the benefit of the Cross Keys transaction in the prior year and have resulted in a material improvement in the ROCE of this business to 15%, meeting its Vision 2020 target two years ahead of plan.
Continuing operations
2018 Year ended
30 June
2017 Year ended
30 June Change %
Revenue1 £4.5bn £4.3bn +5Group revenue £4.2bn £4.1bn +3Operating profit – Underlying2 £160.0m £145.6m +10 – Reported3 £134.4m £8.2m Profit/(loss) before tax – Underlying2 £136.9m £126.1m +9 – Reported3 £106.2m £(14.2)m Earnings/(losses) per share – Underlying2 116.7p 106.8p +9 – Reported (Basic)3 90.8p (27.2)p Dividend per share 69.0p 67.5p +2
1 Group and share of joint ventures.2 Stated before non-underlying items. See note 4 to the consolidated financial statements.3 Prior year restated to reclassify the profit on disposal of Mouchel Consulting within discontinued operations.
Strategic R
eportG
overnanceFinancial S
tatements
Kier Group plc | Report and Accounts 2018 51
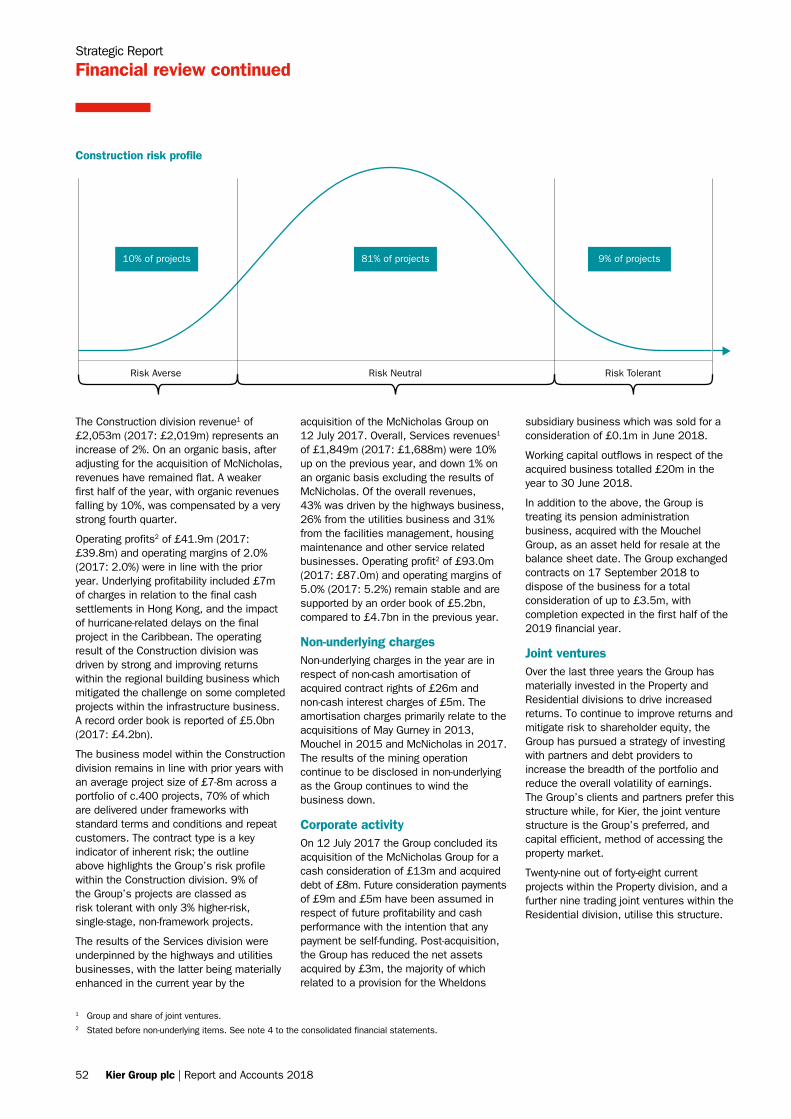
Strategic Report
Financial review continued
The Construction division revenue1 of £2,053m (2017: £2,019m) represents an increase of 2%. On an organic basis, after adjusting for the acquisition of McNicholas, revenues have remained flat. A weaker first half of the year, with organic revenues falling by 10%, was compensated by a very strong fourth quarter.
Operating profits2 of £41.9m (2017: £39.8m) and operating margins of 2.0% (2017: 2.0%) were in line with the prior year. Underlying profitability included £7m of charges in relation to the final cash settlements in Hong Kong, and the impact of hurricane-related delays on the final project in the Caribbean. The operating result of the Construction division was driven by strong and improving returns within the regional building business which mitigated the challenge on some completed projects within the infrastructure business. A record order book is reported of £5.0bn (2017: £4.2bn).
The business model within the Construction division remains in line with prior years with an average project size of £7-8m across a portfolio of c.400 projects, 70% of which are delivered under frameworks with standard terms and conditions and repeat customers. The contract type is a key indicator of inherent risk; the outline above highlights the Group’s risk profile within the Construction division. 9% of the Group’s projects are classed as risk tolerant with only 3% higher-risk, single-stage, non-framework projects.
The results of the Services division were underpinned by the highways and utilities businesses, with the latter being materially enhanced in the current year by the
Risk Averse Risk Neutral Risk Tolerant
10% of projects 81% of projects 9% of projects
Construction risk profile
acquisition of the McNicholas Group on 12 July 2017. Overall, Services revenues1 of £1,849m (2017: £1,688m) were 10% up on the previous year, and down 1% on an organic basis excluding the results of McNicholas. Of the overall revenues, 43% was driven by the highways business, 26% from the utilities business and 31% from the facilities management, housing maintenance and other service related businesses. Operating profit2 of £93.0m (2017: £87.0m) and operating margins of 5.0% (2017: 5.2%) remain stable and are supported by an order book of £5.2bn, compared to £4.7bn in the previous year.
Non-underlying chargesNon-underlying charges in the year are in respect of non-cash amortisation of acquired contract rights of £26m and non-cash interest charges of £5m. The amortisation charges primarily relate to the acquisitions of May Gurney in 2013, Mouchel in 2015 and McNicholas in 2017. The results of the mining operation continue to be disclosed in non-underlying as the Group continues to wind the business down.
Corporate activityOn 12 July 2017 the Group concluded its acquisition of the McNicholas Group for a cash consideration of £13m and acquired debt of £8m. Future consideration payments of £9m and £5m have been assumed in respect of future profitability and cash performance with the intention that any payment be self-funding. Post-acquisition, the Group has reduced the net assets acquired by £3m, the majority of which related to a provision for the Wheldons
subsidiary business which was sold for a consideration of £0.1m in June 2018.
Working capital outflows in respect of the acquired business totalled £20m in the year to 30 June 2018.
In addition to the above, the Group is treating its pension administration business, acquired with the Mouchel Group, as an asset held for resale at the balance sheet date. The Group exchanged contracts on 17 September 2018 to dispose of the business for a total consideration of up to £3.5m, with completion expected in the first half of the 2019 financial year.
Joint venturesOver the last three years the Group has materially invested in the Property and Residential divisions to drive increased returns. To continue to improve returns and mitigate risk to shareholder equity, the Group has pursued a strategy of investing with partners and debt providers to increase the breadth of the portfolio and reduce the overall volatility of earnings. The Group’s clients and partners prefer this structure while, for Kier, the joint venture structure is the Group’s preferred, and capital efficient, method of accessing the property market.
Twenty-nine out of forty-eight current projects within the Property division, and a further nine trading joint ventures within the Residential division, utilise this structure.
1 Group and share of joint ventures.2 Stated before non-underlying items. See note 4 to the consolidated financial statements.
52 Kier Group plc | Report and Accounts 2018
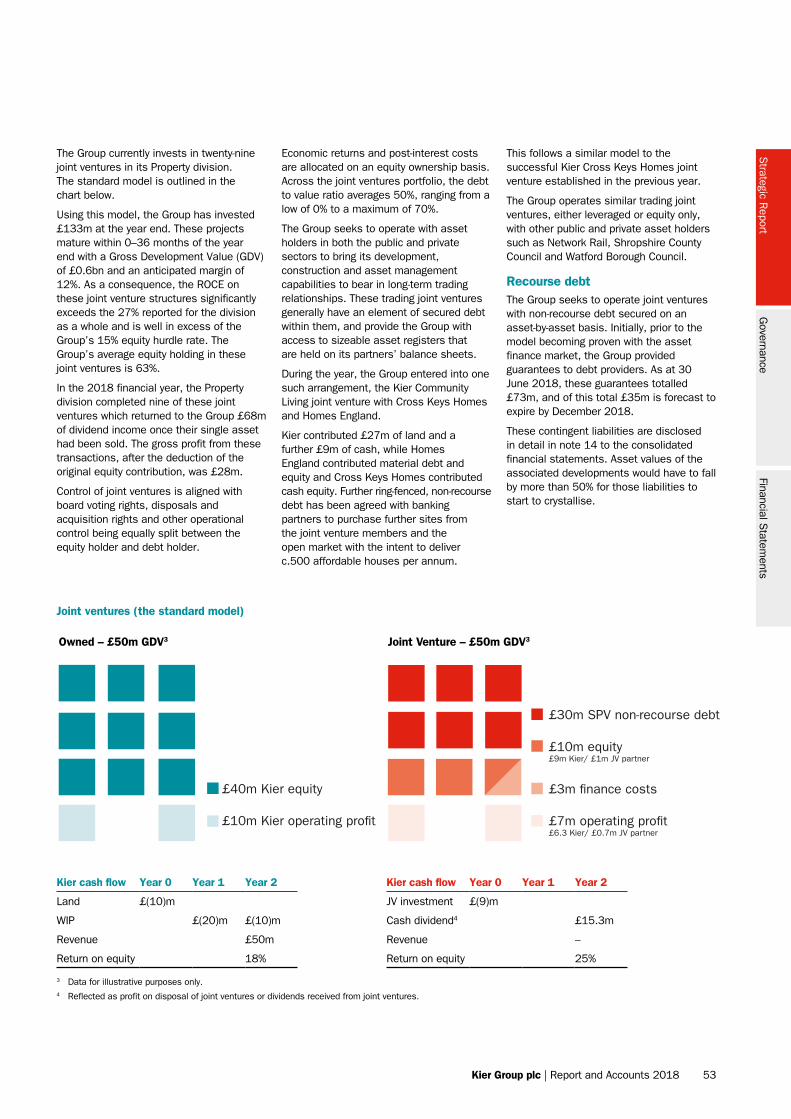
The Group currently invests in twenty-nine joint ventures in its Property division. The standard model is outlined in the chart below.
Using this model, the Group has invested £133m at the year end. These projects mature within 0–36 months of the year end with a Gross Development Value (GDV) of £0.6bn and an anticipated margin of 12%. As a consequence, the ROCE on these joint venture structures significantly exceeds the 27% reported for the division as a whole and is well in excess of the Group’s 15% equity hurdle rate. The Group’s average equity holding in these joint ventures is 63%.
In the 2018 financial year, the Property division completed nine of these joint ventures which returned to the Group £68m of dividend income once their single asset had been sold. The gross profit from these transactions, after the deduction of the original equity contribution, was £28m.
Control of joint ventures is aligned with board voting rights, disposals and acquisition rights and other operational control being equally split between the equity holder and debt holder.
Economic returns and post-interest costs are allocated on an equity ownership basis. Across the joint ventures portfolio, the debt to value ratio averages 50%, ranging from a low of 0% to a maximum of 70%.
The Group seeks to operate with asset holders in both the public and private sectors to bring its development, construction and asset management capabilities to bear in long-term trading relationships. These trading joint ventures generally have an element of secured debt within them, and provide the Group with access to sizeable asset registers that are held on its partners’ balance sheets.
During the year, the Group entered into one such arrangement, the Kier Community Living joint venture with Cross Keys Homes and Homes England.
Kier contributed £27m of land and a further £9m of cash, while Homes England contributed material debt and equity and Cross Keys Homes contributed cash equity. Further ring-fenced, non-recourse debt has been agreed with banking partners to purchase further sites from the joint venture members and the open market with the intent to deliver c.500 affordable houses per annum.
Joint ventures (the standard model)
£40m Kier equity
£10m Kier operating pro�t
£30m SPV non-recourse debt
£10m equity£9m Kier/ £1m JV partner
£3m �nance costs
£7m operating pro�t£6.3 Kier/ £0.7m JV partner
Owned – £50m GDV3 Joint Venture – £50m GDV3
Kier cash flow Year 0 Year 1 Year 2 Kier cash flow Year 0 Year 1 Year 2
Land £(10)m JV investment £(9)m
WIP £(20)m £(10)m Cash dividend4 £15.3m
Revenue £50m Revenue –
Return on equity 18% Return on equity 25%
3 Data for illustrative purposes only.4 Reflected as profit on disposal of joint ventures or dividends received from joint ventures.
This follows a similar model to the successful Kier Cross Keys Homes joint venture established in the previous year.
The Group operates similar trading joint ventures, either leveraged or equity only, with other public and private asset holders such as Network Rail, Shropshire County Council and Watford Borough Council.
Recourse debtThe Group seeks to operate joint ventures with non-recourse debt secured on an asset-by-asset basis. Initially, prior to the model becoming proven with the asset finance market, the Group provided guarantees to debt providers. As at 30 June 2018, these guarantees totalled £73m, and of this total £35m is forecast to expire by December 2018.
These contingent liabilities are disclosed in detail in note 14 to the consolidated financial statements. Asset values of the associated developments would have to fall by more than 50% for those liabilities to start to crystallise.
Strategic R
eportG
overnance
Kier Group plc | Report and Accounts 2018 53
Financial Statem
ents
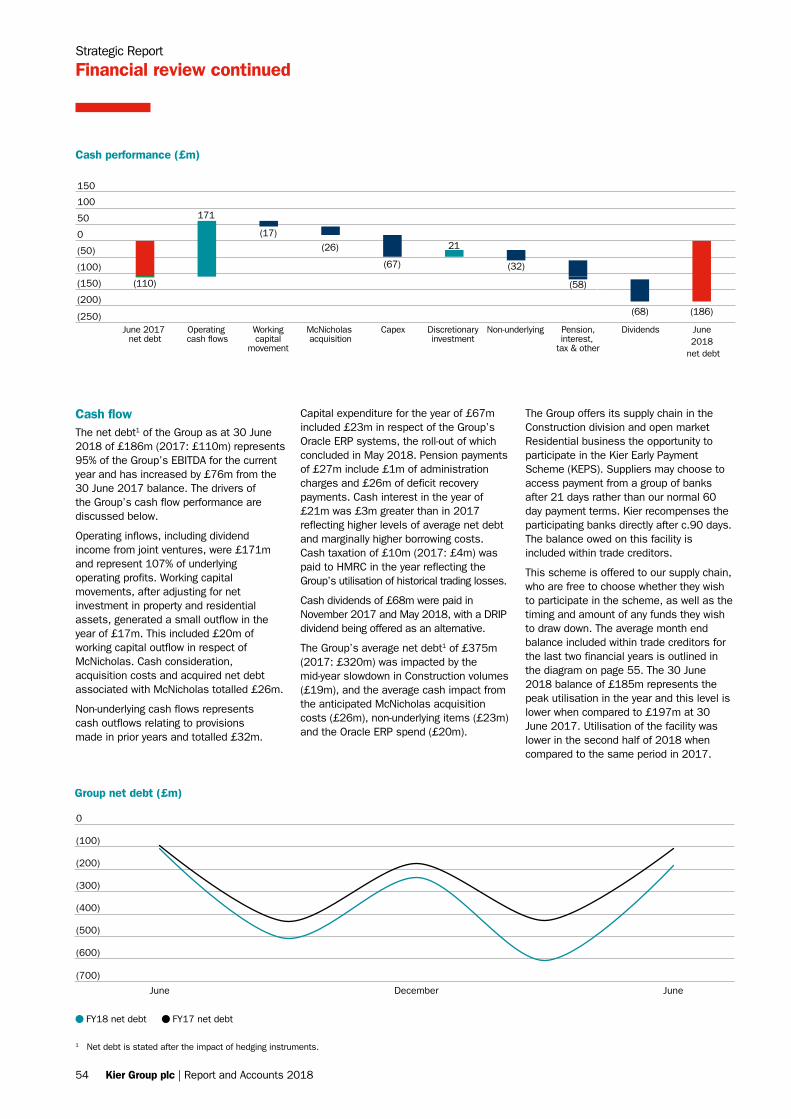
Cash flowThe net debt1 of the Group as at 30 June 2018 of £186m (2017: £110m) represents 95% of the Group’s EBITDA for the current year and has increased by £76m from the 30 June 2017 balance. The drivers of the Group’s cash flow performance are discussed below.
Operating inflows, including dividend income from joint ventures, were £171m and represent 107% of underlying operating profits. Working capital movements, after adjusting for net investment in property and residential assets, generated a small outflow in the year of £17m. This included £20m of working capital outflow in respect of McNicholas. Cash consideration, acquisition costs and acquired net debt associated with McNicholas totalled £26m.
Non-underlying cash flows represents cash outflows relating to provisions made in prior years and totalled £32m.
Capital expenditure for the year of £67m included £23m in respect of the Group’s Oracle ERP systems, the roll-out of which concluded in May 2018. Pension payments of £27m include £1m of administration charges and £26m of deficit recovery payments. Cash interest in the year of £21m was £3m greater than in 2017 reflecting higher levels of average net debt and marginally higher borrowing costs. Cash taxation of £10m (2017: £4m) was paid to HMRC in the year reflecting the Group’s utilisation of historical trading losses.
Cash dividends of £68m were paid in November 2017 and May 2018, with a DRIP dividend being offered as an alternative.
The Group’s average net debt1 of £375m (2017: £320m) was impacted by the mid-year slowdown in Construction volumes (£19m), and the average cash impact from the anticipated McNicholas acquisition costs (£26m), non-underlying items (£23m) and the Oracle ERP spend (£20m).
The Group offers its supply chain in the Construction division and open market Residential business the opportunity to participate in the Kier Early Payment Scheme (KEPS). Suppliers may choose to access payment from a group of banks after 21 days rather than our normal 60 day payment terms. Kier recompenses the participating banks directly after c.90 days. The balance owed on this facility is included within trade creditors.
This scheme is offered to our supply chain, who are free to choose whether they wish to participate in the scheme, as well as the timing and amount of any funds they wish to draw down. The average month end balance included within trade creditors for the last two financial years is outlined in the diagram on page 55. The 30 June 2018 balance of £185m represents the peak utilisation in the year and this level is lower when compared to £197m at 30 June 2017. Utilisation of the facility was lower in the second half of 2018 when compared to the same period in 2017.
Strategic Report
Financial review continued
Group net debt (£m)
FY18 net debt FY17 net debt
June December June
(700)
(600)
(500)
(400)
(300)
(200)
(100)
0
Cash performance (£m)
June 2017 net debt
June2018
net debt
DividendsPension,interest,
tax & other
Non-underlyingMcNicholas acquisition
Discretionaryinvestment
CapexWorkingcapital
movement
Operating cash �ows
171
21(26)
(67) (32)
(58)
(68) (186)
(17)
(110) 67(200)
(250)
(150)
(100)
(50)
0
50
100
150
1 Net debt is stated after the impact of hedging instruments.
54 Kier Group plc | Report and Accounts 2018
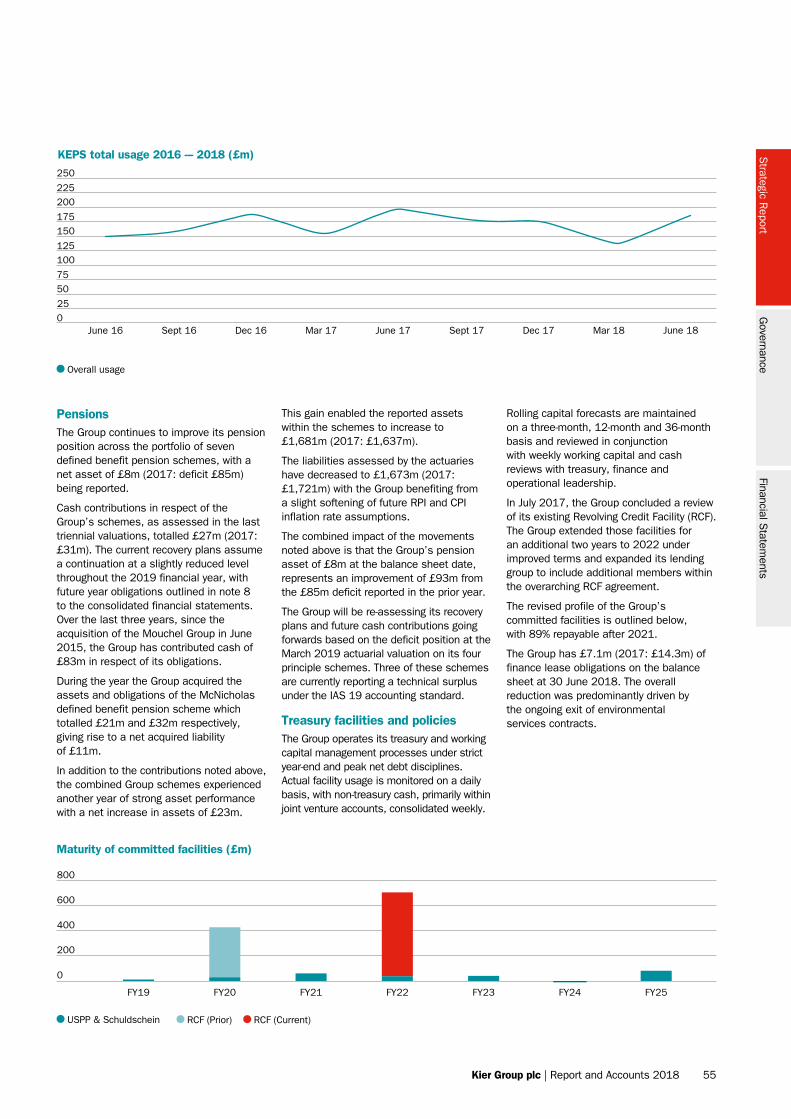
Rolling capital forecasts are maintained on a three-month, 12-month and 36-month basis and reviewed in conjunction with weekly working capital and cash reviews with treasury, finance and operational leadership.
In July 2017, the Group concluded a review of its existing Revolving Credit Facility (RCF). The Group extended those facilities for an additional two years to 2022 under improved terms and expanded its lending group to include additional members within the overarching RCF agreement.
The revised profile of the Group’s committed facilities is outlined below, with 89% repayable after 2021.
The Group has £7.1m (2017: £14.3m) of finance lease obligations on the balance sheet at 30 June 2018. The overall reduction was predominantly driven by the ongoing exit of environmental services contracts.
025
5075
100125
150175
200225
250
KEPS total usage 2016 -– 2018 (£m)
June 16 Sept 16 Dec 16 Mar 17 Sept 17 Dec 17 Mar 18 June 18June 17
Overall usage
PensionsThe Group continues to improve its pension position across the portfolio of seven defined benefit pension schemes, with a net asset of £8m (2017: deficit £85m) being reported.
Cash contributions in respect of the Group’s schemes, as assessed in the last triennial valuations, totalled £27m (2017: £31m). The current recovery plans assume a continuation at a slightly reduced level throughout the 2019 financial year, with future year obligations outlined in note 8 to the consolidated financial statements. Over the last three years, since the acquisition of the Mouchel Group in June 2015, the Group has contributed cash of £83m in respect of its obligations.
During the year the Group acquired the assets and obligations of the McNicholas defined benefit pension scheme which totalled £21m and £32m respectively, giving rise to a net acquired liability of £11m.
In addition to the contributions noted above, the combined Group schemes experienced another year of strong asset performance with a net increase in assets of £23m.
This gain enabled the reported assets within the schemes to increase to £1,681m (2017: £1,637m).
The liabilities assessed by the actuaries have decreased to £1,673m (2017: £1,721m) with the Group benefiting from a slight softening of future RPI and CPI inflation rate assumptions.
The combined impact of the movements noted above is that the Group’s pension asset of £8m at the balance sheet date, represents an improvement of £93m from the £85m deficit reported in the prior year.
The Group will be re-assessing its recovery plans and future cash contributions going forwards based on the deficit position at the March 2019 actuarial valuation on its four principle schemes. Three of these schemes are currently reporting a technical surplus under the IAS 19 accounting standard.
Treasury facilities and policiesThe Group operates its treasury and working capital management processes under strict year-end and peak net debt disciplines. Actual facility usage is monitored on a daily basis, with non-treasury cash, primarily within joint venture accounts, consolidated weekly.
USPP & Schuldschein RCF (Prior) RCF (Current)
0
200
400
600
800
Maturity of committed facilities (£m)
FY20FY19 FY25FY24FY23FY22FY21
Strategic R
eportG
overnanceFinancial S
tatements
Kier Group plc | Report and Accounts 2018 55
Strategic Report
Financial review continued
Viability statementThe Board has assessed the viability of the Group over a three-year period ending 30 June 2021, as it is required to do under the UK Corporate Governance Code. The Board’s statement is set out on page 60. A summary of the work undertaken by management and the RMAC to support this statement is set out on page 76.
Bev DewFinance Director
19 September 2018
Financial instrumentsThe Group’s financial instruments comprise cash and liquid investments. The Group, largely through its PFI and property joint ventures, enters into derivative transactions (principally interest rate swaps) to manage interest rate risks arising from its operations and its sources of finance. The US dollar denominated USPP loan notes have been hedged with fixed cross-currency swaps at inception to mitigate the foreign exchange risk. The Group does not enter into speculative transactions. There are minor foreign currency risks arising from our operations.
The Group has a limited number of international operations in different currencies. Currency exposure to international assets is hedged through inter-company balances and borrowings, so that assets denominated in foreign currencies are matched, as far as possible, by liabilities. Where there may be further exposure to currency fluctuations, forward exchange contracts are completed to buy and sell foreign currency.
Dividend policyThe Board is proposing a final dividend of 46.0 pence per share on the 97m shares in issue. Combined with the interim dividend of 23.0 pence for shares in issue at March 2018, the total dividend declared this year of 69.0 pence (2017: 67.5 pence) represents a 2% increase on the prior year.
Going concernThe Chief Executive’s strategic review highlights the activities of the Group and those factors likely to affect its future development, performance and financial position. These have been carefully considered by the Board in relation to the Group’s ability to operate within its current and foreseeable resources.
The Group has significant financial resources, committed banking facilities, long-term contracts and long-term order books. Within net current liabilities of £(18.7)m, £62.8m of the £226.1m of joint venture assets (presented as non-current under IAS 28 para15) is expected to mature within one year of the balance sheet date. These assets represent property and residential investments that will be sold in the normal course of business. For these reasons, the directors continue to adopt the going concern basis in preparing the Group’s 2018 financial statements. The full going concern statement is set out on page 60. A summary of the work undertaken by management and the Risk Management and Audit Committee (RMAC) to support this statement is set out on page 75.
Haydn MursellChief Executive
19 September 2018
Bev DewFinance Director
This Strategic Report was approved by the Board and signed on its behalf by:
56 Kier Group plc | Report and Accounts 2018
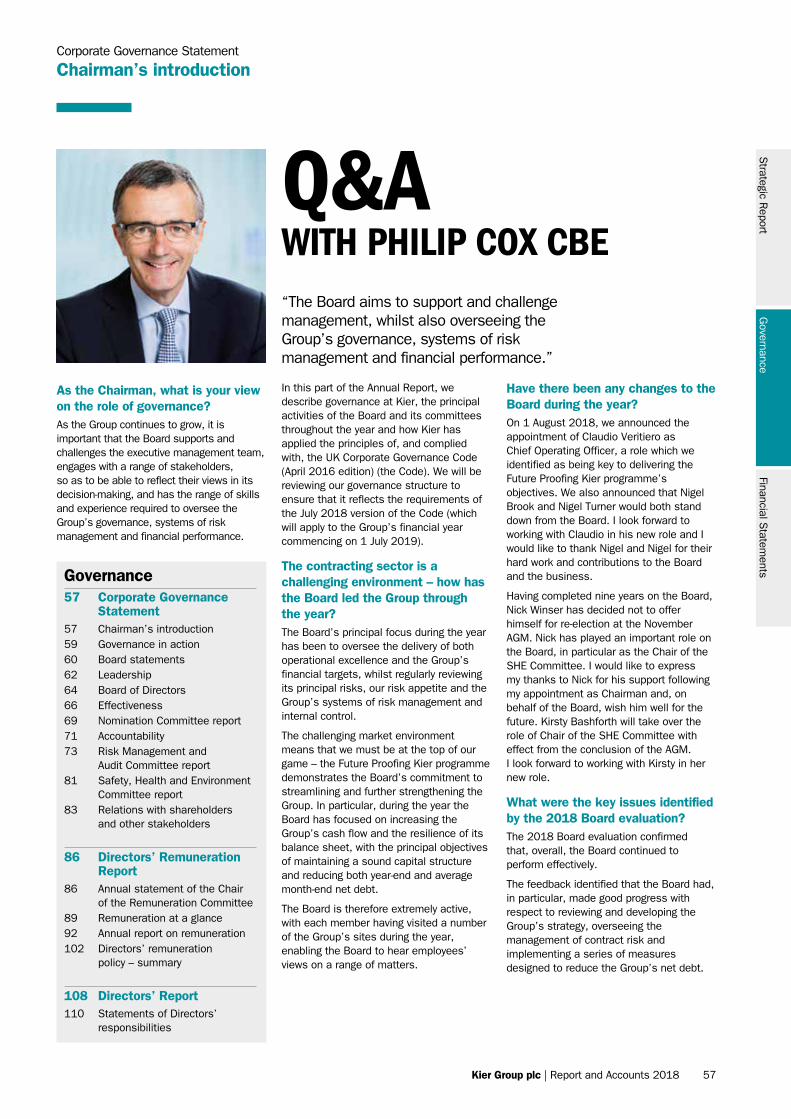
Strategic R
eportG
overnanceFinancial S
tatements
Kier Group plc | Report and Accounts 2018 57
Governance57 Corporate Governance
Statement57 Chairman’s introduction59 Governance in action60 Board statements62 Leadership64 Board of Directors66 Effectiveness69 Nomination Committee report71 Accountability73 Risk Management and
Audit Committee report81 Safety, Health and Environment
Committee report83 Relations with shareholders
and other stakeholders
86 Directors’ Remuneration Report
86 Annual statement of the Chair of the Remuneration Committee
89 Remuneration at a glance92 Annual report on remuneration 102 Directors’ remuneration
policy – summary
108 Directors’ Report110 Statements of Directors’
responsibilities
Corporate Governance Statement
Chairman’s introduction
Q&AWITH PHILIP COX CBE
As the Chairman, what is your view on the role of governance?As the Group continues to grow, it is important that the Board supports and challenges the executive management team, engages with a range of stakeholders, so as to be able to reflect their views in its decision-making, and has the range of skills and experience required to oversee the Group’s governance, systems of risk management and financial performance.
In this part of the Annual Report, we describe governance at Kier, the principal activities of the Board and its committees throughout the year and how Kier has applied the principles of, and complied with, the UK Corporate Governance Code (April 2016 edition) (the Code). We will be reviewing our governance structure to ensure that it reflects the requirements of the July 2018 version of the Code (which will apply to the Group’s financial year commencing on 1 July 2019).
The contracting sector is a challenging environment – how has the Board led the Group through the year?The Board’s principal focus during the year has been to oversee the delivery of both operational excellence and the Group’s financial targets, whilst regularly reviewing its principal risks, our risk appetite and the Group’s systems of risk management and internal control.
The challenging market environment means that we must be at the top of our game – the Future Proofing Kier programme demonstrates the Board’s commitment to streamlining and further strengthening the Group. In particular, during the year the Board has focused on increasing the Group’s cash flow and the resilience of its balance sheet, with the principal objectives of maintaining a sound capital structure and reducing both year-end and average month-end net debt.
The Board is therefore extremely active, with each member having visited a number of the Group’s sites during the year, enabling the Board to hear employees’ views on a range of matters.
Have there been any changes to the Board during the year?On 1 August 2018, we announced the appointment of Claudio Veritiero as Chief Operating Officer, a role which we identified as being key to delivering the Future Proofing Kier programme’s objectives. We also announced that Nigel Brook and Nigel Turner would both stand down from the Board. I look forward to working with Claudio in his new role and I would like to thank Nigel and Nigel for their hard work and contributions to the Board and the business.
Having completed nine years on the Board, Nick Winser has decided not to offer himself for re-election at the November AGM. Nick has played an important role on the Board, in particular as the Chair of the SHE Committee. I would like to express my thanks to Nick for his support following my appointment as Chairman and, on behalf of the Board, wish him well for the future. Kirsty Bashforth will take over the role of Chair of the SHE Committee with effect from the conclusion of the AGM. I look forward to working with Kirsty in her new role.
What were the key issues identified by the 2018 Board evaluation?The 2018 Board evaluation confirmed that, overall, the Board continued to perform effectively.
The feedback identified that the Board had, in particular, made good progress with respect to reviewing and developing the Group’s strategy, overseeing the management of contract risk and implementing a series of measures designed to reduce the Group’s net debt.
“The Board aims to support and challenge management, whilst also overseeing the Group’s governance, systems of risk management and financial performance.”
58 Kier Group plc | Report and Accounts 2018
What engagement with shareholders has the Board had during the year?During the year, I have met a number of shareholders to discuss a range of matters, including the Group’s performance, governance and progress against the Group’s strategy. I have found these meetings useful in assisting me to understand shareholders’ views, which we have then discussed as a board. At the March 2018 meeting, the Board took the opportunity to assess how it engages with shareholders and other key stakeholders, so as to be able to take into account their interests in its decision-making. Other members of the Board (for example, the Chief Executive, the Finance Director and the Senior Independent Director) have also met a number of shareholders during the year and, following their meetings, reported back to the Board on the issues which were discussed.
Further details about the engagement undertaken by the Board with its key stakeholders during the year are set out on pages 83 to 85 (inclusive).
I look forward to meeting shareholders at the AGM on 16 November 2018.
Philip Cox CBEChairman
19 September 2018
Corporate Governance Statement
Chairman’s introduction continued
The Board agreed that its priorities in 2019 would include a continued focus on the reduction of the Group’s net debt, a review of the Vision 2020 goals, developing the pipeline of future Board members, increasing diversity within the business and a continued review of the Group’s risk management processes.
Further details of the 2018 Board evaluation are set out on page 68.
The Board is accountable for the Group’s management of risk. In light of Carillion’s insolvency, how comfortable is the Board that it does so effectively?During the year, the Board reviewed the Group’s principal risks and its overall risk appetite and, through the Risk Management and Audit Committee (RMAC), closely monitored how those risks are managed. By way of example, the Board, through the RMAC, commissioned a review of the Group’s key commercial controls by KPMG, our Internal Auditor at the time, in light of the importance of contract administration to the Group’s operations. The review made a number of proposals to simplify and/or streamline the controls. The Board will oversee management’s development of those controls throughout the 2019 financial year. Further details of how the Group manages risk are set out on pages 36 to 43 (inclusive).
Kier received a significant vote against its Directors’ Remuneration Report at the 2017 AGM. How has the Remuneration Committee taken this into account?The Board was disappointed to receive a significant vote against its 2017 Directors’ Remuneration Report. The Remuneration Committee understands that the principal concern of shareholders related to the increase in the base salary of the Chief Executive with effect from 1 July 2017. The Remuneration Committee took into account this feedback in its decision not to award the Chief Executive an increase in base salary for the 2019 financial year. Details of the decisions taken by the Remuneration Committee during the year are summarised in the Directors’ Remuneration Report on pages 86 to 107 (inclusive).
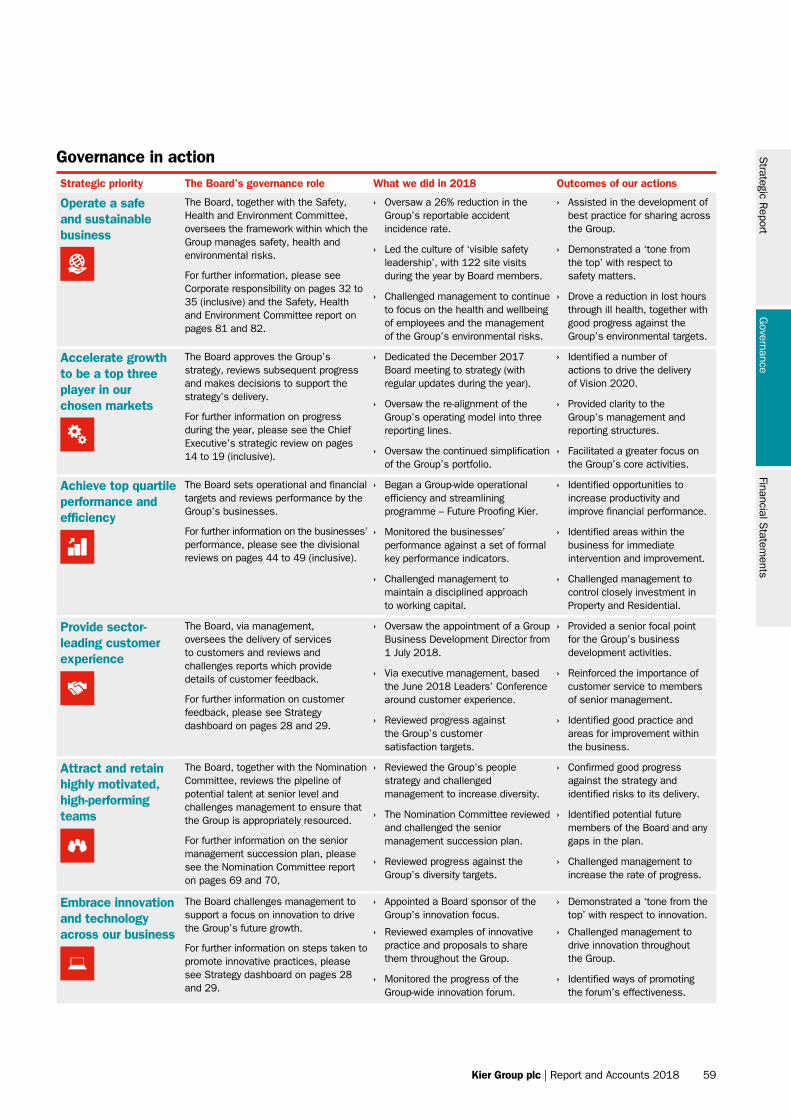
Strategic R
eportG
overnanceFinancial S
tatements
Kier Group plc | Report and Accounts 2018 59
Strategic priority The Board’s governance role What we did in 2018 Outcomes of our actions
Operate a safe and sustainable business
The Board, together with the Safety, Health and Environment Committee, oversees the framework within which the Group manages safety, health and environmental risks.
For further information, please see Corporate responsibility on pages 32 to 35 (inclusive) and the Safety, Health and Environment Committee report on pages 81 and 82.
› Oversaw a 26% reduction in the Group’s reportable accident incidence rate.
› Assisted in the development of best practice for sharing across the Group.
› Led the culture of ‘visible safety leadership’, with 122 site visits during the year by Board members.
› Demonstrated a ‘tone from the top’ with respect to safety matters.
› Challenged management to continue to focus on the health and wellbeing of employees and the management of the Group’s environmental risks.
› Drove a reduction in lost hours through ill health, together with good progress against the Group’s environmental targets.
Accelerate growth to be a top three player in our chosen markets
The Board approves the Group’s strategy, reviews subsequent progress and makes decisions to support the strategy’s delivery.
For further information on progress during the year, please see the Chief Executive’s strategic review on pages 14 to 19 (inclusive).
› Dedicated the December 2017 Board meeting to strategy (with regular updates during the year).
› Identified a number of actions to drive the delivery of Vision 2020.
› Oversaw the re-alignment of the Group’s operating model into three reporting lines.
› Provided clarity to the Group’s management and reporting structures .
› Oversaw the continued simplification of the Group’s portfolio.
› Facilitated a greater focus on the Group’s core activities.
Achieve top quartile performance and efficiency
The Board sets operational and financial targets and reviews performance by the Group’s businesses.
For further information on the businesses’ performance, please see the divisional reviews on pages 44 to 49 (inclusive).
› Began a Group-wide operational efficiency and streamlining programme – Future Proofing Kier.
› Identified opportunities to increase productivity and improve financial performance.
› Monitored the businesses’ performance against a set of formal key performance indicators.
› Identified areas within the business for immediate intervention and improvement.
› Challenged management to maintain a disciplined approach to working capital.
› Challenged management to control closely investment in Property and Residential.
Provide sector-leading customer experience
The Board, via management, oversees the delivery of services to customers and reviews and challenges reports which provide details of customer feedback.
For further information on customer feedback, please see Strategy dashboard on pages 28 and 29.
› Oversaw the appointment of a Group Business Development Director from 1 July 2018.
› Provided a senior focal point for the Group’s business development activities.
› Via executive management, based the June 2018 Leaders’ Conference around customer experience.
› Reinforced the importance of customer service to members of senior management.
› Reviewed progress against the Group’s customer satisfaction targets.
› Identified good practice and areas for improvement within the business.
Attract and retain highly motivated, high-performing teams
The Board, together with the Nomination Committee, reviews the pipeline of potential talent at senior level and challenges management to ensure that the Group is appropriately resourced.
For further information on the senior management succession plan, please see the Nomination Committee report on pages 69 and 70.
› Reviewed the Group’s people strategy and challenged management to increase diversity.
› Confirmed good progress against the strategy and identified risks to its delivery.
› The Nomination Committee reviewed and challenged the senior management succession plan.
› Identified potential future members of the Board and any gaps in the plan.
› Reviewed progress against the Group’s diversity targets.
› Challenged management to increase the rate of progress.
Embrace innovation and technology across our business
The Board challenges management to support a focus on innovation to drive the Group’s future growth.
For further information on steps taken to promote innovative practices, please see Strategy dashboard on pages 28 and 29.
› Appointed a Board sponsor of the Group’s innovation focus.
› Reviewed examples of innovative practice and proposals to share them throughout the Group.
› Demonstrated a ‘tone from the top’ with respect to innovation.
› Challenged management to drive innovation throughout the Group.
› Monitored the progress of the Group-wide innovation forum.
› Identified ways of promoting the forum’s effectiveness.
Governance in action
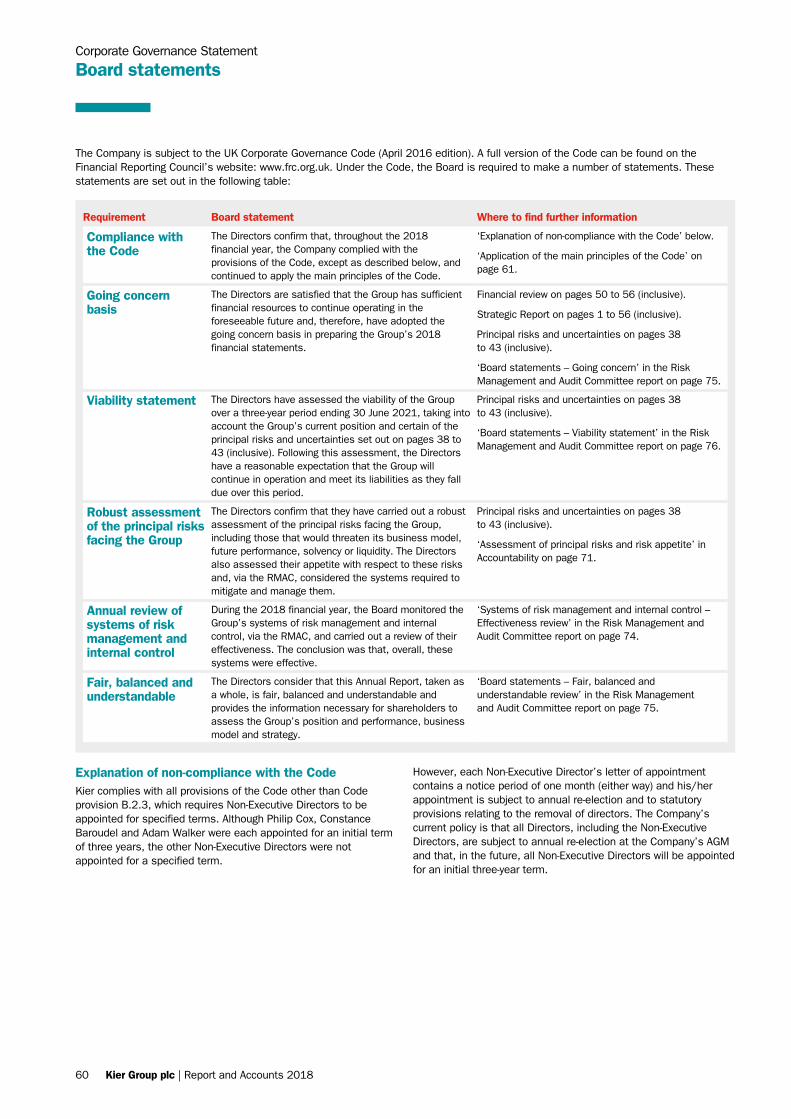
60 Kier Group plc | Report and Accounts 2018
Corporate Governance Statement
Board statements
Requirement Board statement Where to find further information
Compliance with the Code
The Directors confirm that, throughout the 2018 financial year, the Company complied with the provisions of the Code, except as described below, and continued to apply the main principles of the Code.
‘Explanation of non-compliance with the Code’ below.
‘Application of the main principles of the Code’ on page 61.
Going concern basis
The Directors are satisfied that the Group has sufficient financial resources to continue operating in the foreseeable future and, therefore, have adopted the going concern basis in preparing the Group’s 2018 financial statements.
Financial review on pages 50 to 56 (inclusive).
Strategic Report on pages 1 to 56 (inclusive).
Principal risks and uncertainties on pages 38 to 43 (inclusive).
‘Board statements – Going concern’ in the Risk Management and Audit Committee report on page 75.
Viability statement The Directors have assessed the viability of the Group over a three-year period ending 30 June 2021, taking into account the Group’s current position and certain of the principal risks and uncertainties set out on pages 38 to 43 (inclusive). Following this assessment, the Directors have a reasonable expectation that the Group will continue in operation and meet its liabilities as they fall due over this period.
Principal risks and uncertainties on pages 38 to 43 (inclusive).
‘Board statements – Viability statement’ in the Risk Management and Audit Committee report on page 76.
Robust assessment of the principal risks facing the Group
The Directors confirm that they have carried out a robust assessment of the principal risks facing the Group, including those that would threaten its business model, future performance, solvency or liquidity. The Directors also assessed their appetite with respect to these risks and, via the RMAC, considered the systems required to mitigate and manage them.
Principal risks and uncertainties on pages 38 to 43 (inclusive).
‘Assessment of principal risks and risk appetite’ in Accountability on page 71.
Annual review of systems of risk management and internal control
During the 2018 financial year, the Board monitored the Group’s systems of risk management and internal control, via the RMAC, and carried out a review of their effectiveness. The conclusion was that, overall, these systems were effective.
‘Systems of risk management and internal control – Effectiveness review’ in the Risk Management and Audit Committee report on page 74.
Fair, balanced and understandable
The Directors consider that this Annual Report, taken as a whole, is fair, balanced and understandable and provides the information necessary for shareholders to assess the Group’s position and performance, business model and strategy.
‘Board statements – Fair, balanced and understandable review’ in the Risk Management and Audit Committee report on page 75.
The Company is subject to the UK Corporate Governance Code (April 2016 edition). A full version of the Code can be found on the Financial Reporting Council’s website: www.frc.org.uk. Under the Code, the Board is required to make a number of statements. These statements are set out in the following table:
Explanation of non-compliance with the CodeKier complies with all provisions of the Code other than Code provision B.2.3, which requires Non-Executive Directors to be appointed for specified terms. Although Philip Cox, Constance Baroudel and Adam Walker were each appointed for an initial term of three years, the other Non-Executive Directors were not appointed for a specified term.
However, each Non-Executive Director’s letter of appointment contains a notice period of one month (either way) and his/her appointment is subject to annual re-election and to statutory provisions relating to the removal of directors. The Company’s current policy is that all Directors, including the Non-Executive Directors, are subject to annual re-election at the Company’s AGM and that, in the future, all Non-Executive Directors will be appointed for an initial three-year term.
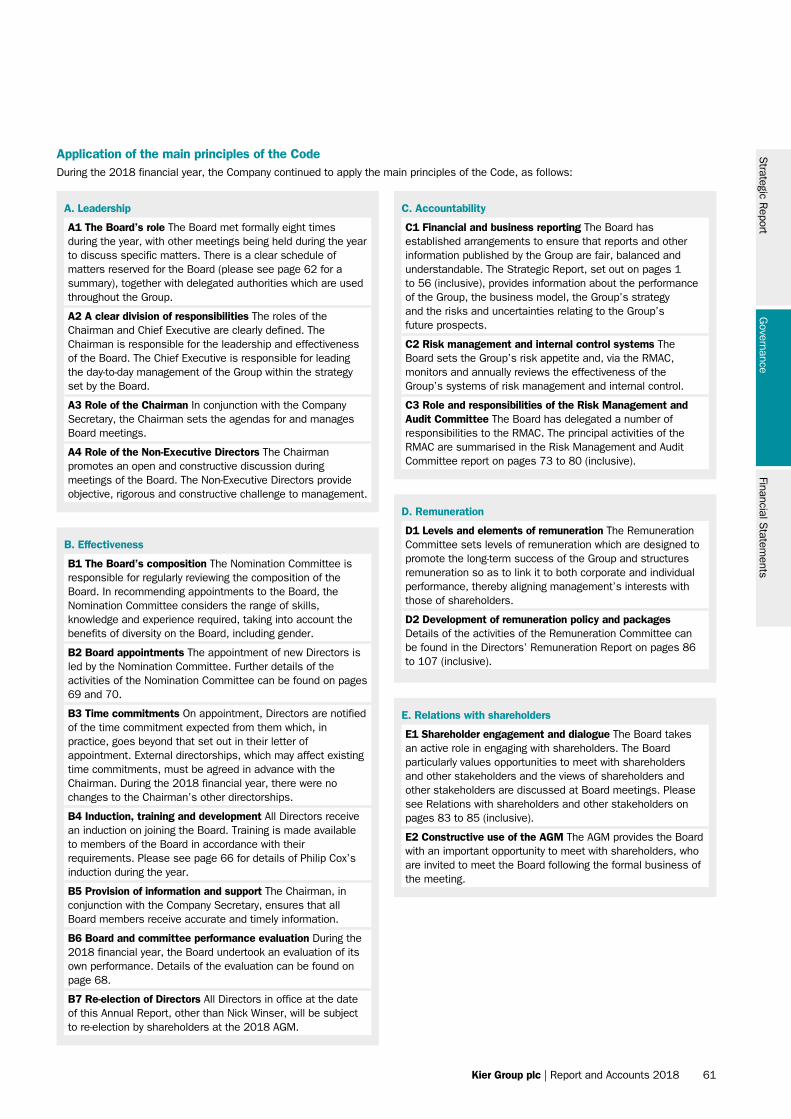
Strategic R
eportG
overnanceFinancial S
tatements
Kier Group plc | Report and Accounts 2018 61
A. Leadership
A1 The Board’s role The Board met formally eight times during the year, with other meetings being held during the year to discuss specific matters. There is a clear schedule of matters reserved for the Board (please see page 62 for a summary), together with delegated authorities which are used throughout the Group.
A2 A clear division of responsibilities The roles of the Chairman and Chief Executive are clearly defined. The Chairman is responsible for the leadership and effectiveness of the Board. The Chief Executive is responsible for leading the day-to-day management of the Group within the strategy set by the Board.
A3 Role of the Chairman In conjunction with the Company Secretary, the Chairman sets the agendas for and manages Board meetings.
A4 Role of the Non-Executive Directors The Chairman promotes an open and constructive discussion during meetings of the Board. The Non-Executive Directors provide objective, rigorous and constructive challenge to management.
C. Accountability
C1 Financial and business reporting The Board has established arrangements to ensure that reports and other information published by the Group are fair, balanced and understandable. The Strategic Report, set out on pages 1 to 56 (inclusive), provides information about the performance of the Group, the business model, the Group’s strategy and the risks and uncertainties relating to the Group’s future prospects.
C2 Risk management and internal control systems The Board sets the Group’s risk appetite and, via the RMAC, monitors and annually reviews the effectiveness of the Group’s systems of risk management and internal control.
C3 Role and responsibilities of the Risk Management and Audit Committee The Board has delegated a number of responsibilities to the RMAC. The principal activities of the RMAC are summarised in the Risk Management and Audit Committee report on pages 73 to 80 (inclusive).
D. Remuneration
D1 Levels and elements of remuneration The Remuneration Committee sets levels of remuneration which are designed to promote the long-term success of the Group and structures remuneration so as to link it to both corporate and individual performance, thereby aligning management’s interests with those of shareholders.
D2 Development of remuneration policy and packages Details of the activities of the Remuneration Committee can be found in the Directors’ Remuneration Report on pages 86 to 107 (inclusive).
E. Relations with shareholders
E1 Shareholder engagement and dialogue The Board takes an active role in engaging with shareholders. The Board particularly values opportunities to meet with shareholders and other stakeholders and the views of shareholders and other stakeholders are discussed at Board meetings. Please see Relations with shareholders and other stakeholders on pages 83 to 85 (inclusive).
E2 Constructive use of the AGM The AGM provides the Board with an important opportunity to meet with shareholders, who are invited to meet the Board following the formal business of the meeting.
B. Effectiveness
B1 The Board’s composition The Nomination Committee is responsible for regularly reviewing the composition of the Board. In recommending appointments to the Board, the Nomination Committee considers the range of skills, knowledge and experience required, taking into account the benefits of diversity on the Board, including gender.
B2 Board appointments The appointment of new Directors is led by the Nomination Committee. Further details of the activities of the Nomination Committee can be found on pages 69 and 70.
B3 Time commitments On appointment, Directors are notified of the time commitment expected from them which, in practice, goes beyond that set out in their letter of appointment. External directorships, which may affect existing time commitments, must be agreed in advance with the Chairman. During the 2018 financial year, there were no changes to the Chairman’s other directorships.
B4 Induction, training and development All Directors receive an induction on joining the Board. Training is made available to members of the Board in accordance with their requirements. Please see page 66 for details of Philip Cox’s induction during the year.
B5 Provision of information and support The Chairman, in conjunction with the Company Secretary, ensures that all Board members receive accurate and timely information.
B6 Board and committee performance evaluation During the 2018 financial year, the Board undertook an evaluation of its own performance. Details of the evaluation can be found on page 68.
B7 Re-election of Directors All Directors in office at the date of this Annual Report, other than Nick Winser, will be subject to re-election by shareholders at the 2018 AGM.
Application of the main principles of the CodeDuring the 2018 financial year, the Company continued to apply the main principles of the Code, as follows:
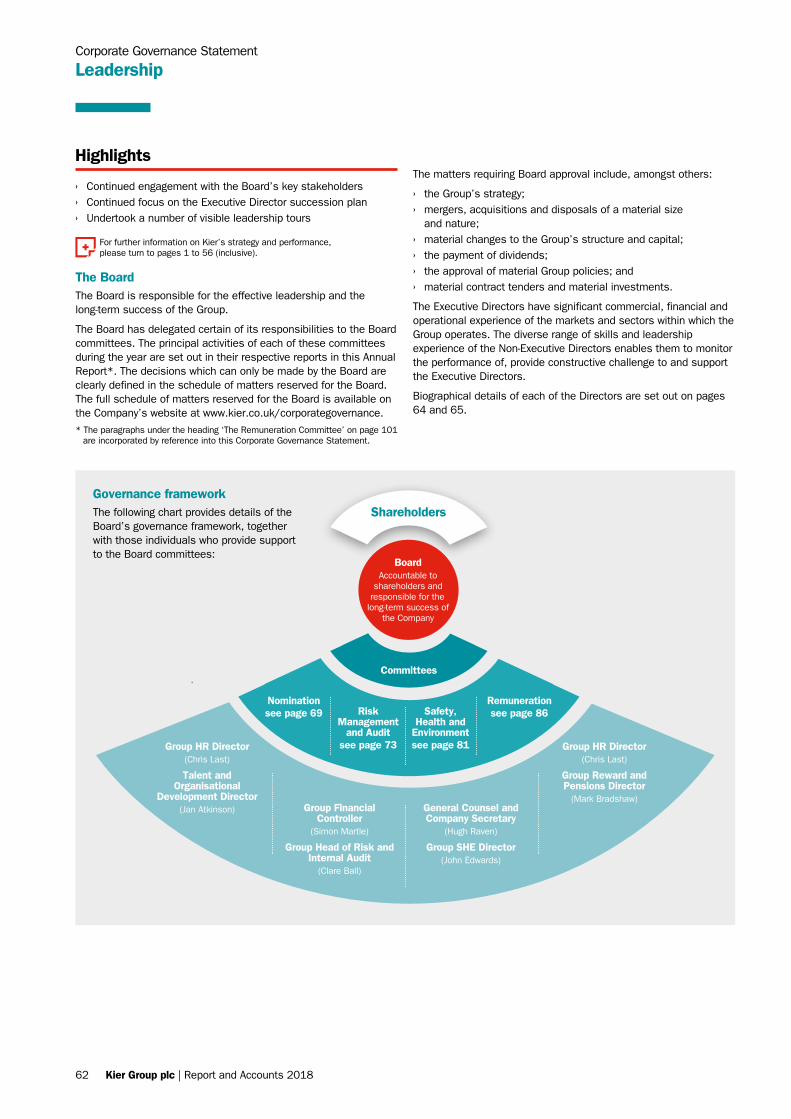
62 Kier Group plc | Report and Accounts 2018
The BoardThe Board is responsible for the effective leadership and the long-term success of the Group.
The Board has delegated certain of its responsibilities to the Board committees. The principal activities of each of these committees during the year are set out in their respective reports in this Annual Report*. The decisions which can only be made by the Board are clearly defined in the schedule of matters reserved for the Board. The full schedule of matters reserved for the Board is available on the Company’s website at www.kier.co.uk/corporategovernance.* The paragraphs under the heading ‘The Remuneration Committee’ on page 101
are incorporated by reference into this Corporate Governance Statement.
Highlights
› Continued engagement with the Board’s key stakeholders › Continued focus on the Executive Director succession plan › Undertook a number of visible leadership tours
For further information on Kier’s strategy and performance, please turn to pages 1 to 56 (inclusive).
Corporate Governance Statement
Leadership
The matters requiring Board approval include, amongst others:
› the Group’s strategy; › mergers, acquisitions and disposals of a material size
and nature; › material changes to the Group’s structure and capital; › the payment of dividends; › the approval of material Group policies; and › material contract tenders and material investments.
The Executive Directors have significant commercial, financial and operational experience of the markets and sectors within which the Group operates. The diverse range of skills and leadership experience of the Non-Executive Directors enables them to monitor the performance of, provide constructive challenge to and support the Executive Directors.
Biographical details of each of the Directors are set out on pages 64 and 65.
Governance frameworkThe following chart provides details of the Board’s governance framework, together with those individuals who provide support to the Board committees:
Shareholders
BoardAccountable to
shareholders and responsible for the
long-term success of the Company
Nominationsee page 69 Risk
Management and Audit
see page 73
Safety, Health and
Environmentsee page 81
Remunerationsee page 86
Group HR Director(Chris Last)
Talent and Organisational
Development Director (Jan Atkinson) Group Financial
Controller(Simon Martle)
Group Head of Risk and Internal Audit
(Clare Ball)
General Counsel and Company Secretary
(Hugh Raven)
Group SHE Director (John Edwards)
Group HR Director(Chris Last)
Group Reward and Pensions Director
(Mark Bradshaw)
Committees
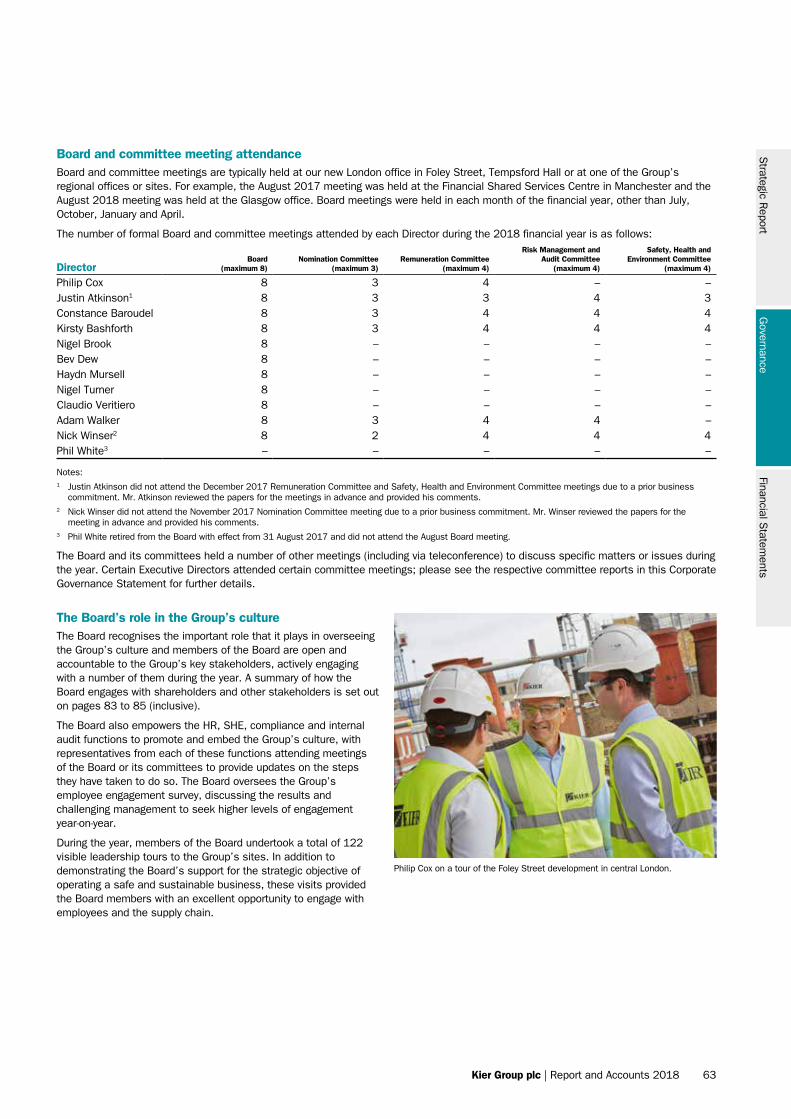
Strategic R
eportG
overnanceFinancial S
tatements
Kier Group plc | Report and Accounts 2018 63
Board and committee meeting attendanceBoard and committee meetings are typically held at our new London office in Foley Street, Tempsford Hall or at one of the Group’s regional offices or sites. For example, the August 2017 meeting was held at the Financial Shared Services Centre in Manchester and the August 2018 meeting was held at the Glasgow office. Board meetings were held in each month of the financial year, other than July, October, January and April.
The number of formal Board and committee meetings attended by each Director during the 2018 financial year is as follows:
DirectorBoard
(maximum 8)Nomination Committee
(maximum 3)Remuneration Committee
(maximum 4)
Risk Management and Audit Committee
(maximum 4)
Safety, Health and Environment Committee
(maximum 4)
Philip Cox 8 3 4 – – Justin Atkinson1 8 3 3 4 3Constance Baroudel 8 3 4 4 4Kirsty Bashforth 8 3 4 4 4Nigel Brook 8 – – – –Bev Dew 8 – – – –Haydn Mursell 8 – – – –Nigel Turner 8 – – – –Claudio Veritiero 8 – – – –Adam Walker 8 3 4 4 –Nick Winser2 8 2 4 4 4Phil White3 – – – – –
Notes:1 Justin Atkinson did not attend the December 2017 Remuneration Committee and Safety, Health and Environment Committee meetings due to a prior business
commitment. Mr. Atkinson reviewed the papers for the meetings in advance and provided his comments.2 Nick Winser did not attend the November 2017 Nomination Committee meeting due to a prior business commitment. Mr. Winser reviewed the papers for the
meeting in advance and provided his comments.3 Phil White retired from the Board with effect from 31 August 2017 and did not attend the August Board meeting.
The Board and its committees held a number of other meetings (including via teleconference) to discuss specific matters or issues during the year. Certain Executive Directors attended certain committee meetings; please see the respective committee reports in this Corporate Governance Statement for further details.
Philip Cox on a tour of the Foley Street development in central London.
The Board’s role in the Group’s cultureThe Board recognises the important role that it plays in overseeing the Group’s culture and members of the Board are open and accountable to the Group’s key stakeholders, actively engaging with a number of them during the year. A summary of how the Board engages with shareholders and other stakeholders is set out on pages 83 to 85 (inclusive).
The Board also empowers the HR, SHE, compliance and internal audit functions to promote and embed the Group’s culture, with representatives from each of these functions attending meetings of the Board or its committees to provide updates on the steps they have taken to do so. The Board oversees the Group’s employee engagement survey, discussing the results and challenging management to seek higher levels of engagement year-on-year.
During the year, members of the Board undertook a total of 122 visible leadership tours to the Group’s sites. In addition to demonstrating the Board’s support for the strategic objective of operating a safe and sustainable business, these visits provided the Board members with an excellent opportunity to engage with employees and the supply chain.
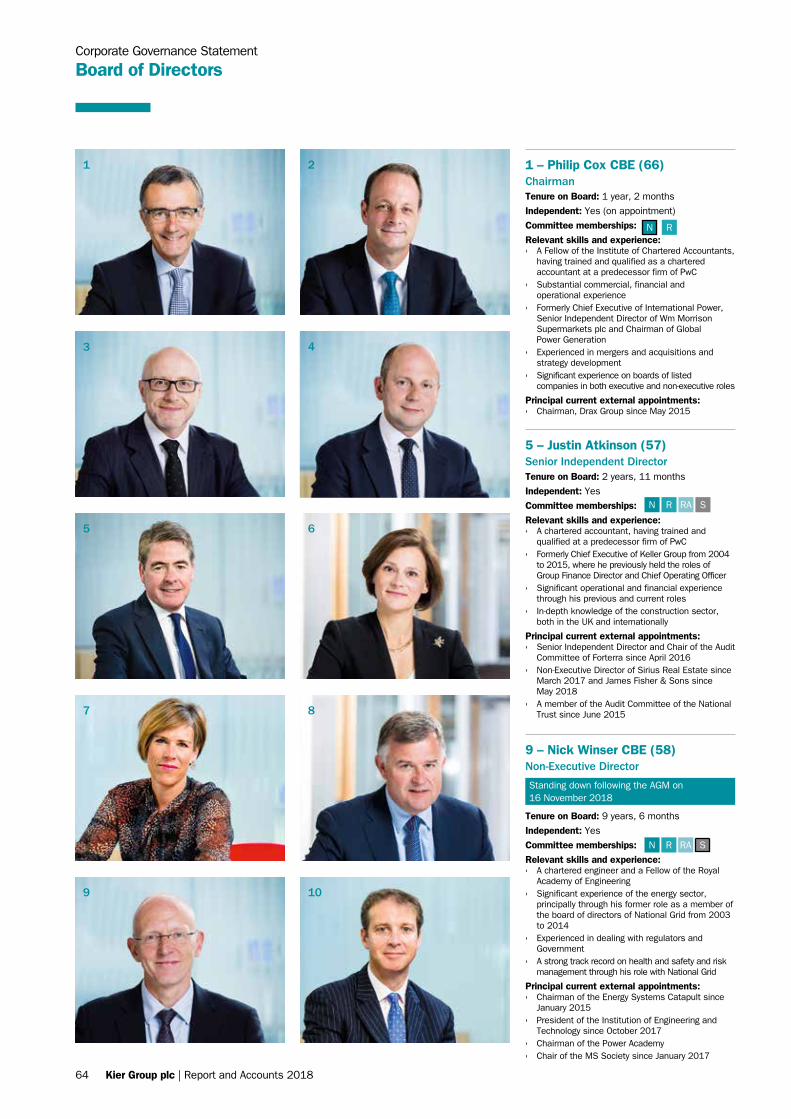
64 Kier Group plc | Report and Accounts 2018
5 – Justin Atkinson (57)Senior Independent DirectorTenure on Board: 2 years, 11 months
Independent: Yes
Committee memberships:Relevant skills and experience: › A chartered accountant, having trained and
qualified at a predecessor firm of PwC › Formerly Chief Executive of Keller Group from 2004
to 2015, where he previously held the roles of Group Finance Director and Chief Operating Officer
› Significant operational and financial experience through his previous and current roles
› In-depth knowledge of the construction sector, both in the UK and internationally
Principal current external appointments: › Senior Independent Director and Chair of the Audit
Committee of Forterra since April 2016 › Non-Executive Director of Sirius Real Estate since
March 2017 and James Fisher & Sons since May 2018
› A member of the Audit Committee of the National Trust since June 2015
Tenure on Board: 9 years, 6 months
Independent: Yes
Committee memberships:Relevant skills and experience: › A chartered engineer and a Fellow of the Royal
Academy of Engineering › Significant experience of the energy sector,
principally through his former role as a member of the board of directors of National Grid from 2003 to 2014
› Experienced in dealing with regulators and Government
› A strong track record on health and safety and risk management through his role with National Grid
Principal current external appointments: › Chairman of the Energy Systems Catapult since
January 2015 › President of the Institution of Engineering and
Technology since October 2017 › Chairman of the Power Academy › Chair of the MS Society since January 2017
Corporate Governance Statement
Board of Directors
1 – Philip Cox CBE (66)ChairmanTenure on Board: 1 year, 2 months
Independent: Yes (on appointment)
Committee memberships:Relevant skills and experience: › A Fellow of the Institute of Chartered Accountants,
having trained and qualified as a chartered accountant at a predecessor firm of PwC
› Substantial commercial, financial and operational experience
› Formerly Chief Executive of International Power, Senior Independent Director of Wm Morrison Supermarkets plc and Chairman of Global Power Generation
› Experienced in mergers and acquisitions and strategy development
› Significant experience on boards of listed companies in both executive and non-executive roles
Principal current external appointments: › Chairman, Drax Group since May 2015
N R
N R RA S
N R RA S
9 – Nick Winser CBE (58)Non-Executive Director
1
4
7
10
2
5
8
3
6
9
Standing down following the AGM on 16 November 2018
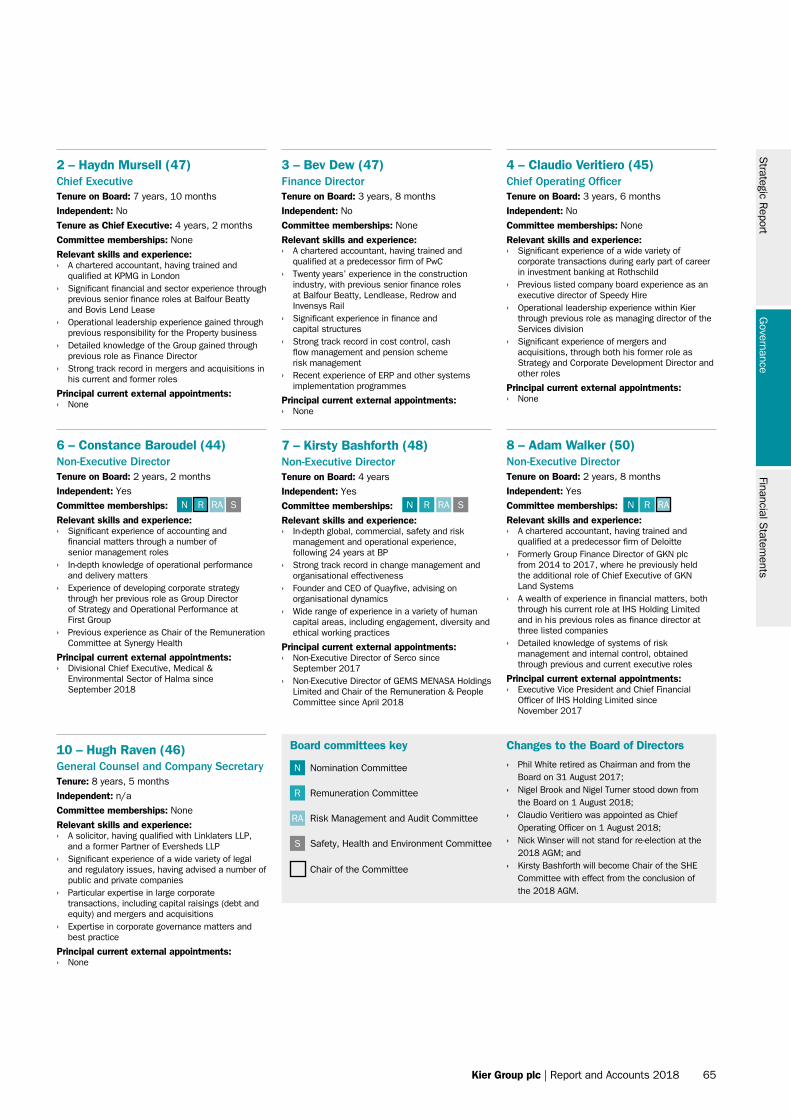
Strategic R
eportG
overnanceFinancial S
tatements
Kier Group plc | Report and Accounts 2018 65
3 – Bev Dew (47)Finance DirectorTenure on Board: 3 years, 8 months
Independent: No
Committee memberships: None
Relevant skills and experience: › A chartered accountant, having trained and
qualified at a predecessor firm of PwC › Twenty years’ experience in the construction
industry, with previous senior finance roles at Balfour Beatty, Lendlease, Redrow and Invensys Rail
› Significant experience in finance and capital structures
› Strong track record in cost control, cash flow management and pension scheme risk management
› Recent experience of ERP and other systems implementation programmes
Principal current external appointments: › None
Board committees key Changes to the Board of Directors
› Phil White retired as Chairman and from the Board on 31 August 2017;
› Nigel Brook and Nigel Turner stood down from the Board on 1 August 2018;
› Claudio Veritiero was appointed as Chief Operating Officer on 1 August 2018;
› Nick Winser will not stand for re-election at the 2018 AGM; and
› Kirsty Bashforth will become Chair of the SHE Committee with effect from the conclusion of the 2018 AGM.
Nomination CommitteeN
N R RA S
8 – Adam Walker (50)Non-Executive DirectorTenure on Board: 2 years, 8 months
Independent: Yes
Committee memberships:Relevant skills and experience: › A chartered accountant, having trained and
qualified at a predecessor firm of Deloitte › Formerly Group Finance Director of GKN plc
from 2014 to 2017, where he previously held the additional role of Chief Executive of GKN Land Systems
› A wealth of experience in financial matters, both through his current role at IHS Holding Limited and in his previous roles as finance director at three listed companies
› Detailed knowledge of systems of risk management and internal control, obtained through previous and current executive roles
Principal current external appointments: › Executive Vice President and Chief Financial
Officer of IHS Holding Limited since November 2017
N R RAN R RA S
2 – Haydn Mursell (47)Chief ExecutiveTenure on Board: 7 years, 10 months
Independent: No
Tenure as Chief Executive: 4 years, 2 months
Committee memberships: None
Relevant skills and experience: › A chartered accountant, having trained and
qualified at KPMG in London › Significant financial and sector experience through
previous senior finance roles at Balfour Beatty and Bovis Lend Lease
› Operational leadership experience gained through previous responsibility for the Property business
› Detailed knowledge of the Group gained through previous role as Finance Director
› Strong track record in mergers and acquisitions in his current and former roles
Principal current external appointments: › None
6 – Constance Baroudel (44)Non-Executive DirectorTenure on Board: 2 years, 2 months
Independent: Yes
Committee memberships:Relevant skills and experience: › Significant experience of accounting and
financial matters through a number of senior management roles
› In-depth knowledge of operational performance and delivery matters
› Experience of developing corporate strategy through her previous role as Group Director of Strategy and Operational Performance at First Group
› Previous experience as Chair of the Remuneration Committee at Synergy Health
Principal current external appointments: › Divisional Chief Executive, Medical &
Environmental Sector of Halma since September 2018
7 – Kirsty Bashforth (48)Non-Executive DirectorTenure on Board: 4 years
Independent: Yes
Committee memberships:Relevant skills and experience: › In-depth global, commercial, safety and risk
management and operational experience, following 24 years at BP
› Strong track record in change management and organisational effectiveness
› Founder and CEO of Quayfive, advising on organisational dynamics
› Wide range of experience in a variety of human capital areas, including engagement, diversity and ethical working practices
Principal current external appointments: › Non-Executive Director of Serco since
September 2017 › Non-Executive Director of GEMS MENASA Holdings
Limited and Chair of the Remuneration & People Committee since April 2018
10 – Hugh Raven (46)General Counsel and Company SecretaryTenure: 8 years, 5 months
Independent: n/a
Committee memberships: None
Relevant skills and experience: › A solicitor, having qualified with Linklaters LLP,
and a former Partner of Eversheds LLP › Significant experience of a wide variety of legal
and regulatory issues, having advised a number of public and private companies
› Particular expertise in large corporate transactions, including capital raisings (debt and equity) and mergers and acquisitions
› Expertise in corporate governance matters and best practice
Principal current external appointments: › None
4 – Claudio Veritiero (45)Chief Operating OfficerTenure on Board: 3 years, 6 months
Independent: No
Committee memberships: None
Relevant skills and experience: › Significant experience of a wide variety of
corporate transactions during early part of career in investment banking at Rothschild
› Previous listed company board experience as an executive director of Speedy Hire
› Operational leadership experience within Kier through previous role as managing director of the Services division
› Significant experience of mergers and acquisitions, through both his former role as Strategy and Corporate Development Director and other roles
Principal current external appointments: › None
R Remuneration Committee
RA Risk Management and Audit Committee
S Safety, Health and Environment Committee
Chair of the Committee
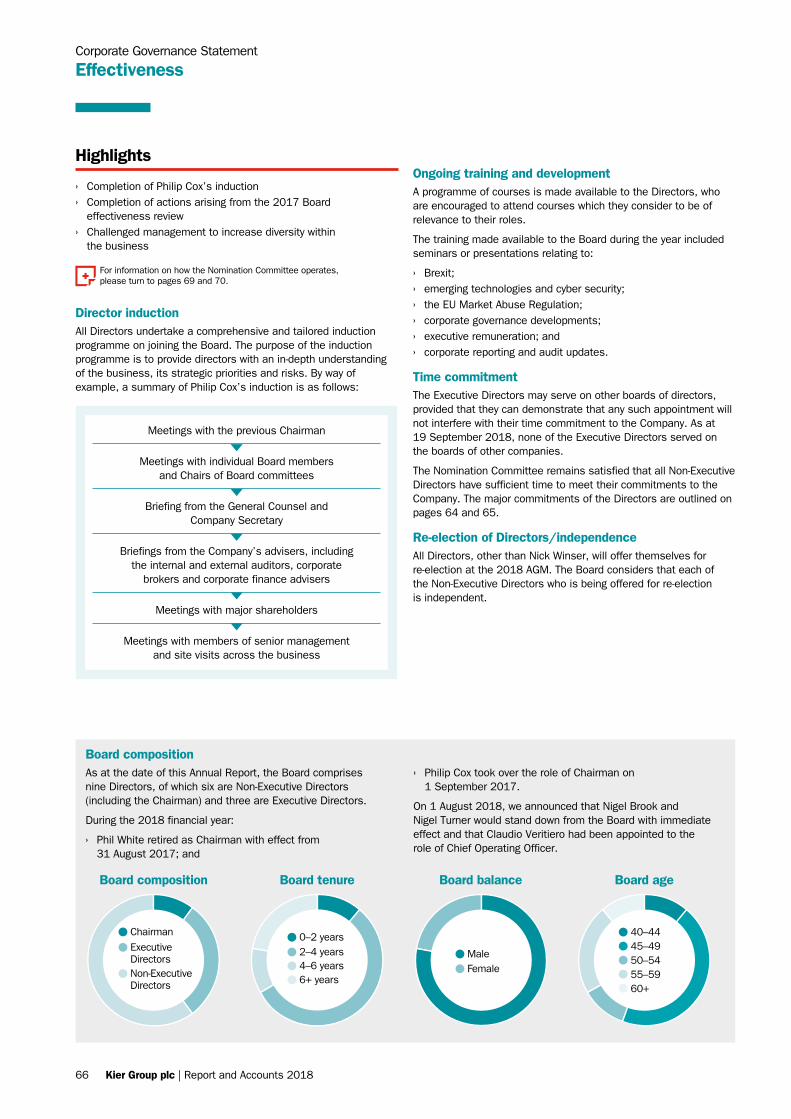
66 Kier Group plc | Report and Accounts 2018
Director inductionAll Directors undertake a comprehensive and tailored induction programme on joining the Board. The purpose of the induction programme is to provide directors with an in-depth understanding of the business, its strategic priorities and risks. By way of example, a summary of Philip Cox’s induction is as follows:
Highlights
› Completion of Philip Cox’s induction › Completion of actions arising from the 2017 Board
effectiveness review › Challenged management to increase diversity within
the business
For information on how the Nomination Committee operates, please turn to pages 69 and 70.
Corporate Governance Statement
Effectiveness
Meetings with the previous Chairman
Meetings with individual Board members and Chairs of Board committees
Briefing from the General Counsel and Company Secretary
Briefings from the Company’s advisers, including the internal and external auditors, corporate
brokers and corporate finance advisers
Meetings with major shareholders
Meetings with members of senior management and site visits across the business
Ongoing training and developmentA programme of courses is made available to the Directors, who are encouraged to attend courses which they consider to be of relevance to their roles.
The training made available to the Board during the year included seminars or presentations relating to:
› Brexit; › emerging technologies and cyber security; › the EU Market Abuse Regulation; › corporate governance developments; › executive remuneration; and › corporate reporting and audit updates.
Time commitmentThe Executive Directors may serve on other boards of directors, provided that they can demonstrate that any such appointment will not interfere with their time commitment to the Company. As at 19 September 2018, none of the Executive Directors served on the boards of other companies.
The Nomination Committee remains satisfied that all Non-Executive Directors have sufficient time to meet their commitments to the Company. The major commitments of the Directors are outlined on pages 64 and 65.
Re-election of Directors/independenceAll Directors, other than Nick Winser, will offer themselves for re-election at the 2018 AGM. The Board considers that each of the Non-Executive Directors who is being offered for re-election is independent.
Board compositionAs at the date of this Annual Report, the Board comprises nine Directors, of which six are Non-Executive Directors (including the Chairman) and three are Executive Directors.
During the 2018 financial year:
› Phil White retired as Chairman with effect from 31 August 2017; and
› Philip Cox took over the role of Chairman on 1 September 2017.
On 1 August 2018, we announced that Nigel Brook and Nigel Turner would stand down from the Board with immediate effect and that Claudio Veritiero had been appointed to the role of Chief Operating Officer.
Board composition Board tenure Board balance Board age
Chairman
Non-Executive Directors
Executive Directors
0–2 years
4–6 years6+ years
2–4 years MaleFemale
40–4445–4950–5455–5960+
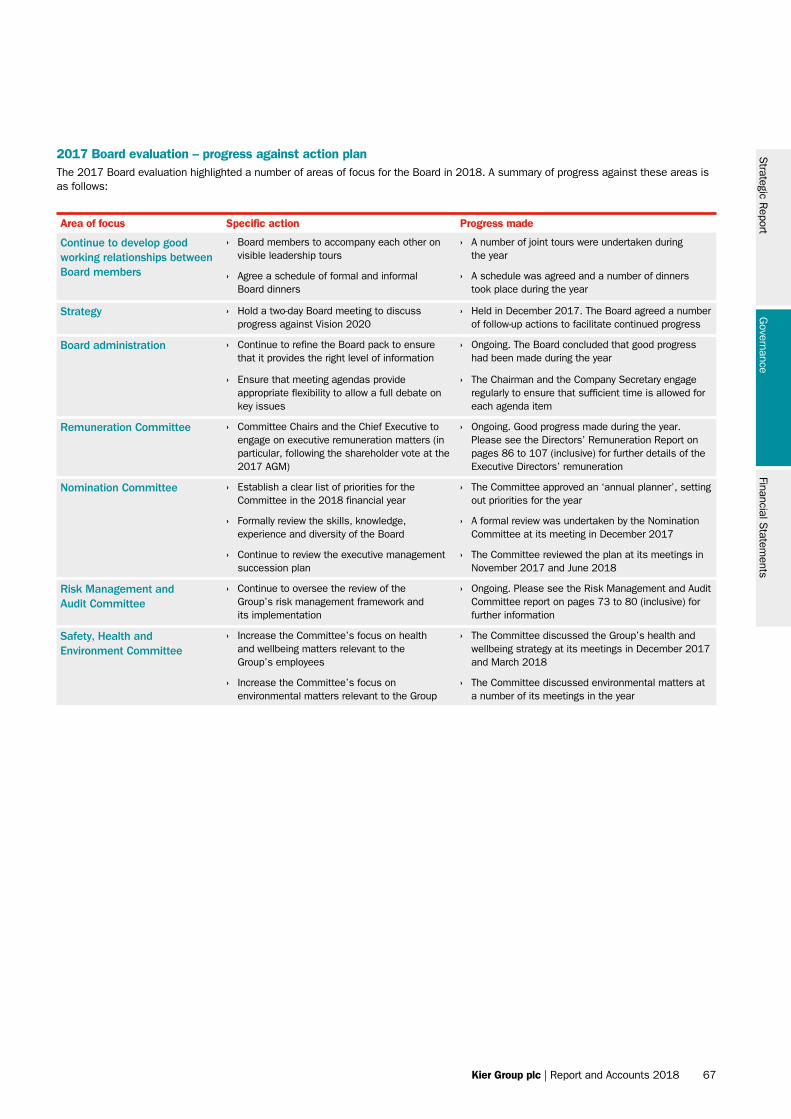
Strategic R
eportG
overnanceFinancial S
tatements
Kier Group plc | Report and Accounts 2018 67
Area of focus Specific action Progress made
Continue to develop good working relationships between Board members
› Board members to accompany each other on visible leadership tours
› A number of joint tours were undertaken during the year
› Agree a schedule of formal and informal Board dinners
› A schedule was agreed and a number of dinners took place during the year
Strategy › Hold a two-day Board meeting to discuss progress against Vision 2020
› Held in December 2017. The Board agreed a number of follow-up actions to facilitate continued progress
Board administration › Continue to refine the Board pack to ensure that it provides the right level of information
› Ongoing. The Board concluded that good progress had been made during the year
› Ensure that meeting agendas provide appropriate flexibility to allow a full debate on key issues
› The Chairman and the Company Secretary engage regularly to ensure that sufficient time is allowed for each agenda item
Remuneration Committee › Committee Chairs and the Chief Executive to engage on executive remuneration matters (in particular, following the shareholder vote at the 2017 AGM)
› Ongoing. Good progress made during the year. Please see the Directors’ Remuneration Report on pages 86 to 107 (inclusive) for further details of the Executive Directors’ remuneration
Nomination Committee › Establish a clear list of priorities for the Committee in the 2018 financial year
› The Committee approved an ‘annual planner’, setting out priorities for the year
› Formally review the skills, knowledge, experience and diversity of the Board
› A formal review was undertaken by the Nomination Committee at its meeting in December 2017
› Continue to review the executive management succession plan
› The Committee reviewed the plan at its meetings in November 2017 and June 2018
Risk Management and Audit Committee
› Continue to oversee the review of the Group’s risk management framework and its implementation
› Ongoing. Please see the Risk Management and Audit Committee report on pages 73 to 80 (inclusive) for further information
Safety, Health and Environment Committee
› Increase the Committee’s focus on health and wellbeing matters relevant to the Group’s employees
› The Committee discussed the Group’s health and wellbeing strategy at its meetings in December 2017 and March 2018
› Increase the Committee’s focus on environmental matters relevant to the Group
› The Committee discussed environmental matters at a number of its meetings in the year
2017 Board evaluation – progress against action planThe 2017 Board evaluation highlighted a number of areas of focus for the Board in 2018. A summary of progress against these areas is as follows:
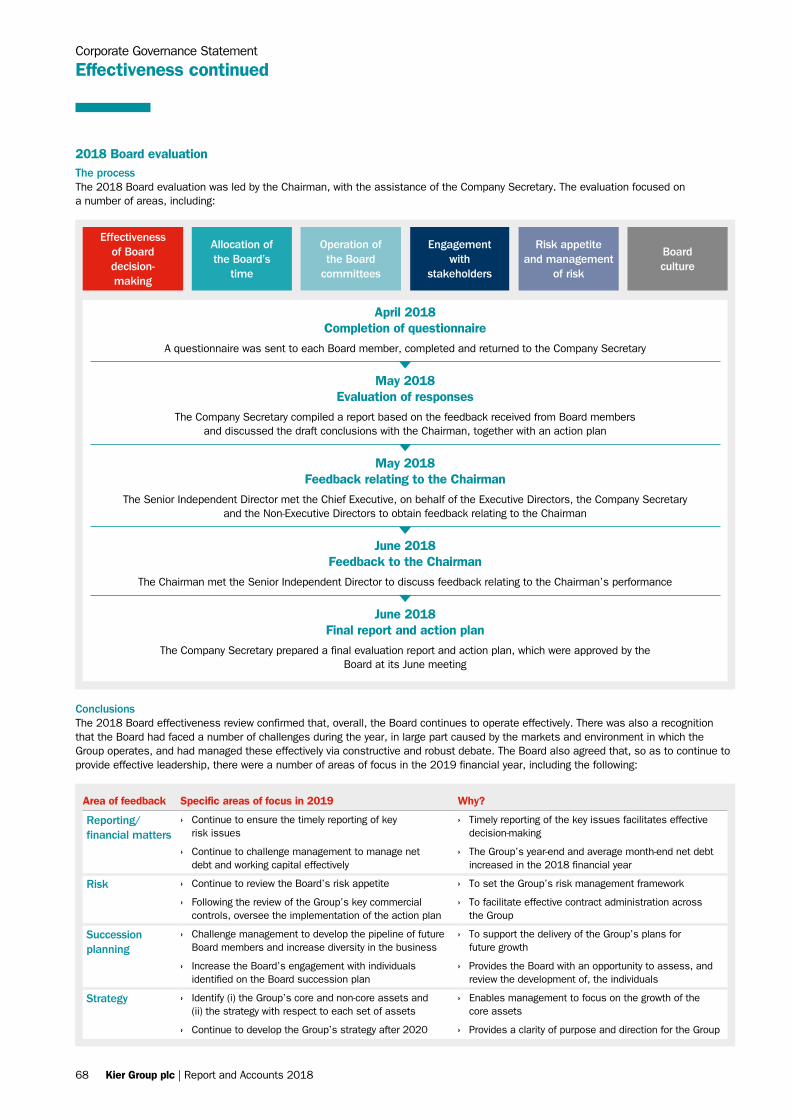
68 Kier Group plc | Report and Accounts 2018
Corporate Governance Statement
Effectiveness continued
Area of feedback Specific areas of focus in 2019 Why?
Reporting/financial matters
› Continue to ensure the timely reporting of key risk issues
› Timely reporting of the key issues facilitates effective decision-making
› Continue to challenge management to manage net debt and working capital effectively
› The Group’s year-end and average month-end net debt increased in the 2018 financial year
Risk › Continue to review the Board’s risk appetite › To set the Group’s risk management framework
› Following the review of the Group’s key commercial controls, oversee the implementation of the action plan
› To facilitate effective contract administration across the Group
Succession planning
› Challenge management to develop the pipeline of future Board members and increase diversity in the business
› To support the delivery of the Group’s plans for future growth
› Increase the Board’s engagement with individuals identified on the Board succession plan
› Provides the Board with an opportunity to assess, and review the development of, the individuals
Strategy › Identify (i) the Group’s core and non-core assets and (ii) the strategy with respect to each set of assets
› Enables management to focus on the growth of the core assets
› Continue to develop the Group’s strategy after 2020 › Provides a clarity of purpose and direction for the Group
2018 Board evaluationThe processThe 2018 Board evaluation was led by the Chairman, with the assistance of the Company Secretary. The evaluation focused on a number of areas, including:
Risk appetite and management
of risk
Allocation of the Board’s
time
Operation of the Board
committees
Board culture
Effectiveness of Board decision- making
Engagement with
stakeholders
April 2018 Completion of questionnaire
A questionnaire was sent to each Board member, completed and returned to the Company Secretary
May 2018 Evaluation of responses
The Company Secretary compiled a report based on the feedback received from Board members and discussed the draft conclusions with the Chairman, together with an action plan
May 2018 Feedback relating to the Chairman
The Senior Independent Director met the Chief Executive, on behalf of the Executive Directors, the Company Secretary and the Non-Executive Directors to obtain feedback relating to the Chairman
June 2018 Feedback to the Chairman
The Chairman met the Senior Independent Director to discuss feedback relating to the Chairman’s performance
June 2018 Final report and action plan
The Company Secretary prepared a final evaluation report and action plan, which were approved by the Board at its June meeting
ConclusionsThe 2018 Board effectiveness review confirmed that, overall, the Board continues to operate effectively. There was also a recognition that the Board had faced a number of challenges during the year, in large part caused by the markets and environment in which the Group operates, and had managed these effectively via constructive and robust debate. The Board also agreed that, so as to continue to provide effective leadership, there were a number of areas of focus in the 2019 financial year, including the following:
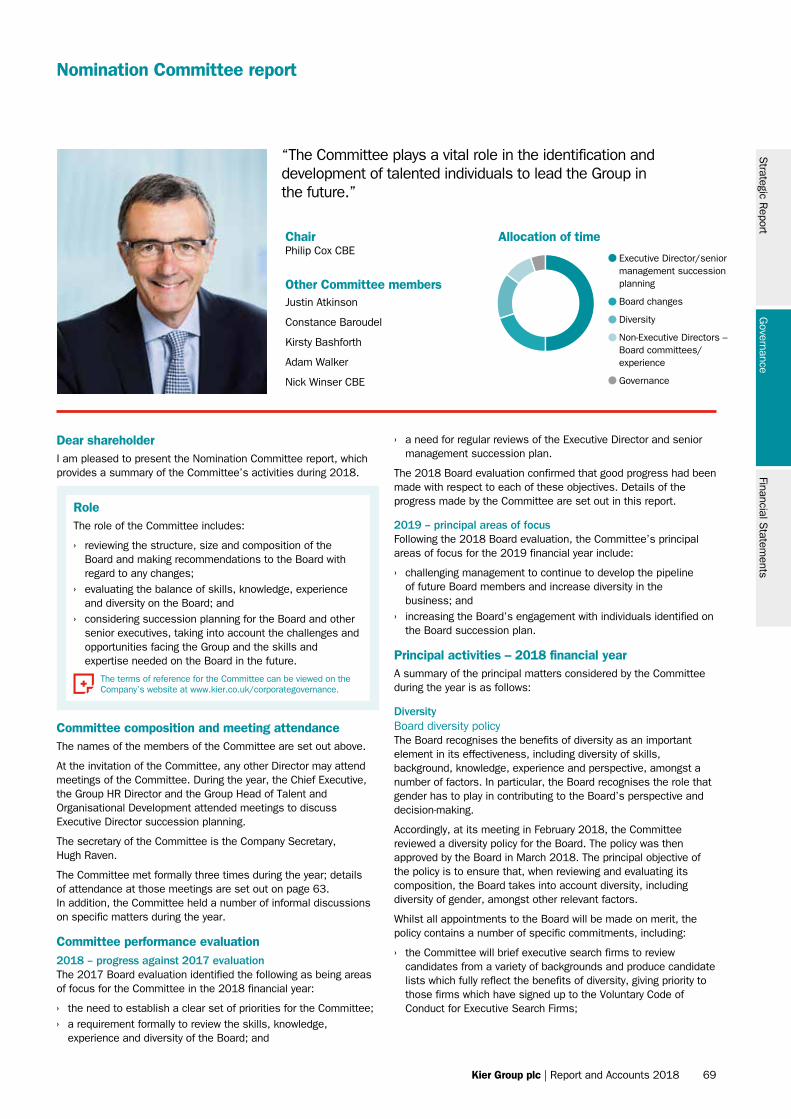
Strategic R
eportG
overnanceFinancial S
tatements
Kier Group plc | Report and Accounts 2018 69
Nomination Committee report
ChairPhilip Cox CBE
Other Committee membersJustin Atkinson
Constance Baroudel
Kirsty Bashforth
Adam Walker
Nick Winser CBE
Allocation of time
Dear shareholderI am pleased to present the Nomination Committee report, which provides a summary of the Committee’s activities during 2018.
Committee composition and meeting attendanceThe names of the members of the Committee are set out above.
At the invitation of the Committee, any other Director may attend meetings of the Committee. During the year, the Chief Executive, the Group HR Director and the Group Head of Talent and Organisational Development attended meetings to discuss Executive Director succession planning.
The secretary of the Committee is the Company Secretary, Hugh Raven.
The Committee met formally three times during the year; details of attendance at those meetings are set out on page 63. In addition, the Committee held a number of informal discussions on specific matters during the year.
Committee performance evaluation2018 – progress against 2017 evaluationThe 2017 Board evaluation identified the following as being areas of focus for the Committee in the 2018 financial year:
› the need to establish a clear set of priorities for the Committee; › a requirement formally to review the skills, knowledge,
experience and diversity of the Board; and
RoleThe role of the Committee includes:
› reviewing the structure, size and composition of the Board and making recommendations to the Board with regard to any changes;
› evaluating the balance of skills, knowledge, experience and diversity on the Board; and
› considering succession planning for the Board and other senior executives, taking into account the challenges and opportunities facing the Group and the skills and expertise needed on the Board in the future.
The terms of reference for the Committee can be viewed on the Company’s website at www.kier.co.uk/corporategovernance.
› a need for regular reviews of the Executive Director and senior management succession plan.
The 2018 Board evaluation confirmed that good progress had been made with respect to each of these objectives. Details of the progress made by the Committee are set out in this report.
2019 – principal areas of focusFollowing the 2018 Board evaluation, the Committee’s principal areas of focus for the 2019 financial year include:
› challenging management to continue to develop the pipeline of future Board members and increase diversity in the business; and
› increasing the Board’s engagement with individuals identified on the Board succession plan.
Principal activities – 2018 financial yearA summary of the principal matters considered by the Committee during the year is as follows:
DiversityBoard diversity policyThe Board recognises the benefits of diversity as an important element in its effectiveness, including diversity of skills, background, knowledge, experience and perspective, amongst a number of factors. In particular, the Board recognises the role that gender has to play in contributing to the Board’s perspective and decision-making.
Accordingly, at its meeting in February 2018, the Committee reviewed a diversity policy for the Board. The policy was then approved by the Board in March 2018. The principal objective of the policy is to ensure that, when reviewing and evaluating its composition, the Board takes into account diversity, including diversity of gender, amongst other relevant factors.
Whilst all appointments to the Board will be made on merit, the policy contains a number of specific commitments, including:
› the Committee will brief executive search firms to review candidates from a variety of backgrounds and produce candidate lists which fully reflect the benefits of diversity, giving priority to those firms which have signed up to the Voluntary Code of Conduct for Executive Search Firms;
“The Committee plays a vital role in the identification and development of talented individuals to lead the Group in the future.”
Allocation of time
Executive Director/senior management succession planning
Board changes
Diversity
Non-Executive Directors – Board committees/ experience
Governance
70 Kier Group plc | Report and Accounts 2018
Corporate Governance Statement
Nomination Committee report continued
› the Committee will consider candidates for Non-Executive Director roles from a wide pool of individuals, including those with little or no previous listed company board experience but whose skills and experience will add value to the Board;
› the Company will develop and implement policies, programmes and initiatives which are designed to promote diversity and inclusion at all levels of the organisation. Please see ‘Action taken during 2018’ below for further information; and
› recognising the FTSE350 target of 33% female representation both on boards and senior leadership teams by 2020, the Board is committed to increasing the number of female members of the Board and the Company’s senior management.
Action taken during 2018The Committee has overseen various programmes and initiatives which management has introduced to increase the number of women employees at all levels of the organisation. These include:
› challenging local management to ensure that, when recruiting, candidate lists demonstrate sufficient gender diversity;
› agreeing specific objectives on gender diversity with senior leaders;
› providing specific guidance for leaders on career coaching for female talent;
› identifying ‘fast potential’ female talent and providing mentoring and development programmes to those identified; and
› reviewing the graduate recruitment programme.
At the date of this Annual Report, the percentage of Executive Directors and direct reports who are women is 19% (2017: 15%).
Executive Director/senior management succession planningIn the 2017 Annual Report, we summarised some of the key elements of the programme which management had implemented (led by the Group HR Director and the Group Head of Talent and Organisational Development) to identify a pipeline of future Board members. During the year, management has continued to monitor and develop this pipeline, reporting on progress to the Committee. A summary of some of the key actions taken during the year is as follows:
Action Why? Next steps
Selected members of the succession plan attended external leadership development programmes
To provide the individuals with an objective perspective on leadership across a range of issues
Assess the extent to which the programmes have assisted in the individuals’ development
Assessment of new members of the succession plan by business psychologists (Deloitte)
To obtain an objective assessment of the individuals’ strengths and development areas
Draft and monitor progress against tailored development plans prepared for these individuals
Providing members of the succession plan with increased managerial responsibilities
To assess the individuals’ ability and potential to respond to new challenges and responsibilities
Assess how effectively the individuals have responded to the increased responsibilities
Board changesOne of the Committee’s key responsibilities is to review the structure and composition of the Board. At the same time as announcing the Future Proofing Kier programme, the Committee took the opportunity to review the composition of the Board and concluded that, so as to oversee the delivery of the benefits of the programme, it would recommend the appointment of a Chief Operating Officer to the Board. The Committee identified Claudio Veritiero as having the necessary skills for the role and he was appointed with effect from 1 August 2018. Prior to making its recommendation, the Committee:
› agreed a role profile for the Chief Operating Officer; › agreed the interaction between the Chief Executive and the
Chief Operating Officer; › assessed Claudio Veritiero’s experience for the role; › defined the interaction between the Chief Operating Officer
and senior management within the business; and › reviewed the changes to the structure of the Group’s senior
management team which followed the introduction of the new role.
As a consequence of the appointment of the Chief Operating Officer, the roles of Executive Director – Construction and Infrastructure Services and Executive Director – Developments, Property and Business Services were no longer considered necessary. Nigel Brook and Nigel Turner therefore stood down from the Board with effect from 1 August 2018.
Having completed nine years on the Board, Nick Winser will not be standing for re-election at the November AGM. In light of the range of skills and experience on the Board, the Committee concluded that there is no immediate need to appoint an additional Non-Executive Director. The Committee also concluded that, in light of her experience in SHE matters, it would be appropriate to recommend that the Board appoint Kirsty Bashforth to the role of Chair of the SHE Committee with effect from the conclusion of the AGM.
Non-Executive Directors – Board committees/experienceAt its meeting in February 2018, the Committee reviewed the balance of skills and experience of the Non-Executive Directors.
The Committee concluded that there was a range of experience across the Non-Executive Directors in a number of areas, including risk management, strategy development, SHE issues, corporate finance, accounting issues and change management. The Committee also concluded that members of the Board currently had relatively limited experience of business disruption issues and digital systems. The Committee agreed that, when considering future non-executive appointments, it would take into account the conclusions of its review.
ConclusionI will be available to answer any questions about the Committee, our work and how we operate at the AGM on 16 November 2018.
Philip Cox CBEChair of the Nomination Committee
19 September 2018
Strategic R
eportG
overnanceFinancial S
tatements
Kier Group plc | Report and Accounts 2018 71
Highlights
› Oversaw the continued good progress of the transition to a new, integrated Oracle ERP system
› Systems of risk management and internal controls assessed as being effective overall
› Continued focus on the Group’s management of risk, in light of its plans for future growth
For further information on how the Group manages risk, please turn to the Risk Management and Audit Committee Report on pages 73 to 80 (inclusive).
Accountability
Systems of risk management and internal controlGeneralThe Board has ultimate responsibility for the Group’s systems of risk management and internal control, including those established to identify, manage and monitor risk.
The Board has delegated the responsibility for overseeing management’s implementation of those systems to the RMAC.
The Group Head of Risk and Internal Audit, who has direct access to the RMAC and its Chair, reports to the RMAC on strategic risk issues and oversees the Group’s risk management framework.
Working with the Group Head of Risk and Internal Audit, management is responsible for the identification and evaluation of the risks that apply to the Group’s business and operations, together with the design and implementation of systems and controls which are designed to manage those risks. Management reviews these systems and controls to ensure that they remain effective to support the Group’s plans for future growth. The Board and the RMAC oversee the steps taken by management.
A summary of the key elements of the Group’s risk management framework is set out on pages 36 and 37.
Effectiveness reviewThe Code requires that the Board conducts an annual review of the Group’s systems of risk management and internal control. The steps taken by the RMAC, on behalf of the Board, in reviewing these systems are described under ‘Systems of risk management and internal control – Effectiveness review’ in the Risk Management and Audit Committee report on page 74.
Assessment of principal risks and risk appetiteDuring the year, the Board conducted a review of the Group’s principal risks and uncertainties, together with its appetite with respect to each such risk. A summary of the various stages of the review process undertaken in 2018 is as follows:
Further information about the Group’s principal risks and uncertainties is set out on pages 38 to 43 (inclusive) of the Strategic Report.
August 2017
Board discussion about its risk appetite and the Group’s risk management framework
December 2017
Further Board discussion about its risk appetite in the context of its review of the Group’s strategy
January – March 2018
Meetings with the Executive Directors to assess their risk appetite against the Group’s six strategic priorities
April and May 2018
Business risk measurement metrics and tolerance discussed with the Executive Directors
June 2018
Meeting of the Executive Directors to discuss specific business risks
Board discussion about its appetite for contract risk by contract type
July and August 2018
Drafting of the ‘Principal risks and uncertainties’ section of this Annual Report
September 2018
RMAC and Board approval of the sections of this Annual Report relating to risk management

72 Kier Group plc | Report and Accounts 2018
Corporate Governance Statement
Accountability continued
Financial reportingThe Group has clear policies and procedures which are designed to ensure the conformity, reliability and accuracy of financial reporting, including the process for preparing the Group’s interim and annual financial statements. The Group’s financial reporting policies and procedures cover financial planning and reporting, preparation of financial information and the monitoring and control of capital expenditure. The Group’s financial statements preparation process includes reviews at business and Group levels.
Over the past few years, the Group has introduced:
› the Oracle ERP system; and › the Finance Shared Service Centre, based in Manchester, which
produces the base or core information on which the Group’s financial statements are produced (via the Oracle ERP system).
Each business monitors its financial performance, using the Group’s finance manual. Following the conclusion of each quarter of the financial year, each business will conduct a formal ‘quarterly review’, the results of which, in turn, are reported to the Board. The Board then oversees the production of the Group’s interim and full-year financial results, reporting them in March and September, respectively, each year.
By way of example, a summary of the process for preparing the full-year 2018 results is:
July and August
The business produces year-end packs for central review
August
Central consolidation process and drafting the Group’s financial statements
August and September
Audit close-out meetings, RMAC review and Board approval
Board statementsThe Board delegated the responsibility for conducting the work required for it to provide the ‘fair, balanced and understandable’, ‘going concern’ and ‘viability’ statements to the RMAC.
These statements and the Board’s statement relating to its assessment of the Group’s principal risks and uncertainties are set out on page 60.
Further details of the work carried out by the RMAC in support of these statements is set out in the Risk Management and Audit Committee report on pages 75 and 76. In conducting this work, the RMAC acts on behalf of the Board and its activities remain the responsibility of the Board.
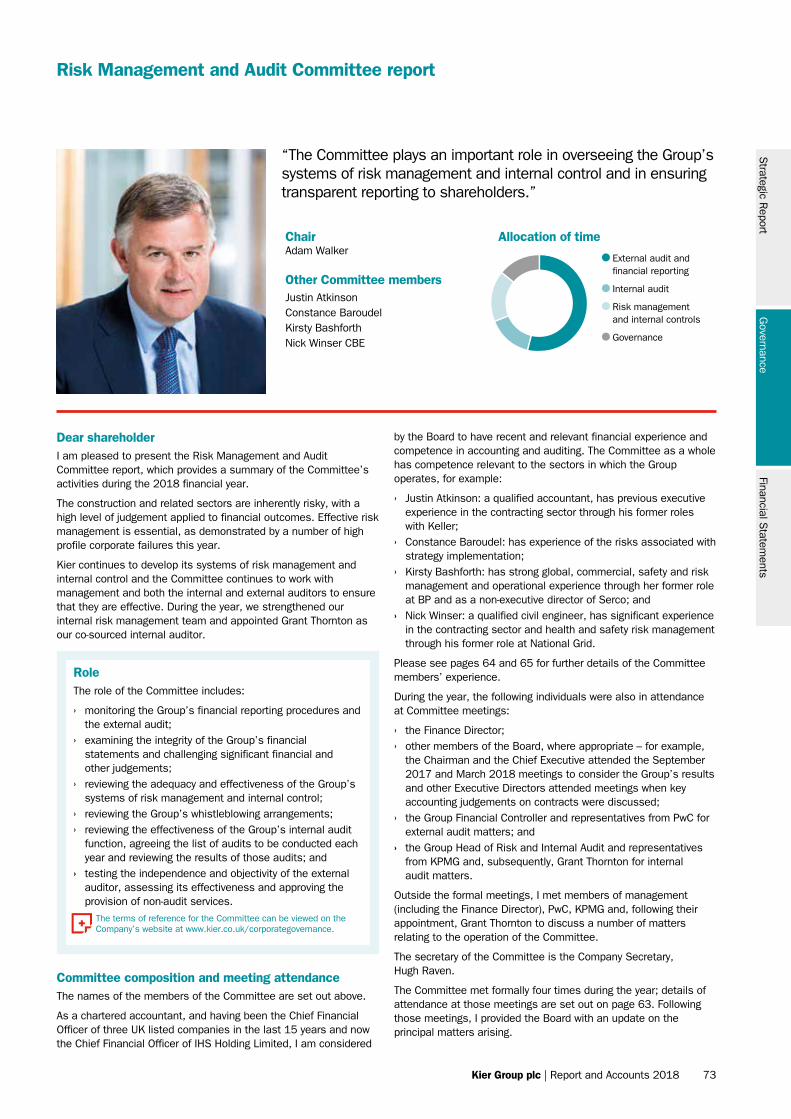
Strategic R
eportG
overnanceFinancial S
tatements
Kier Group plc | Report and Accounts 2018 73
Risk Management and Audit Committee report
Dear shareholderI am pleased to present the Risk Management and Audit Committee report, which provides a summary of the Committee’s activities during the 2018 financial year.
The construction and related sectors are inherently risky, with a high level of judgement applied to financial outcomes. Effective risk management is essential, as demonstrated by a number of high profile corporate failures this year.
Kier continues to develop its systems of risk management and internal control and the Committee continues to work with management and both the internal and external auditors to ensure that they are effective. During the year, we strengthened our internal risk management team and appointed Grant Thornton as our co-sourced internal auditor.
Committee composition and meeting attendanceThe names of the members of the Committee are set out above.
As a chartered accountant, and having been the Chief Financial Officer of three UK listed companies in the last 15 years and now the Chief Financial Officer of IHS Holding Limited, I am considered
RoleThe role of the Committee includes:
› monitoring the Group’s financial reporting procedures and the external audit;
› examining the integrity of the Group’s financial statements and challenging significant financial and other judgements;
› reviewing the adequacy and effectiveness of the Group’s systems of risk management and internal control;
› reviewing the Group’s whistleblowing arrangements; › reviewing the effectiveness of the Group’s internal audit
function, agreeing the list of audits to be conducted each year and reviewing the results of those audits; and
› testing the independence and objectivity of the external auditor, assessing its effectiveness and approving the provision of non-audit services.
The terms of reference for the Committee can be viewed on the Company’s website at www.kier.co.uk/corporategovernance.
by the Board to have recent and relevant financial experience and competence in accounting and auditing. The Committee as a whole has competence relevant to the sectors in which the Group operates, for example:
› Justin Atkinson: a qualified accountant, has previous executive experience in the contracting sector through his former roles with Keller;
› Constance Baroudel: has experience of the risks associated with strategy implementation;
› Kirsty Bashforth: has strong global, commercial, safety and risk management and operational experience through her former role at BP and as a non-executive director of Serco; and
› Nick Winser: a qualified civil engineer, has significant experience in the contracting sector and health and safety risk management through his former role at National Grid.
Please see pages 64 and 65 for further details of the Committee members’ experience.
During the year, the following individuals were also in attendance at Committee meetings:
› the Finance Director; › other members of the Board, where appropriate – for example,
the Chairman and the Chief Executive attended the September 2017 and March 2018 meetings to consider the Group’s results and other Executive Directors attended meetings when key accounting judgements on contracts were discussed;
› the Group Financial Controller and representatives from PwC for external audit matters; and
› the Group Head of Risk and Internal Audit and representatives from KPMG and, subsequently, Grant Thornton for internal audit matters.
Outside the formal meetings, I met members of management (including the Finance Director), PwC, KPMG and, following their appointment, Grant Thornton to discuss a number of matters relating to the operation of the Committee.
The secretary of the Committee is the Company Secretary, Hugh Raven.
The Committee met formally four times during the year; details of attendance at those meetings are set out on page 63. Following those meetings, I provided the Board with an update on the principal matters arising.
ChairAdam Walker Other Committee membersJustin AtkinsonConstance BaroudelKirsty BashforthNick Winser CBE
Allocation of time
“The Committee plays an important role in overseeing the Group’s systems of risk management and internal control and in ensuring transparent reporting to shareholders.”
Allocation of time
External audit and �nancial reporting
Internal audit
Risk management and internal controls
Governance
74 Kier Group plc | Report and Accounts 2018
Corporate Governance Statement
Risk Management and Audit Committee report continued
Committee performance evaluation
2018 – progress against 2017 evaluationThe 2017 Board effectiveness review identified the following as key areas of focus for the Committee in the 2018 financial year:
› ensuring that the Group’s systems of risk management and internal control continue to support the Group’s growth. Please see ‘Systems of risk management and internal control – Effectiveness review’ below; and
› working with PwC to continue to ensure a rigorous and robust approach to the annual audit, for example in relation to significant judgements made by management. As an illustration of this approach, the Committee worked with PwC prior to the Group’s post-close trading update in July 2018 to obtain PwC’s views on certain matters prior to the formal commencement of the 2018 audit.
2019 – principal areas of focusFollowing the 2018 Board evaluation, the Committee’s principal areas of focus for the 2019 financial year include:
› the timely reporting of key risk issues (in particular, those which relate to any underperforming contracts); and
› the implementation of the actions arising from the key commercial controls review undertaken by KPMG in the 2018 financial year.
In addition, and following receipt of the letter from the Financial Reporting Council (the FRC) referred to under ‘Engagement with the FRC – FRC Corporate Reporting Review’ on page 78, the Committee will oversee the implementation of any recommendations which the FRC may make.
Principal activities – 2018 financial yearThe Committee met formally four times during the year. The principal agenda items at those meetings were as follows:
September 2017
Review of the Group’s 2017 results (and ancillary matters)
The 2017 final dividend
December 2017
Evaluation of the effectiveness of the internal and external auditors
Risk management
March 2018
Review of the Group’s 2018 interim results (and ancillary matters)
The 2018 interim dividend
June 2018
The 2018 external audit plan
The 2019 internal audit plan
Approving revised non-audit fee and whistleblowing policies
Risk management
Certain other matters are considered regularly by the Committee during the year. These include:
› non-audit fees incurred by the external auditor; › whistleblowing and compliance updates; › progress against the internal audit plan; and › corporate reporting and governance developments.
Systems of risk management and internal controlGeneralInformation on how the Group manages risk, including a description of the principal aspects of the Group’s systems of risk management and internal control, is set out on pages 36 to 43 (inclusive).
Effectiveness reviewThe Code requires the Board, at least annually, to conduct a review of the effectiveness of the Group’s systems of risk management and internal control. The Board’s statement about this review is set out on page 60.
At its meeting in September 2018, the Committee reviewed management’s assessment of the key elements of these systems and confirmed their overall effectiveness, taking into account the Financial Reporting Council’s Guidance on Risk Management, Internal Control and Related Business Reporting (September 2014). In forming its conclusion, the Committee noted, in particular, that:
› of the 12 internal audits completed during the year, only one was marked as ‘red’;
› the transition to the integrated Oracle ERP system, together with the Finance Shared Services Centre, had standardised financial reporting procedures across the Group to a material extent;
› the integration of risk considerations into the Board’s review of the Group’s strategy (for example, at its meeting in December 2017);
› the discussions held by the Board with respect to its risk appetite; and
› the Board’s specific focus during the year on contract risk management.
Whistleblowing helplineThe Group makes available an externally-hosted, confidential whistleblowing helpline which employees can call if they have any concerns that they would like to raise. Any such concerns are then investigated. Following the appointment of a new helpline provider in 2017, the Group Compliance function continued its programme to raise awareness of the facility. At each Committee meeting during the year, the Committee reviewed reports which provided details of the issues reported to the helpline and how management had investigated them. No issues which were material in the context of the Group were reported to the helpline or via other means during the year.
Strategic R
eportG
overnanceFinancial S
tatements
Kier Group plc | Report and Accounts 2018 75
Board statements
IntroductionUnder the Code, the Board is required to provide a number of statements. These statements are set out on page 60.
For further information on the Committee’s work to support the Board’s statement on the Group’s systems of risk management and internal control, please see ‘Systems of risk management and internal control – Effectiveness review’ on page 74.
The Committee’s work with respect to the ‘fair, balanced and understandable’, ‘going concern’ and ‘viability’ statements is described below.
Fair, balanced and understandable reviewAt its meeting in September 2018, the Committee noted the ‘fair, balanced and understandable’ statement and the work undertaken to support it, which included:
Who? How assurance was provided
Annual Report working group › The working group comprised senior individuals who drafted the Annual Report
› The group held regular meetings to discuss material disclosure items
› The working group members reviewed the sections drafted by them in light of the ‘fair, balanced and understandable’ requirement
Key contributors to the Annual Report › Certain key contributors to sections of the Annual Report (for example, Managing Directors and Finance Directors within the business) signed a declaration confirming the accuracy of the information provided
External support › Provided by PwC, FutureValue, a corporate reporting consultancy, and Mercer, who reviewed the Directors’ Remuneration Report
The Committee and the Board › Drafts of the Annual Report were circulated to individual members of the Board, the Committee and the full Board for review
› Material disclosure items were discussed at the Committee’s meeting in September 2018
Going concernAt its meeting in September 2018, the Committee noted the going concern statement and the principal aspects of the review process conducted to support it, which included:
Going concern element How assurance was provided
Sources of funding › Reviewing the Group’s available sources of funding and, in particular, testing the covenants and assessing the available headroom using a range of assumptions
Cash flow › Reviewing the short, medium and long-term cash flow forecasts in various material downside scenarios
Current and forecast activities › Assessing the Group’s current and forecast activities, including its long-term contracts and order books, and those factors considered likely to affect its future performance and financial position
Bonding facilities › Assessing the level of available bonding facilities, which are considered necessary to support the Group’s ability to tender and deliver future growth
76 Kier Group plc | Report and Accounts 2018
Corporate Governance Statement
Risk Management and Audit Committee report continued
Viability statementAs they have done in previous years, the Directors have chosen to consider the prospects of the Group over a three-year period ending 30 June 2021, as they consider it to be a period over which they are able to forecast the Group’s performance with reasonable certainty, principally because:
› a number of programmes relating to the Group’s key projects, which are important factors in an assessment of the Group’s performance, operate over a period of up to approximately three years;
› the visibility of the Group’s secured work and bidding opportunities can reasonably be assessed over a three-year period; and › a number of the Group’s businesses produce business plans over a period of approximately three years.
At its meeting in September 2018, the Committee noted the viability statement and the work undertaken to support it. The Committee also noted that management had engaged external advisers to undertake a review of its process and methodology. The following table summarises this process, the stress-testing scenarios reviewed and the key mitigating actions applied:
Process › identify the principal risks and uncertainties relating to the Group;
› identify a number of stress-testing scenarios, together with mitigating actions for each of those scenarios; and
› draft the financial forecasts, reflecting certain assumptions with respect to the Group’s principal finance facilities (for example, their availability and the Group’s compliance with covenants), and apply the stress-testing scenarios to them; and
› draft the viability statement, having taken into account the financial performance and scenarios modelled.
Stress-testing scenarios › loss-making contracts having a significant impact on the Group’s reported profit and cash over the three-year period;
› Buildings’ turnover decreasing 15% year-on-year in the 2019, 2020 and 2021 financial years;
› Utilities not obtaining forecast contract extensions and new work in the water sector;
› gross margins decreasing materially over the three-year period;
› a material decline in the property market in the 2019 financial year, following Brexit, causing the Property business’ profits to decrease to 20% of its forecast for the 2021 financial year;
› a material decline in the house-building market in the 2019 financial year, following Brexit, causing significant volume reductions in the Residential business in the 2019 and 2020 financial years;
› payment terms across the Group tightening over the 2019 and 2020 financial years; and
› the supplier finance scheme no longer being available to Kier from January 2019 and, following the repayment of the Schuldschein and the US private placements of notes, no new financing being secured.
Key mitigating actions › overhead and cost reduction programmes delivering significant cash savings over the three-year period;
› capital expenditure being reduced significantly over the three-year period;
› the sale of non-core businesses; and
› stabilising investment in Property and Residential.
Strategic R
eportG
overnanceFinancial S
tatements
Kier Group plc | Report and Accounts 2018 77
Internal auditInternal audits – 2018 financial yearDuring the year, the Committee conducted a formal tender process to identify a new provider of co-sourced internal audit services. The process involved four firms, each of which was invited to respond to a detailed ‘request for proposal’. Following meetings between representatives of the firms, management and members of the Committee, Grant Thornton were selected and appointed with effect from 1 January 2018 to replace KPMG. Grant Thornton and KPMG then worked together to ensure an orderly transition of the 2018 internal audit plan.
During the year, the Committee monitored progress against the 2018 internal audit plan, which was approved by the Committee at its June 2017 meeting. Results from each audit were discussed by the Committee, together with the follow-up actions taken by management.
During the year, 12 internal audits were completed. Examples of these audits include:
› key commercial controls; › anti-bribery and anti-corruption procedures; › joint venture reporting; › WIP and debt management; and › treasury management.
Before each audit, the scope of review, timetable and resources required was agreed with management. Regular updates were provided to management and members of the Committee on the status of ongoing audits.
Internal audits – 2019 financial yearAt its June 2018 meeting, the Committee approved the 2019 internal audit plan. Audits planned for the 2019 financial year include:
› contract governance controls; › miscellaneous procurement-related audits; › information security; › tax – a review of data flow from the business to Group Tax; and › expenses system – a review of compliance with the Group’s
expenses policy.
Internal audit function effectivenessTo assess the effectiveness of the internal audit function, members of the Committee and senior management completed a detailed questionnaire addressing various aspects of both the internal audit function’s and KPMG’s performance. The feedback was then reviewed by the Committee at its meeting in December 2017.
The Committee concluded that, overall, the Internal Audit function was operating effectively. A summary of the results of the review is as follows:
Strengths › The link between the business and the RMAC provided
by management › Clear audit reports assist the business in its management
of risk › Internal audit plan is well-structured
Future areas of focus › Continue to develop Grant Thornton’s understanding of
the business › Continue to focus on completing audits, and agreeing the
recommendations, promptly › Increased use of technology to drive efficiency
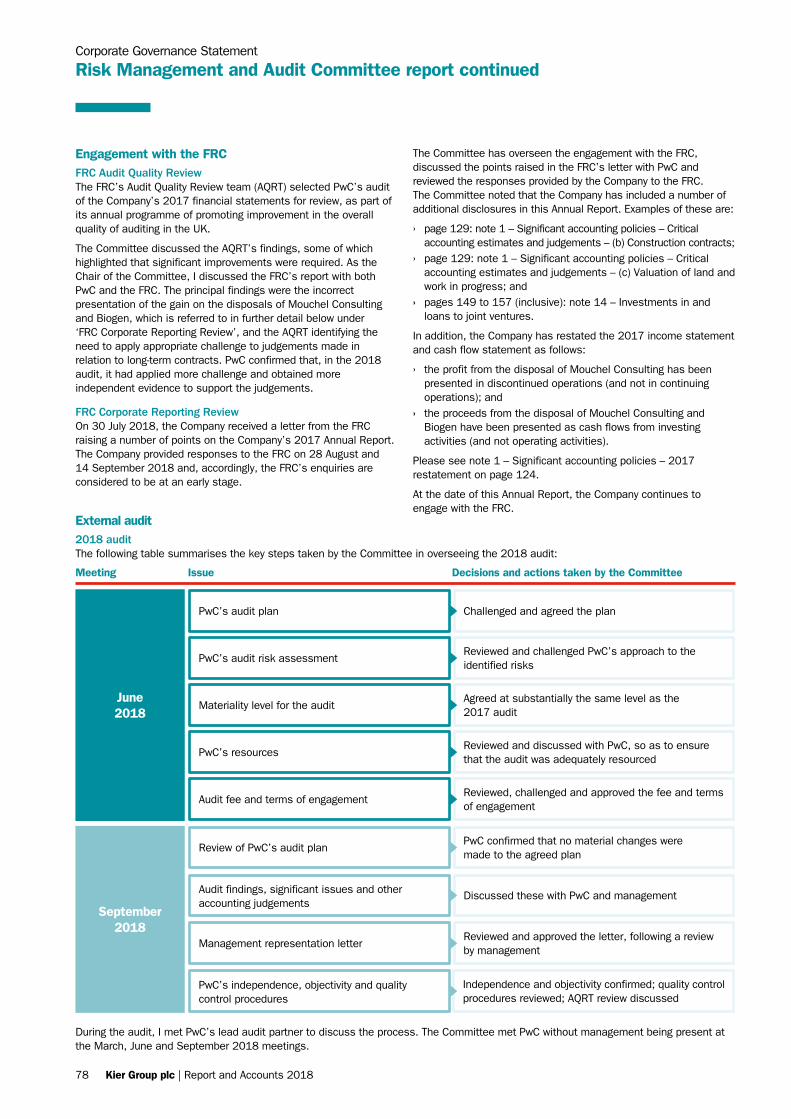
78 Kier Group plc | Report and Accounts 2018
Corporate Governance Statement
Risk Management and Audit Committee report continued
Engagement with the FRCFRC Audit Quality Review The FRC’s Audit Quality Review team (AQRT) selected PwC’s audit of the Company’s 2017 financial statements for review, as part of its annual programme of promoting improvement in the overall quality of auditing in the UK.
The Committee discussed the AQRT’s findings, some of which highlighted that significant improvements were required. As the Chair of the Committee, I discussed the FRC’s report with both PwC and the FRC. The principal findings were the incorrect presentation of the gain on the disposals of Mouchel Consulting and Biogen, which is referred to in further detail below under ‘FRC Corporate Reporting Review’, and the AQRT identifying the need to apply appropriate challenge to judgements made in relation to long-term contracts. PwC confirmed that, in the 2018 audit, it had applied more challenge and obtained more independent evidence to support the judgements.
FRC Corporate Reporting ReviewOn 30 July 2018, the Company received a letter from the FRC raising a number of points on the Company’s 2017 Annual Report. The Company provided responses to the FRC on 28 August and 14 September 2018 and, accordingly, the FRC’s enquiries are considered to be at an early stage.
The Committee has overseen the engagement with the FRC, discussed the points raised in the FRC’s letter with PwC and reviewed the responses provided by the Company to the FRC. The Committee noted that the Company has included a number of additional disclosures in this Annual Report. Examples of these are:
› page 129: note 1 – Significant accounting policies – Critical accounting estimates and judgements – (b) Construction contracts;
› page 129: note 1 – Significant accounting policies – Critical accounting estimates and judgements – (c) Valuation of land and work in progress; and
› pages 149 to 157 (inclusive): note 14 – Investments in and loans to joint ventures.
In addition, the Company has restated the 2017 income statement and cash flow statement as follows:
› the profit from the disposal of Mouchel Consulting has been presented in discontinued operations (and not in continuing operations); and
› the proceeds from the disposal of Mouchel Consulting and Biogen have been presented as cash flows from investing activities (and not operating activities).
Please see note 1 – Significant accounting policies – 2017 restatement on page 124.
At the date of this Annual Report, the Company continues to engage with the FRC.
During the audit, I met PwC’s lead audit partner to discuss the process. The Committee met PwC without management being present at the March, June and September 2018 meetings.
Meeting Issue Decisions and actions taken by the Committee
June 2018
Challenged and agreed the planPwC’s audit plan
Agreed at substantially the same level as the 2017 audit
Materiality level for the audit
Reviewed and challenged PwC’s approach to the identified risks
PwC’s audit risk assessment
Reviewed and discussed with PwC, so as to ensure that the audit was adequately resourced
PwC’s resources
September 2018
PwC confirmed that no material changes were made to the agreed plan
Review of PwC’s audit plan
Reviewed and approved the letter, following a review by management
Management representation letter
Discussed these with PwC and managementAudit findings, significant issues and other accounting judgements
Independence and objectivity confirmed; quality control procedures reviewed; AQRT review discussed
PwC’s independence, objectivity and quality control procedures
Reviewed, challenged and approved the fee and terms of engagement
Audit fee and terms of engagement
External audit2018 auditThe following table summarises the key steps taken by the Committee in overseeing the 2018 audit:
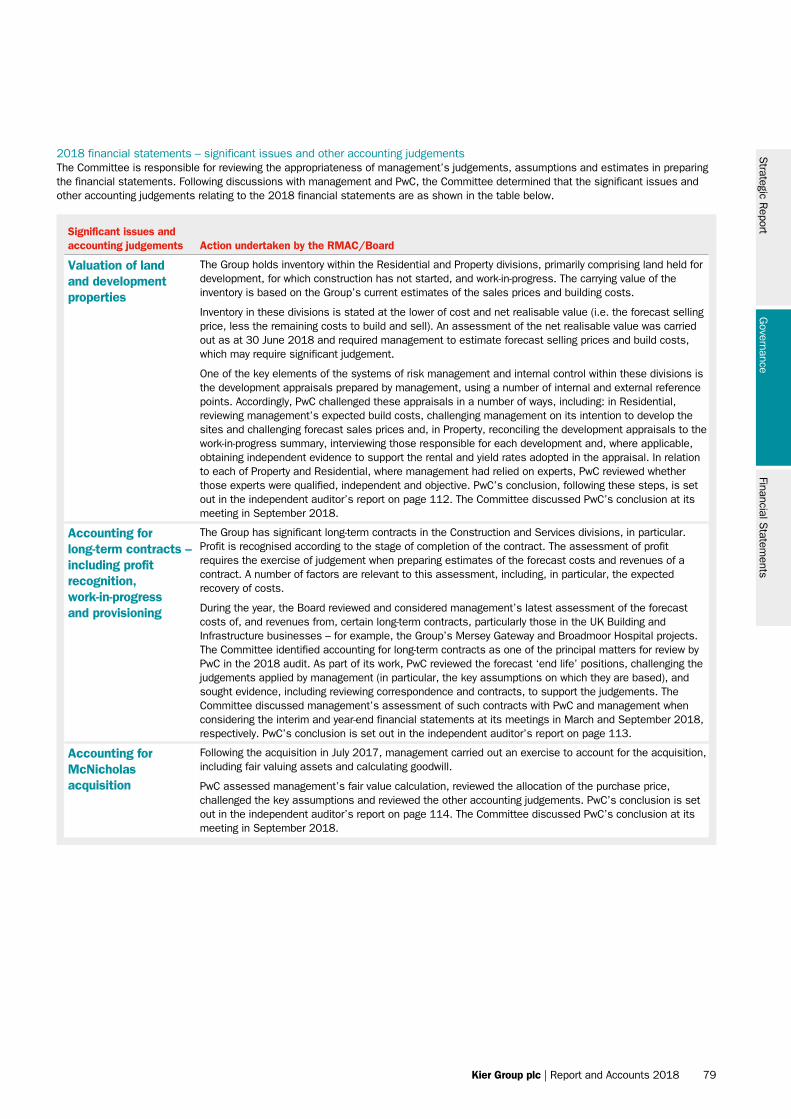
Strategic R
eportG
overnanceFinancial S
tatements
Kier Group plc | Report and Accounts 2018 79
2018 financial statements – significant issues and other accounting judgementsThe Committee is responsible for reviewing the appropriateness of management’s judgements, assumptions and estimates in preparing the financial statements. Following discussions with management and PwC, the Committee determined that the significant issues and other accounting judgements relating to the 2018 financial statements are as shown in the table below.
Significant issues and accounting judgements Action undertaken by the RMAC/Board
Valuation of land and development properties
The Group holds inventory within the Residential and Property divisions, primarily comprising land held for development, for which construction has not started, and work-in-progress. The carrying value of the inventory is based on the Group’s current estimates of the sales prices and building costs.
Inventory in these divisions is stated at the lower of cost and net realisable value (i.e. the forecast selling price, less the remaining costs to build and sell). An assessment of the net realisable value was carried out as at 30 June 2018 and required management to estimate forecast selling prices and build costs, which may require significant judgement.
One of the key elements of the systems of risk management and internal control within these divisions is the development appraisals prepared by management, using a number of internal and external reference points. Accordingly, PwC challenged these appraisals in a number of ways, including: in Residential, reviewing management’s expected build costs, challenging management on its intention to develop the sites and challenging forecast sales prices and, in Property, reconciling the development appraisals to the work-in-progress summary, interviewing those responsible for each development and, where applicable, obtaining independent evidence to support the rental and yield rates adopted in the appraisal. In relation to each of Property and Residential, where management had relied on experts, PwC reviewed whether those experts were qualified, independent and objective. PwC’s conclusion, following these steps, is set out in the independent auditor’s report on page 112. The Committee discussed PwC’s conclusion at its meeting in September 2018.
Accounting for long-term contracts – including profit recognition, work-in-progress and provisioning
The Group has significant long-term contracts in the Construction and Services divisions, in particular. Profit is recognised according to the stage of completion of the contract. The assessment of profit requires the exercise of judgement when preparing estimates of the forecast costs and revenues of a contract. A number of factors are relevant to this assessment, including, in particular, the expected recovery of costs.
During the year, the Board reviewed and considered management’s latest assessment of the forecast costs of, and revenues from, certain long-term contracts, particularly those in the UK Building and Infrastructure businesses – for example, the Group’s Mersey Gateway and Broadmoor Hospital projects. The Committee identified accounting for long-term contracts as one of the principal matters for review by PwC in the 2018 audit. As part of its work, PwC reviewed the forecast ‘end life’ positions, challenging the judgements applied by management (in particular, the key assumptions on which they are based), and sought evidence, including reviewing correspondence and contracts, to support the judgements. The Committee discussed management’s assessment of such contracts with PwC and management when considering the interim and year-end financial statements at its meetings in March and September 2018, respectively. PwC’s conclusion is set out in the independent auditor’s report on page 113.
Accounting for McNicholas acquisition
Following the acquisition in July 2017, management carried out an exercise to account for the acquisition, including fair valuing assets and calculating goodwill.
PwC assessed management’s fair value calculation, reviewed the allocation of the purchase price, challenged the key assumptions and reviewed the other accounting judgements. PwC’s conclusion is set out in the independent auditor’s report on page 114. The Committee discussed PwC’s conclusion at its meeting in September 2018.
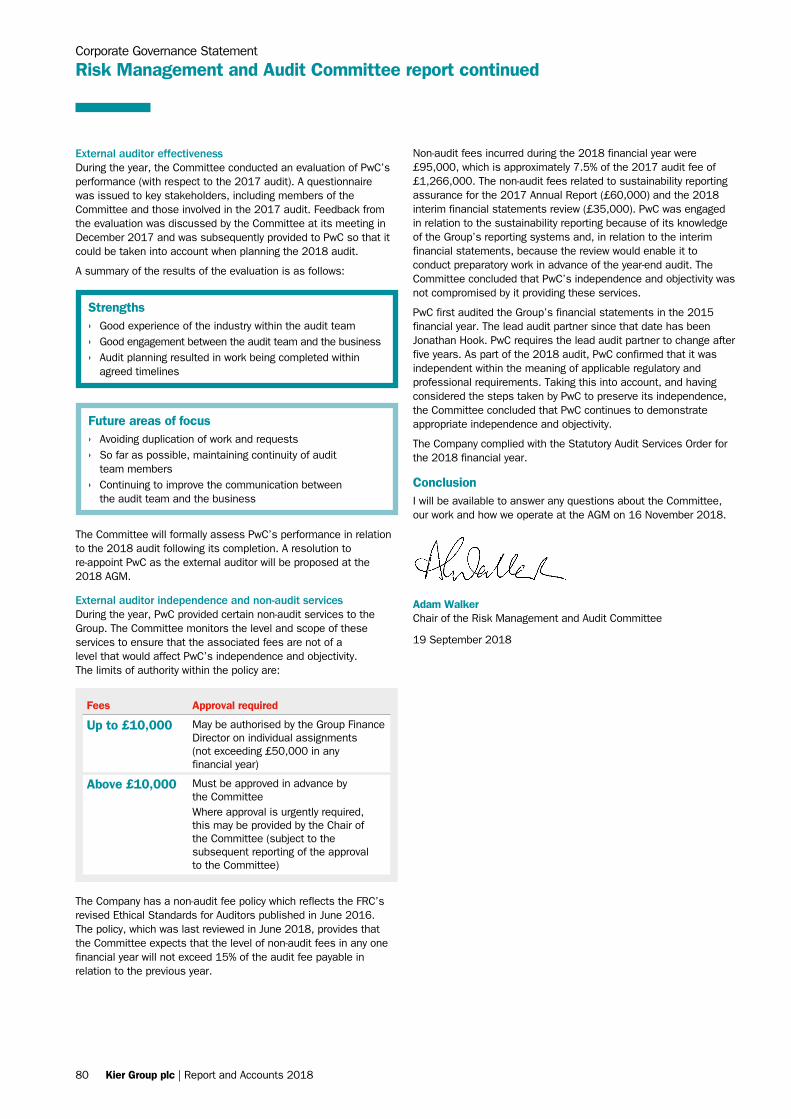
80 Kier Group plc | Report and Accounts 2018
Non-audit fees incurred during the 2018 financial year were £95,000, which is approximately 7.5% of the 2017 audit fee of £1,266,000. The non-audit fees related to sustainability reporting assurance for the 2017 Annual Report (£60,000) and the 2018 interim financial statements review (£35,000). PwC was engaged in relation to the sustainability reporting because of its knowledge of the Group’s reporting systems and, in relation to the interim financial statements, because the review would enable it to conduct preparatory work in advance of the year-end audit. The Committee concluded that PwC’s independence and objectivity was not compromised by it providing these services.
PwC first audited the Group’s financial statements in the 2015 financial year. The lead audit partner since that date has been Jonathan Hook. PwC requires the lead audit partner to change after five years. As part of the 2018 audit, PwC confirmed that it was independent within the meaning of applicable regulatory and professional requirements. Taking this into account, and having considered the steps taken by PwC to preserve its independence, the Committee concluded that PwC continues to demonstrate appropriate independence and objectivity.
The Company complied with the Statutory Audit Services Order for the 2018 financial year.
ConclusionI will be available to answer any questions about the Committee, our work and how we operate at the AGM on 16 November 2018.
Adam WalkerChair of the Risk Management and Audit Committee
19 September 2018
External auditor effectivenessDuring the year, the Committee conducted an evaluation of PwC’s performance (with respect to the 2017 audit). A questionnaire was issued to key stakeholders, including members of the Committee and those involved in the 2017 audit. Feedback from the evaluation was discussed by the Committee at its meeting in December 2017 and was subsequently provided to PwC so that it could be taken into account when planning the 2018 audit.
A summary of the results of the evaluation is as follows:
Fees Approval required
Up to £10,000 May be authorised by the Group Finance Director on individual assignments (not exceeding £50,000 in any financial year)
Above £10,000 Must be approved in advance by the CommitteeWhere approval is urgently required, this may be provided by the Chair of the Committee (subject to the subsequent reporting of the approval to the Committee)
Corporate Governance Statement
Risk Management and Audit Committee report continued
Strengths › Good experience of the industry within the audit team › Good engagement between the audit team and the business › Audit planning resulted in work being completed within
agreed timelines
Future areas of focus › Avoiding duplication of work and requests › So far as possible, maintaining continuity of audit
team members › Continuing to improve the communication between
the audit team and the business
The Committee will formally assess PwC’s performance in relation to the 2018 audit following its completion. A resolution to re-appoint PwC as the external auditor will be proposed at the 2018 AGM.
External auditor independence and non-audit servicesDuring the year, PwC provided certain non-audit services to the Group. The Committee monitors the level and scope of these services to ensure that the associated fees are not of a level that would affect PwC’s independence and objectivity. The limits of authority within the policy are:
The Company has a non-audit fee policy which reflects the FRC’s revised Ethical Standards for Auditors published in June 2016. The policy, which was last reviewed in June 2018, provides that the Committee expects that the level of non-audit fees in any one financial year will not exceed 15% of the audit fee payable in relation to the previous year.
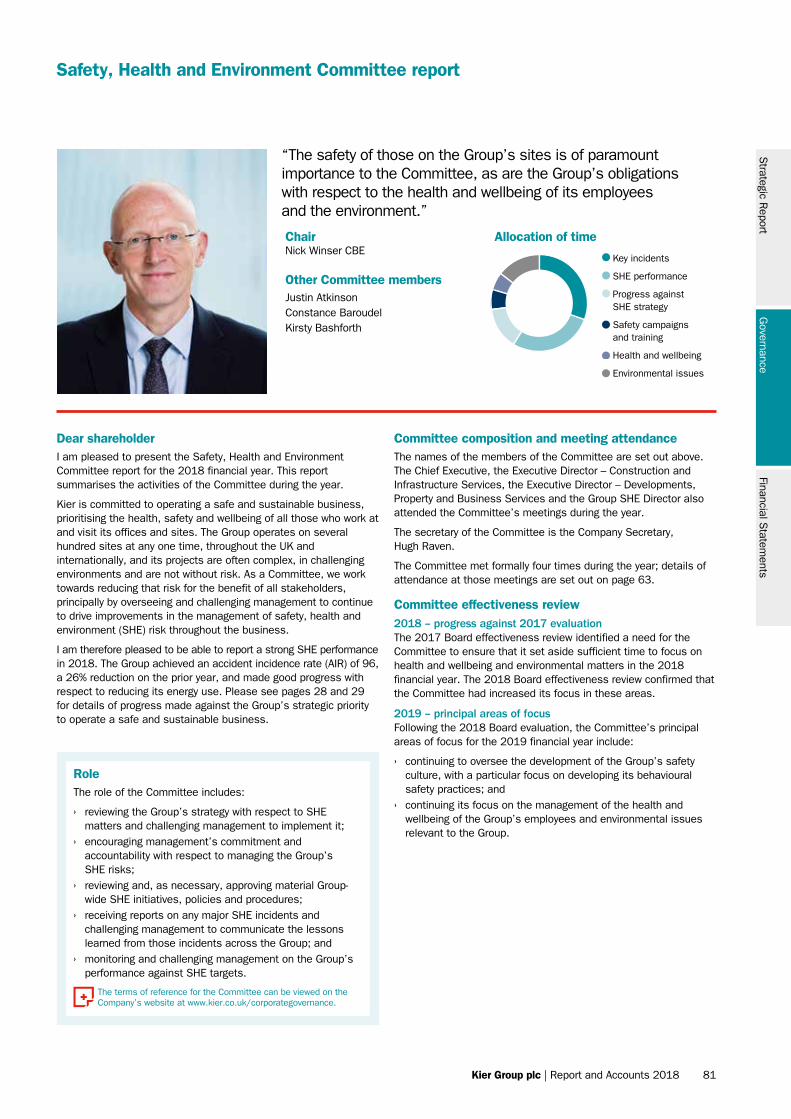
Strategic R
eportG
overnanceFinancial S
tatements
Kier Group plc | Report and Accounts 2018 81
Safety, Health and Environment Committee report
Dear shareholderI am pleased to present the Safety, Health and Environment Committee report for the 2018 financial year. This report summarises the activities of the Committee during the year.
Kier is committed to operating a safe and sustainable business, prioritising the health, safety and wellbeing of all those who work at and visit its offices and sites. The Group operates on several hundred sites at any one time, throughout the UK and internationally, and its projects are often complex, in challenging environments and are not without risk. As a Committee, we work towards reducing that risk for the benefit of all stakeholders, principally by overseeing and challenging management to continue to drive improvements in the management of safety, health and environment (SHE) risk throughout the business.
I am therefore pleased to be able to report a strong SHE performance in 2018. The Group achieved an accident incidence rate (AIR) of 96, a 26% reduction on the prior year, and made good progress with respect to reducing its energy use. Please see pages 28 and 29 for details of progress made against the Group’s strategic priority to operate a safe and sustainable business.
Committee composition and meeting attendanceThe names of the members of the Committee are set out above. The Chief Executive, the Executive Director – Construction and Infrastructure Services, the Executive Director – Developments, Property and Business Services and the Group SHE Director also attended the Committee’s meetings during the year.
The secretary of the Committee is the Company Secretary, Hugh Raven.
The Committee met formally four times during the year; details of attendance at those meetings are set out on page 63.
Committee effectiveness review2018 – progress against 2017 evaluationThe 2017 Board effectiveness review identified a need for the Committee to ensure that it set aside sufficient time to focus on health and wellbeing and environmental matters in the 2018 financial year. The 2018 Board effectiveness review confirmed that the Committee had increased its focus in these areas.
2019 – principal areas of focusFollowing the 2018 Board evaluation, the Committee’s principal areas of focus for the 2019 financial year include:
› continuing to oversee the development of the Group’s safety culture, with a particular focus on developing its behavioural safety practices; and
› continuing its focus on the management of the health and wellbeing of the Group’s employees and environmental issues relevant to the Group.
RoleThe role of the Committee includes:
› reviewing the Group’s strategy with respect to SHE matters and challenging management to implement it;
› encouraging management’s commitment and accountability with respect to managing the Group’s SHE risks;
› reviewing and, as necessary, approving material Group-wide SHE initiatives, policies and procedures;
› receiving reports on any major SHE incidents and challenging management to communicate the lessons learned from those incidents across the Group; and
› monitoring and challenging management on the Group’s performance against SHE targets.
The terms of reference for the Committee can be viewed on the Company’s website at www.kier.co.uk/corporategovernance.
ChairNick Winser CBE Other Committee membersJustin AtkinsonConstance BaroudelKirsty Bashforth
Allocation of time
“The safety of those on the Group’s sites is of paramount importance to the Committee, as are the Group’s obligations with respect to the health and wellbeing of its employees and the environment.”
Allocation of time
Key incidents
SHE performance
Progress against SHE strategy
Safety campaigns and training
Health and wellbeing
Environmental issues
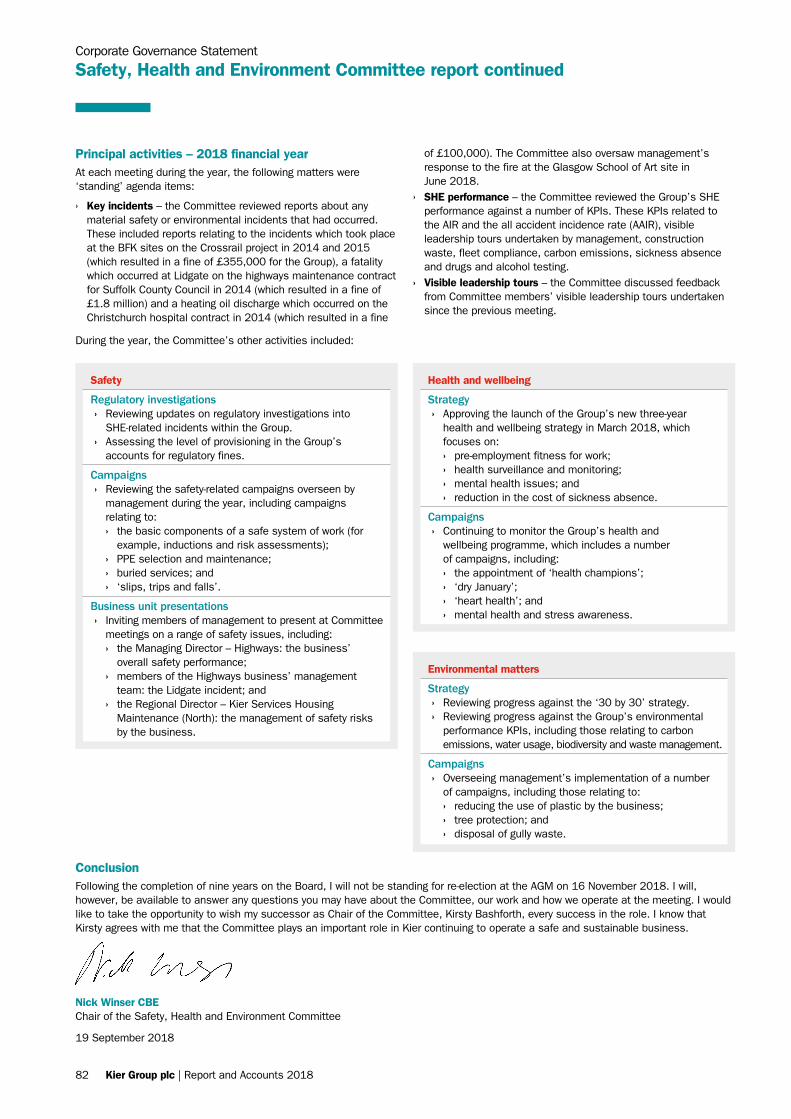
82 Kier Group plc | Report and Accounts 2018
ConclusionFollowing the completion of nine years on the Board, I will not be standing for re-election at the AGM on 16 November 2018. I will, however, be available to answer any questions you may have about the Committee, our work and how we operate at the meeting. I would like to take the opportunity to wish my successor as Chair of the Committee, Kirsty Bashforth, every success in the role. I know that Kirsty agrees with me that the Committee plays an important role in Kier continuing to operate a safe and sustainable business.
Nick Winser CBEChair of the Safety, Health and Environment Committee
19 September 2018
Corporate Governance Statement
Safety, Health and Environment Committee report continued
Principal activities – 2018 financial yearAt each meeting during the year, the following matters were ‘standing’ agenda items:
› Key incidents – the Committee reviewed reports about any material safety or environmental incidents that had occurred. These included reports relating to the incidents which took place at the BFK sites on the Crossrail project in 2014 and 2015 (which resulted in a fine of £355,000 for the Group), a fatality which occurred at Lidgate on the highways maintenance contract for Suffolk County Council in 2014 (which resulted in a fine of £1.8 million) and a heating oil discharge which occurred on the Christchurch hospital contract in 2014 (which resulted in a fine
Safety
Regulatory investigations › Reviewing updates on regulatory investigations into
SHE-related incidents within the Group. › Assessing the level of provisioning in the Group’s
accounts for regulatory fines.
Campaigns › Reviewing the safety-related campaigns overseen by
management during the year, including campaigns relating to: › the basic components of a safe system of work (for
example, inductions and risk assessments); › PPE selection and maintenance; › buried services; and › ‘slips, trips and falls’.
Business unit presentations › Inviting members of management to present at Committee
meetings on a range of safety issues, including: › the Managing Director – Highways: the business’
overall safety performance; › members of the Highways business’ management
team: the Lidgate incident; and › the Regional Director – Kier Services Housing
Maintenance (North): the management of safety risks by the business.
Health and wellbeing
Strategy › Approving the launch of the Group’s new three-year
health and wellbeing strategy in March 2018, which focuses on: › pre-employment fitness for work; › health surveillance and monitoring; › mental health issues; and › reduction in the cost of sickness absence.
Campaigns › Continuing to monitor the Group’s health and
wellbeing programme, which includes a number of campaigns, including: › the appointment of ‘health champions’; › ‘dry January’; › ‘heart health’; and › mental health and stress awareness.
Environmental matters
Strategy › Reviewing progress against the ‘30 by 30’ strategy. › Reviewing progress against the Group’s environmental
performance KPIs, including those relating to carbon emissions, water usage, biodiversity and waste management.
Campaigns › Overseeing management’s implementation of a number
of campaigns, including those relating to: › reducing the use of plastic by the business; › tree protection; and › disposal of gully waste.
During the year, the Committee’s other activities included:
of £100,000). The Committee also oversaw management’s response to the fire at the Glasgow School of Art site in June 2018.
› SHE performance – the Committee reviewed the Group’s SHE performance against a number of KPIs. These KPIs related to the AIR and the all accident incidence rate (AAIR), visible leadership tours undertaken by management, construction waste, fleet compliance, carbon emissions, sickness absence and drugs and alcohol testing.
› Visible leadership tours – the Committee discussed feedback from Committee members’ visible leadership tours undertaken since the previous meeting.
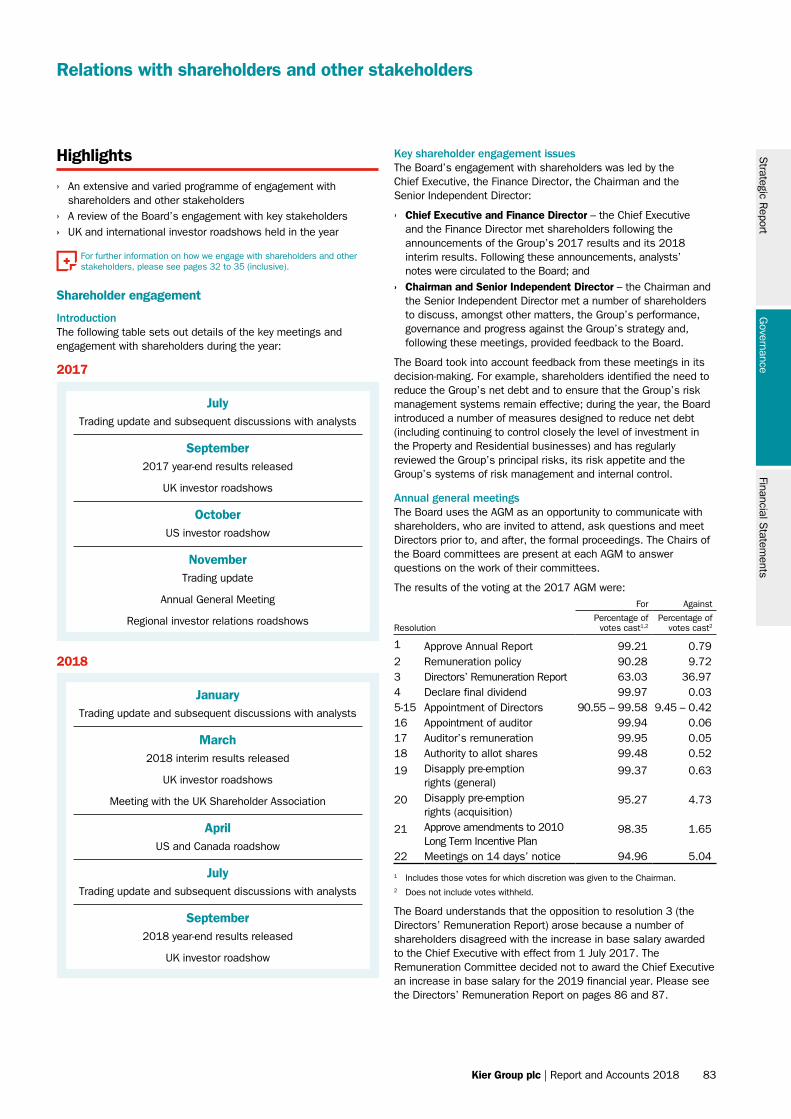
Strategic R
eportG
overnanceFinancial S
tatements
Kier Group plc | Report and Accounts 2018 83
Relations with shareholders and other stakeholders
2017
2018
Highlights
› An extensive and varied programme of engagement with shareholders and other stakeholders
› A review of the Board’s engagement with key stakeholders › UK and international investor roadshows held in the year
JulyTrading update and subsequent discussions with analysts
September2017 year-end results released
UK investor roadshows
OctoberUS investor roadshow
NovemberTrading update
Annual General Meeting
Regional investor relations roadshows
JanuaryTrading update and subsequent discussions with analysts
March2018 interim results released
UK investor roadshows
Meeting with the UK Shareholder Association
AprilUS and Canada roadshow
JulyTrading update and subsequent discussions with analysts
September2018 year-end results released
UK investor roadshow
For further information on how we engage with shareholders and other stakeholders, please see pages 32 to 35 (inclusive).
Shareholder engagement
IntroductionThe following table sets out details of the key meetings and engagement with shareholders during the year:
Key shareholder engagement issuesThe Board’s engagement with shareholders was led by the Chief Executive, the Finance Director, the Chairman and the Senior Independent Director:
› Chief Executive and Finance Director – the Chief Executive and the Finance Director met shareholders following the announcements of the Group’s 2017 results and its 2018 interim results. Following these announcements, analysts’ notes were circulated to the Board; and
› Chairman and Senior Independent Director – the Chairman and the Senior Independent Director met a number of shareholders to discuss, amongst other matters, the Group’s performance, governance and progress against the Group’s strategy and, following these meetings, provided feedback to the Board.
The Board took into account feedback from these meetings in its decision-making. For example, shareholders identified the need to reduce the Group’s net debt and to ensure that the Group’s risk management systems remain effective; during the year, the Board introduced a number of measures designed to reduce net debt (including continuing to control closely the level of investment in the Property and Residential businesses) and has regularly reviewed the Group’s principal risks, its risk appetite and the Group’s systems of risk management and internal control.
Annual general meetingsThe Board uses the AGM as an opportunity to communicate with shareholders, who are invited to attend, ask questions and meet Directors prior to, and after, the formal proceedings. The Chairs of the Board committees are present at each AGM to answer questions on the work of their committees.
The results of the voting at the 2017 AGM were:
Resolution
For Against
Percentage of votes cast1,2
Percentage of votes cast2
1 Approve Annual Report 99.21 0.792 Remuneration policy 90.28 9.723 Directors’ Remuneration Report 63.03 36.974 Declare final dividend 99.97 0.035-15 Appointment of Directors 90.55 – 99.58 9.45 – 0.4216 Appointment of auditor 99.94 0.0617 Auditor’s remuneration 99.95 0.0518 Authority to allot shares 99.48 0.52
19 Disapply pre-emption rights (general)
99.37 0.63
20 Disapply pre-emption rights (acquisition)
95.27 4.73
21 Approve amendments to 2010 Long Term Incentive Plan
98.35 1.65
22 Meetings on 14 days’ notice 94.96 5.04
1 Includes those votes for which discretion was given to the Chairman.2 Does not include votes withheld.
The Board understands that the opposition to resolution 3 (the Directors’ Remuneration Report) arose because a number of shareholders disagreed with the increase in base salary awarded to the Chief Executive with effect from 1 July 2017. The Remuneration Committee decided not to award the Chief Executive an increase in base salary for the 2019 financial year. Please see the Directors’ Remuneration Report on pages 86 and 87.
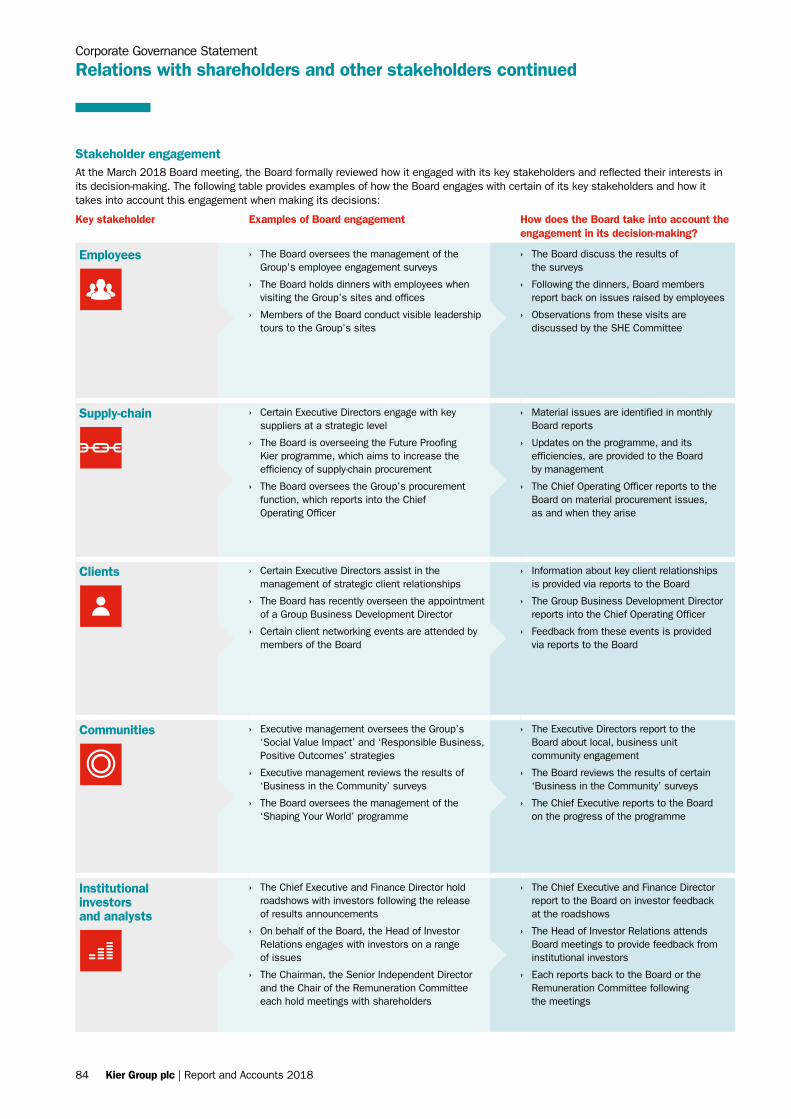
84 Kier Group plc | Report and Accounts 2018
Corporate Governance Statement
Relations with shareholders and other stakeholders continued
Stakeholder engagementAt the March 2018 Board meeting, the Board formally reviewed how it engaged with its key stakeholders and reflected their interests in its decision-making. The following table provides examples of how the Board engages with certain of its key stakeholders and how it takes into account this engagement when making its decisions:
Key stakeholder Examples of Board engagement How does the Board take into account the engagement in its decision-making?
Employees › The Board oversees the management of the Group’s employee engagement surveys
› The Board holds dinners with employees when visiting the Group’s sites and offices
› Members of the Board conduct visible leadership tours to the Group’s sites
› The Board discuss the results of the surveys
› Following the dinners, Board members report back on issues raised by employees
› Observations from these visits are discussed by the SHE Committee
Supply-chain › Certain Executive Directors engage with key suppliers at a strategic level
› The Board is overseeing the Future Proofing Kier programme, which aims to increase the efficiency of supply-chain procurement
› The Board oversees the Group’s procurement function, which reports into the Chief Operating Officer
› Material issues are identified in monthly Board reports
› Updates on the programme, and its efficiencies, are provided to the Board by management
› The Chief Operating Officer reports to the Board on material procurement issues, as and when they arise
Clients › Certain Executive Directors assist in the management of strategic client relationships
› The Board has recently overseen the appointment of a Group Business Development Director
› Certain client networking events are attended by members of the Board
› Information about key client relationships is provided via reports to the Board
› The Group Business Development Director reports into the Chief Operating Officer
› Feedback from these events is provided via reports to the Board
Communities › Executive management oversees the Group’s ‘Social Value Impact’ and ‘Responsible Business, Positive Outcomes’ strategies
› Executive management reviews the results of ‘Business in the Community’ surveys
› The Board oversees the management of the ‘Shaping Your World’ programme
› The Executive Directors report to the Board about local, business unit community engagement
› The Board reviews the results of certain ‘Business in the Community’ surveys
› The Chief Executive reports to the Board on the progress of the programme
Institutional investors and analysts
› The Chief Executive and Finance Director hold roadshows with investors following the release of results announcements
› On behalf of the Board, the Head of Investor Relations engages with investors on a range of issues
› The Chairman, the Senior Independent Director and the Chair of the Remuneration Committee each hold meetings with shareholders
› The Chief Executive and Finance Director report to the Board on investor feedback at the roadshows
› The Head of Investor Relations attends Board meetings to provide feedback from institutional investors
› Each reports back to the Board or the Remuneration Committee following the meetings
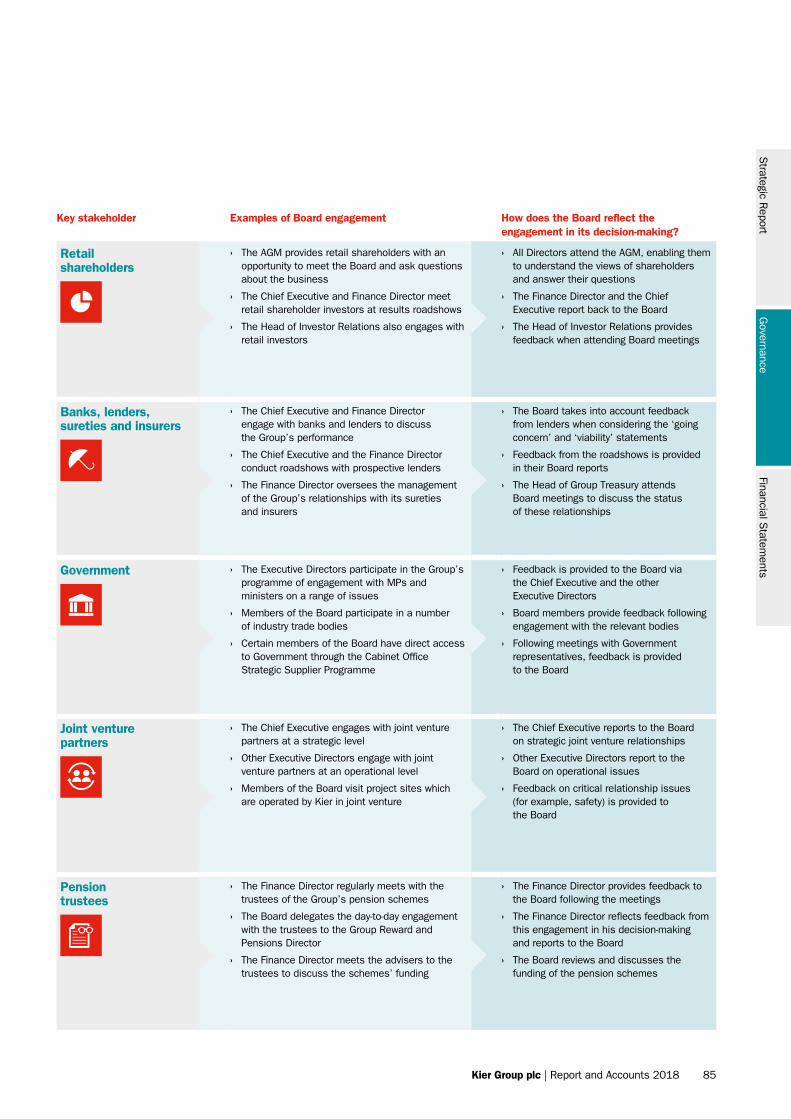
Strategic R
eportG
overnanceFinancial S
tatements
Kier Group plc | Report and Accounts 2018 85
Key stakeholder Examples of Board engagement How does the Board reflect the engagement in its decision-making?
Retail shareholders
› The AGM provides retail shareholders with an opportunity to meet the Board and ask questions about the business
› The Chief Executive and Finance Director meet retail shareholder investors at results roadshows
› The Head of Investor Relations also engages with retail investors
› All Directors attend the AGM, enabling them to understand the views of shareholders and answer their questions
› The Finance Director and the Chief Executive report back to the Board
› The Head of Investor Relations provides feedback when attending Board meetings
Banks, lenders, sureties and insurers
› The Chief Executive and Finance Director engage with banks and lenders to discuss the Group’s performance
› The Chief Executive and the Finance Director conduct roadshows with prospective lenders
› The Finance Director oversees the management of the Group’s relationships with its sureties and insurers
› The Board takes into account feedback from lenders when considering the ‘going concern’ and ‘viability’ statements
› Feedback from the roadshows is provided in their Board reports
› The Head of Group Treasury attends Board meetings to discuss the status of these relationships
Government › The Executive Directors participate in the Group’s programme of engagement with MPs and ministers on a range of issues
› Members of the Board participate in a number of industry trade bodies
› Certain members of the Board have direct access to Government through the Cabinet Office Strategic Supplier Programme
› Feedback is provided to the Board via the Chief Executive and the other Executive Directors
› Board members provide feedback following engagement with the relevant bodies
› Following meetings with Government representatives, feedback is provided to the Board
Joint venture partners
› The Chief Executive engages with joint venture partners at a strategic level
› Other Executive Directors engage with joint venture partners at an operational level
› Members of the Board visit project sites which are operated by Kier in joint venture
› The Chief Executive reports to the Board on strategic joint venture relationships
› Other Executive Directors report to the Board on operational issues
› Feedback on critical relationship issues (for example, safety) is provided to the Board
Pension trustees
› The Finance Director regularly meets with the trustees of the Group’s pension schemes
› The Board delegates the day-to-day engagement with the trustees to the Group Reward and Pensions Director
› The Finance Director meets the advisers to the trustees to discuss the schemes’ funding
› The Finance Director provides feedback to the Board following the meetings
› The Finance Director reflects feedback from this engagement in his decision-making and reports to the Board
› The Board reviews and discusses the funding of the pension schemes
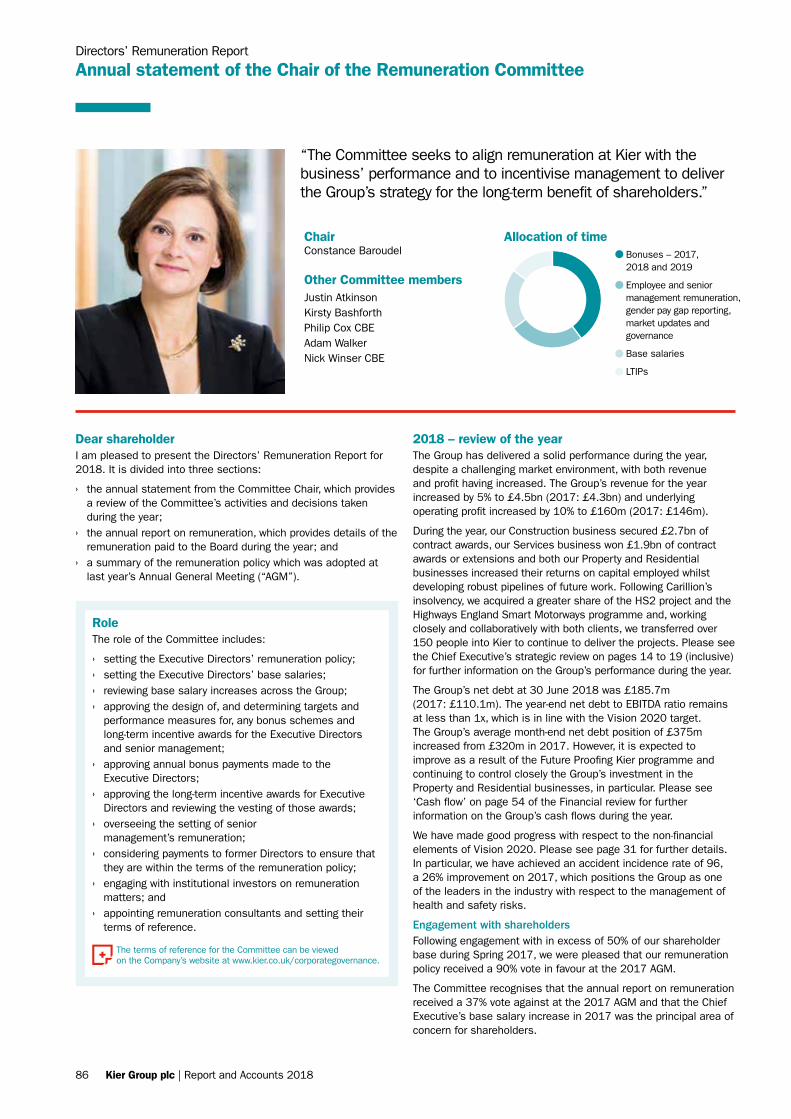
Directors’ Remuneration Report
Annual statement of the Chair of the Remuneration Committee
Dear shareholderI am pleased to present the Directors’ Remuneration Report for 2018. It is divided into three sections:
› the annual statement from the Committee Chair, which provides a review of the Committee’s activities and decisions taken during the year;
› the annual report on remuneration, which provides details of the remuneration paid to the Board during the year; and
› a summary of the remuneration policy which was adopted at last year’s Annual General Meeting (“AGM”).
2018 – review of the yearThe Group has delivered a solid performance during the year, despite a challenging market environment, with both revenue and profit having increased. The Group’s revenue for the year increased by 5% to £4.5bn (2017: £4.3bn) and underlying operating profit increased by 10% to £160m (2017: £146m).
During the year, our Construction business secured £2.7bn of contract awards, our Services business won £1.9bn of contract awards or extensions and both our Property and Residential businesses increased their returns on capital employed whilst developing robust pipelines of future work. Following Carillion’s insolvency, we acquired a greater share of the HS2 project and the Highways England Smart Motorways programme and, working closely and collaboratively with both clients, we transferred over 150 people into Kier to continue to deliver the projects. Please see the Chief Executive’s strategic review on pages 14 to 19 (inclusive) for further information on the Group’s performance during the year.
The Group’s net debt at 30 June 2018 was £185.7m (2017: £110.1m). The year-end net debt to EBITDA ratio remains at less than 1x, which is in line with the Vision 2020 target. The Group’s average month-end net debt position of £375m increased from £320m in 2017. However, it is expected to improve as a result of the Future Proofing Kier programme and continuing to control closely the Group’s investment in the Property and Residential businesses, in particular. Please see ‘Cash flow’ on page 54 of the Financial review for further information on the Group’s cash flows during the year.
We have made good progress with respect to the non-financial elements of Vision 2020. Please see page 31 for further details. In particular, we have achieved an accident incidence rate of 96, a 26% improvement on 2017, which positions the Group as one of the leaders in the industry with respect to the management of health and safety risks.
Engagement with shareholdersFollowing engagement with in excess of 50% of our shareholder base during Spring 2017, we were pleased that our remuneration policy received a 90% vote in favour at the 2017 AGM.
The Committee recognises that the annual report on remuneration received a 37% vote against at the 2017 AGM and that the Chief Executive’s base salary increase in 2017 was the principal area of concern for shareholders.
ChairConstance Baroudel Other Committee membersJustin AtkinsonKirsty BashforthPhilip Cox CBEAdam WalkerNick Winser CBE
Allocation of time
“The Committee seeks to align remuneration at Kier with the business’ performance and to incentivise management to deliver the Group’s strategy for the long-term benefit of shareholders.”
Allocation of time
Bonuses – 2017, 2018 and 2019
Employee and senior management remuneration, gender pay gap reporting, market updates and governance
Base salaries
LTIPs
RoleThe role of the Committee includes:
› setting the Executive Directors’ remuneration policy; › setting the Executive Directors’ base salaries; › reviewing base salary increases across the Group; › approving the design of, and determining targets and
performance measures for, any bonus schemes and long-term incentive awards for the Executive Directors and senior management;
› approving annual bonus payments made to the Executive Directors;
› approving the long-term incentive awards for Executive Directors and reviewing the vesting of those awards;
› overseeing the setting of senior management’s remuneration;
› considering payments to former Directors to ensure that they are within the terms of the remuneration policy;
› engaging with institutional investors on remuneration matters; and
› appointing remuneration consultants and setting their terms of reference.
The terms of reference for the Committee can be viewed on the Company’s website at www.kier.co.uk/corporategovernance.
86 Kier Group plc | Report and Accounts 2018
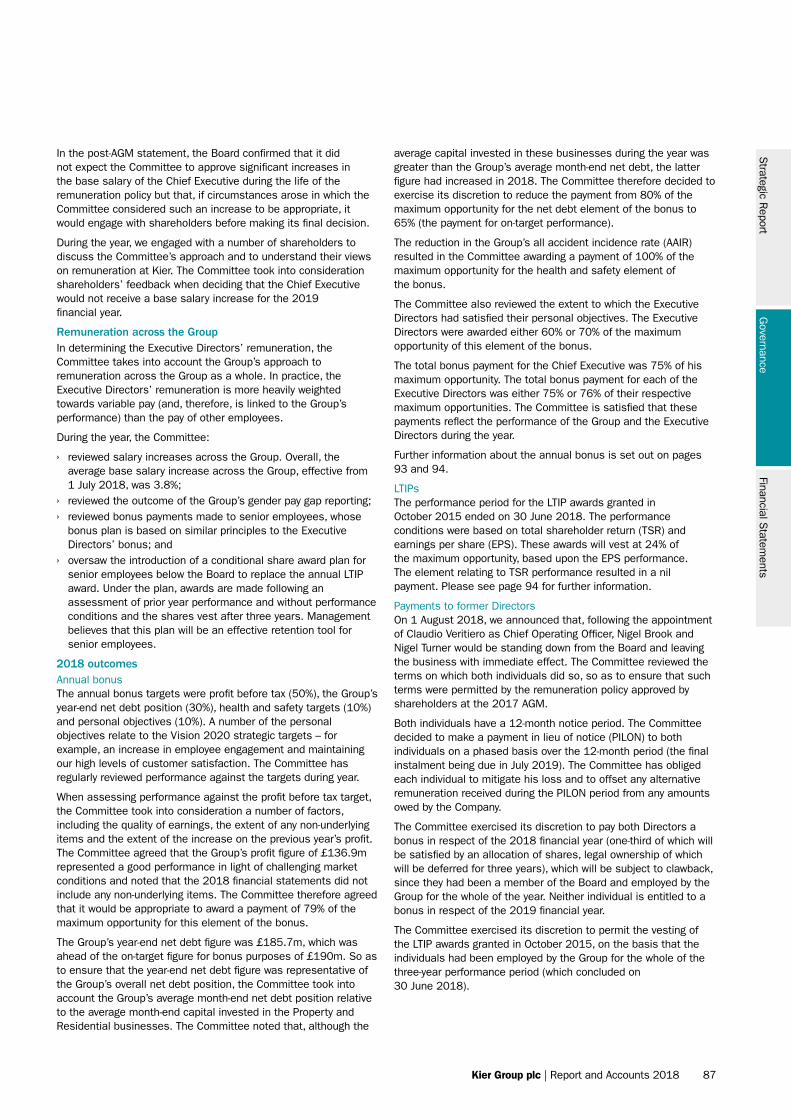
In the post-AGM statement, the Board confirmed that it did not expect the Committee to approve significant increases in the base salary of the Chief Executive during the life of the remuneration policy but that, if circumstances arose in which the Committee considered such an increase to be appropriate, it would engage with shareholders before making its final decision.
During the year, we engaged with a number of shareholders to discuss the Committee’s approach and to understand their views on remuneration at Kier. The Committee took into consideration shareholders’ feedback when deciding that the Chief Executive would not receive a base salary increase for the 2019 financial year.
Remuneration across the GroupIn determining the Executive Directors’ remuneration, the Committee takes into account the Group’s approach to remuneration across the Group as a whole. In practice, the Executive Directors’ remuneration is more heavily weighted towards variable pay (and, therefore, is linked to the Group’s performance) than the pay of other employees.
During the year, the Committee:
› reviewed salary increases across the Group. Overall, the average base salary increase across the Group, effective from 1 July 2018, was 3.8%;
› reviewed the outcome of the Group’s gender pay gap reporting; › reviewed bonus payments made to senior employees, whose
bonus plan is based on similar principles to the Executive Directors’ bonus; and
› oversaw the introduction of a conditional share award plan for senior employees below the Board to replace the annual LTIP award. Under the plan, awards are made following an assessment of prior year performance and without performance conditions and the shares vest after three years. Management believes that this plan will be an effective retention tool for senior employees.
2018 outcomesAnnual bonusThe annual bonus targets were profit before tax (50%), the Group’s year-end net debt position (30%), health and safety targets (10%) and personal objectives (10%). A number of the personal objectives relate to the Vision 2020 strategic targets – for example, an increase in employee engagement and maintaining our high levels of customer satisfaction. The Committee has regularly reviewed performance against the targets during year.
When assessing performance against the profit before tax target, the Committee took into consideration a number of factors, including the quality of earnings, the extent of any non-underlying items and the extent of the increase on the previous year’s profit. The Committee agreed that the Group’s profit figure of £136.9m represented a good performance in light of challenging market conditions and noted that the 2018 financial statements did not include any non-underlying items. The Committee therefore agreed that it would be appropriate to award a payment of 79% of the maximum opportunity for this element of the bonus.
The Group’s year-end net debt figure was £185.7m, which was ahead of the on-target figure for bonus purposes of £190m. So as to ensure that the year-end net debt figure was representative of the Group’s overall net debt position, the Committee took into account the Group’s average month-end net debt position relative to the average month-end capital invested in the Property and Residential businesses. The Committee noted that, although the
average capital invested in these businesses during the year was greater than the Group’s average month-end net debt, the latter figure had increased in 2018. The Committee therefore decided to exercise its discretion to reduce the payment from 80% of the maximum opportunity for the net debt element of the bonus to 65% (the payment for on-target performance).
The reduction in the Group’s all accident incidence rate (AAIR) resulted in the Committee awarding a payment of 100% of the maximum opportunity for the health and safety element of the bonus.
The Committee also reviewed the extent to which the Executive Directors had satisfied their personal objectives. The Executive Directors were awarded either 60% or 70% of the maximum opportunity of this element of the bonus.
The total bonus payment for the Chief Executive was 75% of his maximum opportunity. The total bonus payment for each of the Executive Directors was either 75% or 76% of their respective maximum opportunities. The Committee is satisfied that these payments reflect the performance of the Group and the Executive Directors during the year.
Further information about the annual bonus is set out on pages 93 and 94.
LTIPsThe performance period for the LTIP awards granted in October 2015 ended on 30 June 2018. The performance conditions were based on total shareholder return (TSR) and earnings per share (EPS). These awards will vest at 24% of the maximum opportunity, based upon the EPS performance. The element relating to TSR performance resulted in a nil payment. Please see page 94 for further information.
Payments to former DirectorsOn 1 August 2018, we announced that, following the appointment of Claudio Veritiero as Chief Operating Officer, Nigel Brook and Nigel Turner would be standing down from the Board and leaving the business with immediate effect. The Committee reviewed the terms on which both individuals did so, so as to ensure that such terms were permitted by the remuneration policy approved by shareholders at the 2017 AGM.
Both individuals have a 12-month notice period. The Committee decided to make a payment in lieu of notice (PILON) to both individuals on a phased basis over the 12-month period (the final instalment being due in July 2019). The Committee has obliged each individual to mitigate his loss and to offset any alternative remuneration received during the PILON period from any amounts owed by the Company.
The Committee exercised its discretion to pay both Directors a bonus in respect of the 2018 financial year (one-third of which will be satisfied by an allocation of shares, legal ownership of which will be deferred for three years), which will be subject to clawback, since they had been a member of the Board and employed by the Group for the whole of the year. Neither individual is entitled to a bonus in respect of the 2019 financial year.
The Committee exercised its discretion to permit the vesting of the LTIP awards granted in October 2015, on the basis that the individuals had been employed by the Group for the whole of the three-year performance period (which concluded on 30 June 2018).
Strategic R
eportG
overnanceFinancial S
tatements
Kier Group plc | Report and Accounts 2018 87
The safety element of the bonus will require a reduction in both the Group’s AIR and, so as to further incentivise a continued improvement in the Group’s safety performance, the more challenging AAIR. The Committee will also continue to take into account any material incidents which may occur during the year, as well as requiring a specific number of visible leadership tours to be made.
The personal objectives will relate to an improvement in the Group’s employee engagement survey scores, the realisation of benefits from the Future Proofing Kier programme and the continued development of the Group’s contract governance framework.
Further details of performance against each of the bonus targets will be included in the 2019 Annual Report.
LTIP awardsThe Executive Directors will continue to receive an award of 150% of their base salary in 2019 (the same level as in 2018). The performance conditions will again relate to EPS (50%), TSR (25%) and net debt: EBITDA (25%), over the three-year period ending 30 June 2021.
ConclusionThe Committee recognises that executive remuneration in general continues to be an area of focus for shareholders and other stakeholders. When setting the Executive Directors’ 2019 remuneration, the Committee took into account shareholders’ feedback from the AGM vote in November 2017 and is satisfied that, overall, the link between pay and performance remains strong, the interests of the Executive Directors and shareholders are aligned and the Executive Directors’ remuneration remains competitive.
The Committee will continue to monitor developments in executive remuneration and engage with shareholders and the proxy voting agencies to ensure that Kier’s leadership team is appropriately incentivised to continue to deliver growth and the Group’s long-term strategy.
I will be available to answer any questions you may have about the Committee, our work and how we operate at the AGM on 16 November 2018.
Constance BaroudelChair of the Remuneration Committee
19 September 2018
Directors’ Remuneration Report
Annual statement of the Chair of the Remuneration Committee continued
The Committee also decided to allow the individuals to retain their LTIP awards granted in October 2016 and October 2017, pro-rated for active service during the performance periods.
All payments to be made by the Company with respect to Nigel Brook and Nigel Turner in relation to the cessation of their employment are permitted under the policy on ‘Payments for loss of office’. Please see pages 106 and 107 for further details of the policy.
Further details of the terms agreed with Nigel Brook and Nigel Turner are set out on pages 96 and 97 under ‘Payments to past Directors’.
Looking forward – 2019 financial yearIn the 2019 financial year, there will be no changes to the structure of the Executive Directors’ remuneration. Please see ‘Executive Directors’ remuneration – 2019’ on page 90 for further information.
Base salariesThe Committee reviewed the base salaries for the Executive Directors, taking into account the average base salary increases awarded across the Group and shareholder feedback at the 2017 AGM.
The Committee agreed that no increases would be awarded to the Chief Executive or the Finance Director from 1 July 2018 and that it would be appropriate to set the salary of Claudio Veritiero, in the new role of Chief Operating Officer, at the same level as that of the Finance Director with effect from his appointment on 1 August 2018. The Committee is satisfied that the Chief Operating Officer’s salary is appropriate in light of the responsibilities of the role.
Annual bonusThe maximum bonus opportunity for the Chief Executive will be 125% of base salary, with 115% of base salary for the other Executive Directors (both opportunities remaining unchanged from 2018). The Committee considers these opportunities to be in line with those at peer group companies.
The on-target bonus opportunities (as a percentage of salary) for the Executive Directors will remain unchanged from those which applied in the 2018 financial year.
The bonus targets will be underlying earnings per share (EPS) (50%), the Group’s average month-end cash/net debt position (30%), safety targets (10%) and personal objectives (10%).
The Group’s Property and Residential businesses are increasingly using joint ventures (JVs), which management considers to be capital efficient structures. The performance of JVs is presented in the Group’s financial statements after interest and taxation. The Committee therefore decided to replace the profit before tax target with an EPS target, since EPS is also presented after interest and tax and is considered by the Committee to be a more relevant measure of the Group’s profitability for bonus purposes.
The Committee decided to change the net debt target to measure the Group’s average month-end performance, rather than its year-end position (which was the target in 2018 and previous years). The change in the target reflects discussions between members of the Board and shareholders during the year.
88 Kier Group plc | Report and Accounts 2018
Remuneration at a glance
Background informationApproach to remuneration at KierOur remuneration policy aims to:
› align with strategy and incentivise and reward the delivery of performance: over two-thirds of the Executive Directors’ maximum remuneration opportunity is variable and relates to the Group’s performance against its strategic priorities (as set out on pages 28 and 29);
› align Executive Directors’ interests with those of shareholders: approximately half of the Executive Directors’ maximum remuneration opportunity is satisfied in shares and the Executive Directors are encouraged to build up shareholdings in the Company of at least two years’ base salary over a period of up to five years; and
› attract and retain talent: the Committee considers practices in comparable businesses so as to ensure that remuneration at Kier remains competitive, enabling it to attract and retain talented individuals, but without paying more than is necessary.
Remuneration frameworkThere are three elements to the framework for the Executive Directors’ remuneration:
› fixed element: comprises base salary, taxable benefits (private health insurance and a company car or car allowance) and a pension; › short-term element: an annual bonus, which incentivises and rewards the delivery of a balanced selection of financial and non-
financial targets in a financial year, with payments being satisfied in cash (2/3), which are subject to clawback, and shares (1/3), which are deferred for three years; and
› long-term element: the LTIP incentivises financial performance over a three-year period, promoting long-term sustainable value creation for shareholders. Vested shares are subject to a two-year holding period.
Remuneration policyThe remuneration policy, a summary of which is set out on pages 102 to 107 (inclusive), was approved by shareholders at the Annual General Meeting on 17 November 2017. The policy is subject to shareholder approval every three years.
Compliance statementThis Directors’ Remuneration Report complies with the Companies Act 2006, Schedule 8 of the Large and Medium-sized Companies and Groups (Accounts and Reports) (Amendment) Regulations 2013 and the Listing Rules of the Financial Conduct Authority and applies the main principles relating to remuneration which are set out in the UK Corporate Governance Code (April 2016 edition).
Annual report on remuneration page
Summary of the Executive Directors’ remuneration in 2018 and 2019 90
Annual bonus – 2018 financial year 93
LTIP awards – performance period ended 30 June 2018 94
Incentive awards made during the 2018 financial year 95
Payments to past Directors 96
Directors’ shareholdings and share interests 97
Percentage change in the Chief Executive’s remuneration 100
Relative importance of spend on pay 100
Implementation of the remuneration policy in 2019 100
The Remuneration Committee 101
Shareholder voting 101
Directors’ remuneration policy – summary page
Future policy table 102
Approach to remuneration on recruitment 105
Service contracts 106
Payments for loss of office 106
Consideration of employment conditions elsewhere in the Group 107
Consideration of shareholders’ views 107
Non-Executive Director remuneration policy 107
ContentsIn this section:
Strategic R
eportG
overnanceFinancial S
tatements
Kier Group plc | Report and Accounts 2018 89
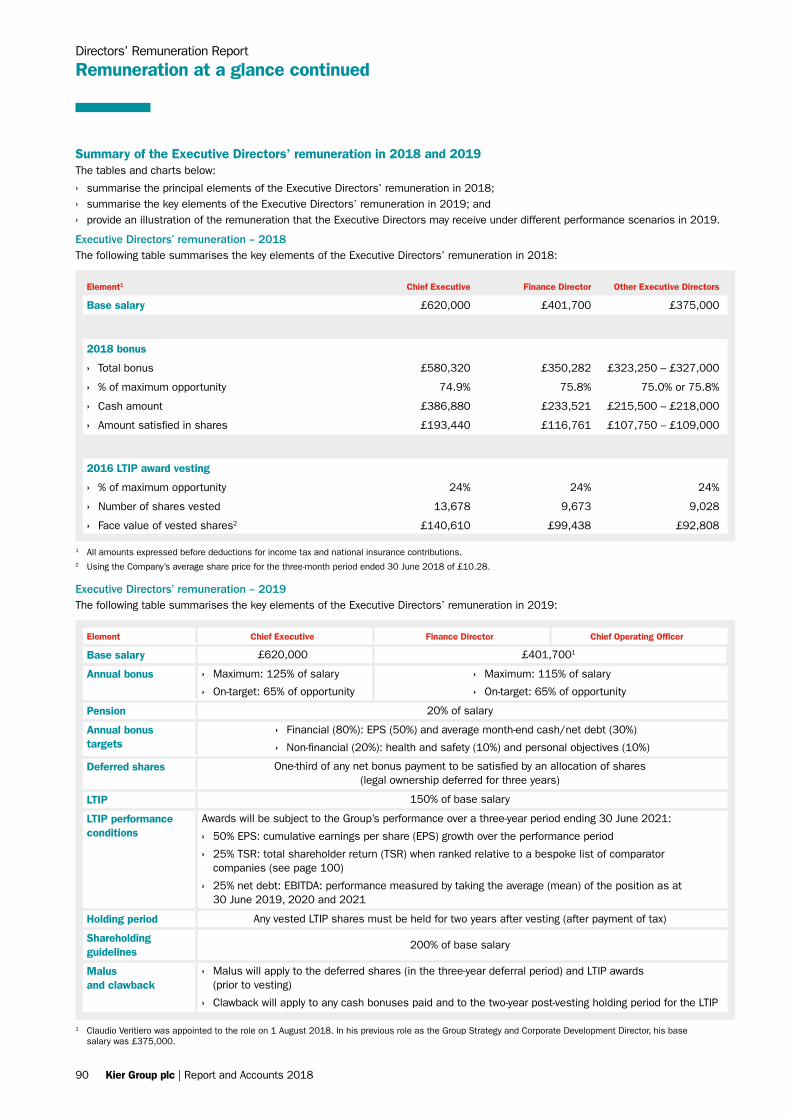
Directors’ Remuneration Report
Remuneration at a glance continued
Executive Directors’ remuneration – 2019The following table summarises the key elements of the Executive Directors’ remuneration in 2019:
Element Chief Executive Finance Director Chief Operating Officer
Base salary
Annual bonus
Pension
Annual bonus targets
Deferred shares
LTIP
LTIP performance conditions
Holding period
Shareholding guidelines
Malus and clawback
› Malus will apply to the deferred shares (in the three-year deferral period) and LTIP awards (prior to vesting)
› Clawback will apply to any cash bonuses paid and to the two-year post-vesting holding period for the LTIP
200% of base salary
One-third of any net bonus payment to be satisfied by an allocation of shares (legal ownership deferred for three years)
› Financial (80%): EPS (50%) and average month-end cash/net debt (30%)
› Non-financial (20%): health and safety (10%) and personal objectives (10%)
› Maximum: 125% of salary
› On-target: 65% of opportunity
£620,000 £401,7001
› Maximum: 115% of salary
› On-target: 65% of opportunity
Any vested LTIP shares must be held for two years after vesting (after payment of tax)
150% of base salary
20% of salary
Awards will be subject to the Group’s performance over a three-year period ending 30 June 2021:
› 50% EPS: cumulative earnings per share (EPS) growth over the performance period
› 25% TSR: total shareholder return (TSR) when ranked relative to a bespoke list of comparator companies (see page 100)
› 25% net debt: EBITDA: performance measured by taking the average (mean) of the position as at 30 June 2019, 2020 and 2021
Element1 Chief Executive Finance Director Other Executive Directors
Base salary £620,000 £401,700 £375,000
2018 bonus
› Total bonus £580,320 £350,282 £323,250 – £327,000
› % of maximum opportunity 74.9% 75.8% 75.0% or 75.8%
› Cash amount £386,880 £233,521 £215,500 – £218,000
› Amount satisfied in shares £193,440 £116,761 £107,750 – £109,000
2016 LTIP award vesting
› % of maximum opportunity 24% 24% 24%
› Number of shares vested 13,678 9,673 9,028
› Face value of vested shares2 £140,610 £99,438 £92,808
1 All amounts expressed before deductions for income tax and national insurance contributions.2 Using the Company’s average share price for the three-month period ended 30 June 2018 of £10.28.
Summary of the Executive Directors’ remuneration in 2018 and 2019The tables and charts below:
› summarise the principal elements of the Executive Directors’ remuneration in 2018; › summarise the key elements of the Executive Directors’ remuneration in 2019; and › provide an illustration of the remuneration that the Executive Directors may receive under different performance scenarios in 2019.
Executive Directors’ remuneration – 2018The following table summarises the key elements of the Executive Directors’ remuneration in 2018:
1 Claudio Veritiero was appointed to the role on 1 August 2018. In his previous role as the Group Strategy and Corporate Development Director, his base salary was £375,000.
90 Kier Group plc | Report and Accounts 2018
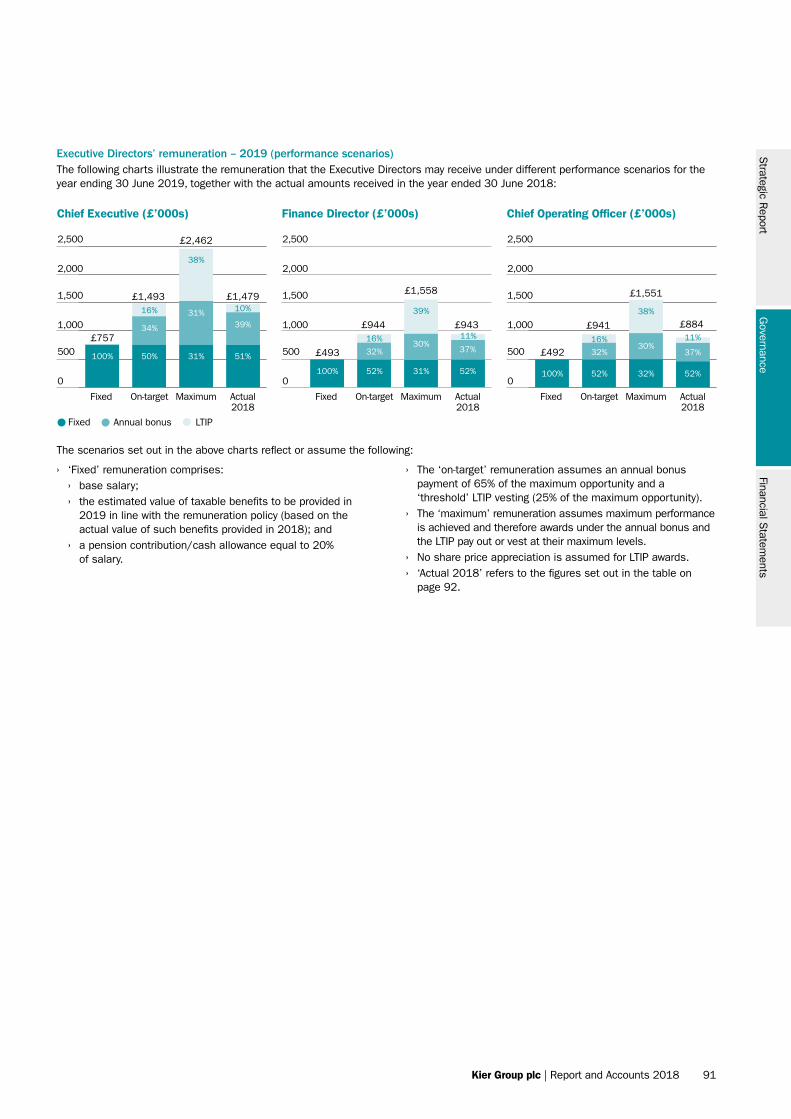
XX
XX
0
500
1,000
1,500
2,000
2,500
Chief Executive (£’000s)
Fixed On-target Maximum Actual2018
38%
10%16%
34%
31%39%
51%31%50%100%
£757
£1,493
£2,462
£1,479
Fixed Annual bonus LTIP
XX
0
500
1,000
1,500
2,000
2,500
Finance Director (£’000s)
Fixed On-target Maximum Actual2018
39%
11%16%
32%30%
37%
52%31%52%100%
£493
£944
£1,558
£943
0
500
1,000
1,500
2,000
2,500
Chief Operating Officer (£’000s)
Fixed On-target Maximum Actual2018
38%
11%16%
32%30%
37%
52%32%52%100%
£492
£941
£1,551
£884
The scenarios set out in the above charts reflect or assume the following:
› ‘Fixed’ remuneration comprises: › base salary; › the estimated value of taxable benefits to be provided in
2019 in line with the remuneration policy (based on the actual value of such benefits provided in 2018); and
› a pension contribution/cash allowance equal to 20% of salary.
› The ‘on-target’ remuneration assumes an annual bonus payment of 65% of the maximum opportunity and a ‘threshold’ LTIP vesting (25% of the maximum opportunity).
› The ‘maximum’ remuneration assumes maximum performance is achieved and therefore awards under the annual bonus and the LTIP pay out or vest at their maximum levels.
› No share price appreciation is assumed for LTIP awards. › ‘Actual 2018’ refers to the figures set out in the table on
page 92.
Executive Directors’ remuneration – 2019 (performance scenarios)The following charts illustrate the remuneration that the Executive Directors may receive under different performance scenarios for the year ending 30 June 2019, together with the actual amounts received in the year ended 30 June 2018:
Strategic R
eportG
overnanceFinancial S
tatements
Kier Group plc | Report and Accounts 2018 91
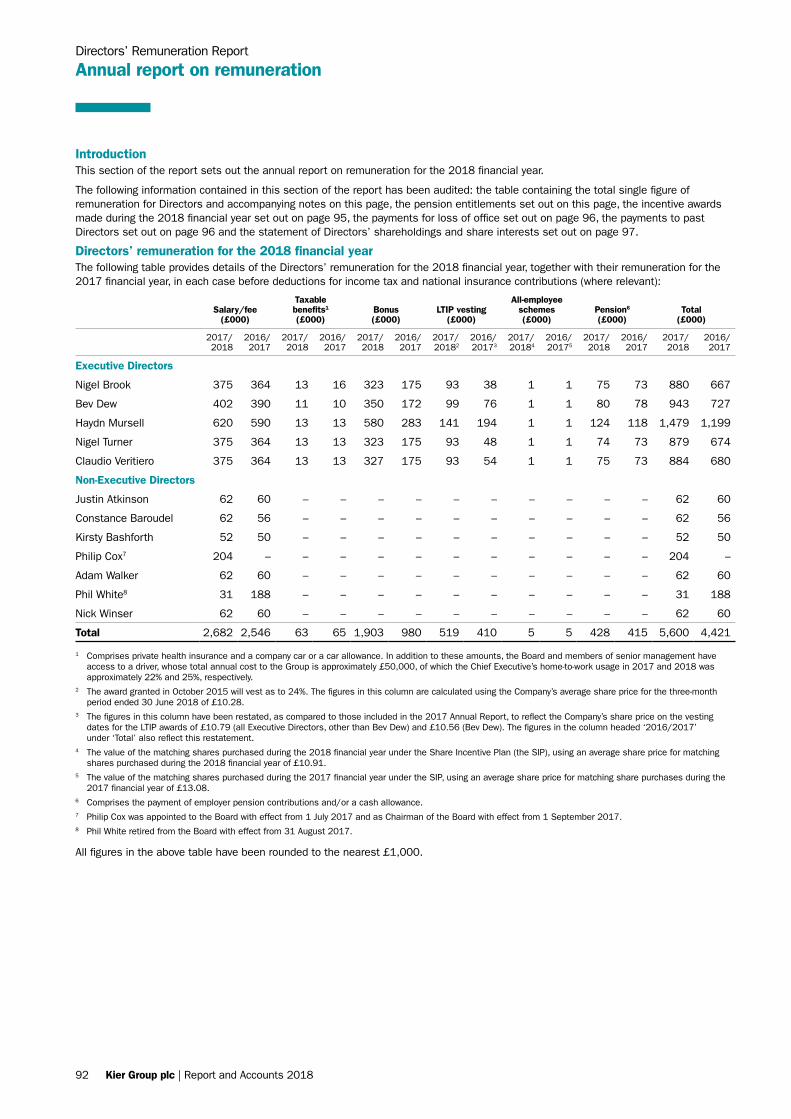
Directors’ Remuneration Report
Annual report on remuneration
IntroductionThis section of the report sets out the annual report on remuneration for the 2018 financial year.
The following information contained in this section of the report has been audited: the table containing the total single figure of remuneration for Directors and accompanying notes on this page, the pension entitlements set out on this page, the incentive awards made during the 2018 financial year set out on page 95, the payments for loss of office set out on page 96, the payments to past Directors set out on page 96 and the statement of Directors’ shareholdings and share interests set out on page 97.
Directors’ remuneration for the 2018 financial yearThe following table provides details of the Directors’ remuneration for the 2018 financial year, together with their remuneration for the 2017 financial year, in each case before deductions for income tax and national insurance contributions (where relevant):
Salary/fee
(£000)
Taxable benefits1
(£000)Bonus (£000)
LTIP vesting (£000)
All-employee schemes (£000)
Pension6
(£000)Total
(£000)
2017/ 2018
2016/ 2017
2017/ 2018
2016/ 2017
2017/ 2018
2016/ 2017
2017/ 20182
2016/ 20173
2017/ 20184
2016/ 20175
2017/ 2018
2016/ 2017
2017/ 2018
2016/ 2017
Executive Directors
Nigel Brook 375 364 13 16 323 175 93 38 1 1 75 73 880 667
Bev Dew 402 390 11 10 350 172 99 76 1 1 80 78 943 727
Haydn Mursell 620 590 13 13 580 283 141 194 1 1 124 118 1,479 1,199
Nigel Turner 375 364 13 13 323 175 93 48 1 1 74 73 879 674
Claudio Veritiero 375 364 13 13 327 175 93 54 1 1 75 73 884 680
Non-Executive Directors
Justin Atkinson 62 60 – – – – – – – – – – 62 60
Constance Baroudel 62 56 – – – – – – – – – – 62 56
Kirsty Bashforth 52 50 – – – – – – – – – – 52 50
Philip Cox7 204 – – – – – – – – – – – 204 –
Adam Walker 62 60 – – – – – – – – – – 62 60
Phil White8 31 188 – – – – – – – – – – 31 188
Nick Winser 62 60 – – – – – – – – – – 62 60
Total 2,682 2,546 63 65 1,903 980 519 410 5 5 428 415 5,600 4,421
1 Comprises private health insurance and a company car or a car allowance. In addition to these amounts, the Board and members of senior management have access to a driver, whose total annual cost to the Group is approximately £50,000, of which the Chief Executive’s home-to-work usage in 2017 and 2018 was approximately 22% and 25%, respectively.
2 The award granted in October 2015 will vest as to 24%. The figures in this column are calculated using the Company’s average share price for the three-month period ended 30 June 2018 of £10.28.
3 The figures in this column have been restated, as compared to those included in the 2017 Annual Report, to reflect the Company’s share price on the vesting dates for the LTIP awards of £10.79 (all Executive Directors, other than Bev Dew) and £10.56 (Bev Dew). The figures in the column headed ‘2016/2017’ under ‘Total’ also reflect this restatement.
4 The value of the matching shares purchased during the 2018 financial year under the Share Incentive Plan (the SIP), using an average share price for matching shares purchased during the 2018 financial year of £10.91.
5 The value of the matching shares purchased during the 2017 financial year under the SIP, using an average share price for matching share purchases during the 2017 financial year of £13.08.
6 Comprises the payment of employer pension contributions and/or a cash allowance.7 Philip Cox was appointed to the Board with effect from 1 July 2017 and as Chairman of the Board with effect from 1 September 2017.8 Phil White retired from the Board with effect from 31 August 2017.
All figures in the above table have been rounded to the nearest £1,000.
92 Kier Group plc | Report and Accounts 2018
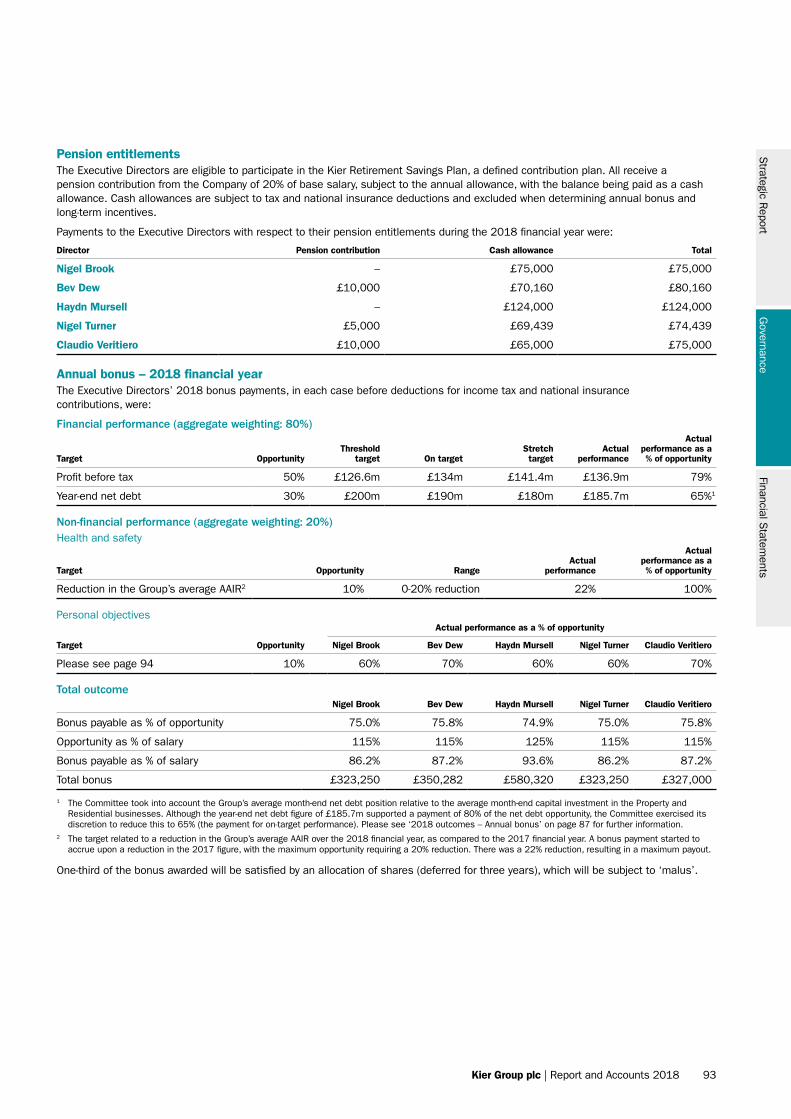
Pension entitlementsThe Executive Directors are eligible to participate in the Kier Retirement Savings Plan, a defined contribution plan. All receive a pension contribution from the Company of 20% of base salary, subject to the annual allowance, with the balance being paid as a cash allowance. Cash allowances are subject to tax and national insurance deductions and excluded when determining annual bonus and long-term incentives.
Payments to the Executive Directors with respect to their pension entitlements during the 2018 financial year were:
Director Pension contribution Cash allowance Total
Nigel Brook – £75,000 £75,000
Bev Dew £10,000 £70,160 £80,160
Haydn Mursell – £124,000 £124,000
Nigel Turner £5,000 £69,439 £74,439
Claudio Veritiero £10,000 £65,000 £75,000
Annual bonus – 2018 financial yearThe Executive Directors’ 2018 bonus payments, in each case before deductions for income tax and national insurance contributions, were:
Financial performance (aggregate weighting: 80%)
Target Opportunity Threshold
target On targetStretch target
Actual performance
Actual performance as a % of opportunity
Profit before tax 50% £126.6m £134m £141.4m £136.9m 79%
Year-end net debt 30% £200m £190m £180m £185.7m 65%1
Non-financial performance (aggregate weighting: 20%)Health and safety
Target Opportunity Range Actual
performance
Actual performance as a % of opportunity
Reduction in the Group’s average AAIR2 10% 0-20% reduction 22% 100%
Personal objectives Actual performance as a % of opportunity
Target Opportunity Nigel Brook Bev Dew Haydn Mursell Nigel Turner Claudio Veritiero
Please see page 94 10% 60% 70% 60% 60% 70%
Total outcome Nigel Brook Bev Dew Haydn Mursell Nigel Turner Claudio Veritiero
Bonus payable as % of opportunity 75.0% 75.8% 74.9% 75.0% 75.8%
Opportunity as % of salary 115% 115% 125% 115% 115%
Bonus payable as % of salary 86.2% 87.2% 93.6% 86.2% 87.2%
Total bonus £323,250 £350,282 £580,320 £323,250 £327,000
1 The Committee took into account the Group’s average month-end net debt position relative to the average month-end capital investment in the Property and Residential businesses. Although the year-end net debt figure of £185.7m supported a payment of 80% of the net debt opportunity, the Committee exercised its discretion to reduce this to 65% (the payment for on-target performance). Please see ‘2018 outcomes – Annual bonus’ on page 87 for further information.
2 The target related to a reduction in the Group’s average AAIR over the 2018 financial year, as compared to the 2017 financial year. A bonus payment started to accrue upon a reduction in the 2017 figure, with the maximum opportunity requiring a 20% reduction. There was a 22% reduction, resulting in a maximum payout.
One-third of the bonus awarded will be satisfied by an allocation of shares (deferred for three years), which will be subject to ‘malus’.
Strategic R
eportG
overnanceFinancial S
tatements
Kier Group plc | Report and Accounts 2018 93
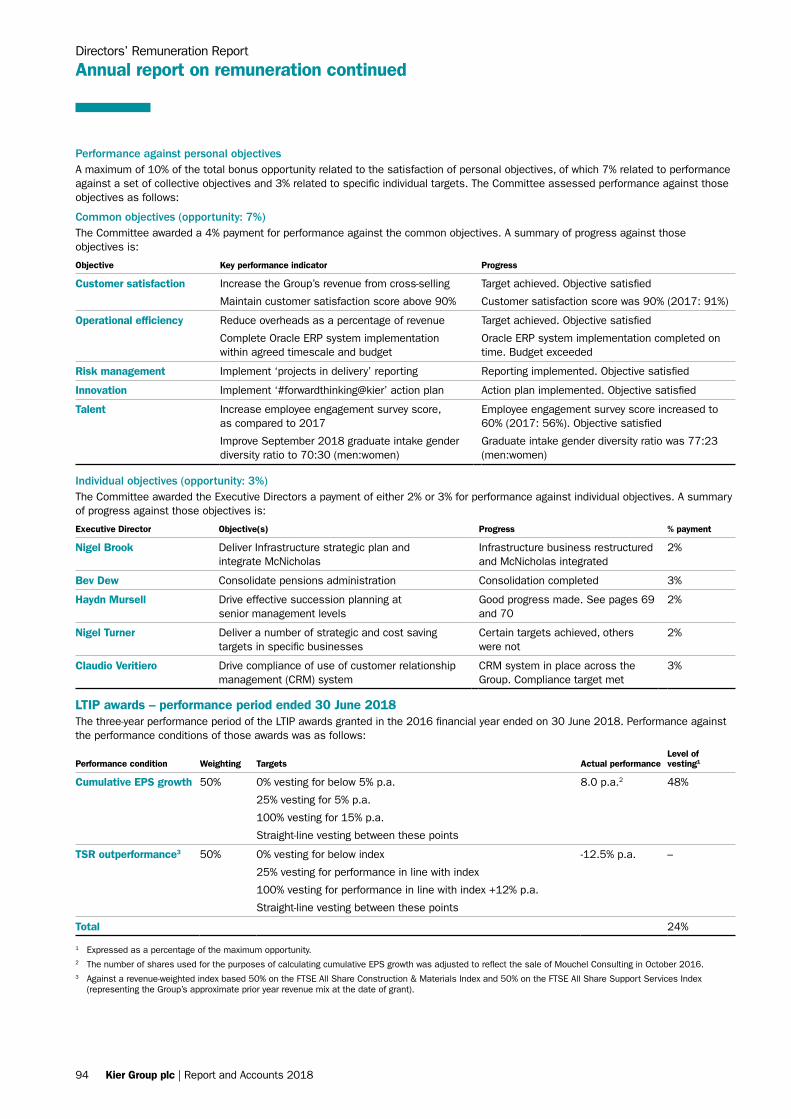
Directors’ Remuneration Report
Annual report on remuneration continued
Performance against personal objectivesA maximum of 10% of the total bonus opportunity related to the satisfaction of personal objectives, of which 7% related to performance against a set of collective objectives and 3% related to specific individual targets. The Committee assessed performance against those objectives as follows:
Common objectives (opportunity: 7%)The Committee awarded a 4% payment for performance against the common objectives. A summary of progress against those objectives is:
Objective Key performance indicator Progress
Customer satisfaction Increase the Group’s revenue from cross-selling
Maintain customer satisfaction score above 90%
Target achieved. Objective satisfied
Customer satisfaction score was 90% (2017: 91%)
Operational efficiency Reduce overheads as a percentage of revenue
Complete Oracle ERP system implementation within agreed timescale and budget
Target achieved. Objective satisfied
Oracle ERP system implementation completed on time. Budget exceeded
Risk management Implement ‘projects in delivery’ reporting Reporting implemented. Objective satisfied
Innovation Implement ‘#forwardthinking@kier’ action plan Action plan implemented. Objective satisfied
Talent Increase employee engagement survey score, as compared to 2017
Improve September 2018 graduate intake gender diversity ratio to 70:30 (men:women)
Employee engagement survey score increased to 60% (2017: 56%). Objective satisfied
Graduate intake gender diversity ratio was 77:23 (men:women)
Individual objectives (opportunity: 3%)The Committee awarded the Executive Directors a payment of either 2% or 3% for performance against individual objectives. A summary of progress against those objectives is:
Executive Director Objective(s) Progress % payment
Nigel Brook Deliver Infrastructure strategic plan and integrate McNicholas
Infrastructure business restructured and McNicholas integrated
2%
Bev Dew Consolidate pensions administration Consolidation completed 3%
Haydn Mursell Drive effective succession planning at senior management levels
Good progress made. See pages 69 and 70
2%
Nigel Turner Deliver a number of strategic and cost saving targets in specific businesses
Certain targets achieved, others were not
2%
Claudio Veritiero Drive compliance of use of customer relationship management (CRM) system
CRM system in place across the Group. Compliance target met
3%
LTIP awards – performance period ended 30 June 2018The three-year performance period of the LTIP awards granted in the 2016 financial year ended on 30 June 2018. Performance against the performance conditions of those awards was as follows:
Performance condition Weighting Targets Actual performanceLevel of vesting1
Cumulative EPS growth 50% 0% vesting for below 5% p.a.
25% vesting for 5% p.a.
100% vesting for 15% p.a.
Straight-line vesting between these points
8.0 p.a.2 48%
TSR outperformance3 50% 0% vesting for below index
25% vesting for performance in line with index
100% vesting for performance in line with index +12% p.a.
Straight-line vesting between these points
-12.5% p.a. –
Total 24%
1 Expressed as a percentage of the maximum opportunity.2 The number of shares used for the purposes of calculating cumulative EPS growth was adjusted to reflect the sale of Mouchel Consulting in October 2016.3 Against a revenue-weighted index based 50% on the FTSE All Share Construction & Materials Index and 50% on the FTSE All Share Support Services Index
(representing the Group’s approximate prior year revenue mix at the date of grant).
94 Kier Group plc | Report and Accounts 2018
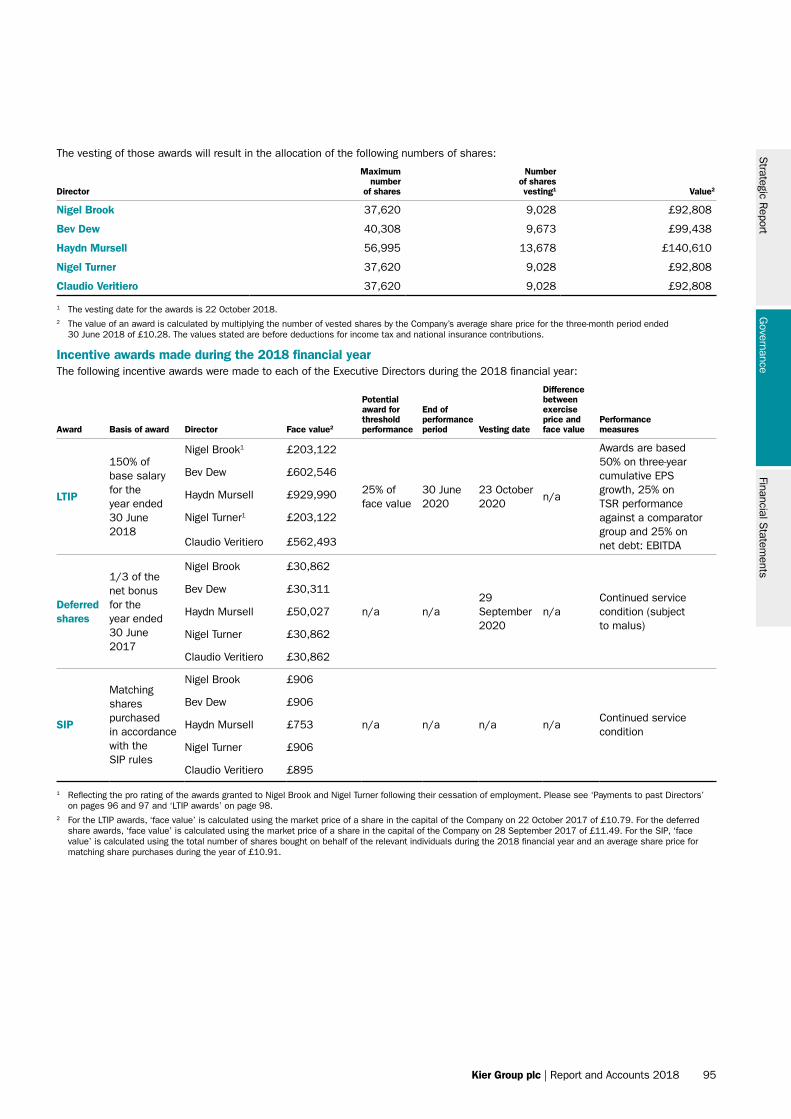
The vesting of those awards will result in the allocation of the following numbers of shares:
Director
Maximum number
of shares
Number of shares vesting1 Value2
Nigel Brook 37,620 9,028 £92,808
Bev Dew 40,308 9,673 £99,438
Haydn Mursell 56,995 13,678 £140,610
Nigel Turner 37,620 9,028 £92,808
Claudio Veritiero 37,620 9,028 £92,808
1 The vesting date for the awards is 22 October 2018.2 The value of an award is calculated by multiplying the number of vested shares by the Company’s average share price for the three-month period ended
30 June 2018 of £10.28. The values stated are before deductions for income tax and national insurance contributions.
Incentive awards made during the 2018 financial yearThe following incentive awards were made to each of the Executive Directors during the 2018 financial year:
Award Basis of award Director Face value2
Potential award for threshold performance
End of performance period Vesting date
Difference between exercise price and face value
Performance measures
LTIP
150% of base salary for the year ended 30 June 2018
Nigel Brook1 £203,122
25% of face value
30 June 2020
23 October 2020
n/a
Awards are based 50% on three-year cumulative EPS growth, 25% on TSR performance against a comparator group and 25% on net debt: EBITDA
Bev Dew £602,546
Haydn Mursell £929,990
Nigel Turner1 £203,122
Claudio Veritiero £562,493
Deferred shares
1/3 of the net bonus for the year ended 30 June 2017
Nigel Brook £30,862
n/a n/a29 September 2020
n/aContinued service condition (subject to malus)
Bev Dew £30,311
Haydn Mursell £50,027
Nigel Turner £30,862
Claudio Veritiero £30,862
SIP
Matching shares purchased in accordance with the SIP rules
Nigel Brook £906
n/a n/a n/a n/aContinued service condition
Bev Dew £906
Haydn Mursell £753
Nigel Turner £906
Claudio Veritiero £895
1 Reflecting the pro rating of the awards granted to Nigel Brook and Nigel Turner following their cessation of employment. Please see ‘Payments to past Directors’ on pages 96 and 97 and ‘LTIP awards’ on page 98.
2 For the LTIP awards, ‘face value’ is calculated using the market price of a share in the capital of the Company on 22 October 2017 of £10.79. For the deferred share awards, ‘face value’ is calculated using the market price of a share in the capital of the Company on 28 September 2017 of £11.49. For the SIP, ‘face value’ is calculated using the total number of shares bought on behalf of the relevant individuals during the 2018 financial year and an average share price for matching share purchases during the year of £10.91.
Strategic R
eportG
overnanceFinancial S
tatements
Kier Group plc | Report and Accounts 2018 95
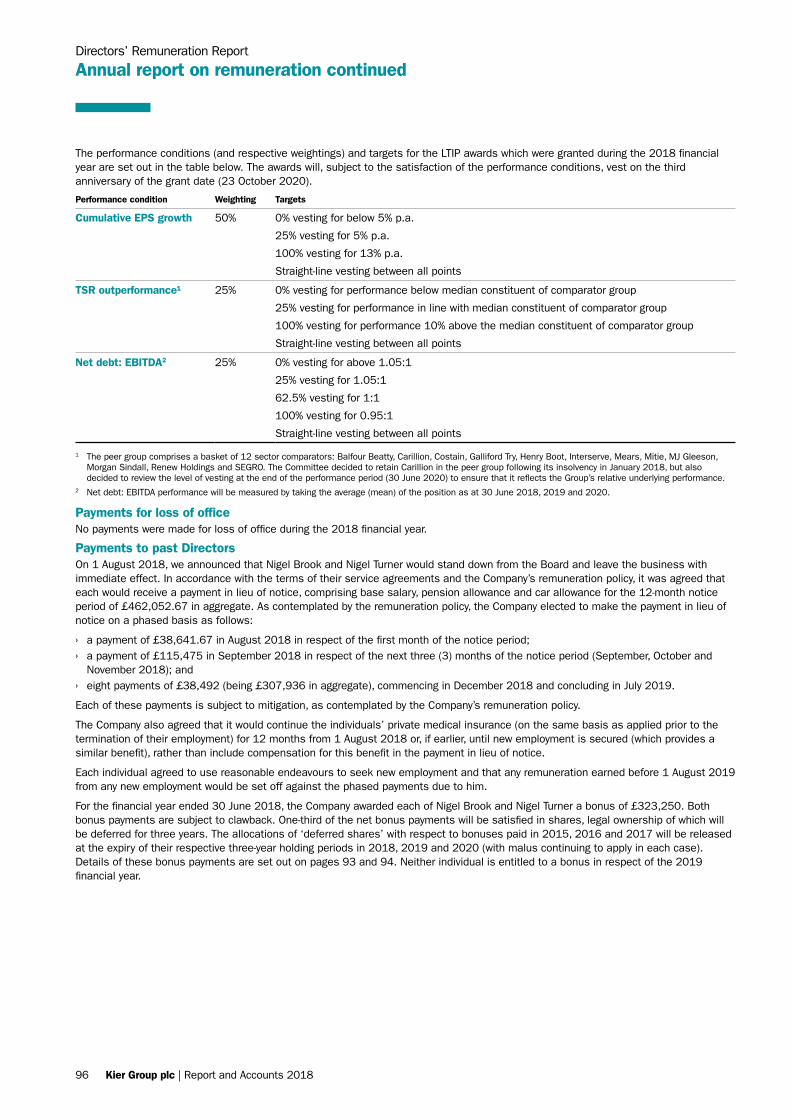
Directors’ Remuneration Report
Annual report on remuneration continued
The performance conditions (and respective weightings) and targets for the LTIP awards which were granted during the 2018 financial year are set out in the table below. The awards will, subject to the satisfaction of the performance conditions, vest on the third anniversary of the grant date (23 October 2020).
Performance condition Weighting Targets
Cumulative EPS growth 50% 0% vesting for below 5% p.a.
25% vesting for 5% p.a.
100% vesting for 13% p.a.
Straight-line vesting between all points
TSR outperformance¹ 25% 0% vesting for performance below median constituent of comparator group
25% vesting for performance in line with median constituent of comparator group
100% vesting for performance 10% above the median constituent of comparator group
Straight-line vesting between all points
Net debt: EBITDA2 25% 0% vesting for above 1.05:1
25% vesting for 1.05:1
62.5% vesting for 1:1
100% vesting for 0.95:1
Straight-line vesting between all points
1 The peer group comprises a basket of 12 sector comparators: Balfour Beatty, Carillion, Costain, Galliford Try, Henry Boot, Interserve, Mears, Mitie, MJ Gleeson, Morgan Sindall, Renew Holdings and SEGRO. The Committee decided to retain Carillion in the peer group following its insolvency in January 2018, but also decided to review the level of vesting at the end of the performance period (30 June 2020) to ensure that it reflects the Group’s relative underlying performance.
2 Net debt: EBITDA performance will be measured by taking the average (mean) of the position as at 30 June 2018, 2019 and 2020.
Payments for loss of officeNo payments were made for loss of office during the 2018 financial year.
Payments to past DirectorsOn 1 August 2018, we announced that Nigel Brook and Nigel Turner would stand down from the Board and leave the business with immediate effect. In accordance with the terms of their service agreements and the Company’s remuneration policy, it was agreed that each would receive a payment in lieu of notice, comprising base salary, pension allowance and car allowance for the 12-month notice period of £462,052.67 in aggregate. As contemplated by the remuneration policy, the Company elected to make the payment in lieu of notice on a phased basis as follows:
› a payment of £38,641.67 in August 2018 in respect of the first month of the notice period; › a payment of £115,475 in September 2018 in respect of the next three (3) months of the notice period (September, October and
November 2018); and › eight payments of £38,492 (being £307,936 in aggregate), commencing in December 2018 and concluding in July 2019.
Each of these payments is subject to mitigation, as contemplated by the Company’s remuneration policy.
The Company also agreed that it would continue the individuals’ private medical insurance (on the same basis as applied prior to the termination of their employment) for 12 months from 1 August 2018 or, if earlier, until new employment is secured (which provides a similar benefit), rather than include compensation for this benefit in the payment in lieu of notice.
Each individual agreed to use reasonable endeavours to seek new employment and that any remuneration earned before 1 August 2019 from any new employment would be set off against the phased payments due to him.
For the financial year ended 30 June 2018, the Company awarded each of Nigel Brook and Nigel Turner a bonus of £323,250. Both bonus payments are subject to clawback. One-third of the net bonus payments will be satisfied in shares, legal ownership of which will be deferred for three years. The allocations of ‘deferred shares’ with respect to bonuses paid in 2015, 2016 and 2017 will be released at the expiry of their respective three-year holding periods in 2018, 2019 and 2020 (with malus continuing to apply in each case). Details of these bonus payments are set out on pages 93 and 94. Neither individual is entitled to a bonus in respect of the 2019 financial year.
96 Kier Group plc | Report and Accounts 2018
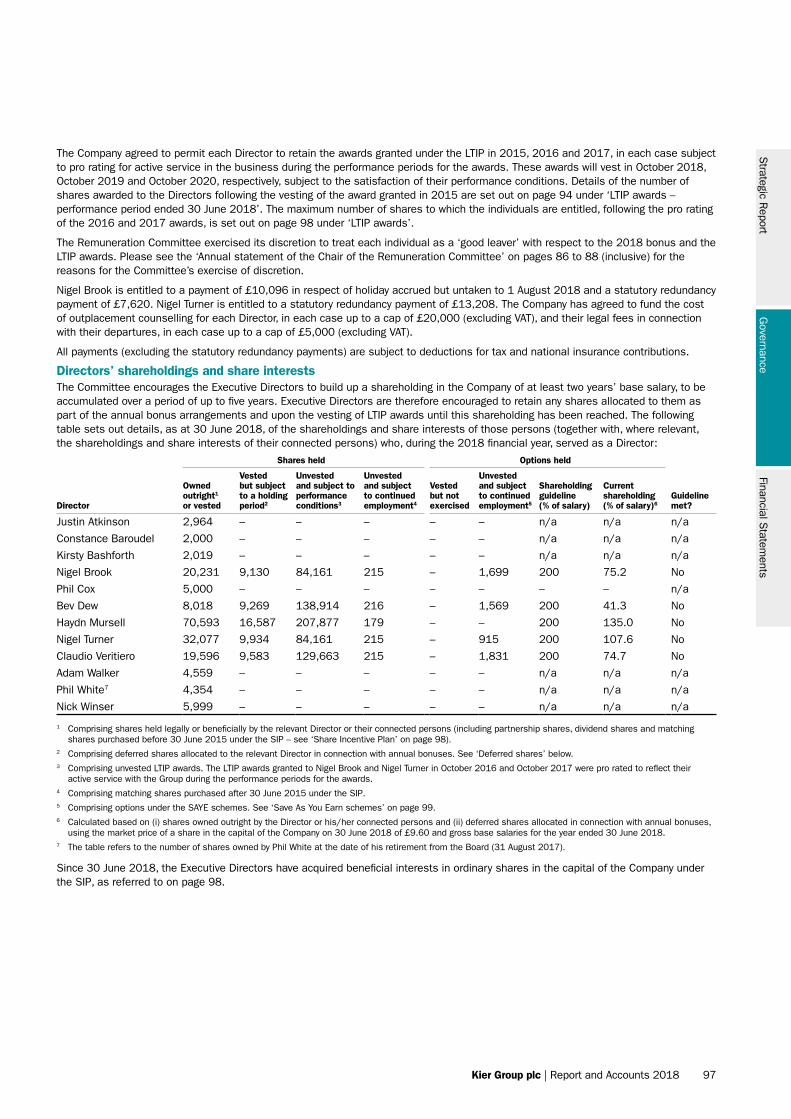
The Company agreed to permit each Director to retain the awards granted under the LTIP in 2015, 2016 and 2017, in each case subject to pro rating for active service in the business during the performance periods for the awards. These awards will vest in October 2018, October 2019 and October 2020, respectively, subject to the satisfaction of their performance conditions. Details of the number of shares awarded to the Directors following the vesting of the award granted in 2015 are set out on page 94 under ‘LTIP awards – performance period ended 30 June 2018’. The maximum number of shares to which the individuals are entitled, following the pro rating of the 2016 and 2017 awards, is set out on page 98 under ‘LTIP awards’.
The Remuneration Committee exercised its discretion to treat each individual as a ‘good leaver’ with respect to the 2018 bonus and the LTIP awards. Please see the ‘Annual statement of the Chair of the Remuneration Committee’ on pages 86 to 88 (inclusive) for the reasons for the Committee’s exercise of discretion.
Nigel Brook is entitled to a payment of £10,096 in respect of holiday accrued but untaken to 1 August 2018 and a statutory redundancy payment of £7,620. Nigel Turner is entitled to a statutory redundancy payment of £13,208. The Company has agreed to fund the cost of outplacement counselling for each Director, in each case up to a cap of £20,000 (excluding VAT), and their legal fees in connection with their departures, in each case up to a cap of £5,000 (excluding VAT).
All payments (excluding the statutory redundancy payments) are subject to deductions for tax and national insurance contributions.
Directors’ shareholdings and share interestsThe Committee encourages the Executive Directors to build up a shareholding in the Company of at least two years’ base salary, to be accumulated over a period of up to five years. Executive Directors are therefore encouraged to retain any shares allocated to them as part of the annual bonus arrangements and upon the vesting of LTIP awards until this shareholding has been reached. The following table sets out details, as at 30 June 2018, of the shareholdings and share interests of those persons (together with, where relevant, the shareholdings and share interests of their connected persons) who, during the 2018 financial year, served as a Director:
Shares held Options held
Director
Owned outright1 or vested
Vested but subject to a holding period2
Unvested and subject to performance conditions3
Unvested and subject to continued employment4
Vested but not exercised
Unvested and subject to continued employment5
Shareholding guideline (% of salary)
Current shareholding (% of salary)6
Guideline met?
Justin Atkinson 2,964 – – – – – n/a n/a n/a
Constance Baroudel 2,000 – – – – – n/a n/a n/a
Kirsty Bashforth 2,019 – – – – – n/a n/a n/a
Nigel Brook 20,231 9,130 84,161 215 – 1,699 200 75.2 No
Phil Cox 5,000 – – – – – – – n/a
Bev Dew 8,018 9,269 138,914 216 – 1,569 200 41.3 No
Haydn Mursell 70,593 16,587 207,877 179 – – 200 135.0 No
Nigel Turner 32,077 9,934 84,161 215 – 915 200 107.6 No
Claudio Veritiero 19,596 9,583 129,663 215 – 1,831 200 74.7 No
Adam Walker 4,559 – – – – – n/a n/a n/a
Phil White7 4,354 – – – – – n/a n/a n/a
Nick Winser 5,999 – – – – – n/a n/a n/a
1 Comprising shares held legally or beneficially by the relevant Director or their connected persons (including partnership shares, dividend shares and matching shares purchased before 30 June 2015 under the SIP – see ‘Share Incentive Plan’ on page 98).
2 Comprising deferred shares allocated to the relevant Director in connection with annual bonuses. See ‘Deferred shares’ below.3 Comprising unvested LTIP awards. The LTIP awards granted to Nigel Brook and Nigel Turner in October 2016 and October 2017 were pro rated to reflect their
active service with the Group during the performance periods for the awards. 4 Comprising matching shares purchased after 30 June 2015 under the SIP.5 Comprising options under the SAYE schemes. See ‘Save As You Earn schemes’ on page 99.6 Calculated based on (i) shares owned outright by the Director or his/her connected persons and (ii) deferred shares allocated in connection with annual bonuses,
using the market price of a share in the capital of the Company on 30 June 2018 of £9.60 and gross base salaries for the year ended 30 June 2018.7 The table refers to the number of shares owned by Phil White at the date of his retirement from the Board (31 August 2017).
Since 30 June 2018, the Executive Directors have acquired beneficial interests in ordinary shares in the capital of the Company under the SIP, as referred to on page 98.
Strategic R
eportG
overnanceFinancial S
tatements
Kier Group plc | Report and Accounts 2018 97
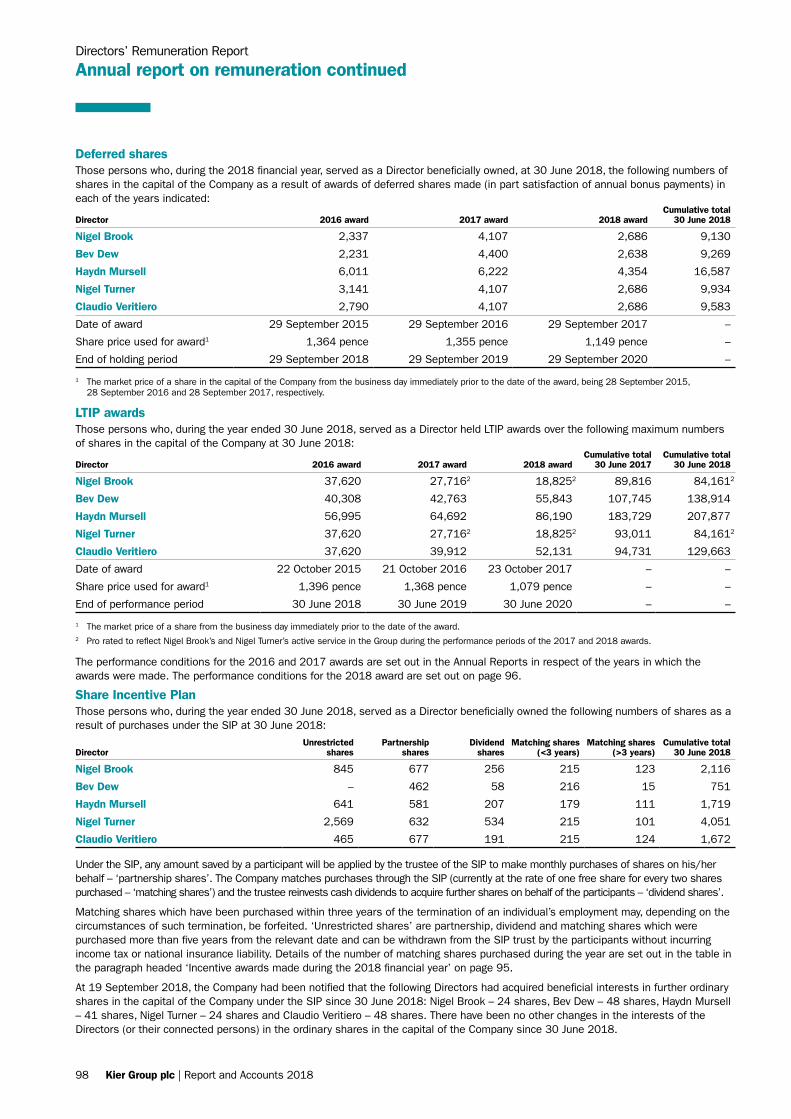
Directors’ Remuneration Report
Annual report on remuneration continued
Deferred sharesThose persons who, during the 2018 financial year, served as a Director beneficially owned, at 30 June 2018, the following numbers of shares in the capital of the Company as a result of awards of deferred shares made (in part satisfaction of annual bonus payments) in each of the years indicated:
Director 2016 award 2017 award 2018 awardCumulative total
30 June 2018
Nigel Brook 2,337 4,107 2,686 9,130
Bev Dew 2,231 4,400 2,638 9,269
Haydn Mursell 6,011 6,222 4,354 16,587
Nigel Turner 3,141 4,107 2,686 9,934
Claudio Veritiero 2,790 4,107 2,686 9,583
Date of award 29 September 2015 29 September 2016 29 September 2017 –
Share price used for award1 1,364 pence 1,355 pence 1,149 pence –
End of holding period 29 September 2018 29 September 2019 29 September 2020 –
1 The market price of a share in the capital of the Company from the business day immediately prior to the date of the award, being 28 September 2015, 28 September 2016 and 28 September 2017, respectively.
LTIP awardsThose persons who, during the year ended 30 June 2018, served as a Director held LTIP awards over the following maximum numbers of shares in the capital of the Company at 30 June 2018:
Director 2016 award 2017 award 2018 awardCumulative total
30 June 2017Cumulative total
30 June 2018
Nigel Brook 37,620 27,7162 18,8252 89,816 84,1612
Bev Dew 40,308 42,763 55,843 107,745 138,914
Haydn Mursell 56,995 64,692 86,190 183,729 207,877
Nigel Turner 37,620 27,7162 18,8252 93,011 84,1612
Claudio Veritiero 37,620 39,912 52,131 94,731 129,663
Date of award 22 October 2015 21 October 2016 23 October 2017 – –
Share price used for award1 1,396 pence 1,368 pence 1,079 pence – –
End of performance period 30 June 2018 30 June 2019 30 June 2020 – –
1 The market price of a share from the business day immediately prior to the date of the award.2 Pro rated to reflect Nigel Brook’s and Nigel Turner’s active service in the Group during the performance periods of the 2017 and 2018 awards.
The performance conditions for the 2016 and 2017 awards are set out in the Annual Reports in respect of the years in which the awards were made. The performance conditions for the 2018 award are set out on page 96.
Share Incentive PlanThose persons who, during the year ended 30 June 2018, served as a Director beneficially owned the following numbers of shares as a result of purchases under the SIP at 30 June 2018:
DirectorUnrestricted
sharesPartnership
sharesDividend
sharesMatching shares
(<3 years)Matching shares
(>3 years)Cumulative total
30 June 2018
Nigel Brook 845 677 256 215 123 2,116
Bev Dew – 462 58 216 15 751
Haydn Mursell 641 581 207 179 111 1,719
Nigel Turner 2,569 632 534 215 101 4,051
Claudio Veritiero 465 677 191 215 124 1,672
Under the SIP, any amount saved by a participant will be applied by the trustee of the SIP to make monthly purchases of shares on his/her behalf – ‘partnership shares’. The Company matches purchases through the SIP (currently at the rate of one free share for every two shares purchased – ‘matching shares’) and the trustee reinvests cash dividends to acquire further shares on behalf of the participants – ‘dividend shares’.
Matching shares which have been purchased within three years of the termination of an individual’s employment may, depending on the circumstances of such termination, be forfeited. ‘Unrestricted shares’ are partnership, dividend and matching shares which were purchased more than five years from the relevant date and can be withdrawn from the SIP trust by the participants without incurring income tax or national insurance liability. Details of the number of matching shares purchased during the year are set out in the table in the paragraph headed ‘Incentive awards made during the 2018 financial year’ on page 95.
At 19 September 2018, the Company had been notified that the following Directors had acquired beneficial interests in further ordinary shares in the capital of the Company under the SIP since 30 June 2018: Nigel Brook – 24 shares, Bev Dew – 48 shares, Haydn Mursell – 41 shares, Nigel Turner – 24 shares and Claudio Veritiero – 48 shares. There have been no other changes in the interests of the Directors (or their connected persons) in the ordinary shares in the capital of the Company since 30 June 2018.
98 Kier Group plc | Report and Accounts 2018
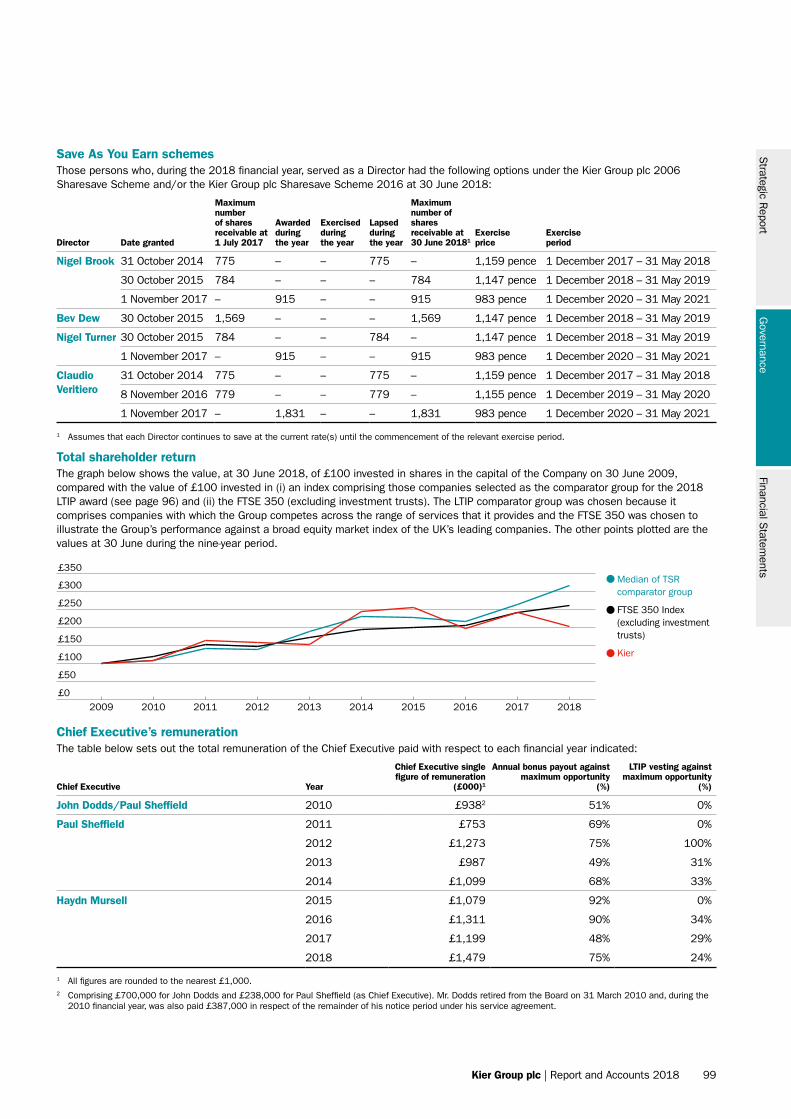
£0
£50
£100
£150
£200
£250
£300
£350
2018201720162015201420132012201120102009
Median of TSR comparator group
FTSE 350 Index (excluding investment trusts)
Kier
Save As You Earn schemesThose persons who, during the 2018 financial year, served as a Director had the following options under the Kier Group plc 2006 Sharesave Scheme and/or the Kier Group plc Sharesave Scheme 2016 at 30 June 2018:
Director Date granted
Maximum number of shares receivable at 1 July 2017
Awarded during the year
Exercised during the year
Lapsed during the year
Maximum number of shares receivable at 30 June 20181
Exercise price
Exercise period
Nigel Brook 31 October 2014 775 – – 775 – 1,159 pence 1 December 2017 – 31 May 2018
30 October 2015 784 – – – 784 1,147 pence 1 December 2018 – 31 May 2019
1 November 2017 – 915 – – 915 983 pence 1 December 2020 – 31 May 2021
Bev Dew 30 October 2015 1,569 – – – 1,569 1,147 pence 1 December 2018 – 31 May 2019
Nigel Turner 30 October 2015 784 – – 784 – 1,147 pence 1 December 2018 – 31 May 2019
1 November 2017 – 915 – – 915 983 pence 1 December 2020 – 31 May 2021
Claudio Veritiero
31 October 2014 775 – – 775 – 1,159 pence 1 December 2017 – 31 May 2018
8 November 2016 779 – – 779 – 1,155 pence 1 December 2019 – 31 May 2020
1 November 2017 – 1,831 – – 1,831 983 pence 1 December 2020 – 31 May 2021
1 Assumes that each Director continues to save at the current rate(s) until the commencement of the relevant exercise period.
Total shareholder returnThe graph below shows the value, at 30 June 2018, of £100 invested in shares in the capital of the Company on 30 June 2009, compared with the value of £100 invested in (i) an index comprising those companies selected as the comparator group for the 2018 LTIP award (see page 96) and (ii) the FTSE 350 (excluding investment trusts). The LTIP comparator group was chosen because it comprises companies with which the Group competes across the range of services that it provides and the FTSE 350 was chosen to illustrate the Group’s performance against a broad equity market index of the UK’s leading companies. The other points plotted are the values at 30 June during the nine-year period.
Chief Executive’s remunerationThe table below sets out the total remuneration of the Chief Executive paid with respect to each financial year indicated:
Chief Executive Year
Chief Executive single figure of remuneration
(£000)1
Annual bonus payout against maximum opportunity
(%)
LTIP vesting against maximum opportunity
(%)
John Dodds/Paul Sheffield 2010 £9382 51% 0%
Paul Sheffield 2011 £753 69% 0%
2012 £1,273 75% 100%
2013 £987 49% 31%
2014 £1,099 68% 33%
Haydn Mursell 2015 £1,079 92% 0%
2016 £1,311 90% 34%
2017 £1,199 48% 29%
2018 £1,479 75% 24%
1 All figures are rounded to the nearest £1,000.2 Comprising £700,000 for John Dodds and £238,000 for Paul Sheffield (as Chief Executive). Mr. Dodds retired from the Board on 31 March 2010 and, during the
2010 financial year, was also paid £387,000 in respect of the remainder of his notice period under his service agreement.
Strategic R
eportG
overnanceFinancial S
tatements
Kier Group plc | Report and Accounts 2018 99
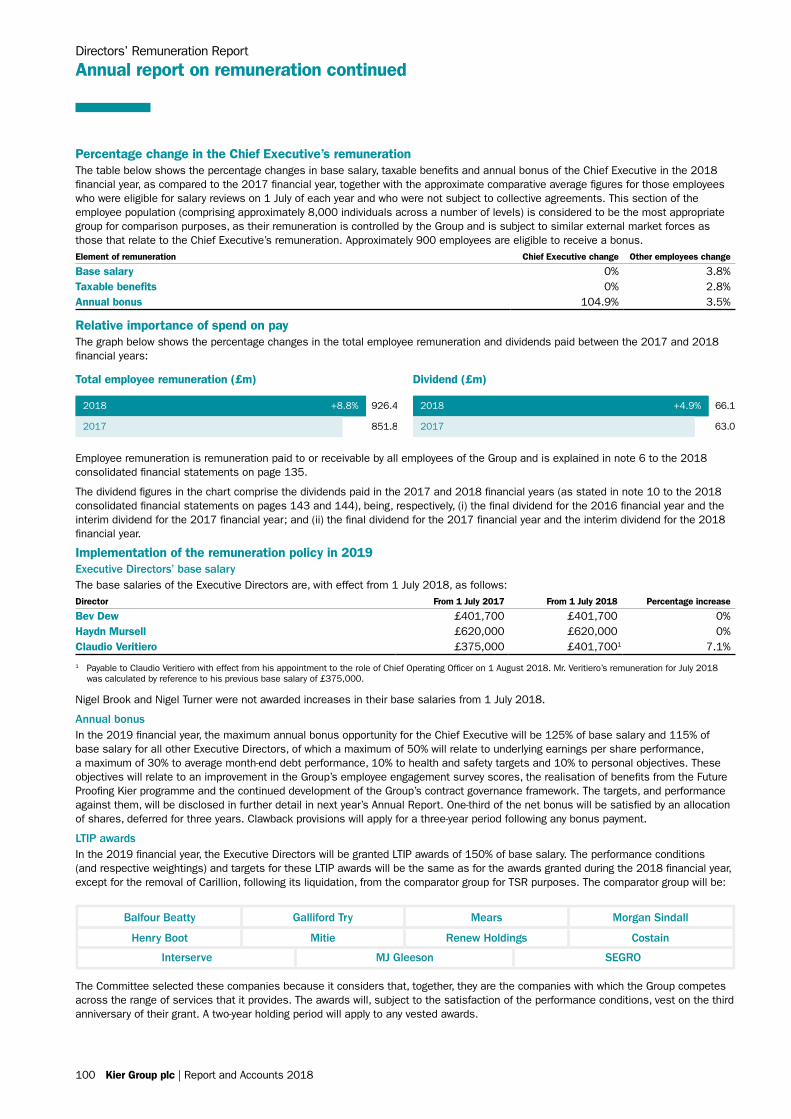
Employee remuneration is remuneration paid to or receivable by all employees of the Group and is explained in note 6 to the 2018 consolidated financial statements on page 135.
The dividend figures in the chart comprise the dividends paid in the 2017 and 2018 financial years (as stated in note 10 to the 2018 consolidated financial statements on pages 143 and 144), being, respectively, (i) the final dividend for the 2016 financial year and the interim dividend for the 2017 financial year; and (ii) the final dividend for the 2017 financial year and the interim dividend for the 2018 financial year.
Implementation of the remuneration policy in 2019Executive Directors’ base salaryThe base salaries of the Executive Directors are, with effect from 1 July 2018, as follows:Director From 1 July 2017 From 1 July 2018 Percentage increase
Bev Dew £401,700 £401,700 0% Haydn Mursell £620,000 £620,000 0%Claudio Veritiero £375,000 £401,7001 7.1%
1 Payable to Claudio Veritiero with effect from his appointment to the role of Chief Operating Officer on 1 August 2018. Mr. Veritiero’s remuneration for July 2018 was calculated by reference to his previous base salary of £375,000.
Nigel Brook and Nigel Turner were not awarded increases in their base salaries from 1 July 2018.
Annual bonusIn the 2019 financial year, the maximum annual bonus opportunity for the Chief Executive will be 125% of base salary and 115% of base salary for all other Executive Directors, of which a maximum of 50% will relate to underlying earnings per share performance, a maximum of 30% to average month-end debt performance, 10% to health and safety targets and 10% to personal objectives. These objectives will relate to an improvement in the Group’s employee engagement survey scores, the realisation of benefits from the Future Proofing Kier programme and the continued development of the Group’s contract governance framework. The targets, and performance against them, will be disclosed in further detail in next year’s Annual Report. One-third of the net bonus will be satisfied by an allocation of shares, deferred for three years. Clawback provisions will apply for a three-year period following any bonus payment.
LTIP awardsIn the 2019 financial year, the Executive Directors will be granted LTIP awards of 150% of base salary. The performance conditions (and respective weightings) and targets for these LTIP awards will be the same as for the awards granted during the 2018 financial year, except for the removal of Carillion, following its liquidation, from the comparator group for TSR purposes. The comparator group will be:
Percentage change in the Chief Executive’s remunerationThe table below shows the percentage changes in base salary, taxable benefits and annual bonus of the Chief Executive in the 2018 financial year, as compared to the 2017 financial year, together with the approximate comparative average figures for those employees who were eligible for salary reviews on 1 July of each year and who were not subject to collective agreements. This section of the employee population (comprising approximately 8,000 individuals across a number of levels) is considered to be the most appropriate group for comparison purposes, as their remuneration is controlled by the Group and is subject to similar external market forces as those that relate to the Chief Executive’s remuneration. Approximately 900 employees are eligible to receive a bonus.Element of remuneration Chief Executive change Other employees change
Base salary 0% 3.8%Taxable benefits 0% 2.8%Annual bonus 104.9% 3.5%
Relative importance of spend on payThe graph below shows the percentage changes in the total employee remuneration and dividends paid between the 2017 and 2018 financial years:
Total employee remuneration (£m)
926.4
851.8
+8.8%2018
2017
Dividend (£m)
66.1
63.0
+4.9%2018
2017
Directors’ Remuneration Report
Annual report on remuneration continued
The Committee selected these companies because it considers that, together, they are the companies with which the Group competes across the range of services that it provides. The awards will, subject to the satisfaction of the performance conditions, vest on the third anniversary of their grant. A two-year holding period will apply to any vested awards.
Balfour Beatty Galliford Try Mears Morgan Sindall
Henry Boot Mitie Renew Holdings Costain
Interserve MJ Gleeson SEGRO
100 Kier Group plc | Report and Accounts 2018

Pension and taxable benefitsThe Executive Directors will continue to receive a pension contribution of 20% of salary, subject to the annual allowance, with the balance being paid as a cash allowance. The Executive Directors will also continue to receive private health insurance and either a company car or a car allowance of £11,900 per annum. Both amounts remain unchanged from the 2018 financial year.
Non-Executive Directors’ feesThere will be no increase in the Non-Executive Director base fee or the fees for Chair of a Board committee, the Senior Independent Director or the Chairman for the 2019 financial year. The total fees payable to the Non-Executive Directors with effect from 1 July 2018 are as follows:
DirectorBase fee from
1 July 2018Chair of Board committee
fee from 1 July 2018Senior Independent Director
fee from 1 July 2018Total from
1 July 2018
Justin Atkinson £51,500 – £10,000 £61,500Constance Baroudel £51,500 £10,000 – £61,500Kirsty Bashforth £51,500 – – £51,500Philip Cox1 £235,0002 – – £235,000Adam Walker £51,500 £10,000 – £61,500Nick Winser £51,500 £10,000 – £61,500
1 Philip Cox does not receive a fee for his work as the Chair of the Nomination Committee.2 The fee payable to Philip Cox upon his appointment as Chairman with effect from 1 August 2017.
The Remuneration CommitteeMembership and meeting attendanceThe names of the members of the Committee are set out on page 86, together with an indication of the Committee’s principal activities during the 2018 financial year. The Chief Executive and the Group HR Director (Chris Last) are invited to attend Committee meetings. No individuals are involved in decisions relating to their own remuneration. The Committee met formally four times during the year. The secretary of the Committee is the Company Secretary (Hugh Raven). The Committee’s terms of reference can be viewed on the Company’s website at www.kier.co.uk/corporategovernance.
Principal activities – 2018 financial yearThe annual statement of the Chair of the Remuneration Committee on pages 86 to 88 (inclusive) provides a summary of the Committee’s principal activities during the year.
Committee performance evaluation2018 – progress against 2017 evaluationThe 2017 Board evaluation identified that engaging with all stakeholders, principally shareholders and the Executive Directors, on remuneration matters was a key area of focus for the Committee in the 2018 financial year. The 2018 Board evaluation process confirmed that good progress had been made in this respect.
2019 – principal areas of focusThe 2018 Board evaluation confirmed that continued engagement with shareholders in respect to the implementation of the remuneration policy would be the Committee’s principal area of focus in the 2019 financial year.
AdvisersDuring the 2018 financial year, the Committee received advice from Mercer (Jenny Martin and Stuart Harrison). Total fees of £30,535 (excluding VAT) were payable in respect of Mercer’s services as remuneration advisers during the year. Mercer is a signatory to the Code of Conduct for Remuneration Consultants which has been developed by the Remuneration Consultants Group. The Committee also receives support and advice from the Company Secretary, the Group HR Director and the Group Reward and Pensions Director (Mark Bradshaw). Mercer provided actuarial advice to the Mouchel pension schemes until 31 December 2017. The Committee is satisfied that the advice it receives from Mercer is objective and independent.
Shareholder votingBoth the Directors’ remuneration policy and the annual report on remuneration were subject to a shareholder vote at the 2017 AGM.
The results of the vote on the resolution approving the remuneration policy were:Votes for1 Percentage votes for Votes against2 Percentage votes against Votes withheld
45,132,928 90.28 4,860,934 9.72 7,311,115
The results of the vote on the resolution approving the remuneration report were:Votes for1 Percentage votes for Votes against2 Percentage votes against Votes withheld
32,021,380 63.03 18,784,004 36.97 6,534,417
1 Includes those votes for which discretion was given to the Chairman.2 Does not include votes withheld.
Please see ‘Relations with shareholders and other stakeholders’ on pages 83 to 85 (inclusive) and the Annual statement of the Chair of the Remuneration Committee on pages 86 and 87 for further information on the vote in relation to the remuneration report.
Strategic R
eportG
overnanceFinancial S
tatements
Kier Group plc | Report and Accounts 2018 101
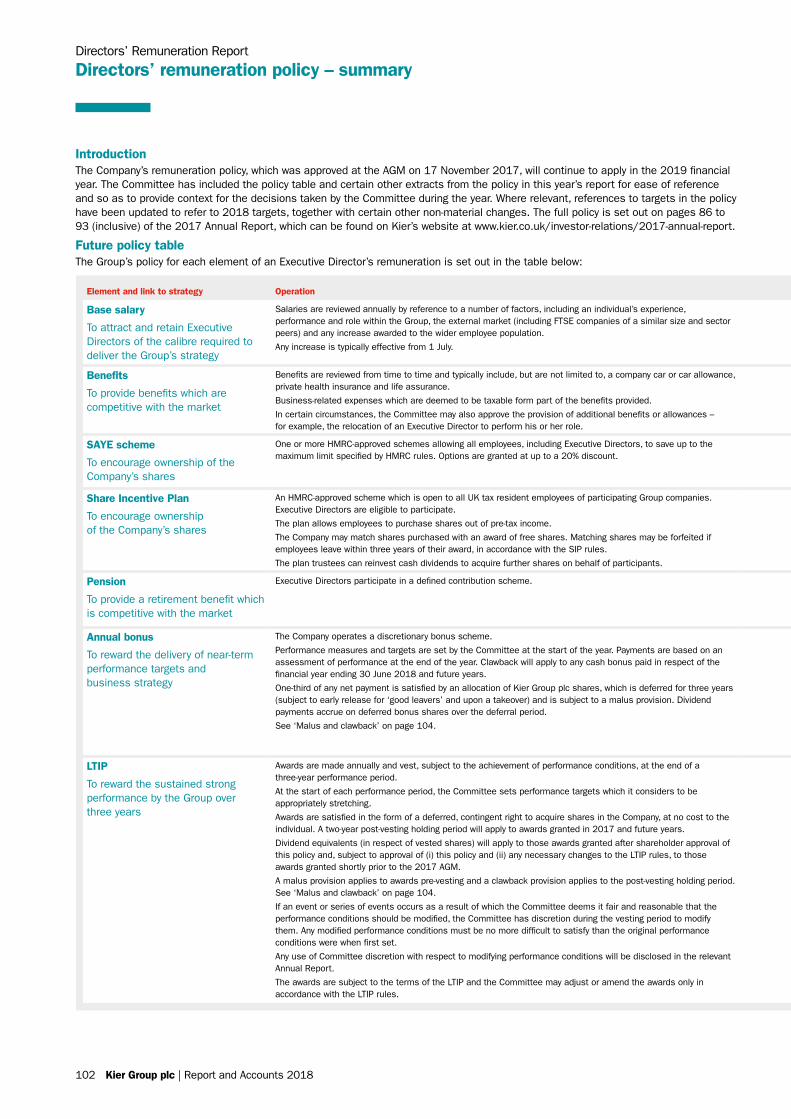
Element and link to strategy Operation Opportunity Performance measures
Base salary
To attract and retain Executive Directors of the calibre required to deliver the Group’s strategy
Salaries are reviewed annually by reference to a number of factors, including an individual’s experience, performance and role within the Group, the external market (including FTSE companies of a similar size and sector peers) and any increase awarded to the wider employee population.
Any increase is typically effective from 1 July.
Any increase will typically be in line with those awarded to the wider employee population. The Committee has discretion to award higher increases in circumstances that it considers appropriate, such as a material change in the complexity of the business or an individual’s responsibility. Details of salary changes will be disclosed in the Annual Report.
Continued strong performance.
Benefits
To provide benefits which are competitive with the market
Benefits are reviewed from time to time and typically include, but are not limited to, a company car or car allowance, private health insurance and life assurance.
Business-related expenses which are deemed to be taxable form part of the benefits provided.
In certain circumstances, the Committee may also approve the provision of additional benefits or allowances – for example, the relocation of an Executive Director to perform his or her role.
Benefits are set at a level which the Committee considers appropriate in light of the market and an individual’s circumstances.
None.
SAYE scheme
To encourage ownership of the Company’s shares
One or more HMRC-approved schemes allowing all employees, including Executive Directors, to save up to the maximum limit specified by HMRC rules. Options are granted at up to a 20% discount.
The maximum amount that may be saved is the limit prescribed by HMRC (or such other lower limit as determined by the Committee) at the time employees are invited to participate in a scheme. Typically, employees are invited to participate on an annual basis.
None.
Share Incentive Plan
To encourage ownership of the Company’s shares
An HMRC-approved scheme which is open to all UK tax resident employees of participating Group companies. Executive Directors are eligible to participate.
The plan allows employees to purchase shares out of pre-tax income.
The Company may match shares purchased with an award of free shares. Matching shares may be forfeited if employees leave within three years of their award, in accordance with the SIP rules.
The plan trustees can reinvest cash dividends to acquire further shares on behalf of participants.
Participants can purchase shares up to the prevailing limit approved by HMRC (or such other lower limit as determined by the Committee) at the time they are invited to participate.
The Company currently offers to match purchases made through the plan at the rate of one free share for every two shares purchased.
None.
Pension
To provide a retirement benefit which is competitive with the market
Executive Directors participate in a defined contribution scheme. For current Executive Directors, the maximum employer contribution is 20% of pensionable salary.
Executive Directors may elect to receive all or part of the employer contribution as a taxable cash supplement.
None.
Annual bonus
To reward the delivery of near-term performance targets and business strategy
The Company operates a discretionary bonus scheme.
Performance measures and targets are set by the Committee at the start of the year. Payments are based on an assessment of performance at the end of the year. Clawback will apply to any cash bonus paid in respect of the financial year ending 30 June 2018 and future years.
One-third of any net payment is satisfied by an allocation of Kier Group plc shares, which is deferred for three years (subject to early release for ‘good leavers’ and upon a takeover) and is subject to a malus provision. Dividend payments accrue on deferred bonus shares over the deferral period.
See ‘Malus and clawback’ on page 104.
The maximum potential bonus for the financial year ended 30 June 2018 was 125% of base salary for the Chief Executive and 115% of base salary for other Executive Directors.
‘Threshold’ performance, for which an element of bonus may become payable under each component of the annual bonus, is set by the Committee at the start of each financial year.
The level of bonus for achieving threshold performance varies by performance measure, and may vary for a measure from year to year, to ensure that it is aligned with the Committee’s assessment of the degree of difficulty (or ‘stretch’) in achieving it.
The Committee has discretion to determine the performance measures and their relative weightings each year. The weighting towards non-financial measures will be no higher than 25% of the maximum potential bonus.
The Committee has discretion to adjust bonus payments to ensure that they accurately reflect business and safety performance over the performance period and are fair to shareholders as well as recipients.
Actual targets for each performance measure (and performance against each of these targets), and any use by the Committee of its discretion with respect to bonus payments, will be disclosed in the Annual Report immediately following the end of the performance period.
LTIP
To reward the sustained strong performance by the Group over three years
Awards are made annually and vest, subject to the achievement of performance conditions, at the end of a three-year performance period.
At the start of each performance period, the Committee sets performance targets which it considers to be appropriately stretching.
Awards are satisfied in the form of a deferred, contingent right to acquire shares in the Company, at no cost to the individual. A two-year post-vesting holding period will apply to awards granted in 2017 and future years.
Dividend equivalents (in respect of vested shares) will apply to those awards granted after shareholder approval of this policy and, subject to approval of (i) this policy and (ii) any necessary changes to the LTIP rules, to those awards granted shortly prior to the 2017 AGM.
A malus provision applies to awards pre-vesting and a clawback provision applies to the post-vesting holding period. See ‘Malus and clawback’ on page 104.
If an event or series of events occurs as a result of which the Committee deems it fair and reasonable that the performance conditions should be modified, the Committee has discretion during the vesting period to modify them. Any modified performance conditions must be no more difficult to satisfy than the original performance conditions were when first set.
Any use of Committee discretion with respect to modifying performance conditions will be disclosed in the relevant Annual Report.
The awards are subject to the terms of the LTIP and the Committee may adjust or amend the awards only in accordance with the LTIP rules.
The maximum award under the rules of the plan is 200% of base salary.
The Committee may grant awards of up to the maximum permitted under the LTIP rules when it considers it appropriate to do so. The reasons for an award in excess of 150% of salary will be disclosed in the relevant Annual Report.
On achieving the threshold performance level for each element of the award, 25% of the relevant element of the award will vest. Vesting is on a straight-line basis between threshold and maximum levels of performance.
The performance conditions for the LTIP awards to be awarded in the 2018 financial year will relate to EPS (50%), TSR (25%) and net debt: EBITDA (25%).
EPS performance is measured by compound cumulative growth over the performance period.
TSR outperformance is measured against a bespoke group of listed companies which reflects the Group’s business mix and competition for capital. The TSR comparators for the awards made in the financial year ended 30 June 2018 are listed on page 96.
The Committee retains discretion to change or supplement EPS, TSR and net debt : EBITDA as performance measures with alternative or additional performance measures to ensure that the awards are always linked to sustained business performance. No measure will carry a weighting of less than 25%.
Actual performance measures and weightings will be disclosed in the Annual Report immediately following the granting of an award.
IntroductionThe Company’s remuneration policy, which was approved at the AGM on 17 November 2017, will continue to apply in the 2019 financial year. The Committee has included the policy table and certain other extracts from the policy in this year’s report for ease of reference and so as to provide context for the decisions taken by the Committee during the year. Where relevant, references to targets in the policy have been updated to refer to 2018 targets, together with certain other non-material changes. The full policy is set out on pages 86 to 93 (inclusive) of the 2017 Annual Report, which can be found on Kier’s website at www.kier.co.uk/investor-relations/2017-annual-report.
Future policy tableThe Group’s policy for each element of an Executive Director’s remuneration is set out in the table below:
Directors’ Remuneration Report
Directors’ remuneration policy – summary
102 Kier Group plc | Report and Accounts 2018
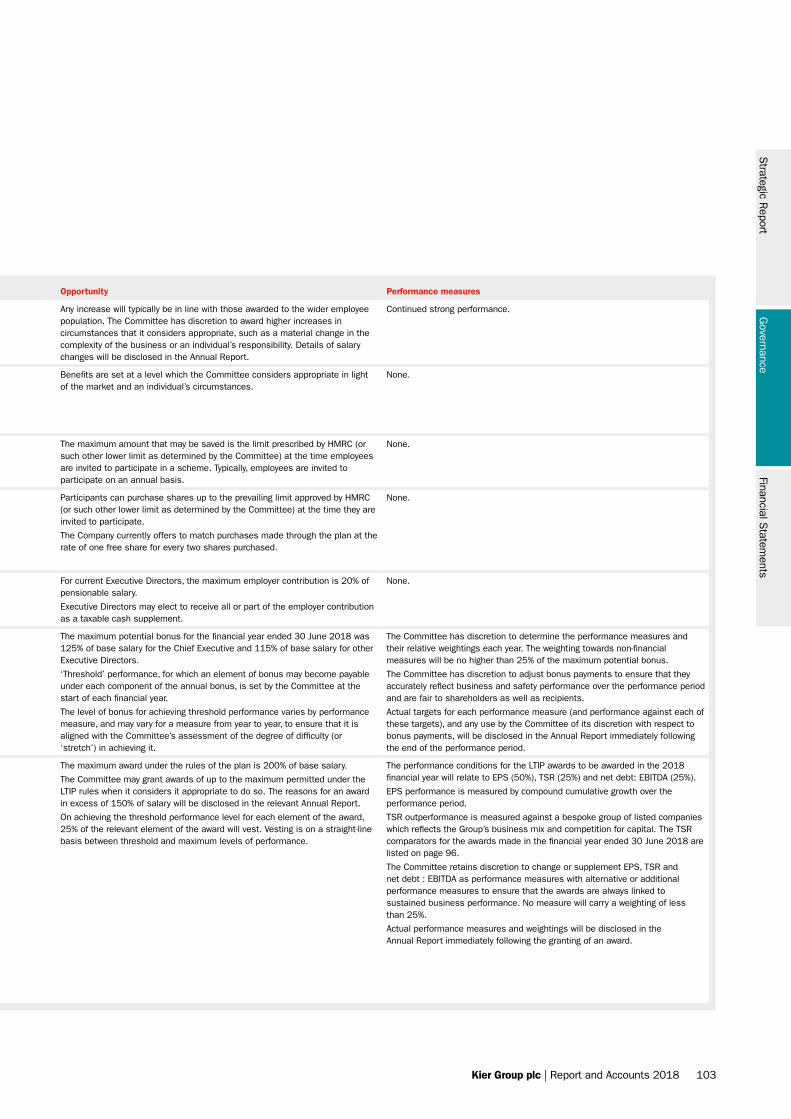
Element and link to strategy Operation Opportunity Performance measures
Base salary
To attract and retain Executive Directors of the calibre required to deliver the Group’s strategy
Salaries are reviewed annually by reference to a number of factors, including an individual’s experience, performance and role within the Group, the external market (including FTSE companies of a similar size and sector peers) and any increase awarded to the wider employee population.
Any increase is typically effective from 1 July.
Any increase will typically be in line with those awarded to the wider employee population. The Committee has discretion to award higher increases in circumstances that it considers appropriate, such as a material change in the complexity of the business or an individual’s responsibility. Details of salary changes will be disclosed in the Annual Report.
Continued strong performance.
Benefits
To provide benefits which are competitive with the market
Benefits are reviewed from time to time and typically include, but are not limited to, a company car or car allowance, private health insurance and life assurance.
Business-related expenses which are deemed to be taxable form part of the benefits provided.
In certain circumstances, the Committee may also approve the provision of additional benefits or allowances – for example, the relocation of an Executive Director to perform his or her role.
Benefits are set at a level which the Committee considers appropriate in light of the market and an individual’s circumstances.
None.
SAYE scheme
To encourage ownership of the Company’s shares
One or more HMRC-approved schemes allowing all employees, including Executive Directors, to save up to the maximum limit specified by HMRC rules. Options are granted at up to a 20% discount.
The maximum amount that may be saved is the limit prescribed by HMRC (or such other lower limit as determined by the Committee) at the time employees are invited to participate in a scheme. Typically, employees are invited to participate on an annual basis.
None.
Share Incentive Plan
To encourage ownership of the Company’s shares
An HMRC-approved scheme which is open to all UK tax resident employees of participating Group companies. Executive Directors are eligible to participate.
The plan allows employees to purchase shares out of pre-tax income.
The Company may match shares purchased with an award of free shares. Matching shares may be forfeited if employees leave within three years of their award, in accordance with the SIP rules.
The plan trustees can reinvest cash dividends to acquire further shares on behalf of participants.
Participants can purchase shares up to the prevailing limit approved by HMRC (or such other lower limit as determined by the Committee) at the time they are invited to participate.
The Company currently offers to match purchases made through the plan at the rate of one free share for every two shares purchased.
None.
Pension
To provide a retirement benefit which is competitive with the market
Executive Directors participate in a defined contribution scheme. For current Executive Directors, the maximum employer contribution is 20% of pensionable salary.
Executive Directors may elect to receive all or part of the employer contribution as a taxable cash supplement.
None.
Annual bonus
To reward the delivery of near-term performance targets and business strategy
The Company operates a discretionary bonus scheme.
Performance measures and targets are set by the Committee at the start of the year. Payments are based on an assessment of performance at the end of the year. Clawback will apply to any cash bonus paid in respect of the financial year ending 30 June 2018 and future years.
One-third of any net payment is satisfied by an allocation of Kier Group plc shares, which is deferred for three years (subject to early release for ‘good leavers’ and upon a takeover) and is subject to a malus provision. Dividend payments accrue on deferred bonus shares over the deferral period.
See ‘Malus and clawback’ on page 104.
The maximum potential bonus for the financial year ended 30 June 2018 was 125% of base salary for the Chief Executive and 115% of base salary for other Executive Directors.
‘Threshold’ performance, for which an element of bonus may become payable under each component of the annual bonus, is set by the Committee at the start of each financial year.
The level of bonus for achieving threshold performance varies by performance measure, and may vary for a measure from year to year, to ensure that it is aligned with the Committee’s assessment of the degree of difficulty (or ‘stretch’) in achieving it.
The Committee has discretion to determine the performance measures and their relative weightings each year. The weighting towards non-financial measures will be no higher than 25% of the maximum potential bonus.
The Committee has discretion to adjust bonus payments to ensure that they accurately reflect business and safety performance over the performance period and are fair to shareholders as well as recipients.
Actual targets for each performance measure (and performance against each of these targets), and any use by the Committee of its discretion with respect to bonus payments, will be disclosed in the Annual Report immediately following the end of the performance period.
LTIP
To reward the sustained strong performance by the Group over three years
Awards are made annually and vest, subject to the achievement of performance conditions, at the end of a three-year performance period.
At the start of each performance period, the Committee sets performance targets which it considers to be appropriately stretching.
Awards are satisfied in the form of a deferred, contingent right to acquire shares in the Company, at no cost to the individual. A two-year post-vesting holding period will apply to awards granted in 2017 and future years.
Dividend equivalents (in respect of vested shares) will apply to those awards granted after shareholder approval of this policy and, subject to approval of (i) this policy and (ii) any necessary changes to the LTIP rules, to those awards granted shortly prior to the 2017 AGM.
A malus provision applies to awards pre-vesting and a clawback provision applies to the post-vesting holding period. See ‘Malus and clawback’ on page 104.
If an event or series of events occurs as a result of which the Committee deems it fair and reasonable that the performance conditions should be modified, the Committee has discretion during the vesting period to modify them. Any modified performance conditions must be no more difficult to satisfy than the original performance conditions were when first set.
Any use of Committee discretion with respect to modifying performance conditions will be disclosed in the relevant Annual Report.
The awards are subject to the terms of the LTIP and the Committee may adjust or amend the awards only in accordance with the LTIP rules.
The maximum award under the rules of the plan is 200% of base salary.
The Committee may grant awards of up to the maximum permitted under the LTIP rules when it considers it appropriate to do so. The reasons for an award in excess of 150% of salary will be disclosed in the relevant Annual Report.
On achieving the threshold performance level for each element of the award, 25% of the relevant element of the award will vest. Vesting is on a straight-line basis between threshold and maximum levels of performance.
The performance conditions for the LTIP awards to be awarded in the 2018 financial year will relate to EPS (50%), TSR (25%) and net debt: EBITDA (25%).
EPS performance is measured by compound cumulative growth over the performance period.
TSR outperformance is measured against a bespoke group of listed companies which reflects the Group’s business mix and competition for capital. The TSR comparators for the awards made in the financial year ended 30 June 2018 are listed on page 96.
The Committee retains discretion to change or supplement EPS, TSR and net debt : EBITDA as performance measures with alternative or additional performance measures to ensure that the awards are always linked to sustained business performance. No measure will carry a weighting of less than 25%.
Actual performance measures and weightings will be disclosed in the Annual Report immediately following the granting of an award.
Strategic R
eportG
overnanceFinancial S
tatements
Kier Group plc | Report and Accounts 2018 103
Payments from outstanding awardsThe Company will honour any commitment entered into, and the Executive Directors will be eligible to receive payment from any award or arrangement made, (i) before this policy came into effect, provided that the terms of the commitment or payment are consistent with this policy or preceded it, or (ii) at a time when the relevant individual was not a Director and, in the opinion of the Committee, the payment was not in consideration for the individual becoming a Director. For these purposes, ‘payment’ includes the satisfaction of awards of variable remuneration and, in relation to awards of shares, upon the terms which were agreed when the award was granted.
Notes to the policy tableMalus and clawbackAllocations of shares in part satisfaction of annual bonus payments and unvested LTIP awards will be subject to a ‘malus’ provision during the deferral period and the period prior to vesting, respectively.
This allows the Committee to determine, in its absolute discretion, that (i) the level of an unvested LTIP award (or part of an award) is reduced (including to nil) and/or (ii) the number of deferred shares is reduced (including to nil) in certain circumstances. Examples of such circumstances include, but are not limited to:
› a material misstatement of the Group’s financial statements; › a material error in determining the level of satisfaction of a
performance condition or target; › a participant’s action/omission resulting in material reputational
damage to the Group; › a participant deliberately misleading the Company, the market
and/or shareholders in relation to the financial performance of the Group;
› a participant’s employment being terminated in circumstances of gross misconduct and/or circumstances justifying summary dismissal; and
› other circumstances similar in nature to those listed above which the Committee considers justifies the application of malus.
The Committee has the right to apply the malus provision to an individual or on a collective basis.
Clawback applies to (i) the cash element of the annual bonus from the 2018 financial year (and may be applied up to three years following payment of the bonus) and (ii) the two-year post-vesting holding period which applies to LTIP awards granted from the 2018 financial year and future years. The Committee expects that the circumstances in which clawback will apply will be the same (or substantially the same) as for malus. The clawback may be effected by a reduction in: the number of deferred bonus shares previously allocated, the number of vested or unvested LTIP awards or salary or by repayment from an individual’s own funds or by any combination of these.
Executive Director shareholding guidelinesThe Committee encourages Executive Directors to accumulate a shareholding in the Company of at least two years’ base salary over a period of up to five years. Executive Directors are encouraged to retain any shares allocated to them as part of the annual bonus arrangements and 50% of the shares allocated to them upon the vesting of LTIP awards (net of tax) until they reach this level of shareholding.
Selection of performance measures and approach to setting targetsThe measures used for the annual bonus are determined annually to reflect KPIs which are considered important and relevant to the Group. The Committee believes that using a number of measures provides a balanced incentive. The measures themselves are aligned to, and are designed to support the delivery of, the Group’s strategy.
In relation to the LTIP awards, the Committee believes that the combination of EPS, TSR and net debt: EBITDA clearly aligns performance to shareholders’ interests and the Group’s long-term strategy. EPS is a key measure of long-term underlying performance of the Group. TSR is intended to measure management’s contribution to the creation of value for shareholders relative to a bespoke peer group which reflects the Group’s mix of business. Cash (and, therefore, net debt) is an important financial measure in the contracting sector and supports the delivery of the Group’s strategy. In future years, the Committee may decide to select other performance measures.
Targets for the annual bonus and the LTIP awards are reviewed before the awards are made, based on a number of internal and external reference points. The Committee intends that targets will be stretching but achievable and will align management’s interests with those of shareholders.
Approach to setting the remuneration of other employeesKier’s approach to setting annual remuneration is broadly consistent across the Group. Consideration is given to the experience, performance and responsibilities of individuals as well as to publicly available external benchmarking data, to the extent considered necessary or appropriate. Certain grades of senior employees are eligible to participate in an annual bonus scheme with similar performance measures to those used for the Executive Directors. Maximum opportunities and specific performance measures vary by seniority, with business-specific measures applied where appropriate. Senior managers (currently, approximately 350 individuals) are also eligible to participate in a long-term share incentive plan under which awards will normally vest after three years, subject to continued employment. Award sizes vary according to seniority and responsibility.
Directors’ Remuneration Report
Directors’ remuneration policy – summary continued
104 Kier Group plc | Report and Accounts 2018
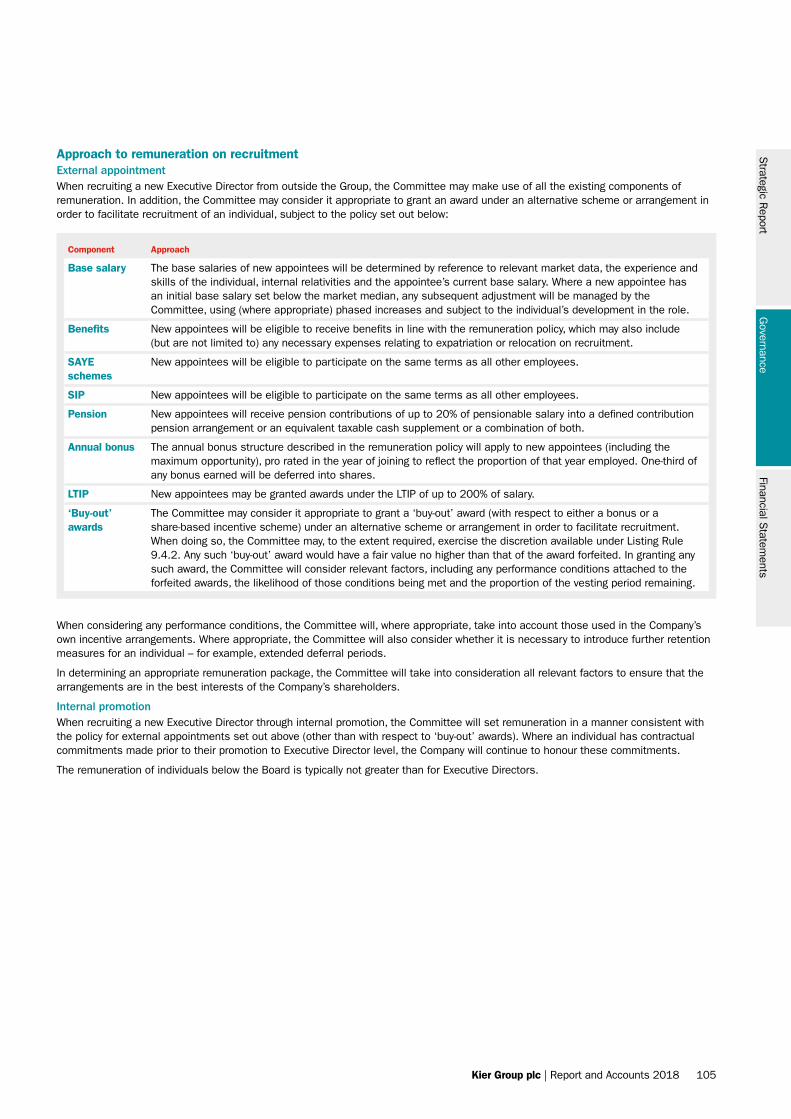
Approach to remuneration on recruitmentExternal appointmentWhen recruiting a new Executive Director from outside the Group, the Committee may make use of all the existing components of remuneration. In addition, the Committee may consider it appropriate to grant an award under an alternative scheme or arrangement in order to facilitate recruitment of an individual, subject to the policy set out below:
Component Approach
Base salary The base salaries of new appointees will be determined by reference to relevant market data, the experience and skills of the individual, internal relativities and the appointee’s current base salary. Where a new appointee has an initial base salary set below the market median, any subsequent adjustment will be managed by the Committee, using (where appropriate) phased increases and subject to the individual’s development in the role.
Benefits New appointees will be eligible to receive benefits in line with the remuneration policy, which may also include (but are not limited to) any necessary expenses relating to expatriation or relocation on recruitment.
SAYE schemes
New appointees will be eligible to participate on the same terms as all other employees.
SIP New appointees will be eligible to participate on the same terms as all other employees.
Pension New appointees will receive pension contributions of up to 20% of pensionable salary into a defined contribution pension arrangement or an equivalent taxable cash supplement or a combination of both.
Annual bonus The annual bonus structure described in the remuneration policy will apply to new appointees (including the maximum opportunity), pro rated in the year of joining to reflect the proportion of that year employed. One-third of any bonus earned will be deferred into shares.
LTIP New appointees may be granted awards under the LTIP of up to 200% of salary.
‘Buy-out’ awards
The Committee may consider it appropriate to grant a ‘buy-out’ award (with respect to either a bonus or a share-based incentive scheme) under an alternative scheme or arrangement in order to facilitate recruitment. When doing so, the Committee may, to the extent required, exercise the discretion available under Listing Rule 9.4.2. Any such ‘buy-out’ award would have a fair value no higher than that of the award forfeited. In granting any such award, the Committee will consider relevant factors, including any performance conditions attached to the forfeited awards, the likelihood of those conditions being met and the proportion of the vesting period remaining.
When considering any performance conditions, the Committee will, where appropriate, take into account those used in the Company’s own incentive arrangements. Where appropriate, the Committee will also consider whether it is necessary to introduce further retention measures for an individual – for example, extended deferral periods.
In determining an appropriate remuneration package, the Committee will take into consideration all relevant factors to ensure that the arrangements are in the best interests of the Company’s shareholders.
Internal promotionWhen recruiting a new Executive Director through internal promotion, the Committee will set remuneration in a manner consistent with the policy for external appointments set out above (other than with respect to ‘buy-out’ awards). Where an individual has contractual commitments made prior to their promotion to Executive Director level, the Company will continue to honour these commitments.
The remuneration of individuals below the Board is typically not greater than for Executive Directors.
Strategic R
eportG
overnanceFinancial S
tatements
Kier Group plc | Report and Accounts 2018 105
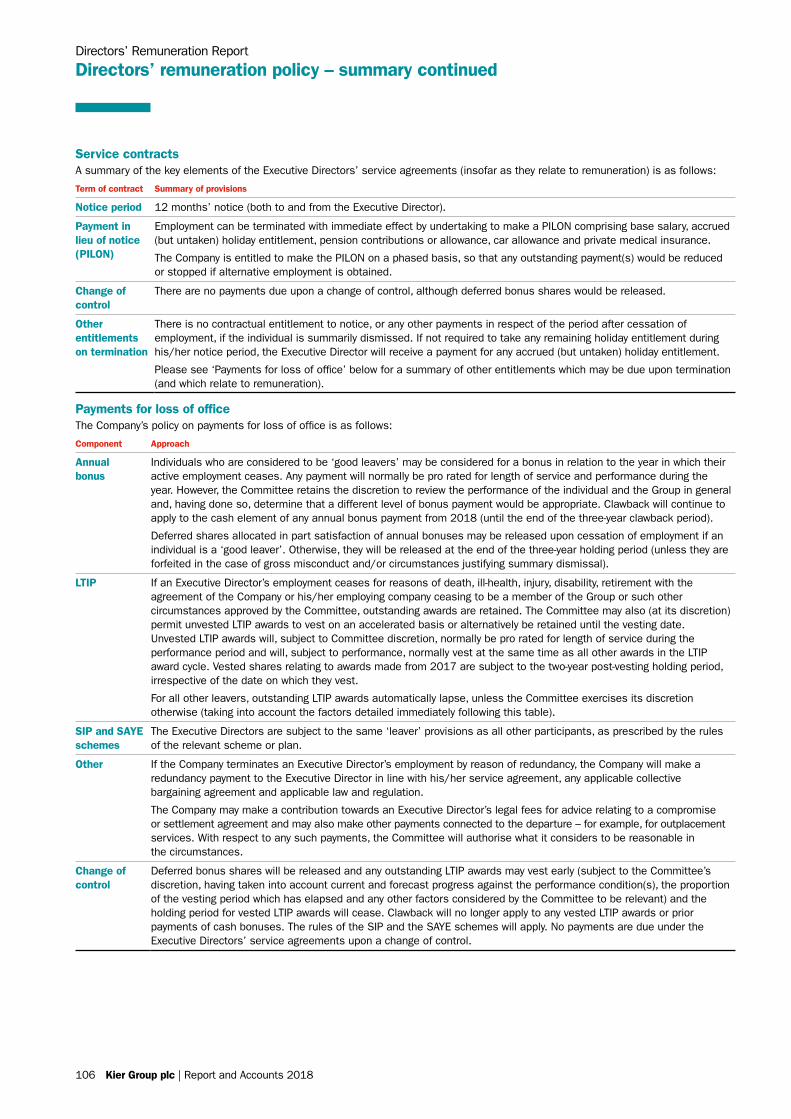
Service contractsA summary of the key elements of the Executive Directors’ service agreements (insofar as they relate to remuneration) is as follows:
Term of contract Summary of provisions
Notice period 12 months’ notice (both to and from the Executive Director).
Payment in lieu of notice (PILON)
Employment can be terminated with immediate effect by undertaking to make a PILON comprising base salary, accrued (but untaken) holiday entitlement, pension contributions or allowance, car allowance and private medical insurance.
The Company is entitled to make the PILON on a phased basis, so that any outstanding payment(s) would be reduced or stopped if alternative employment is obtained.
Change of control
There are no payments due upon a change of control, although deferred bonus shares would be released.
Other entitlements on termination
There is no contractual entitlement to notice, or any other payments in respect of the period after cessation of employment, if the individual is summarily dismissed. If not required to take any remaining holiday entitlement during his/her notice period, the Executive Director will receive a payment for any accrued (but untaken) holiday entitlement.
Please see ‘Payments for loss of office’ below for a summary of other entitlements which may be due upon termination (and which relate to remuneration).
Payments for loss of officeThe Company’s policy on payments for loss of office is as follows:
Component Approach
Annual bonus
Individuals who are considered to be ‘good leavers’ may be considered for a bonus in relation to the year in which their active employment ceases. Any payment will normally be pro rated for length of service and performance during the year. However, the Committee retains the discretion to review the performance of the individual and the Group in general and, having done so, determine that a different level of bonus payment would be appropriate. Clawback will continue to apply to the cash element of any annual bonus payment from 2018 (until the end of the three-year clawback period).
Deferred shares allocated in part satisfaction of annual bonuses may be released upon cessation of employment if an individual is a ‘good leaver’. Otherwise, they will be released at the end of the three-year holding period (unless they are forfeited in the case of gross misconduct and/or circumstances justifying summary dismissal).
LTIP If an Executive Director’s employment ceases for reasons of death, ill-health, injury, disability, retirement with the agreement of the Company or his/her employing company ceasing to be a member of the Group or such other circumstances approved by the Committee, outstanding awards are retained. The Committee may also (at its discretion) permit unvested LTIP awards to vest on an accelerated basis or alternatively be retained until the vesting date. Unvested LTIP awards will, subject to Committee discretion, normally be pro rated for length of service during the performance period and will, subject to performance, normally vest at the same time as all other awards in the LTIP award cycle. Vested shares relating to awards made from 2017 are subject to the two-year post-vesting holding period, irrespective of the date on which they vest.
For all other leavers, outstanding LTIP awards automatically lapse, unless the Committee exercises its discretion otherwise (taking into account the factors detailed immediately following this table).
SIP and SAYE schemes
The Executive Directors are subject to the same ‘leaver’ provisions as all other participants, as prescribed by the rules of the relevant scheme or plan.
Other If the Company terminates an Executive Director’s employment by reason of redundancy, the Company will make a redundancy payment to the Executive Director in line with his/her service agreement, any applicable collective bargaining agreement and applicable law and regulation.
The Company may make a contribution towards an Executive Director’s legal fees for advice relating to a compromise or settlement agreement and may also make other payments connected to the departure – for example, for outplacement services. With respect to any such payments, the Committee will authorise what it considers to be reasonable in the circumstances.
Change of control
Deferred bonus shares will be released and any outstanding LTIP awards may vest early (subject to the Committee’s discretion, having taken into account current and forecast progress against the performance condition(s), the proportion of the vesting period which has elapsed and any other factors considered by the Committee to be relevant) and the holding period for vested LTIP awards will cease. Clawback will no longer apply to any vested LTIP awards or prior payments of cash bonuses. The rules of the SIP and the SAYE schemes will apply. No payments are due under the Executive Directors’ service agreements upon a change of control.
Directors’ Remuneration Report
Directors’ remuneration policy – summary continued
106 Kier Group plc | Report and Accounts 2018
Where appropriate, the Committee will oblige the individual to mitigate his/her losses and either offset any alternative remuneration received by the individual against any payments made by the Company for loss of office or reduce any payments to be made by the Company for loss of office to take account of any failure to mitigate when, in the reasonable opinion of the Committee, the individual has failed actively to do so.
In exercising discretion in respect of any of the elements referred to above, the Committee will take into account all factors, which it considers to be appropriate at the relevant time. These include, but are not limited to: the duration of the Executive Director’s service; the Committee’s assessment of the Executive Director’s contribution to the success of the Group; whether the Executive Director has worked any notice period or whether a PILON is being made; the need to ensure an orderly handover of duties; and the need to compromise any claims which the Executive Director may have. Any use of Committee discretion will be disclosed in the relevant annual report on remuneration.
Consideration of employment conditions elsewhere in the GroupEmployees are not formally consulted on the Executive Directors’ remuneration and were not consulted during the preparation of the remuneration policy set out above. However, the Group’s employee engagement survey provides an opportunity for employees to provide their opinion on their own remuneration arrangements.
The Committee takes into account the overall pay and employment conditions of employees within the Group when making decisions on the Executive Directors’ remuneration. In addition, the Committee is provided with information about the proposed annual Group-wide pay review when setting the Executive Directors’ salaries and is made aware of the approximate outcomes of annual bonuses within the wider workforce.
Consideration of shareholders’ viewsThe views of shareholders, and guidance from shareholder representative bodies, are important to the Committee and provide the context for setting the remuneration of the Executive Directors. The Chair of the Committee consulted with a number of significant shareholders during the year and their views have been taken into account when preparing the remuneration policy.
The Committee will keep the remuneration policy under regular review so as to ensure that it continues to relate to the Company’s long-term strategy and aligns the interests of the Executive Directors with those of the shareholders. In addition, the Committee will continue to monitor trends and developments in corporate governance and market practice to ensure the structure of executive remuneration remains appropriate.
Non-Executive Director remuneration policyGeneralThe Non-Executive Directors’ remuneration (including that of the Chairman) reflects the anticipated time commitment to fulfil their duties. Non-Executive Directors do not receive bonuses, long-term incentive awards, a pension or compensation on termination of their appointments. The policy on Non-Executive Directors’ remuneration is as follows:
Element and link to strategy Operation Opportunity Performance measures
Fees
To attract and retain Non-Executive Directors of the calibre required and with appropriate skills and experience
Fee levels are reviewed annually with reference to individual experience, the external market and the expected time commitment required of the Director.
Additional fees are payable to the Chairs of the Board’s committees and to the Senior Independent Director.
Fees may be increased in line with the outcome of the annual review and will not normally exceed the increase awarded to the wider employee population. Higher increases may be awarded should there be a material change to the requirements of the role, such as additional time commitment.
Any changes to fees will be disclosed in the annual report on remuneration for the relevant year.
Continued strong performance.
Benefits
To reimburse Non-Executive Directors for expenses
Reasonable and necessary expenses are reimbursed, together with any tax due on them.
Expenses (including, without limitation, travel and subsistence) incurred in connection with Kier business.
Not applicable.
Recruiting Non-Executive DirectorsWhen recruiting a new Non-Executive Director, the Committee will follow the policy set out in the table above.
Non-Executive Director letters of appointmentThe Non-Executive Directors do not have service contracts but have entered into letters of appointment with the Company. The letters of appointment do not include any provisions for the payment of pre-determined compensation upon termination of appointment.
Strategic R
eportG
overnanceFinancial S
tatements
Kier Group plc | Report and Accounts 2018 107
108 Kier Group plc | Report and Accounts 2018
Directors’ Report
IntroductionThis Directors’ Report and the Strategic Report on pages 1 to 56 (inclusive) together comprise the ‘management report’ for the purposes of Disclosure and Transparency Rule 4.1.5R.
Information incorporated by referenceThe following information is provided in other appropriate sections of this Annual Report and the financial statements and is incorporated by reference:
Information Reported in Page(s)
Corporate governance Corporate Governance Statement Statements of Directors’ Responsibilities
57 to 85 (inclusive) 110
Directors Board of Directors Directors’ Remuneration Report – Directors’ shareholdings and share interests
64 and 6597
Employees Corporate responsibility 34
Financial instruments Financial statements – note 27
166 to 170 (inclusive)
Going concern Board statements 60
Greenhouse gas emissions
Corporate responsibility 35
Important events since the end of the financial year
Not applicable –
Likely future developments
Chief Executive’s strategic review
19
Results and dividends Chairman’s statement 12
Disclosures required under Listing Rule 9.8.4RThe table below sets out where information required to be disclosed under Listing Rule 9.8.4R can be found in this Annual Report (to the extent applicable to the Company).
Information Reported in Page(s)
(1) Amount of interest capitalised
Financial statements – note 12 (Computer software, footnote 2)
146
(2) Unaudited financial information
Not applicable –
(4) Long-term incentive schemes
Directors’ Remuneration Report
86 to 107 (inclusive)
(5) – (11) Not applicable –
(12) – (13) Rights under employee share schemes
108 and 109
(14) Not applicable –
Political donationsThe Company made no political donations during the year (2017: nil).
Research and developmentThe Group undertakes research and development activities when providing services to its clients – for example, in relation to design development, construction techniques and project management process and efficiencies. The direct expenditure incurred is not readily identifiable, as the investment is typically included in the relevant project.
Share capitalAs at 30 June 2018, the issued share capital of the Company consisted of 97,460,163 ordinary shares of 1 pence each. Details of changes to the ordinary shares issued and of options and awards granted during the year are set out in notes 24 and 25 to the consolidated financial statements on pages 163 to 165 (inclusive).
Subject to the provisions of the articles of association of the Company (the Articles) and prevailing legislation, shares may be issued with such rights or restrictions as the Company may by ordinary resolution determine or, if the Company has not so determined, as the Directors may decide.
Restrictions on transfer of securities in the CompanyThere are no restrictions on the transfer of securities in the Company, other than those that are set out in the Articles or apply as a result of the operation of law or regulation. The Company is not aware of any agreements between holders of securities that may result in restrictions on the transfer of securities in the Company.
Substantial holdingsAs at 19 September 2018, the Company had been notified of the following interests in the share capital of the Company (being voting rights over such share capital), pursuant to Rule 5.1 of the Disclosure and Transparency Rules:
Shareholder Interest1
Standard Life Aberdeen plc 14.0%
Woodford Investment Management Ltd 10.0%
BlackRock Inc 5.9%
Brewin Dolphin Limited 5.0%
Rathbone Investment Management Ltd 4.9%
Schroders plc 4.8%
Norges Bank 3.0%
1 Subject to rounding.
Securities carrying special rightsNo person holds securities in the Company carrying special rights with regard to control of the Company.
Rights under employee share schemesAs at 30 June 2018, RBC Trustees (Guernsey) Limited (RBC), as the trustee of the Kier Group 1999 Employee Benefit Trust, owned 12,897 shares (approximately 0.01% of the Company’s issued share capital) at that date. These shares are made available to satisfy the vesting of LTIP awards and awards of shares to senior management as part of the annual bonus arrangements. RBC does not exercise any voting rights in respect of shares held by the trust. RBC waives its rights to dividends in respect of such shares, other than those relating to the annual bonus arrangements.
Strategic R
eportG
overnanceFinancial S
tatements
Kier Group plc | Report and Accounts 2018 109
As at 30 June 2018, Yorkshire Building Society (YBS) held 1,385,686 shares (approximately 1.42% of the Company’s issued share capital) at that date on trust for the benefit of members of the SIP. At the same date, YBS also held 8,919 shares (0.01% of the issued share capital) on trust for the benefit of members of the legacy May Gurney Share Incentive Plan. YBS does not exercise any voting rights in respect of the shares held by the trust (although beneficiaries may authorise YBS to vote in accordance with their instructions). YBS distributes dividends received to beneficiaries under the trust.
As at 30 June 2018, the trustee of the May Gurney Limited Employee Share Ownership Trust and the trustee of the May Gurney Integrated Services PLC Employee Benefit Trust held, respectively, 219,759 and 19,045 shares (in aggregate, approximately 0.25% of the Company’s issued share capital) at that date.
These shares are made available to satisfy awards of shares under the Group’s remuneration arrangements. Neither trustee exercises any voting rights in respect of shares held by their respective trust and each waives dividends payable with respect to such shares.
Restrictions on voting rightsNo shareholder will, unless the Board otherwise determines, be entitled to vote at any general meeting unless all calls or other sums then payable by the shareholder in respect of that share have been paid or if that shareholder has been served with a disenfranchisement notice.
The Company is not aware of any agreements between holders of securities that may result in restrictions on voting rights.
Appointment and replacement of Directors/qualifying indemnitiesDirectors may be appointed by the Company by ordinary resolution or by the Board. A Director appointed by the Board holds office until the next AGM of the Company after his/her appointment and is then eligible to stand for election.
Each of the Directors in office at the date of this Annual Report, other than Nick Winser, will be standing for re-election by members at the 2018 AGM. Further information about the Directors’ skills and experience can be found on pages 64 and 65.
The Company may by ordinary resolution, of which special notice has been given, remove any Director before the expiry of the Director’s period of office.
The Company is not aware of any of the Directors being the beneficiary of a qualifying indemnity provision.
Amendment of ArticlesThe Articles may be amended by a special resolution of the Company’s shareholders.
Powers of the DirectorsSubject to the Articles, applicable law and any directions given by shareholders, the Company’s business is managed by the Board, which may exercise all the powers of the Company.
Powers in relation to the Company issuing its sharesThe Directors were granted authority at the AGM on 17 November 2017 to allot shares in the Company (i) up to an aggregate nominal amount of £324,866 and (ii) up to an aggregate nominal amount of £649,733 in connection with a rights issue.
The Directors were also granted authority to allot shares (i) non-pre-emptively and wholly for cash up to an aggregate nominal amount of £48,729 and (ii) for the purposes of financing an acquisition or other capital investment up to a further nominal amount of £48,729.
Powers in relation to the Company buying back its sharesThe Company may only buy back shares if the Articles do not prohibit it from doing so and it has received the requisite authority from shareholders in general meeting. Although the Articles do not contain any such prohibition, the Company did not request any such authority at its last AGM and does not propose to do so at the forthcoming AGM.
Change of controlThe Group’s principal loan facility agreements with its UK lending banks, the note purchase agreements entered into in 2012 and 2014 in connection with the Group’s US private placements of notes and the Schuldschein loan agreements entered into in May and June 2016 each contain provisions under which, in the event of a change of control of the Company, the Company may be required to repay all outstanding amounts borrowed.
Certain of the Group’s commercial arrangements, including certain of its joint venture agreements, contract bond agreements and other commercial agreements entered into in the ordinary course of business, include change of control provisions.
Certain of the Group’s employee share schemes or remuneration arrangements contain provisions relating to a change of control of the Company. Outstanding options and awards may become exercisable or vest upon a change of control.
There are no agreements between the Company and the Directors providing for compensation for loss of office by any of the Directors that occurs as a result of a takeover bid (other than those referred to above).
BranchesBecause the Group is a global business, it has activities which operate through branches in certain jurisdictions.
AuditorThe Board has decided that PricewaterhouseCoopers LLP will be proposed as the Group’s auditor for the financial year ending 30 June 2019 and a resolution relating to this re-appointment will be tabled at the forthcoming AGM.
AGMThe Company’s 2018 AGM will be held at 12 noon on 16 November 2018 at the Andaz Hotel, 40 Liverpool Street, London EC2M 7QN.
This Directors’ Report was approved by the Board and signed on its behalf by:
Hugh RavenCompany Secretary
19 September 2018
Tempsford Hall Sandy Bedfordshire SG19 2BD
110 Kier Group plc | Report and Accounts 2018
Compliance with applicable law and regulationsThe Directors are responsible for preparing the Annual Report and the Group and parent company financial statements in accordance with applicable law and regulations. Company law requires the Directors to prepare the Group and parent company financial statements for each financial year. Under that law, they are required to prepare the Group financial statements in accordance with International Financial Reporting Standards as adopted by the European Union (IFRS) and applicable law and have elected to prepare the parent company financial statements in accordance with UK Accounting Standards and applicable law (UK Generally Accepted Accounting Practice). Under company law, the Directors must not approve the financial statements unless they are satisfied that they give a true and fair view of the state of affairs of the Group and parent company and of their profit or loss for that period. In preparing each of the Group and parent company financial statements, the Directors are required to:
› select suitable accounting policies and then apply them consistently; › make judgements and estimates that are reasonable and prudent; › for the Group financial statements, state whether they have
been prepared in accordance with IFRS; › for the parent company financial statements, state whether
applicable UK Accounting Standards have been followed, subject to any material departures disclosed and explained in the parent company financial statements; and
› prepare the financial statements on the going concern basis unless it is inappropriate to presume that the Group and the parent company will continue in business.
The Directors are responsible for keeping adequate accounting records that are sufficient to show and explain the parent company’s transactions and disclose with reasonable accuracy at any time the financial position of the parent company and enable them to ensure that its financial statements comply with the Companies Act 2006 and, with respect to the Group financial statements, Article 4 of the IAS Regulation.
The Directors have general responsibility for taking such steps as are reasonably open to them to safeguard the assets of the Group and to prevent and detect fraud and other irregularities.
Under applicable law and regulations, the Directors are also responsible for preparing the Strategic Report, the Directors’ Report, the Directors’ Remuneration Report and the Corporate Governance Statement and for ensuring that these comply with applicable laws and regulations.
The Directors are responsible for the maintenance and integrity of the corporate and financial information included on the Company’s website. Legislation in the UK governing the preparation and dissemination of financial statements may differ from legislation in other jurisdictions.
This Annual ReportEach of the Directors, whose names and functions are set out on pages 64 and 65, confirms that to the best of his or her knowledge:
› the financial statements contained in this Annual Report, prepared in accordance with the applicable set of accounting standards, give a true and fair view of the assets, liabilities, financial position and profit or loss of the Company and the undertakings included in the consolidation as a whole; and
› the management report contained in this Annual Report includes a fair review of the development and performance of the business and the position of the Company and the undertakings included in the consolidation taken as a whole, together with a description of the principal risks and uncertainties that they face.
Disclosure to auditorsEach Director who holds office at the date of approval of this Directors’ Report confirms that, so far as each such Director is aware, there is no relevant audit information of which the auditor is unaware; and the Directors have taken all the steps that they ought to have taken as directors to make themselves aware of any relevant audit information and to establish that the auditor is aware of that information.
Signed on behalf of the Board by:
Haydn MursellChief Executive
19 September 2018
Bev DewFinance Director
Statements of Directors’ responsibilities
Financial Statem
entsS
trategic Report
Governance
Kier Group plc | Report and Accounts 2018 111
Financial Statements
Independent auditor’s report to the members of Kier Group plc
Kier Group plc | Report and Accounts 2018 111
Report on the audit of the financial statements Opinion In our opinion:
› Kier Group plc’s Group financial statements and Company financial statements (the “financial statements”) give a true and fair view of the state of the Group’s and of the Company’s affairs as at 30 June 2018 and of the Group’s profit and cash flows for the year then ended;
› the Group financial statements have been properly prepared in accordance with International Financial Reporting Standards (IFRSs) as adopted by the European Union;
› the Company financial statements have been properly prepared in accordance with United Kingdom Generally Accepted Accounting Practice (United Kingdom Accounting Standards, comprising FRS 101 “Reduced Disclosure Framework”, and applicable law); and
› the financial statements have been prepared in accordance with the requirements of the Companies Act 2006 and, as regards the Group financial statements, Article 4 of the IAS Regulation.
We have audited the financial statements, included within the Annual Report and Accounts 2018 (the “Annual Report”), which comprise: the Consolidated and Company balance sheets as at 30 June 2018; the Consolidated income statement and Consolidated statement of comprehensive income, the Consolidated and Company statements of changes in equity, and the Consolidated cash flow statement for the year then ended; and the notes to the financial statements, which include a description of the significant accounting policies.
Our opinion is consistent with our reporting to the Audit Committee.
Basis for opinion We conducted our audit in accordance with International Standards on Auditing (UK) (“ISAs (UK)”) and applicable law. Our responsibilities under ISAs (UK) are further described in the Auditors’ responsibilities for the audit of the financial statements section of our report. We believe that the audit evidence we have obtained is sufficient and appropriate to provide a basis for our opinion.
Independence We remained independent of the Group in accordance with the ethical requirements that are relevant to our audit of the financial statements in the UK, which includes the FRC’s Ethical Standard, as applicable to listed public interest entities, and we have fulfilled our other ethical responsibilities in accordance with these requirements.
To the best of our knowledge and belief, we declare that non-audit services prohibited by the FRC’s Ethical Standard were not provided to the Group or the Company.
Other than those disclosed in the Risk Management and Audit Committee report and note 3 within the Financial Statements, we have provided no non-audit services to the Group or the Company in the period from 1 July 2017 to 30 June 2018.
Our audit approach Overview
› Overall Group materiality: £6.8 million (2017: £6.3 million), based on 5% of profit before tax from continuing operations excluding non-underlying items.
› Overall Company materiality: £4.9 million (2017: £4.9 million), based on the lower of component materiality and 1% of total assets.
› We have conducted audit work across all five of the Group’s divisions and achieved coverage over 90% (2017: 95%) of Group revenues.
› Valuation of land and properties (Group).
› Accounting for long-term contracts – including profit recognition, work in progress and provisioning (Group).
› Accounting for McNicholas acquisition (Group).
The scope of our audit As part of designing our audit, we determined materiality and assessed the risks of material misstatement in the financial statements. In particular, we looked at where the Directors made subjective judgements, for example in respect of significant accounting estimates that involved making assumptions and considering future events that are inherently uncertain.
We gained an understanding of the legal and regulatory framework applicable to the Group and the industries in which it operates and considered the risk of acts by the Group which were contrary to applicable laws and regulations, including fraud. We designed audit procedures at Group and significant component level to respond to the risk, recognising that the risk of not detecting a material misstatement due to fraud is higher than the risk of not detecting one resulting from error, as fraud may involve deliberate concealment by, for example, forgery or intentional misrepresentations, or through collusion. We focused on laws and regulations that could give rise to a material misstatement in the Group and Company financial statements, including, but not limited to, the Companies Act 2006, the Listing Rules, pensions and UK tax legislation, the Health and Safety Executive legislation and equivalent local laws and regulations applicable to overseas operations. Our tests included, but were not limited to, discussing compliance with internal legal counsel, review of correspondence with external legal advisors, review of external press releases and enquiries of management. There are inherent limitations in the audit procedures described above and the further removed non-compliance with laws and regulations is from the events and transactions reflected in the financial statements, the less likely we would become aware of it.
MATERIALITY
AUDIT SCOPE
AREAS OF FOCUS

112 Kier Group plc | Report and Accounts 2018
Financial Statements
Independent auditor’s report to the members of Kier Group plc continued
112 Kier Group plc | Report and Accounts 2018
We did not identify any key audit matters relating to irregularities, including fraud. As in all of our audits, we also addressed the risk of management override of internal controls, including testing journals and evaluating whether there was evidence of bias by the directors that represented a risk of material misstatement due to fraud.
Key audit matters Key audit matters are those matters that, in the auditors’ professional judgement, were of most significance in the audit of the financial statements of the current period and include the most significant assessed risks of material misstatement (whether or not due to fraud) identified by the auditors, including those which had the greatest effect on: the overall audit strategy; the allocation of resources in the audit; and directing the efforts of the engagement team. These matters, and any comments we make on the results of our procedures thereon, were addressed in the context of our audit of the financial statements as a whole, and in forming our opinion thereon, and we do not provide a separate opinion on these matters. This is not a complete list of all risks identified by our audit.
Key audit matter How our audit addressed the key audit matter Group Valuation of land and development properties Refer to page 79 (Risk Management and Audit Committee report), page 127 (accounting policy) and page 158 (notes).
Inventory in the Residential and Property divisions is stated at the lower of cost and net realisable value (i.e. the forecast selling price less the remaining costs to build and sell). An assessment of the net realisable value of inventory is carried out at each balance sheet date and is dependent upon management’s estimate of forecast selling prices and build costs (by reference to current prices), which may require significant judgement.
The Residential division comprises the Group’s land held for residential development of £45.1m (2017: £39.0m) and residential work in progress of £124.6m (2017: £132.7m) where building work has commenced.
In particular, we focused our work on those sites with a value of £60.2m (2017: £46.7m) where there is no immediate intention of development as there is a heightened risk that they are valued above their recoverable amount. Therefore a change in the Group’s forecast estimate of sales price or build cost could have a material impact on the carrying value of inventories in the Group’s financial statements.
The Property division comprises the Group’s land held for commercial development of £3.0m (2017: £3.2m) and mixed use commercial and residential development work in progress of £41.7m (2017: £55.0m) where building has commenced.
In particular, we focused our work on testing the recoverable amount of work in progress in commercial and residential developments as this could have a material impact on the carrying value of inventories held in the Group’s financial statements.
We reviewed the property-specific development appraisals supporting the carrying values and challenged the key assumptions underlying these appraisals as follows:
Residential › We obtained management’s expected build cost per square
foot and compared it to the build costs for similar units on other sites and where there were differences, validated explanations against third-party confirmations including quantity surveyor cost estimates, correspondence with suppliers or comparable properties on other sites.
› We challenged management on their intention to develop these sites.
› We challenged management’s forecast sales prices by comparing them to supporting third-party evidence from management’s external sales agents and list prices of comparable assets as published by estate agents and used our own internal valuation experts to assess the reasonableness of price assumptions.
› Where management has relied on experts, we ensured that the third parties were suitably qualified, independent and objective professionals.
Property › We reconciled the development appraisals to the WIP summary;
› We interviewed the Development Manager responsible for a sample of sites to understand the status of the development and challenged the key judgements and inputs.
› We obtained, where applicable, third-party independent comparable evidence to support the rental and yield rates adopted in the appraisal and used our own internal valuation experts to assess the reasonableness of these assumptions.
› We obtained (where applicable) independent construction quotes from tender documents, surveyor reports or similar.
› We obtained confirmation from external sources for any other applicable items to the appraisal.
› We obtained confirmation over legal title and Planning Consent where relevant.
› Where management has relied on experts, we ensured that the third parties were suitably qualified, independent and objective professionals.
We did not encounter any issues through our audit procedures that indicated the land or properties tested were not appropriately valued.
Financial Statem
entsS
trategic Report
Governance
Kier Group plc | Report and Accounts 2018 113
Kier Group plc | Report and Accounts 2018 113
Key audit matter How our audit addressed the key audit matter Group Accounting for long-term contracts – including profit recognition, work in progress and provisioning Refer to page 79 (Risk Management and Audit Committee Report) and page 126 (accounting policy).
The Group has significant long-term contracts in both the Construction and Services divisions.
The recognition of profit on construction contracts in accordance with IAS 11 is based on the stage of completion of contract activity.
Recoverability of work in progress on long-term services contracts involves significant estimates, including an assessment of the end of life outcome of the forecast future profitability of those contracts.
Profit on contracts is a significant risk for our audit because of the judgement involved in preparing suitable estimates of the forecast costs and revenue on contracts. An error in the contract forecast could result in a material variance in the amount of profit or loss recognised to date and therefore also in the current period.
These judgements include the expected recovery of costs arising from the following: variations to the contract requested by the customer, compensation events, and claims made both by and against the Group for delays or other additional costs arising or projected to arise. The inclusion of these estimated amounts in the contract forecast at an inappropriate level could result in a material error in the level of profit or loss recognised by the Group.
› We focused our work on those contracts with the greatest estimation uncertainty over the final contract values and therefore profit outcome. These in particular included the forecast end of life positions on a number of projects which have experienced significant change and therefore cost growth.
› We challenged the judgements applied in management’s forecasts, in particular the key assumptions, which included the expected recovery of variations, claims and compensation events from clients, and estimated recoveries from subcontractors, designers, and insurers included in the forecast.
› We inspected correspondence and meeting minutes with customers concerning variations, claims and compensation events, and obtained third-party assessments of these from legal or technical experts contracted by the Group, if applicable, to assess whether this information was consistent with the estimates made.
› We discussed the status of certain claims with external solicitors and, where relevant, independent experts and assessed their objectivity and independence.
› We inspected selected signed contracts for key clauses to identify relevant contractual mechanisms such as the sharing of cost overruns or efficiencies with the customer, contractual damages and success fees and assessed whether these key clauses have been appropriately reflected in the amounts included in the forecasts.
› We inspected correspondence with insurers relating to recognised insurance claims as well as assessments of these undertaken by the insurers and Group’s legal experts, where applicable, to assess whether this information supported the position taken on the contract.
Overall based on these procedures, we are satisfied that the work in progress relating to the Group’s contracts is appropriately stated and that revenue and profits have been recorded appropriately.
In respect of long-term Environmental Services contracts;
› We challenged the assumptions in the cash flow models surrounding efficiency improvements in the cost base and projected revenues from the sale of recyclate.
We are satisfied that the assumptions are reasonable.

114 Kier Group plc | Report and Accounts 2018
Financial Statements
Independent auditor’s report to the members of Kier Group plc continued
114 Kier Group plc | Report and Accounts 2018
Key audit matter How our audit addressed the key audit matter Group Accounting for McNicholas acquisition Refer to page 79 (Risk Management and Audit Committee Report) and page 125 (accounting policy).
The Group completed the acquisition of McNicholas, the UK infrastructure services business, on 12 July 2017.
Accounting for the acquisition required a fair value exercise, including valuing separately identifiable intangible assets.
This can be a particularly subjective process, given the range of assumptions that are adopted to determine the valuations, including the applicable discount rate used in the fair value calculations. Furthermore, the Directors have exercised judgement in determining to what extent events since the acquisition represented changes to conditions that existed at the date of acquisition.
Based on an exercise performed by external valuation experts, the Directors identified £12.1m of intangibles relating to customer contracts.
In order to test the components of the acquisition, we performed the following procedures:
› Obtained technical papers prepared by management in respect of the acquisition to ensure they were consistent with the requirements of IFRS 3 and agreed the underlying inputs to relevant contracts and information;
› Assessed the fair value estimates of the assets acquired, including assessing the completeness and quantum of adjustments recorded by management;
› Examined the work performed on the purchase price allocations by management’s external experts, to ensure that the relevant intangible assets have been appropriately identified and reasonably valued supported by our internal valuation experts;
› Evaluated the competency and objectivity of management’s external valuation expert;
› Challenged the key assumptions used in the valuation model, including the discount rate; and
› Evaluated whether credits recognised subsequent to the acquisition should have instead represented adjustments to goodwill.
Based upon the above, we are satisfied with the accounting for the acquisition of McNicholas, and that the estimates involved are acceptable.
Financial Statem
entsS
trategic Report
Governance
Kier Group plc | Report and Accounts 2018 115
Kier Group plc | Report and Accounts 2018 115
How we tailored the audit scope We tailored the scope of our audit to ensure that we performed enough work to be able to give an opinion on the financial statements as a whole, taking into account the structure of the Group and the Company, the accounting processes and controls, and the industry in which they operate.
The Group’s operations and reporting process is structured around five divisions represented by Property, Residential, Construction, Services, and Corporate. All five reporting divisions are considered financially significant and were included as reporting components the Group audit. The group audit partner led UK based teams responsible for the audit of each of the five components.
The vast majority of the Group’s operations are concentrated in the UK and account for 94% of Group revenue, with the remaining 6% generated from overseas businesses. Our audit approach was designed to obtain coverage over 90% (2017: 95%) of the Group’s revenue which included UK and overseas operations. We are satisfied that we obtained appropriate audit coverage over the Group’s Income statement, Balance sheet and cash flows through our audit work on the UK and overseas operations.
During the course of the audit, we have visited five construction projects (2017: seven), a number of finance operations located across the UK and held meetings with local management.
Materiality The scope of our audit was influenced by our application of materiality. We set certain quantitative thresholds for materiality. These, together with qualitative considerations, helped us to determine the scope of our audit and the nature, timing and extent of our audit procedures on the individual financial statement line items and disclosures and in evaluating the effect of misstatements, both individually and in aggregate on the financial statements as a whole.
Based on our professional judgement, we determined materiality for the financial statements as a whole as follows:
Group financial statements Company financial statements Overall materiality £6.8 million (2017: £6.3 million). £4.9 million (2017: £4.9 million).
How we determined it 5% of profit before tax from continuing operations excluding non-underlying items.
1% of total assets limited by the allocation of component materiality.
Rationale for benchmark applied
Based on our professional judgement, we determined materiality by applying a benchmark of 5% of consolidated profit before tax excluding non-underlying items. We believe that underlying profit before tax is the most appropriate measure as it eliminates any disproportionate effect of exceptional charges and provides a consistent year-on-year basis for our work.
We believe that calculating statutory materiality based on 1% of total assets is appropriate as total assets is a typical primary measure for users of the financial statements of holding companies, and is a generally accepted auditing benchmark.
For each component in the scope of our Group audit, we allocated a materiality that is less than our overall Group materiality. The range of materiality allocated across components was between £1.9m and £5.5m. Certain components were audited to a local statutory audit materiality that was also less than our overall Group materiality.
We agreed with the Audit Committee that we would report to them misstatements identified during our audit above £0.3m (Group audit) (2017: £0.3m) and £0.3m (Company audit) (2017: £0.3m) as well as misstatements below those amounts that, in our view, warranted reporting for qualitative reasons.
Going concern In accordance with ISAs (UK) we report as follows:
Reporting obligation Outcome We are required to report if we have anything material to add or draw attention to in respect of the Directors’ statement in the financial statements about whether the Directors considered it appropriate to adopt the going concern basis of accounting in preparing the financial statements and the Directors’ identification of any material uncertainties to the Group’s and the Company’s ability to continue as a going concern over a period of at least twelve months from the date of approval of the financial statements.
We have nothing material to add or to draw attention to. However, because not all future events or conditions can be predicted, this statement is not a guarantee as to the Group’s and Company’s ability to continue as a going concern.
We are required to report if the Directors’ statement relating to Going Concern in accordance with Listing Rule 9.8.6R(3) is materially inconsistent with our knowledge obtained in the audit.
We have nothing to report.
116 Kier Group plc | Report and Accounts 2018
Financial Statements
Independent auditor’s report to the members of Kier Group plc continued
116 Kier Group plc | Report and Accounts 2018
Reporting on other information The other information comprises all of the information in the Annual Report other than the financial statements and our auditor’s report thereon. The Directors are responsible for the other information. Our opinion on the financial statements does not cover the other information and, accordingly, we do not express an audit opinion or, except to the extent otherwise explicitly stated in this report, any form of assurance thereon.
In connection with our audit of the financial statements, our responsibility is to read the other information and, in doing so, consider whether the other information is materially inconsistent with the financial statements or our knowledge obtained in the audit, or otherwise appears to be materially misstated. If we identify an apparent material inconsistency or material misstatement, we are required to perform procedures to conclude whether there is a material misstatement of the financial statements or a material misstatement of the other information. If, based on the work we have performed, we conclude that there is a material misstatement of this other information, we are required to report that fact. We have nothing to report based on these responsibilities.
With respect to the Strategic Report, Directors’ Report and Corporate Governance Statement, we also considered whether the disclosures required by the UK Companies Act 2006 have been included.
Based on the responsibilities described above and our work undertaken in the course of the audit, the Companies Act 2006 (CA06), ISAs (UK) and the Listing Rules of the Financial Conduct Authority (FCA) require us also to report certain opinions and matters as described below (required by ISAs (UK) unless otherwise stated).
Strategic Report and Directors’ Report In our opinion, based on the work undertaken in the course of the audit, the information given in the Strategic Report and Directors’ Report for the year ended 30 June 2018 is consistent with the financial statements and has been prepared in accordance with applicable legal requirements. (CA06)
In light of the knowledge and understanding of the Group and Company and their environment obtained in the course of the audit, we did not identify any material misstatements in the Strategic Report and Directors’ Report. (CA06)
Corporate Governance Statement In our opinion, based on the work undertaken in the course of the audit, the information given in the Corporate Governance Statement (page 57) about internal controls and risk management systems in relation to financial reporting processes and about share capital structures in compliance with rules 7.2.5 and 7.2.6 of the Disclosure Guidance and Transparency Rules sourcebook of the FCA (“DTR”) is consistent with the financial statements and has been prepared in accordance with applicable legal requirements. (CA06)
In light of the knowledge and understanding of the Group and Company and their environment obtained in the course of the audit, we did not identify any material misstatements in this information (CA06).
In our opinion, based on the work undertaken in the course of the audit, the information given in the Corporate Governance Statement (page 57) with respect to the Company’s corporate governance code and practices and about its administrative, management and supervisory bodies and their committees complies with rules 7.2.2, 7.2.3 and 7.2.7 of the DTR. (CA06)
We have nothing to report arising from our responsibility to report if a Corporate Governance Statement has not been prepared by the Company. (CA06)
The Directors’ assessment of the prospects of the Group and of the principal risks that would threaten the solvency or liquidity of the Group We have nothing material to add or draw attention to regarding:
› The Directors’ confirmation on page 60 of the Annual Report that they have carried out a robust assessment of the principal risks facing the Group, including those that would threaten its business model, future performance, solvency or liquidity.
› The disclosures in the Annual Report that describe those risks and explain how they are being managed or mitigated.
› The Directors’ explanation on page 60 of the Annual Report as to how they have assessed the prospects of the Group, over what period they have done so and why they consider that period to be appropriate, and their statement as to whether they have a reasonable expectation that the Group will be able to continue in operation and meet its liabilities as they fall due over the period of their assessment, including any related disclosures drawing attention to any necessary qualifications or assumptions.
We have nothing to report having performed a review of the Directors’ statement that they have carried out a robust assessment of the principal risks facing the Group and statement in relation to the longer-term viability of the Group. Our review was substantially less in scope than an audit and only consisted of making inquiries and considering the Directors’ process supporting their statements; checking that the statements are in alignment with the relevant provisions of the UK Corporate Governance Code (the “Code”); and considering whether the statements are consistent with the knowledge and understanding of the Group and Company and their environment obtained in the course of the audit. (Listing Rules)
Other Code Provisions We have nothing to report in respect of our responsibility to report when:
› The statement given by the Directors, on page 60, that they consider the Annual Report taken as a whole to be fair, balanced and understandable, and provides the information necessary for the members to assess the Group’s and Company’s position and performance, business model and strategy is materially inconsistent with our knowledge of the Group and Company obtained in the course of performing our audit.
› The section of the Annual Report on page 73 describing the work of the Audit Committee does not appropriately address matters communicated by us to the Audit Committee.
› The Directors’ statement relating to the Company’s compliance with the Code does not properly disclose a departure from a relevant provision of the Code specified, under the Listing Rules, for review by the auditors.
Directors’ Remuneration In our opinion, the part of the Directors’ Remuneration Report to be audited has been properly prepared in accordance with the Companies Act 2006. (CA06)
Financial Statem
entsS
trategic Report
Governance
Kier Group plc | Report and Accounts 2018 117
Kier Group plc | Report and Accounts 2018 117
Responsibilities for the financial statements and the audit Responsibilities of the Directors for the financial statements As explained more fully in the Statement of Directors’ responsibilities set out on page 110, the Directors are responsible for the preparation of the financial statements in accordance with the applicable framework and for being satisfied that they give a true and fair view. The Directors are also responsible for such internal control as they determine is necessary to enable the preparation of financial statements that are free from material misstatement, whether due to fraud or error.
In preparing the financial statements, the Directors are responsible for assessing the Group’s and the Company’s ability to continue as a going concern, disclosing as applicable, matters related to going concern and using the going concern basis of accounting unless the Directors either intend to liquidate the Group or the Company or to cease operations, or have no realistic alternative but to do so.
Auditor’s responsibilities for the audit of the financial statements Our objectives are to obtain reasonable assurance about whether the financial statements as a whole are free from material misstatement, whether due to fraud or error, and to issue an auditor’s report that includes our opinion. Reasonable assurance is a high level of assurance, but is not a guarantee that an audit conducted in accordance with ISAs (UK) will always detect a material misstatement when it exists. Misstatements can arise from fraud or error and are considered material if, individually or in the aggregate, they could reasonably be expected to influence the economic decisions of users taken on the basis of these financial statements.
A further description of our responsibilities for the audit of the financial statements is located on the FRC’s website at: www.frc.org.uk/auditorsresponsibilities. This description forms part of our auditor’s report.
Use of this report This report, including the opinions, has been prepared for and only for the Company’s members as a body in accordance with Chapter 3 of Part 16 of the Companies Act 2006 and for no other purpose. We do not, in giving these opinions, accept or assume responsibility for any other purpose or to any other person to whom this report is shown or into whose hands it may come save where expressly agreed by our prior consent in writing.
Other required reporting Companies Act 2006 exception reporting Under the Companies Act 2006 we are required to report to you if, in our opinion:
› we have not received all the information and explanations we require for our audit; or
› adequate accounting records have not been kept by the Company, or returns adequate for our audit have not been received from branches not visited by us; or
› certain disclosures of Directors’ remuneration specified by law are not made; or
› the Company financial statements and the part of the Directors’ Remuneration Report to be audited are not in agreement with the accounting records and returns.
We have no exceptions to report arising from this responsibility.
Appointment Following the recommendation of the Audit Committee, we were appointed by the members on 13 November 2014 to audit the financial statements for the year ended 30 June 2015 and subsequent financial periods. The period of total uninterrupted engagement is four years, covering the years ended 30 June 2015 to 30 June 2018.
Jonathan Hook (Senior Statutory Auditor) for and on behalf of PricewaterhouseCoopers LLP Chartered Accountants and Statutory Auditors
London
19 September 2018
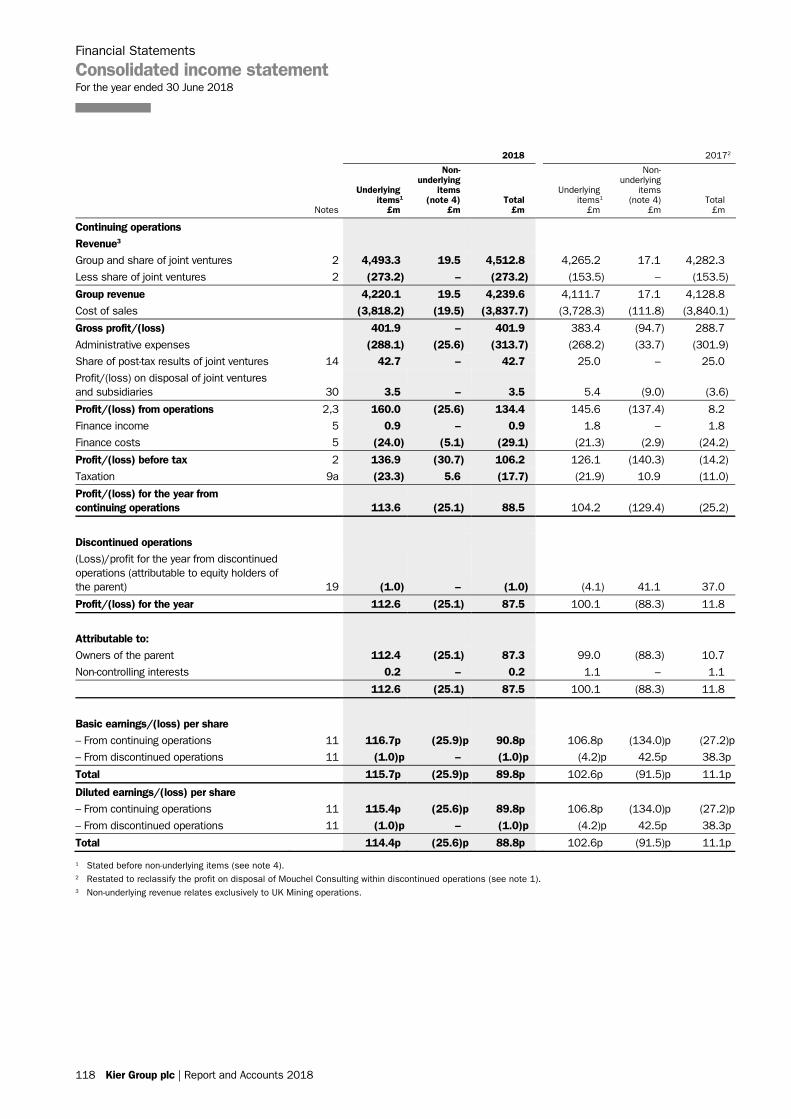
Financial Statements
Consolidated income statement For the year ended 30 June 2018
118 Kier Group plc | Report and Accounts 2018
2018 20172
Notes
Underlying items1
£m
Non- underlying
items (note 4)
£m Total
£m
Underlying items1
£m
Non- underlying
items (note 4)
£m Total £m
Continuing operations
Revenue3
Group and share of joint ventures 2 4,493.3 19.5 4,512.8 4,265.2 17.1 4,282.3
Less share of joint ventures 2 (273.2) – (273.2) (153.5) – (153.5)
Group revenue 4,220.1 19.5 4,239.6 4,111.7 17.1 4,128.8
Cost of sales (3,818.2) (19.5) (3,837.7) (3,728.3) (111.8) (3,840.1)
Gross profit/(loss) 401.9 – 401.9 383.4 (94.7) 288.7
Administrative expenses (288.1) (25.6) (313.7) (268.2) (33.7) (301.9)
Share of post-tax results of joint ventures 14 42.7 – 42.7 25.0 – 25.0
Profit/(loss) on disposal of joint ventures and subsidiaries 30 3.5 – 3.5 5.4 (9.0) (3.6)
Profit/(loss) from operations 2,3 160.0 (25.6) 134.4 145.6 (137.4) 8.2
Finance income 5 0.9 – 0.9 1.8 – 1.8
Finance costs 5 (24.0) (5.1) (29.1) (21.3) (2.9) (24.2)
Profit/(loss) before tax 2 136.9 (30.7) 106.2 126.1 (140.3) (14.2)
Taxation 9a (23.3) 5.6 (17.7) (21.9) 10.9 (11.0)
Profit/(loss) for the year from continuing operations 113.6 (25.1) 88.5 104.2 (129.4) (25.2)
Discontinued operations
(Loss)/profit for the year from discontinued operations (attributable to equity holders of the parent) 19 (1.0) – (1.0) (4.1) 41.1 37.0
Profit/(loss) for the year 112.6 (25.1) 87.5 100.1 (88.3) 11.8
Attributable to:
Owners of the parent 112.4 (25.1) 87.3 99.0 (88.3) 10.7
Non-controlling interests 0.2 – 0.2 1.1 – 1.1
112.6 (25.1) 87.5 100.1 (88.3) 11.8
Basic earnings/(loss) per share
– From continuing operations 11 116.7p (25.9)p 90.8p 106.8p (134.0)p (27.2)p
– From discontinued operations 11 (1.0)p – (1.0)p (4.2)p 42.5p 38.3p
Total 115.7p (25.9)p 89.8p 102.6p (91.5)p 11.1p
Diluted earnings/(loss) per share
– From continuing operations 11 115.4p (25.6)p 89.8p 106.8p (134.0)p (27.2)p
– From discontinued operations 11 (1.0)p – (1.0)p (4.2)p 42.5p 38.3p
Total 114.4p (25.6)p 88.8p 102.6p (91.5)p 11.1p
1 Stated before non-underlying items (see note 4). 2 Restated to reclassify the profit on disposal of Mouchel Consulting within discontinued operations (see note 1). 3 Non-underlying revenue relates exclusively to UK Mining operations.
118 Kier Group plc | Report and Accounts 2018
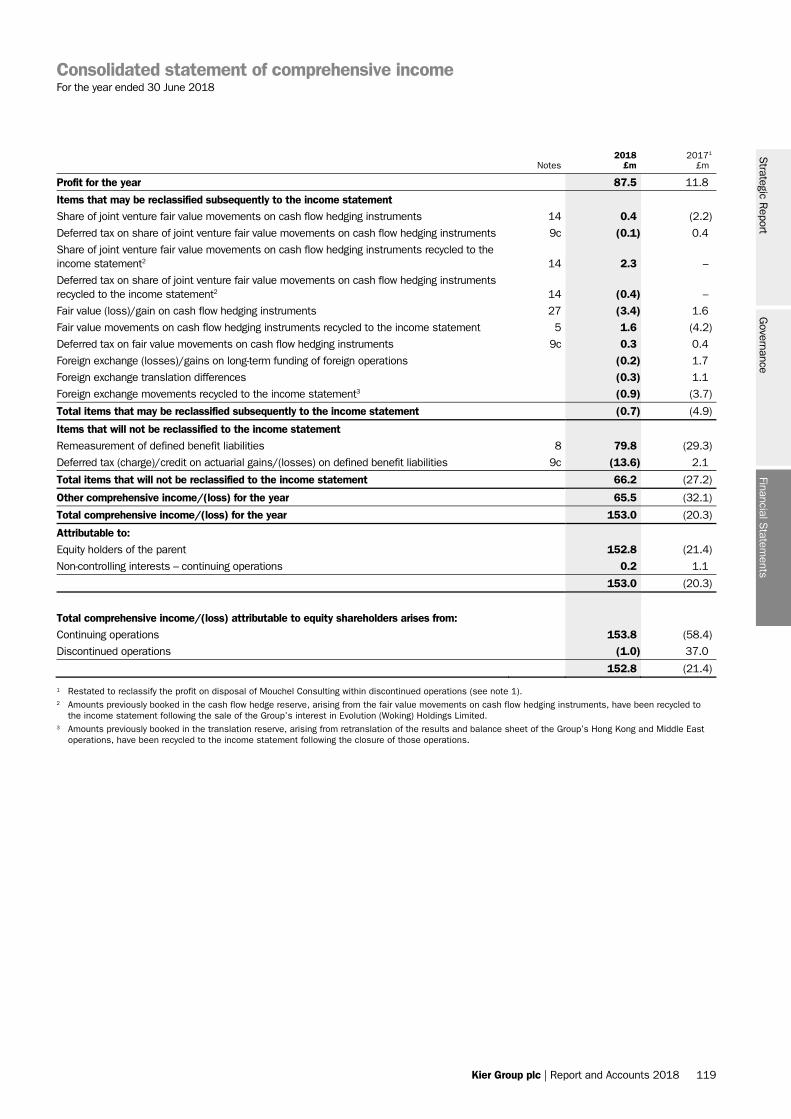
Consolidated statement of comprehensive income For the year ended 30 June 2018
Kier Group plc | Report and Accounts 2018 119
Notes 2018
£m 20171
£m
Profit for the year 87.5 11.8
Items that may be reclassified subsequently to the income statement
Share of joint venture fair value movements on cash flow hedging instruments 14 0.4 (2.2)
Deferred tax on share of joint venture fair value movements on cash flow hedging instruments 9c (0.1) 0.4
Share of joint venture fair value movements on cash flow hedging instruments recycled to the income statement2 14 2.3 –
Deferred tax on share of joint venture fair value movements on cash flow hedging instruments recycled to the income statement2 14 (0.4) –
Fair value (loss)/gain on cash flow hedging instruments 27 (3.4) 1.6
Fair value movements on cash flow hedging instruments recycled to the income statement 5 1.6 (4.2)
Deferred tax on fair value movements on cash flow hedging instruments 9c 0.3 0.4
Foreign exchange (losses)/gains on long-term funding of foreign operations (0.2) 1.7
Foreign exchange translation differences (0.3) 1.1
Foreign exchange movements recycled to the income statement3 (0.9) (3.7)
Total items that may be reclassified subsequently to the income statement (0.7) (4.9)
Items that will not be reclassified to the income statement
Remeasurement of defined benefit liabilities 8 79.8 (29.3)
Deferred tax (charge)/credit on actuarial gains/(losses) on defined benefit liabilities 9c (13.6) 2.1
Total items that will not be reclassified to the income statement 66.2 (27.2)
Other comprehensive income/(loss) for the year 65.5 (32.1)
Total comprehensive income/(loss) for the year 153.0 (20.3)
Attributable to:
Equity holders of the parent 152.8 (21.4)
Non-controlling interests – continuing operations 0.2 1.1
153.0 (20.3)
Total comprehensive income/(loss) attributable to equity shareholders arises from:
Continuing operations 153.8 (58.4)
Discontinued operations (1.0) 37.0
152.8 (21.4)
1 Restated to reclassify the profit on disposal of Mouchel Consulting within discontinued operations (see note 1). 2 Amounts previously booked in the cash flow hedge reserve, arising from the fair value movements on cash flow hedging instruments, have been recycled to
the income statement following the sale of the Group’s interest in Evolution (Woking) Holdings Limited. 3 Amounts previously booked in the translation reserve, arising from retranslation of the results and balance sheet of the Group’s Hong Kong and Middle East
operations, have been recycled to the income statement following the closure of those operations.
Financial Statem
entsS
trategic Report
Governance
Kier Group plc | Report and Accounts 2018 119
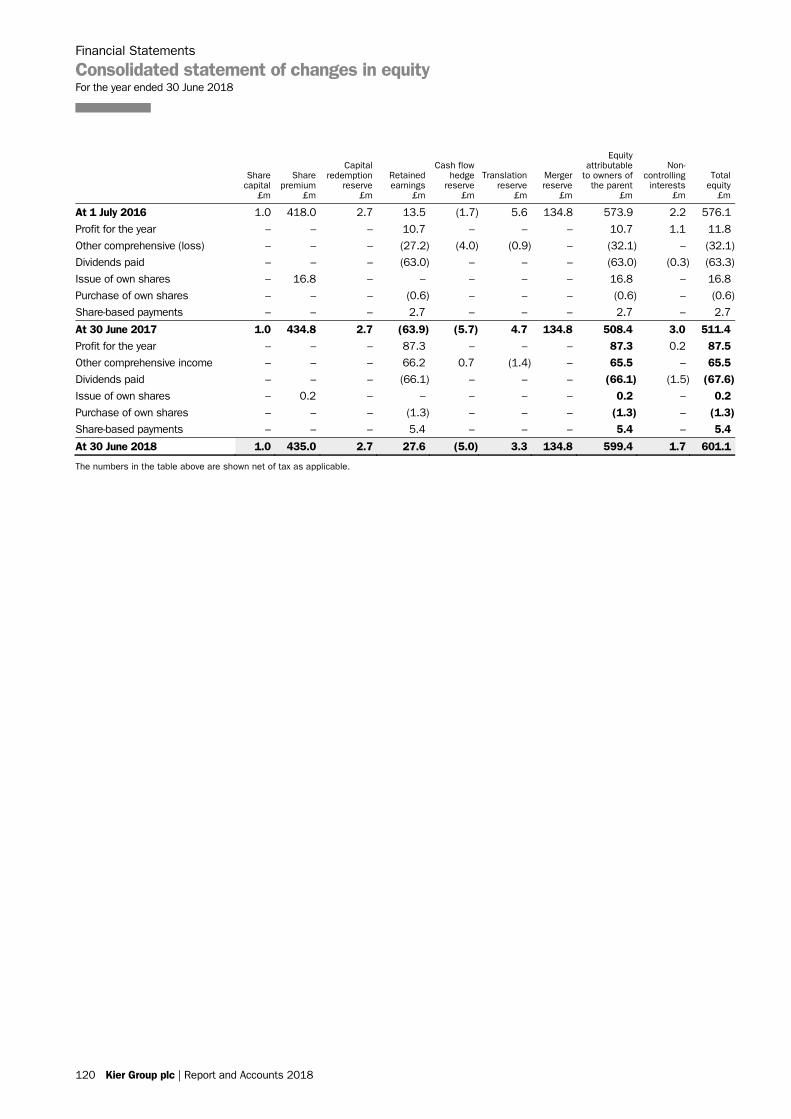
Financial Statements
Consolidated statement of changes in equity For the year ended 30 June 2018
120 Kier Group plc | Report and Accounts 2018
Share capital
£m
Share premium
£m
Capital redemption
reserve £m
Retained earnings
£m
Cash flow hedge
reserve £m
Translation reserve
£m
Merger reserve
£m
Equity attributable
to owners of the parent
£m
Non- controlling
interests £m
Total equity
£m
At 1 July 2016 1.0 418.0 2.7 13.5 (1.7) 5.6 134.8 573.9 2.2 576.1
Profit for the year – – – 10.7 – – – 10.7 1.1 11.8
Other comprehensive (loss) – – – (27.2) (4.0) (0.9) – (32.1) – (32.1)
Dividends paid – – – (63.0) – – – (63.0) (0.3) (63.3)
Issue of own shares – 16.8 – – – – – 16.8 – 16.8
Purchase of own shares – – – (0.6) – – – (0.6) – (0.6)
Share-based payments – – – 2.7 – – – 2.7 – 2.7
At 30 June 2017 1.0 434.8 2.7 (63.9) (5.7) 4.7 134.8 508.4 3.0 511.4 Profit for the year – – – 87.3 – – – 87.3 0.2 87.5 Other comprehensive income – – – 66.2 0.7 (1.4) – 65.5 – 65.5 Dividends paid – – – (66.1) – – – (66.1) (1.5) (67.6) Issue of own shares – 0.2 – – – – – 0.2 – 0.2 Purchase of own shares – – – (1.3) – – – (1.3) – (1.3) Share-based payments – – – 5.4 – – – 5.4 – 5.4
At 30 June 2018 1.0 435.0 2.7 27.6 (5.0) 3.3 134.8 599.4 1.7 601.1
The numbers in the table above are shown net of tax as applicable.
120 Kier Group plc | Report and Accounts 2018
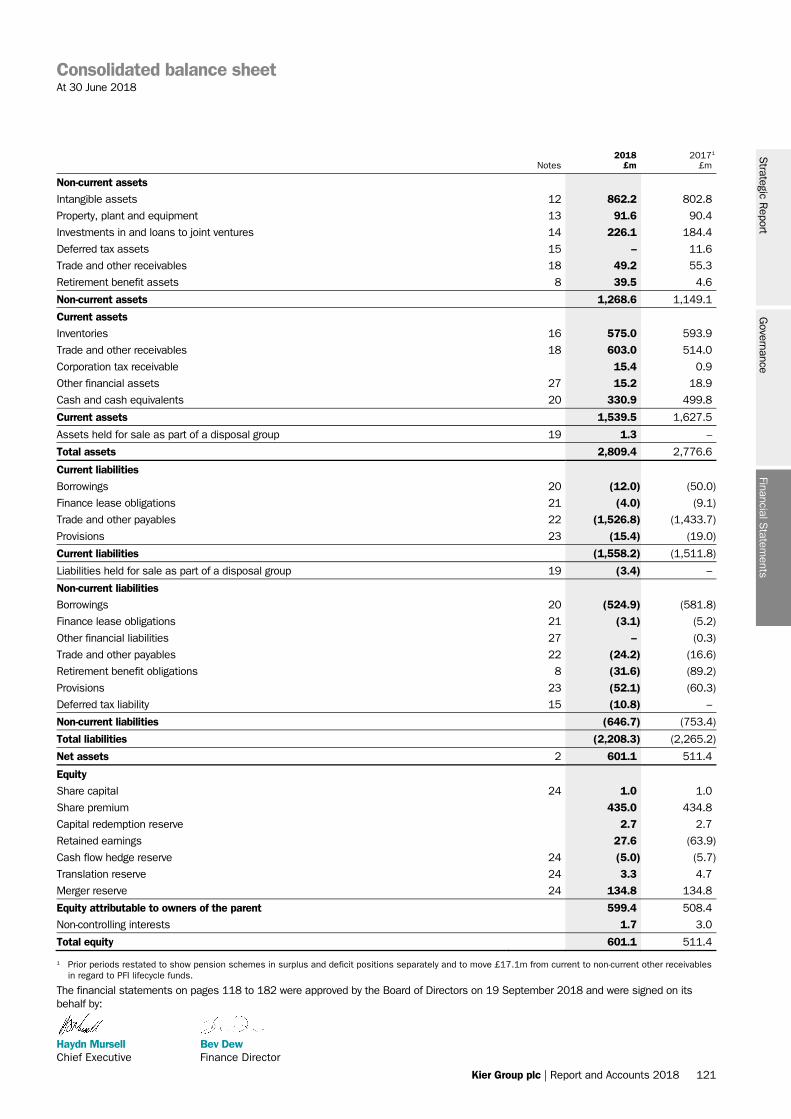
Consolidated balance sheet At 30 June 2018
Kier Group plc | Report and Accounts 2018 121
Notes 2018
£m 20171
£m
Non-current assets
Intangible assets 12 862.2 802.8
Property, plant and equipment 13 91.6 90.4
Investments in and loans to joint ventures 14 226.1 184.4
Deferred tax assets 15 – 11.6
Trade and other receivables 18 49.2 55.3
Retirement benefit assets 8 39.5 4.6
Non-current assets 1,268.6 1,149.1
Current assets
Inventories 16 575.0 593.9
Trade and other receivables 18 603.0 514.0
Corporation tax receivable 15.4 0.9
Other financial assets 27 15.2 18.9
Cash and cash equivalents 20 330.9 499.8
Current assets 1,539.5 1,627.5
Assets held for sale as part of a disposal group 19 1.3 –
Total assets 2,809.4 2,776.6
Current liabilities
Borrowings 20 (12.0) (50.0)
Finance lease obligations 21 (4.0) (9.1)
Trade and other payables 22 (1,526.8) (1,433.7)
Provisions 23 (15.4) (19.0)
Current liabilities (1,558.2) (1,511.8)
Liabilities held for sale as part of a disposal group 19 (3.4) –
Non-current liabilities
Borrowings 20 (524.9) (581.8)
Finance lease obligations 21 (3.1) (5.2)
Other financial liabilities 27 – (0.3)
Trade and other payables 22 (24.2) (16.6)
Retirement benefit obligations 8 (31.6) (89.2)
Provisions 23 (52.1) (60.3)
Deferred tax liability 15 (10.8) –
Non-current liabilities (646.7) (753.4)
Total liabilities (2,208.3) (2,265.2)
Net assets 2 601.1 511.4
Equity
Share capital 24 1.0 1.0
Share premium 435.0 434.8
Capital redemption reserve 2.7 2.7
Retained earnings 27.6 (63.9)
Cash flow hedge reserve 24 (5.0) (5.7)
Translation reserve 24 3.3 4.7
Merger reserve 24 134.8 134.8
Equity attributable to owners of the parent 599.4 508.4
Non-controlling interests 1.7 3.0
Total equity 601.1 511.4
1 Prior periods restated to show pension schemes in surplus and deficit positions separately and to move £17.1m from current to non-current other receivables in regard to PFI lifecycle funds.
The financial statements on pages 118 to 182 were approved by the Board of Directors on 19 September 2018 and were signed on its behalf by:
Haydn Mursell Bev Dew Chief Executive Finance Director
Financial Statem
entsS
trategic Report
Governance
Kier Group plc | Report and Accounts 2018 121
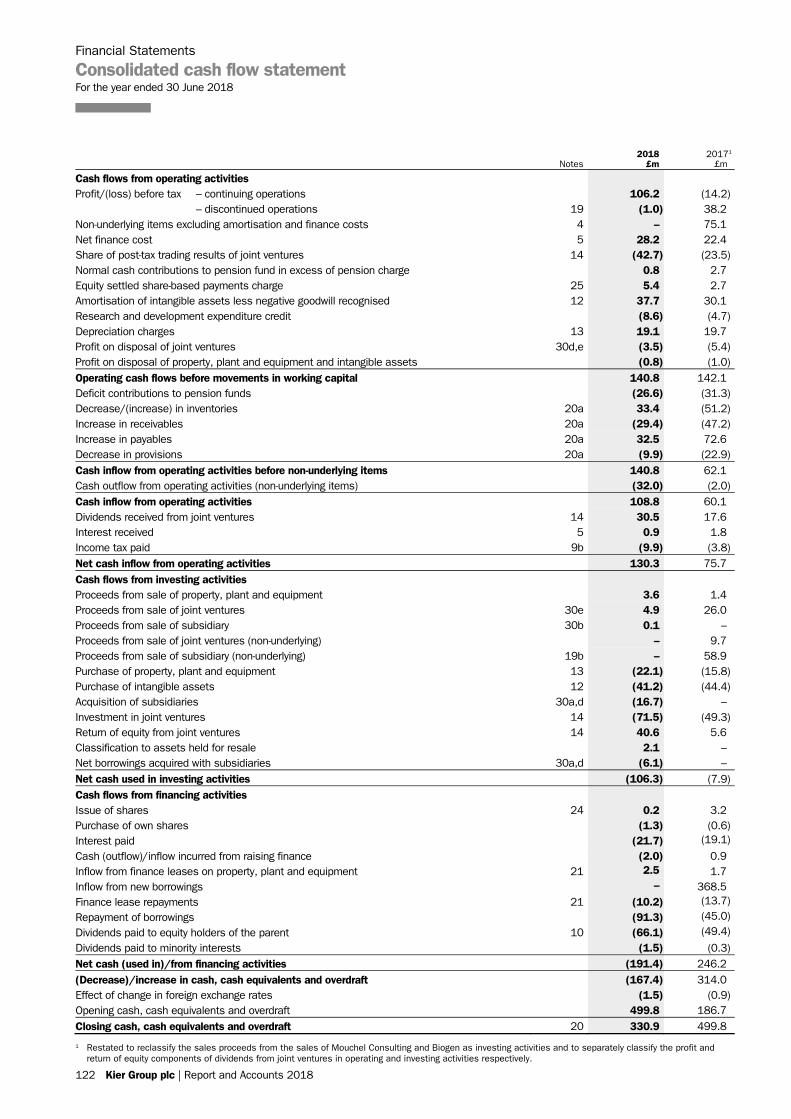
Financial Statements
Consolidated cash flow statement For the year ended 30 June 2018
122 Kier Group plc | Report and Accounts 2018
1 Restated to reclassify the sales proceeds from the sales of Mouchel Consulting and Biogen as investing activities and to separately classify the profit and return of equity components of dividends from joint ventures in operating and investing activities respectively.
Notes 2018
£m 20171
£m
Cash flows from operating activities Profit/(loss) before tax – continuing operations 106.2 (14.2) – discontinued operations 19 (1.0) 38.2 Non-underlying items excluding amortisation and finance costs 4 – 75.1 Net finance cost 5 28.2 22.4 Share of post-tax trading results of joint ventures 14 (42.7) (23.5) Normal cash contributions to pension fund in excess of pension charge 0.8 2.7 Equity settled share-based payments charge 25 5.4 2.7 Amortisation of intangible assets less negative goodwill recognised 12 37.7 30.1 Research and development expenditure credit (8.6) (4.7) Depreciation charges 13 19.1 19.7 Profit on disposal of joint ventures 30d,e (3.5) (5.4) Profit on disposal of property, plant and equipment and intangible assets (0.8) (1.0) Operating cash flows before movements in working capital 140.8 142.1 Deficit contributions to pension funds (26.6) (31.3) Decrease/(increase) in inventories 20a 33.4 (51.2) Increase in receivables 20a (29.4) (47.2) Increase in payables 20a 32.5 72.6 Decrease in provisions 20a (9.9) (22.9) Cash inflow from operating activities before non-underlying items 140.8 62.1 Cash outflow from operating activities (non-underlying items) (32.0) (2.0) Cash inflow from operating activities 108.8 60.1 Dividends received from joint ventures 14 30.5 17.6 Interest received 5 0.9 1.8 Income tax paid 9b (9.9) (3.8) Net cash inflow from operating activities 130.3 75.7 Cash flows from investing activities Proceeds from sale of property, plant and equipment 3.6 1.4 Proceeds from sale of joint ventures 30e 4.9 26.0 Proceeds from sale of subsidiary 30b 0.1 – Proceeds from sale of joint ventures (non-underlying) – 9.7 Proceeds from sale of subsidiary (non-underlying) 19b – 58.9 Purchase of property, plant and equipment 13 (22.1) (15.8) Purchase of intangible assets 12 (41.2) (44.4) Acquisition of subsidiaries 30a,d (16.7) – Investment in joint ventures 14 (71.5) (49.3) Return of equity from joint ventures 14 40.6 5.6 Classification to assets held for resale 2.1 – Net borrowings acquired with subsidiaries 30a,d (6.1) – Net cash used in investing activities (106.3) (7.9) Cash flows from financing activities Issue of shares 24 0.2 3.2 Purchase of own shares (1.3) (0.6) Interest paid (21.7) (19.1)
Cash (outflow)/inflow incurred from raising finance (2.0) 0.9 Inflow from finance leases on property, plant and equipment 21 2.5 1.7 Inflow from new borrowings – 368.5 Finance lease repayments 21 (10.2) (13.7)
Repayment of borrowings (91.3) (45.0)
Dividends paid to equity holders of the parent 10 (66.1) (49.4)
Dividends paid to minority interests (1.5) (0.3) Net cash (used in)/from financing activities (191.4) 246.2 (Decrease)/increase in cash, cash equivalents and overdraft (167.4) 314.0 Effect of change in foreign exchange rates (1.5) (0.9) Opening cash, cash equivalents and overdraft 499.8 186.7 Closing cash, cash equivalents and overdraft 20 330.9 499.8
122 Kier Group plc | Report and Accounts 2018
Notes to the consolidated financial statements For the year ended 30 June 2018
123 Kier Group plc | Report and Accounts 2017
1 Significant accounting policies Kier Group plc (the Company) is a public limited company domiciled in the United Kingdom (UK), incorporated in England and Wales and listed on the London Stock Exchange. The Company’s registered number is 2708030. The consolidated financial statements of the Company for the year ended 30 June 2018 comprise the Company and its subsidiaries (together referred to as the Group) and the Group’s interest in joint arrangements.
The consolidated financial statements were approved by the Directors on 19 September 2018.
Statement of compliance The Group’s consolidated financial statements have been prepared and approved by the Directors in accordance with International Financial Reporting Standards as adopted by the European Union (IFRS) and therefore comply with Article 4 of the EU IAS Regulation and with those parts of the Companies Act 2006 that are applicable to companies reporting under IFRS. The Group has applied all accounting standards issued by the International Accounting Standards Board (‘IASB’) and interpretations issued by the IFRS Interpretations Committee as adopted by the European Union and effective for accounting periods beginning on 1 July 2017.
The Company has elected to prepare its parent company financial statements in accordance with the FRS 101 ‘Reduced Disclosure Framework’. These are presented on pages 183 to 188.
Basis of preparation The Group has considerable financial resources, long-term contracts and a diverse range of customers and suppliers across its business activities.
After making enquiries, the Directors have a reasonable expectation that the Company and the Group have adequate resources to continue in operational existence for the foreseeable future. Accordingly, the Directors continue to adopt the going concern basis in preparing the Group’s financial statements.
The financial statements are presented in pounds sterling. They have been prepared on the historical cost basis except for derivative financial instruments which are stated at their fair value and the IFRS 2 charge which is based on fair value movements of the Group’s share price.
The following amendments to standards are effective for the financial year ended 30 June 2018 onwards:
› Amendments to IAS 7 Statement of Cash Flows
› Amendments to IAS 12 Income Taxes
› Annual Improvements to 2014-2016 cycle – IFRS 12 Disclosure of Interests in Other Entities
None of the above amendments to standards has had a material effect on the Group’s financial statements.
The following new standards and amendments to standards have been issued but were not yet effective and therefore have not been applied in these financial statements:
IFRS 2 (amendments) Share-Based Payments
IFRS 4 (amendments) Insurance Contracts
IFRS 9 Financial Instruments
IFRS 15 Revenue from Contracts with Customers
IFRS 16 Leases
IFRS 17 Insurance Contracts
IAS 19 (amendments) Employee Benefits
IAS 28 (amendments) Investments in Associates
IAS 40 (amendments) Investment Property
IFRIC 22 Foreign Currency Transaction and Advanced Consideration
IFRIC 23 Uncertainty over Income Tax Treatments
Annual Improvements 2014-2016 cycle
Annual Improvements 2015-2017 cycle
Other than the impact of IFRS 9, IFRS 15 and IFRS 16 as noted below, no significant net impact from the adoption of these new standards is expected. The Group has chosen not to adopt any of the above standards and interpretations earlier than required.
The Group is close to concluding its project to assess the impact of IFRS 15 ‘Revenue from Contracts with Customers’ and IFRS 9 ‘Financial Instruments’, both of which the Group will adopt in the year ending 30 June 2019.
Impact of IFRS 15 Supported by its external advisers, the Group has conducted a review by contract type for each of its businesses. This has highlighted that the key areas impacted are in the Construction business, where a detailed contract-by-contract assessment has been carried out. Following this review, the Group has assessed that there is no material impact in our Property, Residential and Services businesses.
It is important to note that whilst the replacement of IAS 11 and IAS 18 by IFRS 15 can impact on the timing of revenue and profit recognition of a long-term contract within an accounting period, it does not change the overall revenue, profit or cash generated by the contract. There may however be a timing impact in terms of profit recognition on transition to IFRS 15 as individual contracts are moved from the measurement basis of one standard to another.
The Group has elected to adopt the cumulative catch-up method of transition, wherein the results of the prior year are not restated but the initial impact of adopting the standard is taken to opening reserves. The main areas where the new standard will give rise to an adjustment on adoption occur in our Construction business and are as follows:
› Move to cost as a measure of progress: previously the Group used an output measure of progress; however, we will move to an input measure of progress as this better reflects the pattern of transfer of control to the customer;
› Derecognition of certain variable revenue items in determining forecast project outcomes: IFRS 15 introduces a requirement for recognition of variable consideration (for example pain/gain shares and milestone payments) that is “highly probable not to reverse”. We have therefore reviewed our construction contracts and concluded that recognition of some of these items will occur later in the projects; and
› Third-party claims: IAS 11 ‘Construction Contracts’ permitted the recognition of expected cost reimbursements resulting from claims against a third party rather than the customer. Certain third-party claims (such as insurance recoveries) are not covered by similar provisions in IFRS 15, which only deals with claims against the customer. Following the withdrawal of IAS 11, in order to recognise an asset for such a third-party claim we will need to comply with the requirements of IAS 37 ‘Provisions, Contingent Liabilities and Contingent Assets’. The requirements of IAS 37 are considerably more stringent than IAS 11, requiring recovery to be virtually certain before an asset can be recognised. Whilst we still expect to recover the amounts claimed from third parties that we have recognised at the balance sheet date, we do not believe that certain claims meet the virtually certain criteria of IAS 37. These claims will therefore need to be de-recognised and accounted for in future periods, when the uncertainty over their recovery has been removed.
Financial Statem
entsS
trategic Report
Governance
Kier Group plc | Report and Accounts 2018 123
Financial Statements
Notes to the consolidated financial statements continued For the year ended 30 June 2018
124 Kier Group plc | Report and Accounts 2018
1 Significant accounting policies continued While our work over the impact of IFRS 15 is ongoing, the combined impact of the above adjustments is expected to be a charge to opening reserves at 1 July 2018 of approximately £20m.
Impact of IFRS 9 IFRS 9 primarily impacts financial institutions, however, there are some changes to adopt for the Group. The main areas of the new standard and their expected impact are set out below:
› Hedge accounting – IFRS 9 provides more flexibility on hedge accounting than IAS 39, potentially allowing more derivatives to meet the requirements for hedge accounting. As the Group’s key derivatives met IAS 39’s hedging criteria, the new standard is not expected to result in major differences to the Group’s hedge accounting going forward;
› Impairment of financial assets – An “expect credit losses model” has been introduced whereby expected losses as well as incurred losses are provided for. As the majority of the Group’s receivables are with utility companies, transport agencies, government agencies and local authorities, it has had low incidence of bad debt and consequently currently maintains a modest bad debt provision. Adoption of this model is not expected to have a material impact on the Group; and
› Classification and measurement of financial assets – Under IAS 39 the accounting treatment of facility fees depended upon the distinction between whether the facility re-negotiation was treated as an extinguishment of the original liability and recognition of a new financial liability or whether it was treated as a modification of an existing liability. However, under IFRS 9, the treatment of the gain or loss on extinguishment or modification is the same. This will impact the Group’s previous treatment of the costs of refinancing its borrowing facilities.
The Group’s work is ongoing in this area, however our current view is that the net impact of the above is not expected to be material.
Impact of IFRS 16 The Group continues to work on assessing the impact of IFRS 16 ‘Leases’. As previously disclosed, the main impact of IFRS 16 will be to move the Group’s larger, longer-term operating leases, primarily in respect of property, onto the balance sheet, with a consequential increase in non-current assets and finance lease obligations. Operating lease charges included in administrative expenses will be replaced by depreciation and interest costs.
The Group will not be adopting IFRS 16 early and therefore the first set of accounts prepared under this standard will be those for the year ended 30 June 2020.
2017 restatement Following the FRC’s review of the Company’s 2017 Annual Report, the 2017 income statement and cash flow statement have been restated as follows:
› In accordance with IFRS 5 Non-Current Assets Held for Sale and Discontinued Operations, paragraph 33, the comparative figures have been restated to show the profit on sale of Mouchel Consulting (£40.0m) and associated tax credit (£1.1m) within non-underlying discontinued, rather than non-underlying continuing operations. In addition, the Directors have concluded that the operating results of Biogen should have been classified as continuing in the comparative figures. The prior year figures have not been restated to reflect this on the grounds of materiality.
› In accordance with IAS 7 Statement of Cash Flows, paragraph 16 (d), the comparative cash flow has been restated to show the net proceeds arising from the sale of Mouchel Consulting (£58.9m) and Biogen (£9.7m) as non-underlying investing activities rather than non-underlying operating activities. Whilst there is no impact on total basic earnings per share, the comparative basic earnings per share from continuing operations is decreased by 42.5p and basic earnings per share from discontinued operations is increased accordingly. The corresponding impacts on diluted earnings per share are a 0.1p increase in total diluted earnings per share; a 42.4p decrease in diluted earnings per share from continuing operations; and a 42.5p increase in diluted earnings per share from discontinued operations. The comparative information in Notes 4, 11 and 19 have also been restated accordingly.
In addition, as the Group’s use of joint ventures has increased, the Directors have reviewed the policy covering treatment of dividends from joint ventures. The Directors concluded that presenting the profit and return of equity components of these dividends, into operating and investing cashflows respectively, better enabled the reader to understand the underlying transactions. Consequently, £5.6m has been reclassified in the prior year cashflow statement from dividends received from joint ventures to return of equity in joint ventures.
The following accounting policies have been applied consistently in dealing with items which are considered material in relation to the Group’s financial statements.
Basis of consolidation (a) Subsidiaries The consolidated financial statements comprise the financial statements of the Company and subsidiaries controlled by the Company drawn up to 30 June 2018. Control exists when the Group has direct or indirect power to govern the financial and operating policies of an entity so as to obtain economic benefits from its activities. Subsidiaries are included in the consolidated financial statements from the date that control transfers to the Group until the date that control ceases.
Business combinations are accounted for using the acquisition method as at the acquisition date, which is the date on which control is transferred to the Group. Control is the power to govern the financial and operating policies of an entity so as to obtain benefits from its activities. In assessing control, the Group takes into consideration potential voting rights that currently are exercisable.
If a business combination is achieved in stages, the acquisition date carrying value of the acquirer’s previously held equity interest in the acquiree is remeasured to fair value at the acquisition date; any gains or losses arising from such remeasurements are recognised in profit or loss.
The Group measures goodwill at the acquisition date as:
› The fair value of the consideration transferred; plus
› The recognised amount of any non-controlling interests in the acquiree; plus
› If the business combination is achieved in stages, the fair value of the existing equity interest in the acquiree; less
› The net recognised amount (generally fair value) of the identifiable assets acquired and liabilities assumed.
When the result is negative, a ‘bargain purchase’ gain is recognised immediately in the income statement.
Provisional fair values allocated at a reporting date are finalised within 12 months of the acquisition date.
124 Kier Group plc | Report and Accounts 2018
125 Kier Group plc | Report and Accounts 2017
The consideration transferred does not include amounts related to the settlement of pre-existing relationships. Such amounts are generally recognised in the income statement. Costs related to the acquisition, other than those associated with the issue of debt or equity securities, that the Group incurs in connection with a business combination are expensed as incurred. Any contingent consideration payable is recognised at fair value at the acquisition date. Subsequent changes to the fair value of the contingent consideration are recognised in the income statement unless the contingent consideration is classified as equity, in which case settlement is accounted for within reserves.
Accounting policies of subsidiaries are adjusted where necessary to ensure consistency with those used by the Group. All intra-Group transactions, balances, income and expenses are eliminated on consolidation.
(b) Joint arrangements A joint arrangement is a contractual arrangement whereby the Group undertakes an economic activity that is subject to joint control with third parties.
The Group’s interests in joint ventures are accounted for using the equity method. Under this method the Group’s share of the profits less losses of joint ventures is included in the consolidated income statement and its interest in their net assets is included in investments in the consolidated balance sheet. Where the share of losses exceeds the Group’s interest in the entity and there is no obligation to fund these losses the carrying amount is reduced to nil, following which no further losses are recognised. Interest in the entity is the carrying amount of the investment together with any long-term interests that, in substance, form part of the net investment in the entity.
From time to time the Group undertakes contracts jointly with other parties. These fall under the category of joint operations as defined by IFRS 11. In accordance with IFRS 11, the Group accounts for its own share of sales, profits, assets, liabilities and cash flows measured according to the terms of the agreements.
Goodwill and other intangible assets Goodwill arising on consolidation represents the excess of the consideration over the Group’s interest in the fair value of the identifiable assets and liabilities of a subsidiary.
Goodwill is recognised as an asset and reviewed for impairment at least annually. Any impairment is recognised immediately in the income statement and is not subsequently reversed. Negative goodwill is recognised in the income statement immediately. On disposal of a subsidiary or jointly controlled entity, the attributable carrying amount of goodwill is included in the determination of the profit or loss on disposal.
Other intangible assets which comprise contract rights and computer software are stated at cost less accumulated amortisation and impairment losses. Amortisation is charged to administrative expenses in the income statement on a straight-line basis over the expected useful lives of the assets, which are principally as follows:
Contract rights Over the remaining contract life
Computer software 3–7 years
Internally generated intangible assets developed by the Group are recognised only if all of the following conditions are met:
› An asset is created that can be identified;
› It is probable that the asset created will generate future economic benefits; and
› The development cost of the asset can be measured reliably.
Other research expenditure is written off in the period in which it is incurred.
Non-underlying items Certain items are presented separately in the consolidated income statement as non-underlying items where, in the judgement of the Directors, they need to be disclosed separately by virtue of their nature, size or incidence in order to obtain a clear and consistent presentation of the Group’s underlying business performance.
Examples of material items which may give rise to disclosure as non-underlying items include gains or losses on the disposal of businesses, gains or losses on closure of businesses, costs of restructuring and reorganisation of existing businesses, certain material and one-off provisions, integration of newly acquired businesses, asset impairments and acquisition transaction costs and unwind of discounts.
Amortisation of acquired intangible assets and certain financing costs are also treated as non-underlying items so that the underlying profit of the Group can be measured on a comparable basis from period to period.
These are examples, and from time to time it may be appropriate to disclose further items as non-underlying in order to highlight the underlying performance of the Group.
Underlying operating profit is one of the key measures used by the Board to monitor the Group’s performance.
Revenue and profit recognition Revenue comprises the fair value of the consideration received or receivable, net of value added tax, rebates and discounts and after eliminating sales within the Group. It also includes the Group’s proportion of work carried out under jointly controlled operations.
Revenue and profit are recognised as follows:
(a) Construction contracts Revenue accrues in line with construction progress which is normally determined by external valuations. It is the gross value of work carried out for the period to the balance sheet date (including retentions).
Profits on contracts are calculated in accordance with IAS 11 ‘Construction Contracts’. Industry practice is to assess the estimated final outcome of each contract and recognise the profit based upon the percentage of completion of the contract at the relevant date. The assessment of the final outcome of each contract is determined by regular review of the revenues and costs to complete that contract. Consistent contract review procedures are in place in respect of contract forecasting.
The general principles for profit recognition are as follows:
› Profits on short duration contracts are taken when the contract is complete;
› Profits on other contracts are recognised on a percentage of completion basis when the contract’s outcome can be estimated reliably;
› Provision is made for losses incurred or foreseen in bringing the contract to completion as soon as they become apparent;
› Claims receivable are recognised as income when received or certified for payment, except that in preparing contract forecasts to completion, a prudent and reasonable evaluation of claims receivable may be included to mitigate foreseeable losses and only to the extent that there is reasonable certainty of recovery; and
› Variations and compensation events are included in forecasts to completion when it is considered highly probable that they will be recovered.
Financial Statem
entsS
trategic Report
Governance
Kier Group plc | Report and Accounts 2018 125
Financial Statements
Notes to the consolidated financial statements continued For the year ended 30 June 2018
126 Kier Group plc | Report and Accounts 2018
1 Significant accounting policies continued Percentage completion is normally calculated by taking certified value to date as a percentage of estimated final value, unless the internal value is materially different to the certified value, in which case the internal value is used.
(b) Services Revenue and profit from services rendered, which include facilities management, highways maintenance, street cleaning and recycling, is recognised as and when the service is provided as opposed to Construction contracts that are required on stage of completion.
Where revenue that has been recognised is subsequently determined not to be recoverable due to a dispute with the client, these amounts are charged against the revenue recognised. Where non-recovery is as a result of inability of a client to meet its obligations, these amounts are charged to administrative expenses.
Unbilled revenue is the difference between the revenue recognised and the amounts actually invoiced to customers. Where invoicing exceeds the amount of revenue recognised these amounts are included in deferred income.
Service contracts are reviewed monthly to assess their future operational performance and profitability. Where a loss-making contract is identified, the net present value of the total projected contracted loss is provided for as an onerous contract.
(c) Private housing and land sales Revenue from housing sales is recognised at the fair value of the consideration received or receivable on legal completion, net of incentives. Revenue from land sales and land exchanges is recognised on the unconditional exchange of contracts. Profit is recognised on a site-by-site basis by reference to the expected out-turn result from each site. The principal estimation technique used by the Group in attributing profit on sites to a particular period is the preparation of forecasts on a site-by-site basis. These focus on revenues and costs to complete and enable an assessment to be made of the final out-turn on each site. Consistent review procedures are in place in respect of site forecasting. Provision is made for any losses foreseen in completing a site as soon as they become apparent.
(d) Property development Revenue in respect of property developments is recorded on unconditional exchange of contracts on disposal of finished developments. Profit taken is subject to any amounts necessary to cover residual commitments relating to development performance. Provision is made for any losses foreseen in completing a development as soon as they become apparent.
Where developments are sold in advance of construction being completed, revenue and profit are recognised from the point of sale and as the significant outstanding acts of construction and development are completed. If a development is sold in advance of the commencement of construction, no revenue or profit is recognised at the point of sale. Revenue and profit are recognised in line with the progress on construction, based on the percentage completion of the construction and development work. If a development is sold during construction but prior to completion, revenue and profit are recognised at the time of sale in line with the percentage completion of the construction and development works at the time of sale and thereafter in line with the percentage of completion of the construction and development works.
(e) Private Finance Initiative (PFI) service concession agreements Revenue relating to construction or upgrade services under a service concession agreement is recognised based on the stage of completion of the work performed, consistent with the Group’s
accounting policy on recognising revenue on construction contracts (see above). Operation or service revenue is recognised in the period in which the services were provided by the Group. When the Group provides more than one service in a service concession agreement, the consideration received is allocated by reference to the relative fair values of the services delivered.
Pre-contract costs Costs associated with bidding for contracts (pre-contract costs) are written off as incurred. When it is probable that a contract will be awarded, usually when the Group has secured preferred bidder status, costs incurred from that date to the date of financial close are carried forward in the balance sheet as other receivables.
When financial close is achieved on PFI or Public Private Partnership (PPP) contracts, costs are recovered from the special purpose vehicle and pre-contract costs within this recovery that were not previously capitalised are credited to the income statement, except to the extent that the Group retains a share in the special purpose vehicle. The amount not credited is deferred and recognised over the life of the construction contract to which the costs relate.
Property, plant and equipment and depreciation Depreciation is based on historical or deemed cost, including expenditure that is directly attributable to the acquisition of the items, less the estimated residual value, and the estimated economic lives of the assets concerned. Freehold land is not depreciated. Other tangible assets are depreciated to residual values in equal annual instalments over the period of their estimated economic lives, which are principally as follows:
Freehold land and buildings
25–50 years
Leasehold buildings and improvements
Period of lease
Plant and equipment (including vehicles)
3–12 years
Assets held under finance leases are depreciated over the shorter of the term of the lease or the expected useful life of the asset.
Leases Leases in terms of which the Group assumes substantially all of the risks and rewards of ownership are classified as finance leases. On initial recognition the leased asset is measured at an amount equal to the lower of its fair value and the present value of the minimum lease payments. Subsequent to initial recognition, the asset is accounted for in accordance with the accounting policy applicable to that asset.
Other leases are operating leases, and the rental charges are charged to the income statement on a straight-line basis over the life of each lease.
Employee benefits (a) Retirement benefit obligations For defined contribution pension schemes operated by the Group, amounts payable are charged to the income statement as they fall due.
The Group accounts for defined benefit obligations in accordance with IAS 19. Obligations are measured at discounted present value while plan assets are measured at fair value. The operating and financing costs of such plans are recognised separately in the income statement; current service costs are spread systematically over the lives of employees and financing costs are recognised in full in the period in which they arise. Remeasurements of the net defined pension liability, including actuarial gains and losses, are recognised immediately in other comprehensive income.
126 Kier Group plc | Report and Accounts 2018
127 Kier Group plc | Report and Accounts 2017
The net finance cost is calculated by applying the discount rate to the net balance of the defined benefit obligation and the fair value of plan assets. This cost is included in finance costs in the income statement.
Where the calculations result in a surplus to the Group, the recognised asset is limited to the present value of any available future refunds from the plan or reductions in future contributions to the plan.
(b) Share-based payments Share-based payments granted but not vested are valued at the fair value of the shares at the date of grant. This affects the Sharesave and Long Term Incentive Plan (LTIP) schemes. The fair value of these schemes at the date of award is calculated using the Black-Scholes model apart from the total shareholder return element of the LTIP which is based on a Stochastic model.
The cost to the Group of awards to employees under the LTIP scheme is spread on a straight-line basis over the relevant performance period. The scheme awards to senior employees a number of shares which will vest after three years if particular criteria are met. The cost of the scheme is based on the fair value of the shares at the date the options are granted.
Shares purchased and held in trust in connection with the Group’s share schemes are deducted from retained earnings. No gain or loss is recognised within the income statement on the market value of these shares compared with the original cost.
Finance income and costs Interest receivable and payable on bank balances is credited or charged to the income statement as incurred using the effective interest rate method.
Borrowing costs are capitalised where the Group constructs qualifying assets. All other borrowing costs are written off to the income statement as incurred.
Borrowing costs incurred within the Group’s jointly controlled entities relating to the construction of assets in PFI and PPP projects are capitalised until the relevant assets are brought into operational use.
Notional interest payable, representing the unwinding of the discount on long-term liabilities, is charged to finance costs.
Taxation Income tax comprises current and deferred tax. Income tax is recognised in the income statement except to the extent that it relates to items recognised directly in equity, in which case it is recognised in equity.
Current tax is the expected tax payable on taxable income for the year, using tax rates enacted or substantively enacted at the balance sheet date, and any adjustment to tax payable in respect of previous years.
Deferred tax is provided using the balance sheet method, providing for temporary differences between the carrying amounts of assets and liabilities for financial reporting purposes and the amounts used for taxation purposes. The deferred tax provision is based on the expected manner of realisation or settlement of the carrying amount of the assets and liabilities, using tax rates enacted or substantively enacted at the balance sheet date.
A deferred tax asset is recognised only to the extent that it is probable that future taxable profits will be available against which the asset can be utilised. Deferred tax assets are reduced to the extent that it is no longer probable that the related tax benefit will be realised.
Foreign currencies Transactions denominated in foreign currencies are recorded at the exchange rates in effect when they take place. Resulting foreign currency denominated assets and liabilities are translated at the exchange rates ruling at the balance sheet date. Exchange differences arising from foreign currency transactions are reflected in the income statement.
Items included in the financial statements of each of the Group’s subsidiaries are measured using the currency of the primary economic environment in which each entity operates (‘the functional currency’). The consolidated financial statements are presented in GBP, which is the Group’s presentation currency.
The assets and liabilities of overseas subsidiary undertakings are translated at the rate of exchange ruling at the balance sheet date. Trading profits or losses are translated at average rates prevailing during the accounting period. Differences on exchange arising from the retranslation of net investments in overseas subsidiary undertakings at the year-end rates are recognised in other comprehensive income. All other translation differences are reflected in the income statement.
Mining assets Opencast expenditure incurred prior to the commencement of operating an opencast site is capitalised and the cost less the residual value is depreciated over the ‘coaling life’ of the site on a coal extraction basis.
The cost of restoration is recognised as a provision as soon as the restoration liability arises. The amount provided represents the present value of the anticipated costs. Costs are charged against the provision as incurred and the unwinding of the discount is included within finance costs. A tangible asset is created for an amount equivalent to the initial provision and depreciated on a coal extraction basis over the life of the asset.
Where there is a subsequent change to the estimated restoration costs or discount rate, the present value of the change is recognised as a change in the restoration provision with a corresponding change in the cost of the tangible asset until the asset is fully depreciated when the remaining adjustment is taken to the income statement.
Inventories Inventories, including land held for and in the course of development, are valued at the lower of cost and net realisable value. Cost comprises direct materials and, where appropriate, labour and production overheads which have been incurred in bringing the inventories and work in progress to their present location and condition. Cost in certain circumstances also includes notional interest as explained in the accounting policy for finance income and costs. Net realisable value represents the estimated selling price less all estimated costs of completion and costs to be incurred in marketing, selling and distribution.
Construction work in progress is included within inventories in the balance sheet. It is measured at cost plus profit less losses recognised to date less progress billings. If payments received from customers exceed the income recognised, the difference is included within trade and other payables in the balance sheet.
Land inventory is recognised at the time a liability is recognised, generally after exchange of unconditional contracts.
Financial Statem
entsS
trategic Report
Governance
Kier Group plc | Report and Accounts 2018 127
Financial Statements
Notes to the consolidated financial statements continued For the year ended 30 June 2018
128 Kier Group plc | Report and Accounts 2018
1 Significant accounting policies continued Property inventory, which represents all development land and work in progress, is included at cost less any losses foreseen in completing and disposing of the development less any amounts received or receivable as progress payments or part disposals. Where a property is being developed, cost includes cost of acquisition and development to date, including directly attributable fees, expenses and finance charges net of rental or other income attributable to the development. Where development property is not being actively developed, net rental income and finance costs are taken to the income statement.
Assets held for sale Assets classified as held for sale are measured at the lower of their carrying amount and fair value less costs to sell.
Assets are classified as held for sale if their carrying amount will be recovered through a sale transaction rather than through continuing use. This condition is regarded as met only when the sale is highly probable, and the assets are available for sale in their present condition.
Share capital The ordinary share capital of the Company is recorded as the proceeds received, net of directly attributable incremental issue costs.
Provisions Provisions are recognised when the Group has a present legal or constructive obligation as a result of a past event, and where it is probable that an outflow will be required to settle the obligation and the amount can be reliably estimated.
Contingent liabilities The Group discloses a contingent liability in circumstances where it has a possible obligation depending on whether some uncertain future event occurs, or has a present obligation but payment is not probable, or the amount cannot be measured reliably.
Government grants Government grant income is recognised at the point that there is reasonable assurance that the Group will comply with the conditions attached to it, and that the grant will be received.
Financial instruments Financial assets and financial liabilities are recognised in the Group’s balance sheet when the Group becomes a party to the contractual provisions of the instrument. An assessment of whether a financial asset is impaired is made at least at each reporting date. The principal financial assets and liabilities of the Group are as follows:
(a) Trade receivables and trade payables Given the varied activities of the Group it is not practicable to identify a common operating cycle. The Group has therefore allocated receivables and payables due within 12 months of the balance sheet date to current with the remainder included in non-current.
Trade receivables do not carry interest and are stated at their initial cost reduced by appropriate allowances for estimated irrecoverable amounts.
Trade payables on normal terms are not interest bearing and are stated at their nominal value. Trade payables on extended terms, particularly in respect of land purchases, are discounted and recorded at their present value.
Amounts owing under supply chain finance arrangements are included within trade payables rather than bank debt. The purpose
of supply chain finance is purely to grant subcontractors and suppliers access to credit and improve their cashflows.
The designation in trade payables is due to the assignment of invoice rather than a novation, Kier acting as an agent with fees related to supply chain finance being borne by the supplier and the final payment date to the bank being set by Kier with interest accrued for any late payments.
(b) Cash and cash equivalents Cash and cash equivalents in the cash flow statement comprise cash at bank and in hand, including bank deposits with original maturities of three months or less, net of bank overdrafts where legal right of set off exists. Bank overdrafts are included within financial liabilities in current liabilities in the balance sheet.
(c) Bank and other borrowings Interest-bearing bank and other borrowings are recorded at the fair value of the proceeds received, net of direct issue costs. Finance charges, including premiums payable on settlement or redemption and direct issue costs, are accounted for on an accruals basis in the income statement using the effective interest method and are added to the carrying value of the instrument to the extent that they are not settled in the period in which they arise.
(d) Private Finance Initiative (PFI) assets Under the terms of a PFI or similar project, where the risks and rewards of ownership remain largely with the purchaser of the associated services, the Group’s interest in the asset is classified as a financial asset and included at its amortised cost within investment in joint ventures. Significant accounting policies continued.
(e) Derivative financial instruments Derivatives are initially recognised at fair value on the date that the contract is entered into and subsequently remeasured in future periods at their fair value. The method of recognising the resulting change in fair value depends on whether the derivative is designated as a hedging instrument and whether the hedging relationship is effective.
For cash flow hedges the effective part of the change in fair value of these derivatives is recognised directly in other comprehensive income. Any ineffective portion is recognised immediately in the income statement. Amounts accumulated in equity are recycled to the income statement in the periods when the hedged items will affect profit or loss. The fair value of interest rate derivatives is the estimated amount that the Group would receive or pay to terminate the derivatives at the balance sheet date.
If the hedging instrument no longer meets the criteria for hedge accounting, expires or is sold, terminated or exercised, the hedge accounting is discontinued prospectively. The cumulative gain or loss previously recognised in equity remains there until the forecast transaction occurs.
The Group enters into forward contracts in order to hedge against transactional foreign currency exposures. In cases where these derivative instruments are significant, hedge accounting is applied as described above. Where hedge accounting is not applied, changes in fair value of derivatives are recognised in the income statement.
Critical accounting estimates and judgements The key assumptions concerning the future and other key sources of estimation uncertainty at the balance sheet date that have a significant risk of causing a material adjustment to the carrying amounts of assets and liabilities within the next financial year are as follows:
128 Kier Group plc | Report and Accounts 2018
129 Kier Group plc | Report and Accounts 2017
(a) Revenue and profit recognition The estimation techniques used for revenue and profit recognition in respect of property development, private housing sales, construction contracts and services contracts require forecasts to be made of the outcome of long-term contracts which require assessments and judgements to be made on the recovery of pre-contract costs, changes in the scope of work, contract programmes, maintenance and defects liabilities and changes in costs.
(b) Construction contracts Over 500 Construction contracts (2017: over 500) were income generating during the year. Of these, three (2017: six) individually had a material impact on operating profit.
The key judgements and estimates relating to determining the revenue and profit of these material contracts are:
› costs to complete
› achieving the planned build programme
› recoverability of claims and variations
› each contract is treated on its merits and subject to a regular review of the revenue and costs to complete that contract, determined by a combination of management judgement and external professional assistance, backed up by judgements papers for the contracts that have a material impact on the income statement.
The level of estimation uncertainty in our Construction business is reduced by the effect of its substantial portfolio and significant experience of the division’s management team. The level of estimation is further reduced by the combination of the modest scale and short contract durations of our projects. Nevertheless, the profit recognition in our Construction business is a key estimate, due to the inherent uncertainties in any construction project over revenues and costs.
The level of estimation and uncertainty differs between our Construction businesses, particularly between UK Building and Infrastructure. UK Building operates around 400 sites each year with an average project size of £7-8m. These projects typically operate under framework contracts where costs are known with a greater degree of certainty. Infrastructure manages around 50 sites with projects ranging from a relatively small number of higher value major Infrastructure Civil Engineering projects to a larger number of more modest minor signalling upgrades and replacements.
The major Infrastructure Civil Engineering Projects typically include Design and Build, Construct only and Lump Sum contracts. The nature and length of these contracts means there can be a greater level of estimation and uncertainty. The blended portfolio risk of the overall Construction business is mitigated by the relative sizes of the UK Building and Infrastructure businesses.
Our Construction revenue for the year is £2.0bn (2017: £2.0bn) with an associated margin of 2.0% (2017: 2.0%). The historic profit margins in our Construction business typically range from 1.8% to 2.8%. We therefore determined that a potential downside risk in margin would be 0.2%. Given the short-term average duration (approximately 12 months) of our Construction portfolio, the impact of such a change across our projects in delivery at the year end would be an impact on operating profit of £2.0m (2017: £2.0m).
(c) Valuation of land and work in progress The inventory balance includes £60m (2017: £47m) relating to ten (2017: eight) land sites acquired for development as residential sites, on which development has been temporarily suspended. These assets are accounted for as work in progress in the balance sheet and are carried at net book value, representing the lower of cost and net realisable value in accordance with IAS 2 ‘Inventories’, para 9.
The net realisable value of the land is a key estimate. In arriving at this value, management must make two key estimations for each site:
› An estimation of the costs to complete
› An estimation of the remaining revenue
In making these estimations, management uses both extensive in-house experience and market research conducted by third-party experts. Across the sites, for net realisable value to drop below cost, development costs would need to increase by over 5.4% (2017: 3.9%) or the gross development value would need to decrease by more than 4.0% (2017: 3.7%).
The classification of these assets as inventory is a key judgement. In making that judgement, management considers both the Group’s intention and ability to develop the sites, driven by required levels of return on capital. The key judgement in arriving at the life time margin is the build rate and sales rate. The build rate is determined by our proven ability to build at a rate on local sites and the sales rate is defined with reference to external market research. These factors can combine in sales rates being currently below what is required to provide a sufficient return on capital, leading to the decision to temporarily suspend development.
In the event that those sites were not developed by the Group and disposed of, a value below current net realisable value may be realised.
Over the last three years, two developments were disposed of or work commenced where it had previously been suspended.
(d) Environmental Services contracts The key sensitivity in our onerous contract provision calculation is future recyclate prices. A reasonably likely change would be an increase or decrease of 20% in assumed recyclate prices, which as at 30 June 2018 would decrease or increase respectively the onerous contract provision required at that date by £1.8m. A key judgement is that we will exit certain contracts before the end of the contracted period.
(e) Life cycle assets The key sensitivity in our calculation is the percentage of the funds build-up required for future maintenance. A reasonably likely change would be an increase or decrease of 10% in the percentage of funds build-up required. Such a change would result in a profit impact of approximately £1m in any one year.
(f) Defined benefit pension scheme valuations In determining the valuation of defined benefit pension scheme assets and liabilities, a number of key assumptions have been made. The key assumptions, which are given below, are largely dependent on factors outside the control of the Group:
› Expected return on plan assets;
› Inflation rate;
› Mortality;
› Discount rate; and
› Salary and pension increases.
Details of the assumptions used and sensitivity to changes in these assumptions are included in note 8.
Financial Statem
entsS
trategic Report
Governance
Kier Group plc | Report and Accounts 2018 129
Financial Statements
Notes to the consolidated financial statements continued For the year ended 30 June 2018
130 Kier Group plc | Report and Accounts 2018
1 Significant accounting policies continued (g) Goodwill Determining whether goodwill is impaired requires an estimation of the value in use of cash generating units (CGUs) to which the goodwill has been allocated. The value in use calculation requires an estimate to be made of the timing and amount of future cash flows expected to arise from the CGU and the application of a suitable discount rate in order to calculate the net present value. Cash flow forecasts for the next three years are based on the Group’s budgets and forecasts. Other key inputs in assessing each CGU are revenue growth, operating margin and discount rate. The assumptions are set out in note 12 together with an assessment of the impact of reasonably possible sensitivities.
(h) Joint ventures In accordance with IFRS 11 para 7, joint ventures are identified where the control of an arrangement is shared and decisions around activities require unanimous consent if the action significantly affects the investee’s return. The key judgement involved in determining joint control is that the board structure and the mechanisms, including deadlock mechanisms, in the reserved matters do not give any one party majority control over relevant activities, regardless of the economic split between partners.
(i) Non-underlying items Non-underlying items are items of financial performance which the Group believes should be separately identified on the face of the income statement to assist in understanding the underlying financial performance achieved by the Group. Determining whether an item is part of underlying or non-underlying items requires judgement.
A total non-underlying cost of £25.1m after tax was charged to the income statement for the year ended 30 June 2018 (2017: £88.3m). The items that comprise this are set out in note 4 together with an explanation of their nature.
2 Segmental reporting The Group operates four divisions: Property, Residential, Construction and Services, which is the basis on which the Group manages and reports its primary segmental information. Corporate includes unrecovered overheads and the charge for defined benefit pension schemes.
Segmental information is based on the information provided to the Chief Executive, together with the Board, who is the chief operating decision maker. The segments are strategic business units which have different core customers and offer different services. The segments are discussed in the Chief Executive’s strategic review on pages 14 to 19 and the divisional reviews on pages 44 to 49.
The accounting policies of the operating segments are the same as those described in the summary of significant accounting policies on pages 123 to 130. The Group evaluates segmental information on the basis of profit or loss from operations before non-underlying items, interest and income tax expense. The segmental results that are reported to the Chief Executive include items directly attributable to a segment as well as those that can be allocated on a reasonable basis.
130 Kier Group plc | Report and Accounts 2018
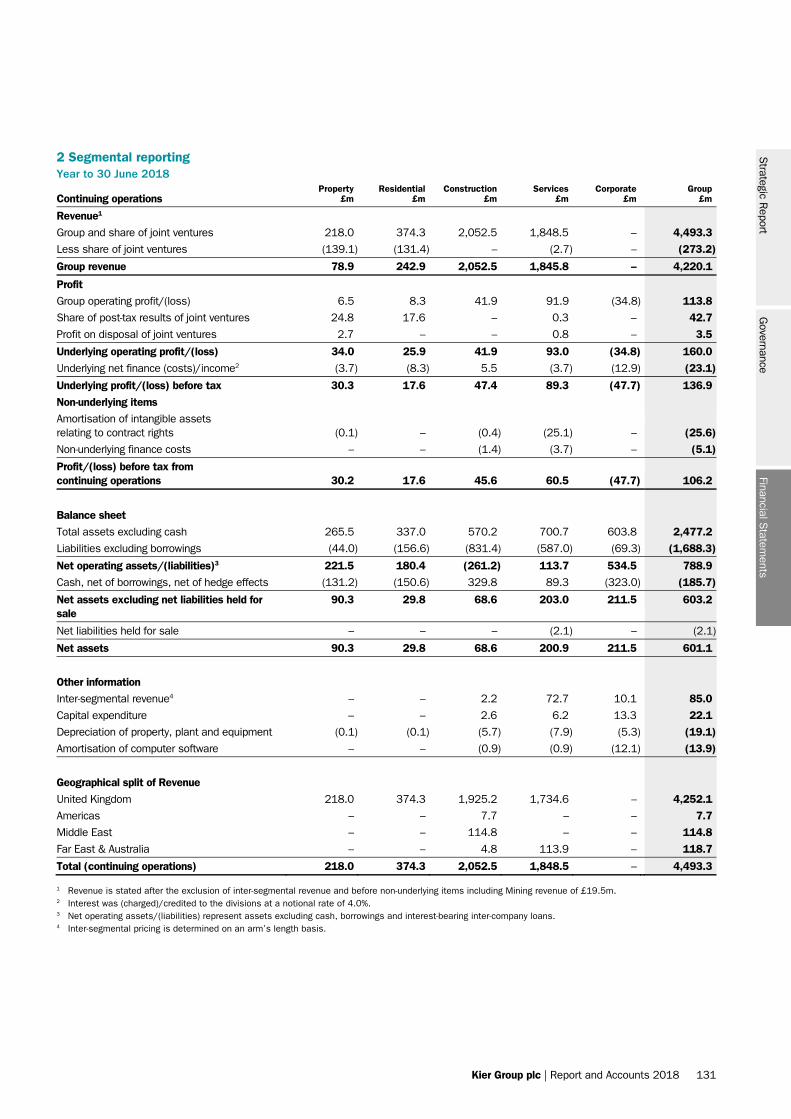
Kier Group plc | Report and Accounts 2018 131
2 Segmental reporting Year to 30 June 2018
Continuing operations Property
£m Residential
£m Construction
£m Services
£m Corporate
£m Group
£m
Revenue1
Group and share of joint ventures 218.0 374.3 2,052.5 1,848.5 – 4,493.3 Less share of joint ventures (139.1) (131.4) – (2.7) – (273.2)
Group revenue 78.9 242.9 2,052.5 1,845.8 – 4,220.1
Profit Group operating profit/(loss) 6.5 8.3 41.9 91.9 (34.8) 113.8 Share of post-tax results of joint ventures 24.8 17.6 – 0.3 – 42.7 Profit on disposal of joint ventures 2.7 – – 0.8 – 3.5
Underlying operating profit/(loss) 34.0 25.9 41.9 93.0 (34.8) 160.0 Underlying net finance (costs)/income2 (3.7) (8.3) 5.5 (3.7) (12.9) (23.1)
Underlying profit/(loss) before tax 30.3 17.6 47.4 89.3 (47.7) 136.9 Non-underlying items Amortisation of intangible assets relating to contract rights (0.1) – (0.4) (25.1) – (25.6) Non-underlying finance costs – – (1.4) (3.7) – (5.1)
Profit/(loss) before tax from continuing operations 30.2 17.6 45.6 60.5 (47.7) 106.2
Balance sheet Total assets excluding cash 265.5 337.0 570.2 700.7 603.8 2,477.2 Liabilities excluding borrowings (44.0) (156.6) (831.4) (587.0) (69.3) (1,688.3)
Net operating assets/(liabilities)3 221.5 180.4 (261.2) 113.7 534.5 788.9 Cash, net of borrowings, net of hedge effects (131.2) (150.6) 329.8 89.3 (323.0) (185.7)
Net assets excluding net liabilities held for sale
90.3 29.8 68.6 203.0 211.5
603.2
Net liabilities held for sale – – – (2.1) – (2.1)
Net assets 90.3 29.8 68.6 200.9 211.5 601.1
Other information Inter-segmental revenue4 – – 2.2 72.7 10.1 85.0 Capital expenditure – – 2.6 6.2 13.3 22.1 Depreciation of property, plant and equipment (0.1) (0.1) (5.7) (7.9) (5.3) (19.1) Amortisation of computer software – – (0.9) (0.9) (12.1) (13.9)
Geographical split of Revenue United Kingdom 218.0 374.3 1,925.2 1,734.6 – 4,252.1 Americas – – 7.7 – – 7.7 Middle East – – 114.8 – – 114.8 Far East & Australia – – 4.8 113.9 – 118.7
Total (continuing operations) 218.0 374.3 2,052.5 1,848.5 – 4,493.3
1 Revenue is stated after the exclusion of inter-segmental revenue and before non-underlying items including Mining revenue of £19.5m. 2 Interest was (charged)/credited to the divisions at a notional rate of 4.0%. 3 Net operating assets/(liabilities) represent assets excluding cash, borrowings and interest-bearing inter-company loans. 4 Inter-segmental pricing is determined on an arm’s length basis.
Financial Statem
entsS
trategic Report
Governance
Kier Group plc | Report and Accounts 2018 131
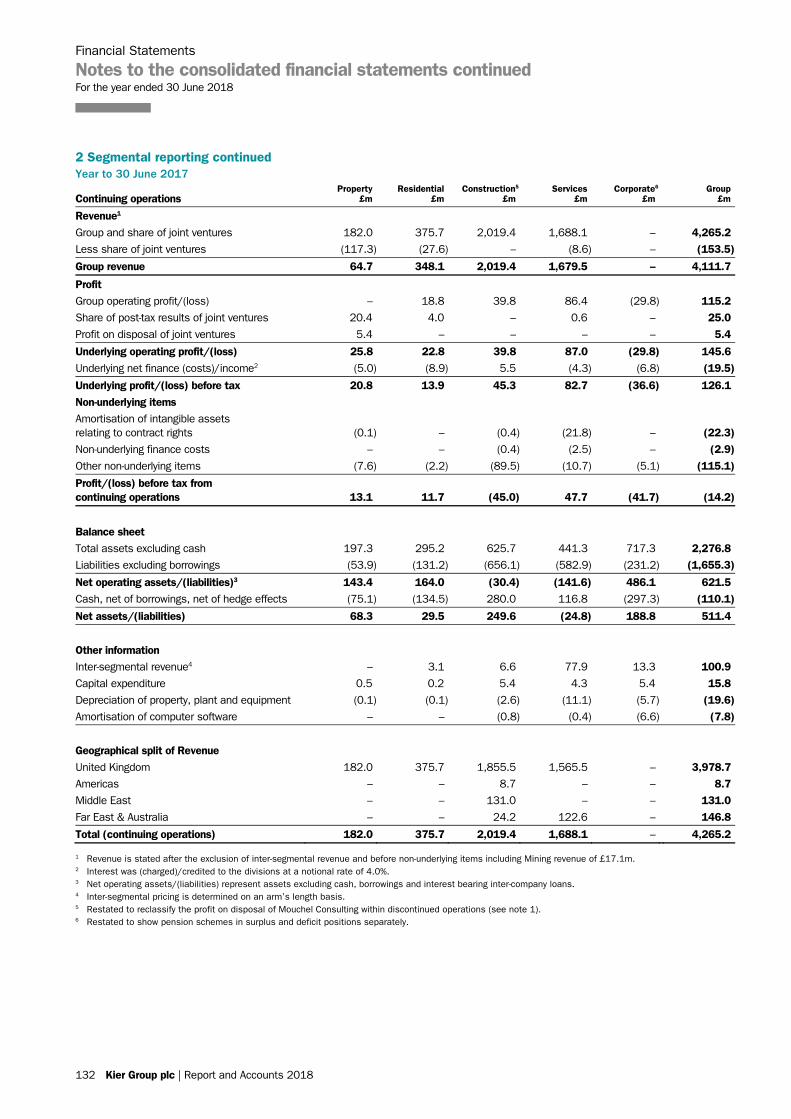
Financial Statements
Notes to the consolidated financial statements continued For the year ended 30 June 2018
132 Kier Group plc | Report and Accounts 2018
2 Segmental reporting continued Year to 30 June 2017
Continuing operations Property
£m Residential
£m Construction5
£m Services
£m Corporate6
£m Group
£m
Revenue1 Group and share of joint ventures 182.0 375.7 2,019.4 1,688.1 – 4,265.2 Less share of joint ventures (117.3) (27.6) – (8.6) – (153.5)
Group revenue 64.7 348.1 2,019.4 1,679.5 – 4,111.7
Profit Group operating profit/(loss) – 18.8 39.8 86.4 (29.8) 115.2 Share of post-tax results of joint ventures 20.4 4.0 – 0.6 – 25.0 Profit on disposal of joint ventures 5.4 – – – – 5.4
Underlying operating profit/(loss) 25.8 22.8 39.8 87.0 (29.8) 145.6 Underlying net finance (costs)/income2 (5.0) (8.9) 5.5 (4.3) (6.8) (19.5)
Underlying profit/(loss) before tax 20.8 13.9 45.3 82.7 (36.6) 126.1 Non-underlying items Amortisation of intangible assets relating to contract rights (0.1) – (0.4) (21.8) – (22.3) Non-underlying finance costs – – (0.4) (2.5) – (2.9) Other non-underlying items (7.6) (2.2) (89.5) (10.7) (5.1) (115.1)
Profit/(loss) before tax from continuing operations 13.1 11.7 (45.0) 47.7 (41.7) (14.2)
Balance sheet Total assets excluding cash 197.3 295.2 625.7 441.3 717.3 2,276.8 Liabilities excluding borrowings (53.9) (131.2) (656.1) (582.9) (231.2) (1,655.3)
Net operating assets/(liabilities)3 143.4 164.0 (30.4) (141.6) 486.1 621.5 Cash, net of borrowings, net of hedge effects (75.1) (134.5) 280.0 116.8 (297.3) (110.1)
Net assets/(liabilities) 68.3 29.5 249.6 (24.8) 188.8 511.4
Other information Inter-segmental revenue4 – 3.1 6.6 77.9 13.3 100.9 Capital expenditure 0.5 0.2 5.4 4.3 5.4 15.8 Depreciation of property, plant and equipment (0.1) (0.1) (2.6) (11.1) (5.7) (19.6) Amortisation of computer software – – (0.8) (0.4) (6.6) (7.8)
Geographical split of Revenue United Kingdom 182.0 375.7 1,855.5 1,565.5 – 3,978.7 Americas – – 8.7 – – 8.7 Middle East – – 131.0 – – 131.0 Far East & Australia – – 24.2 122.6 – 146.8
Total (continuing operations) 182.0 375.7 2,019.4 1,688.1 – 4,265.2
1 Revenue is stated after the exclusion of inter-segmental revenue and before non-underlying items including Mining revenue of £17.1m. 2 Interest was (charged)/credited to the divisions at a notional rate of 4.0%. 3 Net operating assets/(liabilities) represent assets excluding cash, borrowings and interest bearing inter-company loans. 4 Inter-segmental pricing is determined on an arm’s length basis. 5 Restated to reclassify the profit on disposal of Mouchel Consulting within discontinued operations (see note 1). 6 Restated to show pension schemes in surplus and deficit positions separately.
132 Kier Group plc | Report and Accounts 2018
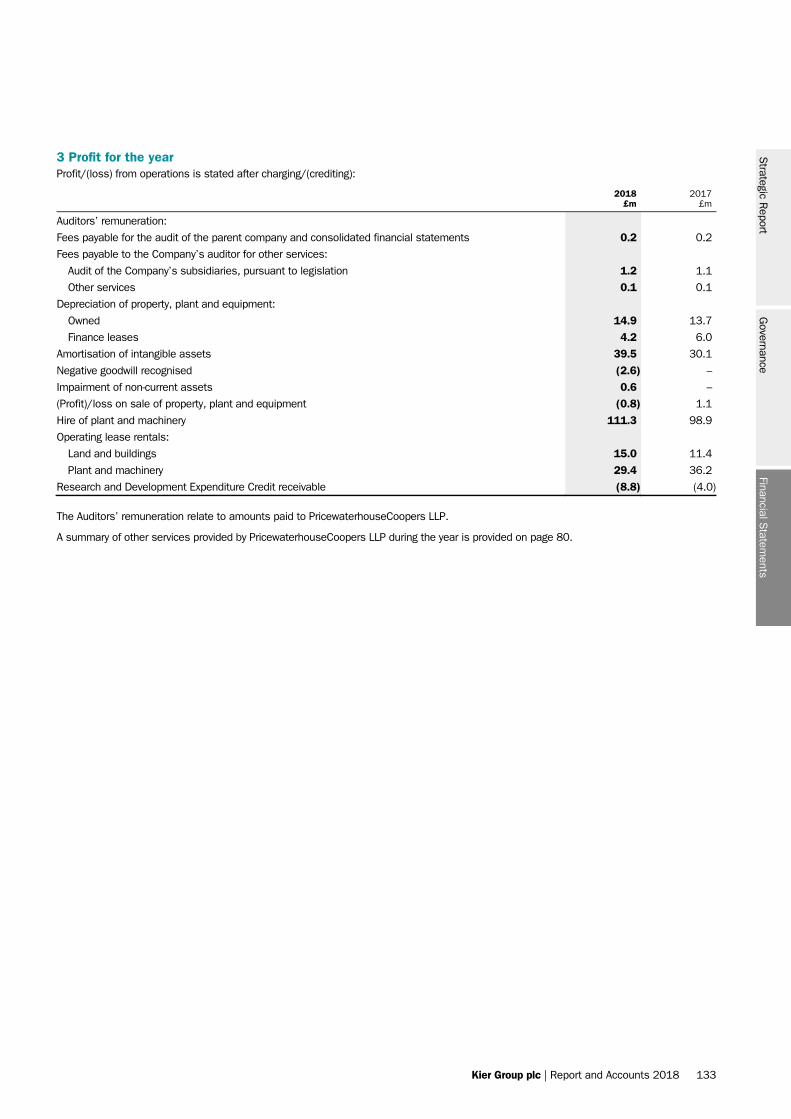
Kier Group plc | Report and Accounts 2018 133
3 Profit for the year Profit/(loss) from operations is stated after charging/(crediting):
2018
£m 2017
£m
Auditors’ remuneration:
Fees payable for the audit of the parent company and consolidated financial statements 0.2 0.2
Fees payable to the Company’s auditor for other services:
Audit of the Company’s subsidiaries, pursuant to legislation 1.2 1.1
Other services 0.1 0.1
Depreciation of property, plant and equipment:
Owned 14.9 13.7
Finance leases 4.2 6.0
Amortisation of intangible assets 39.5 30.1
Negative goodwill recognised (2.6) –
Impairment of non-current assets 0.6 –
(Profit)/loss on sale of property, plant and equipment (0.8) 1.1
Hire of plant and machinery 111.3 98.9
Operating lease rentals:
Land and buildings 15.0 11.4
Plant and machinery 29.4 36.2
Research and Development Expenditure Credit receivable (8.8) (4.0)
The Auditors’ remuneration relate to amounts paid to PricewaterhouseCoopers LLP.
A summary of other services provided by PricewaterhouseCoopers LLP during the year is provided on page 80.
Financial Statem
entsS
trategic Report
Governance
Kier Group plc | Report and Accounts 2018 133
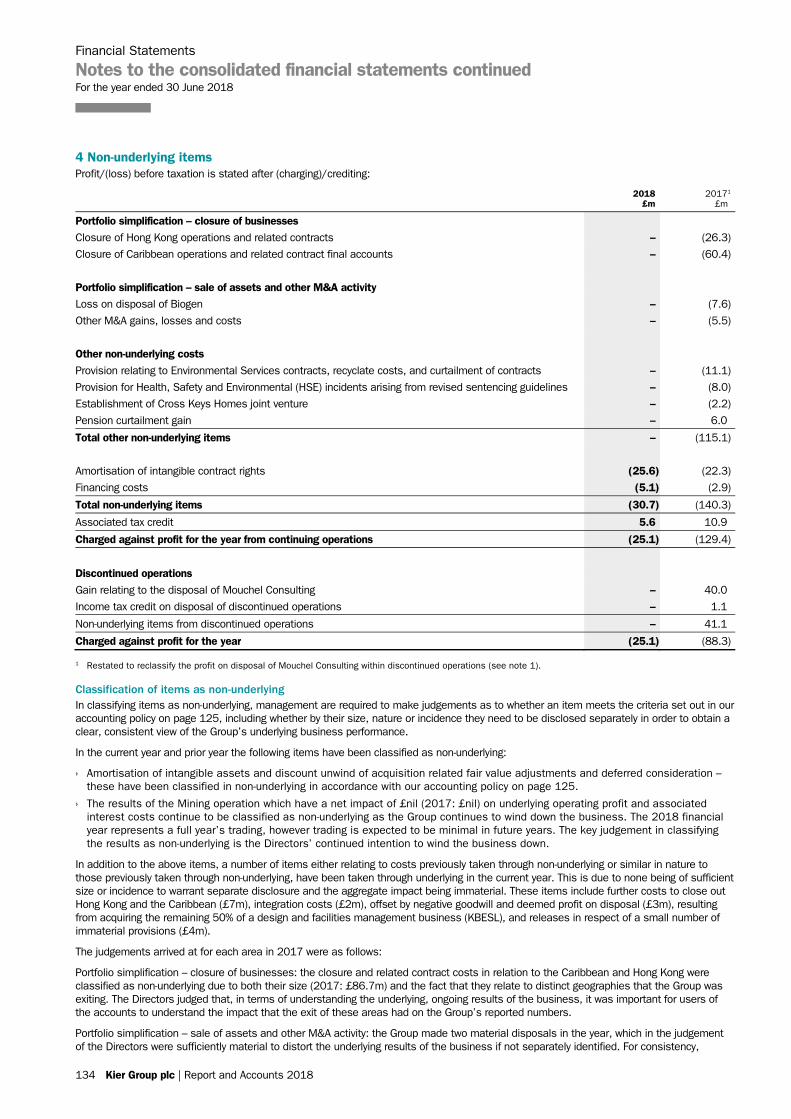
Financial Statements
Notes to the consolidated financial statements continued For the year ended 30 June 2018
134 Kier Group plc | Report and Accounts 2018
4 Non-underlying items
Profit/(loss) before taxation is stated after (charging)/crediting:
2018
£m 20171
£m
Portfolio simplification – closure of businesses
Closure of Hong Kong operations and related contracts – (26.3)
Closure of Caribbean operations and related contract final accounts – (60.4)
Portfolio simplification – sale of assets and other M&A activity
Loss on disposal of Biogen – (7.6)
Other M&A gains, losses and costs – (5.5)
Other non-underlying costs
Provision relating to Environmental Services contracts, recyclate costs, and curtailment of contracts – (11.1)
Provision for Health, Safety and Environmental (HSE) incidents arising from revised sentencing guidelines – (8.0)
Establishment of Cross Keys Homes joint venture – (2.2)
Pension curtailment gain – 6.0
Total other non-underlying items – (115.1)
Amortisation of intangible contract rights (25.6) (22.3)
Financing costs (5.1) (2.9)
Total non-underlying items (30.7) (140.3)
Associated tax credit 5.6 10.9
Charged against profit for the year from continuing operations (25.1) (129.4)
Discontinued operations
Gain relating to the disposal of Mouchel Consulting – 40.0
Income tax credit on disposal of discontinued operations – 1.1
Non-underlying items from discontinued operations – 41.1
Charged against profit for the year (25.1) (88.3)
1 Restated to reclassify the profit on disposal of Mouchel Consulting within discontinued operations (see note 1).
Classification of items as non-underlying In classifying items as non-underlying, management are required to make judgements as to whether an item meets the criteria set out in our accounting policy on page 125, including whether by their size, nature or incidence they need to be disclosed separately in order to obtain a clear, consistent view of the Group’s underlying business performance.
In the current year and prior year the following items have been classified as non-underlying:
› Amortisation of intangible assets and discount unwind of acquisition related fair value adjustments and deferred consideration – these have been classified in non-underlying in accordance with our accounting policy on page 125.
› The results of the Mining operation which have a net impact of £nil (2017: £nil) on underlying operating profit and associated interest costs continue to be classified as non-underlying as the Group continues to wind down the business. The 2018 financial year represents a full year’s trading, however trading is expected to be minimal in future years. The key judgement in classifying the results as non-underlying is the Directors’ continued intention to wind the business down.
In addition to the above items, a number of items either relating to costs previously taken through non-underlying or similar in nature to those previously taken through non-underlying, have been taken through underlying in the current year. This is due to none being of sufficient size or incidence to warrant separate disclosure and the aggregate impact being immaterial. These items include further costs to close out Hong Kong and the Caribbean (£7m), integration costs (£2m), offset by negative goodwill and deemed profit on disposal (£3m), resulting from acquiring the remaining 50% of a design and facilities management business (KBESL), and releases in respect of a small number of immaterial provisions (£4m).
The judgements arrived at for each area in 2017 were as follows:
Portfolio simplification – closure of businesses: the closure and related contract costs in relation to the Caribbean and Hong Kong were classified as non-underlying due to both their size (2017: £86.7m) and the fact that they relate to distinct geographies that the Group was exiting. The Directors judged that, in terms of understanding the underlying, ongoing results of the business, it was important for users of the accounts to understand the impact that the exit of these areas had on the Group’s reported numbers.
Portfolio simplification – sale of assets and other M&A activity: the Group made two material disposals in the year, which in the judgement of the Directors were sufficiently material to distort the underlying results of the business if not separately identified. For consistency,
134 Kier Group plc | Report and Accounts 2018
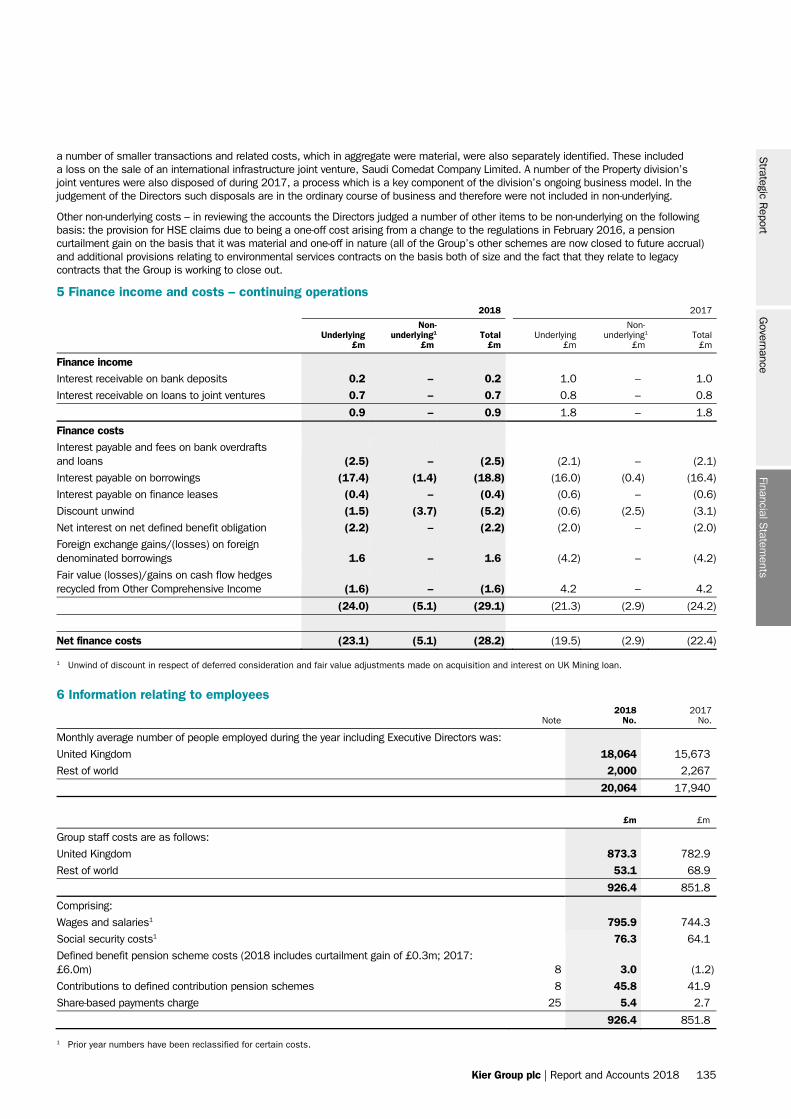
Kier Group plc | Report and Accounts 2018 135
a number of smaller transactions and related costs, which in aggregate were material, were also separately identified. These included a loss on the sale of an international infrastructure joint venture, Saudi Comedat Company Limited. A number of the Property division’s joint ventures were also disposed of during 2017, a process which is a key component of the division’s ongoing business model. In the judgement of the Directors such disposals are in the ordinary course of business and therefore were not included in non-underlying.
Other non-underlying costs – in reviewing the accounts the Directors judged a number of other items to be non-underlying on the following basis: the provision for HSE claims due to being a one-off cost arising from a change to the regulations in February 2016, a pension curtailment gain on the basis that it was material and one-off in nature (all of the Group’s other schemes are now closed to future accrual) and additional provisions relating to environmental services contracts on the basis both of size and the fact that they relate to legacy contracts that the Group is working to close out.
5 Finance income and costs – continuing operations 2018 2017
Underlying
£m
Non- underlying1
£m Total
£m Underlying
£m
Non- underlying1
£m Total
£m
Finance income
Interest receivable on bank deposits 0.2 – 0.2 1.0 – 1.0
Interest receivable on loans to joint ventures 0.7 – 0.7 0.8 – 0.8
0.9 – 0.9 1.8 – 1.8
Finance costs
Interest payable and fees on bank overdrafts and loans (2.5) – (2.5) (2.1) – (2.1)
Interest payable on borrowings (17.4) (1.4) (18.8) (16.0) (0.4) (16.4)
Interest payable on finance leases (0.4) – (0.4) (0.6) – (0.6)
Discount unwind (1.5) (3.7) (5.2) (0.6) (2.5) (3.1)
Net interest on net defined benefit obligation (2.2) – (2.2) (2.0) – (2.0)
Foreign exchange gains/(losses) on foreign denominated borrowings 1.6 – 1.6 (4.2) – (4.2)
Fair value (losses)/gains on cash flow hedges recycled from Other Comprehensive Income (1.6) – (1.6) 4.2 – 4.2
(24.0) (5.1) (29.1) (21.3) (2.9) (24.2)
Net finance costs (23.1) (5.1) (28.2) (19.5) (2.9) (22.4)
1 Unwind of discount in respect of deferred consideration and fair value adjustments made on acquisition and interest on UK Mining loan.
6 Information relating to employees
Note 2018
No. 2017
No.
Monthly average number of people employed during the year including Executive Directors was:
United Kingdom 18,064 15,673
Rest of world 2,000 2,267
20,064 17,940
£m £m
Group staff costs are as follows:
United Kingdom 873.3 782.9
Rest of world 53.1 68.9
926.4 851.8
Comprising:
Wages and salaries1 795.9 744.3
Social security costs1 76.3 64.1
Defined benefit pension scheme costs (2018 includes curtailment gain of £0.3m; 2017: £6.0m) 8 3.0 (1.2)
Contributions to defined contribution pension schemes 8 45.8 41.9
Share-based payments charge 25 5.4 2.7
926.4 851.8
1 Prior year numbers have been reclassified for certain costs.
Financial Statem
entsS
trategic Report
Governance
Kier Group plc | Report and Accounts 2018 135
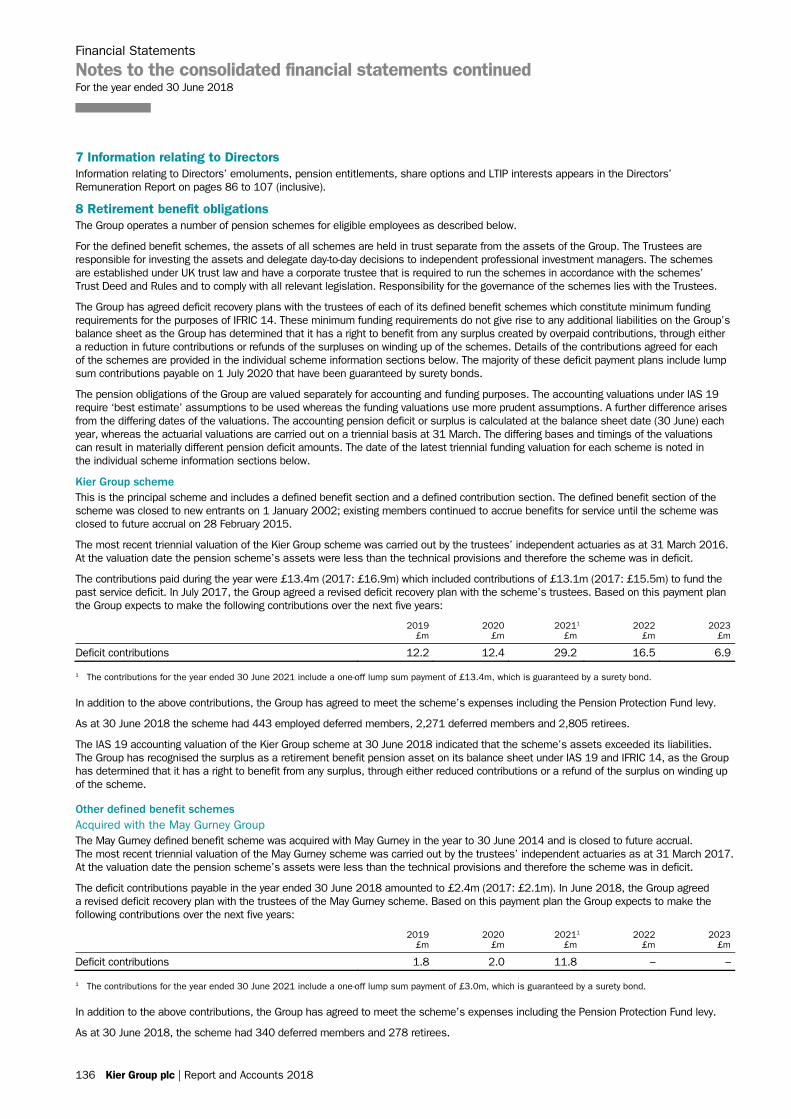
Financial Statements
Notes to the consolidated financial statements continued For the year ended 30 June 2018
136 Kier Group plc | Report and Accounts 2018
7 Information relating to Directors Information relating to Directors’ emoluments, pension entitlements, share options and LTIP interests appears in the Directors’ Remuneration Report on pages 86 to 107 (inclusive).
8 Retirement benefit obligations The Group operates a number of pension schemes for eligible employees as described below.
For the defined benefit schemes, the assets of all schemes are held in trust separate from the assets of the Group. The Trustees are responsible for investing the assets and delegate day-to-day decisions to independent professional investment managers. The schemes are established under UK trust law and have a corporate trustee that is required to run the schemes in accordance with the schemes’ Trust Deed and Rules and to comply with all relevant legislation. Responsibility for the governance of the schemes lies with the Trustees.
The Group has agreed deficit recovery plans with the trustees of each of its defined benefit schemes which constitute minimum funding requirements for the purposes of IFRIC 14. These minimum funding requirements do not give rise to any additional liabilities on the Group’s balance sheet as the Group has determined that it has a right to benefit from any surplus created by overpaid contributions, through either a reduction in future contributions or refunds of the surpluses on winding up of the schemes. Details of the contributions agreed for each of the schemes are provided in the individual scheme information sections below. The majority of these deficit payment plans include lump sum contributions payable on 1 July 2020 that have been guaranteed by surety bonds.
The pension obligations of the Group are valued separately for accounting and funding purposes. The accounting valuations under IAS 19 require ‘best estimate’ assumptions to be used whereas the funding valuations use more prudent assumptions. A further difference arises from the differing dates of the valuations. The accounting pension deficit or surplus is calculated at the balance sheet date (30 June) each year, whereas the actuarial valuations are carried out on a triennial basis at 31 March. The differing bases and timings of the valuations can result in materially different pension deficit amounts. The date of the latest triennial funding valuation for each scheme is noted in the individual scheme information sections below.
Kier Group scheme This is the principal scheme and includes a defined benefit section and a defined contribution section. The defined benefit section of the scheme was closed to new entrants on 1 January 2002; existing members continued to accrue benefits for service until the scheme was closed to future accrual on 28 February 2015.
The most recent triennial valuation of the Kier Group scheme was carried out by the trustees’ independent actuaries as at 31 March 2016. At the valuation date the pension scheme’s assets were less than the technical provisions and therefore the scheme was in deficit.
The contributions paid during the year were £13.4m (2017: £16.9m) which included contributions of £13.1m (2017: £15.5m) to fund the past service deficit. In July 2017, the Group agreed a revised deficit recovery plan with the scheme’s trustees. Based on this payment plan the Group expects to make the following contributions over the next five years:
2019
£m 2020
£m 20211
£m 2022
£m 2023
£m
Deficit contributions 12.2 12.4 29.2 16.5 6.9
1 The contributions for the year ended 30 June 2021 include a one-off lump sum payment of £13.4m, which is guaranteed by a surety bond.
In addition to the above contributions, the Group has agreed to meet the scheme’s expenses including the Pension Protection Fund levy.
As at 30 June 2018 the scheme had 443 employed deferred members, 2,271 deferred members and 2,805 retirees.
The IAS 19 accounting valuation of the Kier Group scheme at 30 June 2018 indicated that the scheme’s assets exceeded its liabilities. The Group has recognised the surplus as a retirement benefit pension asset on its balance sheet under IAS 19 and IFRIC 14, as the Group has determined that it has a right to benefit from any surplus, through either reduced contributions or a refund of the surplus on winding up of the scheme.
Other defined benefit schemes Acquired with the May Gurney Group The May Gurney defined benefit scheme was acquired with May Gurney in the year to 30 June 2014 and is closed to future accrual. The most recent triennial valuation of the May Gurney scheme was carried out by the trustees’ independent actuaries as at 31 March 2017. At the valuation date the pension scheme’s assets were less than the technical provisions and therefore the scheme was in deficit.
The deficit contributions payable in the year ended 30 June 2018 amounted to £2.4m (2017: £2.1m). In June 2018, the Group agreed a revised deficit recovery plan with the trustees of the May Gurney scheme. Based on this payment plan the Group expects to make the following contributions over the next five years:
2019
£m 2020
£m 20211
£m 2022
£m 2023
£m
Deficit contributions 1.8 2.0 11.8 – –
1 The contributions for the year ended 30 June 2021 include a one-off lump sum payment of £3.0m, which is guaranteed by a surety bond.
In addition to the above contributions, the Group has agreed to meet the scheme’s expenses including the Pension Protection Fund levy.
As at 30 June 2018, the scheme had 340 deferred members and 278 retirees.
136 Kier Group plc | Report and Accounts 2018
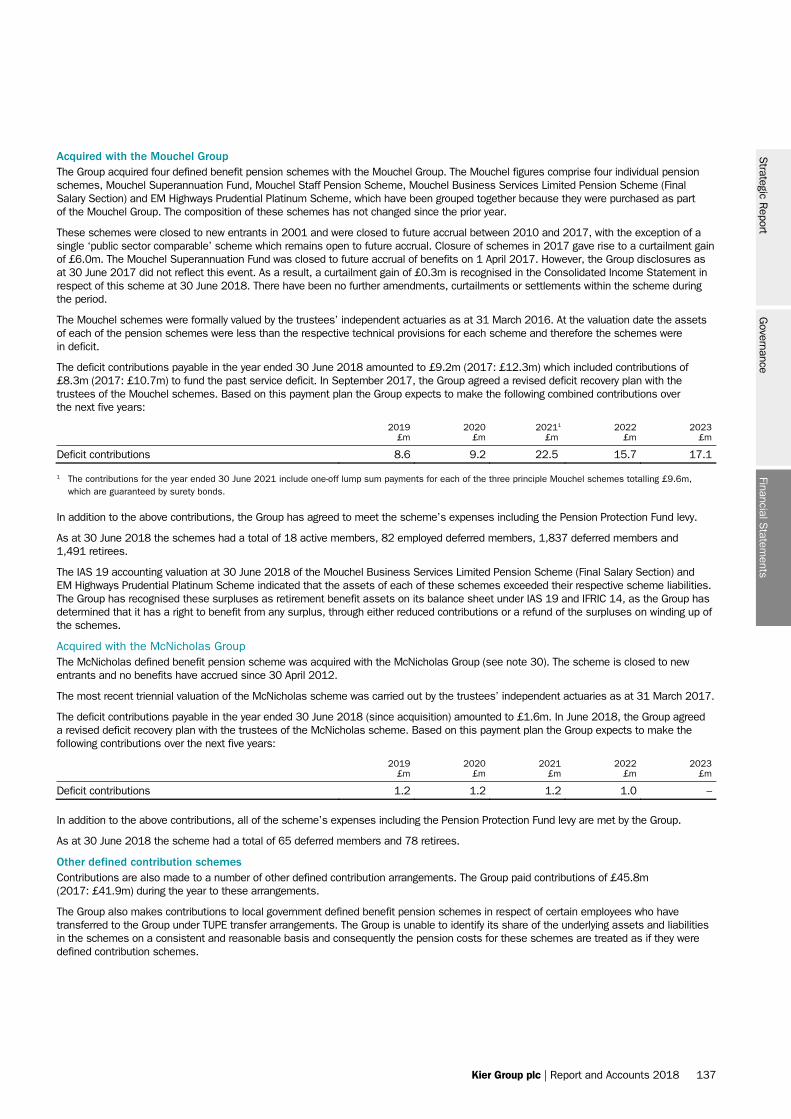
Kier Group plc | Report and Accounts 2018 137
Acquired with the Mouchel Group The Group acquired four defined benefit pension schemes with the Mouchel Group. The Mouchel figures comprise four individual pension schemes, Mouchel Superannuation Fund, Mouchel Staff Pension Scheme, Mouchel Business Services Limited Pension Scheme (Final Salary Section) and EM Highways Prudential Platinum Scheme, which have been grouped together because they were purchased as part of the Mouchel Group. The composition of these schemes has not changed since the prior year.
These schemes were closed to new entrants in 2001 and were closed to future accrual between 2010 and 2017, with the exception of a single ‘public sector comparable’ scheme which remains open to future accrual. Closure of schemes in 2017 gave rise to a curtailment gain of £6.0m. The Mouchel Superannuation Fund was closed to future accrual of benefits on 1 April 2017. However, the Group disclosures as at 30 June 2017 did not reflect this event. As a result, a curtailment gain of £0.3m is recognised in the Consolidated Income Statement in respect of this scheme at 30 June 2018. There have been no further amendments, curtailments or settlements within the scheme during the period.
The Mouchel schemes were formally valued by the trustees’ independent actuaries as at 31 March 2016. At the valuation date the assets of each of the pension schemes were less than the respective technical provisions for each scheme and therefore the schemes were in deficit.
The deficit contributions payable in the year ended 30 June 2018 amounted to £9.2m (2017: £12.3m) which included contributions of £8.3m (2017: £10.7m) to fund the past service deficit. In September 2017, the Group agreed a revised deficit recovery plan with the trustees of the Mouchel schemes. Based on this payment plan the Group expects to make the following combined contributions over the next five years:
2019
£m 2020
£m 20211
£m 2022
£m 2023
£m
Deficit contributions 8.6 9.2 22.5 15.7 17.1
1 The contributions for the year ended 30 June 2021 include one-off lump sum payments for each of the three principle Mouchel schemes totalling £9.6m, which are guaranteed by surety bonds.
In addition to the above contributions, the Group has agreed to meet the scheme’s expenses including the Pension Protection Fund levy.
As at 30 June 2018 the schemes had a total of 18 active members, 82 employed deferred members, 1,837 deferred members and 1,491 retirees.
The IAS 19 accounting valuation at 30 June 2018 of the Mouchel Business Services Limited Pension Scheme (Final Salary Section) and EM Highways Prudential Platinum Scheme indicated that the assets of each of these schemes exceeded their respective scheme liabilities. The Group has recognised these surpluses as retirement benefit assets on its balance sheet under IAS 19 and IFRIC 14, as the Group has determined that it has a right to benefit from any surplus, through either reduced contributions or a refund of the surpluses on winding up of the schemes.
Acquired with the McNicholas Group The McNicholas defined benefit pension scheme was acquired with the McNicholas Group (see note 30). The scheme is closed to new entrants and no benefits have accrued since 30 April 2012.
The most recent triennial valuation of the McNicholas scheme was carried out by the trustees’ independent actuaries as at 31 March 2017.
The deficit contributions payable in the year ended 30 June 2018 (since acquisition) amounted to £1.6m. In June 2018, the Group agreed a revised deficit recovery plan with the trustees of the McNicholas scheme. Based on this payment plan the Group expects to make the following contributions over the next five years:
2019
£m 2020
£m 2021
£m 2022
£m 2023
£m
Deficit contributions 1.2 1.2 1.2 1.0 –
In addition to the above contributions, all of the scheme’s expenses including the Pension Protection Fund levy are met by the Group.
As at 30 June 2018 the scheme had a total of 65 deferred members and 78 retirees.
Other defined contribution schemes Contributions are also made to a number of other defined contribution arrangements. The Group paid contributions of £45.8m (2017: £41.9m) during the year to these arrangements.
The Group also makes contributions to local government defined benefit pension schemes in respect of certain employees who have transferred to the Group under TUPE transfer arrangements. The Group is unable to identify its share of the underlying assets and liabilities in the schemes on a consistent and reasonable basis and consequently the pension costs for these schemes are treated as if they were defined contribution schemes.
Financial Statem
entsS
trategic Report
Governance
Kier Group plc | Report and Accounts 2018 137
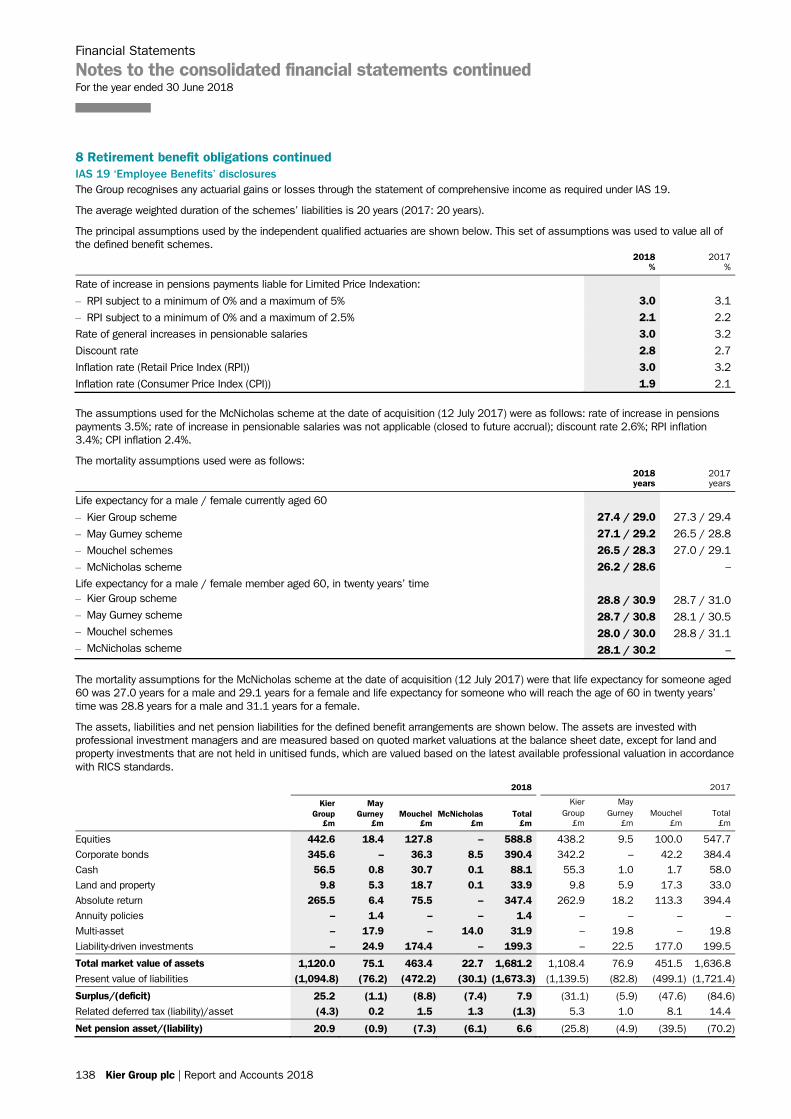
Financial Statements
Notes to the consolidated financial statements continued For the year ended 30 June 2018
138 Kier Group plc | Report and Accounts 2018
8 Retirement benefit obligations continued IAS 19 ‘Employee Benefits’ disclosures The Group recognises any actuarial gains or losses through the statement of comprehensive income as required under IAS 19.
The average weighted duration of the schemes’ liabilities is 20 years (2017: 20 years).
The principal assumptions used by the independent qualified actuaries are shown below. This set of assumptions was used to value all of the defined benefit schemes.
2018
% 2017
%
Rate of increase in pensions payments liable for Limited Price Indexation:
– RPI subject to a minimum of 0% and a maximum of 5% 3.0 3.1
– RPI subject to a minimum of 0% and a maximum of 2.5% 2.1 2.2
Rate of general increases in pensionable salaries 3.0 3.2
Discount rate 2.8 2.7
Inflation rate (Retail Price Index (RPI)) 3.0 3.2
Inflation rate (Consumer Price Index (CPI)) 1.9 2.1
The assumptions used for the McNicholas scheme at the date of acquisition (12 July 2017) were as follows: rate of increase in pensions payments 3.5%; rate of increase in pensionable salaries was not applicable (closed to future accrual); discount rate 2.6%; RPI inflation 3.4%; CPI inflation 2.4%.
The mortality assumptions used were as follows:
2018 years
2017 years
Life expectancy for a male / female currently aged 60
– Kier Group scheme 27.4 / 29.0 27.3 / 29.4
– May Gurney scheme 27.1 / 29.2 26.5 / 28.8
– Mouchel schemes 26.5 / 28.3 27.0 / 29.1
– McNicholas scheme 26.2 / 28.6 –
Life expectancy for a male / female member aged 60, in twenty years’ time – Kier Group scheme 28.8 / 30.9 28.7 / 31.0 – May Gurney scheme 28.7 / 30.8 28.1 / 30.5 – Mouchel schemes 28.0 / 30.0 28.8 / 31.1 – McNicholas scheme 28.1 / 30.2 –
The mortality assumptions for the McNicholas scheme at the date of acquisition (12 July 2017) were that life expectancy for someone aged 60 was 27.0 years for a male and 29.1 years for a female and life expectancy for someone who will reach the age of 60 in twenty years’ time was 28.8 years for a male and 31.1 years for a female.
The assets, liabilities and net pension liabilities for the defined benefit arrangements are shown below. The assets are invested with professional investment managers and are measured based on quoted market valuations at the balance sheet date, except for land and property investments that are not held in unitised funds, which are valued based on the latest available professional valuation in accordance with RICS standards.
2018 2017
Kier Group
£m
May Gurney
£m Mouchel
£m McNicholas
£m Total
£m
Kier Group
£m
May Gurney
£m Mouchel
£m Total
£m
Equities 442.6 18.4 127.8 – 588.8 438.2 9.5 100.0 547.7 Corporate bonds 345.6 – 36.3 8.5 390.4 342.2 – 42.2 384.4 Cash 56.5 0.8 30.7 0.1 88.1 55.3 1.0 1.7 58.0 Land and property 9.8 5.3 18.7 0.1 33.9 9.8 5.9 17.3 33.0 Absolute return 265.5 6.4 75.5 – 347.4 262.9 18.2 113.3 394.4 Annuity policies – 1.4 – – 1.4 – – – – Multi-asset – 17.9 – 14.0 31.9 – 19.8 – 19.8 Liability-driven investments – 24.9 174.4 – 199.3 – 22.5 177.0 199.5
Total market value of assets 1,120.0 75.1 463.4 22.7 1,681.2 1,108.4 76.9 451.5 1,636.8 Present value of liabilities (1,094.8) (76.2) (472.2) (30.1) (1,673.3) (1,139.5) (82.8) (499.1) (1,721.4)
Surplus/(deficit) 25.2 (1.1) (8.8) (7.4) 7.9 (31.1) (5.9) (47.6) (84.6) Related deferred tax (liability)/asset (4.3) 0.2 1.5 1.3 (1.3) 5.3 1.0 8.1 14.4
Net pension asset/(liability) 20.9 (0.9) (7.3) (6.1) 6.6 (25.8) (4.9) (39.5) (70.2)
138 Kier Group plc | Report and Accounts 2018
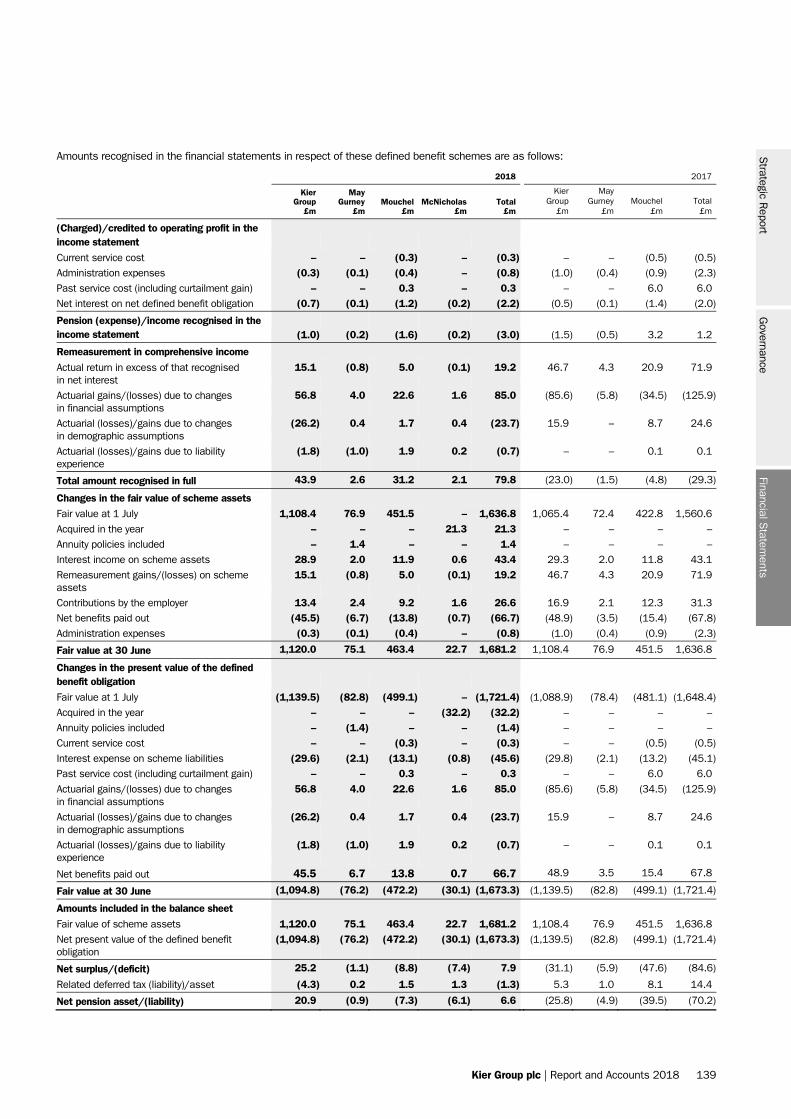
Kier Group plc | Report and Accounts 2018 139
Amounts recognised in the financial statements in respect of these defined benefit schemes are as follows:
2018 2017
Kier Group
£m
May Gurney
£m Mouchel
£m McNicholas
£m Total
£m
Kier Group
£m
May Gurney
£m Mouchel
£m Total
£m
(Charged)/credited to operating profit in the income statement
Current service cost – – (0.3) – (0.3) – – (0.5) (0.5) Administration expenses (0.3) (0.1) (0.4) – (0.8) (1.0) (0.4) (0.9) (2.3) Past service cost (including curtailment gain) – – 0.3 – 0.3 – – 6.0 6.0 Net interest on net defined benefit obligation (0.7) (0.1) (1.2) (0.2) (2.2) (0.5) (0.1) (1.4) (2.0)
Pension (expense)/income recognised in the income statement (1.0) (0.2) (1.6) (0.2) (3.0) (1.5) (0.5) 3.2 1.2
Remeasurement in comprehensive income
Actual return in excess of that recognised in net interest
15.1 (0.8) 5.0 (0.1) 19.2 46.7 4.3 20.9 71.9
Actuarial gains/(losses) due to changes in financial assumptions
56.8 4.0 22.6 1.6 85.0 (85.6) (5.8) (34.5) (125.9)
Actuarial (losses)/gains due to changes in demographic assumptions
(26.2) 0.4 1.7 0.4 (23.7) 15.9 – 8.7 24.6
Actuarial (losses)/gains due to liability experience
(1.8) (1.0) 1.9 0.2 (0.7) – – 0.1 0.1
Total amount recognised in full 43.9 2.6 31.2 2.1 79.8 (23.0) (1.5) (4.8) (29.3)
Changes in the fair value of scheme assets
Fair value at 1 July 1,108.4 76.9 451.5 – 1,636.8 1,065.4 72.4 422.8 1,560.6 Acquired in the year – – – 21.3 21.3 – – – – Annuity policies included – 1.4 – – 1.4 – – – – Interest income on scheme assets 28.9 2.0 11.9 0.6 43.4 29.3 2.0 11.8 43.1 Remeasurement gains/(losses) on scheme assets
15.1 (0.8) 5.0 (0.1) 19.2 46.7 4.3 20.9 71.9
Contributions by the employer 13.4 2.4 9.2 1.6 26.6 16.9 2.1 12.3 31.3 Net benefits paid out (45.5) (6.7) (13.8) (0.7) (66.7) (48.9) (3.5) (15.4) (67.8) Administration expenses (0.3) (0.1) (0.4) – (0.8) (1.0) (0.4) (0.9) (2.3)
Fair value at 30 June 1,120.0 75.1 463.4 22.7 1,681.2 1,108.4 76.9 451.5 1,636.8
Changes in the present value of the defined benefit obligation
Fair value at 1 July (1,139.5) (82.8) (499.1) – (1,721.4) (1,088.9) (78.4) (481.1) (1,648.4) Acquired in the year – – – (32.2) (32.2) – – – – Annuity policies included – (1.4) – – (1.4) – – – – Current service cost – – (0.3) – (0.3) – – (0.5) (0.5) Interest expense on scheme liabilities (29.6) (2.1) (13.1) (0.8) (45.6) (29.8) (2.1) (13.2) (45.1) Past service cost (including curtailment gain) – – 0.3 – 0.3 – – 6.0 6.0 Actuarial gains/(losses) due to changes in financial assumptions
56.8 4.0 22.6 1.6 85.0 (85.6) (5.8) (34.5) (125.9)
Actuarial (losses)/gains due to changes in demographic assumptions
(26.2) 0.4 1.7 0.4 (23.7) 15.9 – 8.7 24.6
Actuarial (losses)/gains due to liability experience
(1.8) (1.0) 1.9 0.2 (0.7) – – 0.1 0.1
Net benefits paid out 45.5 6.7 13.8 0.7 66.7 48.9 3.5 15.4 67.8
Fair value at 30 June (1,094.8) (76.2) (472.2) (30.1) (1,673.3) (1,139.5) (82.8) (499.1) (1,721.4)
Amounts included in the balance sheet
Fair value of scheme assets 1,120.0 75.1 463.4 22.7 1,681.2 1,108.4 76.9 451.5 1,636.8 Net present value of the defined benefit obligation
(1,094.8) (76.2) (472.2) (30.1) (1,673.3) (1,139.5) (82.8) (499.1) (1,721.4)
Net surplus/(deficit) 25.2 (1.1) (8.8) (7.4) 7.9 (31.1) (5.9) (47.6) (84.6)
Related deferred tax (liability)/asset (4.3) 0.2 1.5 1.3 (1.3) 5.3 1.0 8.1 14.4
Net pension asset/(liability) 20.9 (0.9) (7.3) (6.1) 6.6 (25.8) (4.9) (39.5) (70.2)
Financial Statem
entsS
trategic Report
Governance
Kier Group plc | Report and Accounts 2018 139
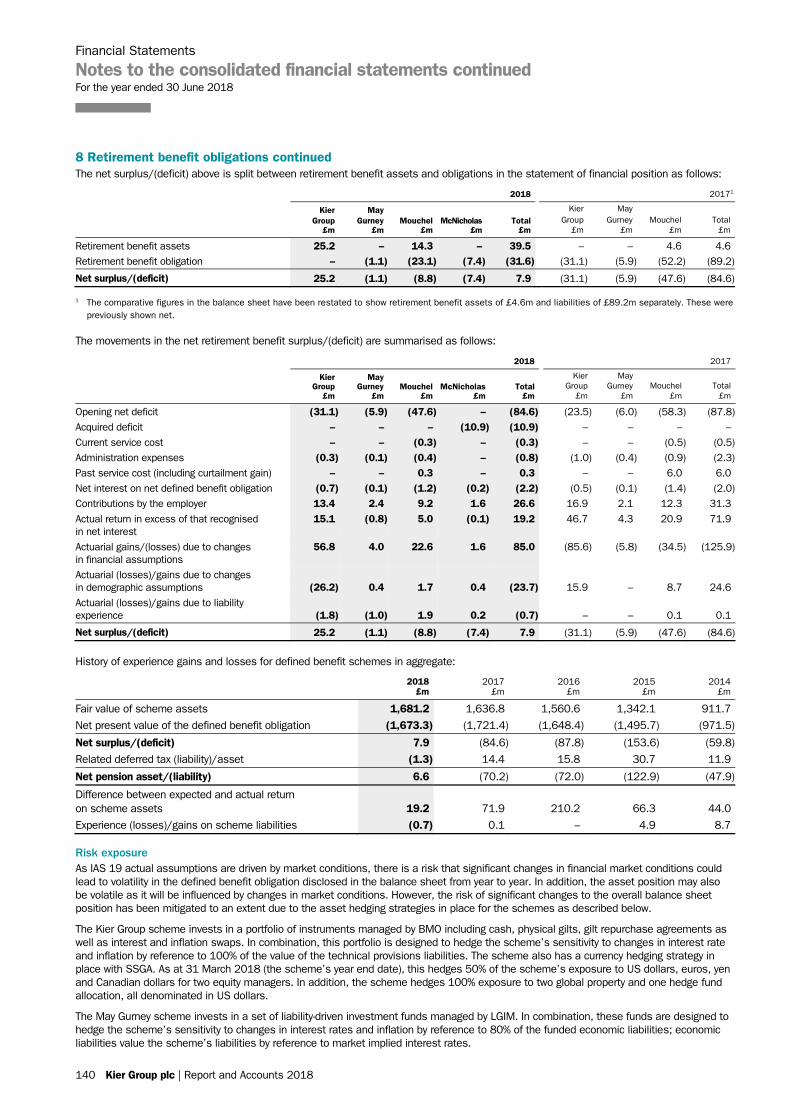
Financial Statements
Notes to the consolidated financial statements continued For the year ended 30 June 2018
140 Kier Group plc | Report and Accounts 2018
8 Retirement benefit obligations continued The net surplus/(deficit) above is split between retirement benefit assets and obligations in the statement of financial position as follows:
2018 20171
Kier Group
£m
May Gurney
£m Mouchel
£m McNicholas
£m Total
£m
Kier Group
£m
May Gurney
£m Mouchel
£m Total
£m
Retirement benefit assets 25.2 – 14.3 – 39.5 – – 4.6 4.6 Retirement benefit obligation – (1.1) (23.1) (7.4) (31.6) (31.1) (5.9) (52.2) (89.2)
Net surplus/(deficit) 25.2 (1.1) (8.8) (7.4) 7.9 (31.1) (5.9) (47.6) (84.6)
1 The comparative figures in the balance sheet have been restated to show retirement benefit assets of £4.6m and liabilities of £89.2m separately. These were previously shown net.
The movements in the net retirement benefit surplus/(deficit) are summarised as follows:
2018 2017
Kier Group
£m
May Gurney
£m Mouchel
£m McNicholas
£m Total
£m
Kier Group
£m
May Gurney
£m Mouchel
£m Total
£m
Opening net deficit (31.1) (5.9) (47.6) – (84.6) (23.5) (6.0) (58.3) (87.8) Acquired deficit – – – (10.9) (10.9) – – – – Current service cost – – (0.3) – (0.3) – – (0.5) (0.5) Administration expenses (0.3) (0.1) (0.4) – (0.8) (1.0) (0.4) (0.9) (2.3) Past service cost (including curtailment gain) – – 0.3 – 0.3 – – 6.0 6.0 Net interest on net defined benefit obligation (0.7) (0.1) (1.2) (0.2) (2.2) (0.5) (0.1) (1.4) (2.0) Contributions by the employer 13.4 2.4 9.2 1.6 26.6 16.9 2.1 12.3 31.3 Actual return in excess of that recognised in net interest
15.1 (0.8) 5.0 (0.1) 19.2 46.7 4.3 20.9 71.9
Actuarial gains/(losses) due to changes in financial assumptions
56.8 4.0 22.6 1.6 85.0 (85.6) (5.8) (34.5) (125.9)
Actuarial (losses)/gains due to changes in demographic assumptions (26.2) 0.4 1.7 0.4 (23.7) 15.9 – 8.7 24.6 Actuarial (losses)/gains due to liability experience (1.8) (1.0) 1.9 0.2 (0.7) – – 0.1 0.1
Net surplus/(deficit) 25.2 (1.1) (8.8) (7.4) 7.9 (31.1) (5.9) (47.6) (84.6)
History of experience gains and losses for defined benefit schemes in aggregate:
2018
£m 2017
£m 2016
£m 2015
£m 2014
£m
Fair value of scheme assets 1,681.2 1,636.8 1,560.6 1,342.1 911.7
Net present value of the defined benefit obligation (1,673.3) (1,721.4) (1,648.4) (1,495.7) (971.5)
Net surplus/(deficit) 7.9 (84.6) (87.8) (153.6) (59.8)
Related deferred tax (liability)/asset (1.3) 14.4 15.8 30.7 11.9
Net pension asset/(liability) 6.6 (70.2) (72.0) (122.9) (47.9)
Difference between expected and actual return on scheme assets 19.2 71.9 210.2 66.3 44.0
Experience (losses)/gains on scheme liabilities (0.7) 0.1 – 4.9 8.7
Risk exposure As IAS 19 actual assumptions are driven by market conditions, there is a risk that significant changes in financial market conditions could lead to volatility in the defined benefit obligation disclosed in the balance sheet from year to year. In addition, the asset position may also be volatile as it will be influenced by changes in market conditions. However, the risk of significant changes to the overall balance sheet position has been mitigated to an extent due to the asset hedging strategies in place for the schemes as described below.
The Kier Group scheme invests in a portfolio of instruments managed by BMO including cash, physical gilts, gilt repurchase agreements as well as interest and inflation swaps. In combination, this portfolio is designed to hedge the scheme’s sensitivity to changes in interest rate and inflation by reference to 100% of the value of the technical provisions liabilities. The scheme also has a currency hedging strategy in place with SSGA. As at 31 March 2018 (the scheme’s year end date), this hedges 50% of the scheme’s exposure to US dollars, euros, yen and Canadian dollars for two equity managers. In addition, the scheme hedges 100% exposure to two global property and one hedge fund allocation, all denominated in US dollars.
The May Gurney scheme invests in a set of liability-driven investment funds managed by LGIM. In combination, these funds are designed to hedge the scheme’s sensitivity to changes in interest rates and inflation by reference to 80% of the funded economic liabilities; economic liabilities value the scheme’s liabilities by reference to market implied interest rates.
140 Kier Group plc | Report and Accounts 2018
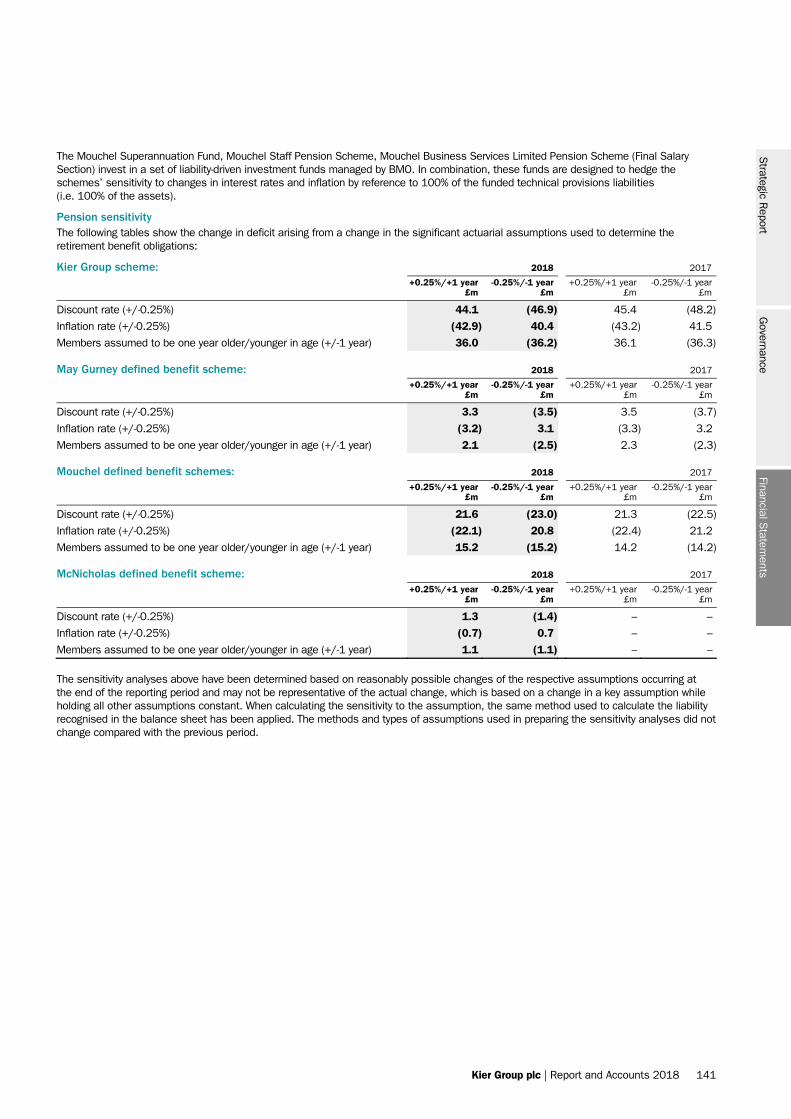
Kier Group plc | Report and Accounts 2018 141
The Mouchel Superannuation Fund, Mouchel Staff Pension Scheme, Mouchel Business Services Limited Pension Scheme (Final Salary Section) invest in a set of liability-driven investment funds managed by BMO. In combination, these funds are designed to hedge the schemes’ sensitivity to changes in interest rates and inflation by reference to 100% of the funded technical provisions liabilities (i.e. 100% of the assets).
Pension sensitivity The following tables show the change in deficit arising from a change in the significant actuarial assumptions used to determine the retirement benefit obligations:
Kier Group scheme: 2018 2017
+0.25%/+1 year
£m -0.25%/-1 year
£m +0.25%/+1 year
£m -0.25%/-1 year
£m
Discount rate (+/-0.25%) 44.1 (46.9) 45.4 (48.2)
Inflation rate (+/-0.25%) (42.9) 40.4 (43.2) 41.5
Members assumed to be one year older/younger in age (+/-1 year) 36.0 (36.2) 36.1 (36.3)
May Gurney defined benefit scheme: 2018 2017
+0.25%/+1 year
£m -0.25%/-1 year
£m +0.25%/+1 year
£m -0.25%/-1 year
£m
Discount rate (+/-0.25%) 3.3 (3.5) 3.5 (3.7)
Inflation rate (+/-0.25%) (3.2) 3.1 (3.3) 3.2
Members assumed to be one year older/younger in age (+/-1 year) 2.1 (2.5) 2.3 (2.3)
Mouchel defined benefit schemes: 2018 2017
+0.25%/+1 year
£m -0.25%/-1 year
£m +0.25%/+1 year
£m -0.25%/-1 year
£m
Discount rate (+/-0.25%) 21.6 (23.0) 21.3 (22.5)
Inflation rate (+/-0.25%) (22.1) 20.8 (22.4) 21.2
Members assumed to be one year older/younger in age (+/-1 year) 15.2 (15.2) 14.2 (14.2)
McNicholas defined benefit scheme: 2018 2017
+0.25%/+1 year
£m -0.25%/-1 year
£m +0.25%/+1 year
£m -0.25%/-1 year
£m
Discount rate (+/-0.25%) 1.3 (1.4) – –
Inflation rate (+/-0.25%) (0.7) 0.7 – –
Members assumed to be one year older/younger in age (+/-1 year) 1.1 (1.1) – –
The sensitivity analyses above have been determined based on reasonably possible changes of the respective assumptions occurring at the end of the reporting period and may not be representative of the actual change, which is based on a change in a key assumption while holding all other assumptions constant. When calculating the sensitivity to the assumption, the same method used to calculate the liability recognised in the balance sheet has been applied. The methods and types of assumptions used in preparing the sensitivity analyses did not change compared with the previous period.
Financial Statem
entsS
trategic Report
Governance
Kier Group plc | Report and Accounts 2018 141
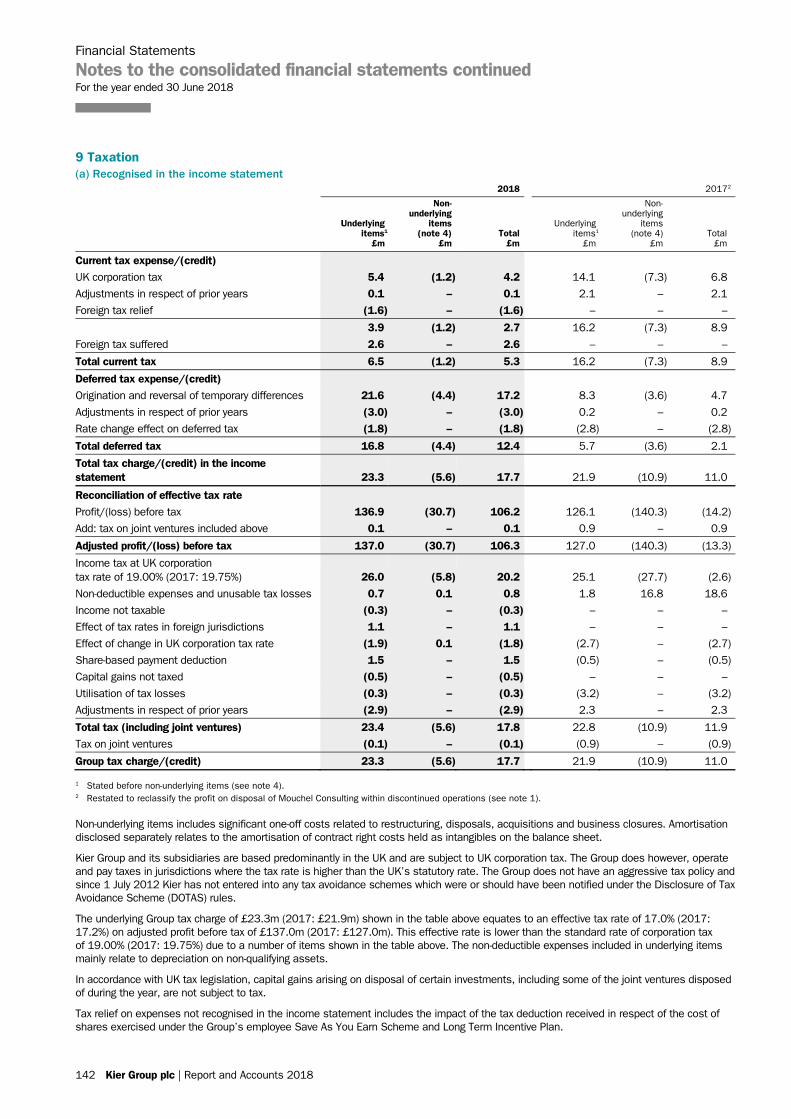
Financial Statements
Notes to the consolidated financial statements continued For the year ended 30 June 2018
142 Kier Group plc | Report and Accounts 2018
9 Taxation (a) Recognised in the income statement
2018 20172
Underlying items1
£m
Non-underlying
items (note 4)
£m Total
£m
Underlying items1
£m
Non- underlying
items (note 4)
£m Total
£m
Current tax expense/(credit)
UK corporation tax 5.4 (1.2) 4.2 14.1 (7.3) 6.8
Adjustments in respect of prior years 0.1 – 0.1 2.1 – 2.1
Foreign tax relief (1.6) – (1.6) – – –
3.9 (1.2) 2.7 16.2 (7.3) 8.9
Foreign tax suffered 2.6 – 2.6 – – –
Total current tax 6.5 (1.2) 5.3 16.2 (7.3) 8.9
Deferred tax expense/(credit)
Origination and reversal of temporary differences 21.6 (4.4) 17.2 8.3 (3.6) 4.7
Adjustments in respect of prior years (3.0) – (3.0) 0.2 – 0.2
Rate change effect on deferred tax (1.8) – (1.8) (2.8) – (2.8)
Total deferred tax 16.8 (4.4) 12.4 5.7 (3.6) 2.1
Total tax charge/(credit) in the income statement 23.3 (5.6) 17.7 21.9 (10.9) 11.0
Reconciliation of effective tax rate
Profit/(loss) before tax 136.9 (30.7) 106.2 126.1 (140.3) (14.2)
Add: tax on joint ventures included above 0.1 – 0.1 0.9 – 0.9
Adjusted profit/(loss) before tax 137.0 (30.7) 106.3 127.0 (140.3) (13.3)
Income tax at UK corporation tax rate of 19.00% (2017: 19.75%) 26.0 (5.8) 20.2 25.1 (27.7) (2.6)
Non-deductible expenses and unusable tax losses 0.7 0.1 0.8 1.8 16.8 18.6
Income not taxable (0.3) – (0.3) – – –
Effect of tax rates in foreign jurisdictions 1.1 – 1.1 – – –
Effect of change in UK corporation tax rate (1.9) 0.1 (1.8) (2.7) – (2.7)
Share-based payment deduction 1.5 – 1.5 (0.5) – (0.5)
Capital gains not taxed (0.5) – (0.5) – – –
Utilisation of tax losses (0.3) – (0.3) (3.2) – (3.2)
Adjustments in respect of prior years (2.9) – (2.9) 2.3 – 2.3
Total tax (including joint ventures) 23.4 (5.6) 17.8 22.8 (10.9) 11.9
Tax on joint ventures (0.1) – (0.1) (0.9) – (0.9)
Group tax charge/(credit) 23.3 (5.6) 17.7 21.9 (10.9) 11.0
1 Stated before non-underlying items (see note 4). 2 Restated to reclassify the profit on disposal of Mouchel Consulting within discontinued operations (see note 1).
Non-underlying items includes significant one-off costs related to restructuring, disposals, acquisitions and business closures. Amortisation disclosed separately relates to the amortisation of contract right costs held as intangibles on the balance sheet.
Kier Group and its subsidiaries are based predominantly in the UK and are subject to UK corporation tax. The Group does however, operate and pay taxes in jurisdictions where the tax rate is higher than the UK’s statutory rate. The Group does not have an aggressive tax policy and since 1 July 2012 Kier has not entered into any tax avoidance schemes which were or should have been notified under the Disclosure of Tax Avoidance Scheme (DOTAS) rules.
The underlying Group tax charge of £23.3m (2017: £21.9m) shown in the table above equates to an effective tax rate of 17.0% (2017: 17.2%) on adjusted profit before tax of £137.0m (2017: £127.0m). This effective rate is lower than the standard rate of corporation tax of 19.00% (2017: 19.75%) due to a number of items shown in the table above. The non-deductible expenses included in underlying items mainly relate to depreciation on non-qualifying assets.
In accordance with UK tax legislation, capital gains arising on disposal of certain investments, including some of the joint ventures disposed of during the year, are not subject to tax.
Tax relief on expenses not recognised in the income statement includes the impact of the tax deduction received in respect of the cost of shares exercised under the Group’s employee Save As You Earn Scheme and Long Term Incentive Plan.
142 Kier Group plc | Report and Accounts 2018
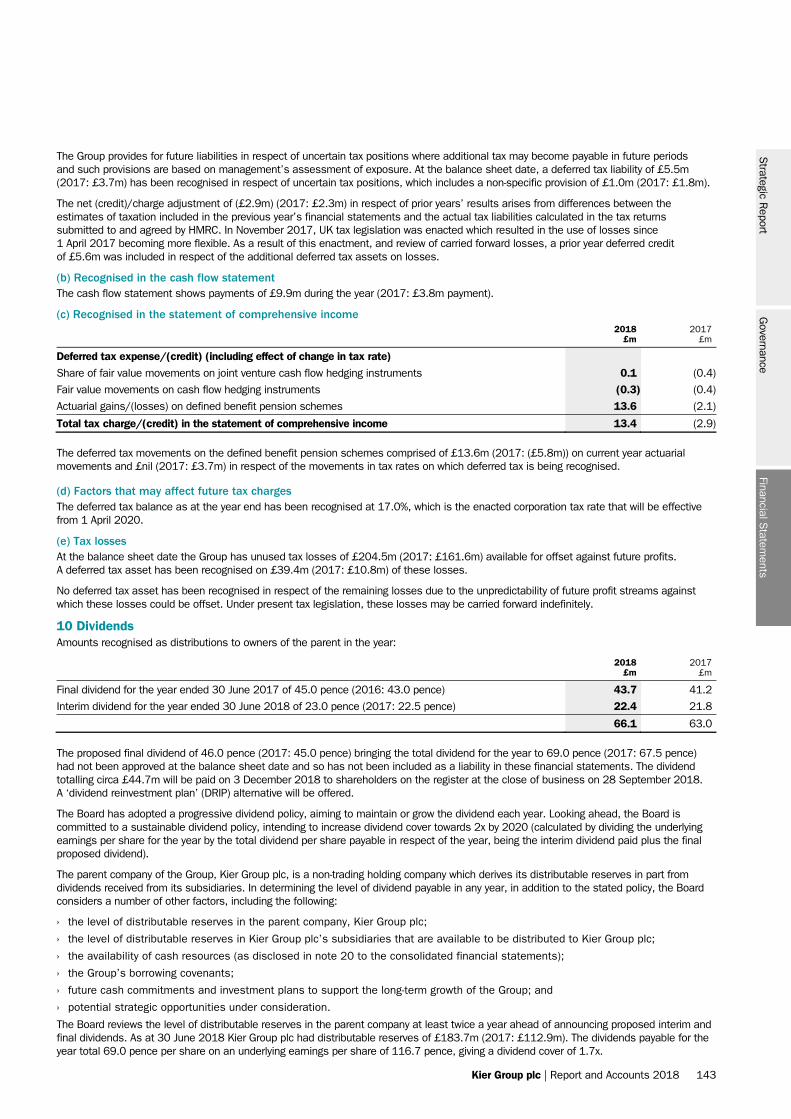
Kier Group plc | Report and Accounts 2018 143
The Group provides for future liabilities in respect of uncertain tax positions where additional tax may become payable in future periods and such provisions are based on management’s assessment of exposure. At the balance sheet date, a deferred tax liability of £5.5m (2017: £3.7m) has been recognised in respect of uncertain tax positions, which includes a non-specific provision of £1.0m (2017: £1.8m).
The net (credit)/charge adjustment of (£2.9m) (2017: £2.3m) in respect of prior years’ results arises from differences between the estimates of taxation included in the previous year’s financial statements and the actual tax liabilities calculated in the tax returns submitted to and agreed by HMRC. In November 2017, UK tax legislation was enacted which resulted in the use of losses since 1 April 2017 becoming more flexible. As a result of this enactment, and review of carried forward losses, a prior year deferred credit of £5.6m was included in respect of the additional deferred tax assets on losses.
(b) Recognised in the cash flow statement The cash flow statement shows payments of £9.9m during the year (2017: £3.8m payment).
(c) Recognised in the statement of comprehensive income
2018
£m 2017
£m
Deferred tax expense/(credit) (including effect of change in tax rate)
Share of fair value movements on joint venture cash flow hedging instruments 0.1 (0.4)
Fair value movements on cash flow hedging instruments (0.3) (0.4)
Actuarial gains/(losses) on defined benefit pension schemes 13.6 (2.1)
Total tax charge/(credit) in the statement of comprehensive income 13.4 (2.9)
The deferred tax movements on the defined benefit pension schemes comprised of £13.6m (2017: (£5.8m)) on current year actuarial movements and £nil (2017: £3.7m) in respect of the movements in tax rates on which deferred tax is being recognised.
(d) Factors that may affect future tax charges The deferred tax balance as at the year end has been recognised at 17.0%, which is the enacted corporation tax rate that will be effective from 1 April 2020.
(e) Tax losses At the balance sheet date the Group has unused tax losses of £204.5m (2017: £161.6m) available for offset against future profits. A deferred tax asset has been recognised on £39.4m (2017: £10.8m) of these losses.
No deferred tax asset has been recognised in respect of the remaining losses due to the unpredictability of future profit streams against which these losses could be offset. Under present tax legislation, these losses may be carried forward indefinitely.
10 Dividends Amounts recognised as distributions to owners of the parent in the year:
2018
£m 2017
£m
Final dividend for the year ended 30 June 2017 of 45.0 pence (2016: 43.0 pence) 43.7 41.2
Interim dividend for the year ended 30 June 2018 of 23.0 pence (2017: 22.5 pence) 22.4 21.8
66.1 63.0
The proposed final dividend of 46.0 pence (2017: 45.0 pence) bringing the total dividend for the year to 69.0 pence (2017: 67.5 pence) had not been approved at the balance sheet date and so has not been included as a liability in these financial statements. The dividend totalling circa £44.7m will be paid on 3 December 2018 to shareholders on the register at the close of business on 28 September 2018. A ‘dividend reinvestment plan’ (DRIP) alternative will be offered.
The Board has adopted a progressive dividend policy, aiming to maintain or grow the dividend each year. Looking ahead, the Board is committed to a sustainable dividend policy, intending to increase dividend cover towards 2x by 2020 (calculated by dividing the underlying earnings per share for the year by the total dividend per share payable in respect of the year, being the interim dividend paid plus the final proposed dividend).
The parent company of the Group, Kier Group plc, is a non-trading holding company which derives its distributable reserves in part from dividends received from its subsidiaries. In determining the level of dividend payable in any year, in addition to the stated policy, the Board considers a number of other factors, including the following:
› the level of distributable reserves in the parent company, Kier Group plc;
› the level of distributable reserves in Kier Group plc’s subsidiaries that are available to be distributed to Kier Group plc;
› the availability of cash resources (as disclosed in note 20 to the consolidated financial statements);
› the Group’s borrowing covenants;
› future cash commitments and investment plans to support the long-term growth of the Group; and
› potential strategic opportunities under consideration.
The Board reviews the level of distributable reserves in the parent company at least twice a year ahead of announcing proposed interim and final dividends. As at 30 June 2018 Kier Group plc had distributable reserves of £183.7m (2017: £112.9m). The dividends payable for the year total 69.0 pence per share on an underlying earnings per share of 116.7 pence, giving a dividend cover of 1.7x.
Financial Statem
entsS
trategic Report
Governance
Kier Group plc | Report and Accounts 2018 143
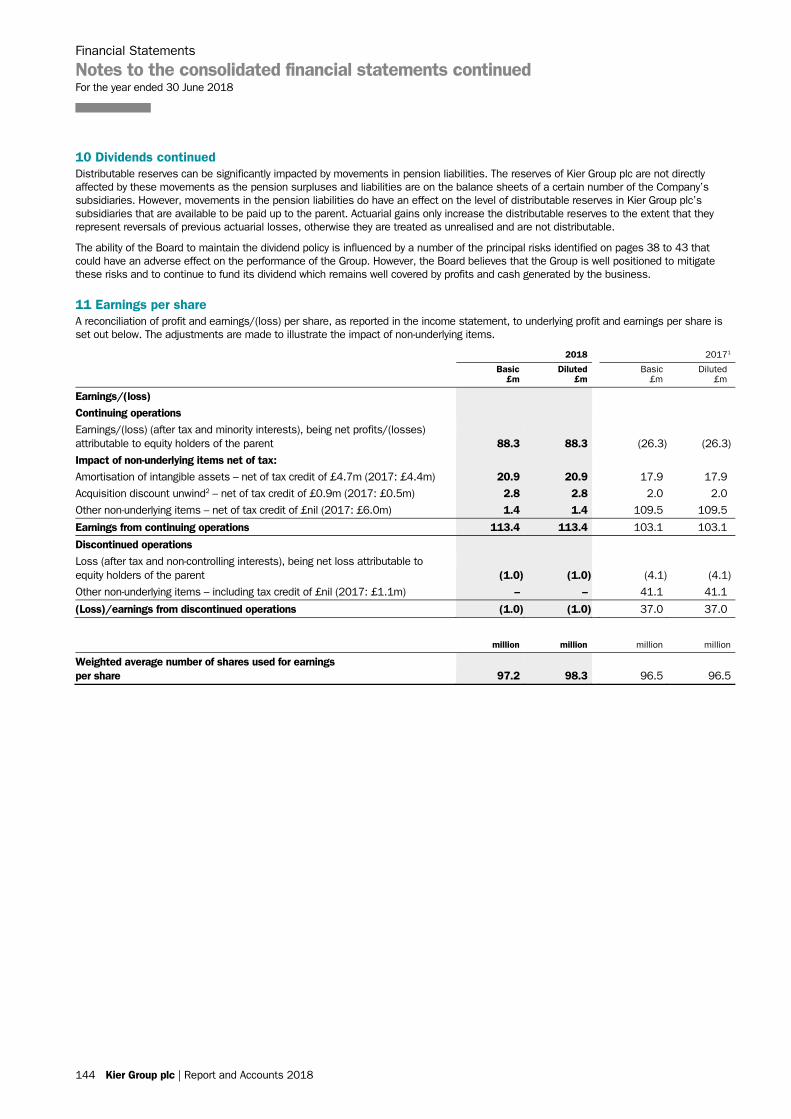
Financial Statements
Notes to the consolidated financial statements continued For the year ended 30 June 2018
144 Kier Group plc | Report and Accounts 2018
10 Dividends continued Distributable reserves can be significantly impacted by movements in pension liabilities. The reserves of Kier Group plc are not directly affected by these movements as the pension surpluses and liabilities are on the balance sheets of a certain number of the Company’s subsidiaries. However, movements in the pension liabilities do have an effect on the level of distributable reserves in Kier Group plc’s subsidiaries that are available to be paid up to the parent. Actuarial gains only increase the distributable reserves to the extent that they represent reversals of previous actuarial losses, otherwise they are treated as unrealised and are not distributable.
The ability of the Board to maintain the dividend policy is influenced by a number of the principal risks identified on pages 38 to 43 that could have an adverse effect on the performance of the Group. However, the Board believes that the Group is well positioned to mitigate these risks and to continue to fund its dividend which remains well covered by profits and cash generated by the business.
11 Earnings per share A reconciliation of profit and earnings/(loss) per share, as reported in the income statement, to underlying profit and earnings per share is set out below. The adjustments are made to illustrate the impact of non-underlying items.
2018 20171
Basic
£m Diluted
£m Basic
£m Diluted
£m
Earnings/(loss)
Continuing operations
Earnings/(loss) (after tax and minority interests), being net profits/(losses) attributable to equity holders of the parent 88.3 88.3 (26.3) (26.3)
Impact of non-underlying items net of tax:
Amortisation of intangible assets – net of tax credit of £4.7m (2017: £4.4m) 20.9 20.9 17.9 17.9
Acquisition discount unwind2 – net of tax credit of £0.9m (2017: £0.5m) 2.8 2.8 2.0 2.0
Other non-underlying items – net of tax credit of £nil (2017: £6.0m) 1.4 1.4 109.5 109.5
Earnings from continuing operations 113.4 113.4 103.1 103.1
Discontinued operations
Loss (after tax and non-controlling interests), being net loss attributable to equity holders of the parent (1.0) (1.0) (4.1) (4.1)
Other non-underlying items – including tax credit of £nil (2017: £1.1m) – – 41.1 41.1
(Loss)/earnings from discontinued operations (1.0) (1.0) 37.0 37.0
million million million million
Weighted average number of shares used for earnings per share 97.2 98.3 96.5 96.5
144 Kier Group plc | Report and Accounts 2018
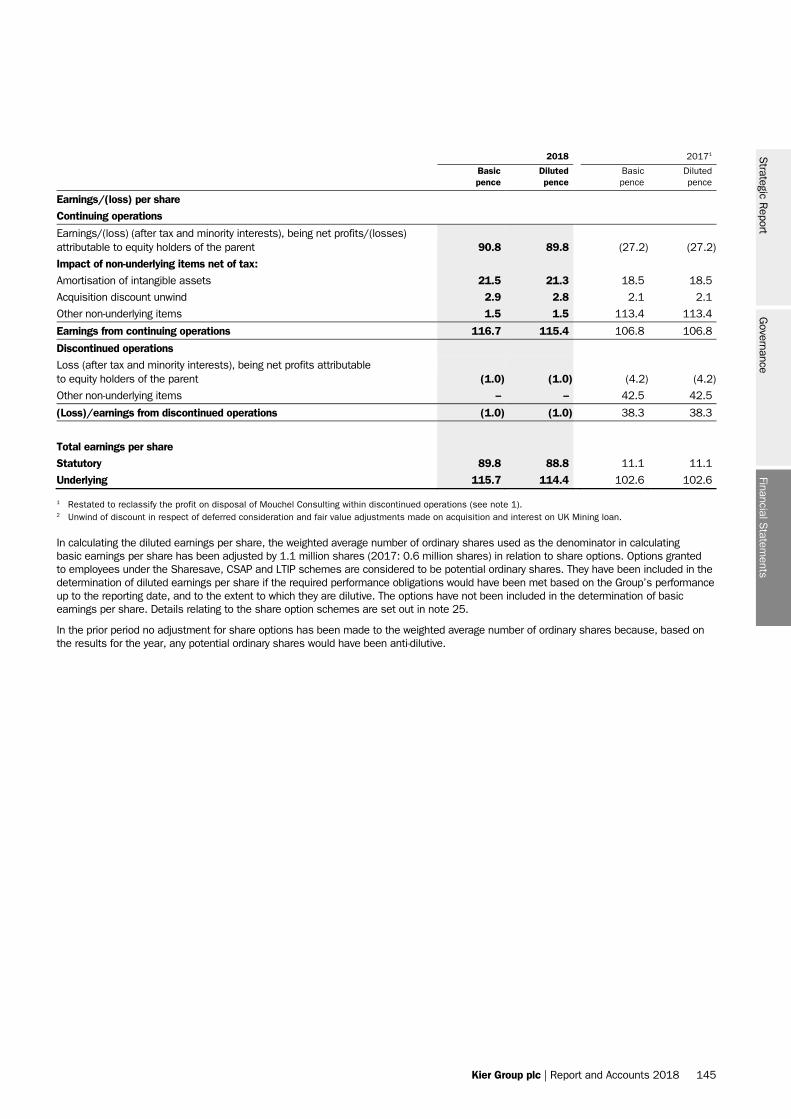
Kier Group plc | Report and Accounts 2018 145
2018 20171
Basic pence
Diluted pence
Basic pence
Diluted pence
Earnings/(loss) per share
Continuing operations
Earnings/(loss) (after tax and minority interests), being net profits/(losses) attributable to equity holders of the parent 90.8 89.8 (27.2) (27.2)
Impact of non-underlying items net of tax:
Amortisation of intangible assets 21.5 21.3 18.5 18.5
Acquisition discount unwind 2.9 2.8 2.1 2.1
Other non-underlying items 1.5 1.5 113.4 113.4
Earnings from continuing operations 116.7 115.4 106.8 106.8
Discontinued operations
Loss (after tax and minority interests), being net profits attributable to equity holders of the parent (1.0) (1.0) (4.2) (4.2)
Other non-underlying items – – 42.5 42.5
(Loss)/earnings from discontinued operations (1.0) (1.0) 38.3 38.3
Total earnings per share
Statutory 89.8 88.8 11.1 11.1
Underlying 115.7 114.4 102.6 102.6
1 Restated to reclassify the profit on disposal of Mouchel Consulting within discontinued operations (see note 1). 2 Unwind of discount in respect of deferred consideration and fair value adjustments made on acquisition and interest on UK Mining loan.
In calculating the diluted earnings per share, the weighted average number of ordinary shares used as the denominator in calculating basic earnings per share has been adjusted by 1.1 million shares (2017: 0.6 million shares) in relation to share options. Options granted to employees under the Sharesave, CSAP and LTIP schemes are considered to be potential ordinary shares. They have been included in the determination of diluted earnings per share if the required performance obligations would have been met based on the Group’s performance up to the reporting date, and to the extent to which they are dilutive. The options have not been included in the determination of basic earnings per share. Details relating to the share option schemes are set out in note 25.
In the prior period no adjustment for share options has been made to the weighted average number of ordinary shares because, based on the results for the year, any potential ordinary shares would have been anti-dilutive.
Financial Statem
entsS
trategic Report
Governance
Kier Group plc | Report and Accounts 2018 145
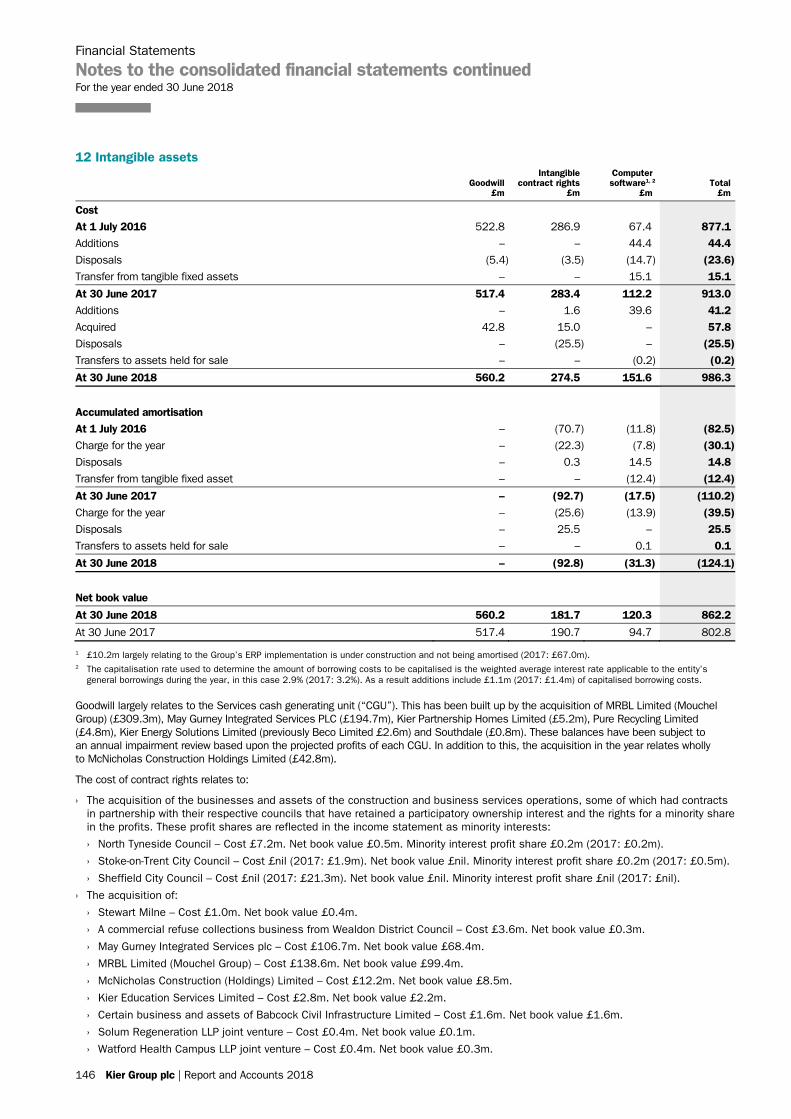
Financial Statements
Notes to the consolidated financial statements continued For the year ended 30 June 2018
146 Kier Group plc | Report and Accounts 2018
12 Intangible assets
Goodwill
£m
Intangible contract rights
£m
Computer software1, 2
£m Total
£m
Cost At 1 July 2016 522.8 286.9 67.4 877.1 Additions – – 44.4 44.4 Disposals (5.4) (3.5) (14.7) (23.6) Transfer from tangible fixed assets – – 15.1 15.1
At 30 June 2017 517.4 283.4 112.2 913.0 Additions – 1.6 39.6 41.2 Acquired 42.8 15.0 – 57.8 Disposals – (25.5) – (25.5) Transfers to assets held for sale – – (0.2) (0.2)
At 30 June 2018 560.2 274.5 151.6 986.3
Accumulated amortisation At 1 July 2016 – (70.7) (11.8) (82.5) Charge for the year – (22.3) (7.8) (30.1) Disposals – 0.3 14.5 14.8 Transfer from tangible fixed asset – – (12.4) (12.4)
At 30 June 2017 – (92.7) (17.5) (110.2) Charge for the year – (25.6) (13.9) (39.5) Disposals – 25.5 – 25.5 Transfers to assets held for sale – – 0.1 0.1
At 30 June 2018 – (92.8) (31.3) (124.1)
Net book value
At 30 June 2018 560.2 181.7 120.3 862.2
At 30 June 2017 517.4 190.7 94.7 802.8
1 £10.2m largely relating to the Group’s ERP implementation is under construction and not being amortised (2017: £67.0m). 2 The capitalisation rate used to determine the amount of borrowing costs to be capitalised is the weighted average interest rate applicable to the entity’s
general borrowings during the year, in this case 2.9% (2017: 3.2%). As a result additions include £1.1m (2017: £1.4m) of capitalised borrowing costs.
Goodwill largely relates to the Services cash generating unit (“CGU”). This has been built up by the acquisition of MRBL Limited (Mouchel Group) (£309.3m), May Gurney Integrated Services PLC (£194.7m), Kier Partnership Homes Limited (£5.2m), Pure Recycling Limited (£4.8m), Kier Energy Solutions Limited (previously Beco Limited £2.6m) and Southdale (£0.8m). These balances have been subject to an annual impairment review based upon the projected profits of each CGU. In addition to this, the acquisition in the year relates wholly to McNicholas Construction Holdings Limited (£42.8m).
The cost of contract rights relates to:
› The acquisition of the businesses and assets of the construction and business services operations, some of which had contracts in partnership with their respective councils that have retained a participatory ownership interest and the rights for a minority share in the profits. These profit shares are reflected in the income statement as minority interests:
› North Tyneside Council – Cost £7.2m. Net book value £0.5m. Minority interest profit share £0.2m (2017: £0.2m).
› Stoke-on-Trent City Council – Cost £nil (2017: £1.9m). Net book value £nil. Minority interest profit share £0.2m (2017: £0.5m).
› Sheffield City Council – Cost £nil (2017: £21.3m). Net book value £nil. Minority interest profit share £nil (2017: £nil).
› The acquisition of:
› Stewart Milne – Cost £1.0m. Net book value £0.4m.
› A commercial refuse collections business from Wealdon District Council – Cost £3.6m. Net book value £0.3m.
› May Gurney Integrated Services plc – Cost £106.7m. Net book value £68.4m.
› MRBL Limited (Mouchel Group) – Cost £138.6m. Net book value £99.4m.
› McNicholas Construction (Holdings) Limited – Cost £12.2m. Net book value £8.5m.
› Kier Education Services Limited – Cost £2.8m. Net book value £2.2m.
› Certain business and assets of Babcock Civil Infrastructure Limited – Cost £1.6m. Net book value £1.6m.
› Solum Regeneration LLP joint venture – Cost £0.4m. Net book value £0.1m.
› Watford Health Campus LLP joint venture – Cost £0.4m. Net book value £0.3m.
146 Kier Group plc | Report and Accounts 2018
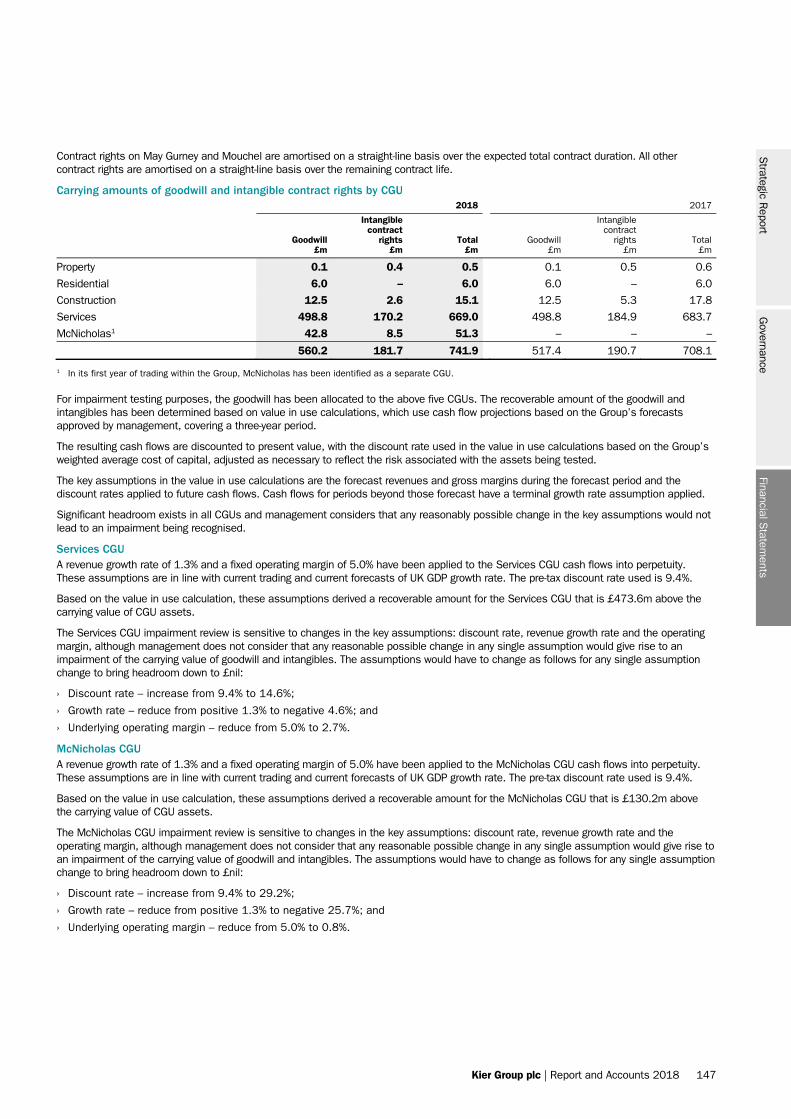
Kier Group plc | Report and Accounts 2018 147
Contract rights on May Gurney and Mouchel are amortised on a straight-line basis over the expected total contract duration. All other contract rights are amortised on a straight-line basis over the remaining contract life.
Carrying amounts of goodwill and intangible contract rights by CGU 2018 2017
Goodwill
£m
Intangible contract
rights £m
Total £m
Goodwill £m
Intangible contract
rights £m
Total £m
Property 0.1 0.4 0.5 0.1 0.5 0.6
Residential 6.0 – 6.0 6.0 – 6.0
Construction 12.5 2.6 15.1 12.5 5.3 17.8
Services 498.8 170.2 669.0 498.8 184.9 683.7
McNicholas1 42.8 8.5 51.3 – – –
560.2 181.7 741.9 517.4 190.7 708.1
1 In its first year of trading within the Group, McNicholas has been identified as a separate CGU.
For impairment testing purposes, the goodwill has been allocated to the above five CGUs. The recoverable amount of the goodwill and intangibles has been determined based on value in use calculations, which use cash flow projections based on the Group’s forecasts approved by management, covering a three-year period.
The resulting cash flows are discounted to present value, with the discount rate used in the value in use calculations based on the Group’s weighted average cost of capital, adjusted as necessary to reflect the risk associated with the assets being tested.
The key assumptions in the value in use calculations are the forecast revenues and gross margins during the forecast period and the discount rates applied to future cash flows. Cash flows for periods beyond those forecast have a terminal growth rate assumption applied.
Significant headroom exists in all CGUs and management considers that any reasonably possible change in the key assumptions would not lead to an impairment being recognised.
Services CGU A revenue growth rate of 1.3% and a fixed operating margin of 5.0% have been applied to the Services CGU cash flows into perpetuity. These assumptions are in line with current trading and current forecasts of UK GDP growth rate. The pre-tax discount rate used is 9.4%.
Based on the value in use calculation, these assumptions derived a recoverable amount for the Services CGU that is £473.6m above the carrying value of CGU assets.
The Services CGU impairment review is sensitive to changes in the key assumptions: discount rate, revenue growth rate and the operating margin, although management does not consider that any reasonable possible change in any single assumption would give rise to an impairment of the carrying value of goodwill and intangibles. The assumptions would have to change as follows for any single assumption change to bring headroom down to £nil:
› Discount rate – increase from 9.4% to 14.6%;
› Growth rate – reduce from positive 1.3% to negative 4.6%; and
› Underlying operating margin – reduce from 5.0% to 2.7%.
McNicholas CGU A revenue growth rate of 1.3% and a fixed operating margin of 5.0% have been applied to the McNicholas CGU cash flows into perpetuity. These assumptions are in line with current trading and current forecasts of UK GDP growth rate. The pre-tax discount rate used is 9.4%.
Based on the value in use calculation, these assumptions derived a recoverable amount for the McNicholas CGU that is £130.2m above the carrying value of CGU assets.
The McNicholas CGU impairment review is sensitive to changes in the key assumptions: discount rate, revenue growth rate and the operating margin, although management does not consider that any reasonable possible change in any single assumption would give rise to an impairment of the carrying value of goodwill and intangibles. The assumptions would have to change as follows for any single assumption change to bring headroom down to £nil:
› Discount rate – increase from 9.4% to 29.2%;
› Growth rate – reduce from positive 1.3% to negative 25.7%; and
› Underlying operating margin – reduce from 5.0% to 0.8%.
Financial Statem
entsS
trategic Report
Governance
Kier Group plc | Report and Accounts 2018 147
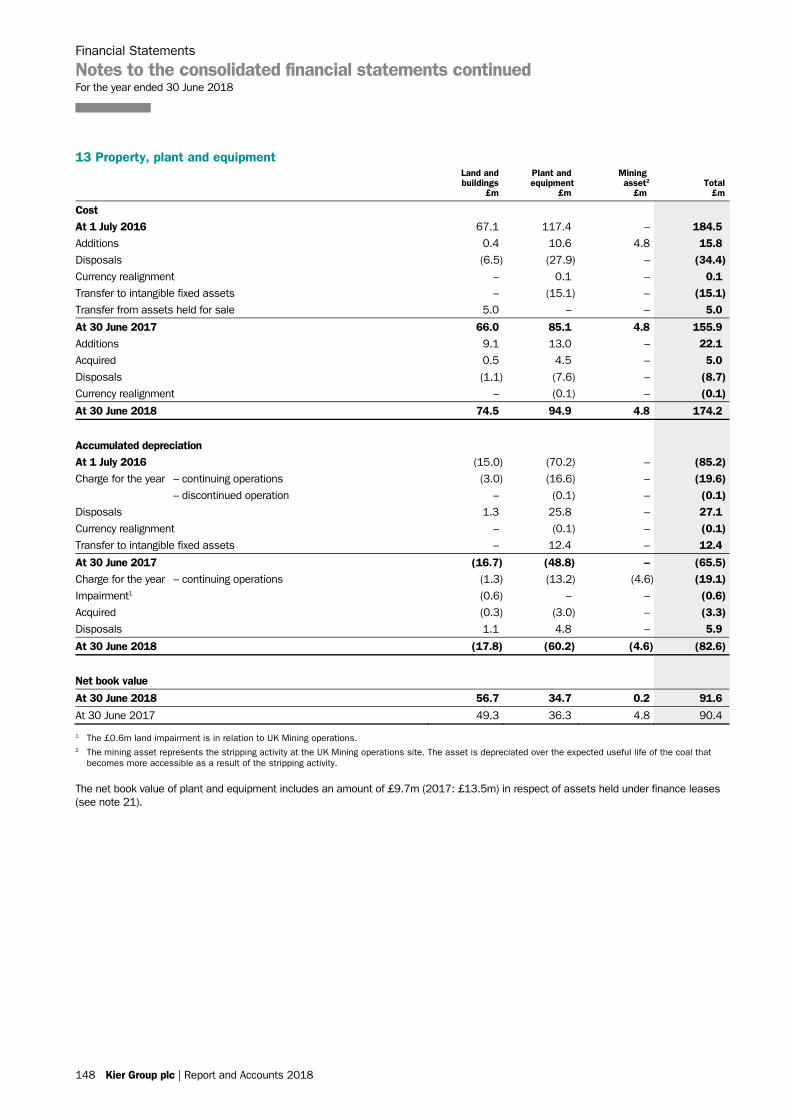
Financial Statements
Notes to the consolidated financial statements continued For the year ended 30 June 2018
148 Kier Group plc | Report and Accounts 2018
13 Property, plant and equipment
Land and buildings
£m
Plant and equipment
£m
Mining asset2
£m Total
£m
Cost At 1 July 2016 67.1 117.4 – 184.5 Additions 0.4 10.6 4.8 15.8 Disposals (6.5) (27.9) – (34.4) Currency realignment – 0.1 – 0.1 Transfer to intangible fixed assets – (15.1) – (15.1) Transfer from assets held for sale 5.0 – – 5.0
At 30 June 2017 66.0 85.1 4.8 155.9 Additions 9.1 13.0 – 22.1 Acquired 0.5 4.5 – 5.0 Disposals (1.1) (7.6) – (8.7) Currency realignment – (0.1) – (0.1)
At 30 June 2018 74.5 94.9 4.8 174.2
Accumulated depreciation At 1 July 2016 (15.0) (70.2) – (85.2) Charge for the year – continuing operations (3.0) (16.6) – (19.6) – discontinued operation – (0.1) – (0.1) Disposals 1.3 25.8 – 27.1 Currency realignment – (0.1) – (0.1) Transfer to intangible fixed assets – 12.4 – 12.4
At 30 June 2017 (16.7) (48.8) – (65.5) Charge for the year – continuing operations (1.3) (13.2) (4.6) (19.1) Impairment1 (0.6) – – (0.6) Acquired (0.3) (3.0) – (3.3) Disposals 1.1 4.8 – 5.9
At 30 June 2018 (17.8) (60.2) (4.6) (82.6)
Net book value
At 30 June 2018 56.7 34.7 0.2 91.6
At 30 June 2017 49.3 36.3 4.8 90.4
1 The £0.6m land impairment is in relation to UK Mining operations. 2 The mining asset represents the stripping activity at the UK Mining operations site. The asset is depreciated over the expected useful life of the coal that
becomes more accessible as a result of the stripping activity.
The net book value of plant and equipment includes an amount of £9.7m (2017: £13.5m) in respect of assets held under finance leases (see note 21).
148 Kier Group plc | Report and Accounts 2018
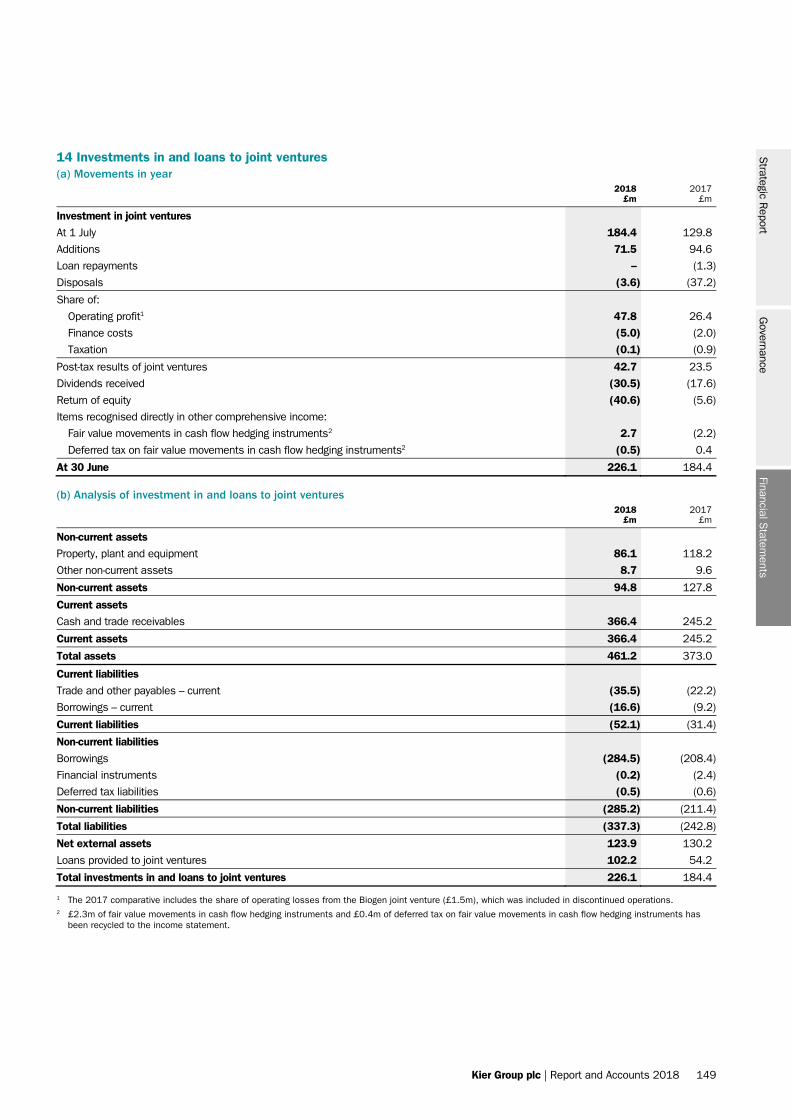
Kier Group plc | Report and Accounts 2018 149
14 Investments in and loans to joint ventures (a) Movements in year
2018
£m 2017
£m
Investment in joint ventures
At 1 July 184.4 129.8
Additions 71.5 94.6
Loan repayments – (1.3)
Disposals (3.6) (37.2)
Share of:
Operating profit1 47.8 26.4
Finance costs (5.0) (2.0)
Taxation (0.1) (0.9)
Post-tax results of joint ventures 42.7 23.5
Dividends received (30.5) (17.6)
Return of equity (40.6) (5.6)
Items recognised directly in other comprehensive income:
Fair value movements in cash flow hedging instruments2 2.7 (2.2)
Deferred tax on fair value movements in cash flow hedging instruments2 (0.5) 0.4
At 30 June 226.1 184.4
(b) Analysis of investment in and loans to joint ventures
2018
£m 2017
£m
Non-current assets
Property, plant and equipment 86.1 118.2
Other non-current assets 8.7 9.6
Non-current assets 94.8 127.8
Current assets
Cash and trade receivables 366.4 245.2
Current assets 366.4 245.2
Total assets 461.2 373.0
Current liabilities
Trade and other payables – current (35.5) (22.2)
Borrowings – current (16.6) (9.2)
Current liabilities (52.1) (31.4)
Non-current liabilities
Borrowings (284.5) (208.4)
Financial instruments (0.2) (2.4)
Deferred tax liabilities (0.5) (0.6)
Non-current liabilities (285.2) (211.4)
Total liabilities (337.3) (242.8)
Net external assets 123.9 130.2
Loans provided to joint ventures 102.2 54.2
Total investments in and loans to joint ventures 226.1 184.4
1 The 2017 comparative includes the share of operating losses from the Biogen joint venture (£1.5m), which was included in discontinued operations. 2 £2.3m of fair value movements in cash flow hedging instruments and £0.4m of deferred tax on fair value movements in cash flow hedging instruments has
been recycled to the income statement.
Financial Statem
entsS
trategic Report
Governance
Kier Group plc | Report and Accounts 2018 149
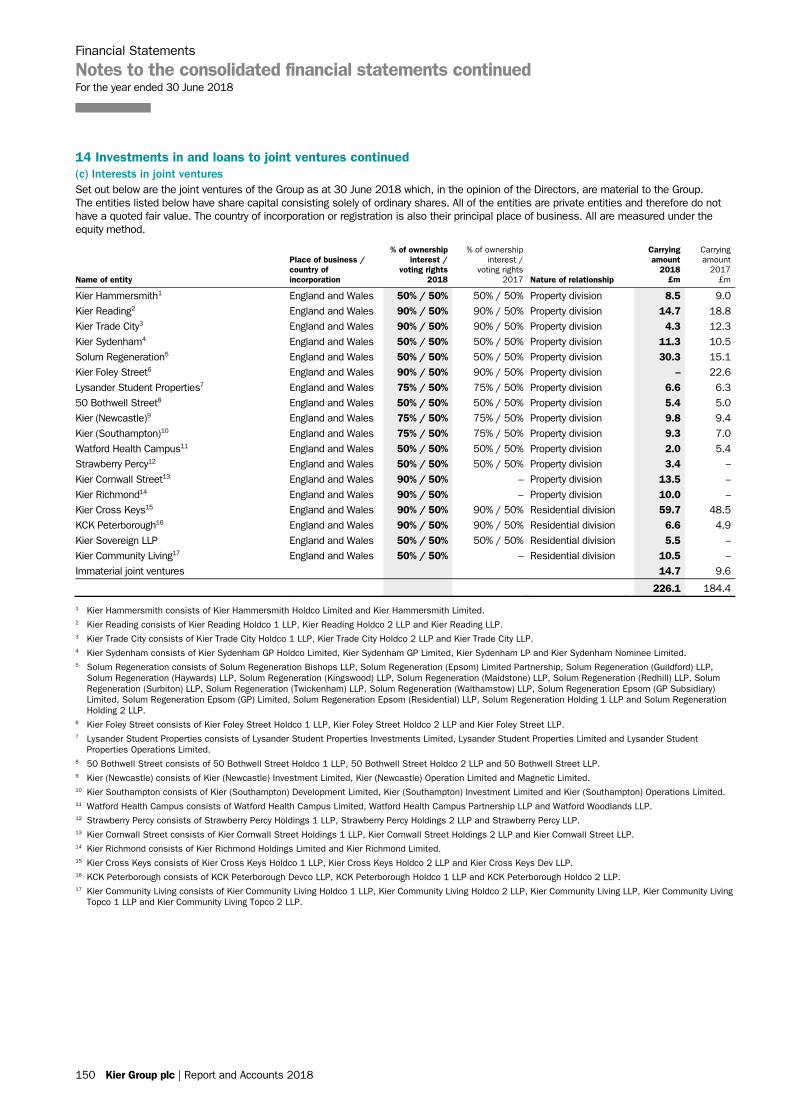
Financial Statements
Notes to the consolidated financial statements continued For the year ended 30 June 2018
150 Kier Group plc | Report and Accounts 2018
14 Investments in and loans to joint ventures continued (c) Interests in joint ventures Set out below are the joint ventures of the Group as at 30 June 2018 which, in the opinion of the Directors, are material to the Group. The entities listed below have share capital consisting solely of ordinary shares. All of the entities are private entities and therefore do not have a quoted fair value. The country of incorporation or registration is also their principal place of business. All are measured under the equity method.
Name of entity
Place of business / country of incorporation
% of ownership interest /
voting rights 2018
% of ownership interest /
voting rights 2017 Nature of relationship
Carrying amount
2018 £m
Carrying amount
2017 £m
Kier Hammersmith1 England and Wales 50% / 50% 50% / 50% Property division 8.5 9.0 Kier Reading2 England and Wales 90% / 50% 90% / 50% Property division 14.7 18.8 Kier Trade City3 England and Wales 90% / 50% 90% / 50% Property division 4.3 12.3 Kier Sydenham4 England and Wales 50% / 50% 50% / 50% Property division 11.3 10.5 Solum Regeneration5 England and Wales 50% / 50% 50% / 50% Property division 30.3 15.1 Kier Foley Street6 England and Wales 90% / 50% 90% / 50% Property division – 22.6 Lysander Student Properties7 England and Wales 75% / 50% 75% / 50% Property division 6.6 6.3 50 Bothwell Street8 England and Wales 50% / 50% 50% / 50% Property division 5.4 5.0 Kier (Newcastle)9 England and Wales 75% / 50% 75% / 50% Property division 9.8 9.4 Kier (Southampton)10 England and Wales 75% / 50% 75% / 50% Property division 9.3 7.0 Watford Health Campus11 England and Wales 50% / 50% 50% / 50% Property division 2.0 5.4 Strawberry Percy12 England and Wales 50% / 50% 50% / 50% Property division 3.4 – Kier Cornwall Street13 England and Wales 90% / 50% – Property division 13.5 – Kier Richmond14 England and Wales 90% / 50% – Property division 10.0 – Kier Cross Keys15 England and Wales 90% / 50% 90% / 50% Residential division 59.7 48.5 KCK Peterborough16 England and Wales 90% / 50% 90% / 50% Residential division 6.6 4.9 Kier Sovereign LLP England and Wales 50% / 50% 50% / 50% Residential division 5.5 – Kier Community Living17 England and Wales 50% / 50% – Residential division 10.5 – Immaterial joint ventures 14.7 9.6
226.1 184.4
1 Kier Hammersmith consists of Kier Hammersmith Holdco Limited and Kier Hammersmith Limited. 2 Kier Reading consists of Kier Reading Holdco 1 LLP, Kier Reading Holdco 2 LLP and Kier Reading LLP. 3 Kier Trade City consists of Kier Trade City Holdco 1 LLP, Kier Trade City Holdco 2 LLP and Kier Trade City LLP. 4 Kier Sydenham consists of Kier Sydenham GP Holdco Limited, Kier Sydenham GP Limited, Kier Sydenham LP and Kier Sydenham Nominee Limited. 5 Solum Regeneration consists of Solum Regeneration Bishops LLP, Solum Regeneration (Epsom) Limited Partnership, Solum Regeneration (Guildford) LLP,
Solum Regeneration (Haywards) LLP, Solum Regeneration (Kingswood) LLP, Solum Regeneration (Maidstone) LLP, Solum Regeneration (Redhill) LLP, Solum Regeneration (Surbiton) LLP, Solum Regeneration (Twickenham) LLP, Solum Regeneration (Walthamstow) LLP, Solum Regeneration Epsom (GP Subsidiary) Limited, Solum Regeneration Epsom (GP) Limited, Solum Regeneration Epsom (Residential) LLP, Solum Regeneration Holding 1 LLP and Solum Regeneration Holding 2 LLP.
6 Kier Foley Street consists of Kier Foley Street Holdco 1 LLP, Kier Foley Street Holdco 2 LLP and Kier Foley Street LLP. 7 Lysander Student Properties consists of Lysander Student Properties Investments Limited, Lysander Student Properties Limited and Lysander Student
Properties Operations Limited. 8 50 Bothwell Street consists of 50 Bothwell Street Holdco 1 LLP, 50 Bothwell Street Holdco 2 LLP and 50 Bothwell Street LLP. 9 Kier (Newcastle) consists of Kier (Newcastle) Investment Limited, Kier (Newcastle) Operation Limited and Magnetic Limited. 10 Kier Southampton consists of Kier (Southampton) Development Limited, Kier (Southampton) Investment Limited and Kier (Southampton) Operations Limited. 11 Watford Health Campus consists of Watford Health Campus Limited, Watford Health Campus Partnership LLP and Watford Woodlands LLP. 12 Strawberry Percy consists of Strawberry Percy Holdings 1 LLP, Strawberry Percy Holdings 2 LLP and Strawberry Percy LLP. 13 Kier Cornwall Street consists of Kier Cornwall Street Holdings 1 LLP, Kier Cornwall Street Holdings 2 LLP and Kier Cornwall Street LLP. 14 Kier Richmond consists of Kier Richmond Holdings Limited and Kier Richmond Limited. 15 Kier Cross Keys consists of Kier Cross Keys Holdco 1 LLP, Kier Cross Keys Holdco 2 LLP and Kier Cross Keys Dev LLP. 16 KCK Peterborough consists of KCK Peterborough Devco LLP, KCK Peterborough Holdco 1 LLP and KCK Peterborough Holdco 2 LLP. 17 Kier Community Living consists of Kier Community Living Holdco 1 LLP, Kier Community Living Holdco 2 LLP, Kier Community Living LLP, Kier Community Living
Topco 1 LLP and Kier Community Living Topco 2 LLP.
150 Kier Group plc | Report and Accounts 2018
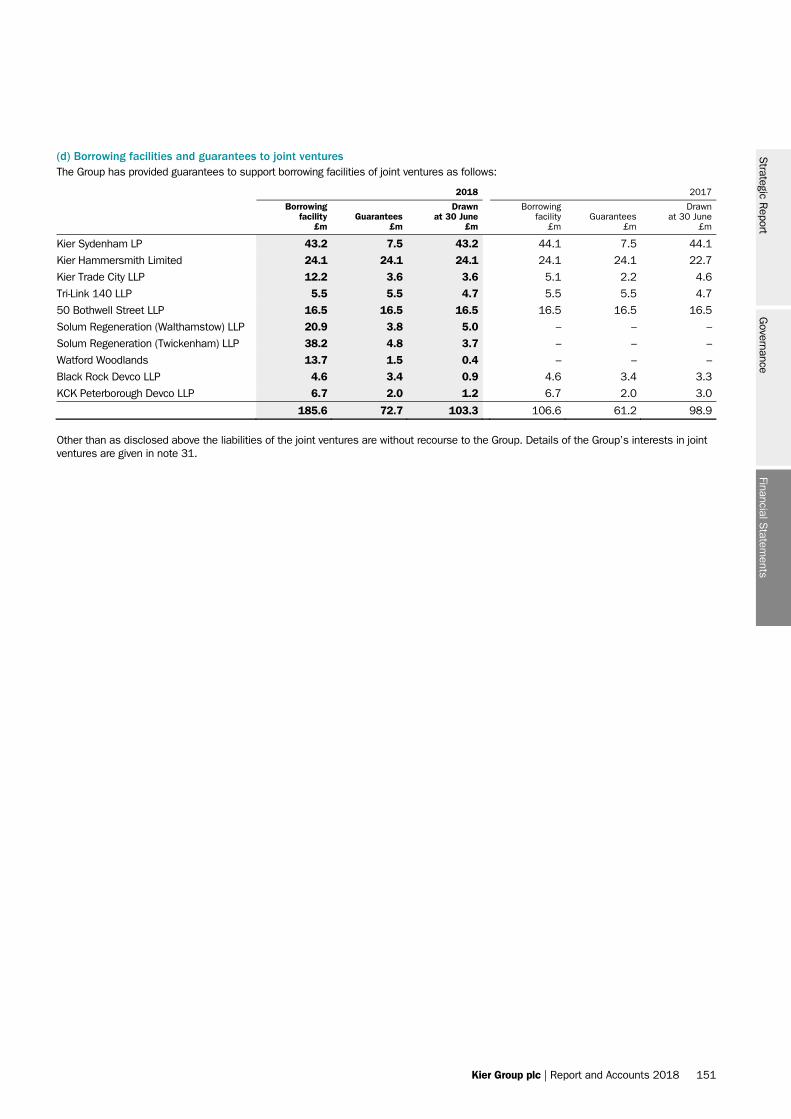
Kier Group plc | Report and Accounts 2018 151
(d) Borrowing facilities and guarantees to joint ventures The Group has provided guarantees to support borrowing facilities of joint ventures as follows:
2018 2017
Borrowing facility
£m Guarantees
£m
Drawn at 30 June
£m
Borrowing facility
£m Guarantees
£m
Drawn at 30 June
£m
Kier Sydenham LP 43.2 7.5 43.2 44.1 7.5 44.1
Kier Hammersmith Limited 24.1 24.1 24.1 24.1 24.1 22.7
Kier Trade City LLP 12.2 3.6 3.6 5.1 2.2 4.6
Tri-Link 140 LLP 5.5 5.5 4.7 5.5 5.5 4.7
50 Bothwell Street LLP 16.5 16.5 16.5 16.5 16.5 16.5
Solum Regeneration (Walthamstow) LLP 20.9 3.8 5.0 – – –
Solum Regeneration (Twickenham) LLP 38.2 4.8 3.7 – – –
Watford Woodlands 13.7 1.5 0.4 – – –
Black Rock Devco LLP 4.6 3.4 0.9 4.6 3.4 3.3
KCK Peterborough Devco LLP 6.7 2.0 1.2 6.7 2.0 3.0
185.6 72.7 103.3 106.6 61.2 98.9
Other than as disclosed above the liabilities of the joint ventures are without recourse to the Group. Details of the Group’s interests in joint ventures are given in note 31.
Financial Statem
entsS
trategic Report
Governance
Kier Group plc | Report and Accounts 2018 151
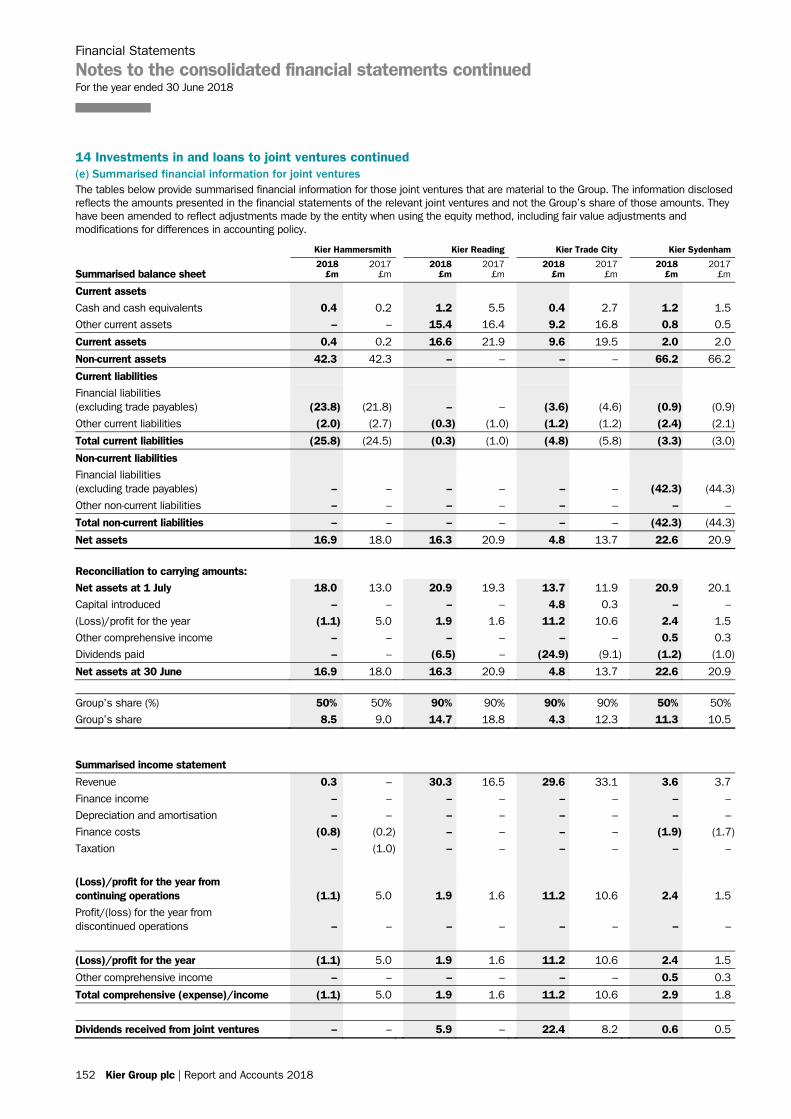
Financial Statements
Notes to the consolidated financial statements continued For the year ended 30 June 2018
152 Kier Group plc | Report and Accounts 2018
14 Investments in and loans to joint ventures continued (e) Summarised financial information for joint ventures The tables below provide summarised financial information for those joint ventures that are material to the Group. The information disclosed reflects the amounts presented in the financial statements of the relevant joint ventures and not the Group’s share of those amounts. They have been amended to reflect adjustments made by the entity when using the equity method, including fair value adjustments and modifications for differences in accounting policy.
Kier Hammersmith Kier Reading Kier Trade City Kier Sydenham
Summarised balance sheet 2018
£m 2017
£m 2018
£m 2017
£m 2018
£m 2017
£m 2018
£m 2017
£m
Current assets Cash and cash equivalents 0.4 0.2 1.2 5.5 0.4 2.7 1.2 1.5
Other current assets – – 15.4 16.4 9.2 16.8 0.8 0.5
Current assets 0.4 0.2 16.6 21.9 9.6 19.5 2.0 2.0
Non-current assets 42.3 42.3 – – – – 66.2 66.2
Current liabilities Financial liabilities (excluding trade payables) (23.8) (21.8) – – (3.6) (4.6) (0.9) (0.9)
Other current liabilities (2.0) (2.7) (0.3) (1.0) (1.2) (1.2) (2.4) (2.1)
Total current liabilities (25.8) (24.5) (0.3) (1.0) (4.8) (5.8) (3.3) (3.0)
Non-current liabilities Financial liabilities (excluding trade payables) – – – – – – (42.3) (44.3)
Other non-current liabilities – – – – – – – –
Total non-current liabilities – – – – – – (42.3) (44.3)
Net assets 16.9 18.0 16.3 20.9 4.8 13.7 22.6 20.9 Reconciliation to carrying amounts: Net assets at 1 July 18.0 13.0 20.9 19.3 13.7 11.9 20.9 20.1
Capital introduced – – – – 4.8 0.3 – –
(Loss)/profit for the year (1.1) 5.0 1.9 1.6 11.2 10.6 2.4 1.5
Other comprehensive income – – – – – – 0.5 0.3
Dividends paid – – (6.5) – (24.9) (9.1) (1.2) (1.0)
Net assets at 30 June 16.9 18.0 16.3 20.9 4.8 13.7 22.6 20.9 Group’s share (%) 50% 50% 90% 90% 90% 90% 50% 50%
Group’s share 8.5 9.0 14.7 18.8 4.3 12.3 11.3 10.5
Summarised income statement
Revenue 0.3 – 30.3 16.5 29.6 33.1 3.6 3.7
Finance income – – – – – – – –
Depreciation and amortisation – – – – – – – –
Finance costs (0.8) (0.2) – – – – (1.9) (1.7)
Taxation – (1.0) – – – – – –
(Loss)/profit for the year from continuing operations (1.1) 5.0 1.9 1.6 11.2 10.6 2.4 1.5
Profit/(loss) for the year from discontinued operations – – – – – –
– –
(Loss)/profit for the year (1.1) 5.0 1.9 1.6 11.2 10.6 2.4 1.5
Other comprehensive income – – – – – – 0.5 0.3
Total comprehensive (expense)/income (1.1) 5.0 1.9 1.6 11.2 10.6 2.9 1.8
Dividends received from joint ventures – – 5.9 – 22.4 8.2 0.6 0.5
152 Kier Group plc | Report and Accounts 2018
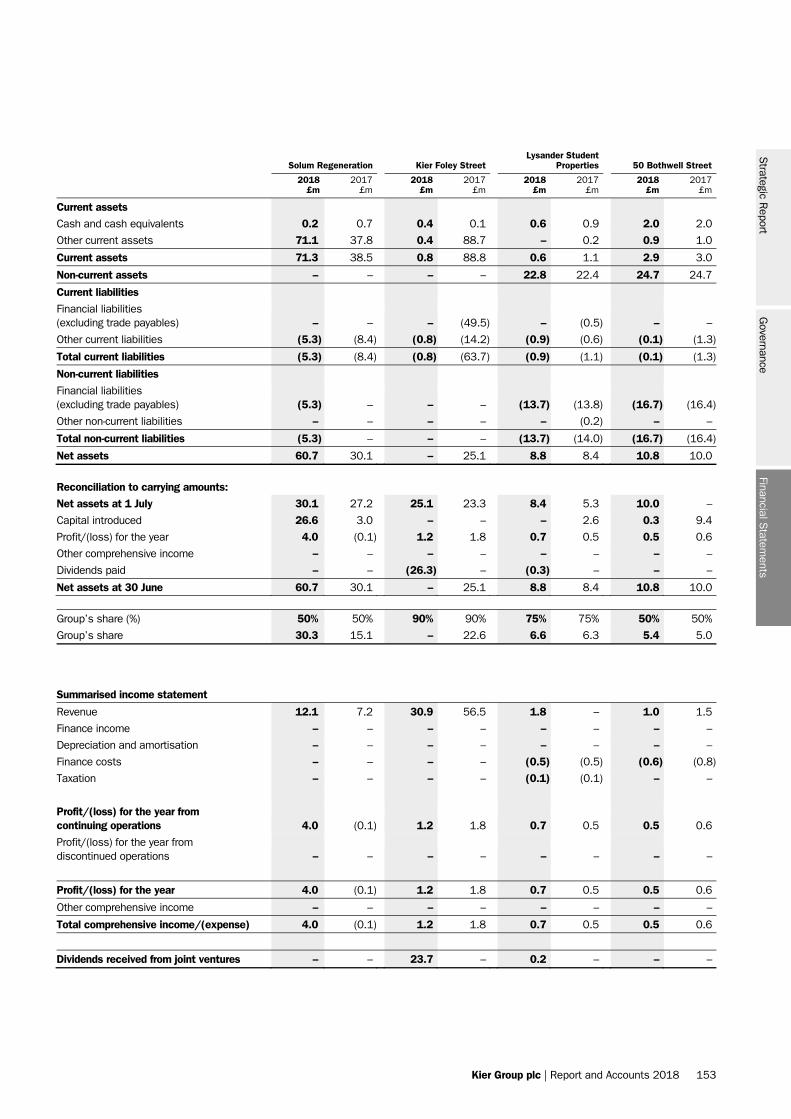
Kier Group plc | Report and Accounts 2018 153
Solum Regeneration Kier Foley Street Lysander Student
Properties 50 Bothwell Street
2018
£m 2017
£m 2018
£m 2017
£m 2018
£m 2017
£m 2018
£m 2017
£m
Current assets Cash and cash equivalents 0.2 0.7 0.4 0.1 0.6 0.9 2.0 2.0
Other current assets 71.1 37.8 0.4 88.7 – 0.2 0.9 1.0
Current assets 71.3 38.5 0.8 88.8 0.6 1.1 2.9 3.0
Non-current assets – – – – 22.8 22.4 24.7 24.7
Current liabilities Financial liabilities (excluding trade payables) – – – (49.5) – (0.5) – –
Other current liabilities (5.3) (8.4) (0.8) (14.2) (0.9) (0.6) (0.1) (1.3)
Total current liabilities (5.3) (8.4) (0.8) (63.7) (0.9) (1.1) (0.1) (1.3)
Non-current liabilities Financial liabilities (excluding trade payables) (5.3) – – – (13.7) (13.8) (16.7) (16.4)
Other non-current liabilities – – – – – (0.2) – –
Total non-current liabilities (5.3) – – – (13.7) (14.0) (16.7) (16.4)
Net assets 60.7 30.1 – 25.1 8.8 8.4 10.8 10.0 Reconciliation to carrying amounts: Net assets at 1 July 30.1 27.2 25.1 23.3 8.4 5.3 10.0 –
Capital introduced 26.6 3.0 – – – 2.6 0.3 9.4
Profit/(loss) for the year 4.0 (0.1) 1.2 1.8 0.7 0.5 0.5 0.6
Other comprehensive income – – – – – – – –
Dividends paid – – (26.3) – (0.3) – – –
Net assets at 30 June 60.7 30.1 – 25.1 8.8 8.4 10.8 10.0 Group’s share (%) 50% 50% 90% 90% 75% 75% 50% 50%
Group’s share 30.3 15.1 – 22.6 6.6 6.3 5.4 5.0
Summarised income statement
Revenue 12.1 7.2 30.9 56.5 1.8 – 1.0 1.5
Finance income – – – – – – – –
Depreciation and amortisation – – – – – – – –
Finance costs – – – – (0.5) (0.5) (0.6) (0.8)
Taxation – – – – (0.1) (0.1) – –
Profit/(loss) for the year from continuing operations 4.0 (0.1) 1.2 1.8 0.7 0.5 0.5 0.6
Profit/(loss) for the year from discontinued operations – – – – – – – –
Profit/(loss) for the year 4.0 (0.1) 1.2 1.8 0.7 0.5 0.5 0.6
Other comprehensive income – – – – – – – –
Total comprehensive income/(expense) 4.0 (0.1) 1.2 1.8 0.7 0.5 0.5 0.6
Dividends received from joint ventures – – 23.7 – 0.2 – – –
Financial Statem
entsS
trategic Report
Governance
Kier Group plc | Report and Accounts 2018 153

Financial Statements
Notes to the consolidated financial statements continued For the year ended 30 June 2018
154 Kier Group plc | Report and Accounts 2018
14 Investments in and loans to joint ventures continued Kier (Newcastle) Kier (Southampton) Watford Health Campus Strawberry Percy
2018
£m 2017
£m 2018
£m 2017
£m 2018
£m 2017
£m 2018
£m 2017
£m
Current assets Cash and cash equivalents 0.2 0.1 0.2 – 1.4 1.5 0.6 –
Other current assets 30.4 27.0 27.3 9.5 25.8 0.7 13.3 –
Current assets 30.6 27.1 27.5 9.5 27.2 2.2 13.9 –
Non-current assets – – – – – 21.6 – –
Current liabilities Financial liabilities (excluding trade payables) (16.9) (13.2) – – – – – –
Other current liabilities (0.7) (1.4) (1.0) (0.2) (16.7) (0.6) (0.5) –
Total current liabilities (17.6) (14.6) (1.0) (0.2) (16.7) (0.6) (0.5) –
Non-current liabilities Financial liabilities (excluding trade payables) – – (14.0) – (6.4) (12.3) (6.5) –
Other non-current liabilities – – – – – – – –
Total non-current liabilities – – (14.0) – (6.4) (12.3) (6.5) –
Net assets 13.0 12.5 12.5 9.3 4.1 10.9 6.9 – Reconciliation to carrying amounts: Net assets at 1 July 12.5 8.6 9.3 – 10.9 2.3 – –
Capital introduced 0.3 3.9 3.2 9.2 9.5 8.7 6.6 –
Profit/(loss) for the year 0.2 – – 0.1 14.5 (0.1) 0.3 –
Other comprehensive income – – – – – – – –
Dividends paid – – – – (30.8) – – –
Net assets at 30 June 13.0 12.5 12.5 9.3 4.1 10.9 6.9 – Group’s share (%) 75% 75% 75% 75% 50% 50% 50% 50%
Group’s share 9.8 9.4 9.3 7.0 2.0 5.4 3.4 –
Summarised income statement
Revenue 31.5 – – – 38.3 – 0.7 –
Finance income – – – – – – – –
Depreciation and amortisation – – – – – – – –
Finance costs (0.7) – – – – – (0.1) –
Taxation – – – – – – – –
Profit/(loss) for the year from continuing operations 0.2 – – 0.1 14.5 (0.1) 0.3 –
Profit/(loss) for the year from discontinued operations – – – – – –
– –
Profit/(loss) for the year 0.2 – – 0.1 14.5 (0.1) 0.3 –
Other comprehensive income – – – – – – – –
Total comprehensive income/(expense) 0.2 – – 0.1 14.5 (0.1) 0.3 –
Dividends received from joint ventures – – – – 15.4 – – –
154 Kier Group plc | Report and Accounts 2018
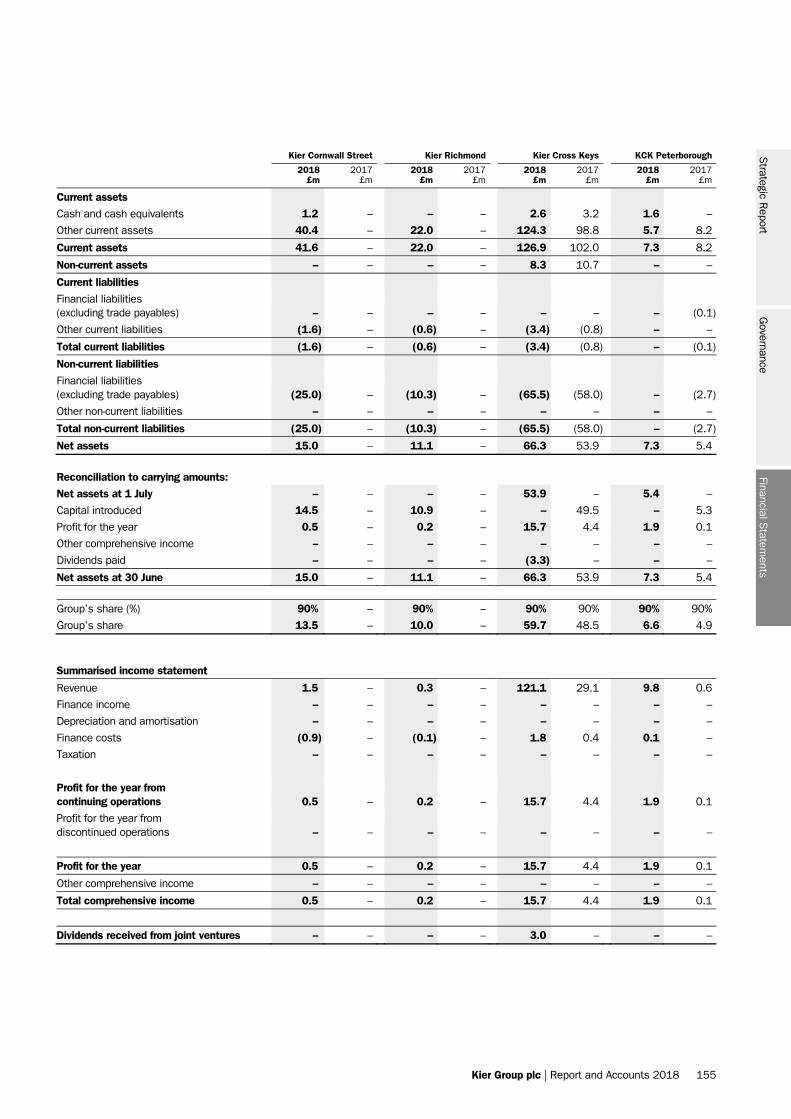
Kier Group plc | Report and Accounts 2018 155
Kier Cornwall Street Kier Richmond Kier Cross Keys KCK Peterborough
2018
£m 2017
£m 2018
£m 2017
£m 2018
£m 2017
£m 2018
£m 2017
£m
Current assets Cash and cash equivalents 1.2 – – – 2.6 3.2 1.6 –
Other current assets 40.4 – 22.0 – 124.3 98.8 5.7 8.2
Current assets 41.6 – 22.0 – 126.9 102.0 7.3 8.2
Non-current assets – – – – 8.3 10.7 – –
Current liabilities Financial liabilities (excluding trade payables) – – – – – – – (0.1)
Other current liabilities (1.6) – (0.6) – (3.4) (0.8) – –
Total current liabilities (1.6) – (0.6) – (3.4) (0.8) – (0.1)
Non-current liabilities Financial liabilities (excluding trade payables) (25.0) – (10.3) – (65.5) (58.0) – (2.7)
Other non-current liabilities – – – – – – – –
Total non-current liabilities (25.0) – (10.3) – (65.5) (58.0) – (2.7)
Net assets 15.0 – 11.1 – 66.3 53.9 7.3 5.4 Reconciliation to carrying amounts: Net assets at 1 July – – – – 53.9 – 5.4 –
Capital introduced 14.5 – 10.9 – – 49.5 – 5.3
Profit for the year 0.5 – 0.2 – 15.7 4.4 1.9 0.1
Other comprehensive income – – – – – – – –
Dividends paid – – – – (3.3) – – –
Net assets at 30 June 15.0 – 11.1 – 66.3 53.9 7.3 5.4 Group’s share (%) 90% – 90% – 90% 90% 90% 90%
Group’s share 13.5 – 10.0 – 59.7 48.5 6.6 4.9
Summarised income statement
Revenue 1.5 – 0.3 – 121.1 29.1 9.8 0.6
Finance income – – – – – – – –
Depreciation and amortisation – – – – – – – –
Finance costs (0.9) – (0.1) – 1.8 0.4 0.1 –
Taxation – – – – – – – –
Profit for the year from continuing operations 0.5 – 0.2 – 15.7 4.4 1.9 0.1
Profit for the year from discontinued operations – – – – – –
– –
Profit for the year 0.5 – 0.2 – 15.7 4.4 1.9 0.1
Other comprehensive income – – – – – – – –
Total comprehensive income 0.5 – 0.2 – 15.7 4.4 1.9 0.1
Dividends received from joint ventures – – – – 3.0 – – –
Financial Statem
entsS
trategic Report
Governance
Kier Group plc | Report and Accounts 2018 155
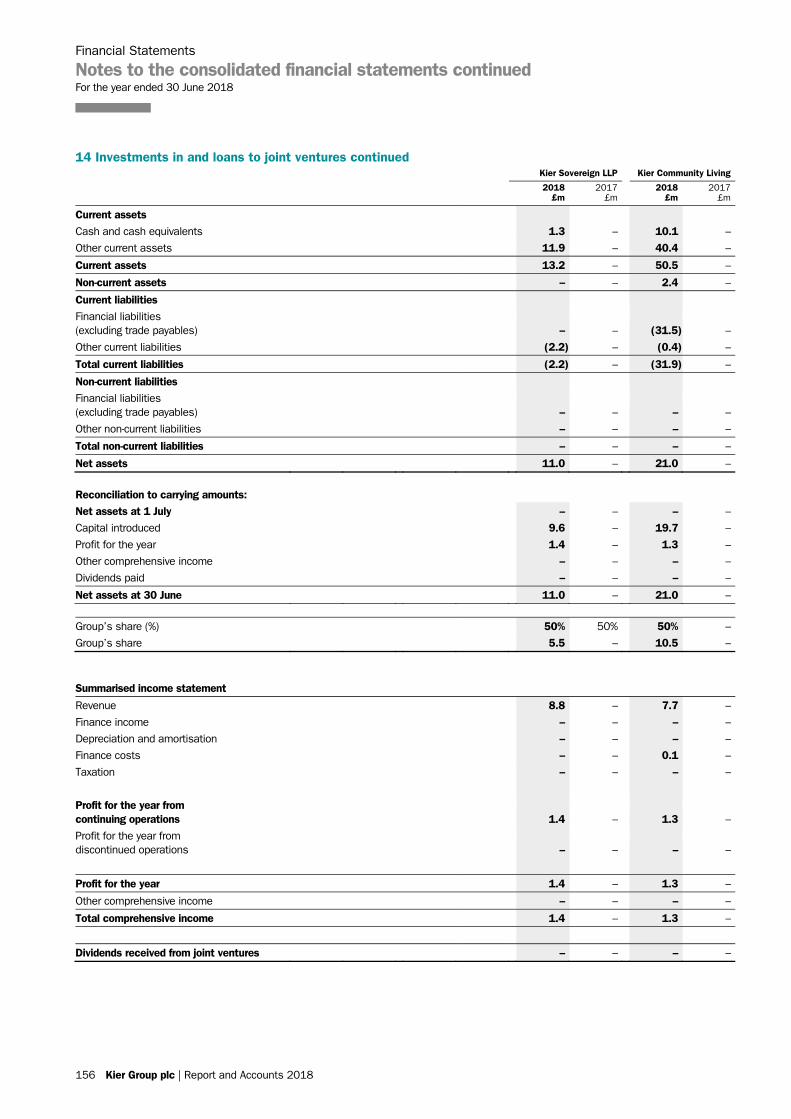
Financial Statements
Notes to the consolidated financial statements continued For the year ended 30 June 2018
156 Kier Group plc | Report and Accounts 2018
14 Investments in and loans to joint ventures continued Kier Sovereign LLP Kier Community Living
2018
£m 2017
£m 2018
£m 2017
£m
Current assets Cash and cash equivalents 1.3 – 10.1 –
Other current assets 11.9 – 40.4 –
Current assets 13.2 – 50.5 –
Non-current assets – – 2.4 –
Current liabilities
Financial liabilities (excluding trade payables) – – (31.5) –
Other current liabilities (2.2) – (0.4) –
Total current liabilities (2.2) – (31.9) –
Non-current liabilities
Financial liabilities (excluding trade payables) – – – –
Other non-current liabilities – – – –
Total non-current liabilities – – – –
Net assets 11.0 – 21.0 – Reconciliation to carrying amounts: Net assets at 1 July – – – –
Capital introduced 9.6 – 19.7 –
Profit for the year 1.4 – 1.3 –
Other comprehensive income – – – –
Dividends paid – – – –
Net assets at 30 June 11.0 – 21.0 – Group’s share (%) 50% 50% 50% –
Group’s share 5.5 – 10.5 –
Summarised income statement
Revenue 8.8 – 7.7 –
Finance income – – – –
Depreciation and amortisation – – – –
Finance costs – – 0.1 –
Taxation – – – –
Profit for the year from continuing operations 1.4 – 1.3 –
Profit for the year from discontinued operations – – – –
Profit for the year 1.4 – 1.3 –
Other comprehensive income – – – –
Total comprehensive income 1.4 – 1.3 –
Dividends received from joint ventures – – – –
156 Kier Group plc | Report and Accounts 2018
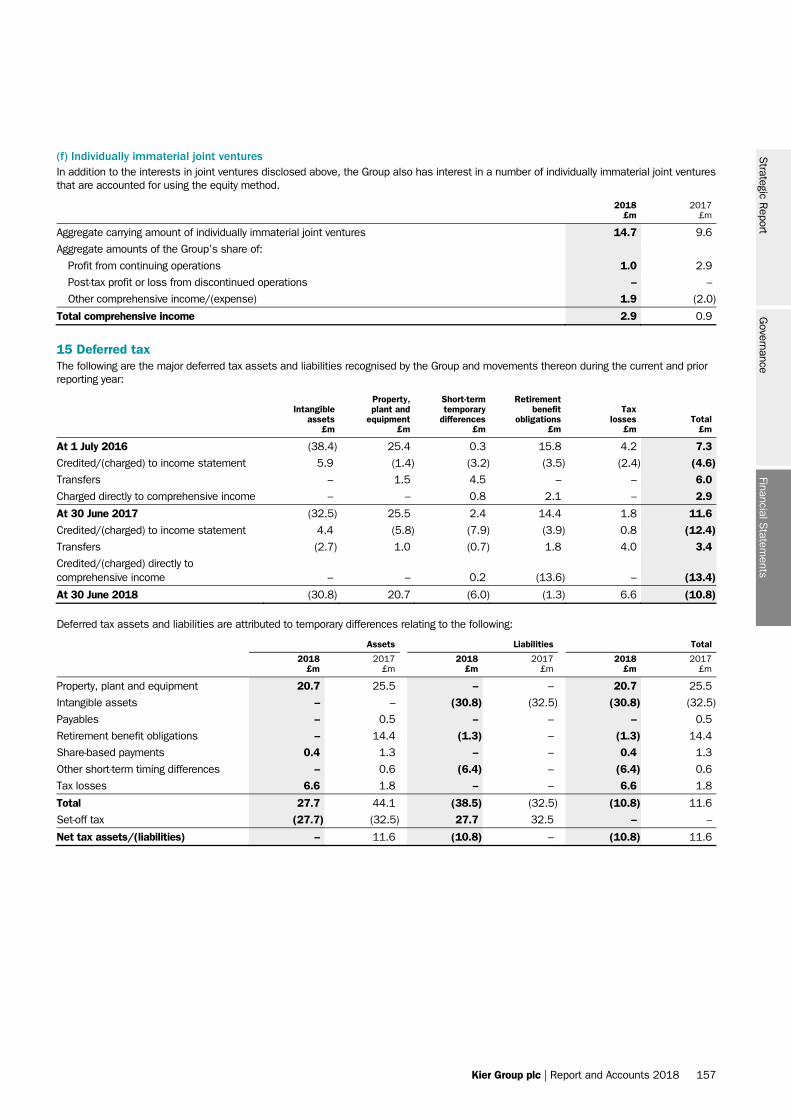
Kier Group plc | Report and Accounts 2018 157
(f) Individually immaterial joint ventures In addition to the interests in joint ventures disclosed above, the Group also has interest in a number of individually immaterial joint ventures that are accounted for using the equity method.
2018
£m 2017
£m
Aggregate carrying amount of individually immaterial joint ventures 14.7 9.6
Aggregate amounts of the Group’s share of:
Profit from continuing operations 1.0 2.9
Post-tax profit or loss from discontinued operations – –
Other comprehensive income/(expense) 1.9 (2.0)
Total comprehensive income 2.9 0.9
15 Deferred tax The following are the major deferred tax assets and liabilities recognised by the Group and movements thereon during the current and prior reporting year:
Intangible assets
£m
Property, plant and
equipment £m
Short-term temporary
differences £m
Retirement benefit
obligations £m
Tax losses
£m Total
£m
At 1 July 2016 (38.4) 25.4 0.3 15.8 4.2 7.3 Credited/(charged) to income statement 5.9 (1.4) (3.2) (3.5) (2.4) (4.6) Transfers – 1.5 4.5 – – 6.0 Charged directly to comprehensive income – – 0.8 2.1 – 2.9
At 30 June 2017 (32.5) 25.5 2.4 14.4 1.8 11.6 Credited/(charged) to income statement 4.4 (5.8) (7.9) (3.9) 0.8 (12.4) Transfers (2.7) 1.0 (0.7) 1.8 4.0 3.4 Credited/(charged) directly to comprehensive income – – 0.2 (13.6) – (13.4)
At 30 June 2018 (30.8) 20.7 (6.0) (1.3) 6.6 (10.8)
Deferred tax assets and liabilities are attributed to temporary differences relating to the following:
Assets Liabilities Total
2018
£m 2017
£m 2018
£m 2017
£m 2018
£m 2017
£m
Property, plant and equipment 20.7 25.5 – – 20.7 25.5
Intangible assets – – (30.8) (32.5) (30.8) (32.5)
Payables – 0.5 – – – 0.5
Retirement benefit obligations – 14.4 (1.3) – (1.3) 14.4
Share-based payments 0.4 1.3 – – 0.4 1.3
Other short-term timing differences – 0.6 (6.4) – (6.4) 0.6
Tax losses 6.6 1.8 – – 6.6 1.8
Total 27.7 44.1 (38.5) (32.5) (10.8) 11.6
Set-off tax (27.7) (32.5) 27.7 32.5 – –
Net tax assets/(liabilities) – 11.6 (10.8) – (10.8) 11.6
Financial Statem
entsS
trategic Report
Governance
Kier Group plc | Report and Accounts 2018 157
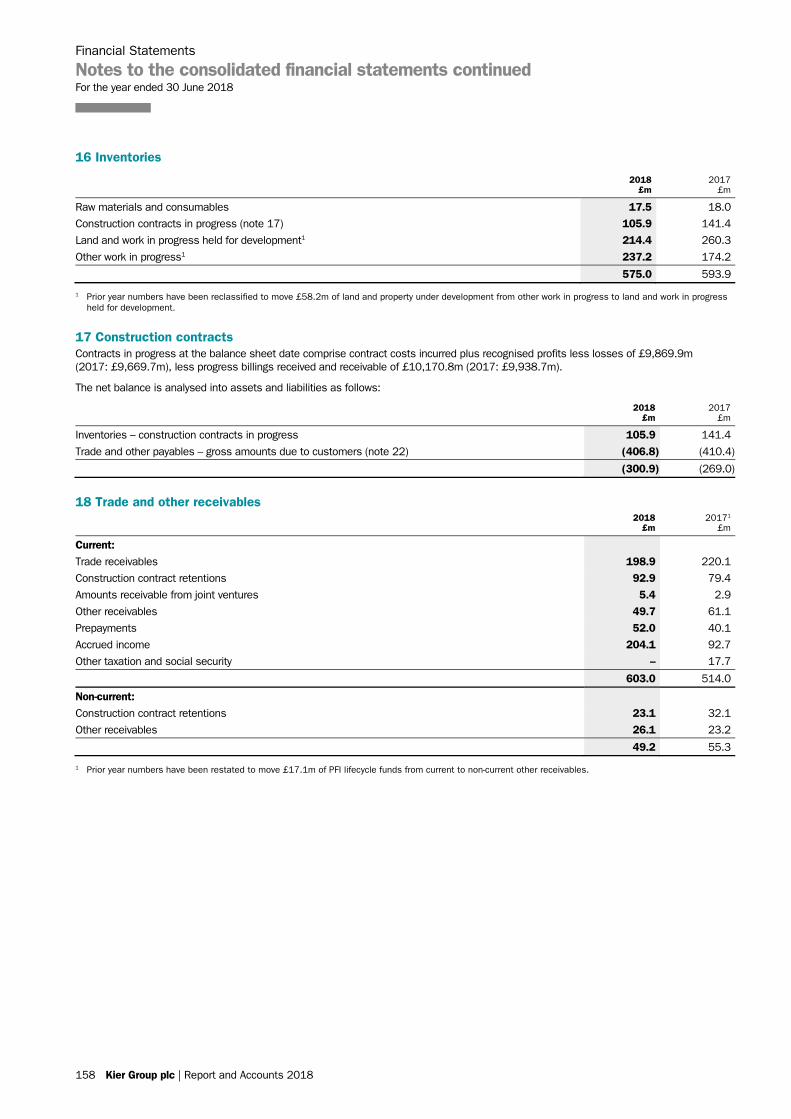
Financial Statements
Notes to the consolidated financial statements continued For the year ended 30 June 2018
158 Kier Group plc | Report and Accounts 2018
16 Inventories
1 Prior year numbers have been reclassified to move £58.2m of land and property under development from other work in progress to land and work in progress held for development.
17 Construction contracts Contracts in progress at the balance sheet date comprise contract costs incurred plus recognised profits less losses of £9,869.9m (2017: £9,669.7m), less progress billings received and receivable of £10,170.8m (2017: £9,938.7m).
The net balance is analysed into assets and liabilities as follows:
2018
£m 2017
£m
Inventories – construction contracts in progress 105.9 141.4
Trade and other payables – gross amounts due to customers (note 22) (406.8) (410.4)
(300.9) (269.0)
18 Trade and other receivables
2018
£m 20171
£m
Current:
Trade receivables 198.9 220.1
Construction contract retentions 92.9 79.4
Amounts receivable from joint ventures 5.4 2.9
Other receivables 49.7 61.1
Prepayments 52.0 40.1
Accrued income 204.1 92.7
Other taxation and social security – 17.7
603.0 514.0
Non-current:
Construction contract retentions 23.1 32.1
Other receivables 26.1 23.2
49.2 55.3
1 Prior year numbers have been restated to move £17.1m of PFI lifecycle funds from current to non-current other receivables.
2018
£m 2017
£m
Raw materials and consumables 17.5 18.0
Construction contracts in progress (note 17) 105.9 141.4
Land and work in progress held for development1 214.4 260.3
Other work in progress1 237.2 174.2
575.0 593.9
158 Kier Group plc | Report and Accounts 2018
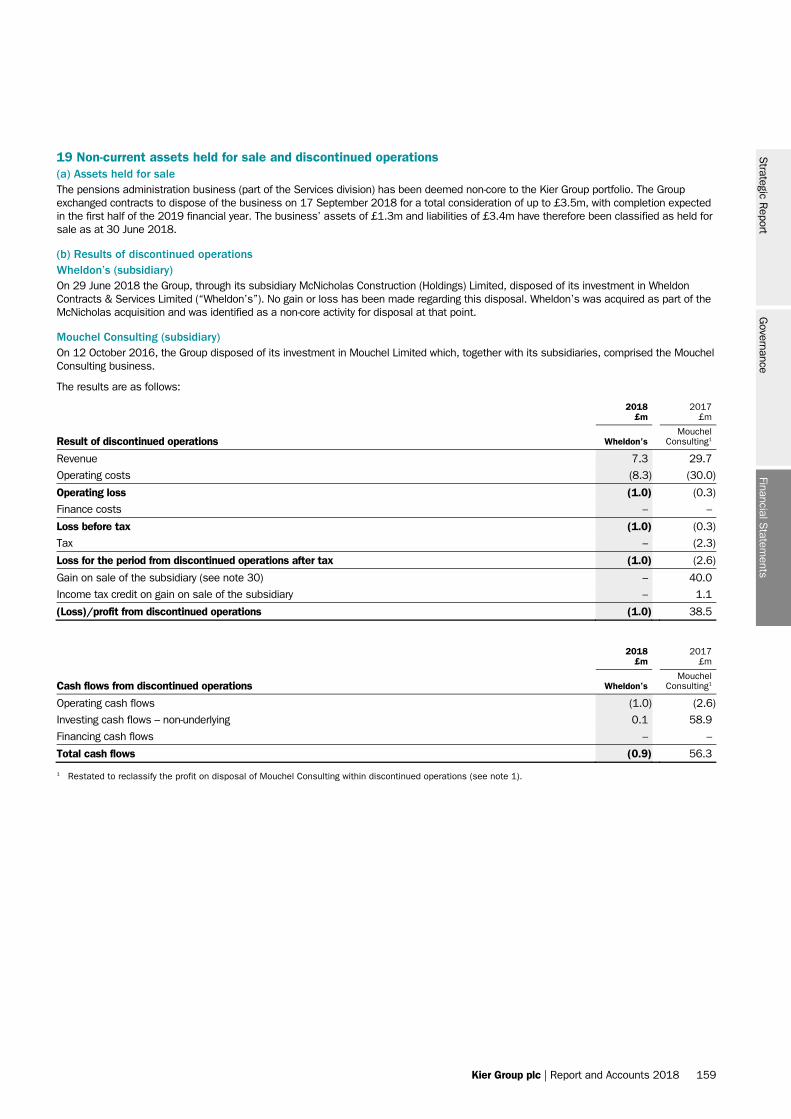
Kier Group plc | Report and Accounts 2018 159
19 Non-current assets held for sale and discontinued operations (a) Assets held for sale The pensions administration business (part of the Services division) has been deemed non-core to the Kier Group portfolio. The Group exchanged contracts to dispose of the business on 17 September 2018 for a total consideration of up to £3.5m, with completion expected in the first half of the 2019 financial year. The business’ assets of £1.3m and liabilities of £3.4m have therefore been classified as held for sale as at 30 June 2018.
(b) Results of discontinued operations Wheldon’s (subsidiary) On 29 June 2018 the Group, through its subsidiary McNicholas Construction (Holdings) Limited, disposed of its investment in Wheldon Contracts & Services Limited (“Wheldon’s”). No gain or loss has been made regarding this disposal. Wheldon’s was acquired as part of the McNicholas acquisition and was identified as a non-core activity for disposal at that point.
Mouchel Consulting (subsidiary) On 12 October 2016, the Group disposed of its investment in Mouchel Limited which, together with its subsidiaries, comprised the Mouchel Consulting business.
The results are as follows:
2018
£m 2017
£m
Result of discontinued operations Wheldon’s Mouchel
Consulting1
Revenue 7.3 29.7
Operating costs (8.3) (30.0)
Operating loss (1.0) (0.3)
Finance costs – –
Loss before tax (1.0) (0.3)
Tax – (2.3)
Loss for the period from discontinued operations after tax (1.0) (2.6)
Gain on sale of the subsidiary (see note 30) – 40.0
Income tax credit on gain on sale of the subsidiary – 1.1
(Loss)/profit from discontinued operations (1.0) 38.5
1 Restated to reclassify the profit on disposal of Mouchel Consulting within discontinued operations (see note 1).
2018
£m 2017
£m
Cash flows from discontinued operations Wheldon’s Mouchel
Consulting1
Operating cash flows (1.0) (2.6)
Investing cash flows – non-underlying 0.1 58.9
Financing cash flows – –
Total cash flows (0.9) 56.3
Financial Statem
entsS
trategic Report
Governance
Kier Group plc | Report and Accounts 2018 159
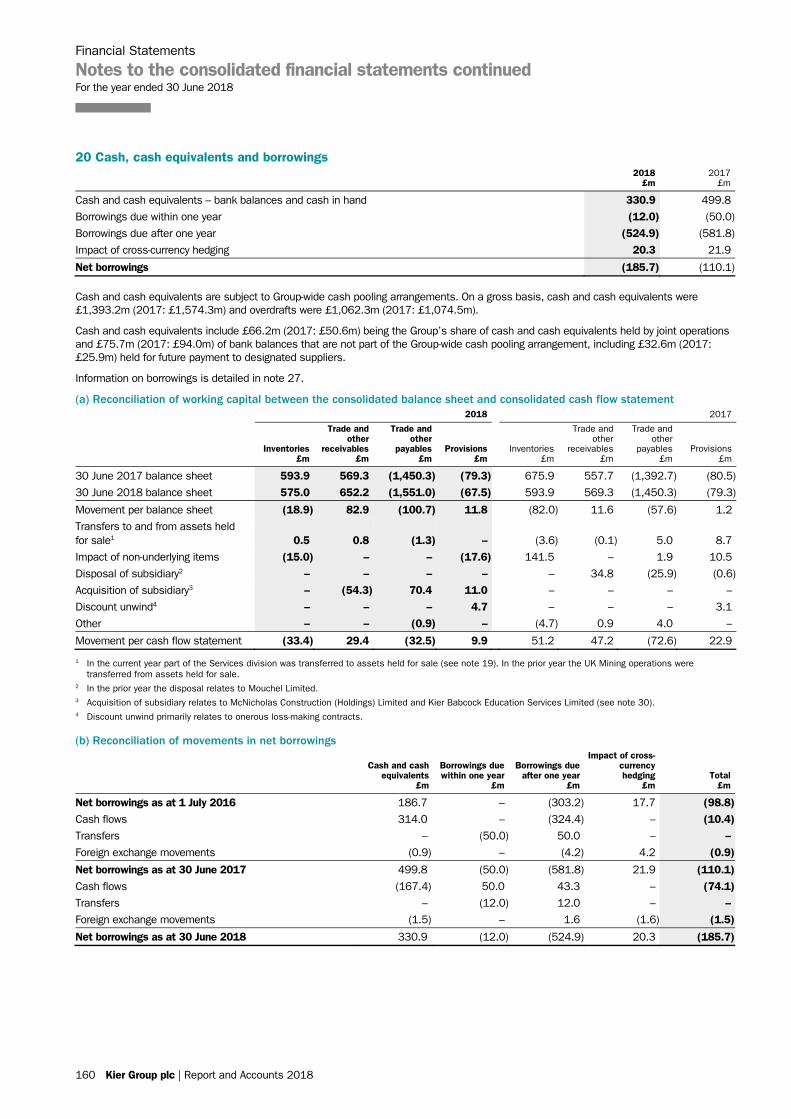
Financial Statements
Notes to the consolidated financial statements continued For the year ended 30 June 2018
160 Kier Group plc | Report and Accounts 2018
20 Cash, cash equivalents and borrowings
2018
£m 2017
£m
Cash and cash equivalents – bank balances and cash in hand 330.9 499.8
Borrowings due within one year (12.0) (50.0)
Borrowings due after one year (524.9) (581.8)
Impact of cross-currency hedging 20.3 21.9
Net borrowings (185.7) (110.1)
Cash and cash equivalents are subject to Group-wide cash pooling arrangements. On a gross basis, cash and cash equivalents were £1,393.2m (2017: £1,574.3m) and overdrafts were £1,062.3m (2017: £1,074.5m).
Cash and cash equivalents include £66.2m (2017: £50.6m) being the Group’s share of cash and cash equivalents held by joint operations and £75.7m (2017: £94.0m) of bank balances that are not part of the Group-wide cash pooling arrangement, including £32.6m (2017: £25.9m) held for future payment to designated suppliers.
Information on borrowings is detailed in note 27.
(a) Reconciliation of working capital between the consolidated balance sheet and consolidated cash flow statement 2018 2017
Inventories
£m
Trade and other
receivables £m
Trade and other
payables £m
Provisions £m
Inventories £m
Trade and other
receivables £m
Trade and other
payables £m
Provisions £m
30 June 2017 balance sheet 593.9 569.3 (1,450.3) (79.3) 675.9 557.7 (1,392.7) (80.5)
30 June 2018 balance sheet 575.0 652.2 (1,551.0) (67.5) 593.9 569.3 (1,450.3) (79.3)
Movement per balance sheet (18.9) 82.9 (100.7) 11.8 (82.0) 11.6 (57.6) 1.2
Transfers to and from assets held for sale1 0.5 0.8 (1.3) – (3.6) (0.1) 5.0 8.7
Impact of non-underlying items (15.0) – – (17.6) 141.5 – 1.9 10.5
Disposal of subsidiary2 – – – – – 34.8 (25.9) (0.6)
Acquisition of subsidiary3 – (54.3) 70.4 11.0 – – – –
Discount unwind4 – – – 4.7 – – – 3.1
Other – – (0.9) – (4.7) 0.9 4.0 –
Movement per cash flow statement (33.4) 29.4 (32.5) 9.9 51.2 47.2 (72.6) 22.9
1 In the current year part of the Services division was transferred to assets held for sale (see note 19). In the prior year the UK Mining operations were transferred from assets held for sale.
2 In the prior year the disposal relates to Mouchel Limited. 3 Acquisition of subsidiary relates to McNicholas Construction (Holdings) Limited and Kier Babcock Education Services Limited (see note 30). 4 Discount unwind primarily relates to onerous loss-making contracts.
(b) Reconciliation of movements in net borrowings
Cash and cash equivalents
£m
Borrowings due within one year
£m
Borrowings due after one year
£m
Impact of cross-currency hedging
£m Total
£m
Net borrowings as at 1 July 2016 186.7 – (303.2) 17.7 (98.8) Cash flows 314.0 – (324.4) – (10.4) Transfers – (50.0) 50.0 – – Foreign exchange movements (0.9) – (4.2) 4.2 (0.9)
Net borrowings as at 30 June 2017 499.8 (50.0) (581.8) 21.9 (110.1) Cash flows (167.4) 50.0 43.3 – (74.1) Transfers – (12.0) 12.0 – – Foreign exchange movements (1.5) – 1.6 (1.6) (1.5)
Net borrowings as at 30 June 2018 330.9 (12.0) (524.9) 20.3 (185.7)
160 Kier Group plc | Report and Accounts 2018
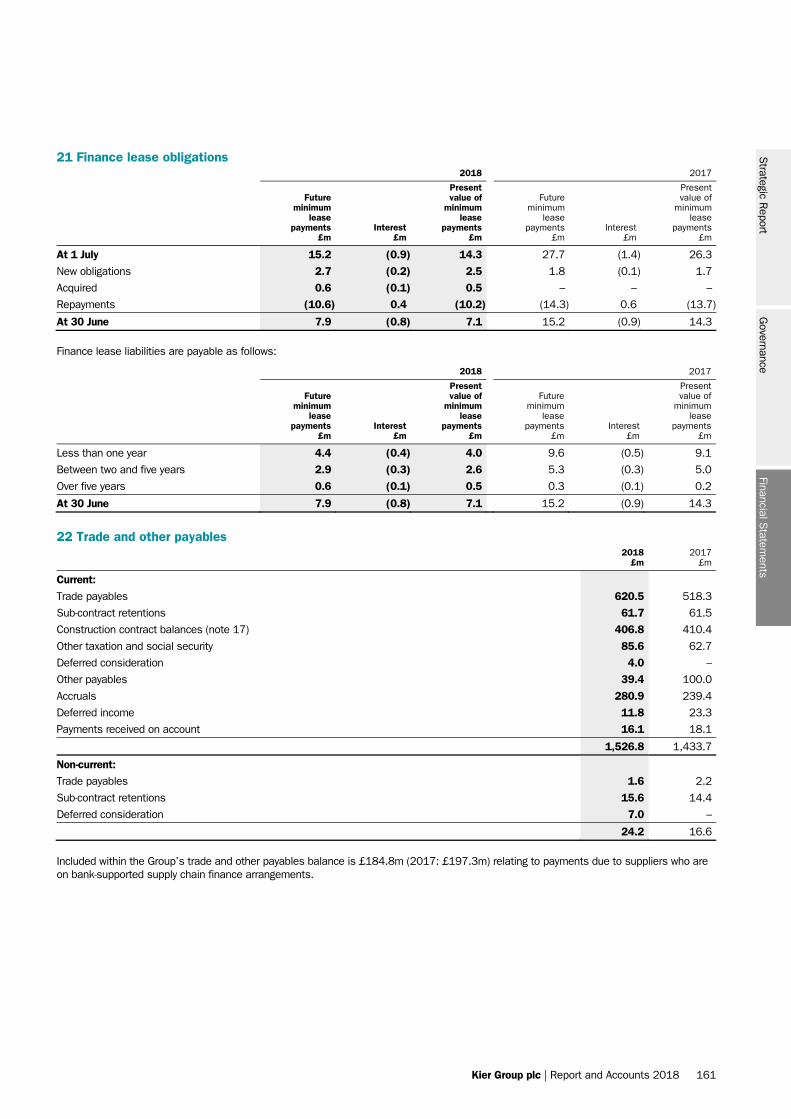
Kier Group plc | Report and Accounts 2018 161
21 Finance lease obligations 2018 2017
Future minimum
lease payments
£m Interest
£m
Present value of
minimum lease
payments £m
Future minimum
lease payments
£m Interest
£m
Present value of
minimum lease
payments £m
At 1 July 15.2 (0.9) 14.3 27.7 (1.4) 26.3
New obligations 2.7 (0.2) 2.5 1.8 (0.1) 1.7
Acquired 0.6 (0.1) 0.5 – – –
Repayments (10.6) 0.4 (10.2) (14.3) 0.6 (13.7)
At 30 June 7.9 (0.8) 7.1 15.2 (0.9) 14.3
Finance lease liabilities are payable as follows:
2018 2017
Future minimum
lease payments
£m Interest
£m
Present value of
minimum lease
payments £m
Future minimum
lease payments
£m Interest
£m
Present value of
minimum lease
payments £m
Less than one year 4.4 (0.4) 4.0 9.6 (0.5) 9.1
Between two and five years 2.9 (0.3) 2.6 5.3 (0.3) 5.0
Over five years 0.6 (0.1) 0.5 0.3 (0.1) 0.2
At 30 June 7.9 (0.8) 7.1 15.2 (0.9) 14.3
22 Trade and other payables
2018
£m 2017
£m
Current:
Trade payables 620.5 518.3
Sub-contract retentions 61.7 61.5
Construction contract balances (note 17) 406.8 410.4
Other taxation and social security 85.6 62.7
Deferred consideration 4.0 –
Other payables 39.4 100.0
Accruals 280.9 239.4
Deferred income 11.8 23.3
Payments received on account 16.1 18.1
1,526.8 1,433.7
Non-current:
Trade payables 1.6 2.2
Sub-contract retentions 15.6 14.4
Deferred consideration 7.0 –
24.2 16.6
Included within the Group’s trade and other payables balance is £184.8m (2017: £197.3m) relating to payments due to suppliers who are on bank-supported supply chain finance arrangements.
Financial Statem
entsS
trategic Report
Governance
Kier Group plc | Report and Accounts 2018 161
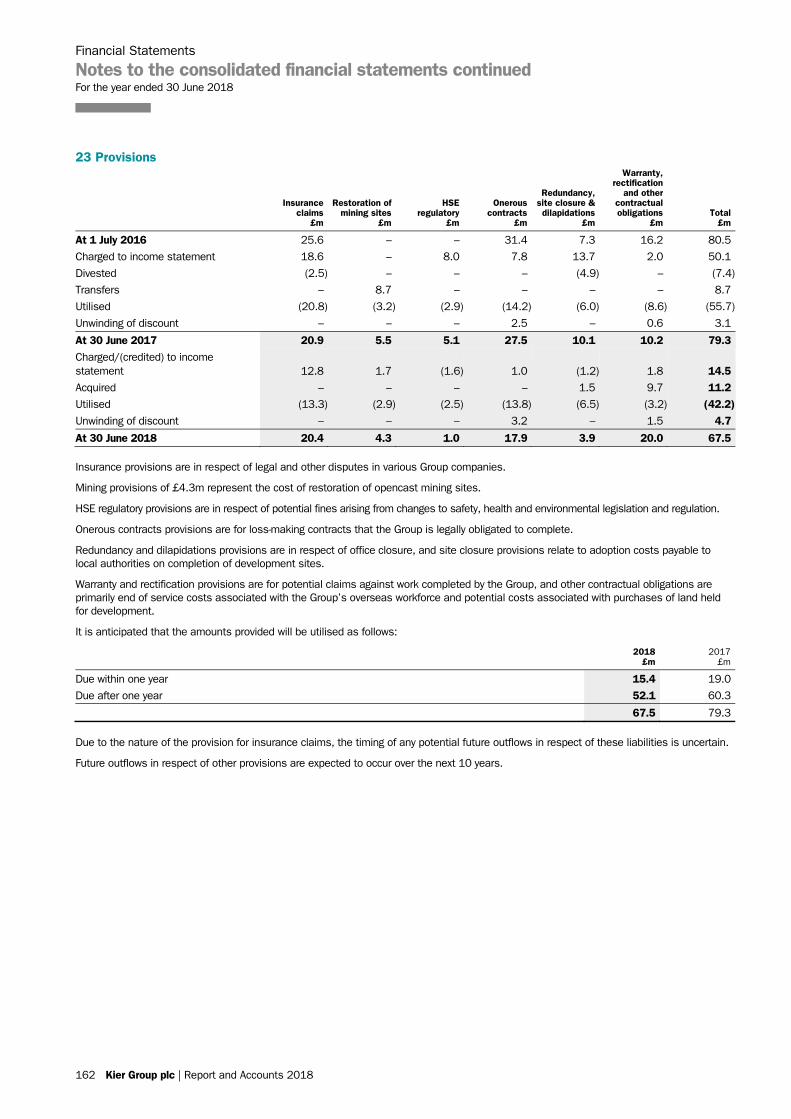
Financial Statements
Notes to the consolidated financial statements continued For the year ended 30 June 2018
162 Kier Group plc | Report and Accounts 2018
23 Provisions
Insurance claims
£m
Restoration of mining sites
£m
HSE regulatory
£m
Onerous contracts
£m
Redundancy, site closure & dilapidations
£m
Warranty, rectification
and other contractual obligations
£m Total
£m
At 1 July 2016 25.6 – – 31.4 7.3 16.2 80.5
Charged to income statement 18.6 – 8.0 7.8 13.7 2.0 50.1
Divested (2.5) – – – (4.9) – (7.4)
Transfers – 8.7 – – – – 8.7
Utilised (20.8) (3.2) (2.9) (14.2) (6.0) (8.6) (55.7)
Unwinding of discount – – – 2.5 – 0.6 3.1
At 30 June 2017 20.9 5.5 5.1 27.5 10.1 10.2 79.3 Charged/(credited) to income statement 12.8 1.7 (1.6) 1.0 (1.2) 1.8 14.5 Acquired – – – – 1.5 9.7 11.2 Utilised (13.3) (2.9) (2.5) (13.8) (6.5) (3.2) (42.2) Unwinding of discount – – – 3.2 – 1.5 4.7
At 30 June 2018 20.4 4.3 1.0 17.9 3.9 20.0 67.5
Insurance provisions are in respect of legal and other disputes in various Group companies.
Mining provisions of £4.3m represent the cost of restoration of opencast mining sites.
HSE regulatory provisions are in respect of potential fines arising from changes to safety, health and environmental legislation and regulation.
Onerous contracts provisions are for loss-making contracts that the Group is legally obligated to complete.
Redundancy and dilapidations provisions are in respect of office closure, and site closure provisions relate to adoption costs payable to local authorities on completion of development sites.
Warranty and rectification provisions are for potential claims against work completed by the Group, and other contractual obligations are primarily end of service costs associated with the Group’s overseas workforce and potential costs associated with purchases of land held for development.
It is anticipated that the amounts provided will be utilised as follows:
2018
£m 2017
£m
Due within one year 15.4 19.0
Due after one year 52.1 60.3
67.5 79.3
Due to the nature of the provision for insurance claims, the timing of any potential future outflows in respect of these liabilities is uncertain.
Future outflows in respect of other provisions are expected to occur over the next 10 years.
162 Kier Group plc | Report and Accounts 2018
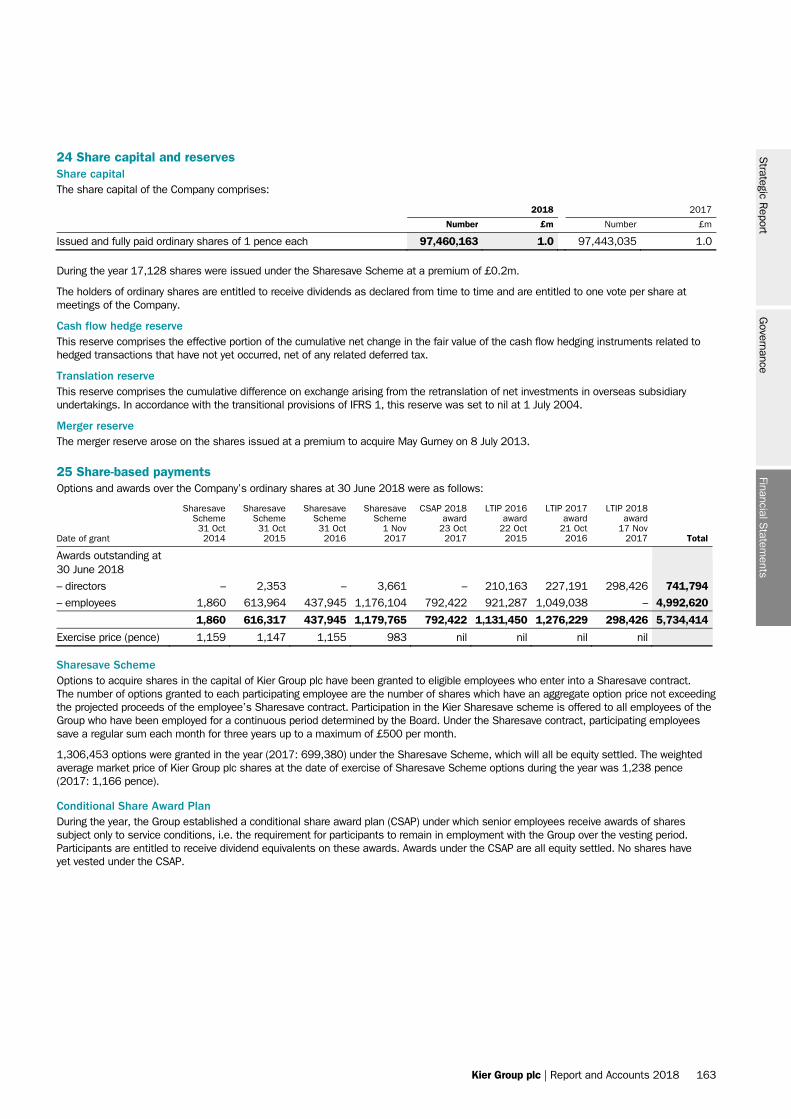
Kier Group plc | Report and Accounts 2018 163
24 Share capital and reserves Share capital The share capital of the Company comprises:
2018 2017
Number £m Number £m
Issued and fully paid ordinary shares of 1 pence each 97,460,163 1.0 97,443,035 1.0
During the year 17,128 shares were issued under the Sharesave Scheme at a premium of £0.2m.
The holders of ordinary shares are entitled to receive dividends as declared from time to time and are entitled to one vote per share at meetings of the Company.
Cash flow hedge reserve This reserve comprises the effective portion of the cumulative net change in the fair value of the cash flow hedging instruments related to hedged transactions that have not yet occurred, net of any related deferred tax.
Translation reserve This reserve comprises the cumulative difference on exchange arising from the retranslation of net investments in overseas subsidiary undertakings. In accordance with the transitional provisions of IFRS 1, this reserve was set to nil at 1 July 2004.
Merger reserve The merger reserve arose on the shares issued at a premium to acquire May Gurney on 8 July 2013.
25 Share-based payments Options and awards over the Company’s ordinary shares at 30 June 2018 were as follows:
Date of grant
Sharesave Scheme 31 Oct 2014
Sharesave Scheme 31 Oct 2015
Sharesave Scheme 31 Oct 2016
Sharesave Scheme
1 Nov 2017
CSAP 2018 award
23 Oct 2017
LTIP 2016 award
22 Oct 2015
LTIP 2017 award
21 Oct 2016
LTIP 2018 award
17 Nov 2017 Total
Awards outstanding at 30 June 2018 – directors – 2,353 – 3,661 – 210,163 227,191 298,426 741,794 – employees 1,860 613,964 437,945 1,176,104 792,422 921,287 1,049,038 – 4,992,620
1,860 616,317 437,945 1,179,765 792,422 1,131,450 1,276,229 298,426 5,734,414
Exercise price (pence) 1,159 1,147 1,155 983 nil nil nil nil
Sharesave Scheme Options to acquire shares in the capital of Kier Group plc have been granted to eligible employees who enter into a Sharesave contract. The number of options granted to each participating employee are the number of shares which have an aggregate option price not exceeding the projected proceeds of the employee’s Sharesave contract. Participation in the Kier Sharesave scheme is offered to all employees of the Group who have been employed for a continuous period determined by the Board. Under the Sharesave contract, participating employees save a regular sum each month for three years up to a maximum of £500 per month.
1,306,453 options were granted in the year (2017: 699,380) under the Sharesave Scheme, which will all be equity settled. The weighted average market price of Kier Group plc shares at the date of exercise of Sharesave Scheme options during the year was 1,238 pence (2017: 1,166 pence).
Conditional Share Award Plan During the year, the Group established a conditional share award plan (CSAP) under which senior employees receive awards of shares subject only to service conditions, i.e. the requirement for participants to remain in employment with the Group over the vesting period. Participants are entitled to receive dividend equivalents on these awards. Awards under the CSAP are all equity settled. No shares have yet vested under the CSAP.
Financial Statem
entsS
trategic Report
Governance
Kier Group plc | Report and Accounts 2018 163

Financial Statements
Notes to the consolidated financial statements continued For the year ended 30 June 2018
164 Kier Group plc | Report and Accounts 2018
25 Share-based payments continued Long Term Incentive Plan The Group has established a Long-Term Incentive Plan (LTIP) under which directors can receive awards of shares. Senior employees also participate in LTIP awards granted before the introduction of the CSAP, which replaced the LTIP awards for senior employees who were not main board directors. Awards made under the scheme are normally able to vest following the third anniversary of the date of the grant. Vesting may be in full or in part (with the balance of the award lapsing) and is subject to the Group achieving specific performance targets. Participants in the 2017 scheme are entitled to receive dividend equivalents on these awards. Awards under the LTIP are all equity settled. The market price of Kier Group plc shares at the date of exercise of LTIP options was 1,078 pence (2017: 1,360 pence).
The awards which are taken as shares are intended to be satisfied from shares held by the Kier Group 1999 Employee Benefit Trust and May Gurney Group Trustees Ltd Employee Share Ownership Plan Trust or from the issue of new shares. The shares held by the trusts are accounted for as a deduction from equity within retained earnings.
2018 2017
Number
of shares Value
£m Number
of shares Value
£m
At 1 July 368,067 4.0 526,169 5.9
Acquired during the year 153,340 1.6 87,116 1.2
Issued in satisfaction of awards and other schemes (239,514) (2.8) (204,709) (2.6)
Issued in satisfaction of deferred bonus schemes (30,192) (0.3) (40,509) (0.5)
At 30 June 251,701 2.5 368,067 4.0
The market value of these shares at 30 June 2018 was £2.4m (2017: £4.5m). The dividends on these shares have been waived.
Further description of these schemes and the terms and conditions of each scheme are included in the Directors’ Remuneration Report on pages 86 to 107.
Value of share schemes The fair value per option granted has been calculated using the following assumptions. These calculations are based on the Black-Scholes model for all options apart from the total shareholder return (TSR) element of the LTIP which is based on a Stochastic model.
Sharesave Scheme
Date of grant 31 October
2015 31 October
2016 1 November
2017
Share price at grant (pence) 1,377 1,329 1,055
Exercise price (pence) 1,147 1,155 983
Option life (years) 3.0 3.0 3.0
Expected volatility 22.9% 25.5% 24.9%
Dividend yield 4.7% 4.7% 6.4%
Risk-free interest rate 0.9% 0.3% 0.6%
Value per option (pence) 222.6 205.8 113.1
Conditional Share Award Plan
Date of grant 23 October
2017
Share price at grant (pence) 1,063
Exercise price (pence) nil
Option life (years) 3.0
Value per option (pence) 1,063
164 Kier Group plc | Report and Accounts 2018
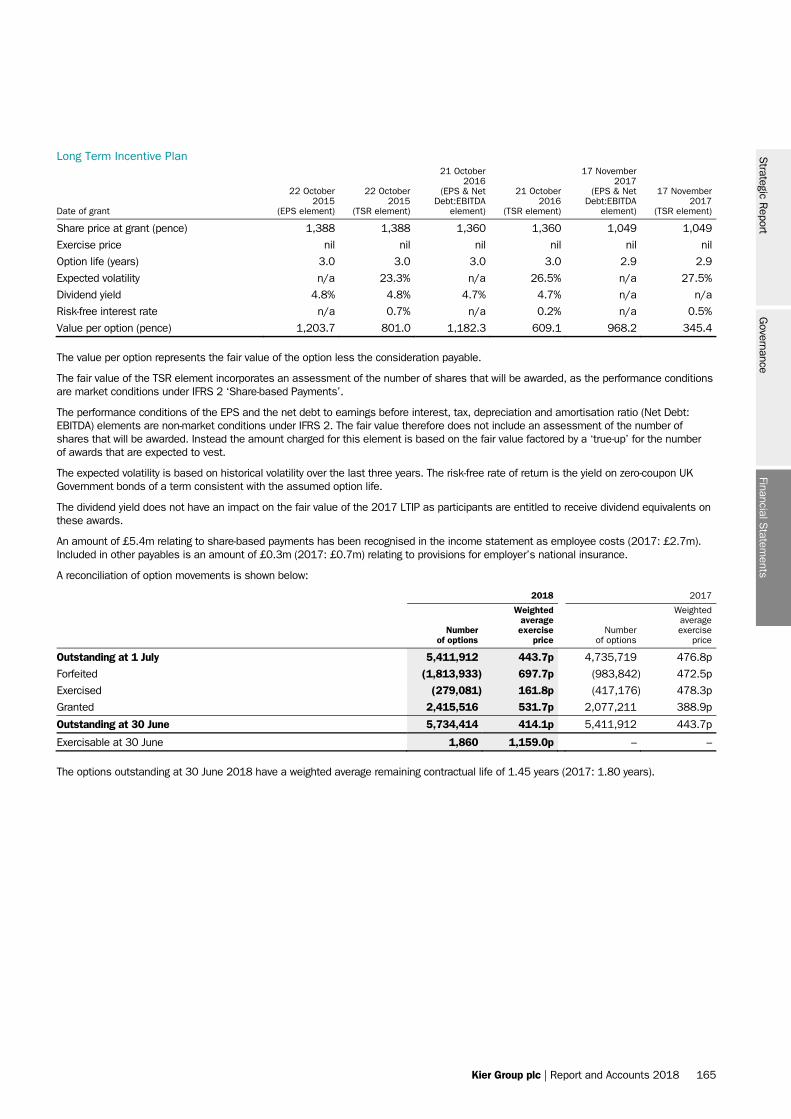
Kier Group plc | Report and Accounts 2018 165
Long Term Incentive Plan
Date of grant
22 October 2015
(EPS element)
22 October 2015
(TSR element)
21 October 2016
(EPS & Net Debt:EBITDA
element)
21 October 2016
(TSR element)
17 November 2017
(EPS & Net Debt:EBITDA
element)
17 November 2017
(TSR element)
Share price at grant (pence) 1,388 1,388 1,360 1,360 1,049 1,049
Exercise price nil nil nil nil nil nil
Option life (years) 3.0 3.0 3.0 3.0 2.9 2.9
Expected volatility n/a 23.3% n/a 26.5% n/a 27.5%
Dividend yield 4.8% 4.8% 4.7% 4.7% n/a n/a
Risk-free interest rate n/a 0.7% n/a 0.2% n/a 0.5%
Value per option (pence) 1,203.7 801.0 1,182.3 609.1 968.2 345.4
The value per option represents the fair value of the option less the consideration payable.
The fair value of the TSR element incorporates an assessment of the number of shares that will be awarded, as the performance conditions are market conditions under IFRS 2 ‘Share-based Payments’.
The performance conditions of the EPS and the net debt to earnings before interest, tax, depreciation and amortisation ratio (Net Debt: EBITDA) elements are non-market conditions under IFRS 2. The fair value therefore does not include an assessment of the number of shares that will be awarded. Instead the amount charged for this element is based on the fair value factored by a ‘true-up’ for the number of awards that are expected to vest.
The expected volatility is based on historical volatility over the last three years. The risk-free rate of return is the yield on zero-coupon UK Government bonds of a term consistent with the assumed option life.
The dividend yield does not have an impact on the fair value of the 2017 LTIP as participants are entitled to receive dividend equivalents on these awards.
An amount of £5.4m relating to share-based payments has been recognised in the income statement as employee costs (2017: £2.7m). Included in other payables is an amount of £0.3m (2017: £0.7m) relating to provisions for employer’s national insurance.
A reconciliation of option movements is shown below:
2018 2017
Number
of options
Weighted average exercise
price Number
of options
Weighted average exercise
price
Outstanding at 1 July 5,411,912 443.7p 4,735,719 476.8p
Forfeited (1,813,933) 697.7p (983,842) 472.5p
Exercised (279,081) 161.8p (417,176) 478.3p
Granted 2,415,516 531.7p 2,077,211 388.9p
Outstanding at 30 June 5,734,414 414.1p 5,411,912 443.7p
Exercisable at 30 June 1,860 1,159.0p – –
The options outstanding at 30 June 2018 have a weighted average remaining contractual life of 1.45 years (2017: 1.80 years).
Financial Statem
entsS
trategic Report
Governance
Kier Group plc | Report and Accounts 2018 165
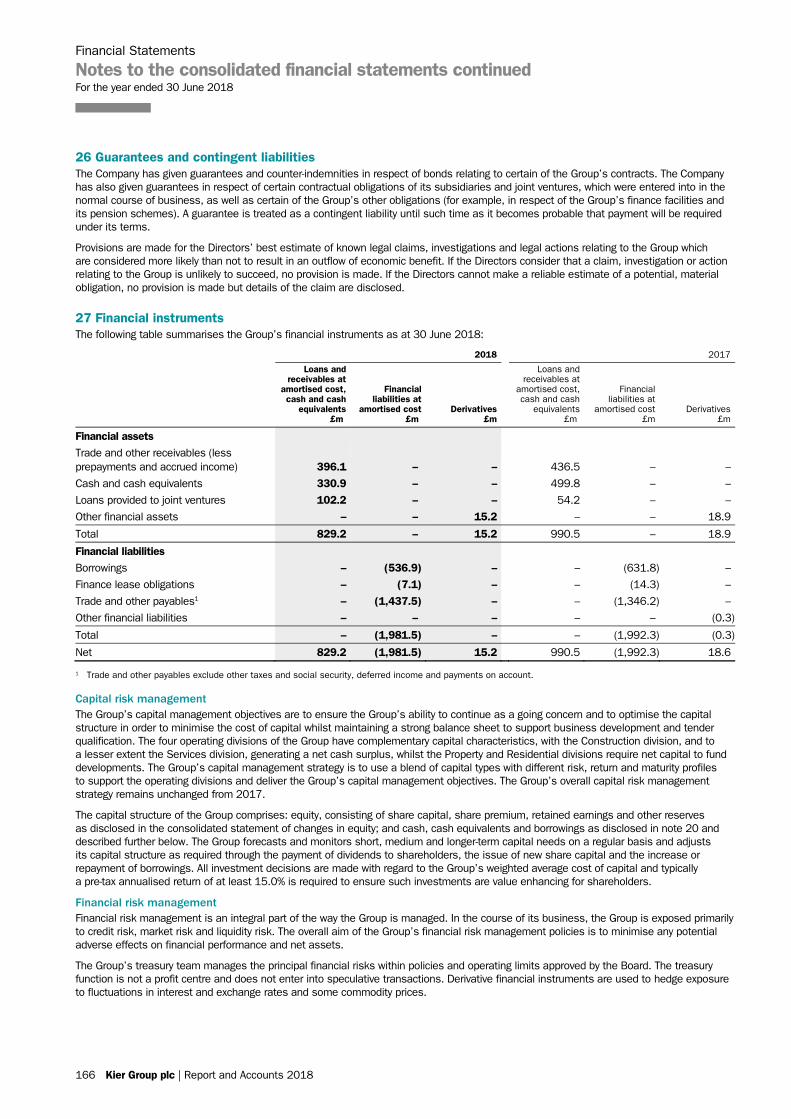
Financial Statements
Notes to the consolidated financial statements continued For the year ended 30 June 2018
166 Kier Group plc | Report and Accounts 2018
26 Guarantees and contingent liabilities The Company has given guarantees and counter-indemnities in respect of bonds relating to certain of the Group’s contracts. The Company has also given guarantees in respect of certain contractual obligations of its subsidiaries and joint ventures, which were entered into in the normal course of business, as well as certain of the Group’s other obligations (for example, in respect of the Group’s finance facilities and its pension schemes). A guarantee is treated as a contingent liability until such time as it becomes probable that payment will be required under its terms.
Provisions are made for the Directors’ best estimate of known legal claims, investigations and legal actions relating to the Group which are considered more likely than not to result in an outflow of economic benefit. If the Directors consider that a claim, investigation or action relating to the Group is unlikely to succeed, no provision is made. If the Directors cannot make a reliable estimate of a potential, material obligation, no provision is made but details of the claim are disclosed.
27 Financial instruments The following table summarises the Group’s financial instruments as at 30 June 2018:
2018 2017
Loans and receivables at
amortised cost, cash and cash
equivalents £m
Financial liabilities at
amortised cost £m
Derivatives £m
Loans and receivables at
amortised cost, cash and cash
equivalents £m
Financial liabilities at
amortised cost £m
Derivatives £m
Financial assets
Trade and other receivables (less prepayments and accrued income) 396.1 – – 436.5 – –
Cash and cash equivalents 330.9 – – 499.8 – –
Loans provided to joint ventures 102.2 – – 54.2 – –
Other financial assets – – 15.2 – – 18.9
Total 829.2 – 15.2 990.5 – 18.9
Financial liabilities
Borrowings – (536.9) – – (631.8) –
Finance lease obligations – (7.1) – – (14.3) –
Trade and other payables1 – (1,437.5) – – (1,346.2) –
Other financial liabilities – – – – – (0.3)
Total – (1,981.5) – – (1,992.3) (0.3)
Net 829.2 (1,981.5) 15.2 990.5 (1,992.3) 18.6
1 Trade and other payables exclude other taxes and social security, deferred income and payments on account.
Capital risk management The Group’s capital management objectives are to ensure the Group’s ability to continue as a going concern and to optimise the capital structure in order to minimise the cost of capital whilst maintaining a strong balance sheet to support business development and tender qualification. The four operating divisions of the Group have complementary capital characteristics, with the Construction division, and to a lesser extent the Services division, generating a net cash surplus, whilst the Property and Residential divisions require net capital to fund developments. The Group’s capital management strategy is to use a blend of capital types with different risk, return and maturity profiles to support the operating divisions and deliver the Group’s capital management objectives. The Group’s overall capital risk management strategy remains unchanged from 2017.
The capital structure of the Group comprises: equity, consisting of share capital, share premium, retained earnings and other reserves as disclosed in the consolidated statement of changes in equity; and cash, cash equivalents and borrowings as disclosed in note 20 and described further below. The Group forecasts and monitors short, medium and longer-term capital needs on a regular basis and adjusts its capital structure as required through the payment of dividends to shareholders, the issue of new share capital and the increase or repayment of borrowings. All investment decisions are made with regard to the Group’s weighted average cost of capital and typically a pre-tax annualised return of at least 15.0% is required to ensure such investments are value enhancing for shareholders.
Financial risk management Financial risk management is an integral part of the way the Group is managed. In the course of its business, the Group is exposed primarily to credit risk, market risk and liquidity risk. The overall aim of the Group’s financial risk management policies is to minimise any potential adverse effects on financial performance and net assets.
The Group’s treasury team manages the principal financial risks within policies and operating limits approved by the Board. The treasury function is not a profit centre and does not enter into speculative transactions. Derivative financial instruments are used to hedge exposure to fluctuations in interest and exchange rates and some commodity prices.
166 Kier Group plc | Report and Accounts 2018
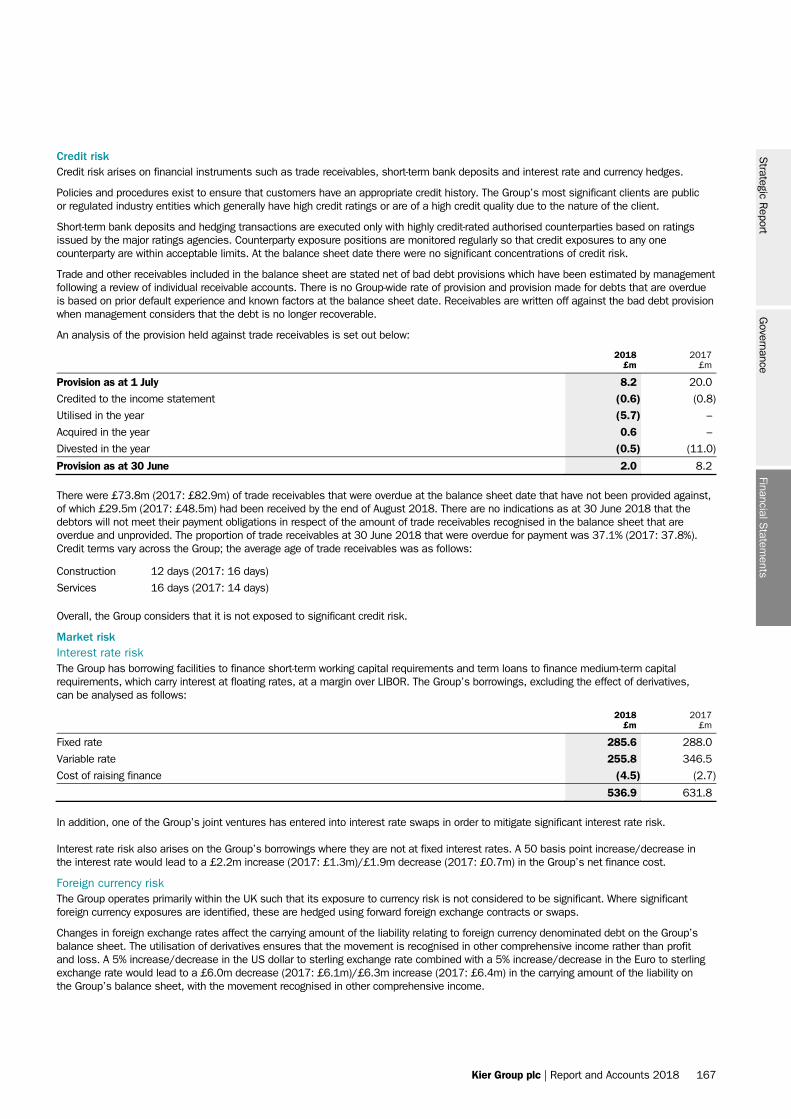
Kier Group plc | Report and Accounts 2018 167
Credit risk Credit risk arises on financial instruments such as trade receivables, short-term bank deposits and interest rate and currency hedges.
Policies and procedures exist to ensure that customers have an appropriate credit history. The Group’s most significant clients are public or regulated industry entities which generally have high credit ratings or are of a high credit quality due to the nature of the client.
Short-term bank deposits and hedging transactions are executed only with highly credit-rated authorised counterparties based on ratings issued by the major ratings agencies. Counterparty exposure positions are monitored regularly so that credit exposures to any one counterparty are within acceptable limits. At the balance sheet date there were no significant concentrations of credit risk.
Trade and other receivables included in the balance sheet are stated net of bad debt provisions which have been estimated by management following a review of individual receivable accounts. There is no Group-wide rate of provision and provision made for debts that are overdue is based on prior default experience and known factors at the balance sheet date. Receivables are written off against the bad debt provision when management considers that the debt is no longer recoverable.
An analysis of the provision held against trade receivables is set out below:
2018
£m 2017
£m
Provision as at 1 July 8.2 20.0
Credited to the income statement (0.6) (0.8)
Utilised in the year (5.7) –
Acquired in the year 0.6 –
Divested in the year (0.5) (11.0)
Provision as at 30 June 2.0 8.2
There were £73.8m (2017: £82.9m) of trade receivables that were overdue at the balance sheet date that have not been provided against, of which £29.5m (2017: £48.5m) had been received by the end of August 2018. There are no indications as at 30 June 2018 that the debtors will not meet their payment obligations in respect of the amount of trade receivables recognised in the balance sheet that are overdue and unprovided. The proportion of trade receivables at 30 June 2018 that were overdue for payment was 37.1% (2017: 37.8%). Credit terms vary across the Group; the average age of trade receivables was as follows:
Construction 12 days (2017: 16 days)
Services 16 days (2017: 14 days)
Overall, the Group considers that it is not exposed to significant credit risk.
Market risk Interest rate risk The Group has borrowing facilities to finance short-term working capital requirements and term loans to finance medium-term capital requirements, which carry interest at floating rates, at a margin over LIBOR. The Group’s borrowings, excluding the effect of derivatives, can be analysed as follows:
2018
£m 2017
£m
Fixed rate 285.6 288.0
Variable rate 255.8 346.5
Cost of raising finance (4.5) (2.7)
536.9 631.8
In addition, one of the Group’s joint ventures has entered into interest rate swaps in order to mitigate significant interest rate risk.
Interest rate risk also arises on the Group’s borrowings where they are not at fixed interest rates. A 50 basis point increase/decrease in the interest rate would lead to a £2.2m increase (2017: £1.3m)/£1.9m decrease (2017: £0.7m) in the Group’s net finance cost.
Foreign currency risk The Group operates primarily within the UK such that its exposure to currency risk is not considered to be significant. Where significant foreign currency exposures are identified, these are hedged using forward foreign exchange contracts or swaps.
Changes in foreign exchange rates affect the carrying amount of the liability relating to foreign currency denominated debt on the Group’s balance sheet. The utilisation of derivatives ensures that the movement is recognised in other comprehensive income rather than profit and loss. A 5% increase/decrease in the US dollar to sterling exchange rate combined with a 5% increase/decrease in the Euro to sterling exchange rate would lead to a £6.0m decrease (2017: £6.1m)/£6.3m increase (2017: £6.4m) in the carrying amount of the liability on the Group’s balance sheet, with the movement recognised in other comprehensive income.
Financial Statem
entsS
trategic Report
Governance
Kier Group plc | Report and Accounts 2018 167
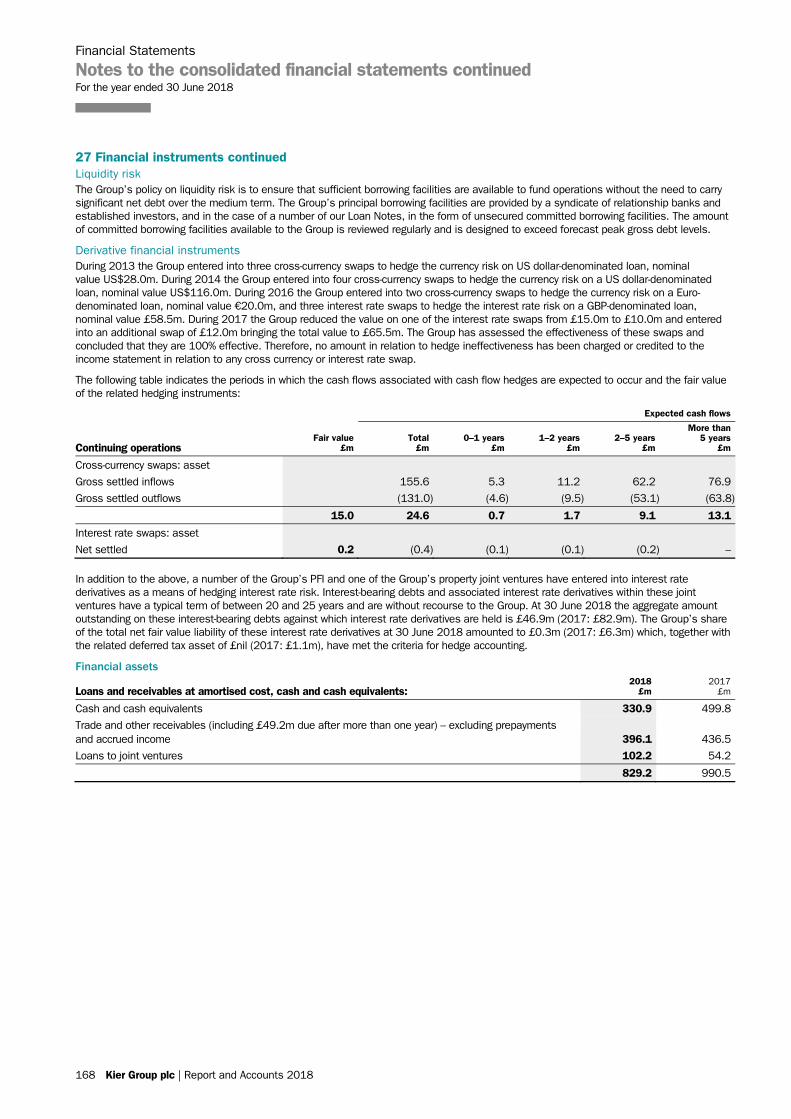
Financial Statements
Notes to the consolidated financial statements continued For the year ended 30 June 2018
168 Kier Group plc | Report and Accounts 2018
27 Financial instruments continued Liquidity risk The Group’s policy on liquidity risk is to ensure that sufficient borrowing facilities are available to fund operations without the need to carry significant net debt over the medium term. The Group’s principal borrowing facilities are provided by a syndicate of relationship banks and established investors, and in the case of a number of our Loan Notes, in the form of unsecured committed borrowing facilities. The amount of committed borrowing facilities available to the Group is reviewed regularly and is designed to exceed forecast peak gross debt levels.
Derivative financial instruments During 2013 the Group entered into three cross-currency swaps to hedge the currency risk on US dollar-denominated loan, nominal value US$28.0m. During 2014 the Group entered into four cross-currency swaps to hedge the currency risk on a US dollar-denominated loan, nominal value US$116.0m. During 2016 the Group entered into two cross-currency swaps to hedge the currency risk on a Euro-denominated loan, nominal value €20.0m, and three interest rate swaps to hedge the interest rate risk on a GBP-denominated loan, nominal value £58.5m. During 2017 the Group reduced the value on one of the interest rate swaps from £15.0m to £10.0m and entered into an additional swap of £12.0m bringing the total value to £65.5m. The Group has assessed the effectiveness of these swaps and concluded that they are 100% effective. Therefore, no amount in relation to hedge ineffectiveness has been charged or credited to the income statement in relation to any cross currency or interest rate swap.
The following table indicates the periods in which the cash flows associated with cash flow hedges are expected to occur and the fair value of the related hedging instruments:
Expected cash flows
Continuing operations Fair value
£m Total
£m 0–1 years
£m 1–2 years
£m 2–5 years
£m
More than 5 years
£m
Cross-currency swaps: asset
Gross settled inflows 155.6 5.3 11.2 62.2 76.9
Gross settled outflows (131.0) (4.6) (9.5) (53.1) (63.8)
15.0 24.6 0.7 1.7 9.1 13.1
Interest rate swaps: asset
Net settled 0.2 (0.4) (0.1) (0.1) (0.2) –
In addition to the above, a number of the Group’s PFI and one of the Group’s property joint ventures have entered into interest rate derivatives as a means of hedging interest rate risk. Interest-bearing debts and associated interest rate derivatives within these joint ventures have a typical term of between 20 and 25 years and are without recourse to the Group. At 30 June 2018 the aggregate amount outstanding on these interest-bearing debts against which interest rate derivatives are held is £46.9m (2017: £82.9m). The Group’s share of the total net fair value liability of these interest rate derivatives at 30 June 2018 amounted to £0.3m (2017: £6.3m) which, together with the related deferred tax asset of £nil (2017: £1.1m), have met the criteria for hedge accounting.
Financial assets
Loans and receivables at amortised cost, cash and cash equivalents: 2018
£m 2017
£m
Cash and cash equivalents 330.9 499.8
Trade and other receivables (including £49.2m due after more than one year) – excluding prepayments and accrued income 396.1 436.5
Loans to joint ventures 102.2 54.2
829.2 990.5
168 Kier Group plc | Report and Accounts 2018
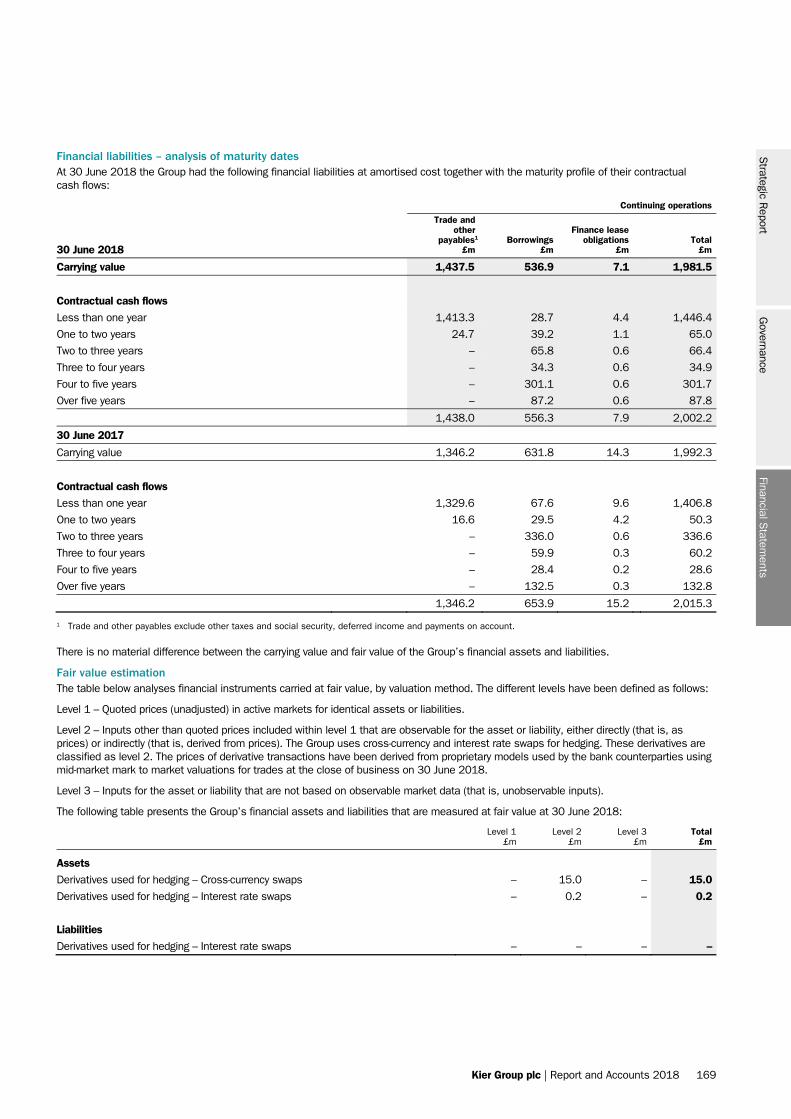
Kier Group plc | Report and Accounts 2018 169
Financial liabilities – analysis of maturity dates At 30 June 2018 the Group had the following financial liabilities at amortised cost together with the maturity profile of their contractual cash flows:
Continuing operations
30 June 2018
Trade and other
payables1 £m
Borrowings £m
Finance lease obligations
£m Total
£m
Carrying value 1,437.5 536.9 7.1 1,981.5
Contractual cash flows
Less than one year 1,413.3 28.7 4.4 1,446.4
One to two years 24.7 39.2 1.1 65.0
Two to three years – 65.8 0.6 66.4
Three to four years – 34.3 0.6 34.9
Four to five years – 301.1 0.6 301.7
Over five years – 87.2 0.6 87.8
1,438.0 556.3 7.9 2,002.2
30 June 2017
Carrying value 1,346.2 631.8 14.3 1,992.3
Contractual cash flows
Less than one year 1,329.6 67.6 9.6 1,406.8
One to two years 16.6 29.5 4.2 50.3
Two to three years – 336.0 0.6 336.6
Three to four years – 59.9 0.3 60.2
Four to five years – 28.4 0.2 28.6
Over five years – 132.5 0.3 132.8
1,346.2 653.9 15.2 2,015.3
1 Trade and other payables exclude other taxes and social security, deferred income and payments on account.
There is no material difference between the carrying value and fair value of the Group’s financial assets and liabilities.
Fair value estimation The table below analyses financial instruments carried at fair value, by valuation method. The different levels have been defined as follows:
Level 1 – Quoted prices (unadjusted) in active markets for identical assets or liabilities.
Level 2 – Inputs other than quoted prices included within level 1 that are observable for the asset or liability, either directly (that is, as prices) or indirectly (that is, derived from prices). The Group uses cross-currency and interest rate swaps for hedging. These derivatives are classified as level 2. The prices of derivative transactions have been derived from proprietary models used by the bank counterparties using mid-market mark to market valuations for trades at the close of business on 30 June 2018.
Level 3 – Inputs for the asset or liability that are not based on observable market data (that is, unobservable inputs).
The following table presents the Group’s financial assets and liabilities that are measured at fair value at 30 June 2018:
Level 1
£m Level 2
£m Level 3
£m Total
£m
Assets Derivatives used for hedging – Cross-currency swaps – 15.0 – 15.0 Derivatives used for hedging – Interest rate swaps – 0.2 – 0.2 Liabilities Derivatives used for hedging – Interest rate swaps – – – –
Financial Statem
entsS
trategic Report
Governance
Kier Group plc | Report and Accounts 2018 169
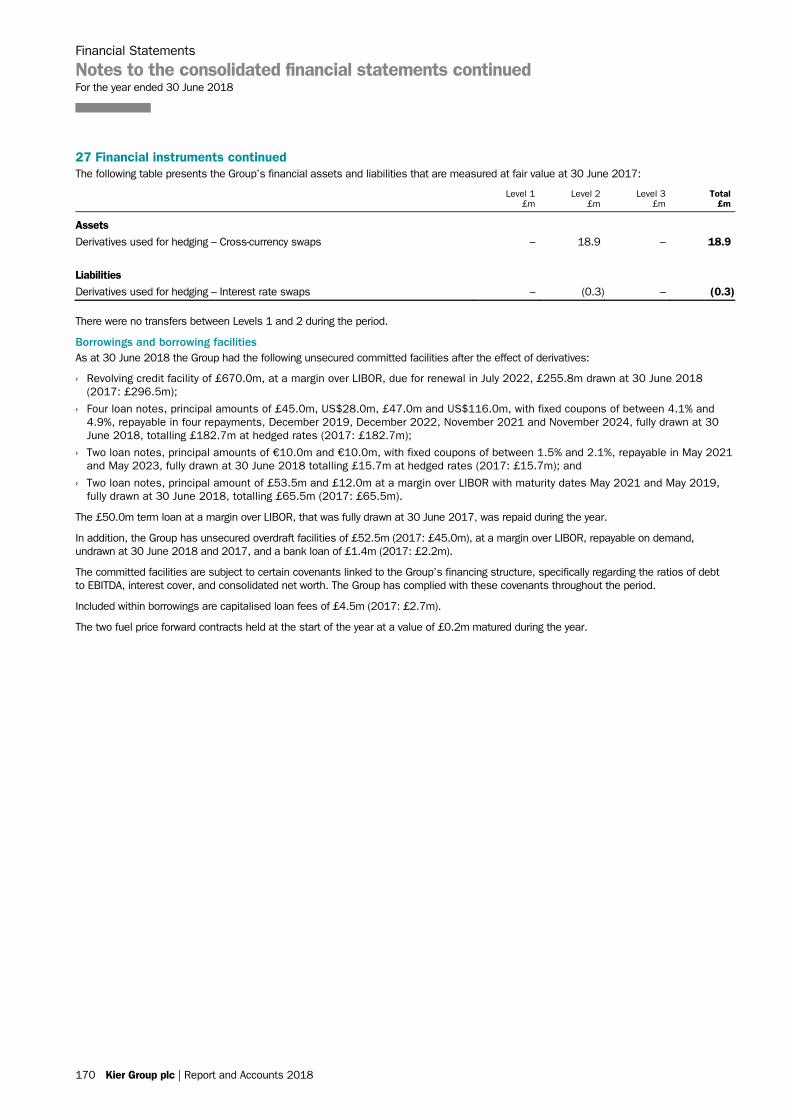
Financial Statements
Notes to the consolidated financial statements continued For the year ended 30 June 2018
170 Kier Group plc | Report and Accounts 2018
27 Financial instruments continued The following table presents the Group’s financial assets and liabilities that are measured at fair value at 30 June 2017:
Level 1
£m Level 2
£m Level 3
£m Total
£m
Assets Derivatives used for hedging – Cross-currency swaps – 18.9 – 18.9 Liabilities Derivatives used for hedging – Interest rate swaps – (0.3) – (0.3)
There were no transfers between Levels 1 and 2 during the period.
Borrowings and borrowing facilities As at 30 June 2018 the Group had the following unsecured committed facilities after the effect of derivatives:
› Revolving credit facility of £670.0m, at a margin over LIBOR, due for renewal in July 2022, £255.8m drawn at 30 June 2018 (2017: £296.5m);
› Four loan notes, principal amounts of £45.0m, US$28.0m, £47.0m and US$116.0m, with fixed coupons of between 4.1% and 4.9%, repayable in four repayments, December 2019, December 2022, November 2021 and November 2024, fully drawn at 30 June 2018, totalling £182.7m at hedged rates (2017: £182.7m);
› Two loan notes, principal amounts of €10.0m and €10.0m, with fixed coupons of between 1.5% and 2.1%, repayable in May 2021 and May 2023, fully drawn at 30 June 2018 totalling £15.7m at hedged rates (2017: £15.7m); and
› Two loan notes, principal amount of £53.5m and £12.0m at a margin over LIBOR with maturity dates May 2021 and May 2019, fully drawn at 30 June 2018, totalling £65.5m (2017: £65.5m).
The £50.0m term loan at a margin over LIBOR, that was fully drawn at 30 June 2017, was repaid during the year.
In addition, the Group has unsecured overdraft facilities of £52.5m (2017: £45.0m), at a margin over LIBOR, repayable on demand, undrawn at 30 June 2018 and 2017, and a bank loan of £1.4m (2017: £2.2m).
The committed facilities are subject to certain covenants linked to the Group’s financing structure, specifically regarding the ratios of debt to EBITDA, interest cover, and consolidated net worth. The Group has complied with these covenants throughout the period.
Included within borrowings are capitalised loan fees of £4.5m (2017: £2.7m).
The two fuel price forward contracts held at the start of the year at a value of £0.2m matured during the year.
170 Kier Group plc | Report and Accounts 2018
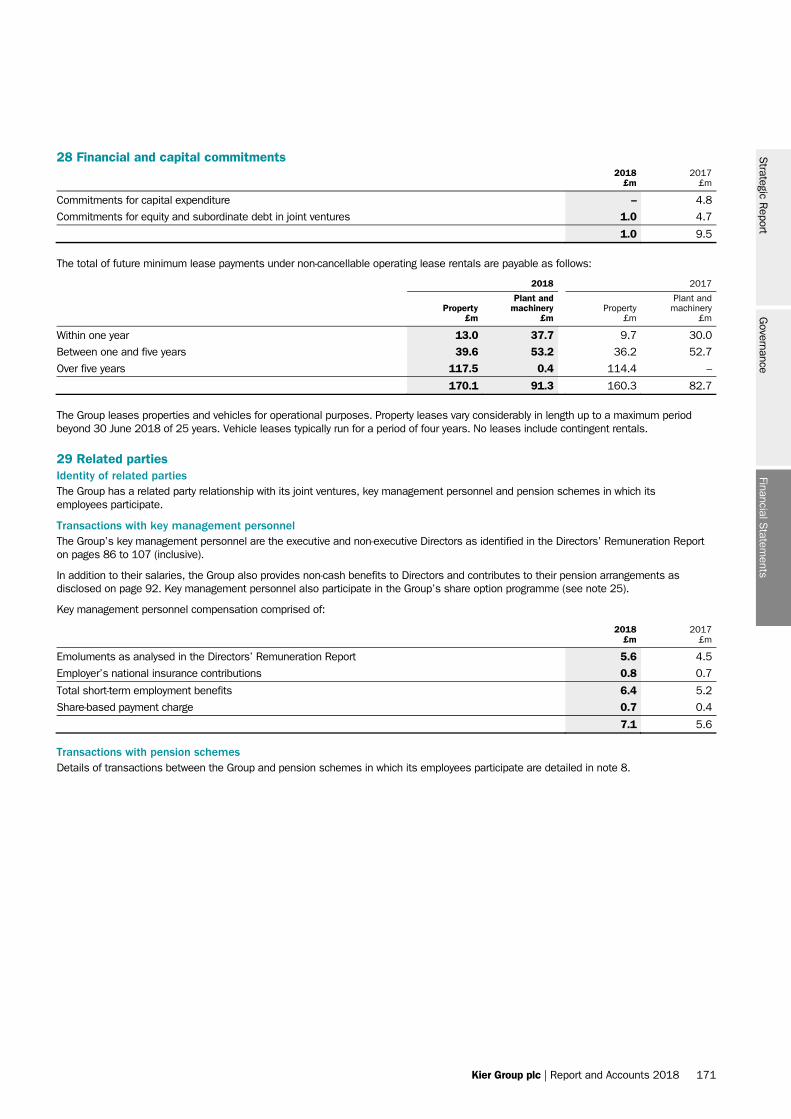
Kier Group plc | Report and Accounts 2018 171
28 Financial and capital commitments
2018
£m 2017
£m
Commitments for capital expenditure – 4.8
Commitments for equity and subordinate debt in joint ventures 1.0 4.7
1.0 9.5
The total of future minimum lease payments under non-cancellable operating lease rentals are payable as follows:
2018 2017
Property
£m
Plant and machinery
£m Property
£m
Plant and machinery
£m
Within one year 13.0 37.7 9.7 30.0
Between one and five years 39.6 53.2 36.2 52.7
Over five years 117.5 0.4 114.4 –
170.1 91.3 160.3 82.7
The Group leases properties and vehicles for operational purposes. Property leases vary considerably in length up to a maximum period beyond 30 June 2018 of 25 years. Vehicle leases typically run for a period of four years. No leases include contingent rentals.
29 Related parties Identity of related parties The Group has a related party relationship with its joint ventures, key management personnel and pension schemes in which its employees participate.
Transactions with key management personnel The Group’s key management personnel are the executive and non-executive Directors as identified in the Directors’ Remuneration Report on pages 86 to 107 (inclusive).
In addition to their salaries, the Group also provides non-cash benefits to Directors and contributes to their pension arrangements as disclosed on page 92. Key management personnel also participate in the Group’s share option programme (see note 25).
Key management personnel compensation comprised of:
2018
£m 2017
£m
Emoluments as analysed in the Directors’ Remuneration Report 5.6 4.5
Employer’s national insurance contributions 0.8 0.7
Total short-term employment benefits 6.4 5.2
Share-based payment charge 0.7 0.4
7.1 5.6
Transactions with pension schemes Details of transactions between the Group and pension schemes in which its employees participate are detailed in note 8.
Financial Statem
entsS
trategic Report
Governance
Kier Group plc | Report and Accounts 2018 171
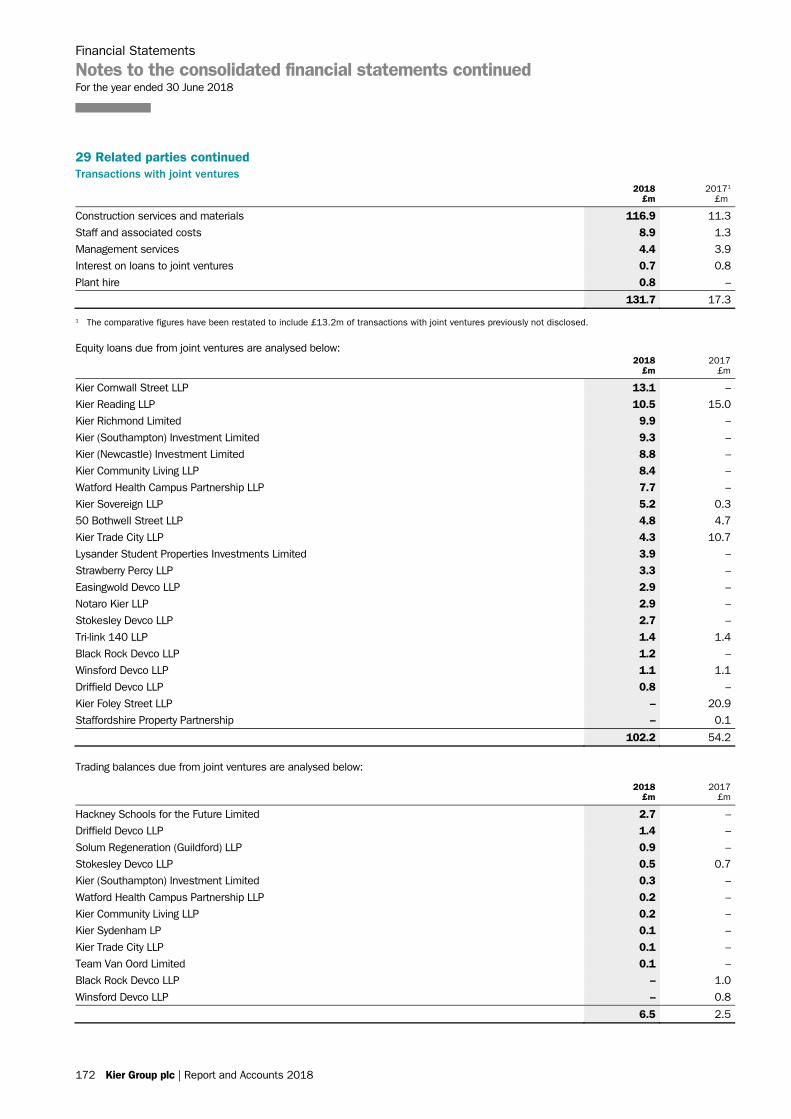
Financial Statements
Notes to the consolidated financial statements continued For the year ended 30 June 2018
172 Kier Group plc | Report and Accounts 2018
29 Related parties continued Transactions with joint ventures
2018
£m 20171
£m
Construction services and materials 116.9 11.3
Staff and associated costs 8.9 1.3
Management services 4.4 3.9
Interest on loans to joint ventures 0.7 0.8
Plant hire 0.8 –
131.7 17.3
1 The comparative figures have been restated to include £13.2m of transactions with joint ventures previously not disclosed.
Equity loans due from joint ventures are analysed below:
2018
£m 2017
£m
Kier Cornwall Street LLP 13.1 –
Kier Reading LLP 10.5 15.0
Kier Richmond Limited 9.9 –
Kier (Southampton) Investment Limited 9.3 –
Kier (Newcastle) Investment Limited 8.8 –
Kier Community Living LLP 8.4 –
Watford Health Campus Partnership LLP 7.7 –
Kier Sovereign LLP 5.2 0.3
50 Bothwell Street LLP 4.8 4.7
Kier Trade City LLP 4.3 10.7
Lysander Student Properties Investments Limited 3.9 –
Strawberry Percy LLP 3.3 –
Easingwold Devco LLP 2.9 –
Notaro Kier LLP 2.9 –
Stokesley Devco LLP 2.7 –
Tri-link 140 LLP 1.4 1.4
Black Rock Devco LLP 1.2 –
Winsford Devco LLP 1.1 1.1
Driffield Devco LLP 0.8 –
Kier Foley Street LLP – 20.9
Staffordshire Property Partnership – 0.1
102.2 54.2
Trading balances due from joint ventures are analysed below:
2018
£m 2017
£m
Hackney Schools for the Future Limited 2.7 –
Driffield Devco LLP 1.4 –
Solum Regeneration (Guildford) LLP 0.9 –
Stokesley Devco LLP 0.5 0.7
Kier (Southampton) Investment Limited 0.3 –
Watford Health Campus Partnership LLP 0.2 –
Kier Community Living LLP 0.2 –
Kier Sydenham LP 0.1 –
Kier Trade City LLP 0.1 –
Team Van Oord Limited 0.1 –
Black Rock Devco LLP – 1.0
Winsford Devco LLP – 0.8
6.5 2.5
172 Kier Group plc | Report and Accounts 2018
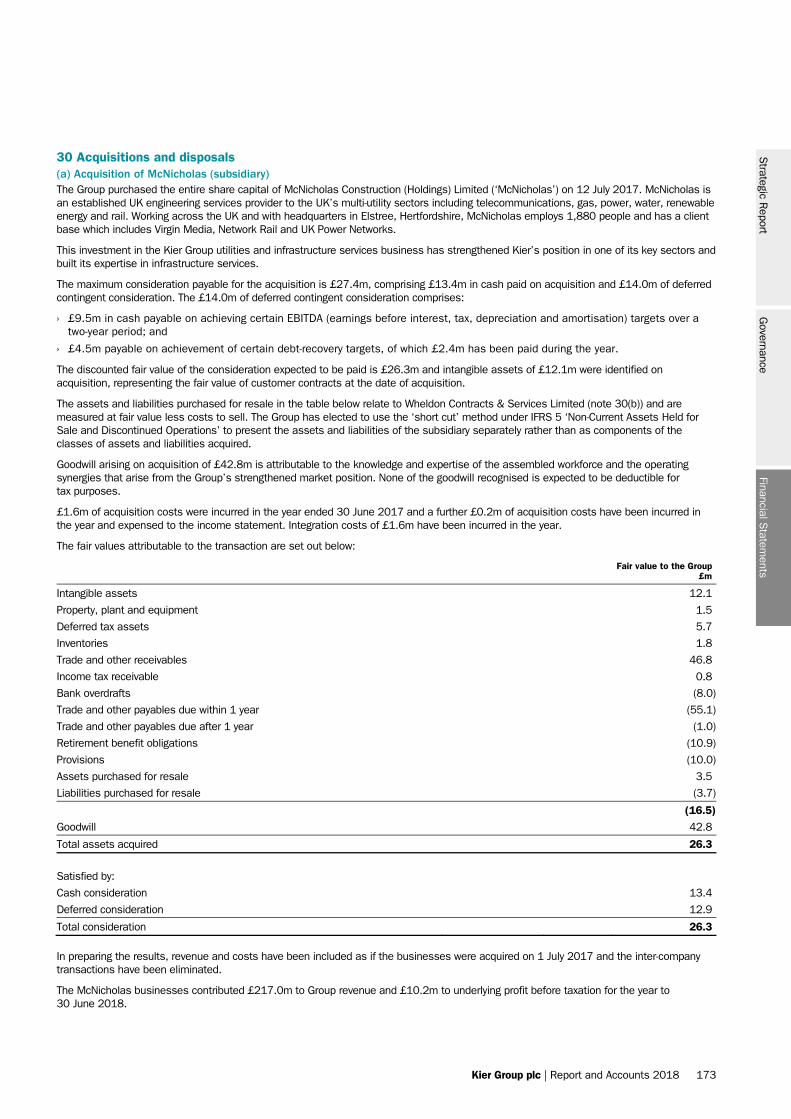
Kier Group plc | Report and Accounts 2018 173
30 Acquisitions and disposals (a) Acquisition of McNicholas (subsidiary) The Group purchased the entire share capital of McNicholas Construction (Holdings) Limited (‘McNicholas’) on 12 July 2017. McNicholas is an established UK engineering services provider to the UK’s multi-utility sectors including telecommunications, gas, power, water, renewable energy and rail. Working across the UK and with headquarters in Elstree, Hertfordshire, McNicholas employs 1,880 people and has a client base which includes Virgin Media, Network Rail and UK Power Networks.
This investment in the Kier Group utilities and infrastructure services business has strengthened Kier’s position in one of its key sectors and built its expertise in infrastructure services.
The maximum consideration payable for the acquisition is £27.4m, comprising £13.4m in cash paid on acquisition and £14.0m of deferred contingent consideration. The £14.0m of deferred contingent consideration comprises:
› £9.5m in cash payable on achieving certain EBITDA (earnings before interest, tax, depreciation and amortisation) targets over a two-year period; and
› £4.5m payable on achievement of certain debt-recovery targets, of which £2.4m has been paid during the year.
The discounted fair value of the consideration expected to be paid is £26.3m and intangible assets of £12.1m were identified on acquisition, representing the fair value of customer contracts at the date of acquisition.
The assets and liabilities purchased for resale in the table below relate to Wheldon Contracts & Services Limited (note 30(b)) and are measured at fair value less costs to sell. The Group has elected to use the ‘short cut’ method under IFRS 5 ‘Non-Current Assets Held for Sale and Discontinued Operations’ to present the assets and liabilities of the subsidiary separately rather than as components of the classes of assets and liabilities acquired.
Goodwill arising on acquisition of £42.8m is attributable to the knowledge and expertise of the assembled workforce and the operating synergies that arise from the Group’s strengthened market position. None of the goodwill recognised is expected to be deductible for tax purposes.
£1.6m of acquisition costs were incurred in the year ended 30 June 2017 and a further £0.2m of acquisition costs have been incurred in the year and expensed to the income statement. Integration costs of £1.6m have been incurred in the year.
The fair values attributable to the transaction are set out below:
Fair value to the Group
£m
Intangible assets 12.1
Property, plant and equipment 1.5
Deferred tax assets 5.7
Inventories 1.8
Trade and other receivables 46.8
Income tax receivable 0.8
Bank overdrafts (8.0)
Trade and other payables due within 1 year (55.1)
Trade and other payables due after 1 year (1.0)
Retirement benefit obligations (10.9)
Provisions (10.0)
Assets purchased for resale 3.5
Liabilities purchased for resale (3.7)
(16.5) Goodwill 42.8
Total assets acquired 26.3
Satisfied by:
Cash consideration 13.4
Deferred consideration 12.9
Total consideration 26.3
In preparing the results, revenue and costs have been included as if the businesses were acquired on 1 July 2017 and the inter-company transactions have been eliminated.
The McNicholas businesses contributed £217.0m to Group revenue and £10.2m to underlying profit before taxation for the year to 30 June 2018.
Financial Statem
entsS
trategic Report
Governance
Kier Group plc | Report and Accounts 2018 173
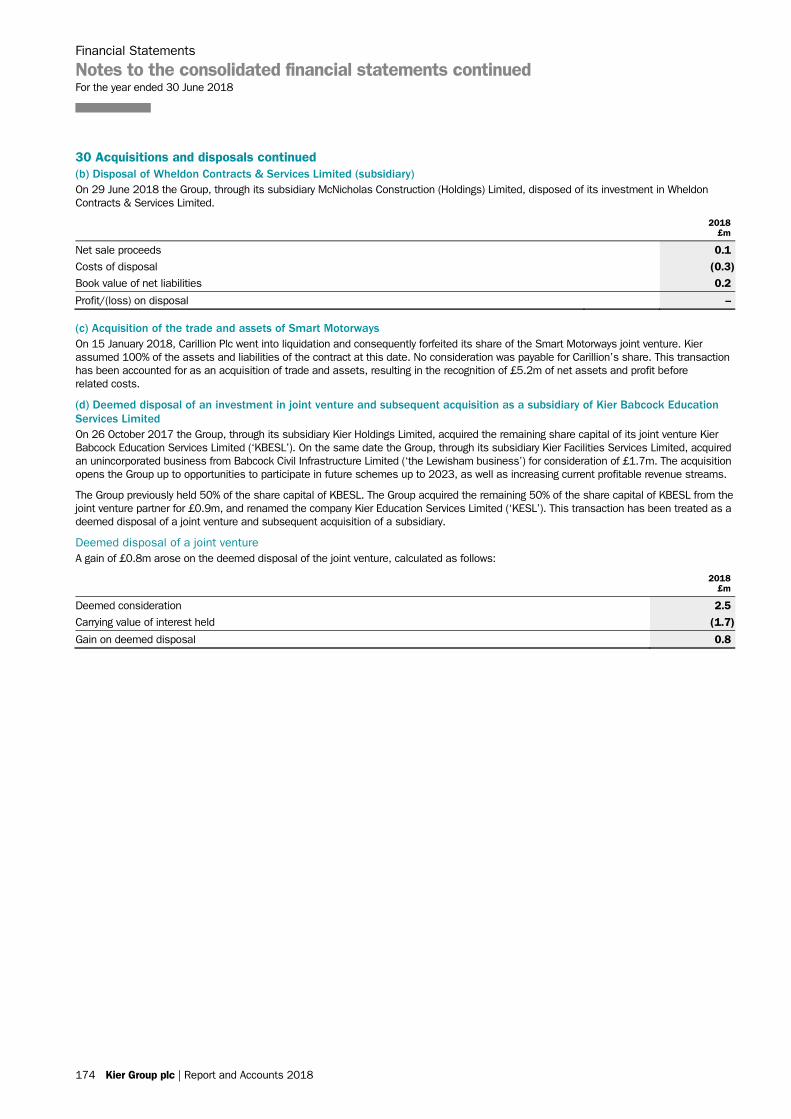
Financial Statements
Notes to the consolidated financial statements continued For the year ended 30 June 2018
174 Kier Group plc | Report and Accounts 2018
30 Acquisitions and disposals continued (b) Disposal of Wheldon Contracts & Services Limited (subsidiary) On 29 June 2018 the Group, through its subsidiary McNicholas Construction (Holdings) Limited, disposed of its investment in Wheldon Contracts & Services Limited.
2018
£m
Net sale proceeds 0.1 Costs of disposal (0.3) Book value of net liabilities 0.2
Profit/(loss) on disposal –
(c) Acquisition of the trade and assets of Smart Motorways On 15 January 2018, Carillion Plc went into liquidation and consequently forfeited its share of the Smart Motorways joint venture. Kier assumed 100% of the assets and liabilities of the contract at this date. No consideration was payable for Carillion’s share. This transaction has been accounted for as an acquisition of trade and assets, resulting in the recognition of £5.2m of net assets and profit before related costs.
(d) Deemed disposal of an investment in joint venture and subsequent acquisition as a subsidiary of Kier Babcock Education Services Limited On 26 October 2017 the Group, through its subsidiary Kier Holdings Limited, acquired the remaining share capital of its joint venture Kier Babcock Education Services Limited (‘KBESL’). On the same date the Group, through its subsidiary Kier Facilities Services Limited, acquired an unincorporated business from Babcock Civil Infrastructure Limited (‘the Lewisham business’) for consideration of £1.7m. The acquisition opens the Group up to opportunities to participate in future schemes up to 2023, as well as increasing current profitable revenue streams.
The Group previously held 50% of the share capital of KBESL. The Group acquired the remaining 50% of the share capital of KBESL from the joint venture partner for £0.9m, and renamed the company Kier Education Services Limited (‘KESL’). This transaction has been treated as a deemed disposal of a joint venture and subsequent acquisition of a subsidiary.
Deemed disposal of a joint venture A gain of £0.8m arose on the deemed disposal of the joint venture, calculated as follows:
2018
£m
Deemed consideration 2.5 Carrying value of interest held (1.7)
Gain on deemed disposal 0.8
174 Kier Group plc | Report and Accounts 2018
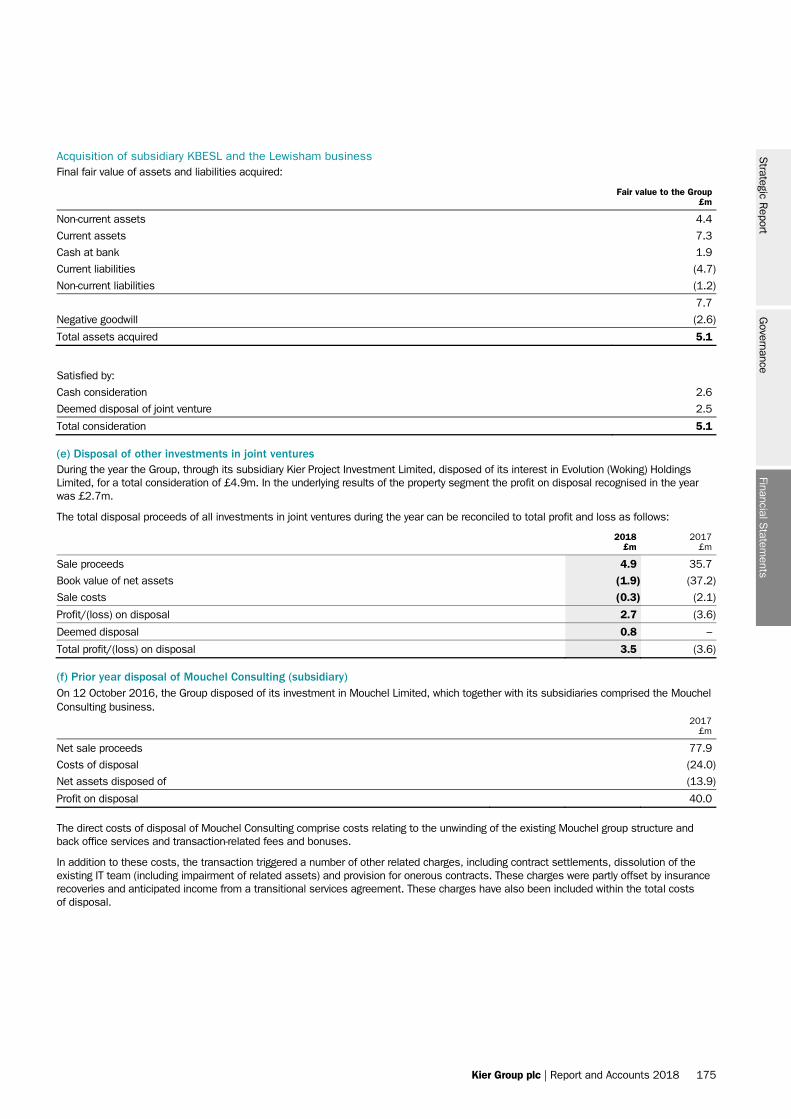
Kier Group plc | Report and Accounts 2018 175
Acquisition of subsidiary KBESL and the Lewisham business Final fair value of assets and liabilities acquired:
Fair value to the Group
£m
Non-current assets 4.4 Current assets 7.3 Cash at bank 1.9 Current liabilities (4.7) Non-current liabilities (1.2)
7.7
Negative goodwill (2.6)
Total assets acquired 5.1
Satisfied by:
Cash consideration 2.6 Deemed disposal of joint venture 2.5
Total consideration 5.1
(e) Disposal of other investments in joint ventures During the year the Group, through its subsidiary Kier Project Investment Limited, disposed of its interest in Evolution (Woking) Holdings Limited, for a total consideration of £4.9m. In the underlying results of the property segment the profit on disposal recognised in the year was £2.7m.
The total disposal proceeds of all investments in joint ventures during the year can be reconciled to total profit and loss as follows:
2018
£m 2017
£m
Sale proceeds 4.9 35.7
Book value of net assets (1.9) (37.2)
Sale costs (0.3) (2.1)
Profit/(loss) on disposal 2.7 (3.6)
Deemed disposal 0.8 –
Total profit/(loss) on disposal 3.5 (3.6)
(f) Prior year disposal of Mouchel Consulting (subsidiary) On 12 October 2016, the Group disposed of its investment in Mouchel Limited, which together with its subsidiaries comprised the Mouchel Consulting business.
2017
£m
Net sale proceeds 77.9
Costs of disposal (24.0)
Net assets disposed of (13.9)
Profit on disposal 40.0
The direct costs of disposal of Mouchel Consulting comprise costs relating to the unwinding of the existing Mouchel group structure and back office services and transaction-related fees and bonuses.
In addition to these costs, the transaction triggered a number of other related charges, including contract settlements, dissolution of the existing IT team (including impairment of related assets) and provision for onerous contracts. These charges were partly offset by insurance recoveries and anticipated income from a transitional services agreement. These charges have also been included within the total costs of disposal.
Financial Statem
entsS
trategic Report
Governance
Kier Group plc | Report and Accounts 2018 175
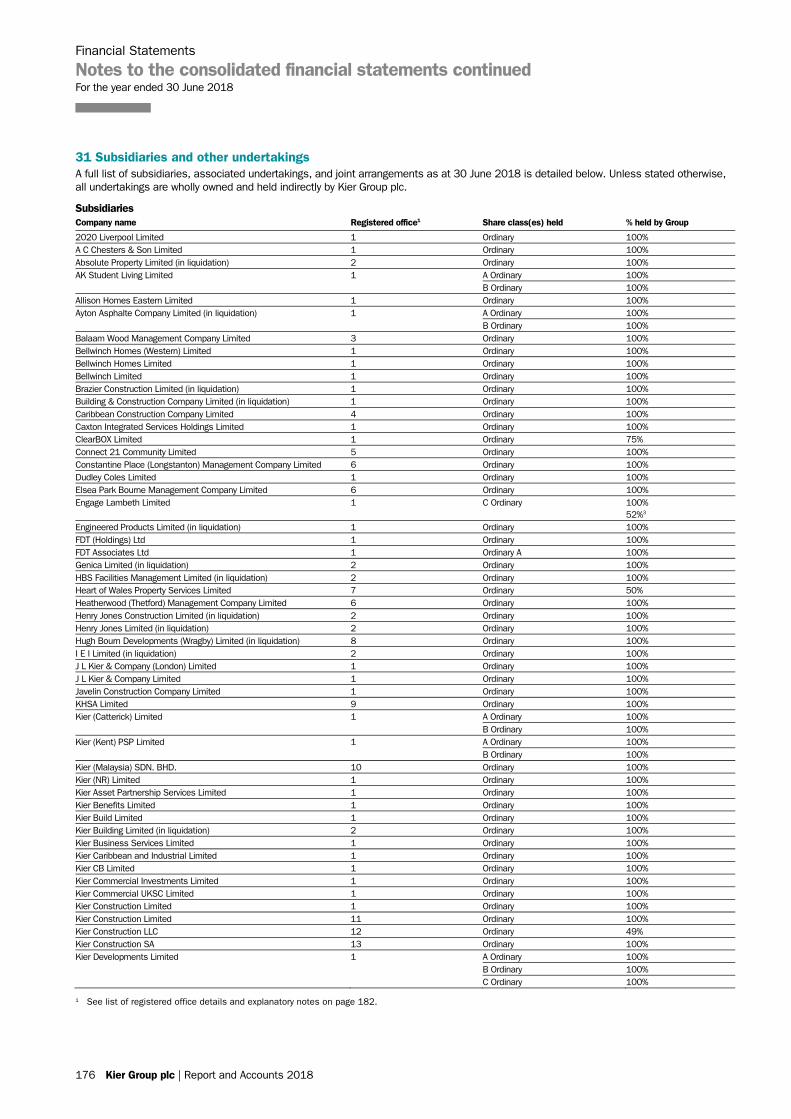
Financial Statements
Notes to the consolidated financial statements continued For the year ended 30 June 2018
176 Kier Group plc | Report and Accounts 2018
31 Subsidiaries and other undertakings A full list of subsidiaries, associated undertakings, and joint arrangements as at 30 June 2018 is detailed below. Unless stated otherwise, all undertakings are wholly owned and held indirectly by Kier Group plc.
Subsidiaries Company name Registered office1 Share class(es) held % held by Group
2020 Liverpool Limited 1 Ordinary 100% A C Chesters & Son Limited 1 Ordinary 100% Absolute Property Limited (in liquidation) 2 Ordinary 100% AK Student Living Limited 1 A Ordinary 100% B Ordinary 100% Allison Homes Eastern Limited 1 Ordinary 100% Ayton Asphalte Company Limited (in liquidation) 1 A Ordinary 100% B Ordinary 100% Balaam Wood Management Company Limited 3 Ordinary 100% Bellwinch Homes (Western) Limited 1 Ordinary 100% Bellwinch Homes Limited 1 Ordinary 100% Bellwinch Limited 1 Ordinary 100% Brazier Construction Limited (in liquidation) 1 Ordinary 100% Building & Construction Company Limited (in liquidation) 1 Ordinary 100% Caribbean Construction Company Limited 4 Ordinary 100% Caxton Integrated Services Holdings Limited 1 Ordinary 100% ClearBOX Limited 1 Ordinary 75% Connect 21 Community Limited 5 Ordinary 100% Constantine Place (Longstanton) Management Company Limited 6 Ordinary 100% Dudley Coles Limited 1 Ordinary 100% Elsea Park Bourne Management Company Limited 6 Ordinary 100% Engage Lambeth Limited 1 C Ordinary 100% 52%3 Engineered Products Limited (in liquidation) 1 Ordinary 100% FDT (Holdings) Ltd 1 Ordinary 100% FDT Associates Ltd 1 Ordinary A 100% Genica Limited (in liquidation) 2 Ordinary 100% HBS Facilities Management Limited (in liquidation) 2 Ordinary 100% Heart of Wales Property Services Limited 7 Ordinary 50% Heatherwood (Thetford) Management Company Limited 6 Ordinary 100% Henry Jones Construction Limited (in liquidation) 2 Ordinary 100% Henry Jones Limited (in liquidation) 2 Ordinary 100% Hugh Bourn Developments (Wragby) Limited (in liquidation) 8 Ordinary 100% I E I Limited (in liquidation) 2 Ordinary 100% J L Kier & Company (London) Limited 1 Ordinary 100% J L Kier & Company Limited 1 Ordinary 100% Javelin Construction Company Limited 1 Ordinary 100% KHSA Limited 9 Ordinary 100% Kier (Catterick) Limited 1 A Ordinary 100% B Ordinary 100% Kier (Kent) PSP Limited 1 A Ordinary 100% B Ordinary 100% Kier (Malaysia) SDN. BHD. 10 Ordinary 100% Kier (NR) Limited 1 Ordinary 100% Kier Asset Partnership Services Limited 1 Ordinary 100% Kier Benefits Limited 1 Ordinary 100% Kier Build Limited 1 Ordinary 100% Kier Building Limited (in liquidation) 2 Ordinary 100% Kier Business Services Limited 1 Ordinary 100% Kier Caribbean and Industrial Limited 1 Ordinary 100% Kier CB Limited 1 Ordinary 100% Kier Commercial Investments Limited 1 Ordinary 100% Kier Commercial UKSC Limited 1 Ordinary 100% Kier Construction Limited 1 Ordinary 100% Kier Construction Limited 11 Ordinary 100% Kier Construction LLC 12 Ordinary 49% Kier Construction SA 13 Ordinary 100% Kier Developments Limited 1 A Ordinary 100% B Ordinary 100% C Ordinary 100%
1 See list of registered office details and explanatory notes on page 182.
176 Kier Group plc | Report and Accounts 2018
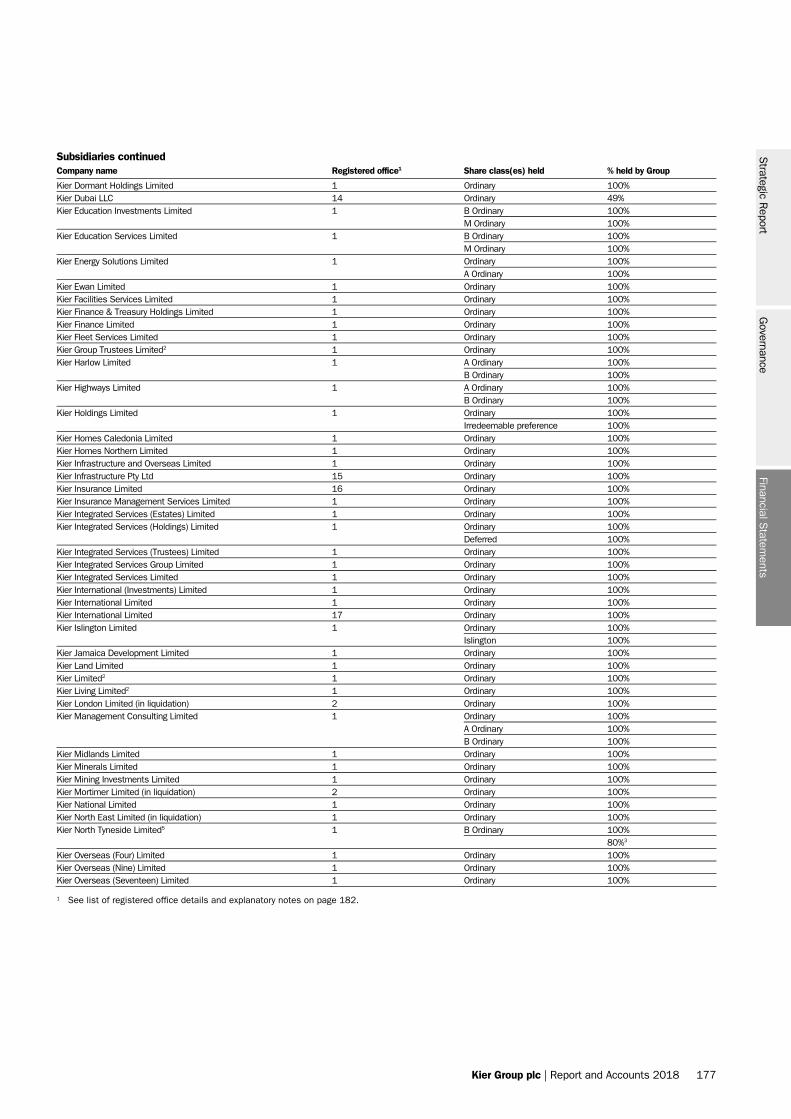
Kier Group plc | Report and Accounts 2018 177
Subsidiaries continued Company name Registered office1 Share class(es) held % held by Group
Kier Dormant Holdings Limited 1 Ordinary 100% Kier Dubai LLC 14 Ordinary 49% Kier Education Investments Limited 1 B Ordinary 100% M Ordinary 100% Kier Education Services Limited 1 B Ordinary 100% M Ordinary 100% Kier Energy Solutions Limited 1 Ordinary 100% A Ordinary 100% Kier Ewan Limited 1 Ordinary 100% Kier Facilities Services Limited 1 Ordinary 100% Kier Finance & Treasury Holdings Limited 1 Ordinary 100% Kier Finance Limited 1 Ordinary 100% Kier Fleet Services Limited 1 Ordinary 100% Kier Group Trustees Limited2 1 Ordinary 100% Kier Harlow Limited 1 A Ordinary 100% B Ordinary 100% Kier Highways Limited 1 A Ordinary 100% B Ordinary 100% Kier Holdings Limited 1 Ordinary 100% Irredeemable preference 100% Kier Homes Caledonia Limited 1 Ordinary 100% Kier Homes Northern Limited 1 Ordinary 100% Kier Infrastructure and Overseas Limited 1 Ordinary 100% Kier Infrastructure Pty Ltd 15 Ordinary 100% Kier Insurance Limited 16 Ordinary 100% Kier Insurance Management Services Limited 1 Ordinary 100% Kier Integrated Services (Estates) Limited 1 Ordinary 100% Kier Integrated Services (Holdings) Limited 1 Ordinary 100% Deferred 100% Kier Integrated Services (Trustees) Limited 1 Ordinary 100% Kier Integrated Services Group Limited 1 Ordinary 100% Kier Integrated Services Limited 1 Ordinary 100% Kier International (Investments) Limited 1 Ordinary 100% Kier International Limited 1 Ordinary 100% Kier International Limited 17 Ordinary 100% Kier Islington Limited 1 Ordinary 100% Islington 100% Kier Jamaica Development Limited 1 Ordinary 100% Kier Land Limited 1 Ordinary 100% Kier Limited2 1 Ordinary 100% Kier Living Limited2 1 Ordinary 100% Kier London Limited (in liquidation) 2 Ordinary 100% Kier Management Consulting Limited 1 Ordinary 100% A Ordinary 100% B Ordinary 100% Kier Midlands Limited 1 Ordinary 100% Kier Minerals Limited 1 Ordinary 100% Kier Mining Investments Limited 1 Ordinary 100% Kier Mortimer Limited (in liquidation) 2 Ordinary 100% Kier National Limited 1 Ordinary 100% Kier North East Limited (in liquidation) 1 Ordinary 100% Kier North Tyneside Limited5 1 B Ordinary 100% 80%3 Kier Overseas (Four) Limited 1 Ordinary 100% Kier Overseas (Nine) Limited 1 Ordinary 100% Kier Overseas (Seventeen) Limited 1 Ordinary 100%
1 See list of registered office details and explanatory notes on page 182.
Financial Statem
entsS
trategic Report
Governance
Kier Group plc | Report and Accounts 2018 177
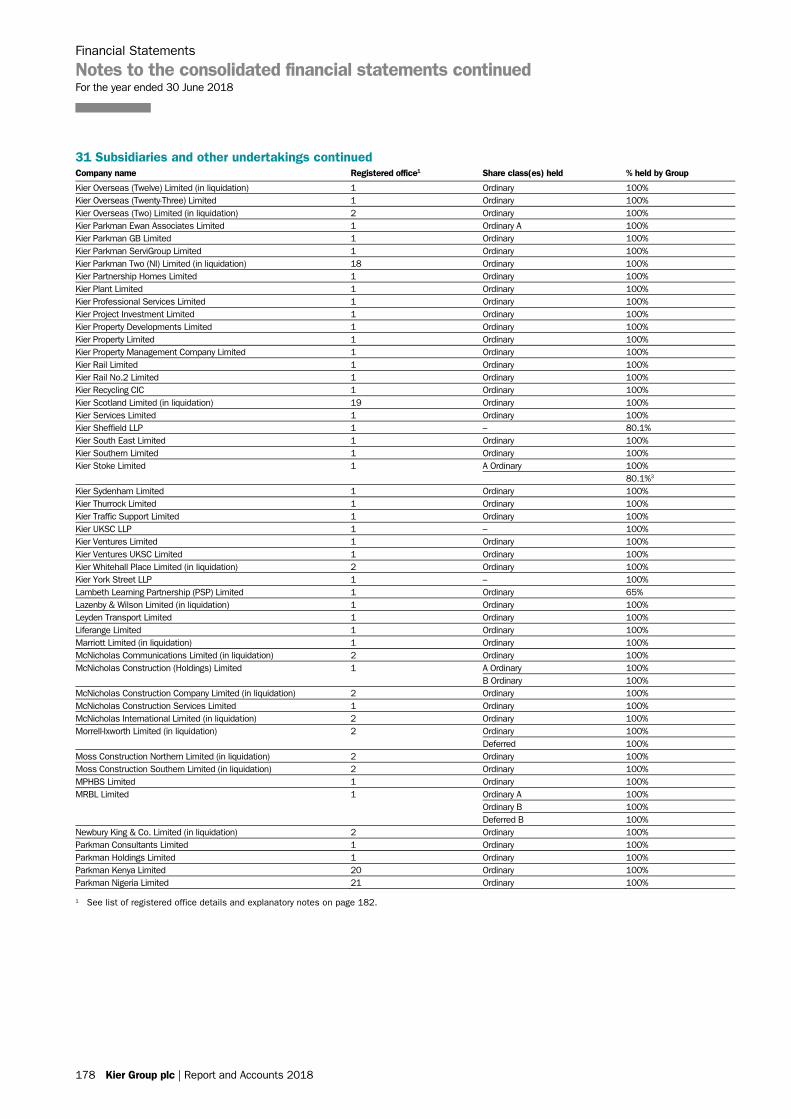
Financial Statements
Notes to the consolidated financial statements continued For the year ended 30 June 2018
178 Kier Group plc | Report and Accounts 2018
31 Subsidiaries and other undertakings continued Company name Registered office1 Share class(es) held % held by Group
Kier Overseas (Twelve) Limited (in liquidation) 1 Ordinary 100% Kier Overseas (Twenty-Three) Limited 1 Ordinary 100% Kier Overseas (Two) Limited (in liquidation) 2 Ordinary 100% Kier Parkman Ewan Associates Limited 1 Ordinary A 100% Kier Parkman GB Limited 1 Ordinary 100% Kier Parkman ServiGroup Limited 1 Ordinary 100% Kier Parkman Two (NI) Limited (in liquidation) 18 Ordinary 100% Kier Partnership Homes Limited 1 Ordinary 100% Kier Plant Limited 1 Ordinary 100% Kier Professional Services Limited 1 Ordinary 100% Kier Project Investment Limited 1 Ordinary 100% Kier Property Developments Limited 1 Ordinary 100% Kier Property Limited 1 Ordinary 100% Kier Property Management Company Limited 1 Ordinary 100% Kier Rail Limited 1 Ordinary 100% Kier Rail No.2 Limited 1 Ordinary 100% Kier Recycling CIC 1 Ordinary 100% Kier Scotland Limited (in liquidation) 19 Ordinary 100% Kier Services Limited 1 Ordinary 100% Kier Sheffield LLP 1 – 80.1% Kier South East Limited 1 Ordinary 100% Kier Southern Limited 1 Ordinary 100% Kier Stoke Limited 1 A Ordinary 100% 80.1%3 Kier Sydenham Limited 1 Ordinary 100% Kier Thurrock Limited 1 Ordinary 100% Kier Traffic Support Limited 1 Ordinary 100% Kier UKSC LLP 1 – 100% Kier Ventures Limited 1 Ordinary 100% Kier Ventures UKSC Limited 1 Ordinary 100% Kier Whitehall Place Limited (in liquidation) 2 Ordinary 100% Kier York Street LLP 1 – 100% Lambeth Learning Partnership (PSP) Limited 1 Ordinary 65% Lazenby & Wilson Limited (in liquidation) 1 Ordinary 100% Leyden Transport Limited 1 Ordinary 100% Liferange Limited 1 Ordinary 100% Marriott Limited (in liquidation) 1 Ordinary 100% McNicholas Communications Limited (in liquidation) 2 Ordinary 100% McNicholas Construction (Holdings) Limited 1 A Ordinary 100% B Ordinary 100% McNicholas Construction Company Limited (in liquidation) 2 Ordinary 100% McNicholas Construction Services Limited 1 Ordinary 100% McNicholas International Limited (in liquidation) 2 Ordinary 100% Morrell-Ixworth Limited (in liquidation) 2 Ordinary 100% Deferred 100% Moss Construction Northern Limited (in liquidation) 2 Ordinary 100% Moss Construction Southern Limited (in liquidation) 2 Ordinary 100% MPHBS Limited 1 Ordinary 100% MRBL Limited 1 Ordinary A 100% Ordinary B 100% Deferred B 100% Newbury King & Co. Limited (in liquidation) 2 Ordinary 100% Parkman Consultants Limited 1 Ordinary 100% Parkman Holdings Limited 1 Ordinary 100% Parkman Kenya Limited 20 Ordinary 100% Parkman Nigeria Limited 21 Ordinary 100%
1 See list of registered office details and explanatory notes on page 182.
178 Kier Group plc | Report and Accounts 2018
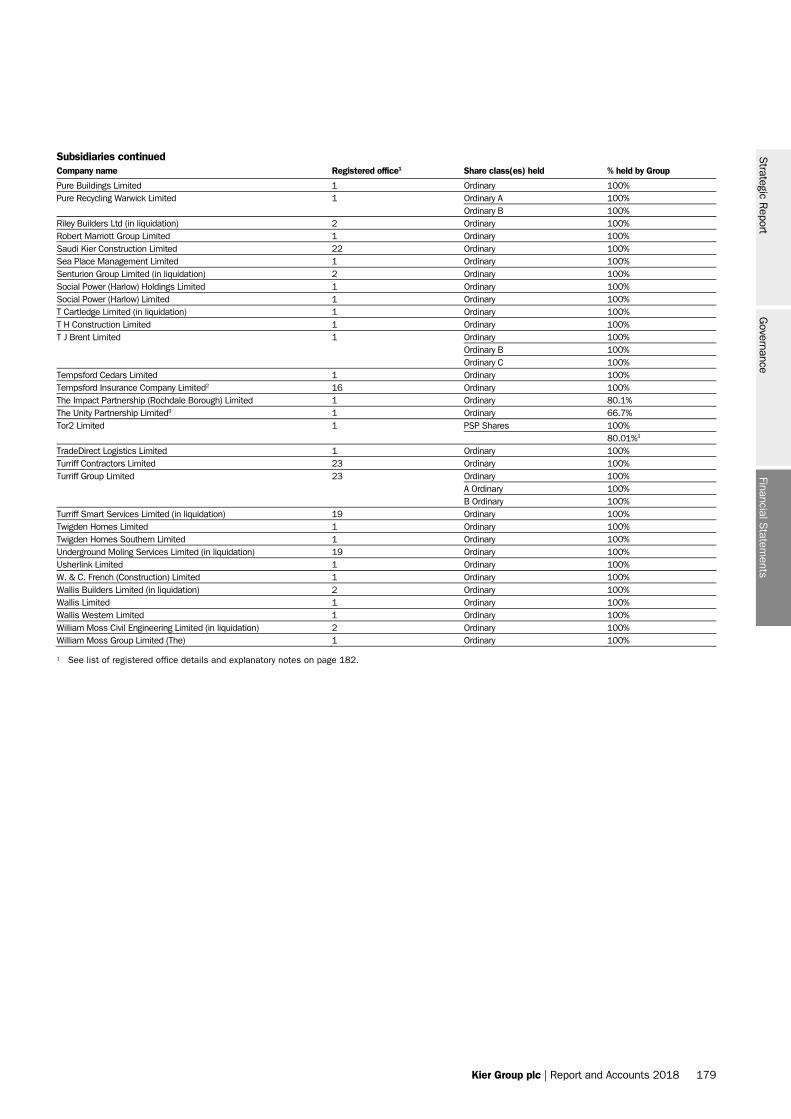
Kier Group plc | Report and Accounts 2018 179
Subsidiaries continued Company name Registered office1 Share class(es) held % held by Group
Pure Buildings Limited 1 Ordinary 100% Pure Recycling Warwick Limited 1 Ordinary A 100% Ordinary B 100% Riley Builders Ltd (in liquidation) 2 Ordinary 100% Robert Marriott Group Limited 1 Ordinary 100% Saudi Kier Construction Limited 22 Ordinary 100% Sea Place Management Limited 1 Ordinary 100% Senturion Group Limited (in liquidation) 2 Ordinary 100% Social Power (Harlow) Holdings Limited 1 Ordinary 100% Social Power (Harlow) Limited 1 Ordinary 100% T Cartledge Limited (in liquidation) 1 Ordinary 100% T H Construction Limited 1 Ordinary 100% T J Brent Limited 1 Ordinary 100% Ordinary B 100% Ordinary C 100% Tempsford Cedars Limited 1 Ordinary 100% Tempsford Insurance Company Limited2 16 Ordinary 100% The Impact Partnership (Rochdale Borough) Limited 1 Ordinary 80.1% The Unity Partnership Limited9 1 Ordinary 66.7% Tor2 Limited 1 PSP Shares 100% 80.01%3 TradeDirect Logistics Limited 1 Ordinary 100% Turriff Contractors Limited 23 Ordinary 100% Turriff Group Limited 23 Ordinary 100% A Ordinary 100% B Ordinary 100% Turriff Smart Services Limited (in liquidation) 19 Ordinary 100% Twigden Homes Limited 1 Ordinary 100% Twigden Homes Southern Limited 1 Ordinary 100% Underground Moling Services Limited (in liquidation) 19 Ordinary 100% Usherlink Limited 1 Ordinary 100% W. & C. French (Construction) Limited 1 Ordinary 100% Wallis Builders Limited (in liquidation) 2 Ordinary 100% Wallis Limited 1 Ordinary 100% Wallis Western Limited 1 Ordinary 100% William Moss Civil Engineering Limited (in liquidation) 2 Ordinary 100% William Moss Group Limited (The) 1 Ordinary 100%
1 See list of registered office details and explanatory notes on page 182.
Financial Statem
entsS
trategic Report
Governance
Kier Group plc | Report and Accounts 2018 179
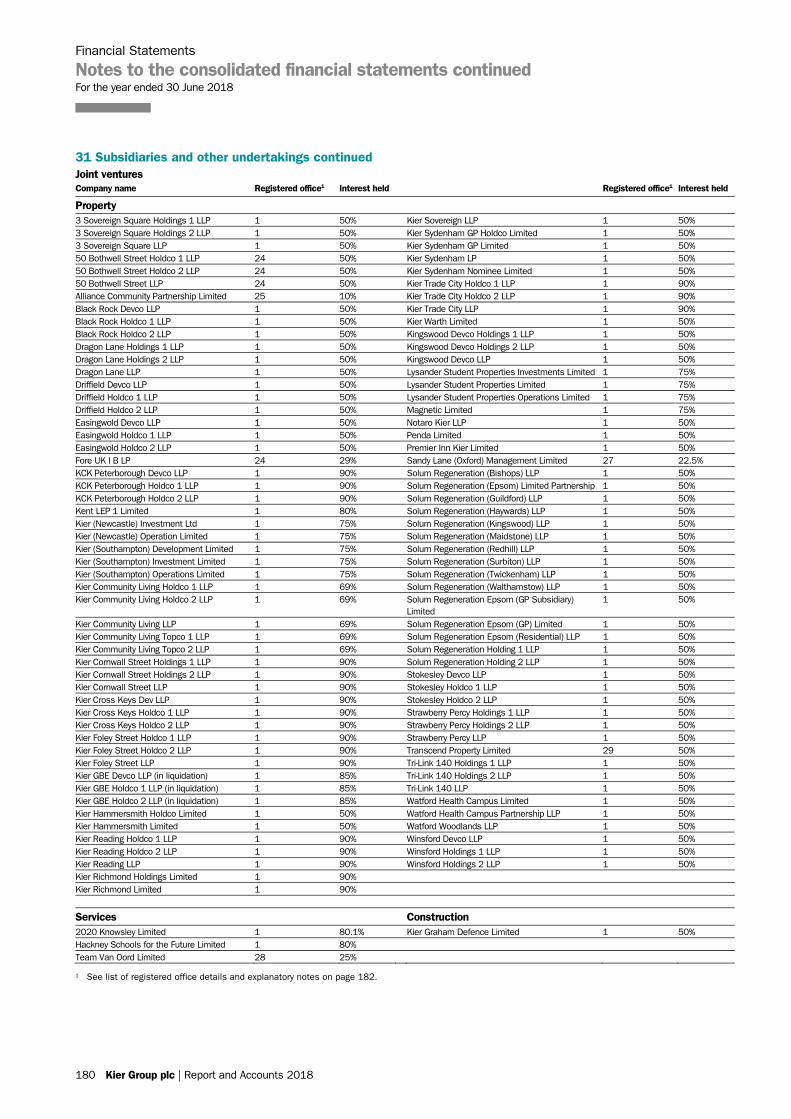
Financial Statements
Notes to the consolidated financial statements continued For the year ended 30 June 2018
180 Kier Group plc | Report and Accounts 2018
31 Subsidiaries and other undertakings continued Joint ventures Company name Registered office1 Interest held Registered office1 Interest held
Property 3 Sovereign Square Holdings 1 LLP 1 50% Kier Sovereign LLP 1 50% 3 Sovereign Square Holdings 2 LLP 1 50% Kier Sydenham GP Holdco Limited 1 50% 3 Sovereign Square LLP 1 50% Kier Sydenham GP Limited 1 50% 50 Bothwell Street Holdco 1 LLP 24 50% Kier Sydenham LP 1 50% 50 Bothwell Street Holdco 2 LLP 24 50% Kier Sydenham Nominee Limited 1 50% 50 Bothwell Street LLP 24 50% Kier Trade City Holdco 1 LLP 1 90% Alliance Community Partnership Limited 25 10% Kier Trade City Holdco 2 LLP 1 90% Black Rock Devco LLP 1 50% Kier Trade City LLP 1 90% Black Rock Holdco 1 LLP 1 50% Kier Warth Limited 1 50% Black Rock Holdco 2 LLP 1 50% Kingswood Devco Holdings 1 LLP 1 50% Dragon Lane Holdings 1 LLP 1 50% Kingswood Devco Holdings 2 LLP 1 50% Dragon Lane Holdings 2 LLP 1 50% Kingswood Devco LLP 1 50% Dragon Lane LLP 1 50% Lysander Student Properties Investments Limited 1 75% Driffield Devco LLP 1 50% Lysander Student Properties Limited 1 75% Driffield Holdco 1 LLP 1 50% Lysander Student Properties Operations Limited 1 75% Driffield Holdco 2 LLP 1 50% Magnetic Limited 1 75% Easingwold Devco LLP 1 50% Notaro Kier LLP 1 50% Easingwold Holdco 1 LLP 1 50% Penda Limited 1 50% Easingwold Holdco 2 LLP 1 50% Premier Inn Kier Limited 1 50% Fore UK I B LP 24 29% Sandy Lane (Oxford) Management Limited 27 22.5% KCK Peterborough Devco LLP 1 90% Solum Regeneration (Bishops) LLP 1 50% KCK Peterborough Holdco 1 LLP 1 90% Solum Regeneration (Epsom) Limited Partnership 1 50% KCK Peterborough Holdco 2 LLP 1 90% Solum Regeneration (Guildford) LLP 1 50% Kent LEP 1 Limited 1 80% Solum Regeneration (Haywards) LLP 1 50% Kier (Newcastle) Investment Ltd 1 75% Solum Regeneration (Kingswood) LLP 1 50% Kier (Newcastle) Operation Limited 1 75% Solum Regeneration (Maidstone) LLP 1 50% Kier (Southampton) Development Limited 1 75% Solum Regeneration (Redhill) LLP 1 50% Kier (Southampton) Investment Limited 1 75% Solum Regeneration (Surbiton) LLP 1 50% Kier (Southampton) Operations Limited 1 75% Solum Regeneration (Twickenham) LLP 1 50% Kier Community Living Holdco 1 LLP 1 69% Solum Regeneration (Walthamstow) LLP 1 50% Kier Community Living Holdco 2 LLP 1 69%
Solum Regeneration Epsom (GP Subsidiary) Limited
1 50%
Kier Community Living LLP 1 69% Solum Regeneration Epsom (GP) Limited 1 50% Kier Community Living Topco 1 LLP 1 69% Solum Regeneration Epsom (Residential) LLP 1 50% Kier Community Living Topco 2 LLP 1 69% Solum Regeneration Holding 1 LLP 1 50% Kier Cornwall Street Holdings 1 LLP 1 90% Solum Regeneration Holding 2 LLP 1 50% Kier Cornwall Street Holdings 2 LLP 1 90% Stokesley Devco LLP 1 50% Kier Cornwall Street LLP 1 90% Stokesley Holdco 1 LLP 1 50% Kier Cross Keys Dev LLP 1 90% Stokesley Holdco 2 LLP 1 50% Kier Cross Keys Holdco 1 LLP 1 90% Strawberry Percy Holdings 1 LLP 1 50% Kier Cross Keys Holdco 2 LLP 1 90% Strawberry Percy Holdings 2 LLP 1 50% Kier Foley Street Holdco 1 LLP 1 90% Strawberry Percy LLP 1 50% Kier Foley Street Holdco 2 LLP 1 90% Transcend Property Limited 29 50% Kier Foley Street LLP 1 90% Tri-Link 140 Holdings 1 LLP 1 50% Kier GBE Devco LLP (in liquidation) 1 85% Tri-Link 140 Holdings 2 LLP 1 50% Kier GBE Holdco 1 LLP (in liquidation) 1 85% Tri-Link 140 LLP 1 50% Kier GBE Holdco 2 LLP (in liquidation) 1 85% Watford Health Campus Limited 1 50% Kier Hammersmith Holdco Limited 1 50% Watford Health Campus Partnership LLP 1 50% Kier Hammersmith Limited 1 50% Watford Woodlands LLP 1 50% Kier Reading Holdco 1 LLP 1 90% Winsford Devco LLP 1 50% Kier Reading Holdco 2 LLP 1 90% Winsford Holdings 1 LLP 1 50% Kier Reading LLP 1 90% Winsford Holdings 2 LLP 1 50% Kier Richmond Holdings Limited 1 90% Kier Richmond Limited 1 90%
Services Construction 2020 Knowsley Limited 1 80.1% Kier Graham Defence Limited 1 50% Hackney Schools for the Future Limited 1 80% Team Van Oord Limited 28 25%
1 See list of registered office details and explanatory notes on page 182.
180 Kier Group plc | Report and Accounts 2018
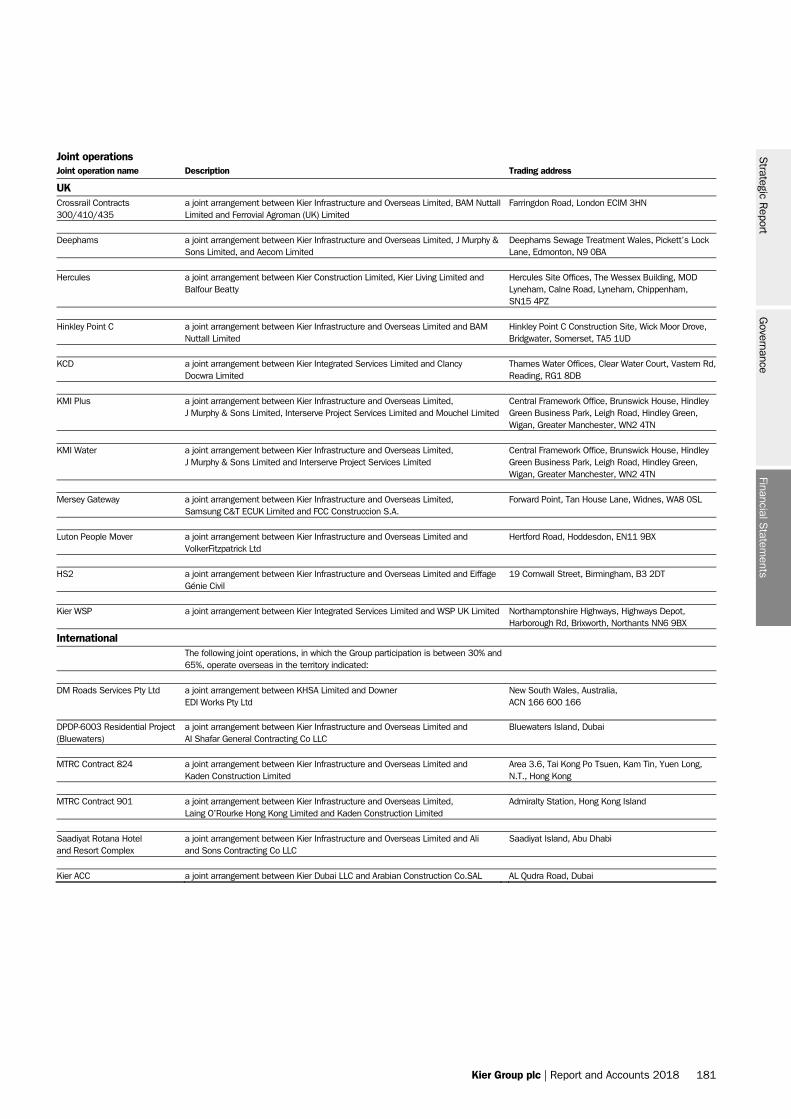
Kier Group plc | Report and Accounts 2018 181
Joint operations Joint operation name Description Trading address
UK Crossrail Contracts 300/410/435
a joint arrangement between Kier Infrastructure and Overseas Limited, BAM Nuttall Limited and Ferrovial Agroman (UK) Limited
Farringdon Road, London ECIM 3HN
Deephams a joint arrangement between Kier Infrastructure and Overseas Limited, J Murphy &
Sons Limited, and Aecom Limited Deephams Sewage Treatment Wales, Pickett’s Lock Lane, Edmonton, N9 0BA
Hercules a joint arrangement between Kier Construction Limited, Kier Living Limited and
Balfour Beatty
Hercules Site Offices, The Wessex Building, MOD Lyneham, Calne Road, Lyneham, Chippenham, SN15 4PZ
Hinkley Point C a joint arrangement between Kier Infrastructure and Overseas Limited and BAM
Nuttall Limited Hinkley Point C Construction Site, Wick Moor Drove, Bridgwater, Somerset, TA5 1UD
KCD a joint arrangement between Kier Integrated Services Limited and Clancy
Docwra Limited Thames Water Offices, Clear Water Court, Vastern Rd, Reading, RG1 8DB
KMI Plus a joint arrangement between Kier Infrastructure and Overseas Limited,
J Murphy & Sons Limited, Interserve Project Services Limited and Mouchel Limited
Central Framework Office, Brunswick House, Hindley Green Business Park, Leigh Road, Hindley Green, Wigan, Greater Manchester, WN2 4TN
KMI Water a joint arrangement between Kier Infrastructure and Overseas Limited,
J Murphy & Sons Limited and Interserve Project Services Limited
Central Framework Office, Brunswick House, Hindley Green Business Park, Leigh Road, Hindley Green, Wigan, Greater Manchester, WN2 4TN
Mersey Gateway a joint arrangement between Kier Infrastructure and Overseas Limited,
Samsung C&T ECUK Limited and FCC Construccion S.A. Forward Point, Tan House Lane, Widnes, WA8 0SL
Luton People Mover a joint arrangement between Kier Infrastructure and Overseas Limited and
VolkerFitzpatrick Ltd Hertford Road, Hoddesdon, EN11 9BX
HS2 a joint arrangement between Kier Infrastructure and Overseas Limited and Eiffage
Génie Civil 19 Cornwall Street, Birmingham, B3 2DT
Kier WSP a joint arrangement between Kier Integrated Services Limited and WSP UK Limited
Northamptonshire Highways, Highways Depot, Harborough Rd, Brixworth, Northants NN6 9BX
International
The following joint operations, in which the Group participation is between 30% and65%, operate overseas in the territory indicated:
DM Roads Services Pty Ltd a joint arrangement between KHSA Limited and Downer
EDI Works Pty Ltd
New South Wales, Australia, ACN 166 600 166
DPDP-6003 Residential Project (Bluewaters)
a joint arrangement between Kier Infrastructure and Overseas Limited and AI Shafar General Contracting Co LLC
Bluewaters Island, Dubai
MTRC Contract 824 a joint arrangement between Kier Infrastructure and Overseas Limited and
Kaden Construction Limited Area 3.6, Tai Kong Po Tsuen, Kam Tin, Yuen Long, N.T., Hong Kong
MTRC Contract 901 a joint arrangement between Kier Infrastructure and Overseas Limited,
Laing O’Rourke Hong Kong Limited and Kaden Construction Limited Admiralty Station, Hong Kong Island
Saadiyat Rotana Hotel and Resort Complex
a joint arrangement between Kier Infrastructure and Overseas Limited and Ali and Sons Contracting Co LLC
Saadiyat Island, Abu Dhabi
Kier ACC a joint arrangement between Kier Dubai LLC and Arabian Construction Co.SAL AL Qudra Road, Dubai
Financial Statem
entsS
trategic Report
Governance
Kier Group plc | Report and Accounts 2018 181
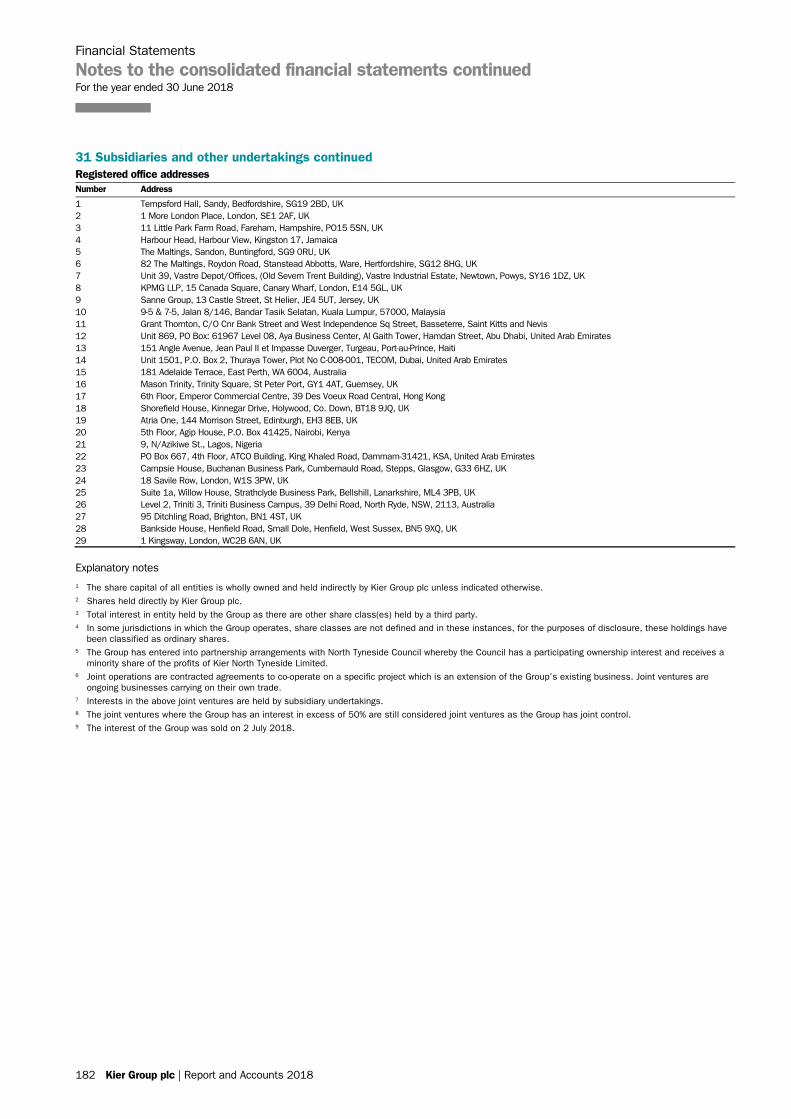
Financial Statements
Notes to the consolidated financial statements continued For the year ended 30 June 2018
182 Kier Group plc | Report and Accounts 2018
31 Subsidiaries and other undertakings continued Registered office addresses Number Address
1 Tempsford Hall, Sandy, Bedfordshire, SG19 2BD, UK 2 1 More London Place, London, SE1 2AF, UK 3 11 Little Park Farm Road, Fareham, Hampshire, PO15 5SN, UK 4 Harbour Head, Harbour View, Kingston 17, Jamaica 5 The Maltings, Sandon, Buntingford, SG9 0RU, UK 6 82 The Maltings, Roydon Road, Stanstead Abbotts, Ware, Hertfordshire, SG12 8HG, UK 7 Unit 39, Vastre Depot/Offices, (Old Severn Trent Building), Vastre Industrial Estate, Newtown, Powys, SY16 1DZ, UK 8 KPMG LLP, 15 Canada Square, Canary Wharf, London, E14 5GL, UK 9 Sanne Group, 13 Castle Street, St Helier, JE4 5UT, Jersey, UK 10 9-5 & 7-5, Jalan 8/146, Bandar Tasik Selatan, Kuala Lumpur, 57000, Malaysia 11 Grant Thornton, C/O Cnr Bank Street and West Independence Sq Street, Basseterre, Saint Kitts and Nevis 12 Unit 869, PO Box: 61967 Level 08, Aya Business Center, Al Gaith Tower, Hamdan Street, Abu Dhabi, United Arab Emirates 13 151 Angle Avenue, Jean Paul II et Impasse Duverger, Turgeau, Port-au-Prince, Haiti 14 Unit 1501, P.O. Box 2, Thuraya Tower, Plot No C-008-001, TECOM, Dubai, United Arab Emirates 15 181 Adelaide Terrace, East Perth, WA 6004, Australia 16 Mason Trinity, Trinity Square, St Peter Port, GY1 4AT, Guernsey, UK 17 6th Floor, Emperor Commercial Centre, 39 Des Voeux Road Central, Hong Kong 18 Shorefield House, Kinnegar Drive, Holywood, Co. Down, BT18 9JQ, UK 19 Atria One, 144 Morrison Street, Edinburgh, EH3 8EB, UK 20 5th Floor, Agip House, P.O. Box 41425, Nairobi, Kenya 21 9, N/Azikiwe St., Lagos, Nigeria 22 PO Box 667, 4th Floor, ATCO Building, King Khaled Road, Dammam-31421, KSA, United Arab Emirates 23 Campsie House, Buchanan Business Park, Cumbernauld Road, Stepps, Glasgow, G33 6HZ, UK 24 18 Savile Row, London, W1S 3PW, UK 25 Suite 1a, Willow House, Strathclyde Business Park, Bellshill, Lanarkshire, ML4 3PB, UK 26 Level 2, Triniti 3, Triniti Business Campus, 39 Delhi Road, North Ryde, NSW, 2113, Australia 27 95 Ditchling Road, Brighton, BN1 4ST, UK 28 Bankside House, Henfield Road, Small Dole, Henfield, West Sussex, BN5 9XQ, UK 29 1 Kingsway, London, WC2B 6AN, UK
Explanatory notes 1 The share capital of all entities is wholly owned and held indirectly by Kier Group plc unless indicated otherwise. 2 Shares held directly by Kier Group plc. 3 Total interest in entity held by the Group as there are other share class(es) held by a third party. 4 In some jurisdictions in which the Group operates, share classes are not defined and in these instances, for the purposes of disclosure, these holdings have
been classified as ordinary shares. 5 The Group has entered into partnership arrangements with North Tyneside Council whereby the Council has a participating ownership interest and receives a
minority share of the profits of Kier North Tyneside Limited. 6 Joint operations are contracted agreements to co-operate on a specific project which is an extension of the Group’s existing business. Joint ventures are
ongoing businesses carrying on their own trade. 7 Interests in the above joint ventures are held by subsidiary undertakings. 8 The joint ventures where the Group has an interest in excess of 50% are still considered joint ventures as the Group has joint control. 9 The interest of the Group was sold on 2 July 2018.
182 Kier Group plc | Report and Accounts 2018
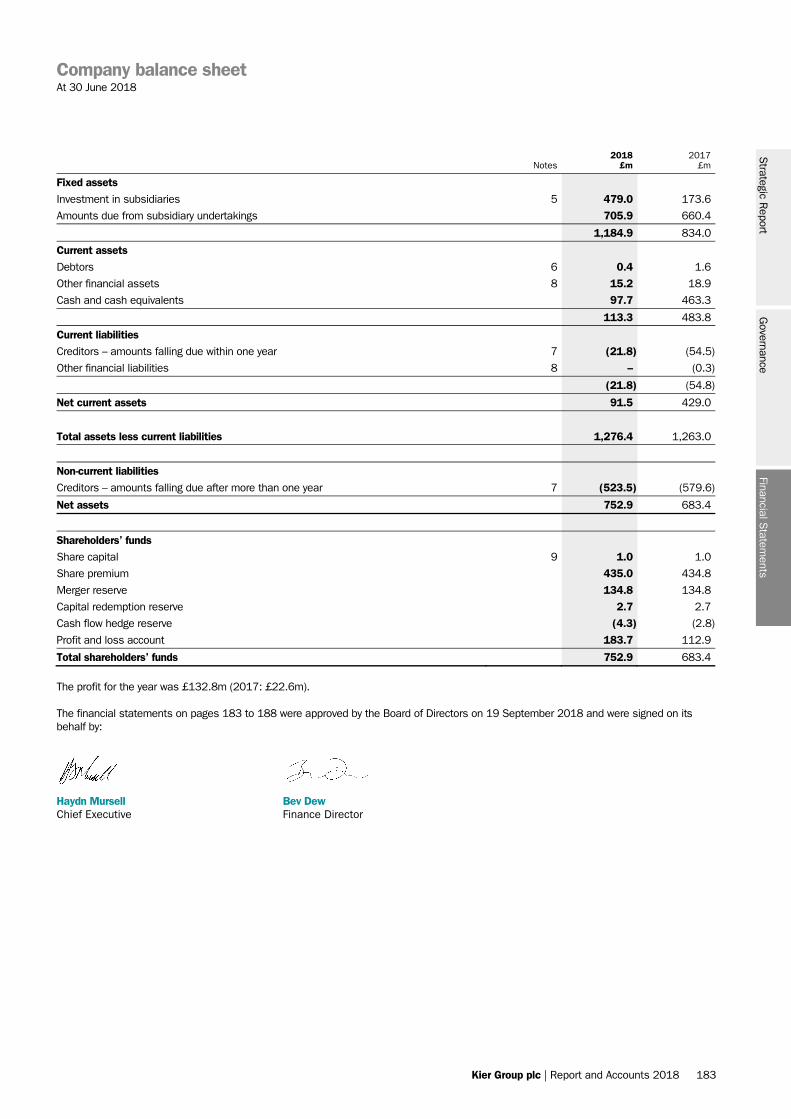
Company balance sheet At 30 June 2018
Kier Group plc | Report and Accounts 2018 183
Notes 2018
£m 2017
£m
Fixed assets Investment in subsidiaries 5 479.0 173.6
Amounts due from subsidiary undertakings 705.9 660.4
1,184.9 834.0
Current assets Debtors 6 0.4 1.6
Other financial assets 8 15.2 18.9
Cash and cash equivalents 97.7 463.3
113.3 483.8
Current liabilities Creditors – amounts falling due within one year 7 (21.8) (54.5)
Other financial liabilities 8 – (0.3)
(21.8) (54.8)
Net current assets 91.5 429.0
Total assets less current liabilities 1,276.4 1,263.0
Non-current liabilities Creditors – amounts falling due after more than one year 7 (523.5) (579.6)
Net assets 752.9 683.4
Shareholders’ funds Share capital 9 1.0 1.0
Share premium 435.0 434.8
Merger reserve 134.8 134.8
Capital redemption reserve 2.7 2.7
Cash flow hedge reserve (4.3) (2.8)
Profit and loss account 183.7 112.9
Total shareholders’ funds 752.9 683.4
The profit for the year was £132.8m (2017: £22.6m).
The financial statements on pages 183 to 188 were approved by the Board of Directors on 19 September 2018 and were signed on its behalf by:
Haydn Mursell Bev Dew Chief Executive Finance Director
Financial Statem
entsS
trategic Report
Governance
Kier Group plc | Report and Accounts 2018 183
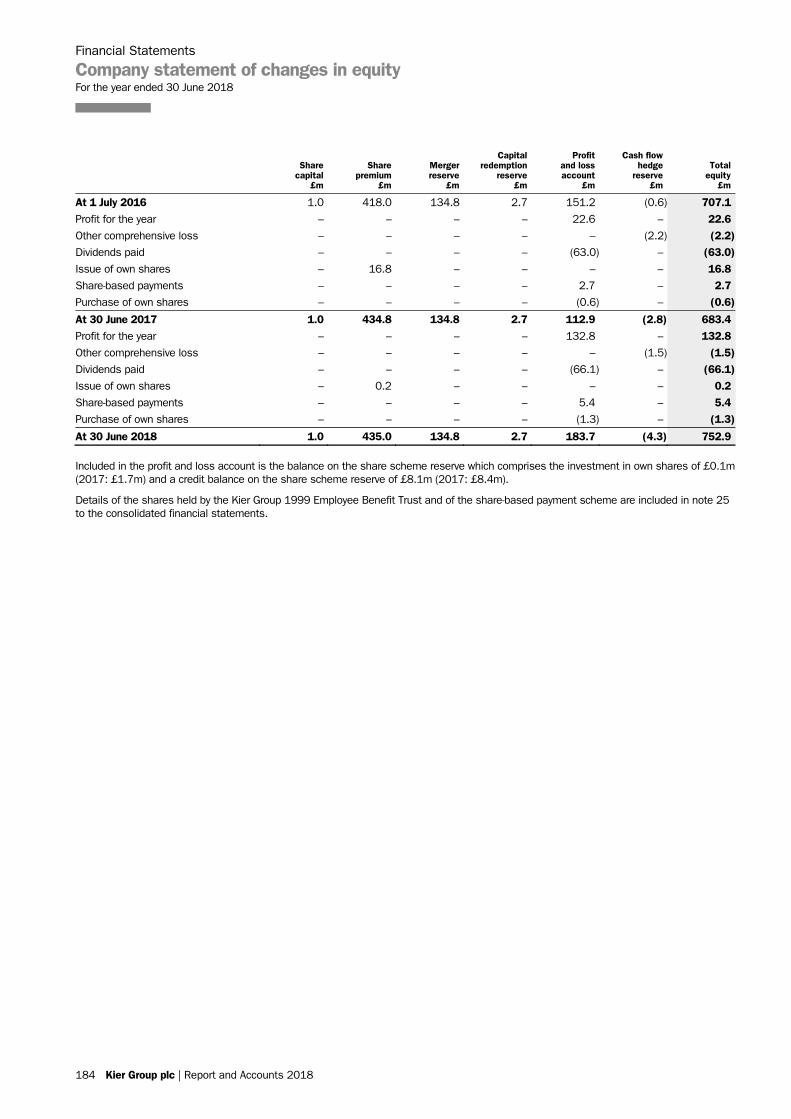
Financial Statements
Company statement of changes in equity For the year ended 30 June 2018
184 Kier Group plc | Report and Accounts 2018
Share capital
£m
Share premium
£m
Merger reserve
£m
Capital redemption
reserve £m
Profit and loss account
£m
Cash flow hedge
reserve £m
Total equity
£m
At 1 July 2016 1.0 418.0 134.8 2.7 151.2 (0.6) 707.1 Profit for the year – – – – 22.6 – 22.6 Other comprehensive loss – – – – – (2.2) (2.2) Dividends paid – – – – (63.0) – (63.0) Issue of own shares – 16.8 – – – – 16.8 Share-based payments – – – – 2.7 – 2.7 Purchase of own shares – – – – (0.6) – (0.6)
At 30 June 2017 1.0 434.8 134.8 2.7 112.9 (2.8) 683.4 Profit for the year – – – – 132.8 – 132.8 Other comprehensive loss – – – – – (1.5) (1.5) Dividends paid – – – – (66.1) – (66.1) Issue of own shares – 0.2 – – – – 0.2 Share-based payments – – – – 5.4 – 5.4 Purchase of own shares – – – – (1.3) – (1.3)
At 30 June 2018 1.0 435.0 134.8 2.7 183.7 (4.3) 752.9
Included in the profit and loss account is the balance on the share scheme reserve which comprises the investment in own shares of £0.1m (2017: £1.7m) and a credit balance on the share scheme reserve of £8.1m (2017: £8.4m).
Details of the shares held by the Kier Group 1999 Employee Benefit Trust and of the share-based payment scheme are included in note 25 to the consolidated financial statements.
184 Kier Group plc | Report and Accounts 2018
Notes to the Company financial statements For the year ended 30 June 2018
Kier Group plc | Report and Accounts 2018 185
1 Accounting policies The principal accounting policies are summarised below. They have been applied consistently throughout the year and the preceding year.
Basis of preparation The financial statements have been prepared in accordance with Financial Reporting Standard 101 ‘Reduced Disclosure Framework’ (FRS 101) and the Companies Act 2006. The financial statements have been prepared under the historical cost convention.
Kier Group plc is a company incorporated in the United Kingdom under the Companies Act. The address of the registered office is given on page 190.
The Company’s financial statements are included in the Kier Group plc consolidated financial statements for the year ended 30 June 2018. As permitted by Section 408 of the Companies Act 2006, the Company has not presented its own profit and loss account.
The Company has taken advantage of the following disclosure exemptions in preparing these financial statements, as permitted by FRS 101.
› The requirement of paragraphs 45(b) and 46 to 52 of IFRS 2 ‘Share Based Payment’
› The requirements of IFRS 7 ‘Financial Instruments: Disclosures’
› The requirements of paragraphs 91 to 99 of IFRS 13 ‘Fair Value Measurement’
› The requirement in paragraph 38 of IAS 1 ‘Presentation of Financial Statements’ to present comparative information in respect of paragraph 79(a)(iv) of IAS 1
› The requirement of paragraphs 10(d), 10a(f), 16, 38A, 38B, 38C, 38D, 40A, 40B, 40C, 40D and 111 of IAS 1 ‘Presentation of Financial Statements’
› The requirements of paragraphs 134 to 136 of IAS 1 ‘Presentation of Financial Statements’
› The requirements of IAS 7 ‘Statement of Cash Flows’
› The requirements of paragraphs 30 and 31 of IAS 8 ‘Accounting Policies, Changes in Accounting Estimates and Errors’
› The requirement of paragraphs 17 and 18A of IAS 24 ‘Related Party Disclosures’
› The requirements in IAS 24 ‘Related party disclosures’ to disclose related party transaction entered into between two or more members of a group
› The requirements of paragraphs 134(d) to 134(f) and 135(c) to 135(e) of IAS 36 ‘Impairment of Assets’
These financial statements are separate financial statements. The Company is exempt from the preparation of consolidated financial statements because these are included in the Annual Report and Financial Statements of the Group.
Where required, equivalent disclosures are given in the Annual Report and Financial Statements of the Group as shown in notes 1 to 9.
Going concern The Directors have made enquiries and have a reasonable expectation that the Company has adequate resources to continue in existence for the foreseeable future. For this reason, they adopt the going concern basis in preparing the financial statements.
Fixed asset investments Investments in subsidiary undertakings are included in the balance sheet at cost less any provision for impairment.
Taxation Income tax comprises current and deferred tax. Income tax is recognised in the income statement except to the extent that it relates to items recognised directly in equity, in which case it is recognised in equity.
Current tax is the expected tax payable on taxable income for the year, using tax rates enacted or substantively enacted at the balance sheet date, and any adjustment to tax payable in respect of previous years.
Deferred tax is provided using the balance sheet method, providing for temporary differences between the carrying amounts of assets and liabilities for financial reporting purposes and the amounts used for taxation purposes. The deferred tax provision is based on the expected manner of realisation or settlement of the carrying amount of the assets and liabilities, using tax rates enacted or substantively enacted at the balance sheet date.
A deferred tax asset is recognised only to the extent that it is probable that future taxable profits will be available against which the asset can be utilised. Deferred tax assets are reduced to the extent that it is no longer probable that the related tax benefit will be realised.
Financial instruments Financial assets and financial liabilities are recognised in the Company’s balance sheet when the Company becomes a party to the contractual provisions of the instrument. The principal financial assets and liabilities of the Company are as follows:
(a) Cash and cash equivalents Cash and cash equivalents comprise cash at bank and in hand, including bank deposits with original maturities of three months or less, net of bank overdrafts where legal right of set-off exists. Bank overdrafts are included within financial liabilities in current liabilities in the balance sheet.
(b) Bank and other borrowings Interest-bearing bank and other borrowings are recorded at the fair value of the proceeds received, net of direct issue costs. Finance charges, including premiums payable on settlement or redemption and direct issue costs, are accounted for on an accruals basis in the income statement using the effective interest method and are added to the carrying value of the instrument to the extent that they are not settled in the period in which they arise.
Financial Statem
entsS
trategic Report
Governance
Kier Group plc | Report and Accounts 2018 185
Financial Statements
Notes to the Company financial statements continued For the year ended 30 June 2018
186 Kier Group plc | Report and Accounts 2018
1 Accounting policies continued (c) Derivative financial instruments Derivatives are initially recognised at fair value on the date that the contract is entered into and subsequently remeasured in future periods at their fair value. The method of recognising the resulting change in fair value depends on whether the derivative is designated as a hedging instrument and whether the hedging relationship is effective.
For cash flow hedges the effective part of the change in fair value of these derivatives is recognised directly in other comprehensive income. Any ineffective portion is recognised immediately in the income statement. Amounts accumulated in equity are recycled to the income statement in the periods when the hedged items will affect profit or loss. The fair value of interest rate derivatives is the estimated amount that the Company would receive or pay to terminate the derivatives at the balance sheet date.
If the hedging instrument no longer meets the criteria for hedge accounting, expires or is sold, terminated or exercised, the hedge accounting is discontinued prospectively. The cumulative gain or loss previously recognised in equity remains there until the forecast transaction occurs.
The Company enters into forward contracts in order to hedge against transactional foreign currency exposures. In cases where these derivative instruments are significant, hedge accounting is applied as described above. Where hedge accounting is not applied, changes in fair value of derivatives are recognised in the income statement. Fair values are based on quoted market prices at the balance sheet date.
Share-based payments Share-based payments granted but not vested are valued at the fair value of the shares at the date of grant. This affects the Sharesave and Long Term Incentive Plan (‘LTIP’) schemes. The fair value of these schemes at the date of award is calculated using the Black-Scholes model apart from the total shareholder return element of the LTIP which is based on a Stochastic model.
The cost to the Company of awards to employees under the LTIP scheme is spread on a straight-line basis over the relevant performance period. The scheme awards to senior employees a number of shares which will vest after three years if particular criteria are met. The cost of the scheme is based on the fair value of the shares at the date the options are granted.
Shares purchased and held in trust in connection with the Company’s share schemes are deducted from retained earnings. No gain or loss is recognised within the income statement on the market value of these shares compared with the original cost.
Critical accounting judgements and key sources of estimation uncertainty In the application of the Company accounting policies which are described above, the Directors are required to make judgements, estimates and assumptions about the carrying amounts of assets and liabilities that are not readily apparent from other sources. The estimates are based on historical experience and the factors that are considered to be relevant. Actual results may differ from those estimates.
The estimates are reviewed on an ongoing basis. Revisions to accounting estimates are recognised in the period in which the estimate is revised.
There are no critical judgements, apart from those involving estimates, that the Directors have made in the process of applying the Company’s accounting policies and that have a significant effect on the amounts recognised in the financial statements.
2 Profit for the year As permitted by section 408 of the Companies Act 2006, the Company has elected not to present its own profit and loss account for the year. The profit for the year was £132.8m (2017: £22.6m).
The auditors’ remuneration for audit services to the Company was £0.1m (2017: £0.1m).
3 Information relating to Directors and employees Information relating to Directors’ emoluments, pension entitlements, share options and LTIP interests appears in the Directors’ Remuneration Report on pages 86 to 107. The Company has no employees other than the Directors.
4 Dividends Details of the dividends paid by the Company are included in note 10 to the consolidated financial statements.
186 Kier Group plc | Report and Accounts 2018
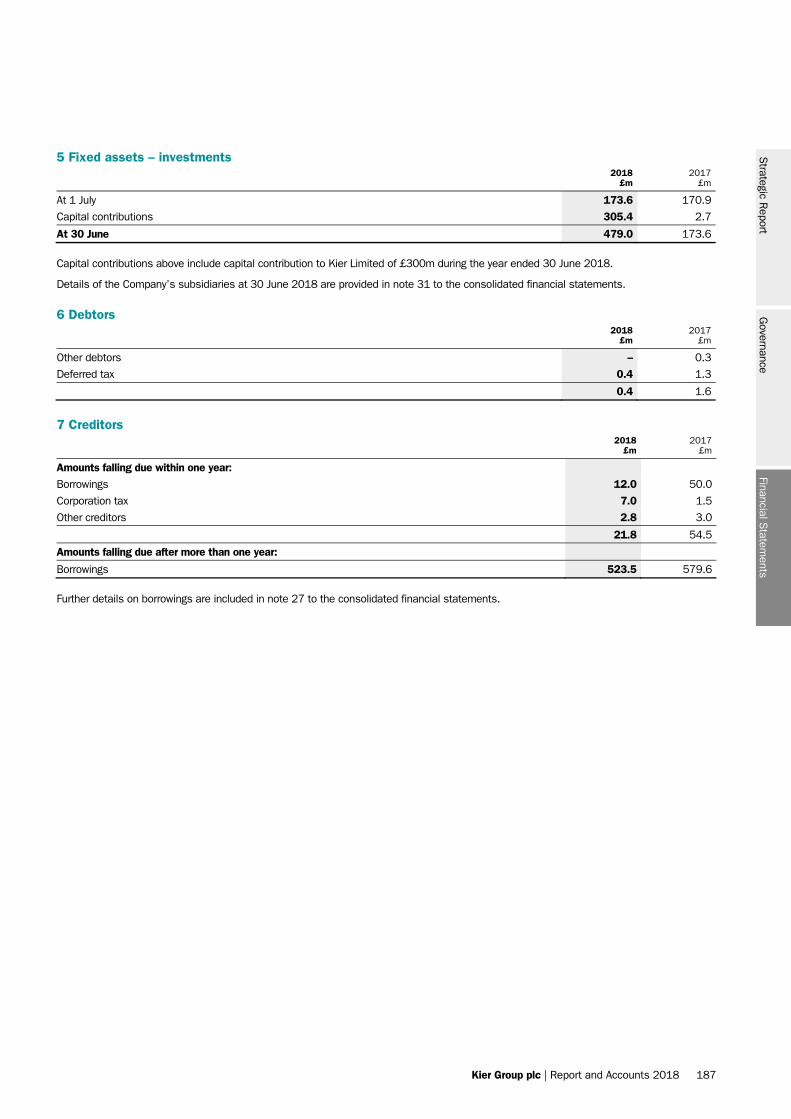
Kier Group plc | Report and Accounts 2018 187
5 Fixed assets – investments
2018
£m 2017
£m
At 1 July 173.6 170.9
Capital contributions 305.4 2.7
At 30 June 479.0 173.6
Capital contributions above include capital contribution to Kier Limited of £300m during the year ended 30 June 2018.
Details of the Company’s subsidiaries at 30 June 2018 are provided in note 31 to the consolidated financial statements.
6 Debtors
2018
£m 2017
£m
Other debtors – 0.3
Deferred tax 0.4 1.3
0.4 1.6
7 Creditors
2018
£m 2017
£m
Amounts falling due within one year:
Borrowings 12.0 50.0
Corporation tax 7.0 1.5
Other creditors 2.8 3.0
21.8 54.5
Amounts falling due after more than one year:
Borrowings 523.5 579.6
Further details on borrowings are included in note 27 to the consolidated financial statements.
Financial Statem
entsS
trategic Report
Governance
Kier Group plc | Report and Accounts 2018 187
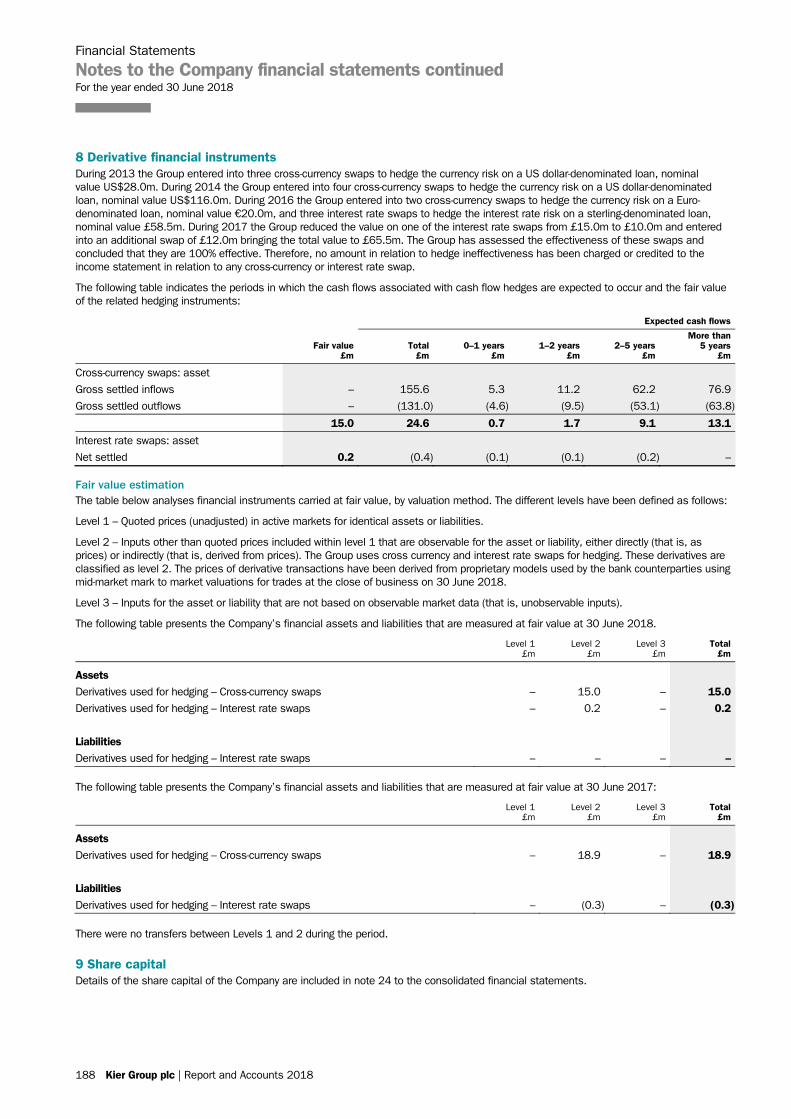
Financial Statements
Notes to the Company financial statements continued For the year ended 30 June 2018
188 Kier Group plc | Report and Accounts 2018
8 Derivative financial instruments During 2013 the Group entered into three cross-currency swaps to hedge the currency risk on a US dollar-denominated loan, nominal value US$28.0m. During 2014 the Group entered into four cross-currency swaps to hedge the currency risk on a US dollar-denominated loan, nominal value US$116.0m. During 2016 the Group entered into two cross-currency swaps to hedge the currency risk on a Euro-denominated loan, nominal value €20.0m, and three interest rate swaps to hedge the interest rate risk on a sterling-denominated loan, nominal value £58.5m. During 2017 the Group reduced the value on one of the interest rate swaps from £15.0m to £10.0m and entered into an additional swap of £12.0m bringing the total value to £65.5m. The Group has assessed the effectiveness of these swaps and concluded that they are 100% effective. Therefore, no amount in relation to hedge ineffectiveness has been charged or credited to the income statement in relation to any cross-currency or interest rate swap.
The following table indicates the periods in which the cash flows associated with cash flow hedges are expected to occur and the fair value of the related hedging instruments:
Expected cash flows
Fair value
£m Total
£m 0–1 years
£m 1–2 years
£m 2–5 years
£m
More than 5 years
£m
Cross-currency swaps: asset
Gross settled inflows – 155.6 5.3 11.2 62.2 76.9
Gross settled outflows – (131.0) (4.6) (9.5) (53.1) (63.8)
15.0 24.6 0.7 1.7 9.1 13.1
Interest rate swaps: asset
Net settled 0.2 (0.4) (0.1) (0.1) (0.2) –
Fair value estimation The table below analyses financial instruments carried at fair value, by valuation method. The different levels have been defined as follows:
Level 1 – Quoted prices (unadjusted) in active markets for identical assets or liabilities.
Level 2 – Inputs other than quoted prices included within level 1 that are observable for the asset or liability, either directly (that is, as prices) or indirectly (that is, derived from prices). The Group uses cross currency and interest rate swaps for hedging. These derivatives are classified as level 2. The prices of derivative transactions have been derived from proprietary models used by the bank counterparties using mid-market mark to market valuations for trades at the close of business on 30 June 2018.
Level 3 – Inputs for the asset or liability that are not based on observable market data (that is, unobservable inputs).
The following table presents the Company’s financial assets and liabilities that are measured at fair value at 30 June 2018.
Level 1
£m Level 2
£m Level 3
£m Total
£m
Assets Derivatives used for hedging – Cross-currency swaps – 15.0 – 15.0 Derivatives used for hedging – Interest rate swaps – 0.2 – 0.2 Liabilities Derivatives used for hedging – Interest rate swaps – – – –
The following table presents the Company’s financial assets and liabilities that are measured at fair value at 30 June 2017:
Level 1
£m Level 2
£m Level 3
£m Total
£m
Assets Derivatives used for hedging – Cross-currency swaps – 18.9 – 18.9 Liabilities Derivatives used for hedging – Interest rate swaps – (0.3) – (0.3)
There were no transfers between Levels 1 and 2 during the period.
9 Share capital Details of the share capital of the Company are included in note 24 to the consolidated financial statements.
188 Kier Group plc | Report and Accounts 2018
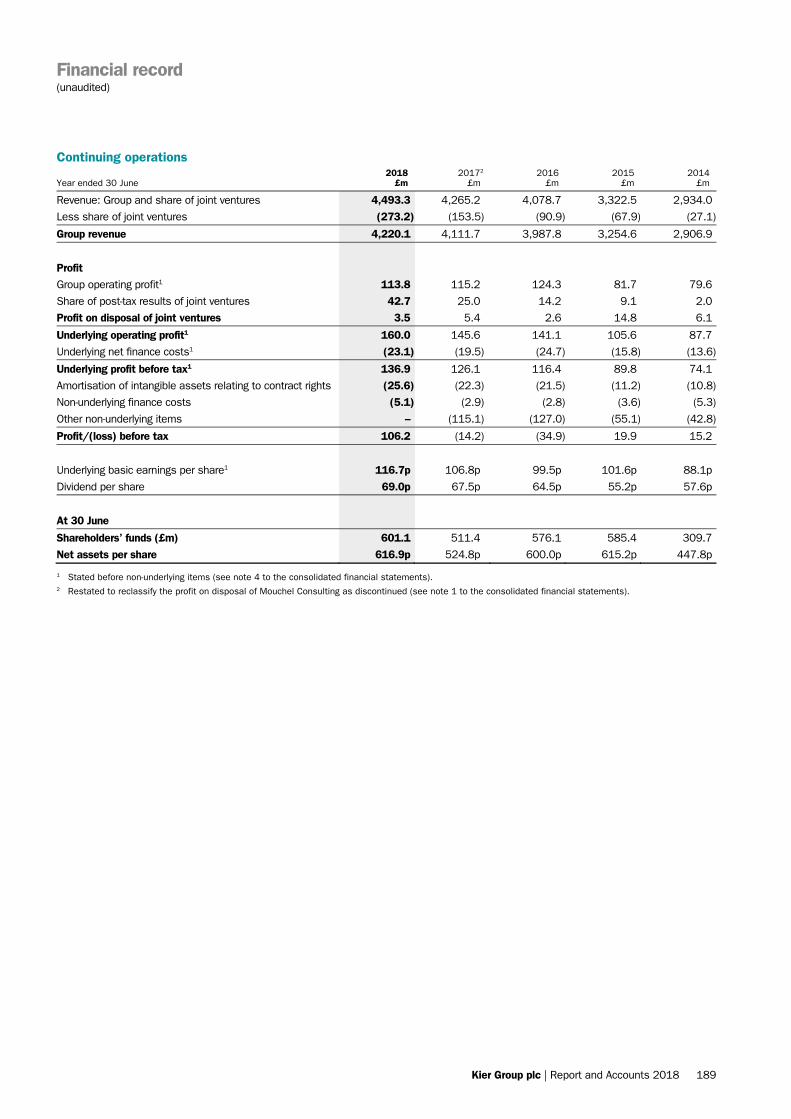
Financial record (unaudited)
Kier Group plc | Report and Accounts 2018 189
Continuing operations
Year ended 30 June 2018
£m 20172
£m 2016
£m 2015
£m 2014
£m
Revenue: Group and share of joint ventures 4,493.3 4,265.2 4,078.7 3,322.5 2,934.0
Less share of joint ventures (273.2) (153.5) (90.9) (67.9) (27.1)
Group revenue 4,220.1 4,111.7 3,987.8 3,254.6 2,906.9
Profit
Group operating profit1 113.8 115.2 124.3 81.7 79.6
Share of post-tax results of joint ventures 42.7 25.0 14.2 9.1 2.0
Profit on disposal of joint ventures 3.5 5.4 2.6 14.8 6.1
Underlying operating profit1 160.0 145.6 141.1 105.6 87.7
Underlying net finance costs1 (23.1) (19.5) (24.7) (15.8) (13.6)
Underlying profit before tax1 136.9 126.1 116.4 89.8 74.1
Amortisation of intangible assets relating to contract rights (25.6) (22.3) (21.5) (11.2) (10.8)
Non-underlying finance costs (5.1) (2.9) (2.8) (3.6) (5.3)
Other non-underlying items – (115.1) (127.0) (55.1) (42.8)
Profit/(loss) before tax 106.2 (14.2) (34.9) 19.9 15.2
Underlying basic earnings per share1 116.7p 106.8p 99.5p 101.6p 88.1p
Dividend per share 69.0p 67.5p 64.5p 55.2p 57.6p
At 30 June
Shareholders’ funds (£m) 601.1 511.4 576.1 585.4 309.7
Net assets per share 616.9p 524.8p 600.0p 615.2p 447.8p
1 Stated before non-underlying items (see note 4 to the consolidated financial statements). 2 Restated to reclassify the profit on disposal of Mouchel Consulting as discontinued (see note 1 to the consolidated financial statements).
Kier Group plc | Report and Accounts 2018 189
Corporate information
190 Kier Group plc | Report and Accounts 2018
Board of Directors P G Cox CBE H J Mursell B E J Dew C Veritiero J R Atkinson C F Baroudel A K Bashforth A C Walker N P Winser CBE
Secretary H E E Raven
Headquarters and registered office Kier Group plc Tempsford Hall Sandy Bedfordshire SG19 2BD
Registered number England 2708030
Financial calendar 16 November 2018 Annual general meeting
3 December 2018 Payment of final dividend for the year ended 30 June 2018
March 2019 Announcement of half-year results and interim dividend for the six months ending 31 December 2018
May 2019 Payment of interim dividend for the six months ending 31 December 2018
September 2019 Announcement of preliminary full-year results and final dividend for the year ending 30 June 2019
Auditor PricewaterhouseCoopers LLP 1 Embankment Place London WC2N 6RH
Principal bankers Barclays Bank plc 1 Churchill Place London E14 5HP
Lloyds Banking Group plc 10 Gresham Street London EC2V 7AE
HSBC Bank plc Metropolitan House 321 Avebury Boulevard Milton Keynes MK9 2GA
Santander UK plc 2 Triton Square Regent’s Place London NW1 3AN
The Royal Bank of Scotland plc 280 Bishopsgate London EC2M 4RB
Registrars Link Asset Services 34 Beckenham Road Beckenham Kent BR3 4TU Financial advisers Numis Securities Limited 10 Paternoster Square London EC4M 7LT
Peel Hunt Moor House 120 London Wall London EC2Y 5ET
190 Kier Group plc | Report and Accounts 2018

Kier Group plc | Report and Accounts 2018 191
www.kier.co.uk Our corporate website has key information covering our capabilities, markets, corporate responsibility and investor relations.
Join the conversation Engage with us and keep up with the latest news and developments via social media.
Printed on Amadeus Primo Silk which is produced using wood fibre from fully responsible forests with FSC®certification. All pulps used are Elemental Chlorine Free (ECF). The manufacturing mill holds the ISO 14001 and EU Ecolabel certificates for environmental management.
Consultancy, design and production by Black Sun plc. www.blacksunplc.com
Printed by Perivan Financial. www.perivands.co.uk
Kier Group plc Tempsford Hall, Sandy Bedfordshire SG19 2BD Tel: 01767 355000 www.kier.co.uk


www.kier.co.uk
Go online to find out moreOur corporate website has key information covering our capabilities, markets, corporate responsibility and investor relations.
Join the conversationEngage with us and keep up with the latest news and developments via social media.

Kier G
roup plc Annual R
eport and Accounts 2018
Kier Group plcTempsford Hall, Sandy Bedfordshire SG19 2BD Tel: 01767 355000 www.kier.co.uk