Embed Size (px)
Citation preview

KHS Chemistry Unit 3.4 Structural Analysis 1
StructuralStructuralAnalysis 1Analysis 1
Adv Higher Unit 3 Topic 4Adv Higher Unit 3 Topic 4
Gordon WatsonGordon Watson
Chemistry Department, Kelso High SchoolChemistry Department, Kelso High School

KHS Chemistry Unit 3.4 Structural Analysis 2
IntroductionIntroduction
This topic explores various methods used in the Structural AnalysisStructural Analysis of organic molecules starting with Elemental AnalysisElemental Analysis and Mass Mass SpectrometrySpectrometry.
m/z8060 1004020
20
40
60
80
10043
41

KHS Chemistry Unit 3.4 Structural Analysis 3
Elemental Analysis 1Elemental Analysis 1
Empirical formulas are determined by combustion combustion analysisanalysis:
CarbonCarbon, HydrogenHydrogen, Sulphur & Nitrogen can all be determined by combustion analysiscombustion analysis.
Other elements can be determined by other methods.

KHS Chemistry Unit 3.4 Structural Analysis 4
Elemental Analysis 2Elemental Analysis 2
Calculation is same as taught at Standard Grade.

KHS Chemistry Unit 3.4 Structural Analysis 5
Empirical Formula 1Empirical Formula 1
A substance was analysed and gave these results:
C 47.6% ; H 4.76% ; N 22.2% and O 25.4% by mass.
What is the empirical formula?
In 100 g there will be
47.6 / 12 moles of C = 3.97
4.76 / 1 moles of H = 4.76
22.2 / 14 moles of N = 1.59
25.4 / 16 moles of O = 1.59

KHS Chemistry Unit 3.4 Structural Analysis 6
Empirical Formula 2Empirical Formula 2
Ratio of C:H:N:O is 3.97: 4.76: 1.59: 1.59
Divide by smallest number to simplifyDivide by smallest number to simplify
Simplifying ratio: 2.5: 2.99: 1: 1
Whole number ratioWhole number ratio is 5: 6: 2: 2
Empirical formulaEmpirical formula is C5H6N2O2

KHS Chemistry Unit 3.4 Structural Analysis 7
Mass SpectrometryMass Spectrometry
A mass spectrometer does three things
vaporisesvaporises a minute sampleminute sample of compound (10-10 g)
ionisesionises the vaporised molecules
separatesseparates and analysesanalyses the ions, produced when the molecules molecules fall apartfall apart, according to their mass/charge ratio, giving a mass spectrum

KHS Chemistry Unit 3.4 Structural Analysis 8
Mass SpectrometerMass Spectrometer

KHS Chemistry Unit 3.4 Structural Analysis 9
Molecular IonMolecular IonA high-energy electron can dislodge an electron from a bond,
creating a radical cation (a positive ionpositive ion with an unpaired e-).
e- + H C
H
H
C
H
H
H
Molecular Molecular ionion
m1+ + m2
. M M+.
m1
. + m2
+
m1+ + m2
FragmentationFragmentation then occurs.

KHS Chemistry Unit 3.4 Structural Analysis 10
Common FragmentsCommon Fragments
Fragment m or m/z
H2O 18
CH3+ 15
CH3CH2+ 29
CH3CO+ 43
91C7H7+
H
H
H
H
H
H H
+
Some fragments are more stablemore stable and, therefore, more likelymore likely
KHS Chemistry Unit 3.4 Structural Analysis 11
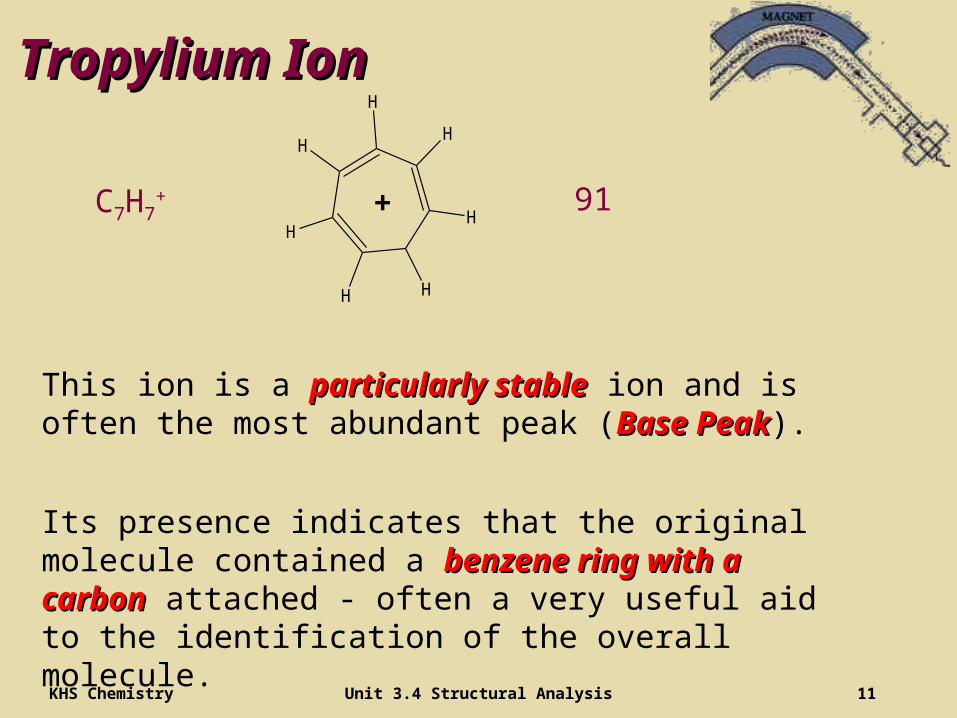
Tropylium IonTropylium Ion
91C7H7+
H
H
H
H
H
H H
+
This ion is a particularly stableparticularly stable ion and is often the most abundant peak (Base PeakBase Peak).
Its presence indicates that the original molecule contained a benzene ring with a carbonbenzene ring with a carbon attached - often a very useful aid to the identification of the overall molecule.

KHS Chemistry Unit 3.4 Structural Analysis 12
The Mass SpectrumThe Mass Spectrum
Masses are graphed or tabulated according to their relative abundance.

KHS Chemistry Unit 3.4 Structural Analysis 13
Example 1aExample 1a
m/z8060 1004020
20
40
60
80
100
rel
abu
nd
ance
H3C CH CH2 CH3CH2
CH3
2-METHYLPENTANE

KHS Chemistry Unit 3.4 Structural Analysis 14
Example 1bExample 1b
m/z8060 1004020
20
40
60
80
100
rel
abu
nd
ance
H3C CH CH2 CH3CH2
CH3
86
M+.
The main use of a mass spectrum (at Advanced Higher ) is to identify the Molecular ionMolecular ion.

KHS Chemistry Unit 3.4 Structural Analysis 15
Example 1cExample 1c
m/z8060 1004020
20
40
60
80
100
rel
abu
nd
ance
71 H3C CH CH2 CH3CH2
CH3
15
CH3+ C5H11
+
Occasionally you can be asked to identify possible fragmentsfragments.
KHS Chemistry Unit 3.4 Structural Analysis 16
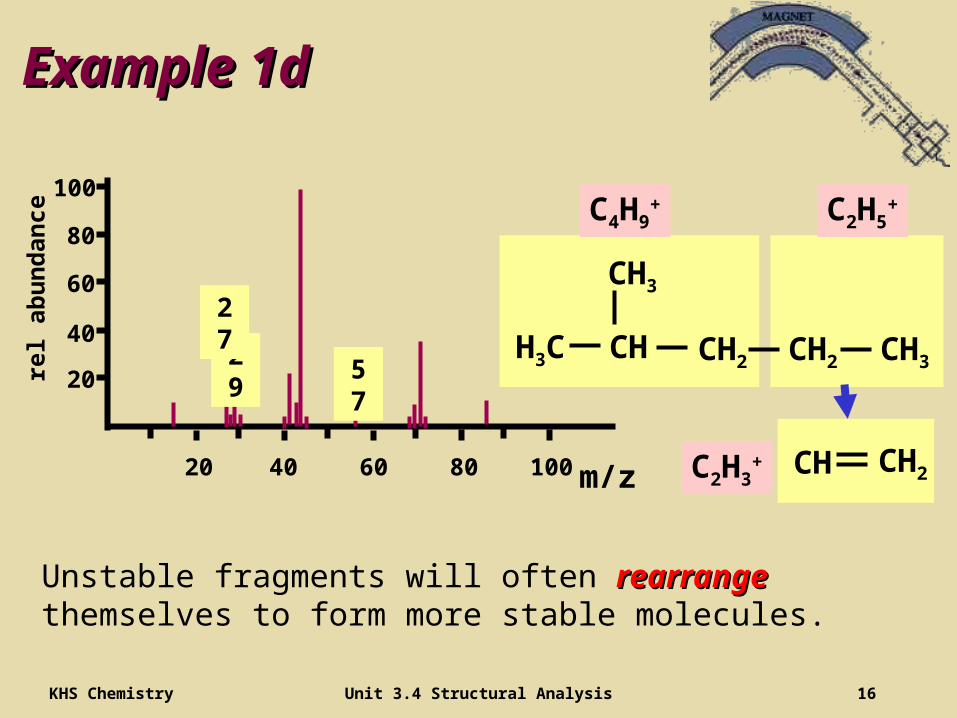
Example 1dExample 1d
Unstable fragments will often rearrangerearrange themselves to form more stable molecules.
m/z8060 1004020
20
40
60
80
100
rel
abu
nd
ance
H3C CH CH2 CH3CH2
CH3
5729
C4H9+ C2H5
+
CH CH2C2H3+
27

KHS Chemistry Unit 3.4 Structural Analysis 17
Example 1eExample 1e
The detailed analysis of a mass spectrum is best left to experienced operators with years of experience.
m/z8060 1004020
20
40
60
80
10043
41
H3C CH CH2 CH3CH2
CH3
C3H7+ C3H7
+ C3H5+
H2C C
CH3

KHS Chemistry Unit 3.4 Structural Analysis 18
Use of Mass SpectraUse of Mass SpectraAt Advanced Higher, the main (only?) use of mass spectra is to determine the molecular formulamolecular formula of the molecule.
IR Spectroscopy IR Spectroscopy and NMR SpectroscopyNMR Spectroscopy will be used to identify the actual structure of the molecule.
m/z8060 1004020
20
40
60
80
100
rel
abu
nd
ance
H3C CH CH2 CH3CH2
CH3
86
M+.

KHS Chemistry Unit 3.4 Structural Analysis 19
High Resolution Mass SpectrometerHigh Resolution Mass SpectrometerSome modern Mass Spectrometers can now determine masses to 5 or 6 decimal places.
This is accurate enough to differentiate between molecules of the ‘same mass’‘same mass’. Eg molecules with a mass of ‘44’ could be:
C3H8 C2H4O CO2 or CN2H4
A more accurate measurement of mass from the spectrometer could be 44.029
C3H8 C2H4O CO2 CN2H4
44.06260 44.02620 43.98983 44.03740

KHS Chemistry Unit 3.4 Structural Analysis 20
End of Topic 4End of Topic 4
StructuralStructuralAnalysis 1Analysis 1