Embed Size (px)
Citation preview

Reactive power control for photovoltaic power plantsM. Stremțan, R. Curatu, Prof. Dr. N Vasiliu
POLITEHNICA University of Bucharest313, Splaiul Independentei, Sector 6, 060042 Bucharest, Romania
1 KEYWORDSPhotovoltaic, solar, reactive power, control, SCADA
2 ABSTRACTThis paper describes the practical implementation of a custom reactive power control strategy on a 9MW installed power photovoltaic plant, as an integrated component of a SCADA system, in the context of the instability generated by meteorological conditions and their impact on the quality of the energy delivered through power grid.
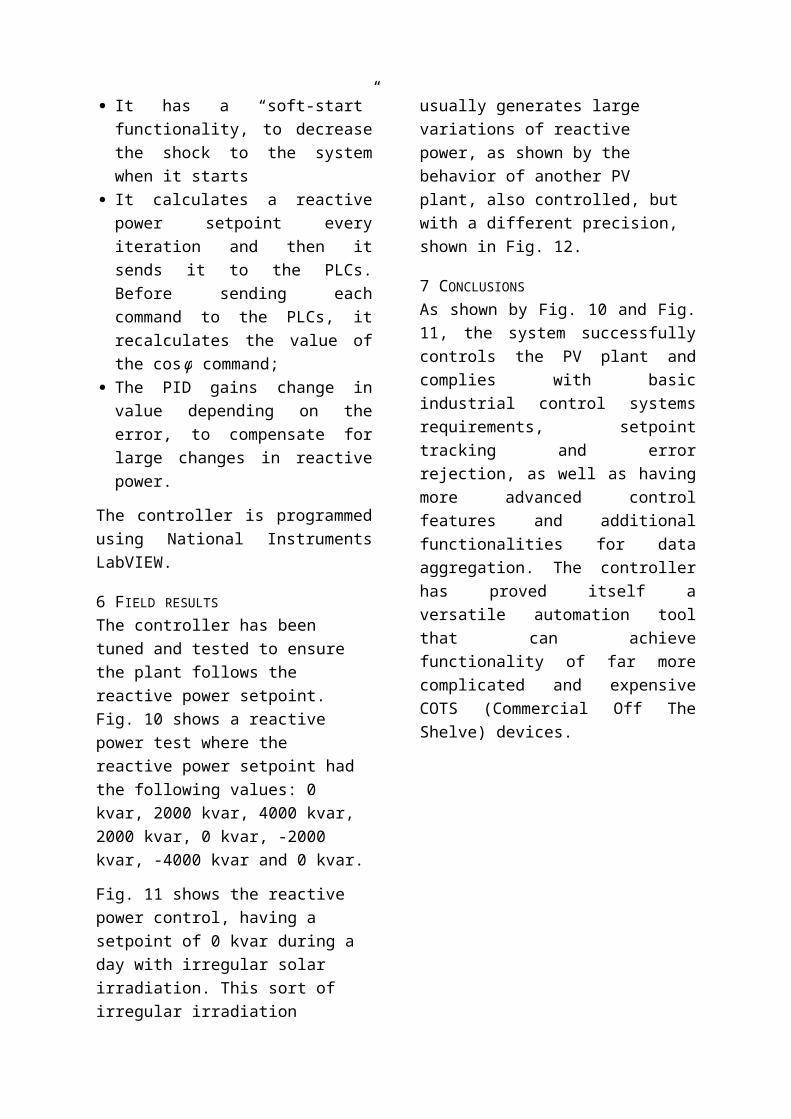
3 INTRODUCTIONRomania’s energy production variety has recently evolved to include a large number of renewable sources with significant impact on the Romanian National Energy System. As seen in Fig. 7, renewable energy amounts to 43% of Romania’s energy production, consisting of Hydropower (31.16%), Wind (10.14%), Solar (1.58%) and Biomass (0.84%). In terms of stability, renewable energy has a major impact on the national grid and its accelerated growth through the last years demands accurate control in order to minimize the impact on the grid’s energy quality. Romania’s National Energy Sector Regulation Authority (ANRE – Autoritatea Națională de Reglementare în Domeniul Energiei) has set into place rules and regulation for solar and wind plants control.
ANRE requires plants over 5MW installed capacity to have active power control depending on the grid frequency, and active and reactive power control and
voltage based on dispatch orders, in the connection point. The reactive power control has to continuously ensure a power factor of maximum 0.9 capacitive and 0.9 inductive (¿cos ( ϕ )∨∈ [ 0.9 , 1 ]).(Autoritatea Națională de Reglementare înDomeniul Energiei, 2013), (AutoritateaNațională de Reglementare în DomeniulEnergiei, 2013).
4 THE NEED FOR REACTIVE POWER CONTROL
In order to comply with the previously described regulations, it is required to control the power factor in each inverter of the PV plant with regards to the feedback from the connection point to the grid. Although the output of the inverter can provide a power factor of 1, due to the influence of the transport and distribution networks, network components and consumers, the power factor can vary, and the PV plant will be required to compensate for these disturbances.
Loads can be:
Inductive: consume reactive power to produce electromagnetic fields (such as motors)
Capacitive: produce reactive power (such as high-voltage overhead transmission lines)
An important factor that influences the output of PV plants is weather, solar irradiance rapid variations having a significant impact and PV inverters must keep energy parameters within limits, no matter the energy output it gives.
Power factor (cos φ) is an indicator of the quality and management of an electrical system and is a ratio of active power (P) and apparent power (S), as shown in Equation 1. Active power is the real power transmitted to loads such as motors, heaters, electronics, etc. The electrical active power is transformed into mechanical power, heat or light. Apparent power is the product of r.m.s. voltage and r.m.s. current (Equation 2) and is used for rating most electrical equipment.
cos φ=P [W ]S [VA ]
Equation 1
S [ VA ]=V rms [V ]⋅ I rms [ A ]
Equation 2
Reactive power appears when the current I is lagging behind or leading the voltage V by an angle of φ and is defined as a relation of active and apparent power (Equation 3, Equation 1) or described by a power factor, cos φ (Equation 4). The essential difference between active and reactive power is the fact that while active power is power transported from the generator to the load, reactive power is a measure of the energy stored in elements that act as coils and capacitors.
S2=P2+Q2
Equation 3
A power factor (Equation 4) close to unity means that the apparent power is minimal, meaning that the electrical equipment rating is minimal for the transmission of a given active power to the load, while a low value indicates the opposite. Reactive power can also be calculated by using Equation 5, for a 3-phased circuit.
cos φ= PS
Equation 4
Q=√3 ⋅U ⋅ I ⋅sin φ
Equation 5
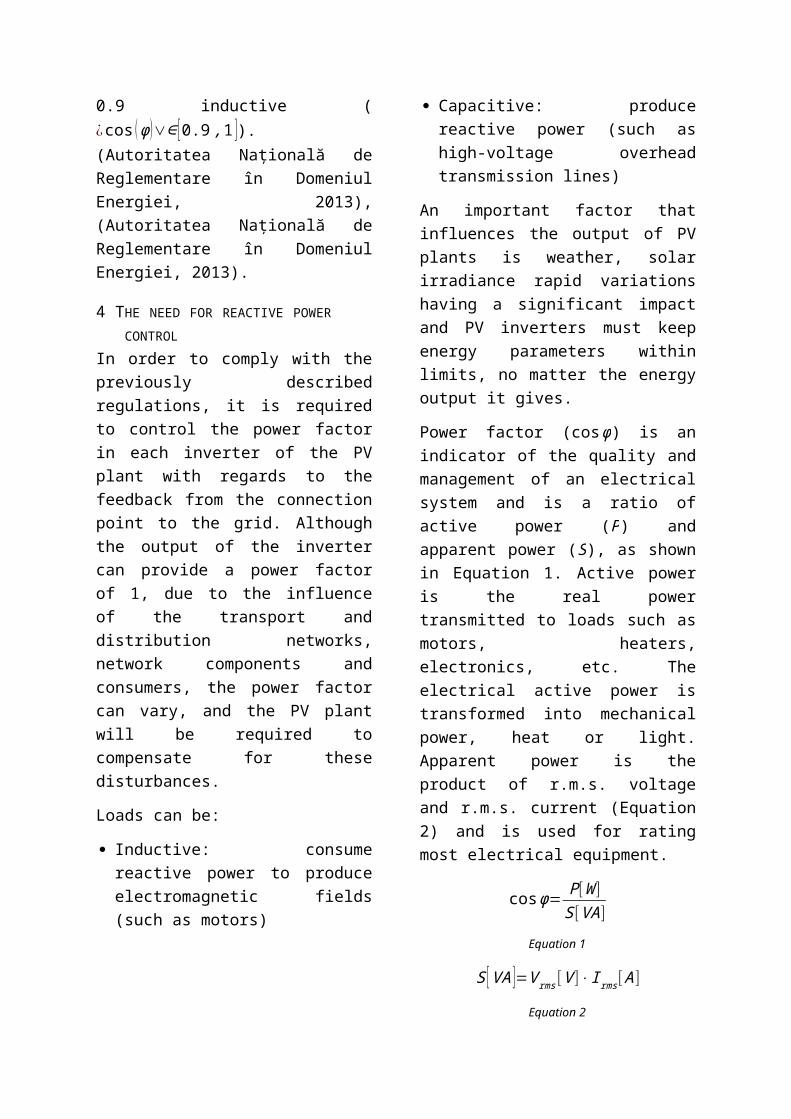
If currents and voltages can be represented by sinusoidal signals, a vector diagram can be used for representation for the current (Fig. 1) and power (Fig. 2). Where the active component of current I a is in phase with the voltage and the other, reactive component (I r), lagging by π /2 (in quadrature). Current and the two components (active and reactive) can be used to define active, reactive and apparent power (Equation 6, Equation 7 and Equation 8).
Fig. 1: Active and reactive current
Fig. 2: Active, reactive and apparent power
S[VA ]=V ⋅ I
Equation 6
P [W ]=V ⋅I a
Equation 7
Q [ var ]=V ⋅ I r
Equation 8
Low power factors have negative consequences, both technical and economical, to the grid, such as increased costs (most European countries have tariffs that charge industrial consumers more when the power factor drops below 0.93), active power losses, the necessity to install thicker transmission cables (according to Table 1, (Schneider Electric, 2015)), and voltage drops (Micu, Pop, & Cuzumbil).
Table 1: Controlled system description
Cable cross-sectional area of the cable multiplying factor
1 1.25 1.67 2.5
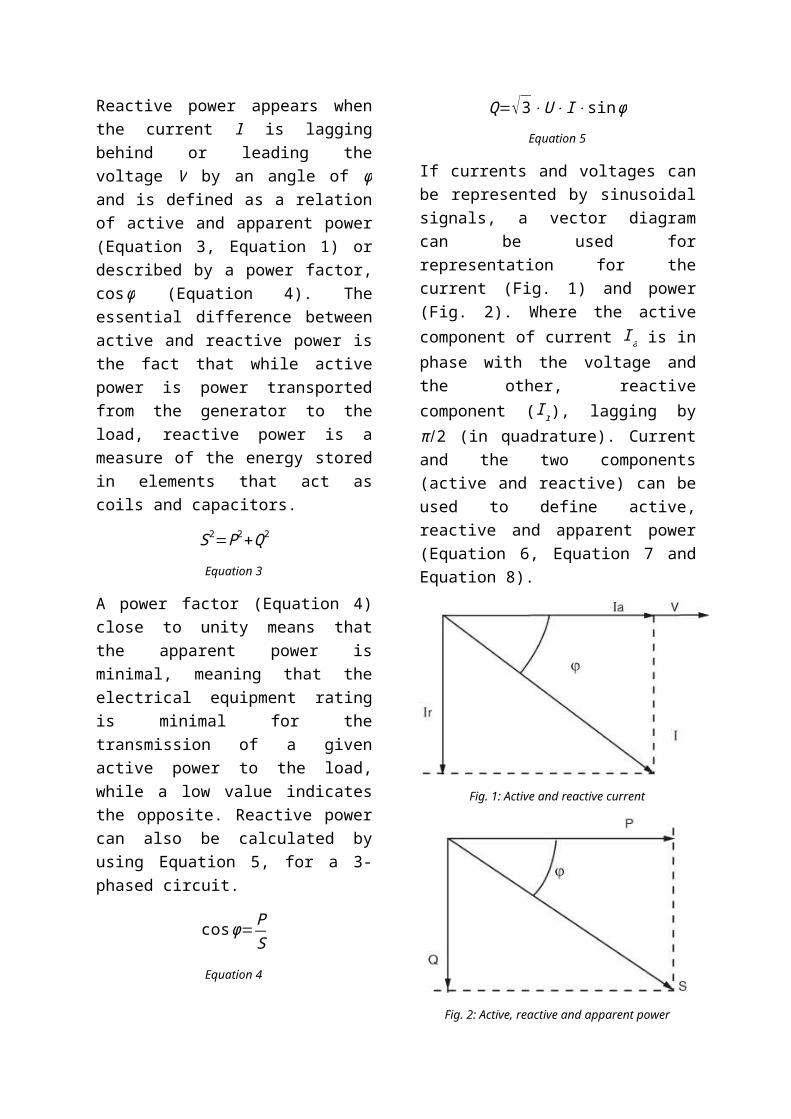
cos φ 1 0.8 0.6 0.4The control strategy described in this paper is applied to a PV plant with a nameplate rating of 9 MVA that has 9 cabins with 3 inverters with a nameplate rating of 334 kVA and a low-voltage to medium-voltage transformer (6kW) each. Each inverter has 5 modules with a nameplate rating of 67 kVA, each having a DC input from 11 to 13 string connector boxes. Each string connector box is a junction of 22 strings and each string feeds power from 242 to 286 PV modules, each having a nominal power PMPP(℘) of 255 W. This amounts to 27 inverters and approximately 35300 PV modules (panels).
Fig. 3: Block architecture
Thus, the controlled PV plant has a maximum output of 9 MVA, at 6kV.
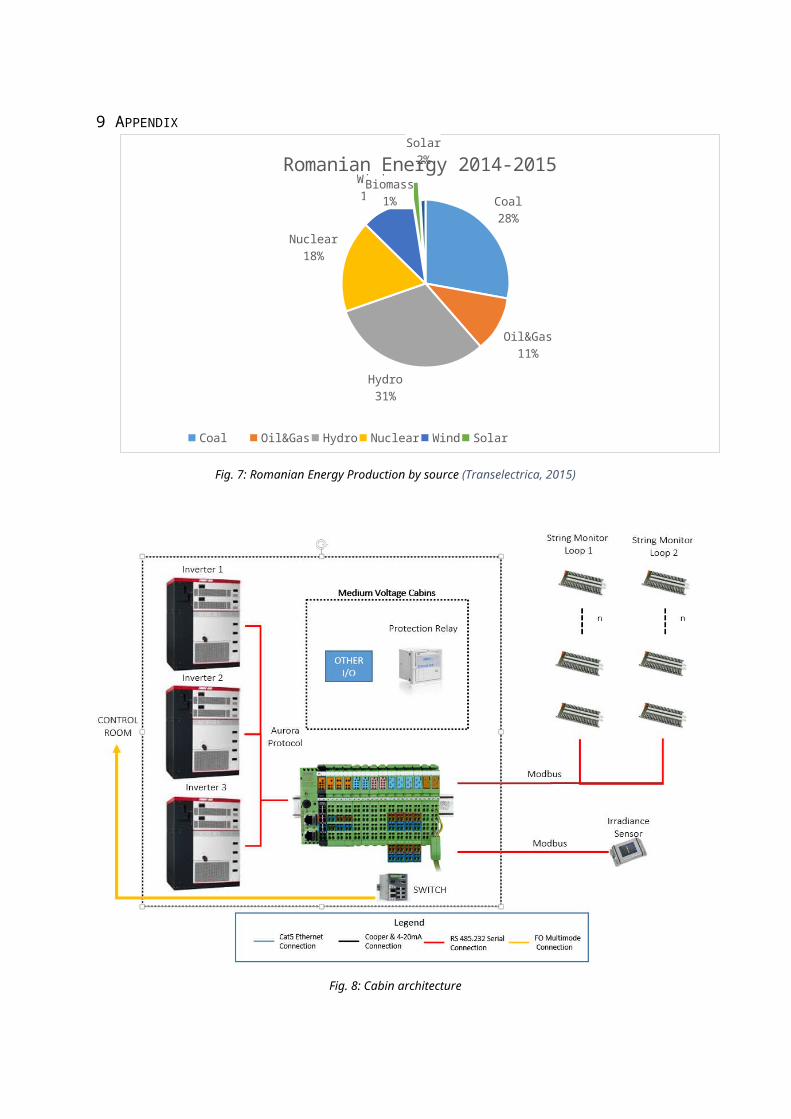
4.1 INVERTERSThe controlled inverters communicate on a proprietary variation of the Modbus protocol called “Aurora”, over RS485 field buses. The following data is available by communicating with the inverters:
Part number, Serial Number, Firmware Version
General state of the inverter and its two DC inputs
DC voltage and current AC voltage and current (on each phase) Active power, frequency and insulation
resistance Inverter’s temperature Daily energy counter Active power and power factor setpoint
values in use
Active power and power factor commands are sent using the same communication channel.
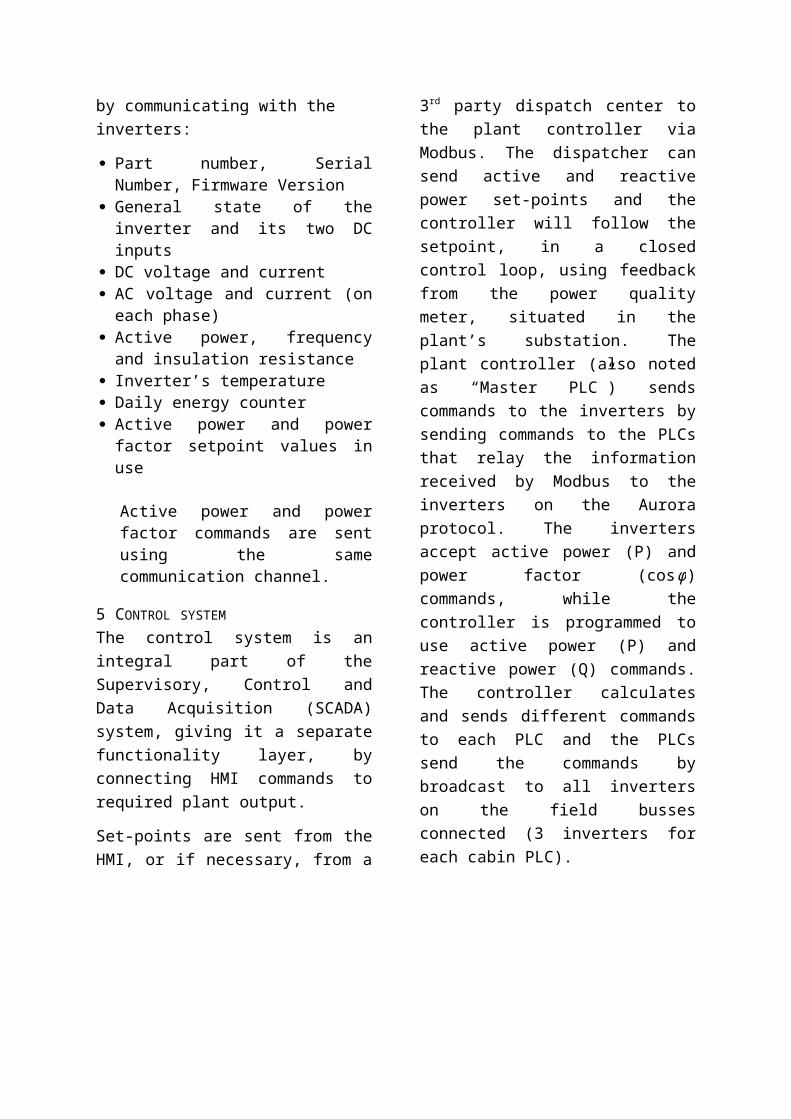
5 CONTROL SYSTEMThe control system is an integral part of the Supervisory, Control and Data Acquisition (SCADA) system, giving it a separate functionality layer, by connecting HMI commands to required plant output.
Set-points are sent from the HMI, or if necessary, from a 3rd party dispatch center to the plant controller via Modbus. The dispatcher can send active and reactive power set-points and the controller will follow the setpoint, in a closed control loop, using feedback from the power quality meter, situated in the plant’s substation. The plant controller (also noted as “Master PLC”) sends commands to the inverters by sending commands to the PLCs that relay the information received by Modbus to the inverters on the Aurora protocol. The inverters accept active power (P) and power factor (cos φ) commands, while the controller is programmed to use active power (P) and reactive power (Q) commands. The controller calculates and
Grid
Transformer
Inverters
String connector boxes
PV modules
sends different commands to each PLC and the PLCs send the commands by broadcast to all inverters on the field
busses connected (3 inverters for each cabin PLC).
Fig. 4: Command and feedback data flow
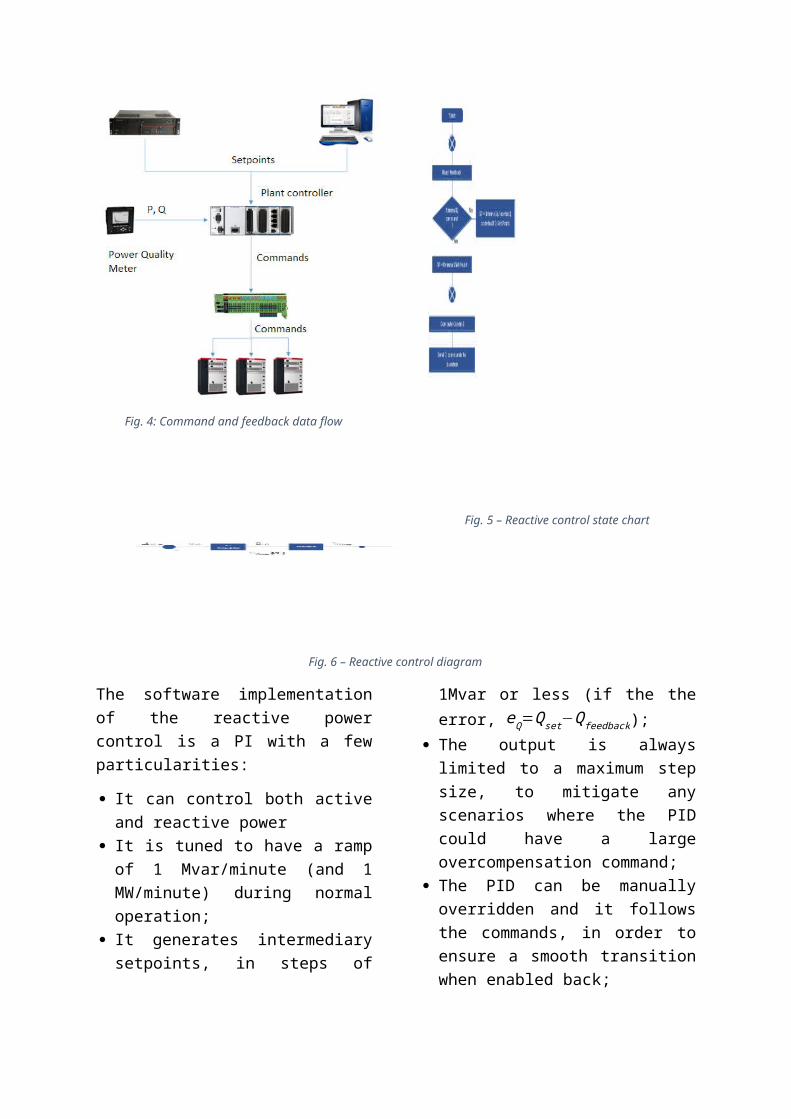
Fig. 5 – Reactive control state chart
Fig. 6 – Reactive control diagram
The software implementation of the reactive power control is a PI with a few particularities:
It can control both active and reactive power
It is tuned to have a ramp of 1 Mvar/minute (and 1 MW/minute) during normal operation;
It generates intermediary setpoints, in steps of 1Mvar or less (if the the error, eQ=Q set−Qfeedback);
The output is always limited to a maximum step size, to mitigate any
scenarios where the PID could have a large overcompensation command;
The PID can be manually overridden and it follows the commands, in order to ensure a smooth transition when enabled back;
It has a “soft-start” functionality, to decrease the shock to the system when it starts
It calculates a reactive power setpoint every iteration and then it sends it to the PLCs. Before sending each command to the PLCs, it recalculates the value of the cos φ command;
The PID gains change in value depending on the error, to compensate for large changes in reactive power.
The controller is programmed using National Instruments LabVIEW.
6 FIELD RESULTSThe controller has been tuned and tested to ensure the plant follows the reactive power setpoint. Fig. 10 shows a reactive power test where the reactive power setpoint had the following values: 0 kvar, 2000 kvar, 4000 kvar, 2000 kvar, 0 kvar, -2000 kvar, -4000 kvar and 0 kvar.
Fig. 11 shows the reactive power control, having a setpoint of 0 kvar during a day with irregular solar irradiation. This sort of irregular irradiation usually generates large variations of reactive power, as shown by the behavior of another PV plant, also controlled, but with a different precision, shown in Fig. 12.
7 CONCLUSIONSAs shown by Fig. 10 and Fig. 11, the system successfully controls the PV plant and complies with basic industrial control systems requirements, setpoint tracking and error rejection, as well as having more advanced control features and additional functionalities for data aggregation. The controller has proved itself a versatile automation tool that can achieve functionality of far more complicated and expensive COTS (Commercial Off The Shelve) devices.
8 REFERENCES
Autoritatea Națională de Reglementare în Domeniul Energiei. (2013). Ordinul Nr. 30. Bucharest.
Autoritatea Națională de Reglementare în Domeniul Energiei. (2013). Ordinul nr. 74. Bucharest.
Micu, D. D., Pop, A.-C., & Cuzumbil, L. (n.d.). Scenarii de compensare al factorului de putere.
Schneider Electric. (2015). Installation guide according to IEC international standards.
Transelectrica. (2015, 05 25). Productia, consumul si soldul SEN. Retrieved from Transelectrica: http://transelectrica.ro/widget/web/tel/sen-grafic/
9 APPENDIX
Coal28%
Oil&Gas11%
Hydro31%
Nuclear18%
Wind10%
Solar2%
Biomass1%
Romanian Energy 2014-2015
Coal Oil&Gas Hydro Nuclear Wind Solar Biomass
Fig. 7: Romanian Energy Production by source (Transelectrica, 2015)
Fig. 8: Cabin architecture

Fig. 9: Plant architecture overview
01:25:00 PM 01:38:43 PM 01:52:27 PM 02:06:11 PM 02:19:55 PM 02:33:39 PM 02:47:23 PM
-6000
-4000
-2000
0
2000
4000
6000
8000
Reactive power control tests
Active_Power (kW) Reactive_Power (Kvar)
Fig. 10: Reactive power test
7/14/15 7:00 7/14/15 9:17 7/14/15 11:33 7/14/15 13:50 7/14/15 16:06 7/14/15 18:23-1000
0
1000
2000
3000
4000
5000
6000
7000
8000
9000
Reactive power control
Fig. 11: 0 kvar setpoint during a day with irregular irradiation
7/14/2015 7:00 7/14/2015 9:43 7/14/2015 12:26 7/14/2015 15:08 7/14/2015 17:51
-3000
-2000
-1000
0
1000
2000
3000
4000
5000
6000
7000
Reactive Power control on another PV plant
Active_Power Reactive_Power
Fig. 12: 0 kvar setpoint during a day with irregular irradiation (another PV plant)
Fig. 9: Control software code snippet


![DPU2000/1500R/2000R MODBUS / MODBUS PLUS … · DPU2000/1500R/2000R Modbus/Modbus Plus Automation Guide i DPU2000/1500R/2000R MODBUS / MODBUS PLUS ... [Catalog 587XXX00-XXX0 or 587XXXX6-XXX4]](https://img.pdfslide.us/doc/110x75/5acb9eac7f8b9a73128bdc42/dpu20001500r2000r-modbus-modbus-plus-modbusmodbus-plus-automation-guide.jpg)