Embed Size (px)
Citation preview
KEYSTONE
AREA EDUCATION AGENCY 1
INDEPENDENT AUDITOR’S REPORTS
BASIC FINANCIAL STATEMENTS AND
SUPPLEMENTARY INFORMATION
SCHEDULE OF FINDINGS AND QUESTIONED COSTS
JUNE 30, 2016
CONTENTS
OFFICIALS 1
INDEPENDENT AUDITOR’S REPORT 2-4
MANAGEMENT’S DISCUSSION AND ANALYSIS 5-10
BASIC FINANCIAL STATEMENTS Exhibit
Government-Wide Financial Statements:
Statement of Net Position
Statement of Activities
Governmental Fund Financial Statements:
Balance Sheet
Reconciliation of the Balance Sheet –
Governmental Funds to the Statement of Net Position
Statement of Revenues, Expenditures and Changes in
Fund Balances – Governmental Funds
Reconciliation of the Statement of Revenues,
Expenditures and Changes in Fund Balances –
Governmental Funds to the Statement of Activities
Fiduciary Fund Financial Statement:
Statement of Fiduciary Assets and Liabilities – Agency Fund
Notes to Financial Statements
A
B
C
D
E
F
G
11
12
13
14
15
16
17
18-31
REQUIRED SUPPLEMENTARY INFORMATION
Schedule of Revenues, Expenditures/Expenses and
Changes in Balances – Budget and Actual –
All Governmental Funds
Notes to Required Supplementary Information – Budgetary Reporting
Schedule of the Agency’s Proportionate Share of the
Net Pension Liability
Schedule of Agency Contributions
Notes to Required Supplementary Information – Pension Liability
Schedule of Funding Progress for the Retiree Health Plan
32
33
34
35
36
37
CONTENTS
(Continued)
SUPPLEMENTARY INFORMATION
Nonmajor Governmental Funds:
Combining Balance Sheet
Combining Schedule of Revenues, Expenditures
and Changes in Fund Balances
Schedule of Changes in Fiduciary Assets and Liabilities –
Agency Fund
Schedule of Revenues by Source
and Expenditures by Function –
All Governmental Funds
Schedule of Expenditures of Federal Awards
Schedule
1
2
3
4
5
38
39
40
41
42-43
INDEPENDENT AUDITOR’S REPORT
ON INTERNAL CONTROL OVER FINANCIAL REPORTING
AND ON COMPLIANCE AND OTHER MATTERS BASED ON AN
AUDIT OF THE FINANCIAL STATEMENTS PERFORMED IN
ACCORDANCE WITH GOVERNMENT AUDITING STANDARDS
44-45
INDEPENDENT AUDITOR’S REPORT
ON COMPLIANCE FOR EACH MAJOR FEDERAL PROGRAM
AND ON INTERNAL CONTROL OVER COMPLIANCE
REQUIRED BY THE UNIFORM GUIDANCE
46-47
SCHEDULE OF FINDINGS AND QUESTIONED COSTS 48-49
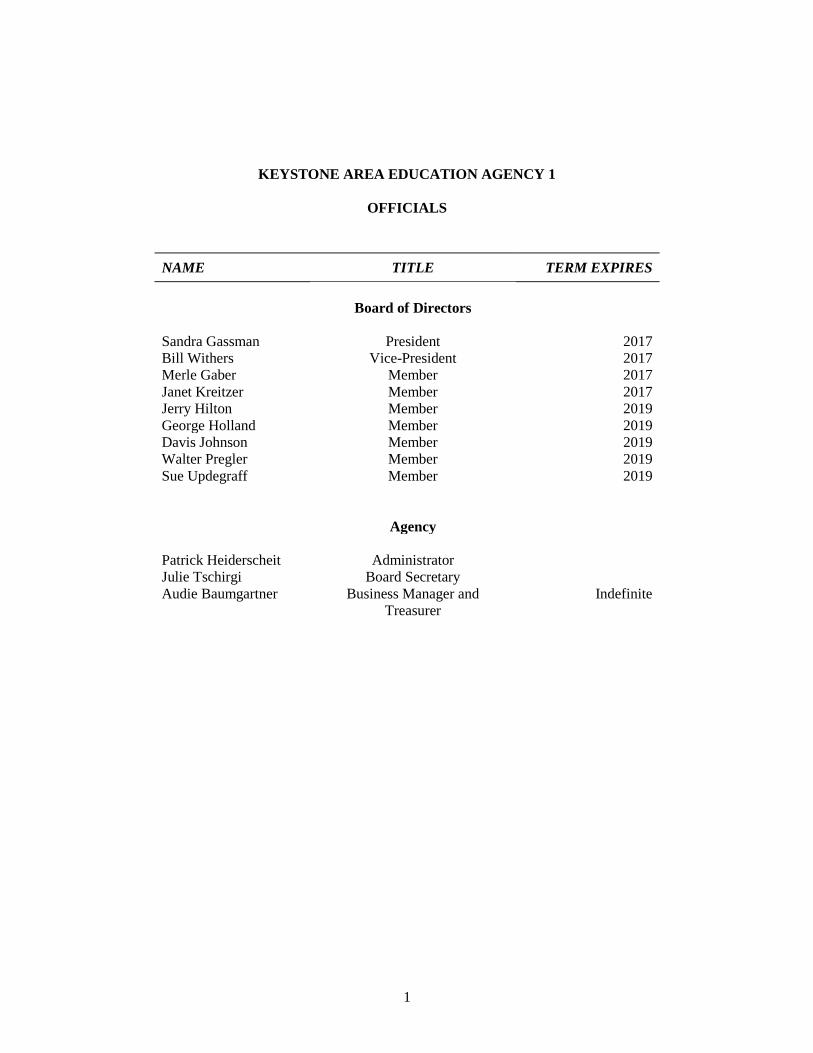
1
KEYSTONE AREA EDUCATION AGENCY 1
OFFICIALS
NAME TITLE TERM EXPIRES
Board of Directors
Sandra Gassman President 2017
Bill Withers Vice-President 2017
Merle Gaber Member 2017
Janet Kreitzer Member 2017
Jerry Hilton Member 2019
George Holland Member 2019
Davis Johnson Member 2019
Walter Pregler Member 2019
Sue Updegraff Member 2019
Agency
Patrick Heiderscheit Administrator
Julie Tschirgi Board Secretary
Audie Baumgartner Business Manager and
Treasurer
Indefinite
2
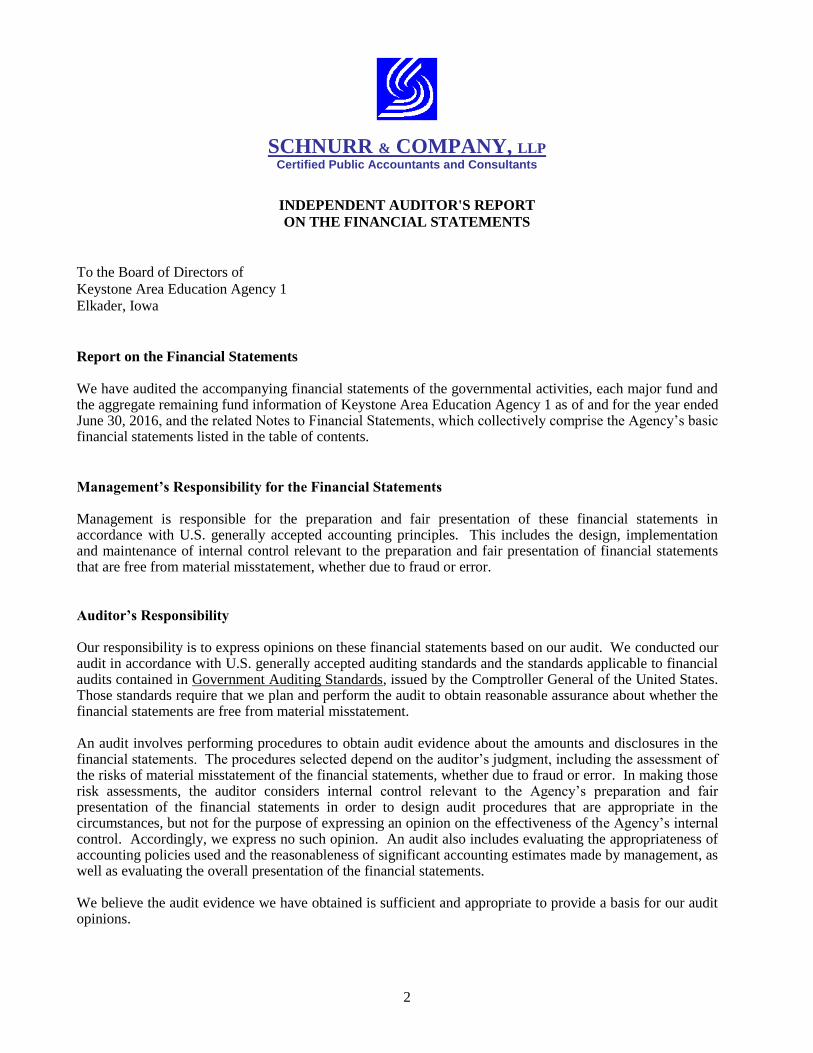
SCHNURR & COMPANY, LLP Certified Public Accountants and Consultants
INDEPENDENT AUDITOR'S REPORT
ON THE FINANCIAL STATEMENTS
To the Board of Directors of
Keystone Area Education Agency 1
Elkader, Iowa
Report on the Financial Statements
We have audited the accompanying financial statements of the governmental activities, each major fund and the aggregate remaining fund information of Keystone Area Education Agency 1 as of and for the year ended June 30, 2016, and the related Notes to Financial Statements, which collectively comprise the Agency’s basic financial statements listed in the table of contents.
Management’s Responsibility for the Financial Statements
Management is responsible for the preparation and fair presentation of these financial statements in accordance with U.S. generally accepted accounting principles. This includes the design, implementation and maintenance of internal control relevant to the preparation and fair presentation of financial statements that are free from material misstatement, whether due to fraud or error.
Auditor’s Responsibility
Our responsibility is to express opinions on these financial statements based on our audit. We conducted our audit in accordance with U.S. generally accepted auditing standards and the standards applicable to financial audits contained in Government Auditing Standards, issued by the Comptroller General of the United States. Those standards require that we plan and perform the audit to obtain reasonable assurance about whether the financial statements are free from material misstatement. An audit involves performing procedures to obtain audit evidence about the amounts and disclosures in the financial statements. The procedures selected depend on the auditor’s judgment, including the assessment of the risks of material misstatement of the financial statements, whether due to fraud or error. In making those risk assessments, the auditor considers internal control relevant to the Agency’s preparation and fair presentation of the financial statements in order to design audit procedures that are appropriate in the circumstances, but not for the purpose of expressing an opinion on the effectiveness of the Agency’s internal control. Accordingly, we express no such opinion. An audit also includes evaluating the appropriateness of accounting policies used and the reasonableness of significant accounting estimates made by management, as well as evaluating the overall presentation of the financial statements. We believe the audit evidence we have obtained is sufficient and appropriate to provide a basis for our audit opinions.
3
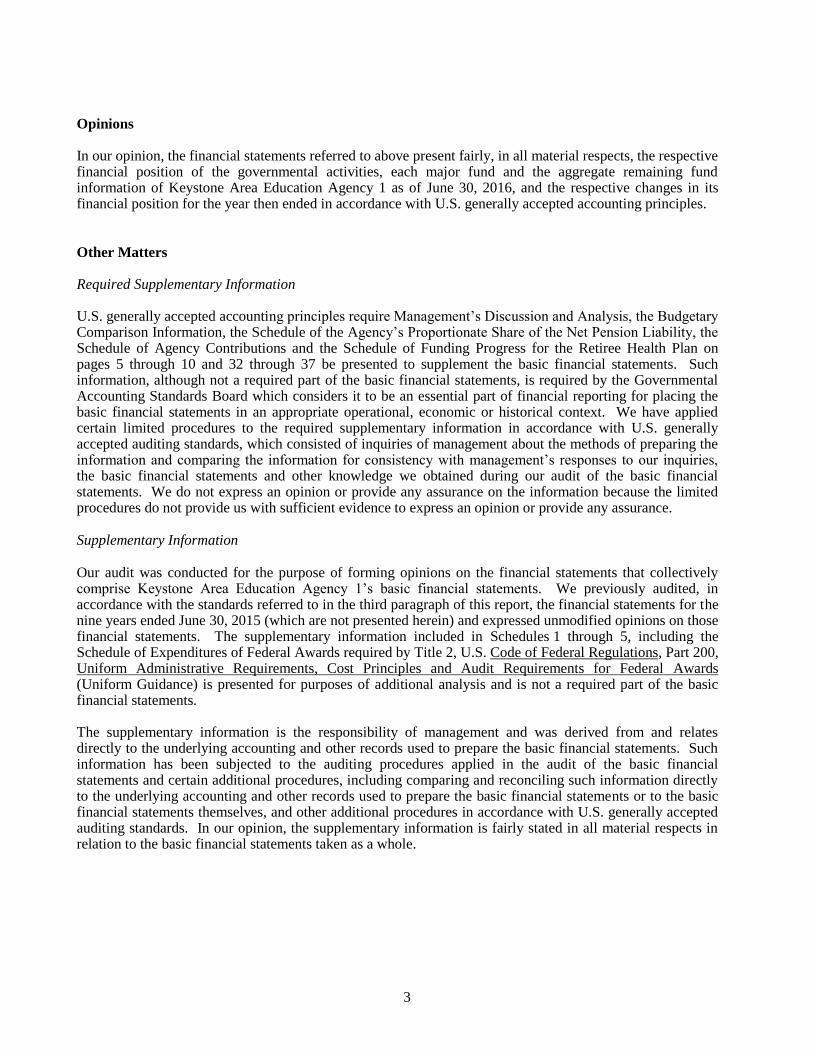
Opinions In our opinion, the financial statements referred to above present fairly, in all material respects, the respective financial position of the governmental activities, each major fund and the aggregate remaining fund information of Keystone Area Education Agency 1 as of June 30, 2016, and the respective changes in its financial position for the year then ended in accordance with U.S. generally accepted accounting principles.
Other Matters
Required Supplementary Information
U.S. generally accepted accounting principles require Management’s Discussion and Analysis, the Budgetary Comparison Information, the Schedule of the Agency’s Proportionate Share of the Net Pension Liability, the Schedule of Agency Contributions and the Schedule of Funding Progress for the Retiree Health Plan on pages 5 through 10 and 32 through 37 be presented to supplement the basic financial statements. Such information, although not a required part of the basic financial statements, is required by the Governmental Accounting Standards Board which considers it to be an essential part of financial reporting for placing the basic financial statements in an appropriate operational, economic or historical context. We have applied certain limited procedures to the required supplementary information in accordance with U.S. generally accepted auditing standards, which consisted of inquiries of management about the methods of preparing the information and comparing the information for consistency with management’s responses to our inquiries, the basic financial statements and other knowledge we obtained during our audit of the basic financial statements. We do not express an opinion or provide any assurance on the information because the limited procedures do not provide us with sufficient evidence to express an opinion or provide any assurance. Supplementary Information
Our audit was conducted for the purpose of forming opinions on the financial statements that collectively comprise Keystone Area Education Agency 1’s basic financial statements. We previously audited, in accordance with the standards referred to in the third paragraph of this report, the financial statements for the nine years ended June 30, 2015 (which are not presented herein) and expressed unmodified opinions on those financial statements. The supplementary information included in Schedules 1 through 5, including the Schedule of Expenditures of Federal Awards required by Title 2, U.S. Code of Federal Regulations, Part 200, Uniform Administrative Requirements, Cost Principles and Audit Requirements for Federal Awards (Uniform Guidance) is presented for purposes of additional analysis and is not a required part of the basic financial statements. The supplementary information is the responsibility of management and was derived from and relates directly to the underlying accounting and other records used to prepare the basic financial statements. Such information has been subjected to the auditing procedures applied in the audit of the basic financial statements and certain additional procedures, including comparing and reconciling such information directly to the underlying accounting and other records used to prepare the basic financial statements or to the basic financial statements themselves, and other additional procedures in accordance with U.S. generally accepted auditing standards. In our opinion, the supplementary information is fairly stated in all material respects in relation to the basic financial statements taken as a whole.
4
Other Reporting Required by Government Auditing Standards In accordance with Government Auditing Standards, we have also issued our report dated November 7, 2016 on our consideration of Keystone Area Education Agency 1’s internal control over financial reporting and our tests of its compliance with certain provisions of laws, regulations, contracts and grant agreements and other matters. The purpose of that report is to describe the scope of our testing of internal control over financial reporting and compliance and the results of that testing and not to provide an opinion on the internal control over financial reporting or on compliance. That report is an integral part of an audit performed in accordance with Government Auditing Standards in considering Keystone Area Education Agency 1’s internal control over financial reporting and compliance.
Fort Dodge, Iowa
November 7, 2016
KEYSTONE AREA EDUCATION AGENCY 1

KEYSTONE AREA EDUCATION AGENCY 1
MANAGEMENT’S DISCUSSION AND ANALYSIS
5
Keystone Area Education Agency 1 provides this Management’s Discussion and Analysis of its financial
statements. This narrative overview and analysis of the financial activities is for the year ended June 30, 2016.
We encourage readers to consider this information in conjunction with the Agency’s financial statements, which
follow.
2016 FINANCIAL HIGHLIGHTS
General Fund revenues in 2016 (FY16) were $23,221,278 while General Fund expenditures for FY16 were
$23,099,429. This resulted in an increase in the Agency’s General Fund balance from $1,850,965 in FY15 to
$1,928,842 in FY16, a 4.2% increase from the prior year.
USING THIS ANNUAL REPORT
The annual report consists of a series of financial statements and other information, as follows:
Management’s Discussion and Analysis introduces the basic financial statements and provides an
analytical overview of the Agency’s financial activities.
The Government-wide Financial Statements consist of a Statement of Net Position and a Statement of
Activities. These provide information about the activities of Keystone Area Education Agency as a whole
and present an overall view of the Agency’s finances.
The Fund Financial Statements tell how governmental services were financed in the short term as well as
what remains for future spending. Fund financial statements report the Agency’s operations in more detail
than the government-wide financial statements by providing information about the most significant funds.
Notes to the Financial Statements provide additional information essential to a full understanding of the
data provided in the basic financial statements.
Required Supplementary Information further explains and supports the financial statements with a
comparison of the Agency’s budget for the year, the Agency’s proportionate share of the net position
liability and related contributions, as well as presenting the Schedule of Funding Progress for the Retiree
Health Plan.
Supplementary Information provides detailed information about the non-major funds. In addition, the
Schedule of Expenditures of Federal Awards provides details of various federal programs benefiting the
Agency.
MANAGEMENT’S DISCUSSION AND ANALYSIS
6
REPORTING THE AGENCY’S FINANCIAL ACTIVITIES
Government-wide Financial Statements
The government-wide statements report information about the Agency as a whole using accounting methods
similar to those used by private-sector companies. The Statement of Net Position includes all of the Agency’s
assets, deferred outflow of resources, liabilities and deferred inflow of resources, with the difference reported
as net position. All of the current year revenues and expenses are accounted for in the Statement of Activities
regardless of when cash is received or paid.
The two government-wide statements report the Agency’s net position and how it has changed. Net position
is one way to measure the Agency’s financial health or financial position. Over time, increases or decreases in
the Agency’s net position is an indicator of whether financial position is improving or deteriorating. To assess
the Agency’s overall health, additional non-financial factors, such as changes in the Agency’s property tax
base and the condition of its facilities, need to be considered.
In the government-wide financial statements, the Agency’s activities consist of the following category:
Governmental activities: The Agency’s basic services are included here, such as regular and special
education instruction, student and instructional staff support services, and administration. Local school
districts, federal and state aid finance most of these activities.
Fund Financial Statements
The fund financial statements provide detailed information about the Agency’s funds, focusing on its most
significant or “major” funds – not the Agency as a whole. Funds are accounting devices the Agency uses to
keep track of specific sources of funding and spending on particular programs.
Some funds are required by state law or by bond covenants. The Agency establishes other funds to control
and manage money for particular purposes, such as accounting for major construction projects or to show it is
properly using certain revenues, such as federal grants.
The Agency has two kinds of funds:
Governmental funds account for most of the Agency’s basic services. These focus on how cash and
other financial assets that can readily be converted to cash flow in and out and the balances left at year-
end available for spending. Consequently, the governmental fund financial statements provide a
detailed short-term view that helps determine whether there are more or fewer financial resources that
can be spent in the near future to finance the Agency’s programs. The Agency’s governmental funds
include: 1) the General Fund, 2) the Special Revenue Fund, and 3) the Capital Projects Fund.
The required financial statements for governmental funds include a Balance Sheet and a Statement of
Revenues, Expenditures and Changes in Fund Balances.
MANAGEMENT’S DISCUSSION AND ANALYSIS
7
REPORTING THE AGENCY’S FINANCIAL ACTIVITIES (Continued)
Fund Financial Statements (Continued)
Fiduciary funds are funds through which the Agency administers and accounts for certain activity as a
fiscal agent. The Agency is responsible for ensuring the assets reported in the fiduciary funds are used
only for their intended purposes and by those to whom the assets belong. The Agency excludes these
activities from the government-wide financial statements because it cannot use these assets to finance
its operations.
The required financial statement for fiduciary funds is a Statement of Fiduciary Assets and Liabilities.
Reconciliations between the government-wide financial statements and the governmental fund financial
statements follow the governmental fund financial statements.
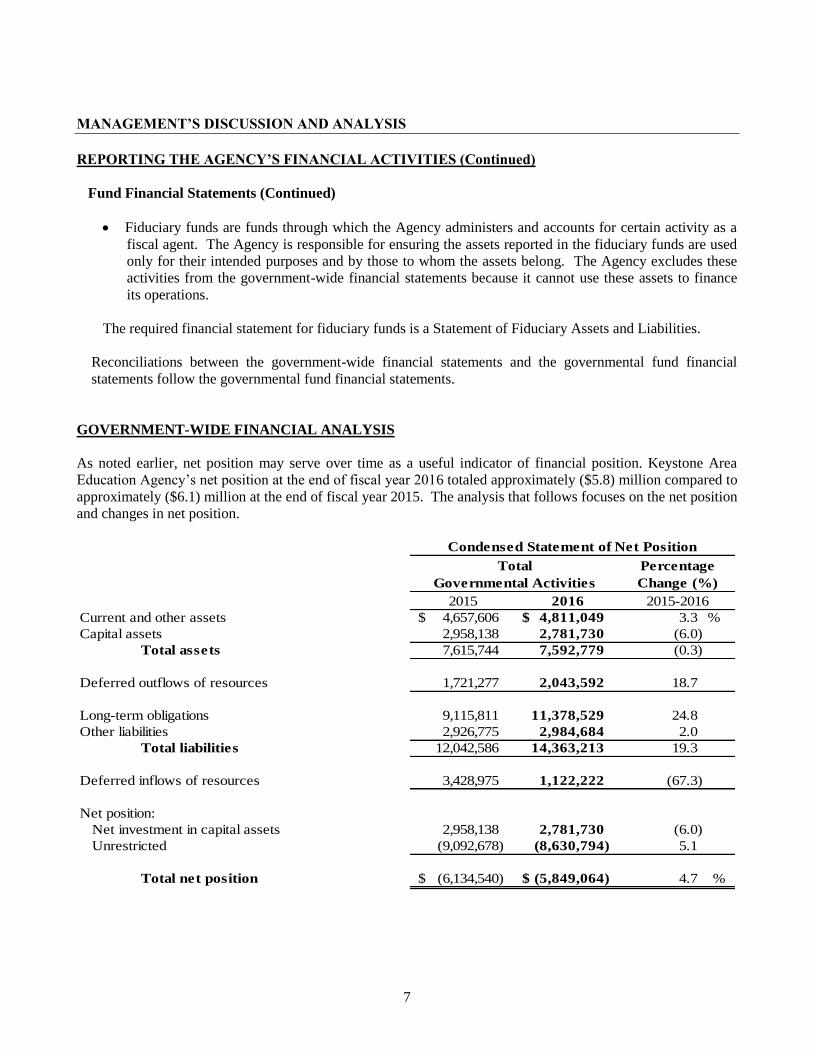
GOVERNMENT-WIDE FINANCIAL ANALYSIS
As noted earlier, net position may serve over time as a useful indicator of financial position. Keystone Area
Education Agency’s net position at the end of fiscal year 2016 totaled approximately ($5.8) million compared to
approximately ($6.1) million at the end of fiscal year 2015. The analysis that follows focuses on the net position
and changes in net position.
2015 2016
Current and other assets 4,657,606 $ 4,811,049 $ 3.3 %
Capital assets 2,958,138 2,781,730 (6.0)
Total assets 7,615,744 7,592,779 (0.3)
Deferred outflows of resources 1,721,277 2,043,592 18.7
Long-term obligations 9,115,811 11,378,529 24.8
Other liabilities 2,926,775 2,984,684 2.0
Total liabilities 12,042,586 14,363,213 19.3
Deferred inflows of resources 3,428,975 1,122,222 (67.3)
Net position:
Net investment in capital assets 2,958,138 2,781,730 (6.0)
Unrestricted (9,092,678) (8,630,794) 5.1
Total net position (6,134,540) $ (5,849,064) $ 4.7 %
Total
Governmental Activities
Condensed Statement of Net Position
Percentage
Change (%)
2015-2016
MANAGEMENT’S DISCUSSION AND ANALYSIS
8
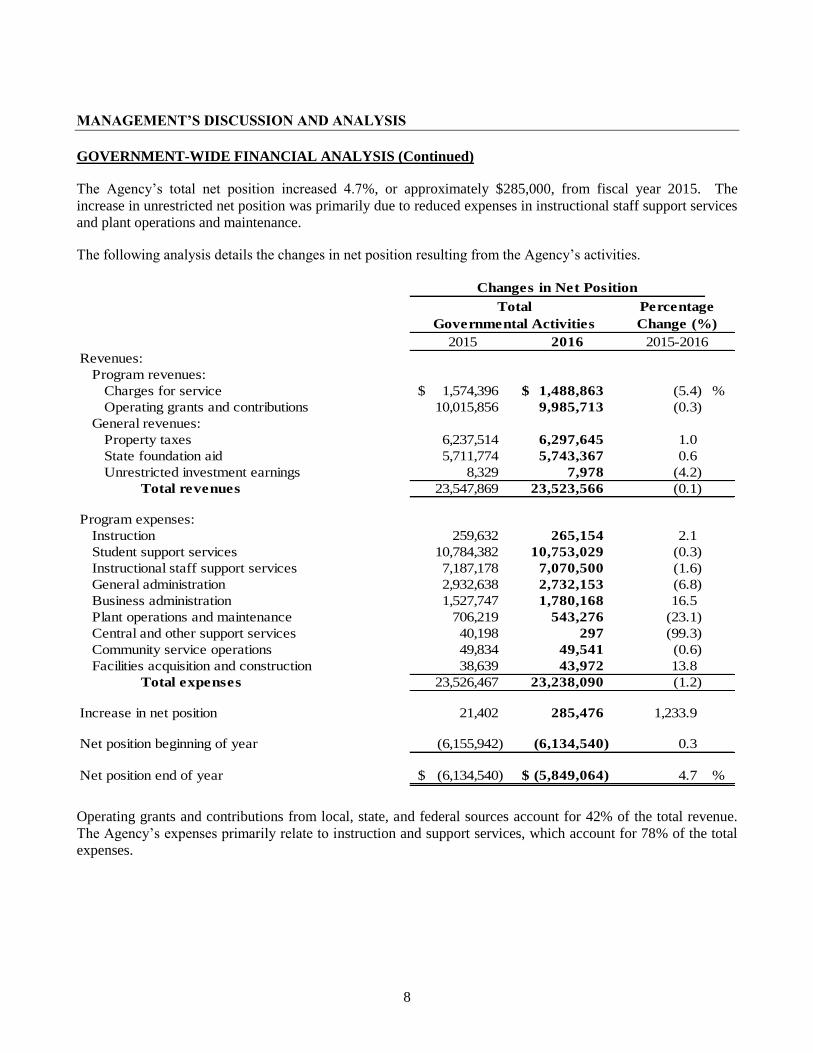
GOVERNMENT-WIDE FINANCIAL ANALYSIS (Continued) The Agency’s total net position increased 4.7%, or approximately $285,000, from fiscal year 2015. The
increase in unrestricted net position was primarily due to reduced expenses in instructional staff support services
and plant operations and maintenance. The following analysis details the changes in net position resulting from the Agency’s activities.
2015 2016
Revenues:
Program revenues:
Charges for service 1,574,396 $ 1,488,863 $ (5.4) %
Operating grants and contributions 10,015,856 9,985,713 (0.3)
General revenues:
Property taxes 6,237,514 6,297,645 1.0
State foundation aid 5,711,774 5,743,367 0.6
Unrestricted investment earnings 8,329 7,978 (4.2)
Total revenues 23,547,869 23,523,566 (0.1)
Program expenses:
Instruction 259,632 265,154 2.1
Student support services 10,784,382 10,753,029 (0.3)
Instructional staff support services 7,187,178 7,070,500 (1.6)
General administration 2,932,638 2,732,153 (6.8)
Business administration 1,527,747 1,780,168 16.5
Plant operations and maintenance 706,219 543,276 (23.1)
Central and other support services 40,198 297 (99.3)
Community service operations 49,834 49,541 (0.6)
Facilities acquisition and construction 38,639 43,972 13.8
Total expenses 23,526,467 23,238,090 (1.2)
Increase in net position 21,402 285,476 1,233.9
Net position beginning of year (6,155,942) (6,134,540) 0.3
Net position end of year (6,134,540) $ (5,849,064) $ 4.7 %
2015-2016
Changes in Net Position
Total
Governmental Activities
Percentage
Change (%)
Operating grants and contributions from local, state, and federal sources account for 42% of the total revenue.
The Agency’s expenses primarily relate to instruction and support services, which account for 78% of the total
expenses.
MANAGEMENT’S DISCUSSION AND ANALYSIS
9
INDIVIDUAL FUND ANALYSIS
As previously noted, Keystone Area Education Agency uses fund accounting to ensure and demonstrate
compliance with finance-related legal requirements.
The Agency’s governmental funds reported a combined fund balance that increased from $1,850,965 to
$1,928,842.
Governmental Fund Highlights
FY '16 for Keystone Area Education Agency was highlighted by the following management strategies:
maintenance of an appropriate ending balance in each of the three divisions (special education, educational
services, and media)
continuation of a conservative master staffing plan in an attempt to ensure appropriate balance among and
between revenue, expenditures and member district needs.
evolution of administrative FTE and associated expenditures following the exodus of five licensed
management staff members (four to retirement; one to lateral placement)
Economic Factors and Next Year’s Budget
FY ’17 for Keystone Area Education Agency promises to be impacted by the following realities:
expiration of the two-year financial agreement with AEA 267 following the merger of Sumner and
Fredericksburg
diminished state resources (2.25% state supplemental aid disproportionate to enrollment drop)
a modest increase in federal special education resources (two years removed from sequestration)
an increase in the AEA reduction from $15 million to $18.75 million at the end of the Iowa Legislature’s
2016 session
escalation of duties for special education to support the state’s effort to close the achievement gap for
students with individualized education programs (IEPs)
escalation of duties for instructional services to support the state’s Multi-Tiered System of Supports
(MTSS) for early literacy, and implement the state’s Teacher Leadership and Compensation (TLC)
program.
recognition of infrastructure needs that will require attention in the next three to five years.
MANAGEMENT’S DISCUSSION AND ANALYSIS
10
BUDGETARY HIGHLIGHTS
The Agency’s Board of Directors annually adopts a budget on a basis consistent with U.S. generally accepted
accounting principles. Although the budget document presents functional disbursements by fund, the legal level
of control is at the total expenditure level, not at the fund or fund type level. After required public notice and
State Board review, the State Board either approves the budget or returns it with comments. Any unapproved
budget must be resubmitted to the State Board for final approval. The budget may be amended during the year
utilizing procedures prescribed by the State Board. Over the course of the year, the Agency amended its annual
operating budget one time to reflect reduced revenue and expenditures. A schedule showing the original and
final budget amounts compared to the Agency’s actual financial activity is included in the required
supplementary information section of this report.
CAPITAL ASSETS AND DEBT ADMINISTRATION
Capital Assets
At June 30, 2016, the Agency had invested approximately $2.8 million, net of accumulated depreciation, in a
broad range of capital assets, including land, building, computers, media lending library and audio-visual
equipment. This is a net decrease of approximately $176,000 from last year. This decrease was primarily due to
the excess of depreciation and dispositions over additions made during the year.
Keystone Area Education Agency had depreciation expense of $423,777 in FY16 and total accumulated
depreciation of approximately $7.3 million on June 30, 2016. More detailed information about capital assets is
available in Note 3 to the financial statements.
CONTACTING THE AGENCY’S FINANCIAL MANAGEMENT
This financial report is designed to provide the Agency’s citizens, taxpayers, customers, investors and creditors
with a general overview of the Agency’s finances and to demonstrate the Agency’s accountability for the money
it receives. If you have questions about this report or need additional financial information, contact the Business
Office of Keystone Area Education Agency, 1400 2nd St N.W., Elkader, Iowa, 52043-9564.

BASIC FINANCIAL STATEMENTS

11
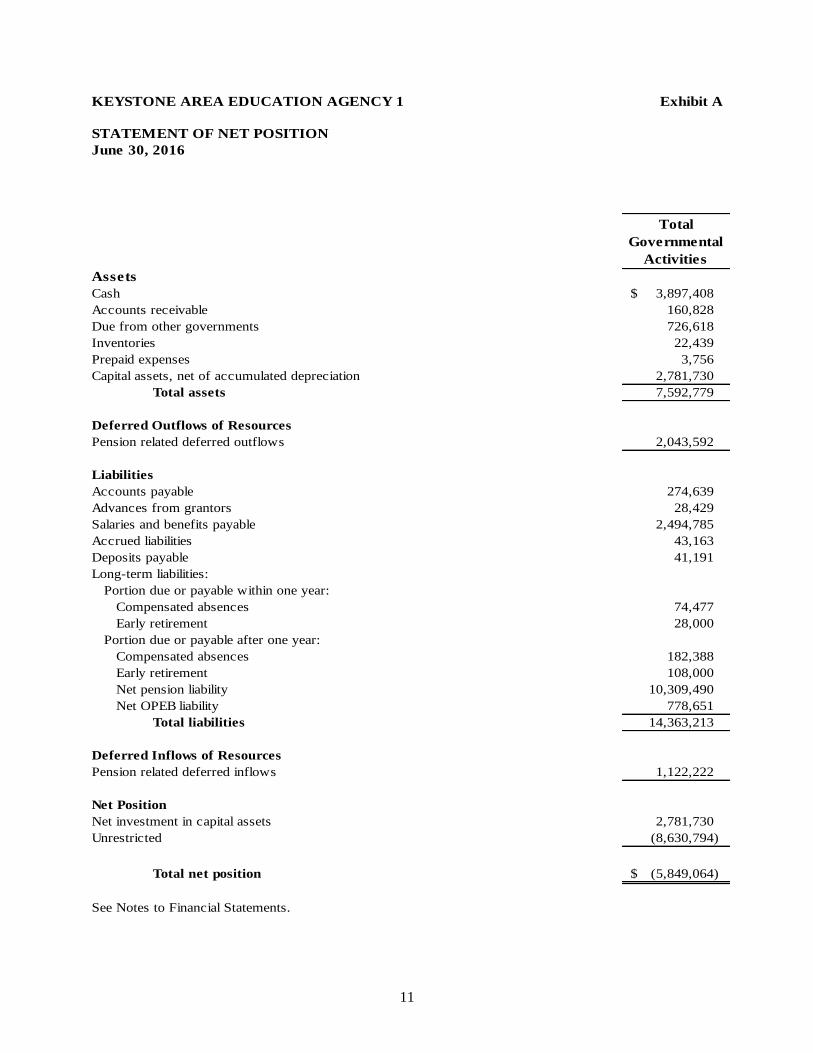
KEYSTONE AREA EDUCATION AGENCY 1 Exhibit A
June 30, 2016
Total
Governmental
Activities
Assets
Cash 3,897,408 $
Accounts receivable 160,828
Due from other governments 726,618
Inventories 22,439
Prepaid expenses 3,756
Capital assets, net of accumulated depreciation 2,781,730
Total assets 7,592,779
Deferred Outflows of Resources
Pension related deferred outflows 2,043,592
Liabilities
Accounts payable 274,639
Advances from grantors 28,429
Salaries and benefits payable 2,494,785
Accrued liabilities 43,163
Deposits payable 41,191
Long-term liabilities:
Portion due or payable within one year:
Compensated absences 74,477
Early retirement 28,000
Portion due or payable after one year:
Compensated absences 182,388
Early retirement 108,000
Net pension liability 10,309,490
Net OPEB liability 778,651
Total liabilities 14,363,213
Deferred Inflows of Resources
Pension related deferred inflows 1,122,222
Net Position
Net investment in capital assets 2,781,730
Unrestricted (8,630,794)
Total net position (5,849,064) $
See Notes to Financial Statements.
STATEMENT OF NET POSITION
KEYSTONE AREA EDUCATION AGENCY 1
Year Ended June 30, 2016
Expenses
Charges for
Services
Operating
Grants and
Contributions
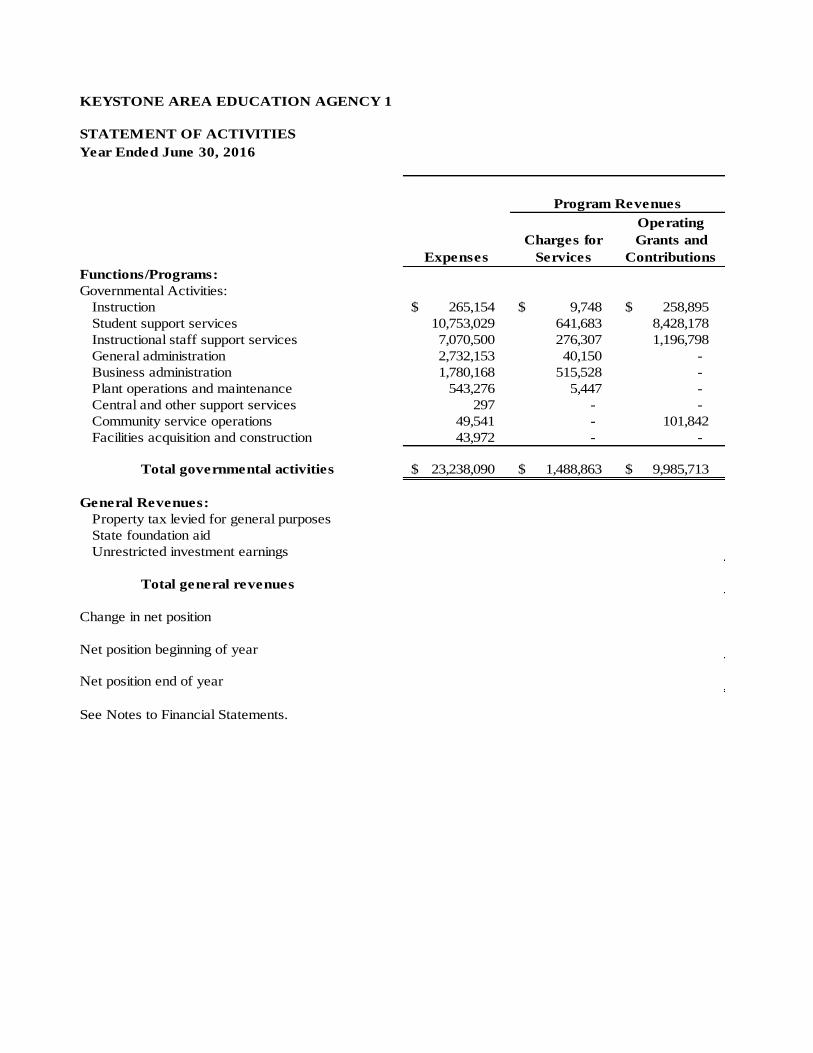
Functions/Programs:
Governmental Activities:
Instruction 265,154 $ 9,748 $ 258,895 $
Student support services 10,753,029 641,683 8,428,178
Instructional staff support services 7,070,500 276,307 1,196,798
General administration 2,732,153 40,150 -
Business administration 1,780,168 515,528 -
Plant operations and maintenance 543,276 5,447 -
Central and other support services 297 - -
Community service operations 49,541 - 101,842
Facilities acquisition and construction 43,972 - -
Total governmental activities 23,238,090 $ 1,488,863 $ 9,985,713 $
General Revenues:
Property tax levied for general purposes
State foundation aid
Unrestricted investment earnings
Total general revenues
Change in net position
Net position beginning of year
Net position end of year
See Notes to Financial Statements.
STATEMENT OF ACTIVITIES
Program Revenues
12
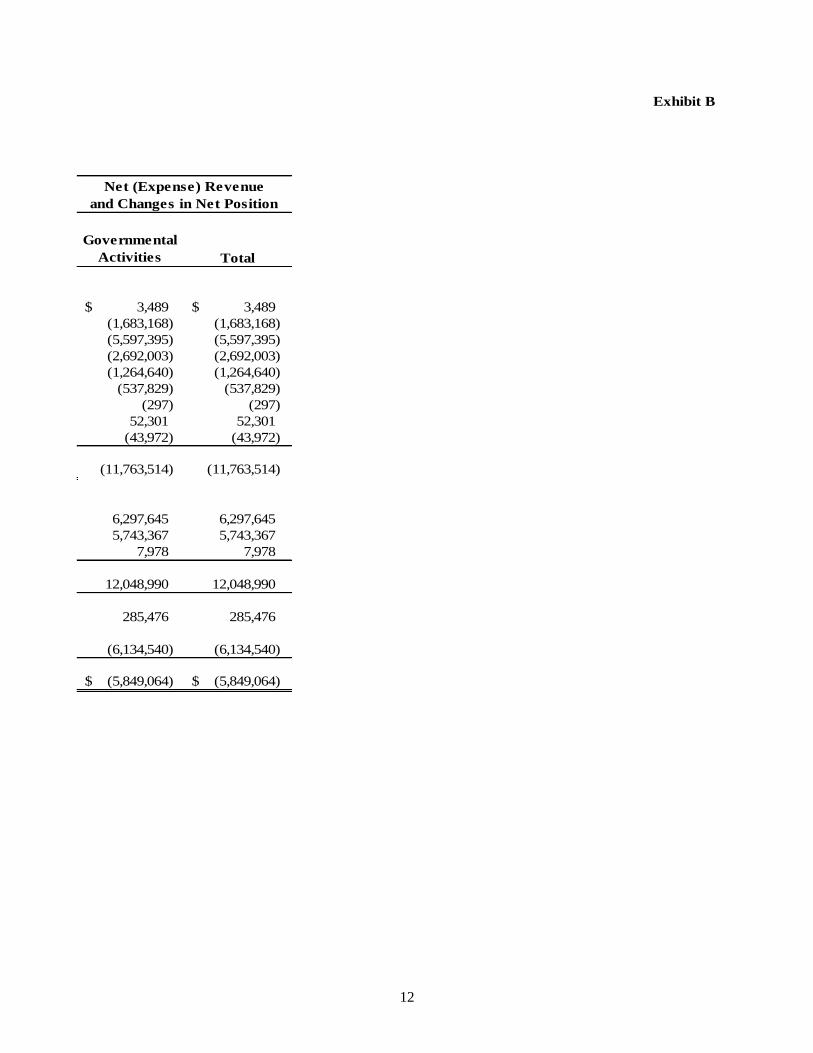
Exhibit B
Governmental
Activities Total
3,489 $ 3,489 $
(1,683,168) (1,683,168)
(5,597,395) (5,597,395)
(2,692,003) (2,692,003)
(1,264,640) (1,264,640)
(537,829) (537,829)
(297) (297)
52,301 52,301
(43,972) (43,972)
(11,763,514) (11,763,514)
6,297,645 6,297,645
5,743,367 5,743,367
7,978 7,978
12,048,990 12,048,990
285,476 285,476
(6,134,540) (6,134,540)
(5,849,064) $ (5,849,064) $
Net (Expense) Revenue
and Changes in Net Position
13
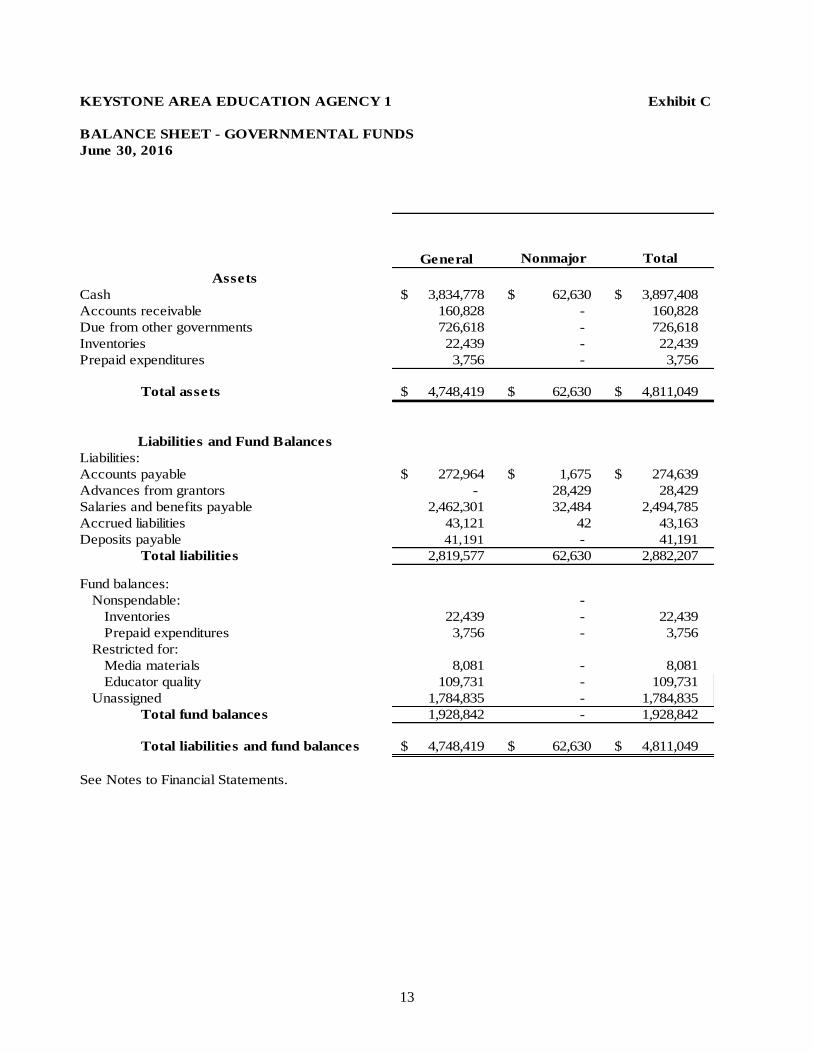
KEYSTONE AREA EDUCATION AGENCY 1 Exhibit C
June 30, 2016
General Nonmajor Total
Assets
Cash 3,834,778 $ 62,630 $ 3,897,408 $
Accounts receivable 160,828 - 160,828
Due from other governments 726,618 - 726,618
Inventories 22,439 - 22,439
Prepaid expenditures 3,756 - 3,756
Total assets 4,748,419 $ 62,630 $ 4,811,049 $
Liabilities and Fund Balances
Liabilities:
Accounts payable 272,964 $ 1,675 $ 274,639 $
Advances from grantors - 28,429 28,429
Salaries and benefits payable 2,462,301 32,484 2,494,785
Accrued liabilities 43,121 42 43,163
Deposits payable 41,191 - 41,191
Total liabilities 2,819,577 62,630 2,882,207
Fund balances:
Nonspendable: -
Inventories 22,439 - 22,439
Prepaid expenditures 3,756 - 3,756
Restricted for:
Media materials 8,081 - 8,081
Educator quality 109,731 - 109,731
Unassigned 1,784,835 - 1,784,835
Total fund balances 1,928,842 - 1,928,842
Total liabilities and fund balances 4,748,419 $ 62,630 $ 4,811,049 $
See Notes to Financial Statements.
BALANCE SHEET - GOVERNMENTAL FUNDS
14
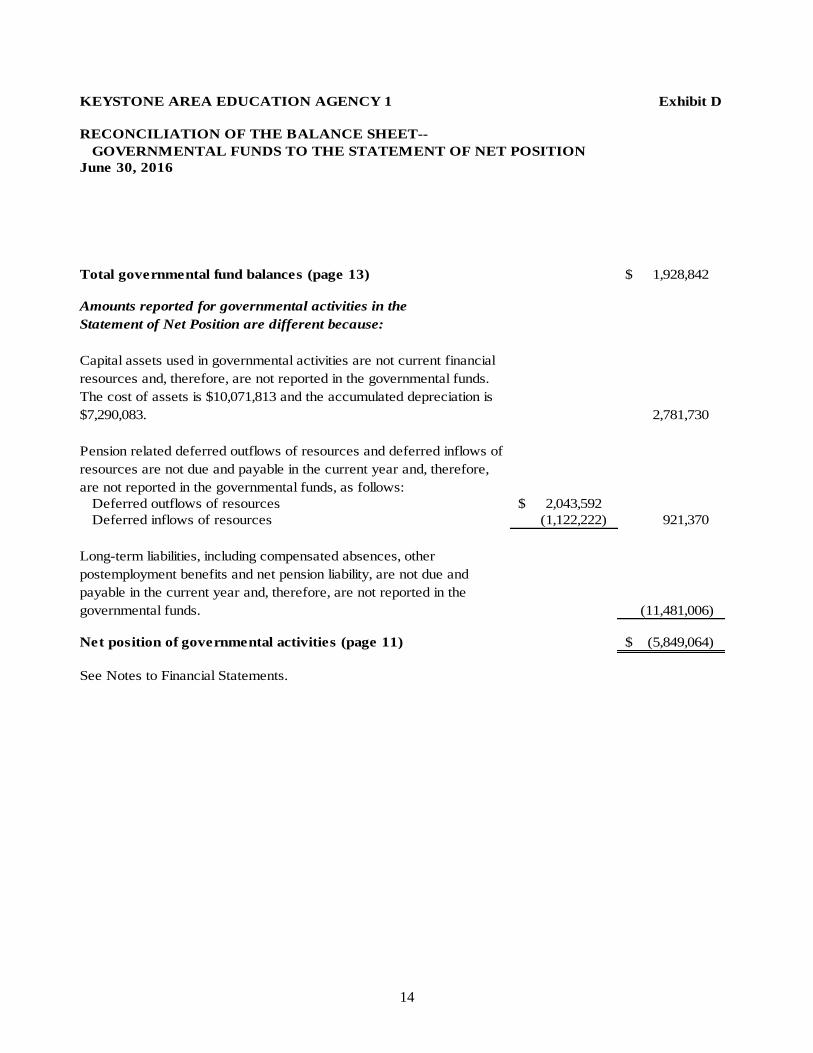
KEYSTONE AREA EDUCATION AGENCY 1 Exhibit D
June 30, 2016
Total governmental fund balances (page 13) 1,928,842 $
Amounts reported for governmental activities in the
Statement of Net Position are different because:
Capital assets used in governmental activities are not current financial
resources and, therefore, are not reported in the governmental funds.
The cost of assets is $10,071,813 and the accumulated depreciation is
$7,290,083. 2,781,730
Pension related deferred outflows of resources and deferred inflows of
resources are not due and payable in the current year and, therefore,
are not reported in the governmental funds, as follows:
Deferred outflows of resources 2,043,592 $
Deferred inflows of resources (1,122,222) 921,370
Long-term liabilities, including compensated absences, other
postemployment benefits and net pension liability, are not due and
payable in the current year and, therefore, are not reported in the
governmental funds. (11,481,006)
Net position of governmental activities (page 11) (5,849,064) $
See Notes to Financial Statements.
RECONCILIATION OF THE BALANCE SHEET--
GOVERNMENTAL FUNDS TO THE STATEMENT OF NET POSITION
15
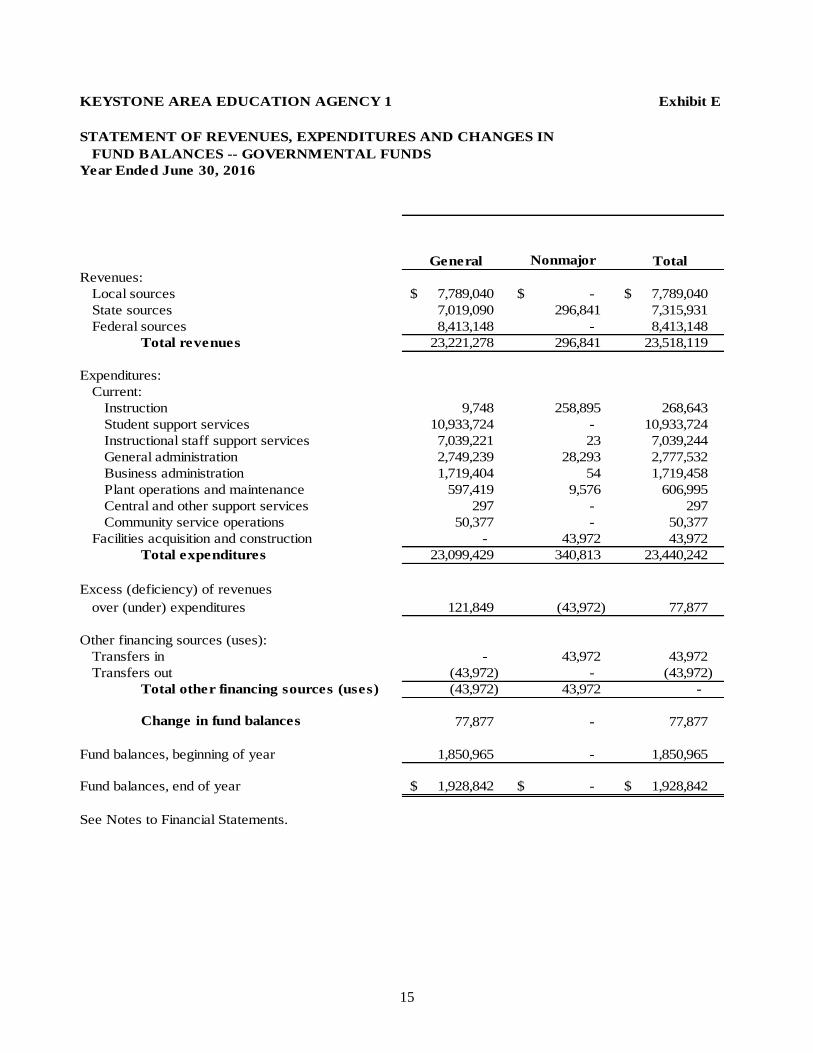
KEYSTONE AREA EDUCATION AGENCY 1 Exhibit E
Year Ended June 30, 2016
General Nonmajor Total
Revenues:
Local sources 7,789,040 $ -$ 7,789,040 $
State sources 7,019,090 296,841 7,315,931
Federal sources 8,413,148 - 8,413,148
Total revenues 23,221,278 296,841 23,518,119
Expenditures:
Current:
Instruction 9,748 258,895 268,643
Student support services 10,933,724 - 10,933,724
Instructional staff support services 7,039,221 23 7,039,244
General administration 2,749,239 28,293 2,777,532
Business administration 1,719,404 54 1,719,458
Plant operations and maintenance 597,419 9,576 606,995
Central and other support services 297 - 297
Community service operations 50,377 - 50,377
Facilities acquisition and construction - 43,972 43,972
Total expenditures 23,099,429 340,813 23,440,242
Excess (deficiency) of revenues
over (under) expenditures 121,849 (43,972) 77,877
Other financing sources (uses):
Transfers in - 43,972 43,972
Transfers out (43,972) - (43,972)
Total other financing sources (uses) (43,972) 43,972 -
Change in fund balances 77,877 - 77,877
Fund balances, beginning of year 1,850,965 - 1,850,965
Fund balances, end of year 1,928,842 $ -$ 1,928,842 $
See Notes to Financial Statements.
STATEMENT OF REVENUES, EXPENDITURES AND CHANGES IN
FUND BALANCES -- GOVERNMENTAL FUNDS
16
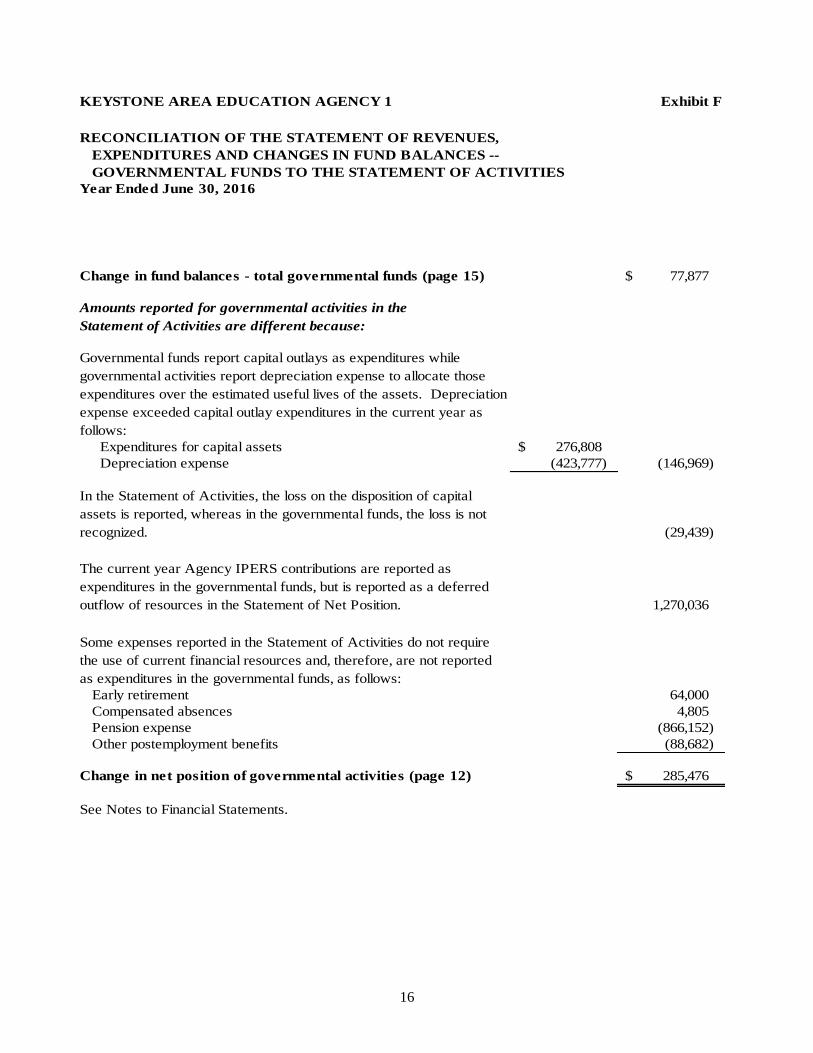
KEYSTONE AREA EDUCATION AGENCY 1 Exhibit F
Year Ended June 30, 2016
Change in fund balances - total governmental funds (page 15) 77,877 $
Amounts reported for governmental activities in the
Statement of Activities are different because:
Governmental funds report capital outlays as expenditures while
governmental activities report depreciation expense to allocate those
expenditures over the estimated useful lives of the assets. Depreciation
expense exceeded capital outlay expenditures in the current year as
follows:
Expenditures for capital assets 276,808 $
Depreciation expense (423,777) (146,969)
In the Statement of Activities, the loss on the disposition of capital
assets is reported, whereas in the governmental funds, the loss is not
recognized. (29,439)
The current year Agency IPERS contributions are reported as
expenditures in the governmental funds, but is reported as a deferred
outflow of resources in the Statement of Net Position. 1,270,036
Some expenses reported in the Statement of Activities do not require
the use of current financial resources and, therefore, are not reported
as expenditures in the governmental funds, as follows:
Early retirement 64,000
Compensated absences 4,805
Pension expense (866,152)
Other postemployment benefits (88,682)
Change in net position of governmental activities (page 12) 285,476 $
See Notes to Financial Statements.
RECONCILIATION OF THE STATEMENT OF REVENUES,
EXPENDITURES AND CHANGES IN FUND BALANCES --
GOVERNMENTAL FUNDS TO THE STATEMENT OF ACTIVITIES
17
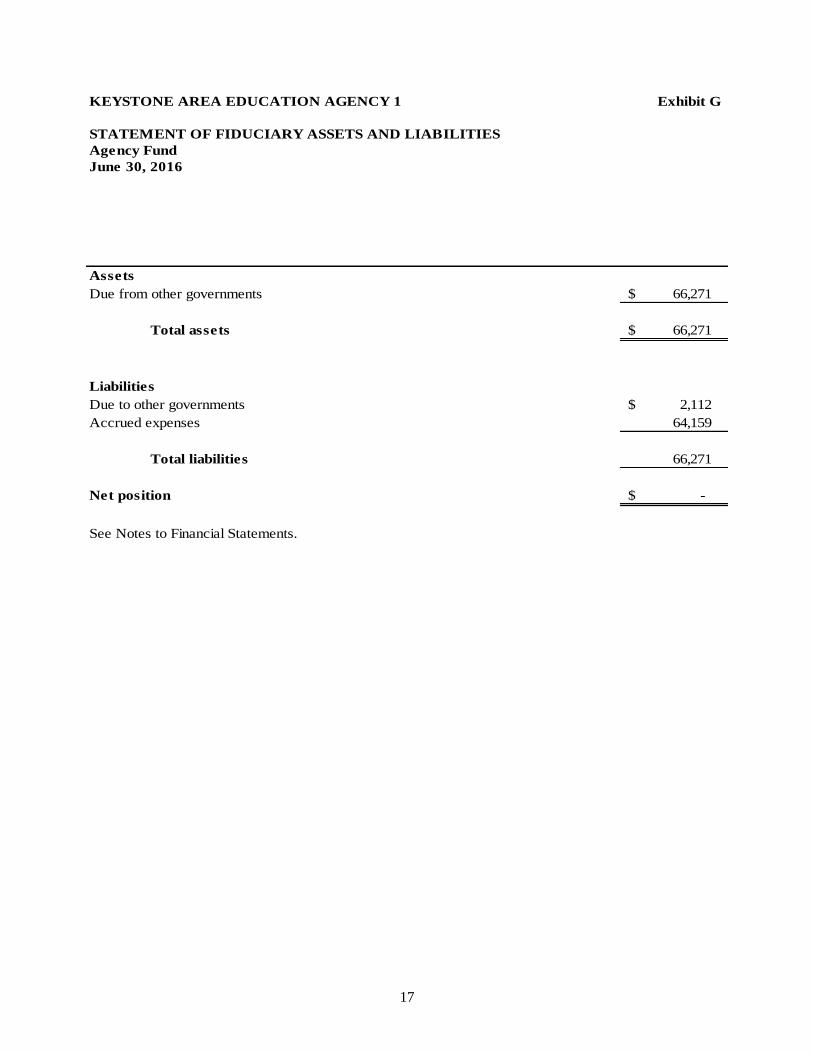
KEYSTONE AREA EDUCATION AGENCY 1 Exhibit G
Agency Fund
June 30, 2016
Assets
Due from other governments 66,271 $
Total assets 66,271 $
Liabilities
Due to other governments 2,112 $
Accrued expenses 64,159
Total liabilities 66,271
Net position -$
See Notes to Financial Statements.
STATEMENT OF FIDUCIARY ASSETS AND LIABILITIES
KEYSTONE AREA EDUCATION AGENCY 1
NOTES TO FINANCIAL STATEMENTS
18
Note 1. Summary of Significant Accounting Policies
Keystone Area Education Agency 1 is an intermediate school corporation established to identify and serve
children who require special education. The Agency also provides media services and education support
services. These programs and support services are provided to 23 school districts and private schools in an
eight-county area. The Agency is governed by a Board of Directors whose members are elected on a non-
partisan basis.
The Agency’s financial statements are prepared in conformity with U.S. generally accepted accounting
principles as prescribed by the Governmental Accounting Standards Board.
A. Reporting Entity:
For financial reporting purposes, Keystone Area Education Agency 1 has included all funds, organizations,
agencies, boards, commissions and authorities. The Agency has also considered all potential component
units for which it is financially accountable and other organizations for which the nature and significance of
their relationship with the Agency are such that exclusion would cause the Agency's financial statements to
be misleading or incomplete. The Governmental Accounting Standards Board has set forth criteria to be
considered in determining financial accountability. These criteria include appointing a voting majority of an
organization's governing body and (1) the ability of the Agency to impose its will on that organization or (2)
the potential for the organization to provide specific benefits to or impose specific financial burdens on the
Agency. The Agency has no component units that meet the Governmental Accounting Standards Board
criteria.
B. Basis of Presentation:
Government-wide financial statements: The Statement of Net Position and the Statement of Activities
report information on all of the activities of the Agency. For the most part, the effect of interfund activity
has been removed from these statements. Governmental activities, which normally are supported by
intergovernmental revenues, are reported separately from business-type activities, which rely to a significant
extent on fees and charges for support.
The Statement of Net Position presents the Agency’s nonfiduciary assets, deferred outflows of resources,
liabilities and deferred inflows of resources, with the difference reported as net position. Net position is
reported in the following categories:
Net investment in capital assets consists of capital assets, net of accumulated depreciation and reduced
by outstanding balances for bonds, notes, and other debt attributable to the acquisition, construction or
improvement of those assets.
Restricted net position results when constraints placed on net position use are either externally imposed
or are imposed by law through constitutional provisions or enabling legislation. Enabling legislation did
not result in any restricted net position.
Unrestricted net position consists of net position not meeting the definition of the preceding categories.
Unrestricted net position is often subject to constraints imposed by management which can be removed
or modified.
NOTES TO FINANCIAL STATEMENTS
19
Note 1. Summary of Significant Accounting Policies (Continued)
B. Basis of Presentation (continued):
Government-wide financial statements (continued): The Statement of Activities demonstrates the degree
to which the direct expenses of a given function or segment are offset by program revenues. Direct
expenses are those clearly identifiable with a specific function. Program revenues include 1) charges to
customers or applicants who purchase, use, or directly benefit from goods, services, or privileges provided
by a given function and 2) grants, contributions and interest restricted to meeting the operational or capital
requirements of a particular function. Unrestricted interest income and other items not properly included
among program revenues are reported as general revenues.
Fund financial statements: Separate financial statements are provided for governmental and proprietary
funds. Major individual governmental funds are reported as separate columns in the fund financial
statements. All remaining governmental funds are aggregated and reported as nonmajor governmental
funds.
The Agency reports the following major governmental fund:
The General Fund is the general operating fund of the Agency. All general revenues and other revenues
not allocated by law or contractual agreement to some other fund are accounted for in this fund. From the
fund are paid the general operating expenditures, including instructional, support and other costs.
The Agency also reports the following fiduciary fund:
The Agency Fund is used to account for assets held by the Agency as an agent for individuals, private
organizations and other governments. The Agency Fund is custodial in nature, assets equal liabilities, and
does not involve measurement of results of operations.
C. Measurement Focus and Basis of Accounting:
The government-wide financial statements are reported using the economic resources measurement focus
and the accrual basis of accounting. Revenues are recorded when earned and expenses are recorded when a
liability is incurred, regardless of the timing of related cash flows. Grants and similar items are recognized
as revenue as soon as all eligibility requirements imposed by the provider have been satisfied.
Governmental fund financial statements are reported using the current financial resources measurement
focus and the modified accrual basis of accounting. Revenues are recognized as soon as they are both
measurable and available. Revenues are considered to be available when they are collectible within the
current year or soon enough thereafter to pay liabilities of the current year. For this purpose, the Agency
considers revenues to be available if they are collected within 60 days after year-end.
Intergovernmental revenues (shared revenues, grants and reimbursements from other governments) and
interest associated with the current year are all considered to be susceptible to accrual. All other revenue
items are considered to be measurable and available only when cash is received by the Agency.
NOTES TO FINANCIAL STATEMENTS
20
Note 1. Summary of Significant Accounting Policies (Continued)
C. Measurement Focus and Basis of Accounting (continued):
Expenditures generally are recorded when a liability is incurred, as under accrual accounting. However,
principal and interest on long-term debt, claims and judgments and compensated absences are recognized as
expenditures only when payment is due. Capital asset acquisitions are reported as expenditures in
governmental funds. Proceeds of general long-term debt and acquisitions under capital leases are reported
as other financing sources.
Under the terms of grant agreements, the Agency funds certain programs by a combination of specific cost-
reimbursement grants and general revenues. Thus, when program expenses are incurred, there are both
restricted and unrestricted net position available to finance the program. It is the Agency’s policy to first
apply cost-reimbursement grant resources to such programs and then general revenues.
When an expenditure is incurred in governmental funds which can be paid using either restricted or
unrestricted resources, the Agency’s policy is to pay the expenditure from restricted fund balance and then
from, less-restrictive classifications – committed, assigned, and then unassigned fund balances.
D. Assets, Deferred Outflows of Resources, Liabilities, Deferred Inflows of Resources and Fund Equity:
Cash: Cash includes amounts in demand deposits and money market funds.
Inventories: Inventories are stated at cost using the first-in, first-out method and consist of expendable
supplies and materials. The cost of these items is recorded as an expenditure at the time of consumption.
Capital assets: Capital assets, which include property, furniture and equipment and intangibles acquired
after July 1, 1980 are reported in the applicable governmental or business type activities columns in the
government-wide Statement of Net Position. Capital assets are recorded at historical cost. Donated capital
assets are recorded at estimated fair market value at the date of donation. The costs of normal maintenance
and repair that do not add to the value of the asset or materially extend asset lives are not capitalized.
Capital assets are defined by the Agency as assets with initial, individual costs in excess of the following
thresholds and estimated useful lives in excess of two years.
Asset Class Amount
Land No lower limit
Building 50,000 $
Improvements other than buildings 5,000
Furniture and equipment 5,000
Library books Aggregated annual purchases
NOTES TO FINANCIAL STATEMENTS
21
Note 1. Summary of Significant Accounting Policies (Continued)
D. Assets, Deferred Outflows of Resources, Liabilities, Deferred Inflows of Resources and Fund Equity
(continued):
Capital assets (continued): Capital assets of the Agency are depreciated using the straight-line method of
depreciation over the following estimated useful lives:
Asset Class
Estimated
Useful Lives
(In Years)
Buildings 25
Improvements other than buildings 20
Furniture and equipment 5-20
Library books 5
Deferred outflows of resources: Deferred outflows of resources represent a consumption of net position
applicable to a future year(s) which will not be recognized as an outflow of resources (expense/ expenditure)
until then. Deferred outflows of resources consist of unrecognized items not yet charged to pension expense
and contributions from the Agency after the measurement date, but before the end of the Agency’s reporting
period.
Advances from grantors: Grant proceeds which have been received by the Agency but will be spent in a
succeeding fiscal year.
Salaries and benefits payable: Payroll and related expenses for employees with annual contracts
corresponding to the current fiscal year, which are payable in July and August, have been accrued as
liabilities.
Compensated absences: Agency employees accumulate a limited amount of earned but unused vacation
and sick leave hours for subsequent use or for payment upon termination, death or retirement. A liability
has been recorded in the Statement of Net Position representing the Agency’s commitment to fund non-
current compensated absences. This liability has been computed based on rates of pay in effect at June 30,
2016. The compensated absences liability attributable to the governmental activities will be paid primarily
by the General and Special Revenue Funds.
Long-term liabilities: In the government-wide financial statements, long-term debt and other long-term
obligations are reported as liabilities in the governmental activities column in the Statement of Net Position.
Pensions: For purposes of measuring the net pension liability, deferred outflows of resources, deferred
inflows of resources related to pensions and pension expense, information about the fiduciary net position of
the Iowa Public Employees’ Retirement System (IPERS) and additions to/deductions from IPERS’ fiduciary
net position have been determined on the same basis as they are reported by IPERS. For this purpose,
benefit payments (including refunds of employee contributions) are recognized when due and payable in
accordance with the benefit terms. Investments are reported at fair value. The net pension liability
attributable to the governmental activities will be paid primarily by the General and Special Revenue Funds.
NOTES TO FINANCIAL STATEMENTS
22
Note 1. Summary of Significant Accounting Policies (Continued)
D. Assets, Deferred Outflows of Resources, Liabilities, Deferred Inflows of Resources and Fund Equity
(continued):
Deferred Inflows of Resources: Deferred inflows of resources represents an acquisition of net position
applicable to a future year(s) which will not be recognized as an inflow of resources (revenue) until that
time. Although certain revenues are measurable, they are not available. Available means collected within
the current year or expected to be collected soon enough thereafter to be used to pay liabilities of the current
year. Deferred inflows of resources in the governmental fund financial statements represent the amount of
assets that have been recognized, but the related revenue has not been recognized since the assets are not
collected within the current year or expected to be collected soon enough thereafter to be used to pay
liabilities of the current year. Deferred inflows of resources consist of receivables not collected within sixty
days after year end.
Deferred inflows of resources in the Statement of Net Position consist of the unamortized portion of the net
difference between projected and actual earnings on IPERS’ investments.
Fund Balances: In the governmental fund financial statements, fund balances are classified as follows:
Nonspendable Amounts which cannot be spent because they are in a nonspendable form or because they
are legally or contractually required to be maintained intact.
Restricted Amounts restricted to specific purposes when constraints placed on the use of the resources are
either externally imposed by creditors, grantors or state or federal laws or are imposed by law through
constitutional provisions or enabling legislation.
Committed Amounts which can be used only for specific purposes determined pursuant to constraints
formally imposed by the Board of Directors through resolution approved prior to year-end. Committed
amounts cannot be used for any other purpose unless the Board of Directors removes or changes the
specified use by taking the same action it employed to commit these amounts.
Unassigned Amounts not included in preceding classifications.
E. Budgets and Budgetary Accounting
The budgetary comparison and related disclosures are reported as Required Supplementary Information.
F. Subsequent Events
Subsequent events have been evaluated through November 7, 2016, which is the date the financial
statements were available to be issued. Events occurring after that date have not been evaluated to
determine whether a change in the financial statements would be required.
NOTES TO FINANCIAL STATEMENTS
23
Note 2. Cash
The Agency's deposits in banks at June 30, 2016 were entirely covered by federal depository insurance or by the
state sinking fund in accordance with Chapter 12C of the Code of Iowa. This chapter provides for additional
assessments against the depositories to insure there will be no loss of public funds.
The Agency is authorized by statute to invest public funds in obligations of the United States government, its
agencies and instrumentalities; certificates of deposit or other evidences of deposit at federally insured
depository institutions approved by the Board of Directors; prime eligible bankers’ acceptances; certain high
rated commercial paper; perfected repurchase agreements; certain registered open-end management investment
companies; certain joint investment trusts; and warrants or improvement certificates of a drainage district.
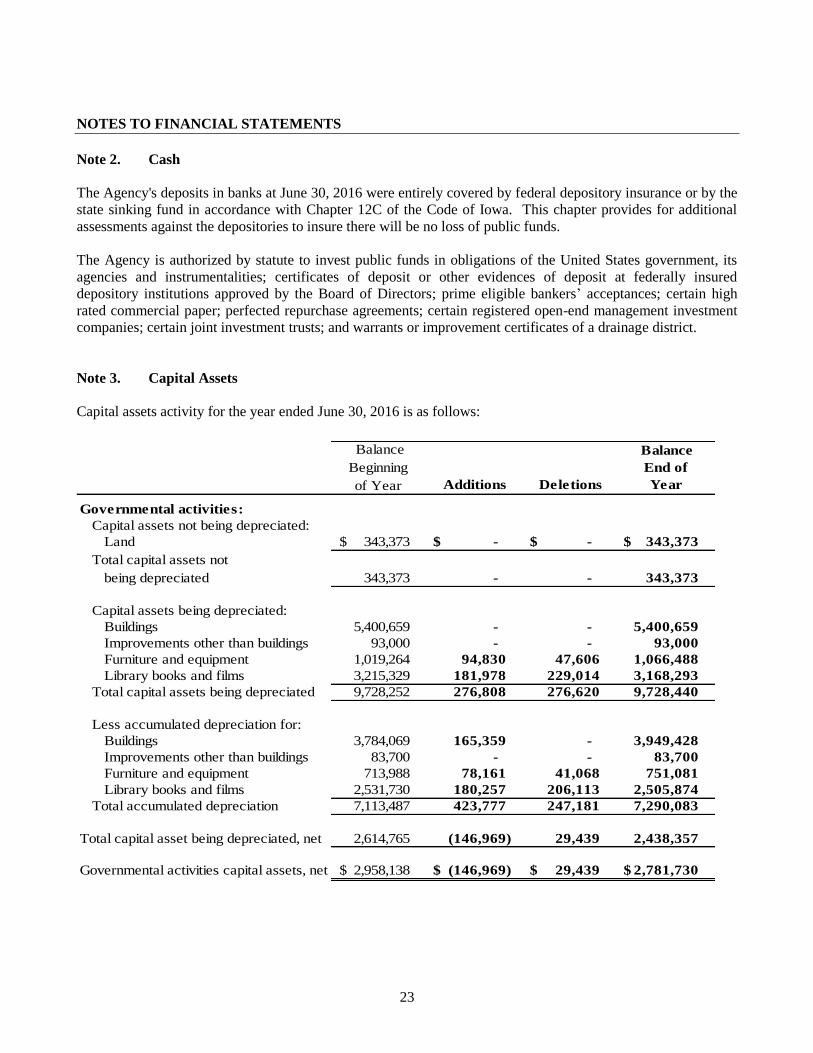
Note 3. Capital Assets
Capital assets activity for the year ended June 30, 2016 is as follows:
Balance
Beginning
of Year Additions Deletions
Balance
End of
Year
Governmental activities:
Capital assets not being depreciated:
Land 343,373 $ -$ -$ 343,373 $
343,373 - - 343,373
Capital assets being depreciated:
Buildings 5,400,659 - - 5,400,659
Improvements other than buildings 93,000 - - 93,000
Furniture and equipment 1,019,264 94,830 47,606 1,066,488
Library books and films 3,215,329 181,978 229,014 3,168,293
Total capital assets being depreciated 9,728,252 276,808 276,620 9,728,440
Less accumulated depreciation for:
Buildings 3,784,069 165,359 - 3,949,428
Improvements other than buildings 83,700 - - 83,700
Furniture and equipment 713,988 78,161 41,068 751,081
Library books and films 2,531,730 180,257 206,113 2,505,874
Total accumulated depreciation 7,113,487 423,777 247,181 7,290,083
2,614,765 (146,969) 29,439 2,438,357
Governmental activities capital assets, net 2,958,138 $ (146,969) $ 29,439 $ 2,781,730 $
Total capital assets not
being depreciated
Total capital asset being depreciated, net
NOTES TO FINANCIAL STATEMENTS
24
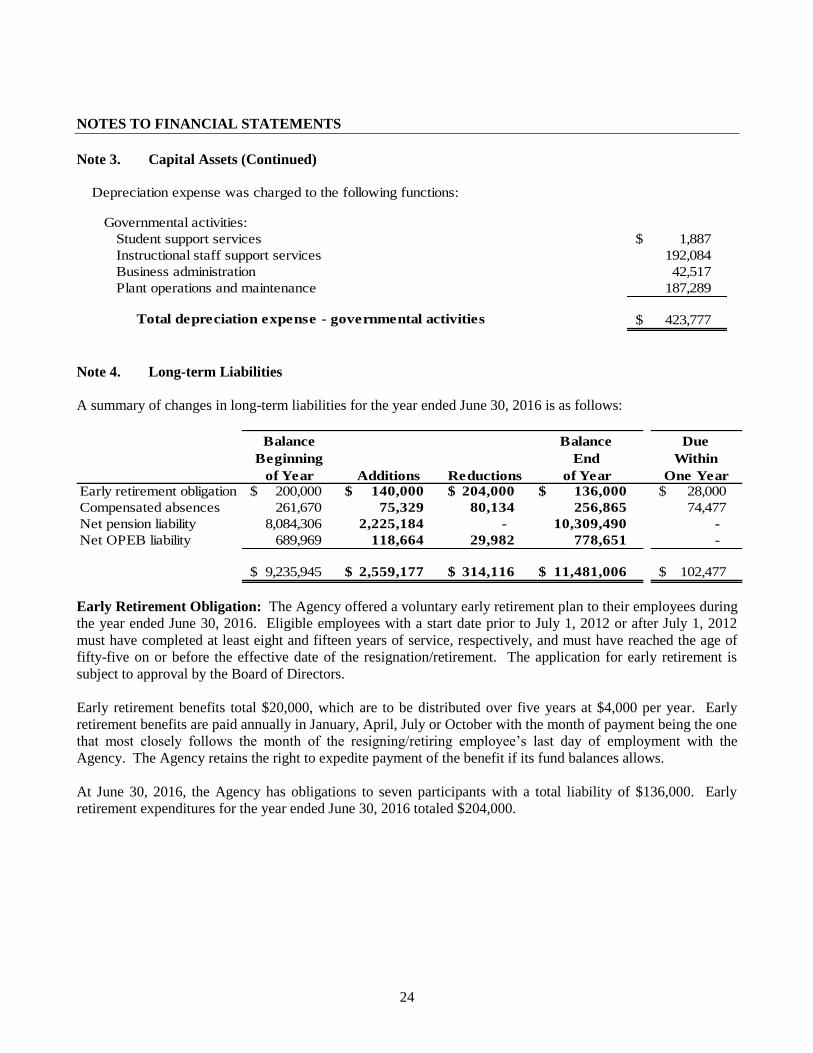
Note 3. Capital Assets (Continued)
Depreciation expense was charged to the following functions:
Governmental activities:
Student support services 1,887 $
Instructional staff support services 192,084
Business administration 42,517
Plant operations and maintenance 187,289
423,777 $ Total depreciation expense - governmental activities
Note 4. Long-term Liabilities
A summary of changes in long-term liabilities for the year ended June 30, 2016 is as follows:
Balance
Beginning
of Year Additions Reductions
Balance
End
of Year
Due
Within
One Year
Early retirement obligation 200,000 $ 140,000 $ 204,000 $ 136,000 $ 28,000 $
Compensated absences 261,670 75,329 80,134 256,865 74,477
Net pension liability 8,084,306 2,225,184 - 10,309,490 -
Net OPEB liability 689,969 118,664 29,982 778,651 -
9,235,945 $ 2,559,177 $ 314,116 $ 11,481,006 $ 102,477 $
Early Retirement Obligation: The Agency offered a voluntary early retirement plan to their employees during
the year ended June 30, 2016. Eligible employees with a start date prior to July 1, 2012 or after July 1, 2012
must have completed at least eight and fifteen years of service, respectively, and must have reached the age of
fifty-five on or before the effective date of the resignation/retirement. The application for early retirement is
subject to approval by the Board of Directors.
Early retirement benefits total $20,000, which are to be distributed over five years at $4,000 per year. Early
retirement benefits are paid annually in January, April, July or October with the month of payment being the one
that most closely follows the month of the resigning/retiring employee’s last day of employment with the
Agency. The Agency retains the right to expedite payment of the benefit if its fund balances allows.
At June 30, 2016, the Agency has obligations to seven participants with a total liability of $136,000. Early
retirement expenditures for the year ended June 30, 2016 totaled $204,000.
NOTES TO FINANCIAL STATEMENTS
25
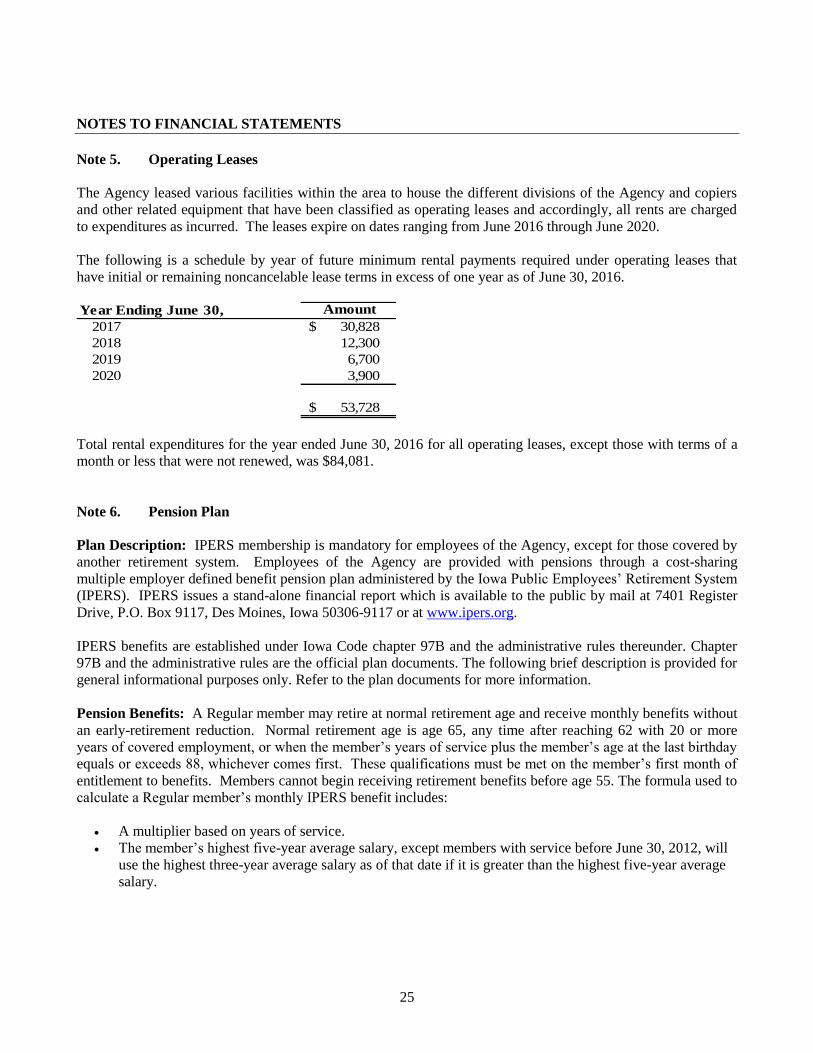
Note 5. Operating Leases
The Agency leased various facilities within the area to house the different divisions of the Agency and copiers
and other related equipment that have been classified as operating leases and accordingly, all rents are charged
to expenditures as incurred. The leases expire on dates ranging from June 2016 through June 2020.
The following is a schedule by year of future minimum rental payments required under operating leases that
have initial or remaining noncancelable lease terms in excess of one year as of June 30, 2016.
Amount
2017 30,828 $
2018 12,300
2019 6,700
2020 3,900
53,728 $
Year Ending June 30,
Total rental expenditures for the year ended June 30, 2016 for all operating leases, except those with terms of a
month or less that were not renewed, was $84,081.
Note 6. Pension Plan
Plan Description: IPERS membership is mandatory for employees of the Agency, except for those covered by
another retirement system. Employees of the Agency are provided with pensions through a cost-sharing
multiple employer defined benefit pension plan administered by the Iowa Public Employees’ Retirement System
(IPERS). IPERS issues a stand-alone financial report which is available to the public by mail at 7401 Register
Drive, P.O. Box 9117, Des Moines, Iowa 50306-9117 or at www.ipers.org.
IPERS benefits are established under Iowa Code chapter 97B and the administrative rules thereunder. Chapter
97B and the administrative rules are the official plan documents. The following brief description is provided for
general informational purposes only. Refer to the plan documents for more information.
Pension Benefits: A Regular member may retire at normal retirement age and receive monthly benefits without
an early-retirement reduction. Normal retirement age is age 65, any time after reaching 62 with 20 or more
years of covered employment, or when the member’s years of service plus the member’s age at the last birthday
equals or exceeds 88, whichever comes first. These qualifications must be met on the member’s first month of
entitlement to benefits. Members cannot begin receiving retirement benefits before age 55. The formula used to
calculate a Regular member’s monthly IPERS benefit includes:
A multiplier based on years of service.
The member’s highest five-year average salary, except members with service before June 30, 2012, will
use the highest three-year average salary as of that date if it is greater than the highest five-year average
salary.
NOTES TO FINANCIAL STATEMENTS
26
Note 6. Pension Plan (Continued)
Pension Benefits (continued): If a member retires before normal retirement age, the member’s monthly
retirement benefit will be permanently reduced by an early-retirement reduction. The early-retirement reduction
is calculated differently for service earned before and after July 1, 2012. For service earned before July 1, 2012,
the reduction is 0.25% for each month that the member receives benefits before the member’s earliest normal
retirement age. For service earned on or after July 1, 2012, the reduction is 0.50% for each month that the
member receives benefits before age 65.
Generally, once a member selects a benefit option, a monthly benefit is calculated and remains the same for the
rest of the member’s lifetime. However, to combat the effects of inflation, retirees who began receiving benefits
prior to July 1990 receive a guaranteed dividend with their regular November benefit payments.
Disability and Death Benefits: A vested member who is awarded federal Social Security disability or Railroad
Retirement disability benefits is eligible to claim IPERS benefits regardless of age. Disability benefits are not
reduced for early retirement. If a member dies before retirement, the member’s beneficiary will receive a
lifetime annuity or a lump-sum payment equal to the present actuarial value of the member’s accrued benefit or
calculated with a set formula, whichever is greater. When a member dies after retirement, death benefits depend
on the benefit option the member selected at retirement.
Contributions: Contribution rates are established by IPERS following the annual actuarial valuation, which
applies IPERS’ Contribution Rate Funding Policy and Actuarial Amortization Method. State statute limits the
amount rates can increase or decrease each year to 1 percentage point. IPERS Contribution Rate Funding Policy
requires that the actuarial contribution rate be determined using the “entry age normal” actuarial cost method
and the actuarial assumptions and methods approved by the IPERS Investment Board. The actuarial contribution
rate covers normal cost plus the unfunded actuarial liability payment based on a 30-year amortization period.
The payment to amortize the unfunded actuarial liability is determined as level percentage of payroll, based on
the Actuarial Amortization Method adopted by the Investment Board.
In fiscal year 2016, pursuant to the required rate, Regular members contributed 5.95% of covered payroll and
the Agency contributed 8.93% of covered payroll for a total rate of 14.88%.
The Agency’s contributions to IPERS for the year ended June 30, 2016 were $1,270,036.
Net Pension Liabilities, Pension Expense, and Deferred Outflows of Resources and Deferred Inflows of
Resources Related to Pensions: At June 30, 2016, the Agency reports a liability of $10,309,490 for its
proportionate share of the net pension liability. The net pension liability was measured as of June 30, 2015, and
the total pension liability used to calculate the net pension liability was determined by an actuarial valuation as
of that date. The Agency’s proportion of the net pension liability was based on the Agency’s share of
contributions to IPERS relative to the contributions of all IPERS participating employers. At June 30, 2015, the
Agency’s collective proportion was 0.208674%, which was an increase of 0.004829% from its proportion
measured as of June 30, 2014.
NOTES TO FINANCIAL STATEMENTS
27
Note 6. Pension Plan (Continued)
Net Pension Liabilities, Pension Expense, and Deferred Outflows of Resources and Deferred Inflows of
Resources Related to Pensions (continued): For the year ended June 30, 2016, the Agency recognized
pension expense of $866,152. At June 30, 2016, the Agency reported deferred outflows of resources and
deferred inflows of resources related to pensions from the following sources:
Deferred Outflows
of Resources
Deferred Inflows
of Resources
Differences between expected and actual experience 155,763$ -$
Changes in assumptions 283,846 -
- 858,020
333,947 264,202
Agency contributions subsequent to the measurement date 1,270,036 -
2,043,592$ 1,122,222$
Net difference between projected and actual earnings
on IPERS' investments
Changes in proportion and differences between Agency
contributions and the Agency's proportionate share of
contributions
$1,270,036 reported as deferred outflows of resources related to pensions resulting from Agency contributions
subsequent to the measurement date will be recognized as a reduction of the net pension liability in the year
ended June 30, 2017. Other amounts reported as deferred outflows of resources and deferred inflows of
resources related to pensions will be recognized in pension expense as follows:
Year Ended June 30, Total
2017 (288,701)$
2018 (288,701)
2019 (288,701)
2020 491,815
2021 25,622
(348,666)$
There were no non-employer contributing entities at IPERS.
NOTES TO FINANCIAL STATEMENTS
28
Note 6. Pension Plan (Continued)
Actuarial Assumptions: The total pension liability in the June 30, 2015 actuarial valuation was determined
using the following actuarial assumptions, applied to all periods included in the measurement:
Rate of inflation
(effective June 30, 2014) 3.00% per annum
Rates of salary increase 4.00 to 17.00% average, including inflation.
(effective June 30, 2010) Rates vary by membership group.
Long-term investment rate of return 7.50% compounded annually, net of
(effective June 30, 1996) investment expense, including inflation.Wage growth 4.00% per anum, based on 3.00% inflation
(effective June 30, 1990) and 1.00% real wage inflation.
The actuarial assumptions used in the June 30, 2015 valuation were based on the results of actuarial experience
studies with dates corresponding to those listed above.
Mortality rates were based on the RP-2000 Mortality Table for Males or Females, as appropriate, with
adjustments for mortality improvements based on Scale AA.
The long-term expected rate of return on IPERS’ investments was determined using a building-block method in
which best-estimate ranges of expected future real rates (expected returns, net of investment expense and
inflation) are developed for each major asset class. These ranges are combined to produce the long-term
expected rate of return by weighing the expected future real rates of return by the target asset allocation
percentage and by adding expected inflation. The target allocation and best estimates of arithmetic real rates of
return for each major asset class are summarized in the following table:
Asset Class
Core plus fixed income 28 % 2.04 %
Domestic equity 24 6.29
International equity 16 6.75
Private equity/debt 11 11.32
Real estate 8 3.48
Credit opportunities 5 3.63
U. S. TIPS 5 1.91
Other real assets 2 6.24
Cash 1 ( 0.71 )
100 %
Asset Allocation
Long-Term Expected
Real Rate of Return
NOTES TO FINANCIAL STATEMENTS
29
Note 6. Pension Plan (Continued)
Discount Rate: The discount rate used to measure the total pension liability was 7.50%. The projection of cash
flows used to determine the discount rate assumed employee contributions will be made at the contractually
required rate and contributions from the Agency will be made at contractually required rates, actuarially
determined. Based on those assumptions, the IPERS’ fiduciary net position was projected to be available to
make all projected future benefit payments to current active and inactive employees. Therefore, the long-term
expected rate of return on IPERS’ investments was applied to all periods of projected benefit payments to
determine the total pension liability.
Sensitivity of the Agency’s Proportionate Share of the Net Pension Liability to Changes in the Discount
Rate: The following presents the Agency’s proportionate share of the net pension liability calculated using the
discount rate of 7.50%, as well as what the Agency’s proportionate share of the net pension liability would be if
it were calculated using a discount rate that is 1% lower (6.50%) or 1% higher (8.50%) than the current rate.
1%
Decrease
(6.5%)
Discount
Rate
(7.5%)
1%
Increase
(8.5%)
Agency's proportionate share of the net pension liability 18,050,062$ 10,309,490$ 3,775,892$
IPERS Fiduciary Net Position: Detailed information about IPERS’ fiduciary net position is available in the
separately issued IPERS financial report which is available on IPERS’ website at www.ipers.org
Payables to IPERS: At June 30, 2016, the Agency reported payables to the defined benefit pension plan of
$106,364 for legally required Agency contributions and $70,870 for legally required employee contributions
withheld from employee wages but not yet remitted to IPERS.
Note 7. Other Postemployment Benefits (OPEB)
Plan Description: The Agency operates a single-employer retiree benefit plan that provides medical and
prescription drug benefits for employees, retirees and their spouses. There are 226 active and 30 retired
members in the plan. Participants must be age 55 or older at retirement.
The medical and prescription drug benefits are provided through a fully insured plan with Wellmark. Retirees
under age 65 pay the same premium for the medical/prescription drug benefits as active employees, which
results in an implicit rate subsidy and an OPEB liability.
Funding Policy: The contribution requirements of plan members are established and may be amended by the
Agency. The Agency currently finances the retiree benefit plan on a pay-as-you-go basis.
NOTES TO FINANCIAL STATEMENTS
30
Note 7. Other Postemployment Benefits (OPEB) (Continued)
Annual OPEB Cost and Net OPEB Obligation: The Agency’s annual OPEB cost is calculated based on the
annual required contribution (ARC) of the Agency, an amount actuarially determined in accordance with GASB
Statement No. 45. The ARC represents a level of funding that, if paid on an ongoing basis, is projected to cover
normal cost each year and amortize any unfunded actuarial liabilities over a period not to exceed 30 years.
The following table shows the components of the Agency’s annual OPEB cost for the year ended June 30, 2016,
the amount actually contributed to the plan and changes in the Agency’s net OPEB obligation:
Annual required contribution 165,219 $
Interest on net OPEB obligation 17,249
Other adjustments to ARC (63,804)
Annual OPEB cost 118,664
Contributions made (29,982)
Increase in net OPEB obligation 88,682
Net OPEB obligation beginning of year 689,969
Net OPEB obligation end of year 778,651 $
For calculation of the net OPEB obligation, the actuary has set the transition day as July 1, 2008. The end of
year net OPEB obligation was calculated by the actuary as the cumulative difference between the actuarially
determined funding requirements and the actual contributions for the year ended June 30, 2016.
For the year ended June 30, 2016, the Agency contributed $29,982 to the medical plan. Plan members eligible
for benefits contributed $415,609 to the plan.
The Agency’s annual OPEB cost, the percentage of annual OPEB cost contributed to the plan and the net OPEB
obligation are summarized as follows:
Year Ended
Annual
OPEB Cost
Net OPEB
Obligation
June 30, 2016 $ 118,664 $ 778,651
June 30, 2015 122,512 689,969
June 30, 2014 137,908 599,403 18.30
Percentage of
Annual OPEB
Cost Contributed
26.08
25.27%
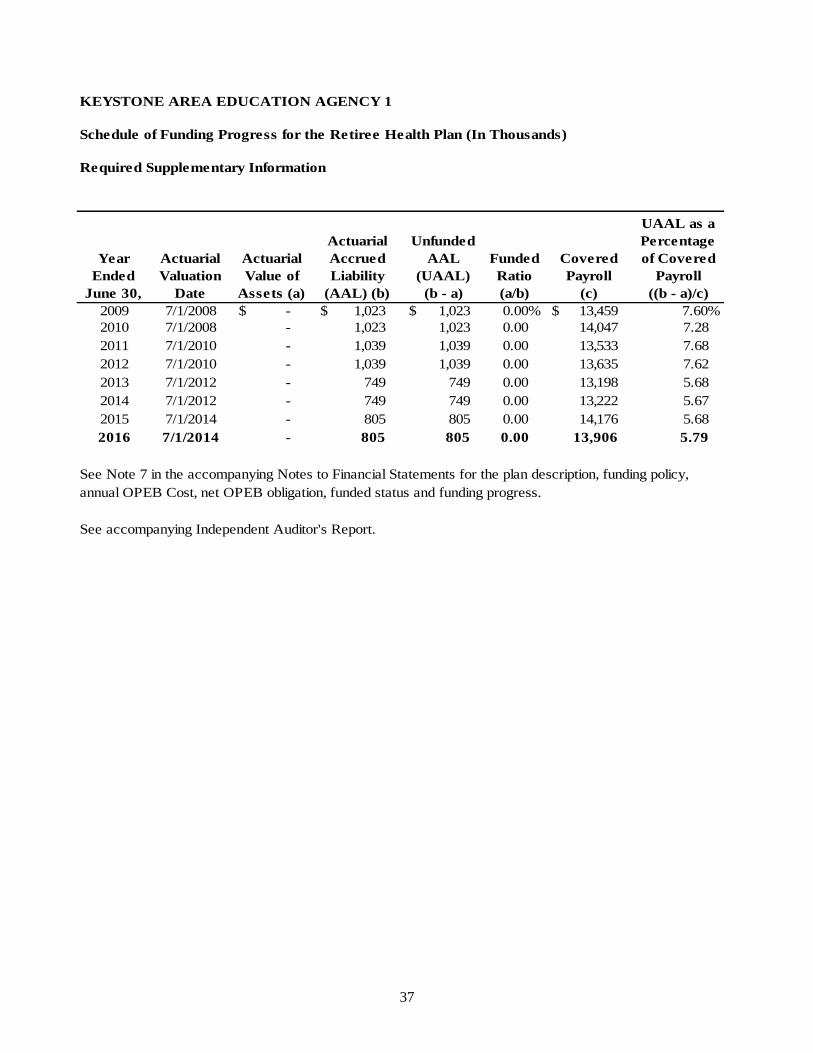
Funded Status and Funding Progress: As of July 1, 2014, the most recent actuarial valuation date for the
period July 1, 2015 through June 30, 2016, the actuarial accrued liability was $805 thousand, with no actuarial
value of assets, resulting in an unfunded actuarial accrued liability (UAAL) of $805 thousand. The covered
payroll (annual payroll of active employees covered by the plan) was approximately $13,906,000, and the ratio
of the UAAL to covered payroll was 5.79%. As of June 30, 2016, there were no trust fund assets.
NOTES TO FINANCIAL STATEMENTS
31
Note 7. Other Postemployment Benefits (OPEB) (Continued)
Actuarial Methods and Assumptions: Actuarial valuations of an ongoing plan involve estimates of the value
of reported amounts and assumptions about the probability of occurrence of events far into the future. Examples
include assumption about future employment, mortality and the health care cost trend. Actuarially determined
amounts are subject to continual revision as actual results are compared with past expectations and new
estimates are made about the future. The Schedule of Funding Progress for the Retiree Health Plan, presented as
Required Supplementary Information in the section following the Notes to Financial Statements, presents
multiyear trend information about whether the actuarial value of plan assets is increasing or decreasing over
time relative to the actuarial accrued liabilities for benefits.
Projections of benefits for financial reporting purposes are based on the plan as understood by the employer and
the plan members and include the types of benefits provided at the time of each valuation and the historical
pattern of sharing of benefit costs between the employer and plan members to that point. The actuarial methods
and assumptions used include techniques that are designed to reduce the effects of short-term volatility in
actuarial accrued liabilities and the actuarial value of assets, consistent with the long-term perspective of the
calculations.
As of the July 1, 2014 actuarial valuation date, the frozen entry age actuarial cost method was used. The
actuarial assumptions include a 2.5% discount rate based on the Agency’s funding policy. The projected annual
medical trend rate and ultimate medical trend rate is 6%. An inflation rate of 0% is assumed for the purpose of
this computation.
Mortality rates are from the 94 Group Annuity Mortality Table, applied on a gender-specific basis. Annual
retirement and termination probabilities were developed from the retirement probabilities from the IPERS
Actuarial report as of June 30, 2014 and applying the termination factors used in the IPERS Actuarial Report as
of June 30, 2014.
Note 8. Risk Management
The Agency is exposed to various risks of loss related to torts; theft, damage to and destruction of assets; errors
and omissions; injuries to employees; and natural disasters. These risks are covered by the purchase of
commercial insurance. The Agency assumes liability for any deductibles and claims in excess of coverage
limitations. Settled claims from these risks have not exceeded commercial insurance coverage in any of the past
three fiscal years.
Note 9. Deficit Balance
The Agency had a governmental activities deficit net position balance of $5,849,064 at June 30, 2016, primarily
due to the net pension liability.

REQUIRED SUPPLEMENTARY INFORMATION

32
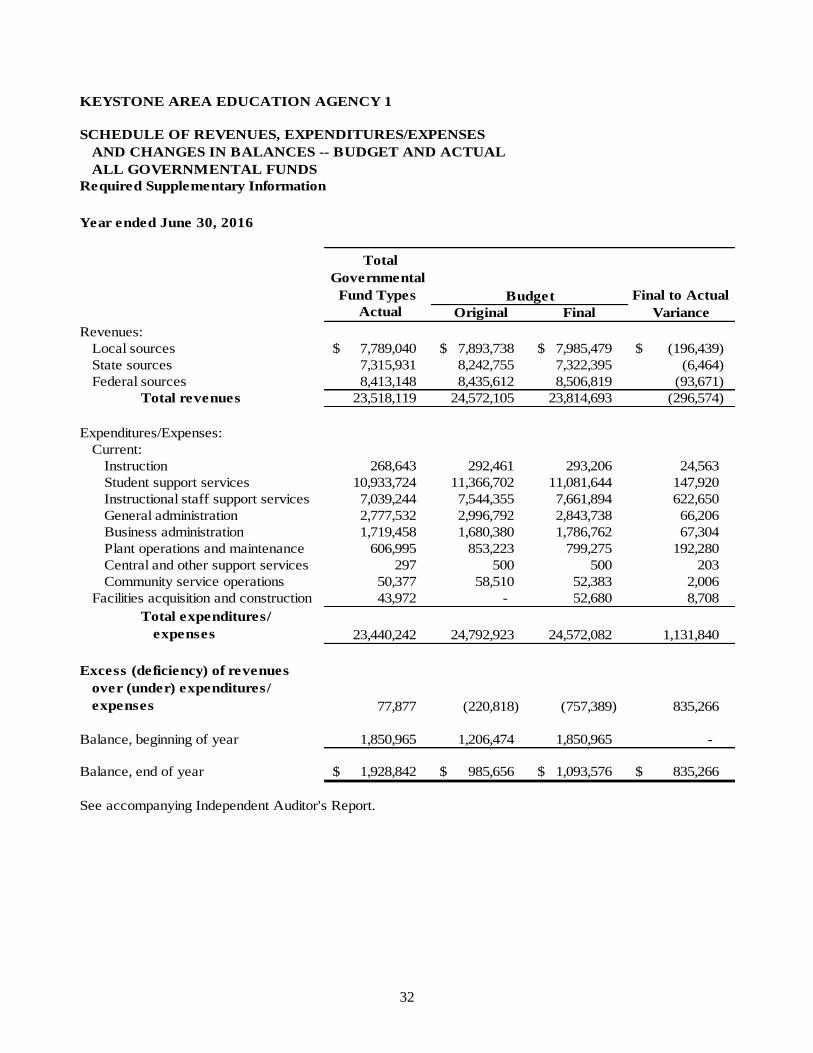
KEYSTONE AREA EDUCATION AGENCY 1
Total
Governmental
Fund Types Final to Actual
Actual Original Final Variance
Revenues:
Local sources 7,789,040 $ 7,893,738 $ 7,985,479 $ (196,439) $
State sources 7,315,931 8,242,755 7,322,395 (6,464)
Federal sources 8,413,148 8,435,612 8,506,819 (93,671)
Total revenues 23,518,119 24,572,105 23,814,693 (296,574)
Expenditures/Expenses:
Current:
Instruction 268,643 292,461 293,206 24,563
Student support services 10,933,724 11,366,702 11,081,644 147,920
Instructional staff support services 7,039,244 7,544,355 7,661,894 622,650
General administration 2,777,532 2,996,792 2,843,738 66,206
Business administration 1,719,458 1,680,380 1,786,762 67,304
Plant operations and maintenance 606,995 853,223 799,275 192,280
Central and other support services 297 500 500 203
Community service operations 50,377 58,510 52,383 2,006
Facilities acquisition and construction 43,972 - 52,680 8,708
Total expenditures/
expenses 23,440,242 24,792,923 24,572,082 1,131,840
Excess (deficiency) of revenues
over (under) expenditures/
expenses 77,877 (220,818) (757,389) 835,266
Balance, beginning of year 1,850,965 1,206,474 1,850,965 -
Balance, end of year 1,928,842 $ 985,656 $ 1,093,576 $ 835,266 $
See accompanying Independent Auditor's Report.
SCHEDULE OF REVENUES, EXPENDITURES/EXPENSES
AND CHANGES IN BALANCES -- BUDGET AND ACTUAL
ALL GOVERNMENTAL FUNDS
Budget
Year ended June 30, 2016
Required Supplementary Information

33
KEYSTONE AREA EDUCATION AGENCY 1
June 30, 2016
NOTES TO REQUIRED SUPPLEMENTARY INFORMATION – BUDGETARY REPORTING
This budgetary comparison is presented as Required Supplementary Information in accordance with
Governmental Accounting Standards Board Statement No. 41 for governments with significant budgetary
perspective differences resulting from not being able to present budgetary comparisons for the General Fund and
each major Special Revenue Fund.
The Agency’s Board of Directors annually prepares a budget on a basis consistent with U.S. generally accepted
accounting principles for all funds except Agency Funds. Although the budget document presents function
expenditures/expenses by fund, the legal level of control is at the total expenditure/expense level, not by fund.
After required public notice and hearing in accordance with the Code of Iowa, the Board submits its budget to
the State Board of Education. The State Board reviews the proposed budget and either grants approval or
returns it without approval with comments. Any unapproved budget must be resubmitted to the State Board for
final approval. The budget may be amended during the year utilizing procedures prescribed by the State Board.
For the year ended June 30, 2016, the Agency’s expenditures/expenses did not exceed the approved budget.

34
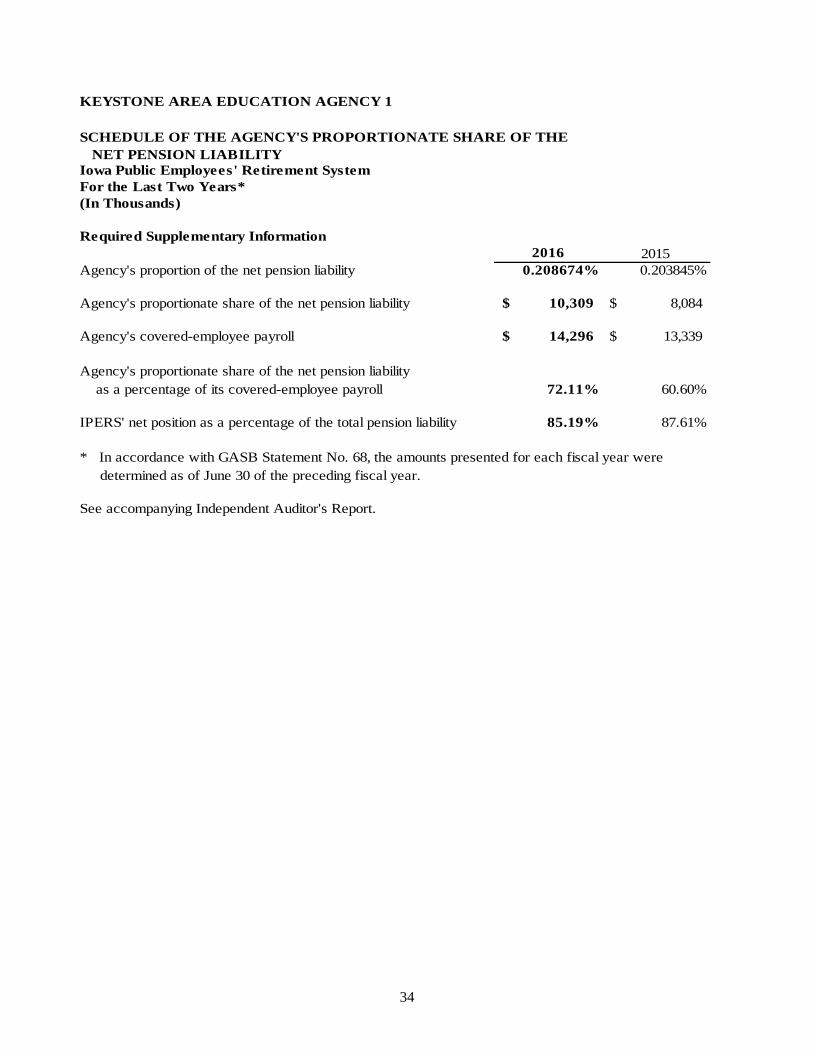
KEYSTONE AREA EDUCATION AGENCY 1
Iowa Public Employees' Retirement System
For the Last Two Years*
(In Thousands)
Required Supplementary Information
2016 2015
Agency's proportion of the net pension liability 0.208674% 0.203845%
Agency's proportionate share of the net pension liability 10,309$ 8,084$
Agency's covered-employee payroll 14,296$ 13,339$
Agency's proportionate share of the net pension liability
as a percentage of its covered-employee payroll 72.11% 60.60%
IPERS' net position as a percentage of the total pension liability 85.19% 87.61%
See accompanying Independent Auditor's Report.
SCHEDULE OF THE AGENCY'S PROPORTIONATE SHARE OF THE
NET PENSION LIABILITY
* In accordance with GASB Statement No. 68, the amounts presented for each fiscal year were
determined as of June 30 of the preceding fiscal year.
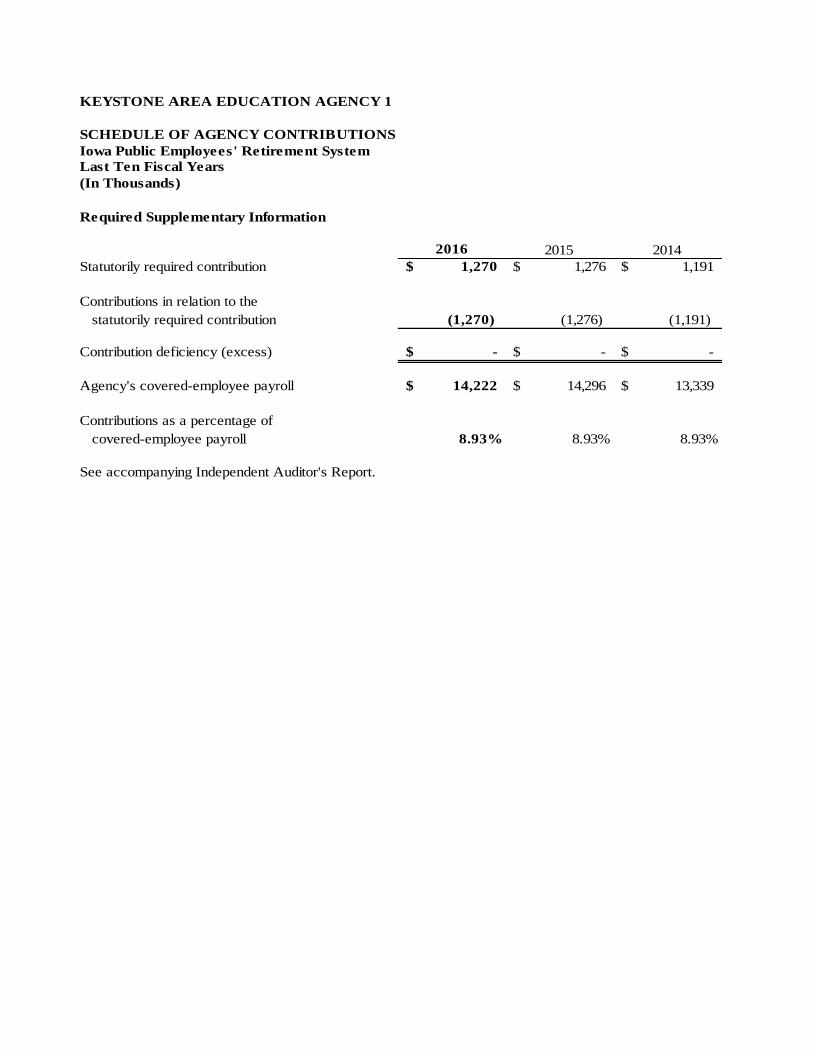
KEYSTONE AREA EDUCATION AGENCY 1
Last Ten Fiscal Years
(In Thousands)
2016 2015 2014
Statutorily required contribution 1,270$ 1,276$ 1,191$
Contributions in relation to the
statutorily required contribution (1,270) (1,276) (1,191)
Contribution deficiency (excess) -$ -$ -$
Agency's covered-employee payroll 14,222$ 14,296$ 13,339$
Contributions as a percentage of
covered-employee payroll 8.93% 8.93% 8.93%
See accompanying Independent Auditor's Report.
SCHEDULE OF AGENCY CONTRIBUTIONS
Iowa Public Employees' Retirement System
Required Supplementary Information
35
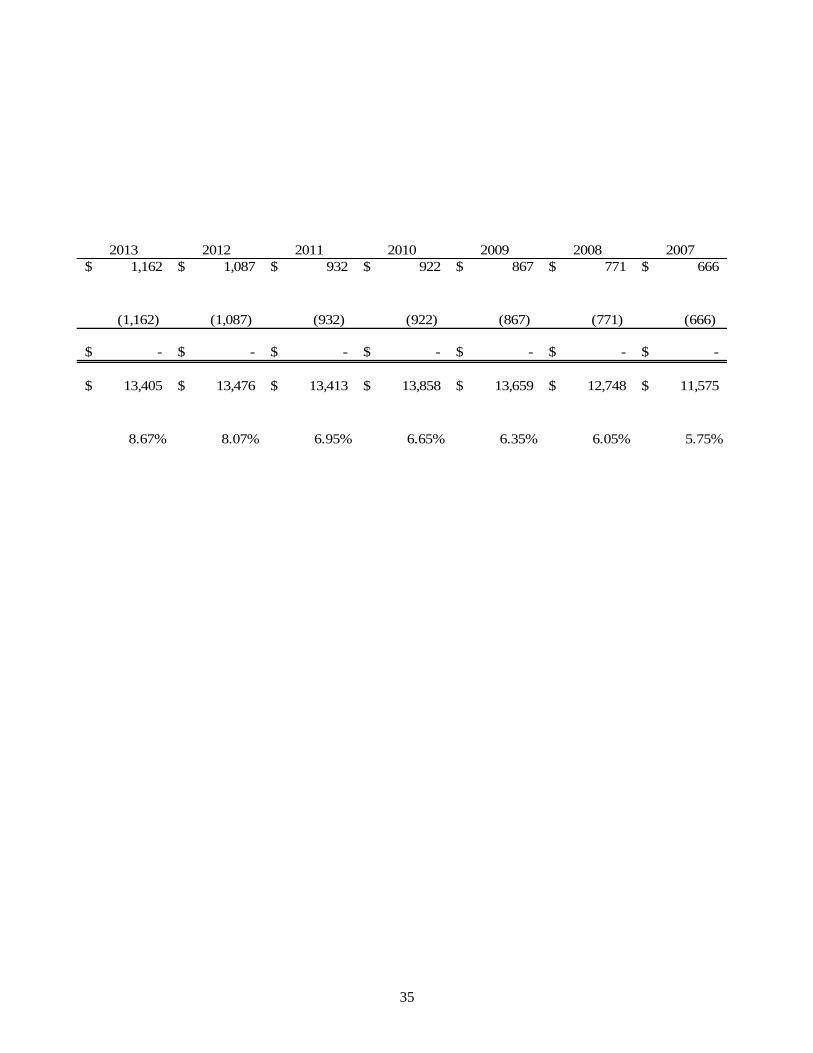
2013 2012 2011 2010 2009 2008 2007
1,162$ 1,087$ 932$ 922$ 867$ 771$ 666$
(1,162) (1,087) (932) (922) (867) (771) (666)
-$ -$ -$ -$ -$ -$ -$
13,405$ 13,476$ 13,413$ 13,858$ 13,659$ 12,748$ 11,575$
8.67% 8.07% 6.95% 6.65% 6.35% 6.05% 5.75%

KEYSTONE AREA EDUCATION AGENCY 1
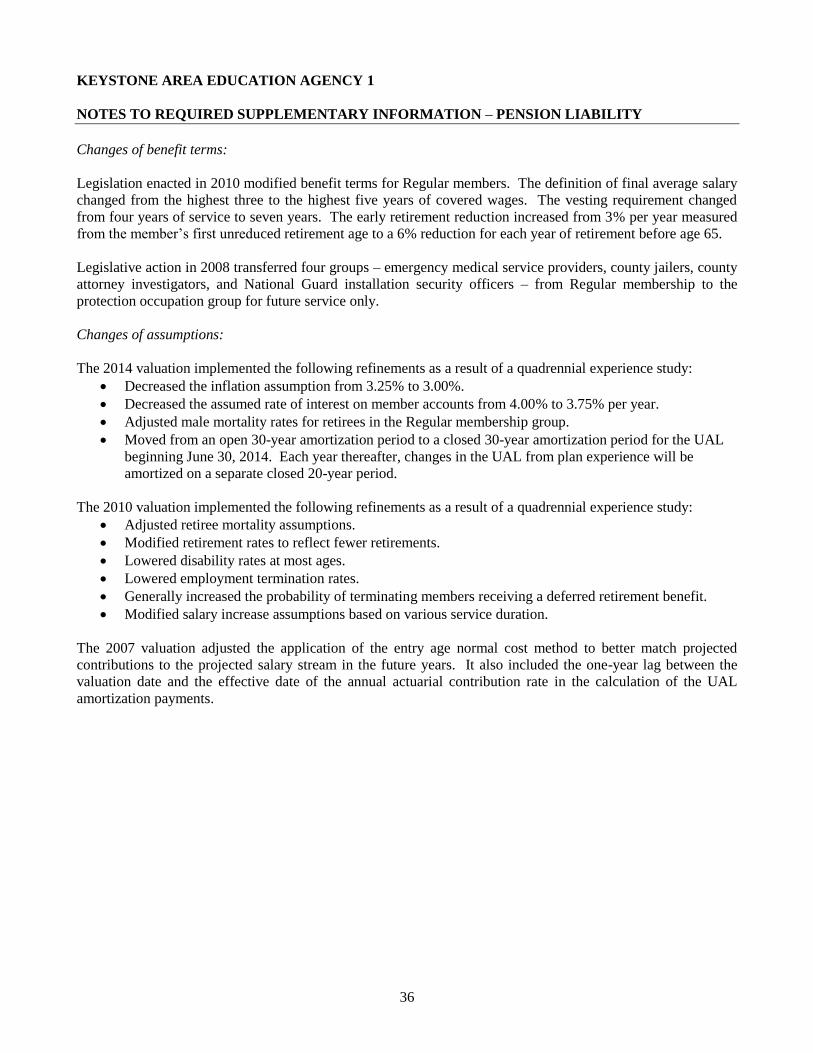
NOTES TO REQUIRED SUPPLEMENTARY INFORMATION – PENSION LIABILITY
36
Changes of benefit terms:
Legislation enacted in 2010 modified benefit terms for Regular members. The definition of final average salary
changed from the highest three to the highest five years of covered wages. The vesting requirement changed
from four years of service to seven years. The early retirement reduction increased from 3% per year measured
from the member’s first unreduced retirement age to a 6% reduction for each year of retirement before age 65.
Legislative action in 2008 transferred four groups – emergency medical service providers, county jailers, county
attorney investigators, and National Guard installation security officers – from Regular membership to the
protection occupation group for future service only.
Changes of assumptions:
The 2014 valuation implemented the following refinements as a result of a quadrennial experience study:
Decreased the inflation assumption from 3.25% to 3.00%.
Decreased the assumed rate of interest on member accounts from 4.00% to 3.75% per year.
Adjusted male mortality rates for retirees in the Regular membership group.
Moved from an open 30-year amortization period to a closed 30-year amortization period for the UAL
beginning June 30, 2014. Each year thereafter, changes in the UAL from plan experience will be
amortized on a separate closed 20-year period.
The 2010 valuation implemented the following refinements as a result of a quadrennial experience study:
Adjusted retiree mortality assumptions.
Modified retirement rates to reflect fewer retirements.
Lowered disability rates at most ages.
Lowered employment termination rates.
Generally increased the probability of terminating members receiving a deferred retirement benefit.
Modified salary increase assumptions based on various service duration.
The 2007 valuation adjusted the application of the entry age normal cost method to better match projected
contributions to the projected salary stream in the future years. It also included the one-year lag between the
valuation date and the effective date of the annual actuarial contribution rate in the calculation of the UAL
amortization payments.

37
Year
Ended
June 30,
Actuarial
Valuation
Date
Actuarial
Value of
Assets (a)
Actuarial
Accrued
Liability
(AAL) (b)
Unfunded
AAL
(UAAL)
(b - a)
Funded
Ratio
(a/b)
Covered
Payroll
(c)
UAAL as a
Percentage
of Covered
Payroll
((b - a)/c)
2009 7/1/2008 -$ 1,023 $ 1,023 $ 0.00% 13,459 $ 7.60%
2010 7/1/2008 - 1,023 1,023 0.00 14,047 7.28
2011 7/1/2010 - 1,039 1,039 0.00 13,533 7.68
2012 7/1/2010 - 1,039 1,039 0.00 13,635 7.62
2013 7/1/2012 - 749 749 0.00 13,198 5.68
2014 7/1/2012 - 749 749 0.00 13,222 5.67
2015 7/1/2014 - 805 805 0.00 14,176 5.68
2016 7/1/2014 - 805 805 0.00 13,906 5.79
See Note 7 in the accompanying Notes to Financial Statements for the plan description, funding policy,
annual OPEB Cost, net OPEB obligation, funded status and funding progress.
See accompanying Independent Auditor's Report.
Required Supplementary Information
KEYSTONE AREA EDUCATION AGENCY 1
Schedule of Funding Progress for the Retiree Health Plan (In Thousands)


KEYSTONE AREA EDUCATION AGENCY 1

38
KEYSTONE AREA EDUCATION AGENCY 1 Schedule 1
June 30, 2016
Special
Revenue
Juvenile
Home
Capital
Projects Total
Assets
Current Assets:
Cash 62,630 $ -$ 62,630 $
Total assets 62,630 $ -$ 62,630 $
Liabilities and Fund Balances
Liabilities:
Accounts payable 1,675 $ -$ 1,675 $
Advances from grantors 28,429 - 28,429
Salaries and benefits payable 32,484 - 32,484
Accrued liabilities 42 - 42
Total liabilities 62,630 - 62,630
Fund balances:
Restricted for specific special purposes - - -
Total liabilities and fund balances 62,630 $ -$ 62,630 $
See accompanying Independent Auditor's Report.
COMBINING BALANCE SHEET
NONMAJOR GOVERNMENTAL FUNDS

39
KEYSTONE AREA EDUCATION AGENCY 1 Schedule 2
Year Ended June 30, 2016
Special
Revenue
Juvenile
Home
Capital
Projects Total
Revenues:
State sources 296,841 $ -$ 296,841 $
Total revenues 296,841 - 296,841
Expenditures:
Current:
Instruction 258,895 - 258,895
Instructional staff support services 23 - 23
General administration 28,293 - 28,293
Business administration 54 - 54
Plant operations and maintenance 9,576 - 9,576
Facilities acquisition and construction - 43,972 43,972
Total expenditures 296,841 43,972 340,813
Excess (Deficiency) of revenues
over (under) expenditures - (43,972) (43,972)
Other financing sources:
Transfers in - 43,972 43,972
- 43,972 43,972
Change in fund balance - - -
Fund balances beginning of year - - -
Fund balances end of year -$ -$ -$
See accompanying Independent Auditor's Report.
COMBINING SCHEDULE OF REVENUES, EXPENDITURES
AND CHANGES IN FUND BALANCES
NONMAJOR GOVERNMENTAL FUNDS

KEYSTONE AREA EDUCATION AGENCY 1

40
KEYSTONE AREA EDUCATION AGENCY 1 Schedule 3
Agency Fund
Year Ended June 30, 2016
Balance
Beginning
of Year Additions Deductions
Balance
End of
Year
Assets
Cash 2,000 $ -$ 2,000 $ -$
Due from other governments - 66,271 - 66,271
Total assets 2,000 $ 66,271 $ 2,000 $ 66,271 $
Liabilities
Due to other governments 2,000 $ 2,112 $ 2,000 $ 2,112 $
Accrued expenses - 64,159 - 64,159
Total liabilities 2,000 $ 66,271 $ 2,000 $ 66,271 $
See accompanying Independent Auditor's Report.
SCHEDULE OF CHANGES IN FIDUCIARY ASSETS AND LIABILITIES -
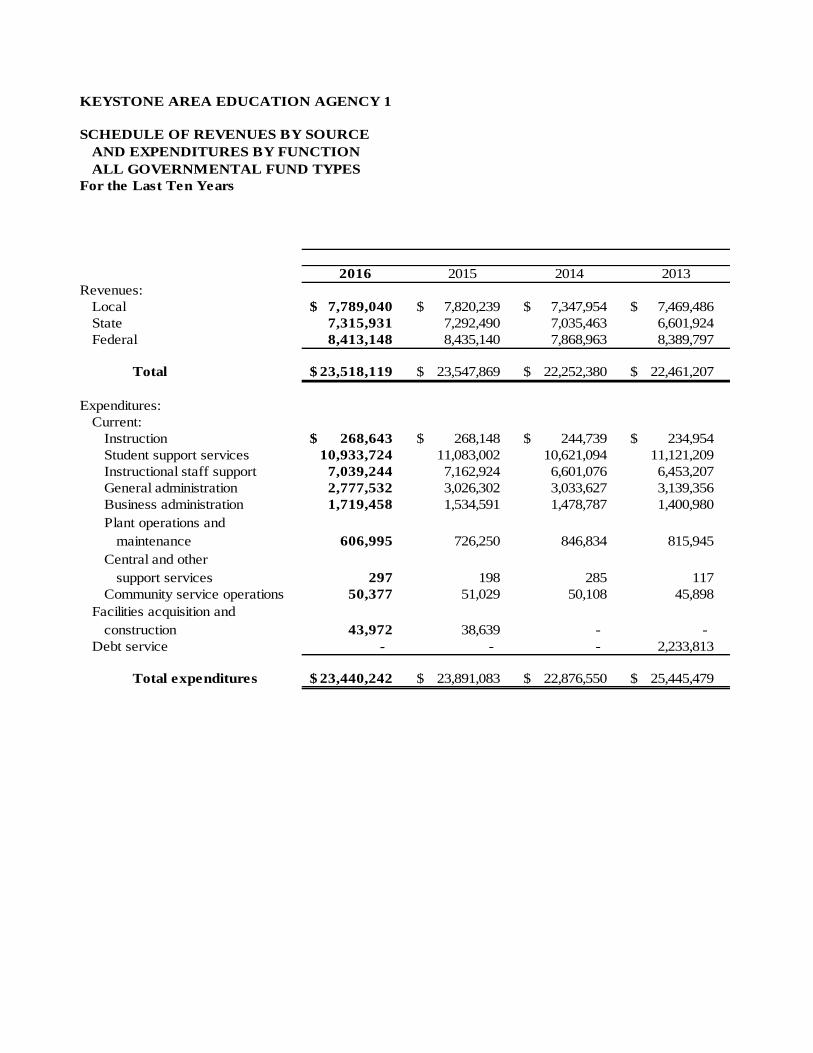
KEYSTONE AREA EDUCATION AGENCY 1
For the Last Ten Years
2016 2015 2014 2013
Revenues:
Local 7,789,040 $ 7,820,239 $ 7,347,954 $ 7,469,486 $
State 7,315,931 7,292,490 7,035,463 6,601,924
Federal 8,413,148 8,435,140 7,868,963 8,389,797
Total 23,518,119 $ 23,547,869 $ 22,252,380 $ 22,461,207 $
Expenditures:
Current:
Instruction 268,643 $ 268,148 $ 244,739 $ 234,954 $
Student support services 10,933,724 11,083,002 10,621,094 11,121,209
Instructional staff support 7,039,244 7,162,924 6,601,076 6,453,207
General administration 2,777,532 3,026,302 3,033,627 3,139,356
Business administration 1,719,458 1,534,591 1,478,787 1,400,980
Plant operations and
maintenance 606,995 726,250 846,834 815,945
Central and other
support services 297 198 285 117
Community service operations 50,377 51,029 50,108 45,898
Facilities acquisition and
construction 43,972 38,639 - -
Debt service - - - 2,233,813
Total expenditures 23,440,242 $ 23,891,083 $ 22,876,550 $ 25,445,479 $
SCHEDULE OF REVENUES BY SOURCE
AND EXPENDITURES BY FUNCTION
ALL GOVERNMENTAL FUND TYPES
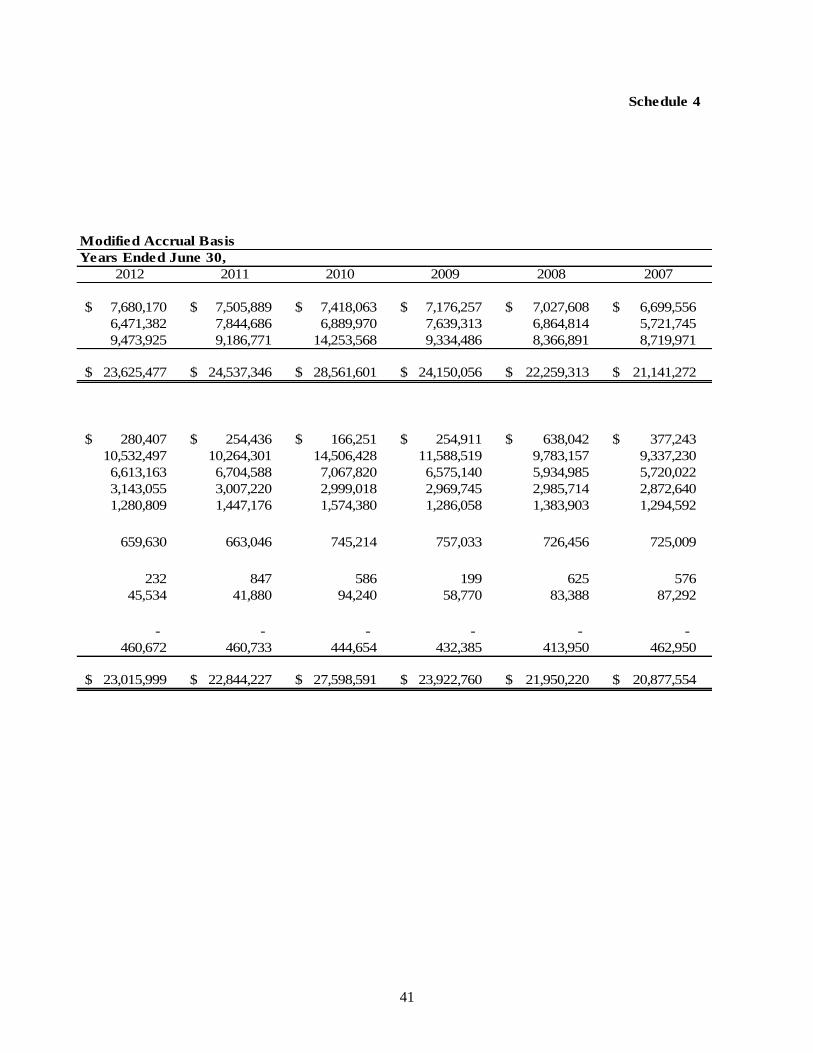
41
Schedule 4
Modified Accrual Basis
Years Ended June 30,
2012 2011 2010 2009 2008 2007
7,680,170 $ 7,505,889 $ 7,418,063 $ 7,176,257 $ 7,027,608 $ 6,699,556 $
6,471,382 7,844,686 6,889,970 7,639,313 6,864,814 5,721,745
9,473,925 9,186,771 14,253,568 9,334,486 8,366,891 8,719,971
23,625,477 $ 24,537,346 $ 28,561,601 $ 24,150,056 $ 22,259,313 $ 21,141,272 $
280,407 $ 254,436 $ 166,251 $ 254,911 $ 638,042 $ 377,243 $
10,532,497 10,264,301 14,506,428 11,588,519 9,783,157 9,337,230
6,613,163 6,704,588 7,067,820 6,575,140 5,934,985 5,720,022
3,143,055 3,007,220 2,999,018 2,969,745 2,985,714 2,872,640
1,280,809 1,447,176 1,574,380 1,286,058 1,383,903 1,294,592
659,630 663,046 745,214 757,033 726,456 725,009
232 847 586 199 625 576
45,534 41,880 94,240 58,770 83,388 87,292
- - - - - -
460,672 460,733 444,654 432,385 413,950 462,950
23,015,999 $ 22,844,227 $ 27,598,591 $ 23,922,760 $ 21,950,220 $ 20,877,554 $
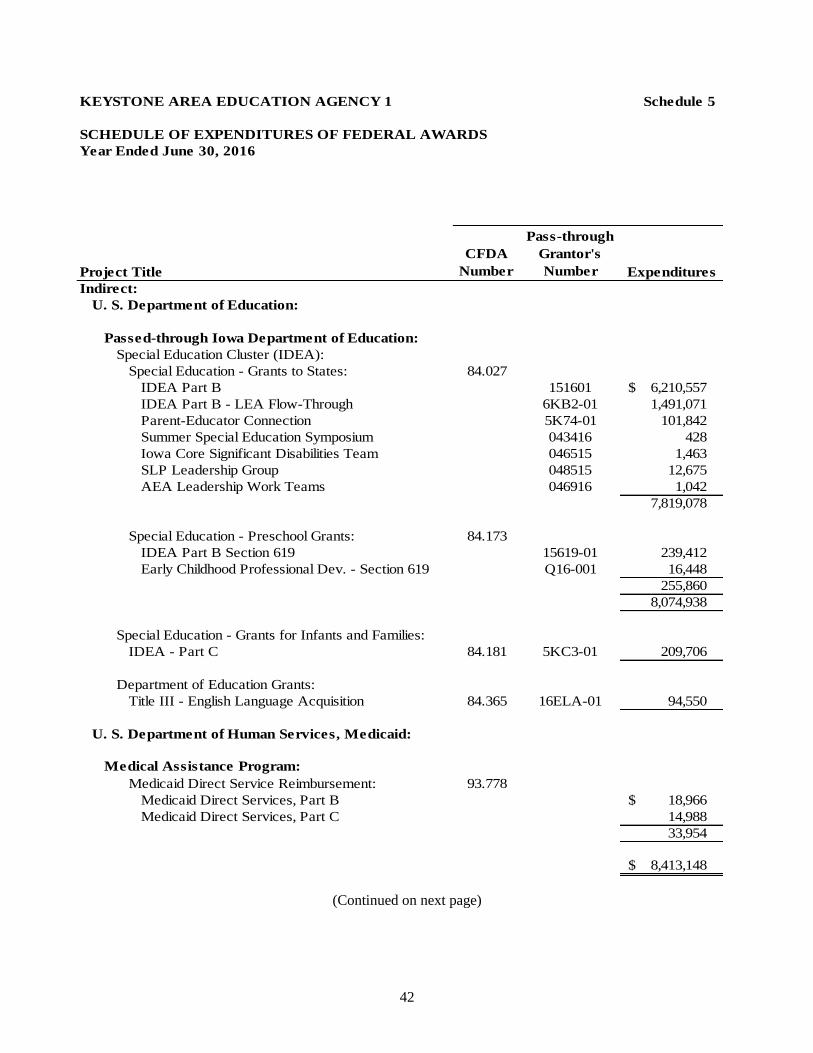
42
KEYSTONE AREA EDUCATION AGENCY 1 Schedule 5
Year Ended June 30, 2016
Project Title
CFDA
Number
Pass-through
Grantor's
Number Expenditures
Indirect:
U. S. Department of Education:
Passed-through Iowa Department of Education:
Special Education Cluster (IDEA):
Special Education - Grants to States: 84.027
IDEA Part B 151601 6,210,557 $
IDEA Part B - LEA Flow-Through 6KB2-01 1,491,071
Parent-Educator Connection 5K74-01 101,842
Summer Special Education Symposium 043416 428
Iowa Core Significant Disabilities Team 046515 1,463
SLP Leadership Group 048515 12,675
AEA Leadership Work Teams 046916 1,042
7,819,078
Special Education - Preschool Grants: 84.173
IDEA Part B Section 619 15619-01 239,412
Early Childhood Professional Dev. - Section 619 Q16-001 16,448
255,860
8,074,938
Special Education - Grants for Infants and Families:
IDEA - Part C 84.181 5KC3-01 209,706
Department of Education Grants:
Title III - English Language Acquisition 84.365 16ELA-01 94,550
U. S. Department of Human Services, Medicaid:
Medical Assistance Program:
Medicaid Direct Service Reimbursement: 93.778
Medicaid Direct Services, Part B 18,966 $
Medicaid Direct Services, Part C 14,988
33,954
8,413,148 $
SCHEDULE OF EXPENDITURES OF FEDERAL AWARDS
(Continued on next page)
43
KEYSTONE AREA EDUCATION AGENCY 1 Schedule 5
SCHEDULE OF EXPENDITURES OF FEDERAL AWARDS (Continued)
Basis of Presentation: The accompanying Schedule of Expenditures of Federal Awards (Schedule) includes
the federal award activity of Keystone Area Education Agency 1 under programs of the federal government for
the year ended June 30, 2016. The information in this Schedule is presented in accordance with the
requirements of Title 2, U.S. Code of Federal Regulations, Part 200, Uniform Administrative Requirements,
Cost Principles and Audit Requirements for Federal Awards (Uniform Guidance). Because the Schedule
presents only a selected portion of the operations of Keystone Area Education Agency 1, it is not intended to
and does not present the financial position or changes in financial position of Keystone Area Education Agency
1.
Summary of Significant Accounting Policies: Expenditures reported in the Schedule are reported on the
modified accrual basis of accounting. Such expenditures are recognized following, as applicable, either the cost
principles in OMB Circular A-87, Cost Principles for State, Local and Indian Tribal Governments, or the cost
principles contained in the Uniform Guidance, wherein certain types of expenditures are not allowable or are
limited as to reimbursement. Keystone Area Education Agency 1 has elected not to use the 10% de minimis
indirect cost rate as allowed under the Uniform Guidance.
See accompanying Independent Auditor’s Report.

INDEPENDENT AUDITOR’S REPORT
ON INTERNAL CONTROL OVER FINANCIAL REPORTING
AND ON COMPLIANCE AND OTHER MATTERS BASED ON AN
AUDIT OF THE FINANCIAL STATEMENTS PERFORMED IN
ACCORDANCE WITH GOVERNMENT AUDITING STANDARDS
KEYSTONE AREA EDUCATION AGENCY 1
44
SCHNURR & COMPANY, LLP Certified Public Accountants and Consultants
INDEPENDENT AUDITOR’S REPORT
ON INTERNAL CONTROL OVER FINANCIAL REPORTING
AND ON COMPLIANCE AND OTHER MATTERS BASED ON AN
AUDIT OF THE FINANCIAL STATEMENTS PERFORMED IN
ACCORDANCE WITH GOVERNMENT AUDITING STANDARDS
Board of Directors
Keystone Area Education Agency 1
Elkader, Iowa
We have audited in accordance with U.S. generally accepted auditing standards and the standards applicable to financial audits contained in Government Auditing Standards, issued by the Comptroller General of the United States, the financial statements of the governmental activities, each major fund and the aggregate remaining fund information of Keystone Area Education Agency 1 as of and for the year ended June 30, 2016, and the related Notes to Financial Statements, which collectively comprise the Agency’s basic financial statements, and have issued our report thereon dated November 7, 2016. Internal Control Over Financial Reporting
In planning and performing our audit of the financial statements, we considered Keystone Area Education Agency 1’s internal control over financial reporting to determine the audit procedures appropriate in the circumstances for the purpose of expressing our opinions on the financial statements, but not for the purpose of expressing an opinion on the effectiveness of Keystone Area Education Agency 1’s internal control. Accordingly, we do not express an opinion on the effectiveness of Keystone Area Education Agency 1’s internal control. Our consideration of internal control was for the limited purpose described in the preceding paragraph and was not designed to identify all deficiencies in internal control that might be material weaknesses or significant deficiencies and, therefore, material weaknesses or significant deficiencies may exist that were not identified. A deficiency in internal control exists when the design or operation of a control does not allow management or employees, in the normal course of performing their assigned functions, to prevent or detect and correct misstatements on a timely basis. A material weakness is a deficiency, or a combination of deficiencies, in internal control such that there is a reasonable possibility a material misstatement of the Agency’s financial statements will not be prevented or detected and corrected on a timely basis. A significant deficiency is a deficiency, or a combination of deficiencies, in internal control which is less severe than a material weakness, yet important enough to merit attention by those charged with governance.
45
Compliance and Other Matters As part of obtaining reasonable assurance about whether Keystone Area Education Agency 1’s financial statements are free of material misstatement, we performed tests of its compliance with certain provisions of laws, regulations, contracts and grant agreements, non-compliance with which could have a direct and material effect on the determination of financial statement amounts. However, providing an opinion on compliance with those provisions was not an objective of our audit and, accordingly, we do not express such an opinion. The results of our tests disclosed no instances of non-compliance or other matters that are required to be reported under Government Auditing Standards. Comments involving statutory and other legal matters about Keystone Area Education Agency 1’s operations for the year ended June 30, 2016 are based exclusively on knowledge obtained from procedures performed during our audit of the financial statements of Keystone Area Education Agency 1. Since our audit was based on tests and samples, not all transactions that might have had an impact on the comments were necessarily audited. The comments involving statutory and other legal matters are not intended to constitute legal interpretations of those statutes. Purpose of this Report
The purpose of this report is solely to describe the scope of our testing of internal control and compliance and the results of that testing, and not to provide an opinion on the effectiveness of the Agency’s internal control or on compliance. This report is an integral part of an audit performed in accordance with Government Auditing Standards in considering the Agency’s internal control and compliance. Accordingly, this communication is not suitable for any other purpose.
Fort Dodge, Iowa
November 7, 2016
INDEPENDENT AUDITOR’S REPORT
ON COMPLIANCE FOR EACH MAJOR FEDERAL PROGRAM
AND ON INTERNAL CONTROL OVER COMPLIANCE
REQUIRED BY THE UNIFORM GUIDANCE
KEYSTONE AREA EDUCATION AGENCY 1
46
SCHNURR & COMPANY, LLP Certified Public Accountants and Consultants
INDEPENDENT AUDITOR’S REPORT
ON COMPLIANCE FOR EACH MAJOR FEDERAL PROGRAM
AND ON INTERNAL CONTROL OVER COMPLIANCE
REQUIRED BY THE UNIFORM GUIDANCE
Board of Directors of
Keystone Area Education Agency 1
Elkader, Iowa
Report on Compliance for Each Major Federal Program We have audited Keystone Area Education Agency 1’s compliance with the types of compliance requirements described in U.S. Office of Management and Budget (OMB) Compliance Supplement that could have a direct and material effect on each of its major federal programs for the year ended June 30, 2016. Keystone Area Education Agency 1’s major federal programs are identified in Part I of the accompanying Schedule of Findings and Questioned Costs. Management’s Responsibility Management is responsible for compliance with the requirements of laws, regulations, contracts and grant agreements applicable to its federal programs. Auditor’s Responsibility Our responsibility is to express an opinion on compliance for Keystone Area Education Agency 1’s major federal programs based on our audit of the types of compliance requirements referred to above. We conducted our audit of compliance in accordance with U.S. generally accepted auditing standards, the standards applicable to financial audits contained in Government Auditing Standards, issued by the Comptroller General of the United States, and the audit requirements of Title 2, U.S. Code of Federal Regulations, Part 200, Uniform Administrative Requirements, Cost Principles and Audit Requirements for Federal Awards (Uniform Guidance). Those standards and the Uniform Guidance require that we plan and perform the audit to obtain reasonable assurance about whether non-compliance with the types of compliance requirements referred to above that could have a direct and material effect on a major federal program occurred. An audit includes examining, on a test basis, evidence about Keystone Area Education Agency 1’s compliance with those requirements and performing such other procedures as we considered necessary in the circumstances.
We believe our audit provides a reasonable basis for our opinion on compliance for each major federal program. However, our audit does not provide a legal determination of Keystone Area Education Agency 1’s compliance.
47
Opinion on Each Major Federal Program
In our opinion, Keystone Area Education Agency 1 complied, in all material respects, with the types of compliance requirements referred to above that could have a direct and material effect on each of its major federal programs for the year ended June 30, 2016.
Report on Internal Control Over Compliance
The management of Keystone Area Education Agency 1 is responsible for establishing and maintaining effective internal control over compliance with the types of compliance requirements referred to above. In planning and performing our audit of compliance, we considered Keystone Area Education Agency 1’s internal control over compliance with the types of requirements that could have a direct and material effect on each major federal program to determine the auditing procedures appropriate in the circumstances for the purpose of expressing an opinion on compliance for each major federal program and to test and report on internal control over compliance in accordance with the Uniform Guidance, but not for the purpose of expressing an opinion on the effectiveness of internal control over compliance. Accordingly, we do not express an opinion on the effectiveness of Keystone Area Education Agency 1’s internal control over compliance.
Our consideration of internal control over compliance was for the limited purpose described in the preceding paragraph and was not designed to identify all deficiencies in internal control over compliance that might be material weaknesses or significant deficiencies and, therefore, material weaknesses or significant deficiencies may exist that were not identified.
A deficiency in internal control over compliance exists when the design or operation of a control over compliance does not allow management or employees, in the normal course of performing their assigned functions, to prevent or detect and correct noncompliance with a type of compliance requirement of a federal program on a timely basis. A material weakness in internal control over compliance is a deficiency, or a combination of deficiencies, in internal control over compliance such that there is a reasonable possibility material noncompliance with a type of compliance requirement of a federal program will not be prevented or detected and corrected on a timely basis.
A significant deficiency in internal control over compliance is a deficiency, or a combination of deficiencies, in internal control over compliance with a type of compliance requirement of a federal program that is less severe than a material weakness in internal control over compliance, yet important enough to merit attention by those charged with governance.
The purpose of this report on internal control over compliance is solely to describe the scope of our testing of internal control over compliance and the results of that testing based on the requirements of the Uniform Guidance. Accordingly, this report is not suitable for any other purpose.
Fort Dodge, Iowa
November 7, 2016
48
KEYSTONE AREA EDUCATION AGENCY 1
Schedule of Findings and Questioned Costs
Year Ended June 30, 2016
Part I: Summary of the Independent Auditor’s Results
(a) Unmodified opinions were issued on the financial statements.
(b) No significant deficiencies or material weaknesses in internal control over financial reporting were
disclosed.
(c) The audit did not disclose any noncompliance that is material to the financial statements.
(d) No significant deficiencies or material weaknesses in internal control over major programs were disclosed.
(e) An unmodified opinion was issued on compliance with requirements applicable to each major program.
(f) The audit did not disclose any audit findings that are required to be reported in accordance with the Uniform
Guidance, Section 200.515.
(g) The major programs were:
Special Education Cluster (IDEA):
CFDA Number 84.027 – Special Education – Grants to States
CFDA Number 84.173 – Special Education – Preschool Grants
(h) The dollar threshold used to distinguish between Type A and Type B programs was $750,000.
(i) Keystone Area Education Agency 1 qualified as a low-risk auditee.
Part II: Findings Related to the Financial Statements:
Instances of Non-Compliance:
No matters were noted.
Internal Control Deficiencies:
No matters were noted.
Part III: Findings and Questioned Costs For Federal Awards:
Instances of Non-Compliance:
No matters were noted.
Internal Control Deficiencies:
No matters were noted.
49
Schedule of Findings and Questioned Costs (Continued)
Year Ended June 30, 2016
Part IV: Other Findings Related to Required Statutory Reporting:
IV-A-16 Certified Budget: Expenditures during the year ended June 30, 2016 did not exceed the amount
budgeted.
IV-B-16 Questionable Expenditures: No expenditures that we believe may not meet the requirements of
public purpose as defined in an Attorney General’s opinion dated April 25, 1979 were noted.
IV-C-16 Travel Expense: No expenditures of Agency money for travel expenses of spouses of Agency
officials or employees were noted.
IV-D-16 Business Transactions: No business transactions between the Agency and Agency officials or
employees were noted.
IV-E-16 Bond Coverage: Surety bond coverage of Agency officials and employees is in accordance with
statutory provisions. The amount of coverage should be reviewed annually to ensure the coverage
is adequate for current operations.
IV-F-16 Board Minutes: No transactions were found that we believe should have been approved in the
Board minutes but were not.
IV-G-16 Deposits and Investments: No instances of non-compliance with the deposit and investment
provisions of Chapters 12B and 12C of the Code of Iowa and the Agency’s investment policy were
noted.
IV-H-16 Certified Annual Report: The Certified Annual Report was certified timely to the Iowa Department
of Education.
IV-I-16 Categorical Funding: No instances of categorical funding being used to supplant rather than
supplement other funds were noted.