Embed Size (px)
Citation preview
Ihr Spezialist fürMess- und Prüfgeräte
dataTec ▪ Ferdinand-Lassalle-Str. 52 ▪ 72770 Reutlingen ▪ Tel. 07121 / 51 50 50 ▪ Fax 07121 / 51 50 10 ▪ [email protected] ▪ www.datatec.de
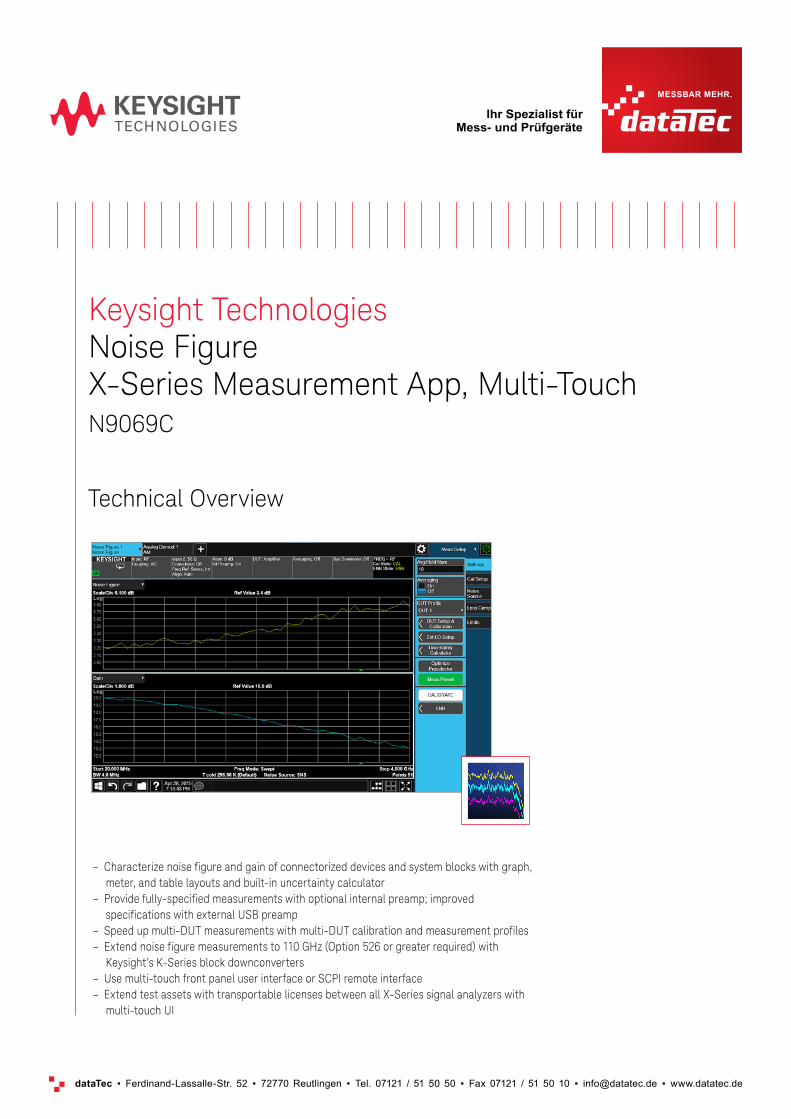
Keysight TechnologiesNoise Figure X-Series Measurement App, Multi-Touch N9069C
Technical Overview
– Characterize noise figure and gain of connectorized devices and system blocks with graph, meter, and table layouts and built-in uncertainty calculator
– Provide fully-specified measurements with optional internal preamp; improved specifications with external USB preamp
– Speed up multi-DUT measurements with multi-DUT calibration and measurement profiles – Extend noise figure measurements to 110 GHz (Option 526 or greater required) with
Keysight’s K-Series block downconverters – Use multi-touch front panel user interface or SCPI remote interface – Extend test assets with transportable licenses between all X-Series signal analyzers with
multi-touch UI
2 dataTec ▪ Ferdinand-Lassalle-Str. 52 ▪ 72770 Reutlingen ▪ Tel. 07121 / 51 50 50 ▪ Fax 07121 / 51 50 10 ▪ [email protected] ▪ www.datatec.de
02 | Keysight | N9069C Noise Figure X-Series Measurement App, Multi-Touch - Technical Overview
Noise Figure Measurement Application
Noise figure is one of the fundamental parameters that differentiates one system, ampli-fier, or transistor from another. To minimize the problems resulting from noise gener-ated in receiver systems, engineers can either make a weak signal stronger, or reduce the noise of that system or its individual components. The Keysight Technologies, Inc. N9069C noise figure measurement application offers development engineers a simple tool to make accurate and repeatable noise figure measurements. The speed of this ap-plication also allows manufacturing engineers to rapidly measure any one of the follow-ing in their test racks:
– Noise figure/factor – Gain – Effective temperature – Y-factor – Hot/cold power density
The noise figure application utilizes the Y-factor method for calculating noise figure. By using a noise source, an X-Series signal analyzer can quickly determine the noise of the device under test. This method is very simple, as it utilizes a ratio of two noise power levels: one measured with the noise source ON and the other with the noise source OFF.
Preamps are available to reduce the uncertainty of Y-factor noise figure measure-ments. With an optional preamp installed in an X-Series signal analyzer or standard with N8973/N8974/N8975/N8976B NFA X-Series, you can obtain better noise figure measurements. NFA X-Series specifications are not included in this document.
X-Series measurement applications increase the capability and functionality of Keysight signal analyzers to speed time to insight. They provide essential measurements for spe-cific tasks in general-purpose, cellular communications, wireless connectivity and digital video applications, covering more than 40 standards or modulation types. Applications are supported on both benchtop and modular, with the only difference being the level of performance achieved by the hardware you select.
Keysight software is downloadable
expertise. From first simulation
through first customer shipment,
we deliver the tools your team
needs to accelerate from data to
information to actionable insight.
– Electronic design automation
(EDA) software
– Application software
– Programming environments
– Productivity software
Download your next insight
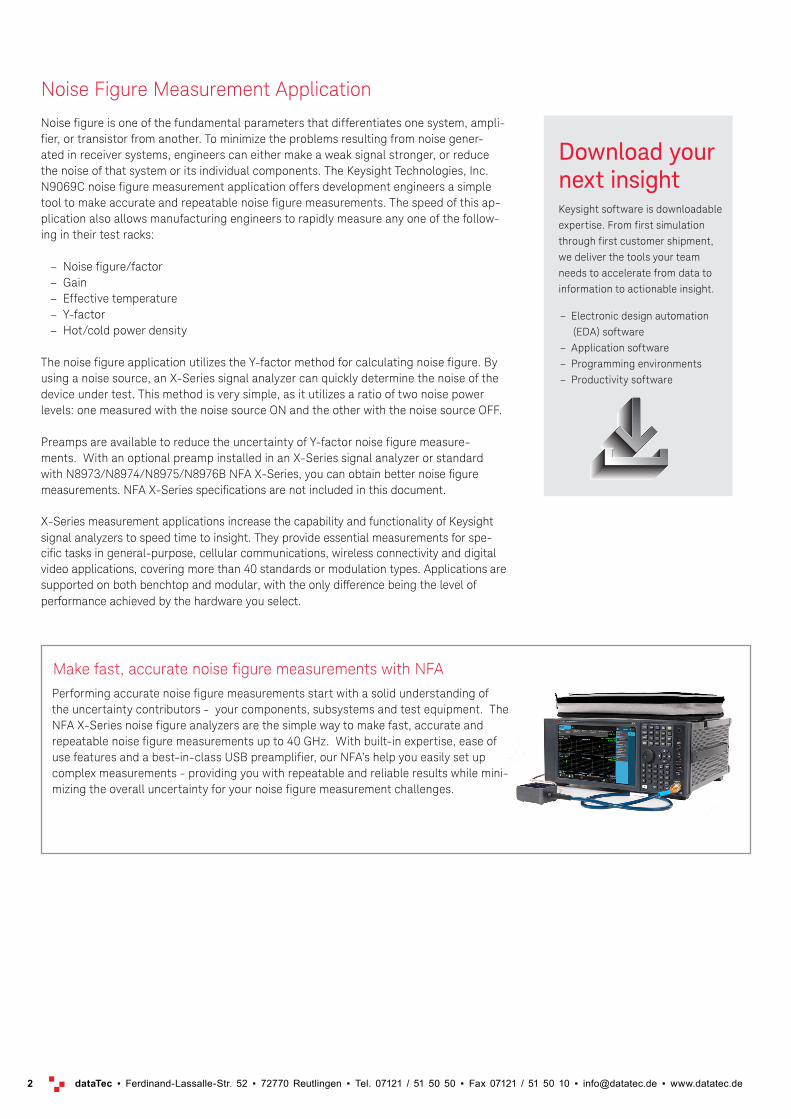
Performing accurate noise figure measurements start with a solid understanding of the uncertainty contributors - your components, subsystems and test equipment. The NFA X-Series noise figure analyzers are the simple way to make fast, accurate and repeatable noise figure measurements up to 40 GHz. With built-in expertise, ease of use features and a best-in-class USB preamplifier, our NFA’s help you easily set up complex measurements - providing you with repeatable and reliable results while mini-mizing the overall uncertainty for your noise figure measurement challenges.
Make fast, accurate noise figure measurements with NFA
3 dataTec ▪ Ferdinand-Lassalle-Str. 52 ▪ 72770 Reutlingen ▪ Tel. 07121 / 51 50 50 ▪ Fax 07121 / 51 50 10 ▪ [email protected] ▪ www.datatec.de
03 | Keysight | N9069C Noise Figure X-Series Measurement App, Multi-Touch - Technical Overview
Top Features
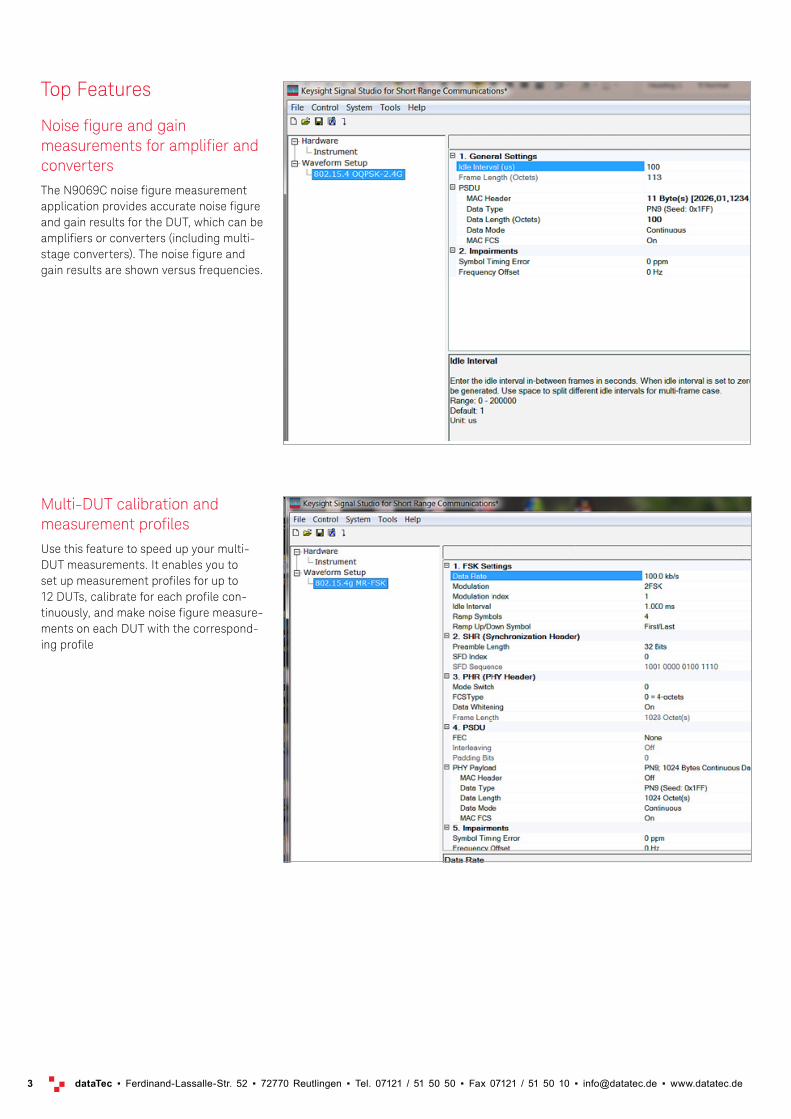
Noise figure and gain measurements for amplifier and converters The N9069C noise figure measurement application provides accurate noise figure and gain results for the DUT, which can be amplifiers or converters (including multi-stage converters). The noise figure and gain results are shown versus frequencies.
Multi-DUT calibration and measurement profilesUse this feature to speed up your multi-DUT measurements. It enables you to set up measurement profiles for up to 12 DUTs, calibrate for each profile con-tinuously, and make noise figure measure-ments on each DUT with the correspond-ing profile
4 dataTec ▪ Ferdinand-Lassalle-Str. 52 ▪ 72770 Reutlingen ▪ Tel. 07121 / 51 50 50 ▪ Fax 07121 / 51 50 10 ▪ [email protected] ▪ www.datatec.de
04 | Keysight | N9069C Noise Figure X-Series Measurement App, Multi-Touch - Technical Overview
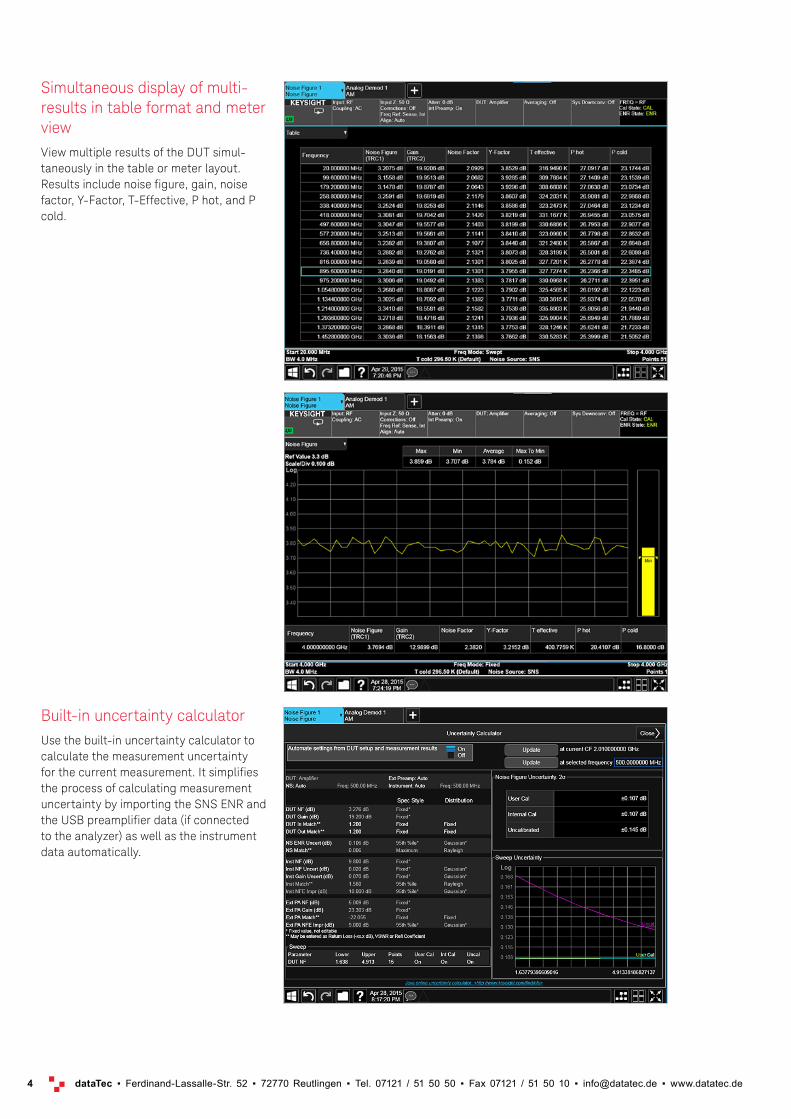
Simultaneous display of multi-results in table format and meter view View multiple results of the DUT simul-taneously in the table or meter layout. Results include noise figure, gain, noise factor, Y-Factor, T-Effective, P hot, and P cold.
Built-in uncertainty calculator Use the built-in uncertainty calculator to calculate the measurement uncertainty for the current measurement. It simplifies the process of calculating measurement uncertainty by importing the SNS ENR and the USB preamplifier data (if connected to the analyzer) as well as the instrument data automatically.
5 dataTec ▪ Ferdinand-Lassalle-Str. 52 ▪ 72770 Reutlingen ▪ Tel. 07121 / 51 50 50 ▪ Fax 07121 / 51 50 10 ▪ [email protected] ▪ www.datatec.de
05 | Keysight | N9069C Noise Figure X-Series Measurement App, Multi-Touch - Technical Overview
Key Specifications
Definitions – Specifications describe the performance of parameters. – 95th percentile values indicate the breadth of the population (≈2) of performance
tolerances expected to be met in 95% of cases with a 95% confidence. – Typical values are designated with the abbreviation "typ." These are performance
beyond specification that 80% of the units exhibit with a 95% confidence. – Nominal values are designated with the abbreviation "nom." These values indicate
expected performance, or describe product performance that is useful in the ap-plication of the product.
Analyzer noise figure is computed from the specified DANL. See specifications on follow-ing pages for further explanation.
Noise figure for the combination of USB preamp and analyzer is
NFsys = 10 * Log (Fpreamp + (Fanalyzer - 1)/Gpreamp)
The noise figure and gain of the preamp are specified and warranted.
Analyzer VSWR is characterized to the 95th percentile but not measured and warranted. USB preamp VSWR is measured and warranted and becomes the input VSWR of the measurement system when used.
Instrument uncertainty is defined for gain measurements as uncertainty due to relative amplitude uncertainties encountered in the analyzer when making the measurements required for the gain computation.
The noise figure measurement application is not specified for use below 10 MHz. Instru-ment uncertainty will nominally be the same as the 10 MHz to 3.6 GHz specifications; however, performance is not warranted. Instrument uncertainty for gain is characterized to the 95th percentile above 3.6 GHz.
These notes apply to the following specifications. For more information on configuring an X-Series signal analyzer for noise figure measurements, depending on the DUT noise fig-ure and gain, see the Noise Figure Measurement Guide, literature number N9069-90001.
6 dataTec ▪ Ferdinand-Lassalle-Str. 52 ▪ 72770 Reutlingen ▪ Tel. 07121 / 51 50 50 ▪ Fax 07121 / 51 50 10 ▪ [email protected] ▪ www.datatec.de
06 | Keysight | N9069C Noise Figure X-Series Measurement App, Multi-Touch - Technical Overview
Performance specifications
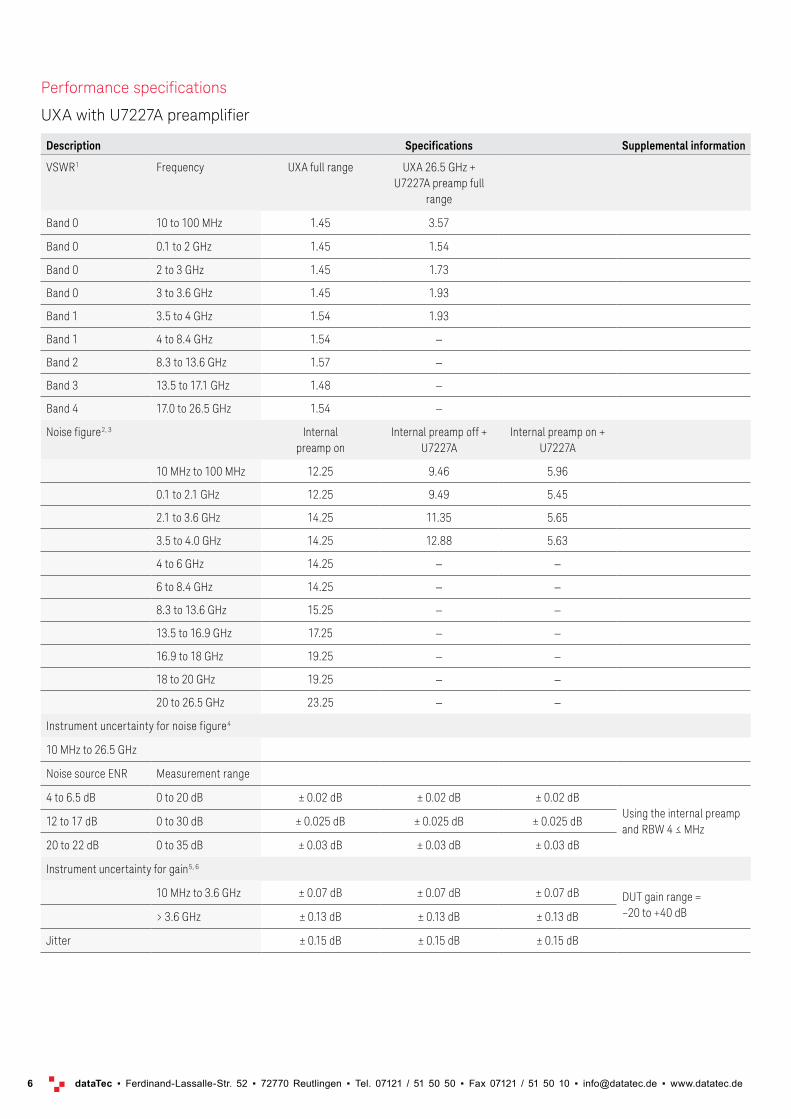
UXA with U7227A preamplifier
Description Specifications Supplemental information
VSWR1 Frequency UXA full range UXA 26.5 GHz + U7227A preamp full
range
Band 0 10 to 100 MHz 1.45 3.57
Band 0 0.1 to 2 GHz 1.45 1.54
Band 0 2 to 3 GHz 1.45 1.73
Band 0 3 to 3.6 GHz 1.45 1.93
Band 1 3.5 to 4 GHz 1.54 1.93
Band 1 4 to 8.4 GHz 1.54 —
Band 2 8.3 to 13.6 GHz 1.57 —
Band 3 13.5 to 17.1 GHz 1.48 —
Band 4 17.0 to 26.5 GHz 1.54 —
Noise figure2, 3 Internalpreamp on
Internal preamp off + U7227A
Internal preamp on + U7227A
10 MHz to 100 MHz 12.25 9.46 5.96
0.1 to 2.1 GHz 12.25 9.49 5.45
2.1 to 3.6 GHz 14.25 11.35 5.65
3.5 to 4.0 GHz 14.25 12.88 5.63
4 to 6 GHz 14.25 — —
6 to 8.4 GHz 14.25 — —
8.3 to 13.6 GHz 15.25 — —
13.5 to 16.9 GHz 17.25 — —
16.9 to 18 GHz 19.25 — —
18 to 20 GHz 19.25 — —
20 to 26.5 GHz 23.25 — —
Instrument uncertainty for noise figure4
10 MHz to 26.5 GHz
Noise source ENR Measurement range
4 to 6.5 dB 0 to 20 dB ± 0.02 dB ± 0.02 dB ± 0.02 dBUsing the internal preamp and RBW 4 ≤ MHz
12 to 17 dB 0 to 30 dB ± 0.025 dB ± 0.025 dB ± 0.025 dB
20 to 22 dB 0 to 35 dB ± 0.03 dB ± 0.03 dB ± 0.03 dB
Instrument uncertainty for gain5, 6
10 MHz to 3.6 GHz ± 0.07 dB ± 0.07 dB ± 0.07 dB DUT gain range =–20 to +40 dB> 3.6 GHz ± 0.13 dB ± 0.13 dB ± 0.13 dB
Jitter ± 0.15 dB ± 0.15 dB ± 0.15 dB
7 dataTec ▪ Ferdinand-Lassalle-Str. 52 ▪ 72770 Reutlingen ▪ Tel. 07121 / 51 50 50 ▪ Fax 07121 / 51 50 10 ▪ [email protected] ▪ www.datatec.de
07 | Keysight | N9069C Noise Figure X-Series Measurement App, Multi-Touch - Technical Overview
Performance specifications
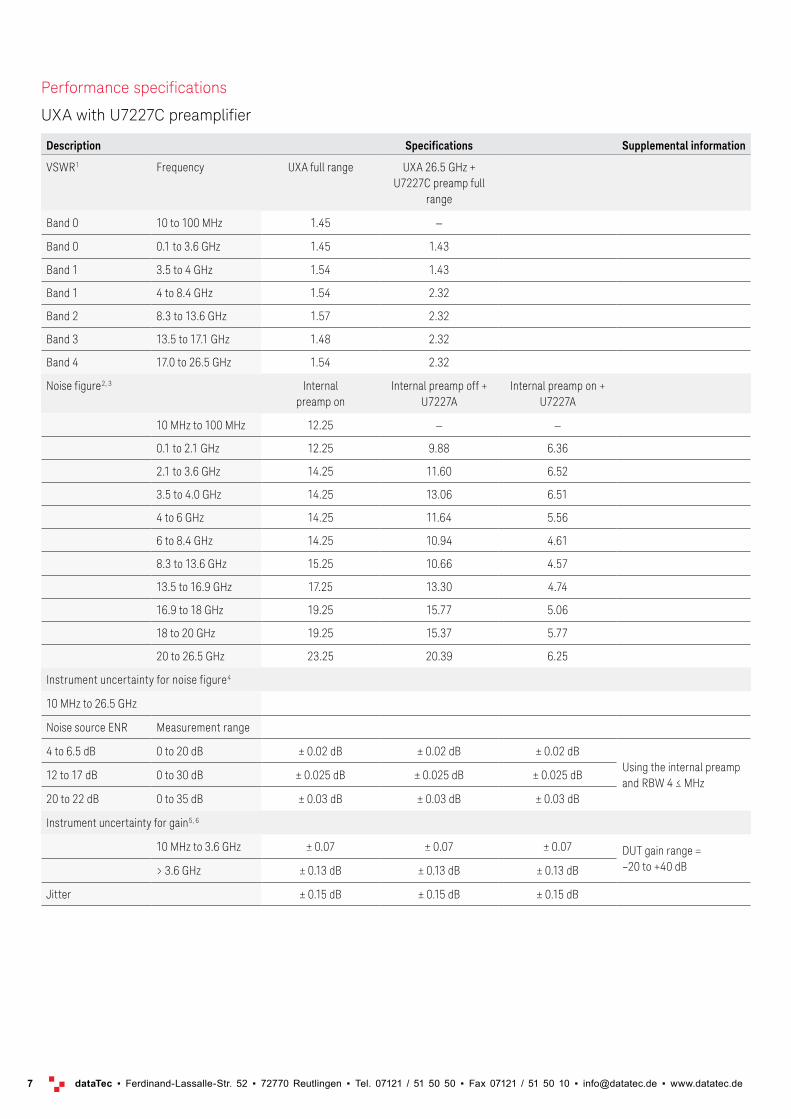
UXA with U7227C preamplifier
Description Specifications Supplemental information
VSWR1 Frequency UXA full range UXA 26.5 GHz + U7227C preamp full
range
Band 0 10 to 100 MHz 1.45 —
Band 0 0.1 to 3.6 GHz 1.45 1.43
Band 1 3.5 to 4 GHz 1.54 1.43
Band 1 4 to 8.4 GHz 1.54 2.32
Band 2 8.3 to 13.6 GHz 1.57 2.32
Band 3 13.5 to 17.1 GHz 1.48 2.32
Band 4 17.0 to 26.5 GHz 1.54 2.32
Noise figure2, 3 Internalpreamp on
Internal preamp off + U7227A
Internal preamp on + U7227A
10 MHz to 100 MHz 12.25 — —
0.1 to 2.1 GHz 12.25 9.88 6.36
2.1 to 3.6 GHz 14.25 11.60 6.52
3.5 to 4.0 GHz 14.25 13.06 6.51
4 to 6 GHz 14.25 11.64 5.56
6 to 8.4 GHz 14.25 10.94 4.61
8.3 to 13.6 GHz 15.25 10.66 4.57
13.5 to 16.9 GHz 17.25 13.30 4.74
16.9 to 18 GHz 19.25 15.77 5.06
18 to 20 GHz 19.25 15.37 5.77
20 to 26.5 GHz 23.25 20.39 6.25
Instrument uncertainty for noise figure4
10 MHz to 26.5 GHz
Noise source ENR Measurement range
4 to 6.5 dB 0 to 20 dB ± 0.02 dB ± 0.02 dB ± 0.02 dBUsing the internal preamp and RBW 4 ≤ MHz
12 to 17 dB 0 to 30 dB ± 0.025 dB ± 0.025 dB ± 0.025 dB
20 to 22 dB 0 to 35 dB ± 0.03 dB ± 0.03 dB ± 0.03 dB
Instrument uncertainty for gain5, 6
10 MHz to 3.6 GHz ± 0.07 ± 0.07 ± 0.07 DUT gain range =–20 to +40 dB> 3.6 GHz ± 0.13 dB ± 0.13 dB ± 0.13 dB
Jitter ± 0.15 dB ± 0.15 dB ± 0.15 dB
8 dataTec ▪ Ferdinand-Lassalle-Str. 52 ▪ 72770 Reutlingen ▪ Tel. 07121 / 51 50 50 ▪ Fax 07121 / 51 50 10 ▪ [email protected] ▪ www.datatec.de
08 | Keysight | N9069C Noise Figure X-Series Measurement App, Multi-Touch - Technical Overview
Performance specifications
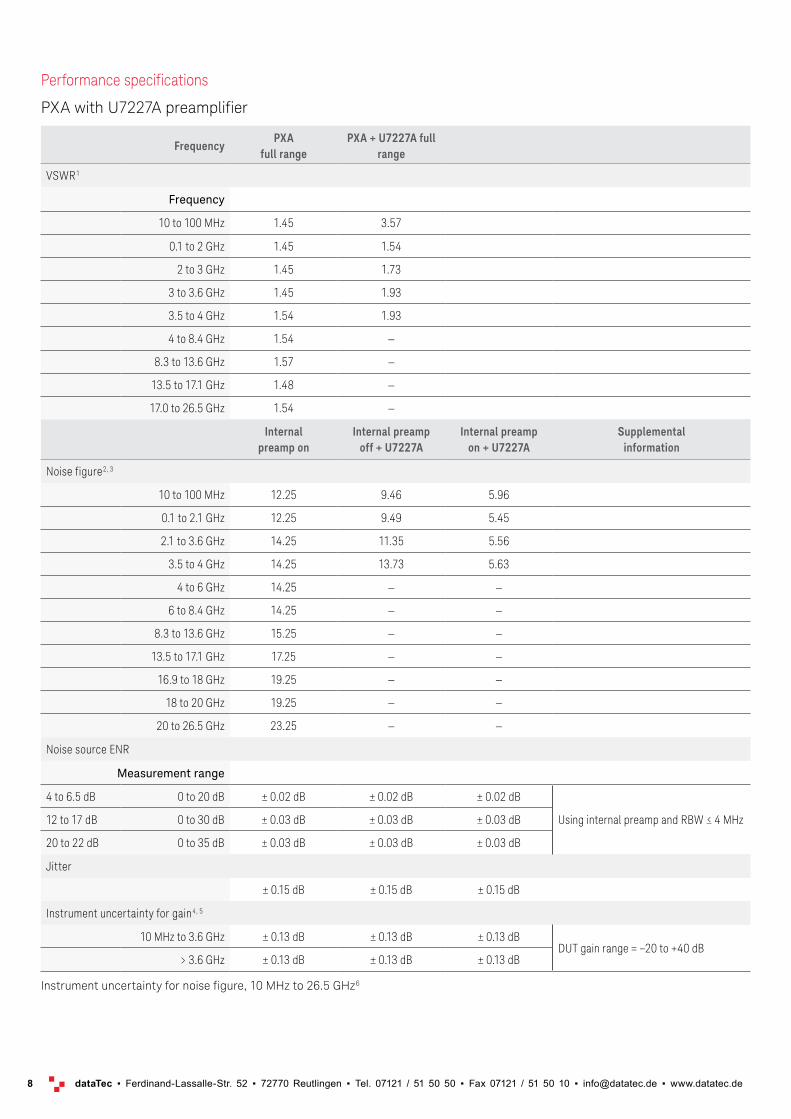
PXA with U7227A preamplifier
FrequencyPXA
full rangePXA + U7227A full
range
VSWR1
Frequency
10 to 100 MHz 1.45 3.57
0.1 to 2 GHz 1.45 1.54
2 to 3 GHz 1.45 1.73
3 to 3.6 GHz 1.45 1.93
3.5 to 4 GHz 1.54 1.93
4 to 8.4 GHz 1.54 —
8.3 to 13.6 GHz 1.57 —
13.5 to 17.1 GHz 1.48 —
17.0 to 26.5 GHz 1.54 —
Internal preamp on
Internal preamp off + U7227A
Internal preamp on + U7227A
Supplemental information
Noise figure2, 3
10 to 100 MHz 12.25 9.46 5.96
0.1 to 2.1 GHz 12.25 9.49 5.45
2.1 to 3.6 GHz 14.25 11.35 5.56
3.5 to 4 GHz 14.25 13.73 5.63
4 to 6 GHz 14.25 — —
6 to 8.4 GHz 14.25 — —
8.3 to 13.6 GHz 15.25 — —
13.5 to 17.1 GHz 17.25 — —
16.9 to 18 GHz 19.25 — —
18 to 20 GHz 19.25 — —
20 to 26.5 GHz 23.25 — —
Noise source ENR
Measurement range
4 to 6.5 dB 0 to 20 dB ± 0.02 dB ± 0.02 dB ± 0.02 dB
Using internal preamp and RBW ≤ 4 MHz12 to 17 dB 0 to 30 dB ± 0.03 dB ± 0.03 dB ± 0.03 dB
20 to 22 dB 0 to 35 dB ± 0.03 dB ± 0.03 dB ± 0.03 dB
Jitter
± 0.15 dB ± 0.15 dB ± 0.15 dB
Instrument uncertainty for gain4, 5
10 MHz to 3.6 GHz ± 0.13 dB ± 0.13 dB ± 0.13 dBDUT gain range = −20 to +40 dB
> 3.6 GHz ± 0.13 dB ± 0.13 dB ± 0.13 dB
Instrument uncertainty for noise figure, 10 MHz to 26.5 GHz6
9 dataTec ▪ Ferdinand-Lassalle-Str. 52 ▪ 72770 Reutlingen ▪ Tel. 07121 / 51 50 50 ▪ Fax 07121 / 51 50 10 ▪ [email protected] ▪ www.datatec.de
09 | Keysight | N9069C Noise Figure X-Series Measurement App, Multi-Touch - Technical Overview
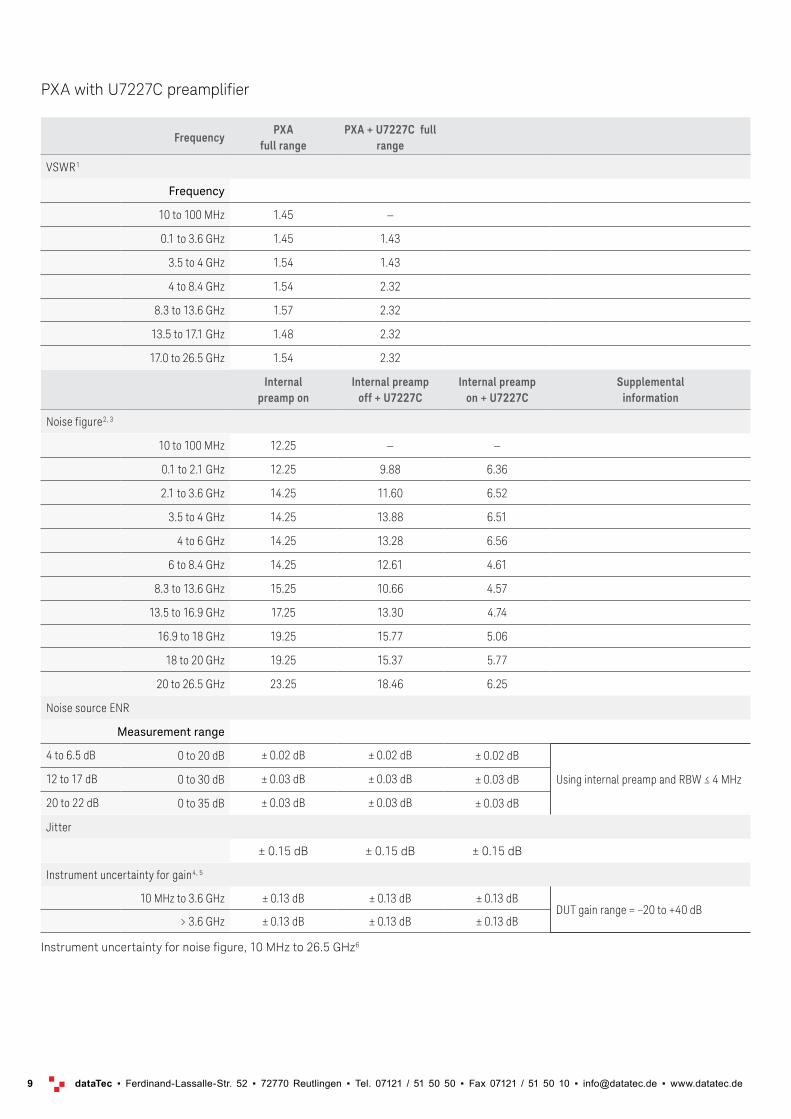
FrequencyPXA
full rangePXA + U7227C full
range
VSWR1
Frequency
10 to 100 MHz 1.45 —
0.1 to 3.6 GHz 1.45 1.43
3.5 to 4 GHz 1.54 1.43
4 to 8.4 GHz 1.54 2.32
8.3 to 13.6 GHz 1.57 2.32
13.5 to 17.1 GHz 1.48 2.32
17.0 to 26.5 GHz 1.54 2.32
Internal preamp on
Internal preamp off + U7227C
Internal preamp on + U7227C
Supplemental information
Noise figure2, 3
10 to 100 MHz 12.25 — —
0.1 to 2.1 GHz 12.25 9.88 6.36
2.1 to 3.6 GHz 14.25 11.60 6.52
3.5 to 4 GHz 14.25 13.88 6.51
4 to 6 GHz 14.25 13.28 6.56
6 to 8.4 GHz 14.25 12.61 4.61
8.3 to 13.6 GHz 15.25 10.66 4.57
13.5 to 16.9 GHz 17.25 13.30 4.74
16.9 to 18 GHz 19.25 15.77 5.06
18 to 20 GHz 19.25 15.37 5.77
20 to 26.5 GHz 23.25 18.46 6.25
Noise source ENR
Measurement range
4 to 6.5 dB 0 to 20 dB ± 0.02 dB ± 0.02 dB ± 0.02 dB
Using internal preamp and RBW ≤ 4 MHz12 to 17 dB 0 to 30 dB ± 0.03 dB ± 0.03 dB ± 0.03 dB
20 to 22 dB 0 to 35 dB ± 0.03 dB ± 0.03 dB ± 0.03 dB
Jitter
± 0.15 dB ± 0.15 dB ± 0.15 dB
Instrument uncertainty for gain4, 5
10 MHz to 3.6 GHz ± 0.13 dB ± 0.13 dB ± 0.13 dBDUT gain range = −20 to +40 dB
> 3.6 GHz ± 0.13 dB ± 0.13 dB ± 0.13 dB
Instrument uncertainty for noise figure, 10 MHz to 26.5 GHz6
PXA with U7227C preamplifier
10 dataTec ▪ Ferdinand-Lassalle-Str. 52 ▪ 72770 Reutlingen ▪ Tel. 07121 / 51 50 50 ▪ Fax 07121 / 51 50 10 ▪ [email protected] ▪ www.datatec.de
10 | Keysight | N9069C Noise Figure X-Series Measurement App, Multi-Touch - Technical Overview
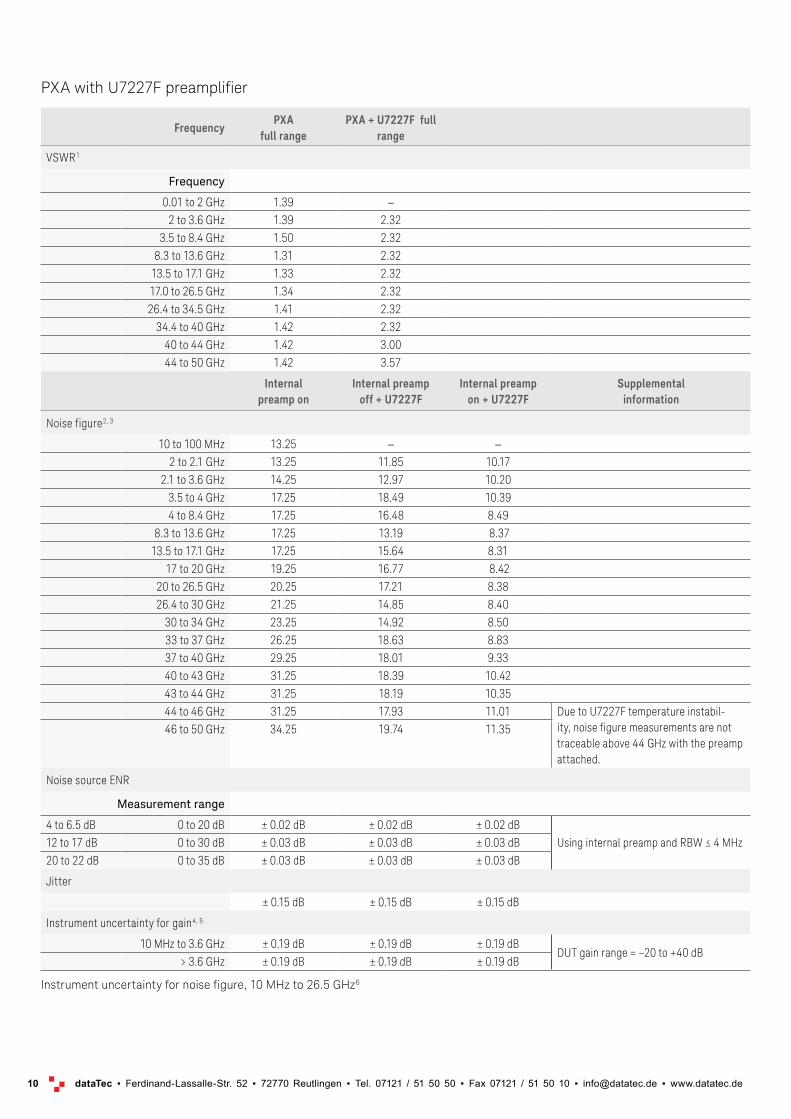
FrequencyPXA
full rangePXA + U7227F full
range
VSWR1
Frequency
0.01 to 2 GHz 1.39 —
2 to 3.6 GHz 1.39 2.32
3.5 to 8.4 GHz 1.50 2.32
8.3 to 13.6 GHz 1.31 2.32
13.5 to 17.1 GHz 1.33 2.32
17.0 to 26.5 GHz 1.34 2.32
26.4 to 34.5 GHz 1.41 2.32
34.4 to 40 GHz 1.42 2.32
40 to 44 GHz 1.42 3.00
44 to 50 GHz 1.42 3.57
Internal preamp on
Internal preamp off + U7227F
Internal preamp on + U7227F
Supplemental information
Noise figure2, 3
10 to 100 MHz 13.25 — —
2 to 2.1 GHz 13.25 11.85 10.17
2.1 to 3.6 GHz 14.25 12.97 10.20
3.5 to 4 GHz 17.25 18.49 10.39
4 to 8.4 GHz 17.25 16.48 8.49
8.3 to 13.6 GHz 17.25 13.19 8.37
13.5 to 17.1 GHz 17.25 15.64 8.31
17 to 20 GHz 19.25 16.77 8.42
20 to 26.5 GHz 20.25 17.21 8.38
26.4 to 30 GHz 21.25 14.85 8.40
30 to 34 GHz 23.25 14.92 8.50
33 to 37 GHz 26.25 18.63 8.83
37 to 40 GHz 29.25 18.01 9.33
40 to 43 GHz 31.25 18.39 10.42
43 to 44 GHz 31.25 18.19 10.35
44 to 46 GHz 31.25 17.93 11.01 Due to U7227F temperature instabil-ity, noise figure measurements are not traceable above 44 GHz with the preamp attached.
46 to 50 GHz 34.25 19.74 11.35
Noise source ENR
Measurement range
4 to 6.5 dB 0 to 20 dB ± 0.02 dB ± 0.02 dB ± 0.02 dB
Using internal preamp and RBW ≤ 4 MHz12 to 17 dB 0 to 30 dB ± 0.03 dB ± 0.03 dB ± 0.03 dB
20 to 22 dB 0 to 35 dB ± 0.03 dB ± 0.03 dB ± 0.03 dB
Jitter
± 0.15 dB ± 0.15 dB ± 0.15 dB
Instrument uncertainty for gain4, 5
10 MHz to 3.6 GHz ± 0.19 dB ± 0.19 dB ± 0.19 dBDUT gain range = −20 to +40 dB
> 3.6 GHz ± 0.19 dB ± 0.19 dB ± 0.19 dB
Instrument uncertainty for noise figure, 10 MHz to 26.5 GHz6
PXA with U7227F preamplifier
11 dataTec ▪ Ferdinand-Lassalle-Str. 52 ▪ 72770 Reutlingen ▪ Tel. 07121 / 51 50 50 ▪ Fax 07121 / 51 50 10 ▪ [email protected] ▪ www.datatec.de
11 | Keysight | N9069C Noise Figure X-Series Measurement App, Multi-Touch - Technical Overview
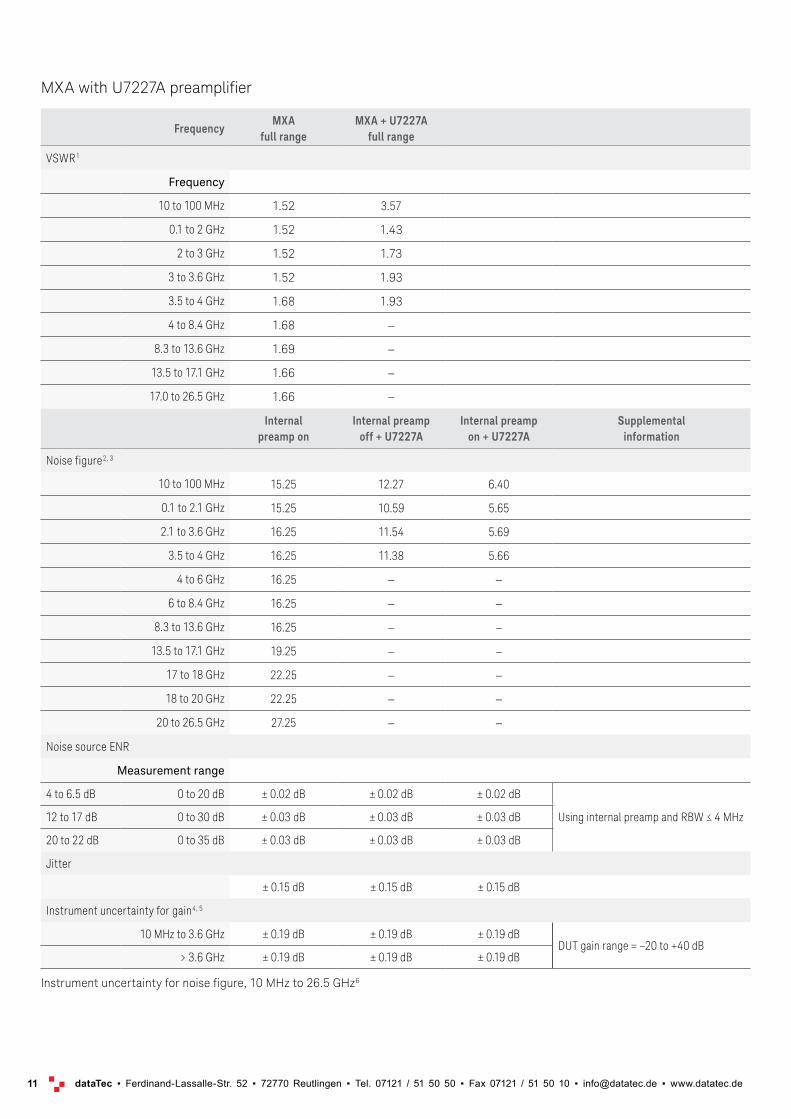
FrequencyMXA
full rangeMXA + U7227A
full range
VSWR1
Frequency
10 to 100 MHz 1.52 3.57
0.1 to 2 GHz 1.52 1.43
2 to 3 GHz 1.52 1.73
3 to 3.6 GHz 1.52 1.93
3.5 to 4 GHz 1.68 1.93
4 to 8.4 GHz 1.68 —
8.3 to 13.6 GHz 1.69 —
13.5 to 17.1 GHz 1.66 —
17.0 to 26.5 GHz 1.66 —
Internal preamp on
Internal preamp off + U7227A
Internal preamp on + U7227A
Supplemental information
Noise figure2, 3
10 to 100 MHz 15.25 12.27 6.40
0.1 to 2.1 GHz 15.25 10.59 5.65
2.1 to 3.6 GHz 16.25 11.54 5.69
3.5 to 4 GHz 16.25 11.38 5.66
4 to 6 GHz 16.25 — —
6 to 8.4 GHz 16.25 — —
8.3 to 13.6 GHz 16.25 — —
13.5 to 17.1 GHz 19.25 — —
17 to 18 GHz 22.25 — —
18 to 20 GHz 22.25 — —
20 to 26.5 GHz 27.25 — —
Noise source ENR
Measurement range
4 to 6.5 dB 0 to 20 dB ± 0.02 dB ± 0.02 dB ± 0.02 dB
Using internal preamp and RBW ≤ 4 MHz12 to 17 dB 0 to 30 dB ± 0.03 dB ± 0.03 dB ± 0.03 dB
20 to 22 dB 0 to 35 dB ± 0.03 dB ± 0.03 dB ± 0.03 dB
Jitter
± 0.15 dB ± 0.15 dB ± 0.15 dB
Instrument uncertainty for gain4, 5
10 MHz to 3.6 GHz ± 0.19 dB ± 0.19 dB ± 0.19 dBDUT gain range = −20 to +40 dB
> 3.6 GHz ± 0.19 dB ± 0.19 dB ± 0.19 dB
Instrument uncertainty for noise figure, 10 MHz to 26.5 GHz6
MXA with U7227A preamplifier
12 dataTec ▪ Ferdinand-Lassalle-Str. 52 ▪ 72770 Reutlingen ▪ Tel. 07121 / 51 50 50 ▪ Fax 07121 / 51 50 10 ▪ [email protected] ▪ www.datatec.de
12 | Keysight | N9069C Noise Figure X-Series Measurement App, Multi-Touch - Technical Overview
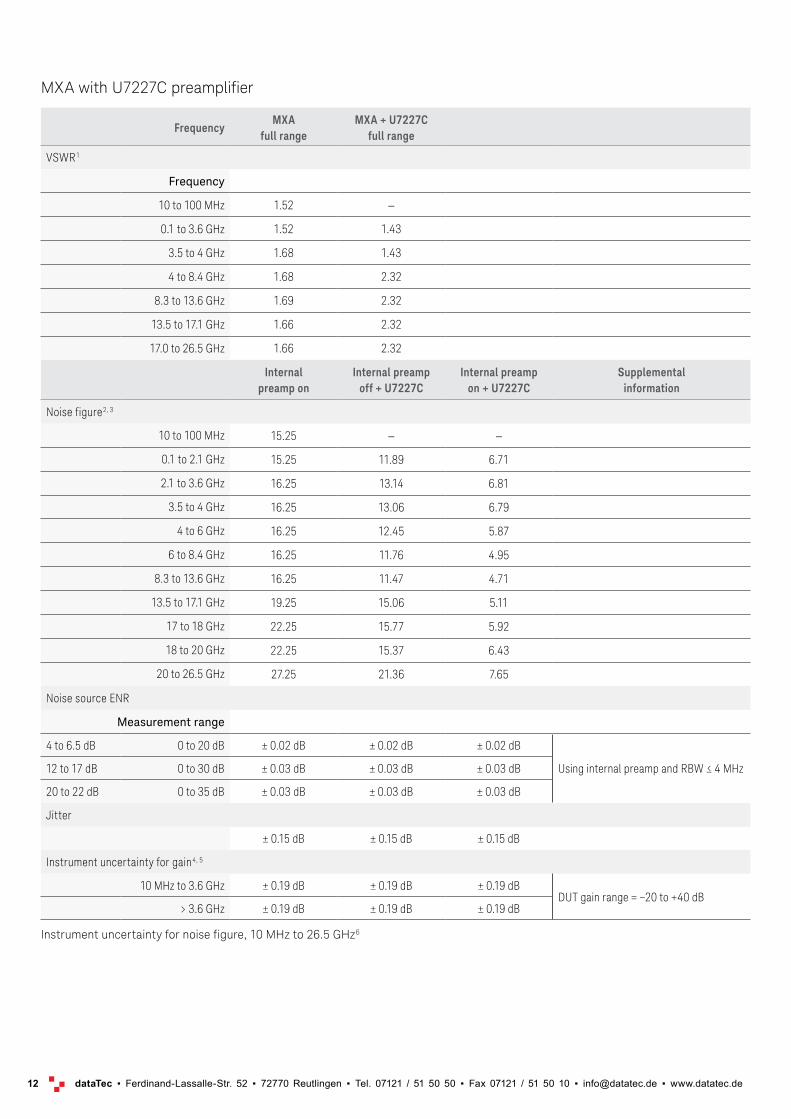
FrequencyMXA
full rangeMXA + U7227C
full range
VSWR1
Frequency
10 to 100 MHz 1.52 —
0.1 to 3.6 GHz 1.52 1.43
3.5 to 4 GHz 1.68 1.43
4 to 8.4 GHz 1.68 2.32
8.3 to 13.6 GHz 1.69 2.32
13.5 to 17.1 GHz 1.66 2.32
17.0 to 26.5 GHz 1.66 2.32
Internal preamp on
Internal preamp off + U7227C
Internal preamp on + U7227C
Supplemental information
Noise figure2, 3
10 to 100 MHz 15.25 — —
0.1 to 2.1 GHz 15.25 11.89 6.71
2.1 to 3.6 GHz 16.25 13.14 6.81
3.5 to 4 GHz 16.25 13.06 6.79
4 to 6 GHz 16.25 12.45 5.87
6 to 8.4 GHz 16.25 11.76 4.95
8.3 to 13.6 GHz 16.25 11.47 4.71
13.5 to 17.1 GHz 19.25 15.06 5.11
17 to 18 GHz 22.25 15.77 5.92
18 to 20 GHz 22.25 15.37 6.43
20 to 26.5 GHz 27.25 21.36 7.65
Noise source ENR
Measurement range
4 to 6.5 dB 0 to 20 dB ± 0.02 dB ± 0.02 dB ± 0.02 dB
Using internal preamp and RBW ≤ 4 MHz12 to 17 dB 0 to 30 dB ± 0.03 dB ± 0.03 dB ± 0.03 dB
20 to 22 dB 0 to 35 dB ± 0.03 dB ± 0.03 dB ± 0.03 dB
Jitter
± 0.15 dB ± 0.15 dB ± 0.15 dB
Instrument uncertainty for gain4, 5
10 MHz to 3.6 GHz ± 0.19 dB ± 0.19 dB ± 0.19 dBDUT gain range = −20 to +40 dB
> 3.6 GHz ± 0.19 dB ± 0.19 dB ± 0.19 dB
Instrument uncertainty for noise figure, 10 MHz to 26.5 GHz6
MXA with U7227C preamplifier
13 dataTec ▪ Ferdinand-Lassalle-Str. 52 ▪ 72770 Reutlingen ▪ Tel. 07121 / 51 50 50 ▪ Fax 07121 / 51 50 10 ▪ [email protected] ▪ www.datatec.de
13 | Keysight | N9069C Noise Figure X-Series Measurement App, Multi-Touch - Technical Overview
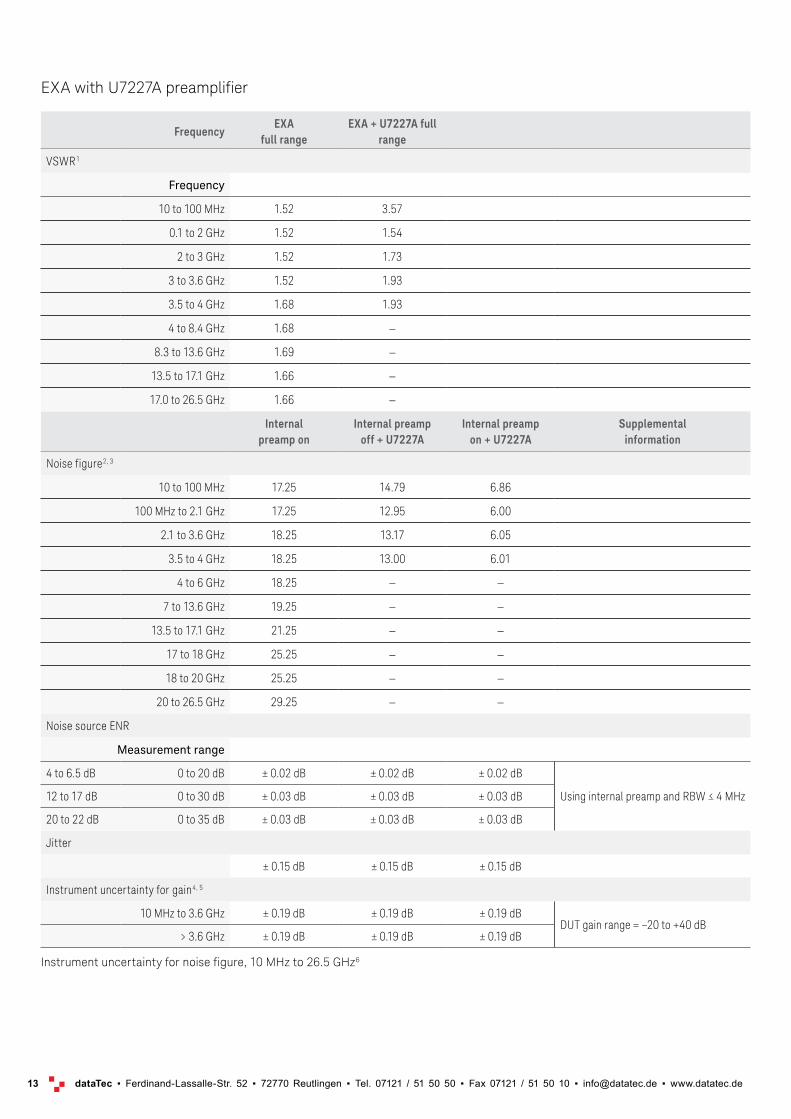
FrequencyEXA
full rangeEXA + U7227A full
range
VSWR1
Frequency
10 to 100 MHz 1.52 3.57
0.1 to 2 GHz 1.52 1.54
2 to 3 GHz 1.52 1.73
3 to 3.6 GHz 1.52 1.93
3.5 to 4 GHz 1.68 1.93
4 to 8.4 GHz 1.68 —
8.3 to 13.6 GHz 1.69 —
13.5 to 17.1 GHz 1.66 —
17.0 to 26.5 GHz 1.66 —
Internal preamp on
Internal preamp off + U7227A
Internal preamp on + U7227A
Supplemental information
Noise figure2, 3
10 to 100 MHz 17.25 14.79 6.86
100 MHz to 2.1 GHz 17.25 12.95 6.00
2.1 to 3.6 GHz 18.25 13.17 6.05
3.5 to 4 GHz 18.25 13.00 6.01
4 to 6 GHz 18.25 — —
7 to 13.6 GHz 19.25 — —
13.5 to 17.1 GHz 21.25 — —
17 to 18 GHz 25.25 — —
18 to 20 GHz 25.25 — —
20 to 26.5 GHz 29.25 — —
Noise source ENR
Measurement range
4 to 6.5 dB 0 to 20 dB ± 0.02 dB ± 0.02 dB ± 0.02 dB
Using internal preamp and RBW ≤ 4 MHz12 to 17 dB 0 to 30 dB ± 0.03 dB ± 0.03 dB ± 0.03 dB
20 to 22 dB 0 to 35 dB ± 0.03 dB ± 0.03 dB ± 0.03 dB
Jitter
± 0.15 dB ± 0.15 dB ± 0.15 dB
Instrument uncertainty for gain4, 5
10 MHz to 3.6 GHz ± 0.19 dB ± 0.19 dB ± 0.19 dBDUT gain range = −20 to +40 dB
> 3.6 GHz ± 0.19 dB ± 0.19 dB ± 0.19 dB
Instrument uncertainty for noise figure, 10 MHz to 26.5 GHz6
EXA with U7227A preamplifier

14 dataTec ▪ Ferdinand-Lassalle-Str. 52 ▪ 72770 Reutlingen ▪ Tel. 07121 / 51 50 50 ▪ Fax 07121 / 51 50 10 ▪ [email protected] ▪ www.datatec.de
14 | Keysight | N9069C Noise Figure X-Series Measurement App, Multi-Touch - Technical Overview
FrequencyEXA
full rangeEXA + U7227C full
range
VSWR1
Frequency
10 to 100 MHz 1.52 —
0.1 to 3.6 GHz 1.52 1.43
3.5 to 4 GHz 1.68 1.43
4 to 8.4 GHz 1.68 2.32
8.3 to 13.6 GHz 1.69 2.32
13.5 to 17.1 GHz 1.66 2.32
17.0 to 26.5 GHz 1.66 2.32
Internal preamp on
Internal preamp off + U7227C
Internal preamp on + U7227C
Supplemental information
Noise figure2, 3
10 to 100 MHz 17.25 — —
100 MHz to 2.1 GHz 17.25 14.30 7.08
2.1 to 3.6 GHz 18.25 14.82 7.23
3.5 to 4 GHz 18.25 14.73 7.20
4 to 6 GHz 18.25 14.15 6.33
6 to 7 GHz 18.25 13.81 5.53
7 to 13.6 GHz 19.25 15.90 5.34
13.5 to 17.1 GHz 21.25 21.78 5.66
17 to 18 GHz 25.25 21.55 7.24
18 to 20 GHz 25.25 21.06 7.51
20 to 26.5 GHz 29.25 23.32 8.68
Noise source ENR
Measurement range
4 to 6.5 dB 0 to 20 dB ± 0.02 dB ± 0.02 dB ± 0.02 dB
Using internal preamp and RBW ≤ 4 MHz12 to 17 dB 0 to 30 dB ± 0.03 dB ± 0.03 dB ± 0.03 dB
20 to 22 dB 0 to 35 dB ± 0.03 dB ± 0.03 dB ± 0.03 dB
Jitter
± 0.15 dB ± 0.15 dB ± 0.15 dB
Instrument uncertainty for gain4, 5
10 MHz to 3.6 GHz ± 0.19 dB ± 0.19 dB ± 0.19 dBDUT gain range = −20 to +40 dB
> 3.6 GHz ± 0.19 dB ± 0.19 dB ± 0.19 dB
Instrument uncertainty for noise figure, 10 MHz to 26.5 GHz6
EXA with U7227C preamplifier
15 dataTec ▪ Ferdinand-Lassalle-Str. 52 ▪ 72770 Reutlingen ▪ Tel. 07121 / 51 50 50 ▪ Fax 07121 / 51 50 10 ▪ [email protected] ▪ www.datatec.de
15 | Keysight | N9069C Noise Figure X-Series Measurement App, Multi-Touch - Technical Overview
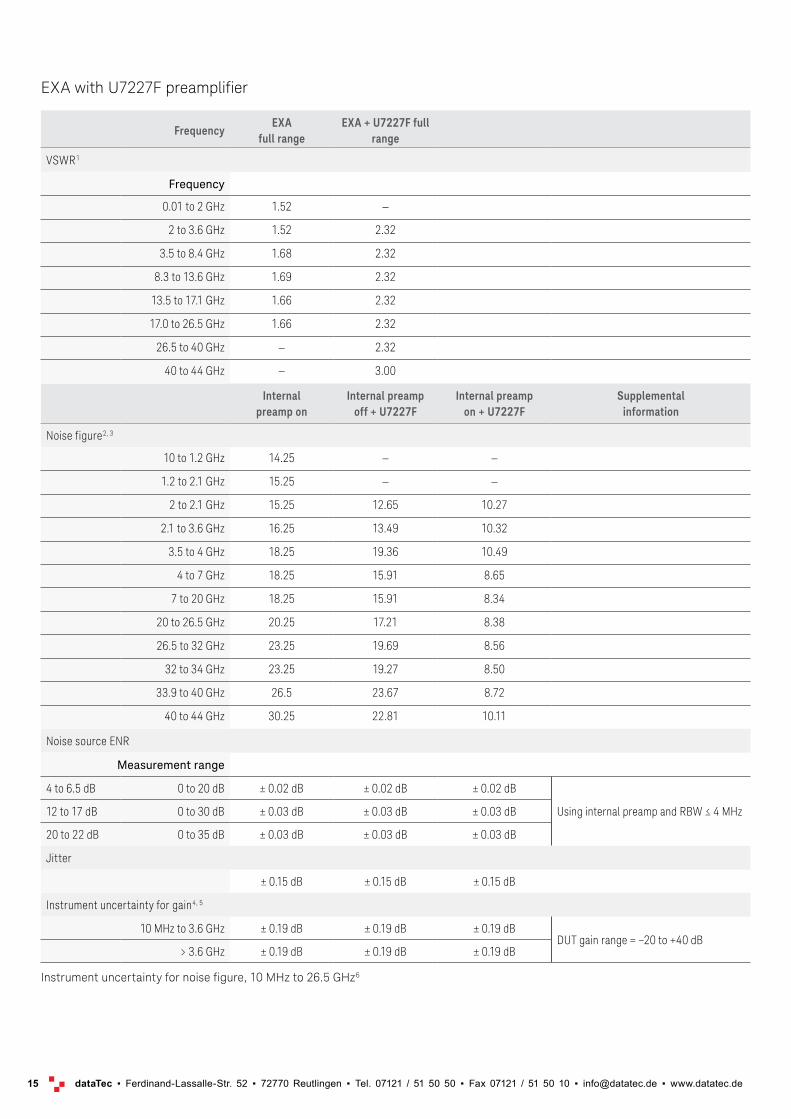
FrequencyEXA
full rangeEXA + U7227F full
range
VSWR1
Frequency
0.01 to 2 GHz 1.52 —
2 to 3.6 GHz 1.52 2.32
3.5 to 8.4 GHz 1.68 2.32
8.3 to 13.6 GHz 1.69 2.32
13.5 to 17.1 GHz 1.66 2.32
17.0 to 26.5 GHz 1.66 2.32
26.5 to 40 GHz — 2.32
40 to 44 GHz — 3.00
Internal preamp on
Internal preamp off + U7227F
Internal preamp on + U7227F
Supplemental information
Noise figure2, 3
10 to 1.2 GHz 14.25 — —
1.2 to 2.1 GHz 15.25 — —
2 to 2.1 GHz 15.25 12.65 10.27
2.1 to 3.6 GHz 16.25 13.49 10.32
3.5 to 4 GHz 18.25 19.36 10.49
4 to 7 GHz 18.25 15.91 8.65
7 to 20 GHz 18.25 15.91 8.34
20 to 26.5 GHz 20.25 17.21 8.38
26.5 to 32 GHz 23.25 19.69 8.56
32 to 34 GHz 23.25 19.27 8.50
33.9 to 40 GHz 26.5 23.67 8.72
40 to 44 GHz 30.25 22.81 10.11
Noise source ENR
Measurement range
4 to 6.5 dB 0 to 20 dB ± 0.02 dB ± 0.02 dB ± 0.02 dB
Using internal preamp and RBW ≤ 4 MHz12 to 17 dB 0 to 30 dB ± 0.03 dB ± 0.03 dB ± 0.03 dB
20 to 22 dB 0 to 35 dB ± 0.03 dB ± 0.03 dB ± 0.03 dB
Jitter
± 0.15 dB ± 0.15 dB ± 0.15 dB
Instrument uncertainty for gain4, 5
10 MHz to 3.6 GHz ± 0.19 dB ± 0.19 dB ± 0.19 dBDUT gain range = −20 to +40 dB
> 3.6 GHz ± 0.19 dB ± 0.19 dB ± 0.19 dB
Instrument uncertainty for noise figure, 10 MHz to 26.5 GHz6
EXA with U7227F preamplifier
16 dataTec ▪ Ferdinand-Lassalle-Str. 52 ▪ 72770 Reutlingen ▪ Tel. 07121 / 51 50 50 ▪ Fax 07121 / 51 50 10 ▪ [email protected] ▪ www.datatec.de
16 | Keysight | N9069C Noise Figure X-Series Measurement App, Multi-Touch - Technical Overview
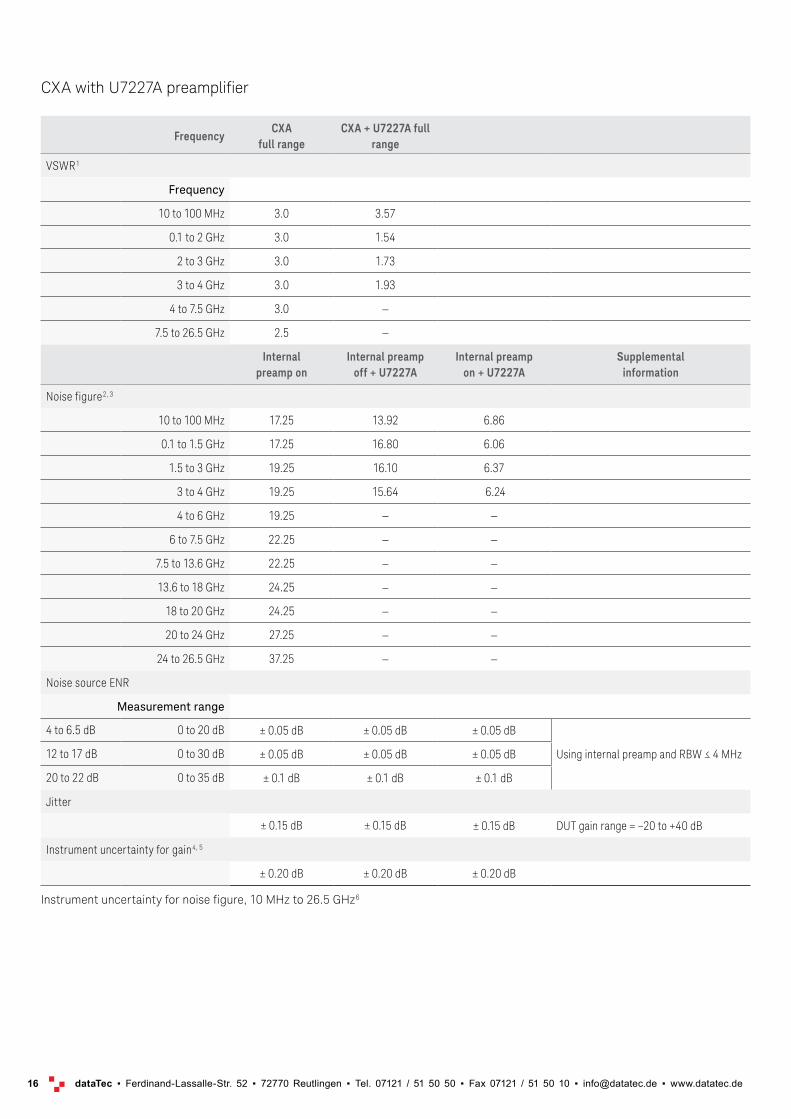
FrequencyCXA
full rangeCXA + U7227A full
range
VSWR1
Frequency
10 to 100 MHz 3.0 3.57
0.1 to 2 GHz 3.0 1.54
2 to 3 GHz 3.0 1.73
3 to 4 GHz 3.0 1.93
4 to 7.5 GHz 3.0 —
7.5 to 26.5 GHz 2.5 —
Internal preamp on
Internal preamp off + U7227A
Internal preamp on + U7227A
Supplemental information
Noise figure2, 3
10 to 100 MHz 17.25 13.92 6.86
0.1 to 1.5 GHz 17.25 16.80 6.06
1.5 to 3 GHz 19.25 16.10 6.37
3 to 4 GHz 19.25 15.64 6.24
4 to 6 GHz 19.25 — —
6 to 7.5 GHz 22.25 — —
7.5 to 13.6 GHz 22.25 — —
13.6 to 18 GHz 24.25 — —
18 to 20 GHz 24.25 — —
20 to 24 GHz 27.25 — —
24 to 26.5 GHz 37.25 — —
Noise source ENR
Measurement range
4 to 6.5 dB 0 to 20 dB ± 0.05 dB ± 0.05 dB ± 0.05 dB
Using internal preamp and RBW ≤ 4 MHz12 to 17 dB 0 to 30 dB ± 0.05 dB ± 0.05 dB ± 0.05 dB
20 to 22 dB 0 to 35 dB ± 0.1 dB ± 0.1 dB ± 0.1 dB
Jitter
± 0.15 dB ± 0.15 dB ± 0.15 dB DUT gain range = −20 to +40 dB
Instrument uncertainty for gain4, 5
± 0.20 dB ± 0.20 dB ± 0.20 dB
Instrument uncertainty for noise figure, 10 MHz to 26.5 GHz6
CXA with U7227A preamplifier
17 dataTec ▪ Ferdinand-Lassalle-Str. 52 ▪ 72770 Reutlingen ▪ Tel. 07121 / 51 50 50 ▪ Fax 07121 / 51 50 10 ▪ [email protected] ▪ www.datatec.de
17 | Keysight | N9069C Noise Figure X-Series Measurement App, Multi-Touch - Technical Overview
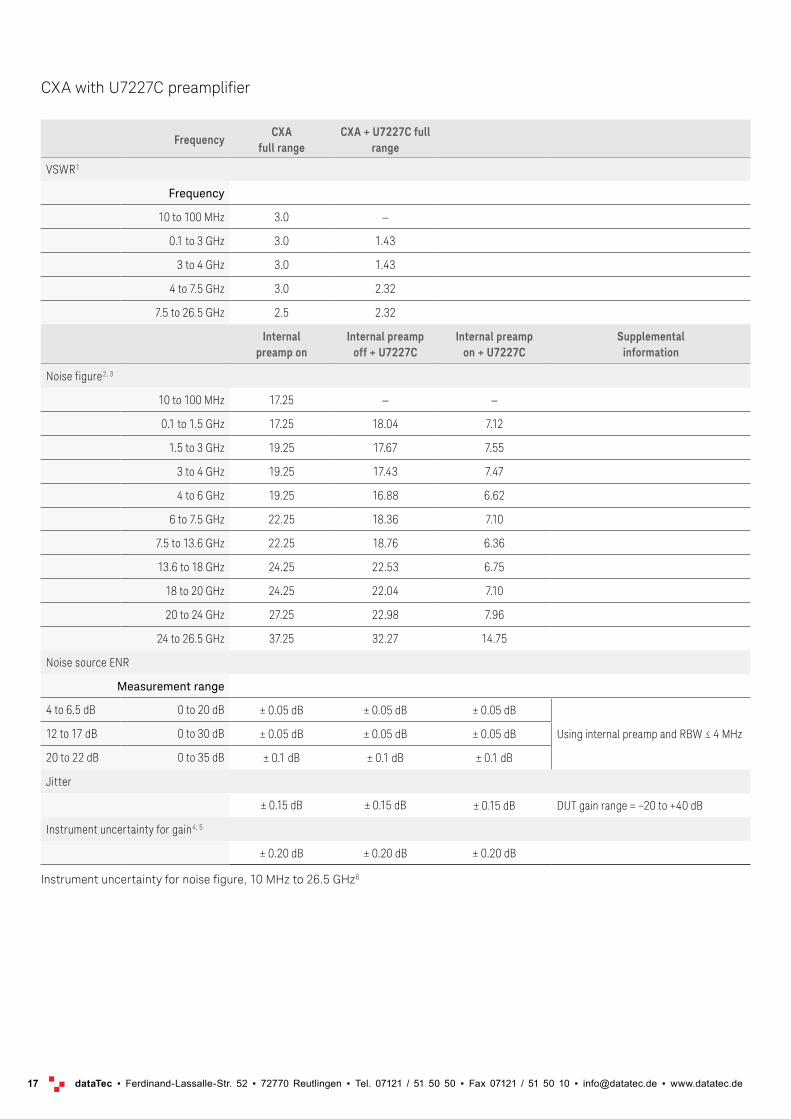
FrequencyCXA
full rangeCXA + U7227C full
range
VSWR1
Frequency
10 to 100 MHz 3.0 —
0.1 to 3 GHz 3.0 1.43
3 to 4 GHz 3.0 1.43
4 to 7.5 GHz 3.0 2.32
7.5 to 26.5 GHz 2.5 2.32
Internal preamp on
Internal preamp off + U7227C
Internal preamp on + U7227C
Supplemental information
Noise figure2, 3
10 to 100 MHz 17.25 — —
0.1 to 1.5 GHz 17.25 18.04 7.12
1.5 to 3 GHz 19.25 17.67 7.55
3 to 4 GHz 19.25 17.43 7.47
4 to 6 GHz 19.25 16.88 6.62
6 to 7.5 GHz 22.25 18.36 7.10
7.5 to 13.6 GHz 22.25 18.76 6.36
13.6 to 18 GHz 24.25 22.53 6.75
18 to 20 GHz 24.25 22.04 7.10
20 to 24 GHz 27.25 22.98 7.96
24 to 26.5 GHz 37.25 32.27 14.75
Noise source ENR
Measurement range
4 to 6.5 dB 0 to 20 dB ± 0.05 dB ± 0.05 dB ± 0.05 dB
Using internal preamp and RBW ≤ 4 MHz12 to 17 dB 0 to 30 dB ± 0.05 dB ± 0.05 dB ± 0.05 dB
20 to 22 dB 0 to 35 dB ± 0.1 dB ± 0.1 dB ± 0.1 dB
Jitter
± 0.15 dB ± 0.15 dB ± 0.15 dB DUT gain range = −20 to +40 dB
Instrument uncertainty for gain4, 5
± 0.20 dB ± 0.20 dB ± 0.20 dB
Instrument uncertainty for noise figure, 10 MHz to 26.5 GHz6
CXA with U7227C preamplifier
18 dataTec ▪ Ferdinand-Lassalle-Str. 52 ▪ 72770 Reutlingen ▪ Tel. 07121 / 51 50 50 ▪ Fax 07121 / 51 50 10 ▪ [email protected] ▪ www.datatec.de
18 | Keysight | N9069C Noise Figure X-Series Measurement App, Multi-Touch - Technical Overview
1. Analyzer VSWR is characterized to the 95th percentile but not measured and warranted. The VSWR measurement is made on the PNA-X which is traceable. The reverse isolation of the USAB preamp is high enough that the system VSWR is insignificantly affected by the analyzer VSWR. So the system VSWR is the warranted VSWR of the USB preamp.
2. Analyzer noise figure is computed from the specified DANL using NF = D - (K - L + B ) where D is the DANL (displayed average noise level), K is kTB (-173.98 dBm in a 1 Hz bandwidth at 290 K), L is 2.51 dB (the effect of log averaging used in DANL verifications), N is 0.24 dB (the ratio of the noise bandwidth of the RBW filter with which the DANL is specified to an ideal noise bandwidth), B is ten times the base-10 logarithm of the RBW (in hertz) in which the DANL is specified. B is 0 dB for the 1 Hz RBW. The actual NF will vary from the nominal due to frequency response errors. Frequency response errors help as often as they harm, so NF derived from the DANL is a very good approximation to the true NF. Any other uncertainties created by deriving the noise figure are small second-order uncertainties the GUM does not require.
3. Noise figure for the combination of USB preamp and analyzer is NFsys = 10*Log(Fpreamp + (Fanalyzer - 1)/Gpreamp). The noise figure and gain of the preamp are specified and warranted. The noise figure of the analyzer is derived and discussed in [2]. The uncertainty due to the noise figure of the analyzer is smaller than [2].
4. “Instrument Uncertainty” is defined for noise figure analysis as uncertainty due to relative amplitude uncertainties encountered in the analyzer when mak-ing the measurements required for a noise figure computation. The relative amplitude uncertainty depends on, but is not identical to, the relative display scale fidelity, also known as incremental log fidelity. The uncertainty of the analyzer is multiplied within the computation by an amount that depends on the Y factor to give the total uncertainty of the noise figure or gain measurement. See Agilent App Note 57-2, literature number 5952-3706E for details on the use of this specification. Jitter (amplitude variations) will also affect the accuracy of results. The standard deviation of the measured result decreases by a factor of the square root of the Resolution Bandwidth used and by the square root of the number of averages. This application uses the 4 MHz Resolution Bandwidth as default because this is the widest bandwidth with uncompromised accuracy.
5. “Instrument Uncertainty” is defined for gain measurements as uncertainty due to relative amplitude uncertainties encountered in the analyzer when making the measurements required for the gain computation. See Agilent App Note 57-2, literature number 5952-3706E for details on the use of this specification. Jitter (amplitude variations) will also affect the accuracy of results. The standard deviation of the measured result decreases by a factor of the square root of the Resolution Bandwidth used and by the square root of the number of averages. This application uses the 4 MHz Resolution Bandwidth as default since this is the widest bandwidth with uncompromised accuracy.
6. Instrument uncertainty for gain is characterized to the 95th percentile above 3.6 GHz.
Computing measurement uncertainty Keysight provides three versions of noise figure uncertainty calculation, including
– Built-in noise figure uncertainty calculator (NFUC) enables you to calculate mea-surement uncertainty directly using the current measurement results.
– Spreadsheet version gives you the most freedom to enter DUT information and in-strument specifications to get an accurate noise figure uncertainty. The spreadsheet version of the NFUC can be found
– Online version enables you to sweep on almost all the relevant parameters to see their impact on measurement uncertainty. Access the online version of the NFUC
Note: Data subject to change
19 dataTec ▪ Ferdinand-Lassalle-Str. 52 ▪ 72770 Reutlingen ▪ Tel. 07121 / 51 50 50 ▪ Fax 07121 / 51 50 10 ▪ [email protected] ▪ www.datatec.de
19 | Keysight | N9069C Noise Figure X-Series Measurement App, Multi-Touch - Technical Overview
N9069C noise figure X-Series measurement application
Model-Option Description, license type
N9069C-3FP Noise figure measurement fixed perpetual
N9069C-3TP Noise figure measurement transportable perpetual
Software Licensing and Instrument Configuration
Choose from two license types::
– Fixed, perpetual license: This allows you to run the application in the X-Series analyzer in which it is initially installed.
– Transportable, perpetual license: This allows you to run the application in the X-Series analyzer in which it is initially installed, plus it may be transferred from one multi-touch X-Series analyzer to another.
You Can Upgrade!
Options can be added after your initial purchase. All of our X-Series application options are license-key up-gradeable.
UPGRADE
Hardware Configuration
For optimizing noise figure measurements with noise figure measurement application, Keysight recommends a minimum level of X-Series multi-touch signal analyzer hardware functionality at each instrument performance point.Supported analyzers include:
– UXA N9040B – PXA N9030B – MXA N9020B – EXA N9010B – CXA N9000B
Capability Instrument Option Benefit
Electronic Attenuator -EA3 Recommended: Fast and reliable attenuation changes ideal for manufacturing without the wear associated with mechanical attenuators up to 3.6 GHz in 1 dB steps
Pre-amplifier 3.6 GHz (-P03) or higher Required: For maximizing the measurement sensitivity to meet specifications
The following NFA X-Series Noise Figure Analyzers are supported: – N8973B – N8974B – N8975B – N8976B
The NFA-X-Series comes standard with the fine step attenuator, precision frequency reference, full band preamplifier, noise floor extension, and U7227 USB preamplifier so no additional options are required.
Ihr Spezialist fürMess- und Prüfgeräte
dataTec ▪ Ferdinand-Lassalle-Str. 52 ▪ 72770 Reutlingen ▪ Tel. 07121 / 51 50 50 ▪ Fax 07121 / 51 50 10 ▪ [email protected] ▪ www.datatec.de
Änd
erun
gen
und
Irrt
ümer
vor
beha
lten.
dat
aTec
18-
03-2
018
| © K
eysi
ght T
echn
olog
ies:
Dec
embe
r 1, 2
017
| 599
2-08
51E
N
20 | Keysight | N9069C Noise Figure X-Series Measurement App, Multi-Touch - Technical Overview
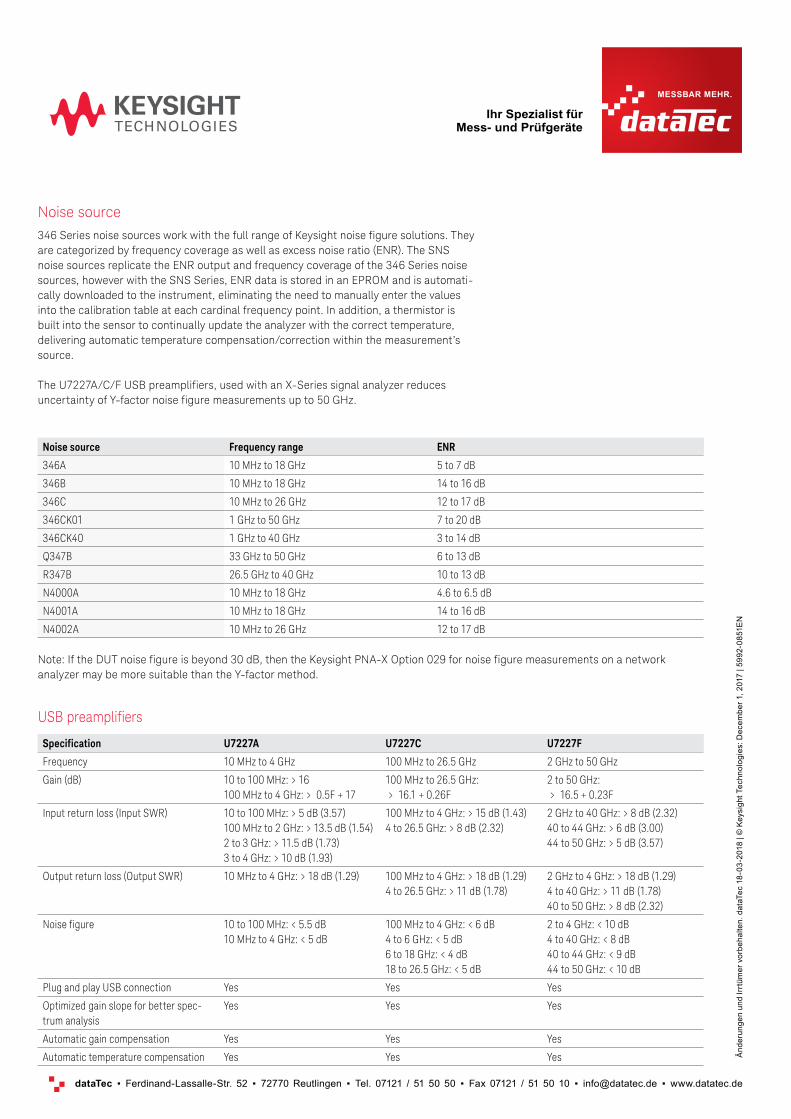
Noise source Frequency range ENR
346A 10 MHz to 18 GHz 5 to 7 dB
346B 10 MHz to 18 GHz 14 to 16 dB
346C 10 MHz to 26 GHz 12 to 17 dB
346CK01 1 GHz to 50 GHz 7 to 20 dB
346CK40 1 GHz to 40 GHz 3 to 14 dB
Q347B 33 GHz to 50 GHz 6 to 13 dB
R347B 26.5 GHz to 40 GHz 10 to 13 dB
N4000A 10 MHz to 18 GHz 4.6 to 6.5 dB
N4001A 10 MHz to 18 GHz 14 to 16 dB
N4002A 10 MHz to 26 GHz 12 to 17 dB
Note: If the DUT noise figure is beyond 30 dB, then the Keysight PNA-X Option 029 for noise figure measurements on a network analyzer may be more suitable than the Y-factor method.
Noise source346 Series noise sources work with the full range of Keysight noise figure solutions. They are categorized by frequency coverage as well as excess noise ratio (ENR). The SNS noise sources replicate the ENR output and frequency coverage of the 346 Series noise sources, however with the SNS Series, ENR data is stored in an EPROM and is automati-cally downloaded to the instrument, eliminating the need to manually enter the values into the calibration table at each cardinal frequency point. In addition, a thermistor is built into the sensor to continually update the analyzer with the correct temperature, delivering automatic temperature compensation/correction within the measurement’s source.
The U7227A/C/F USB preamplifiers, used with an X-Series signal analyzer reduces uncertainty of Y-factor noise figure measurements up to 50 GHz.
USB preamplifiers
Specification U7227A U7227C U7227F
Frequency 10 MHz to 4 GHz 100 MHz to 26.5 GHz 2 GHz to 50 GHz
Gain (dB) 10 to 100 MHz: > 16 100 MHz to 4 GHz: > 0.5F + 17
100 MHz to 26.5 GHz: > 16.1 + 0.26F
2 to 50 GHz: > 16.5 + 0.23F
Input return loss (Input SWR) 10 to 100 MHz: > 5 dB (3.57) 100 MHz to 2 GHz: > 13.5 dB (1.54) 2 to 3 GHz: > 11.5 dB (1.73) 3 to 4 GHz: > 10 dB (1.93)
100 MHz to 4 GHz: > 15 dB (1.43) 4 to 26.5 GHz: > 8 dB (2.32)
2 GHz to 40 GHz: > 8 dB (2.32) 40 to 44 GHz: > 6 dB (3.00) 44 to 50 GHz: > 5 dB (3.57)
Output return loss (Output SWR) 10 MHz to 4 GHz: > 18 dB (1.29) 100 MHz to 4 GHz: > 18 dB (1.29) 4 to 26.5 GHz: > 11 dB (1.78)
2 GHz to 4 GHz: > 18 dB (1.29) 4 to 40 GHz: > 11 dB (1.78) 40 to 50 GHz: > 8 dB (2.32)
Noise figure 10 to 100 MHz: < 5.5 dB 10 MHz to 4 GHz: < 5 dB
100 MHz to 4 GHz: < 6 dB 4 to 6 GHz: < 5 dB 6 to 18 GHz: < 4 dB 18 to 26.5 GHz: < 5 dB
2 to 4 GHz: < 10 dB 4 to 40 GHz: < 8 dB 40 to 44 GHz: < 9 dB 44 to 50 GHz: < 10 dB
Plug and play USB connection Yes Yes Yes
Optimized gain slope for better spec-trum analysis
Yes Yes Yes
Automatic gain compensation Yes Yes Yes
Automatic temperature compensation Yes Yes Yes