Embed Size (px)
DESCRIPTION
KPIs for Enterprise
Citation preview
Gross Revenue - Earned
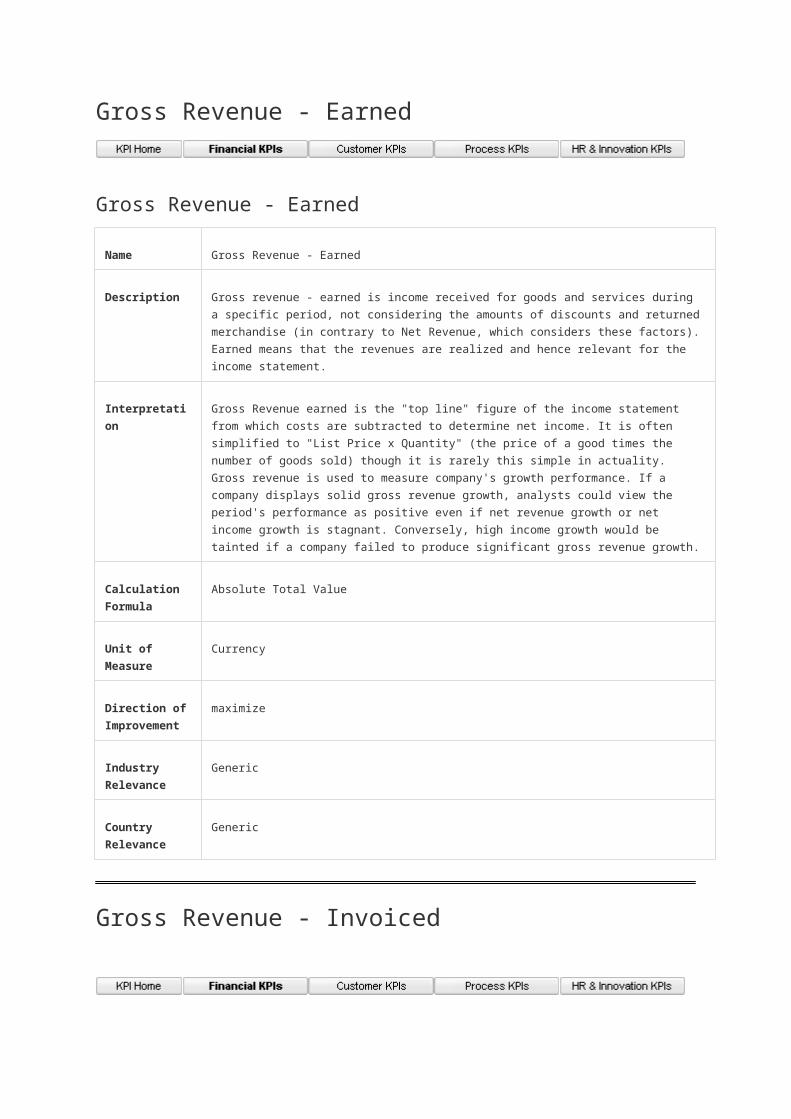
Gross Revenue - Earned
Name Gross Revenue - Earned
Description Gross revenue - earned is income received for goods and services during a specific period, not
considering the amounts of discounts and returned merchandise (in contrary to Net Revenue,
which considers these factors). Earned means that the revenues are realized and hence relevant
for the income statement.
Interpretation Gross Revenue earned is the "top line" figure of the income statement from which costs are
subtracted to determine net income. It is often simplified to "List Price x Quantity" (the price of a
good times the number of goods sold) though it is rarely this simple in actuality. Gross revenue is
used to measure company's growth performance. If a company displays solid gross revenue
growth, analysts could view the period's performance as positive even if net revenue growth or net
income growth is stagnant. Conversely, high income growth would be tainted if a company failed to
produce significant gross revenue growth.
Calculation
Formula
Absolute Total Value
Unit of Measure Currency
Direction of
Improvement
maximize
Industry
Relevance
Generic
Country
Relevance
Generic
Gross Revenue - Invoiced
Gross Revenue - Invoiced
Name Gross Revenue - Invoiced
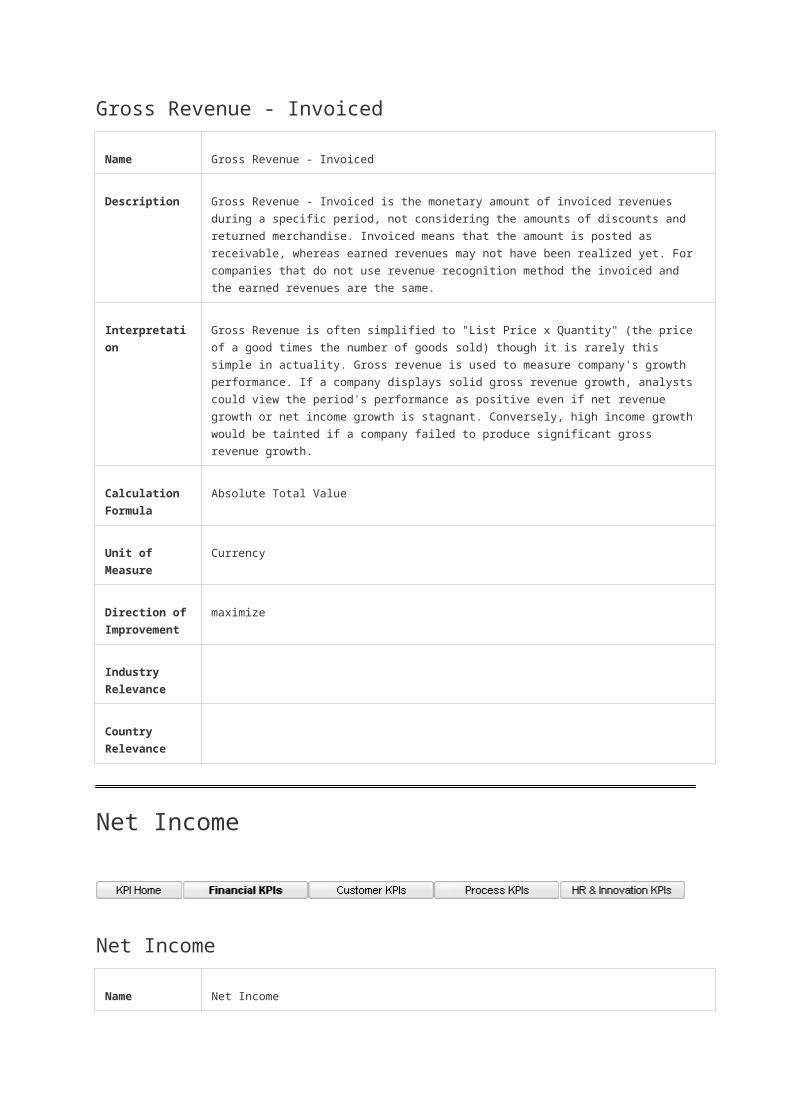
Description Gross Revenue - Invoiced is the monetary amount of invoiced revenues during a specific period,
not considering the amounts of discounts and returned merchandise. Invoiced means that the
amount is posted as receivable, whereas earned revenues may not have been realized yet. For
companies that do not use revenue recognition method the invoiced and the earned revenues are
the same.
Interpretation Gross Revenue is often simplified to "List Price x Quantity" (the price of a good times the number
of goods sold) though it is rarely this simple in actuality. Gross revenue is used to measure
company's growth performance. If a company displays solid gross revenue growth, analysts could
view the period's performance as positive even if net revenue growth or net income growth is
stagnant. Conversely, high income growth would be tainted if a company failed to produce
significant gross revenue growth.
Calculation
Formula
Absolute Total Value
Unit of Measure Currency
Direction of
Improvement
maximize
Industry
Relevance
Country
Relevance
Net Income
Net Income
Name Net Income
Description Net income is a company's total earnings (or profit). Net income is calculated by subtracting costs,
expenses and taxes from the total revenue.
Interpretation Net income is sometimes called the bottom line because it is typically found on the last line of a
company's income statement. It is a useful snapshot of how profitable the company is over a
period of time. If a company's total expenses exceed its total revenues for a certain period, it can
be said to have a net loss. If revenues and expenses should turn out to be equal, the company will
have broken even. The change in net income reflects the trend of company's performance. In

general, when a company's net income is negative or is fairly low, this could suggest a myriad of
problems, ranging from inadequacies in customer or expenses management to unfavorable
accounting methods. Net income varies greatly from company to company and from industry to
industry. Generally, comparisons are most meaningful among companies within the same industry.
In addition to providing information on its own, net income is also frequently used to calculate other
figures in financial ratios in order to provide further information about a company's overall health,
for example, earnings per share, return on stockholder's equity. Note: As net income can be
changed considerably by various items such as changes in accounting principles, special items
and sales of discontinues operations, Earnings before interest and tax is more accuracy indicator
when analyzing business operating performance.
Calculation
Formula
Absolute Total Value from Income Statement
Unit of Measure Currency
Direction of
improvement
maximize
Industry
Relevance
Generic
Country
Relevance
Generic
Net Incoming Orders
Net Incoming Orders
Name Net Incoming Orders
Description Net Incoming Orders is the monetary amount of incoming sales and service orders during a
specific period, considering discounts and returned merchandise. It can be used for revenue
estimates and forecasting purposes.
Interpretation Net Incoming Orders is one of key indicators to monitor the sales activities occurring within
organization. As discounts and returned are included in net incoming orders, it is more precise
than gross incoming order in monitoring sales amount and comparing with net revenue invoiced
later. By analyzing the trend of net incoming orders, sales organization can optimize the sales
management resource, sales strategy, promotion campaign to achieve superior performance.
Stable growth of net incoming orders indicates that company has good sales perspective. It shows

that the product is gaining market share. If the net incoming order is steady over a period of time,
this generally means that the product has reached its maturity stage and demand is level.
Calculation
Formula
Net Incoming Orders = (Gross Incoming Orders) - (Sales Deductions) + (Merchandise Returned
from Credit) + (Allowances for Damaged or Missing Goods) + (Freight Out) + (Cash Discounts)
Unit of Measure Currency
Direction of
Improvement
maximize
Industry
Relevance
Generic
Country
Relevance
Generic
Net Operating Profit after Tax (NOPAT)
Net Operating Profit after Tax (NOPAT)
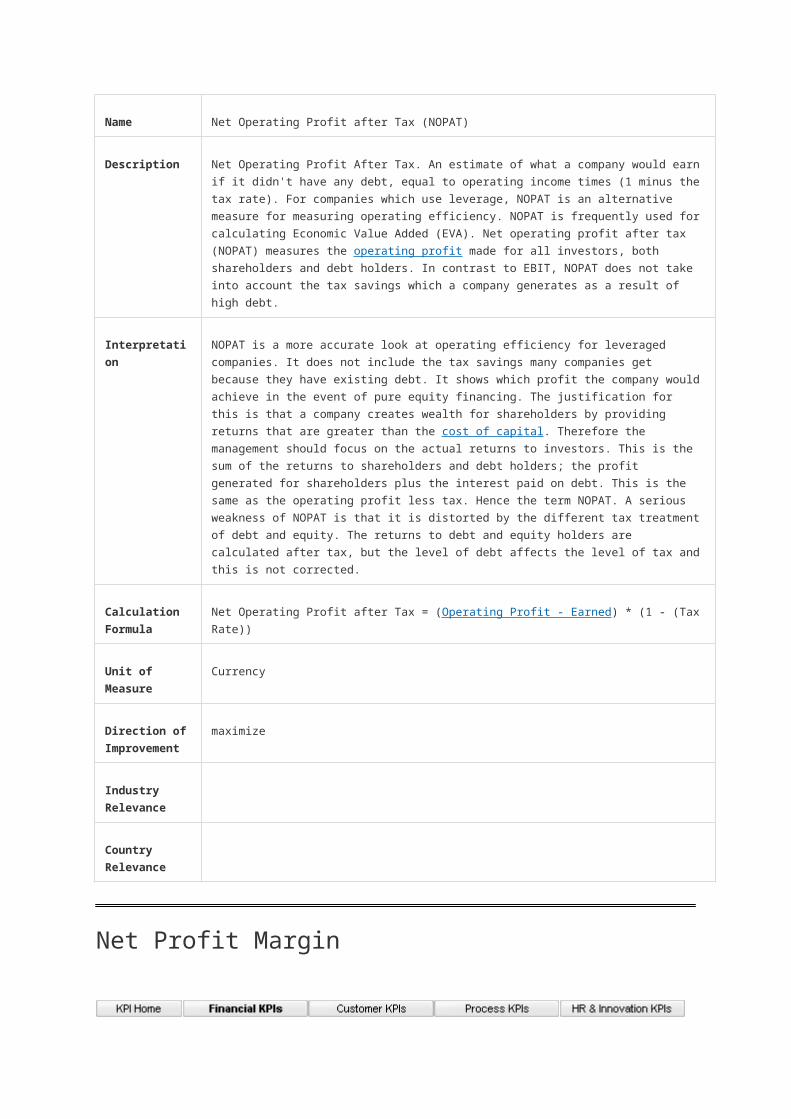
Name Net Operating Profit after Tax (NOPAT)
Description Net Operating Profit After Tax. An estimate of what a company would earn if it didn't have any
debt, equal to operating income times (1 minus the tax rate). For companies which use leverage,
NOPAT is an alternative measure for measuring operating efficiency. NOPAT is frequently used
for calculating Economic Value Added (EVA). Net operating profit after tax (NOPAT) measures the
operating profit made for all investors, both shareholders and debt holders. In contrast to EBIT,
NOPAT does not take into account the tax savings which a company generates as a result of high
debt.
Interpretation NOPAT is a more accurate look at operating efficiency for leveraged companies. It does not
include the tax savings many companies get because they have existing debt. It shows which
profit the company would achieve in the event of pure equity financing. The justification for this is
that a company creates wealth for shareholders by providing returns that are greater than the cost
of capital. Therefore the management should focus on the actual returns to investors. This is the
sum of the returns to shareholders and debt holders; the profit generated for shareholders plus the
interest paid on debt. This is the same as the operating profit less tax. Hence the term NOPAT. A
serious weakness of NOPAT is that it is distorted by the different tax treatment of debt and equity.
The returns to debt and equity holders are calculated after tax, but the level of debt affects the
level of tax and this is not corrected.
Calculation
Formula
Net Operating Profit after Tax = (Operating Profit - Earned) * (1 - (Tax Rate))
Unit of Measure Currency
Direction of
Improvement
maximize
Industry
Relevance
Country
Relevance
Net Profit Margin
Net Profit Margin
Name Net Profit Margin
Description This ratio compares Net Income with Net Revenue. It comes as close as possible to summing-up
in a single figure how efficiently managers run the business.
Also known as Contribution Margin 3.
Interpretation Measured as Net profit divided by net revenues, often expressed as a percentage. This number is
an indication of how effective a company is at cost control. The higher the net profit margin is, the
more effective the company is at converting revenue into actual profit. A low-cost company in an
industry would generally have a higher net profit margin. Since companies tend to sell the same
product at roughly the same price (adjusted for quality differences), lower costs would be reflected
in a higher net profit margin. Lower cost companies also have a strategic advantage in a
competitive price war, because they have the ability to undercut their competitors by cutting prices
in order to gain market share and potentially drive higher cost firms out of business. Companies
clearly exist to expand their profits. But while increasing the absolute amount of dollar profit is
desirable, it has minimal significance unless it is related to its source. This is why companies use
measures such as net profit margin. The net profit margin is a good way of comparing companies
in the same industry, since such companies are generally subject to similar business conditions.
However, the net profit margins are also a good way to to compare companies in different
industries in order to gauge which industries are relatively more profitable.
Calculation
Formula
Net Profit Margin = ((Net Income) / (Net Revenue - Earned)) * 100%
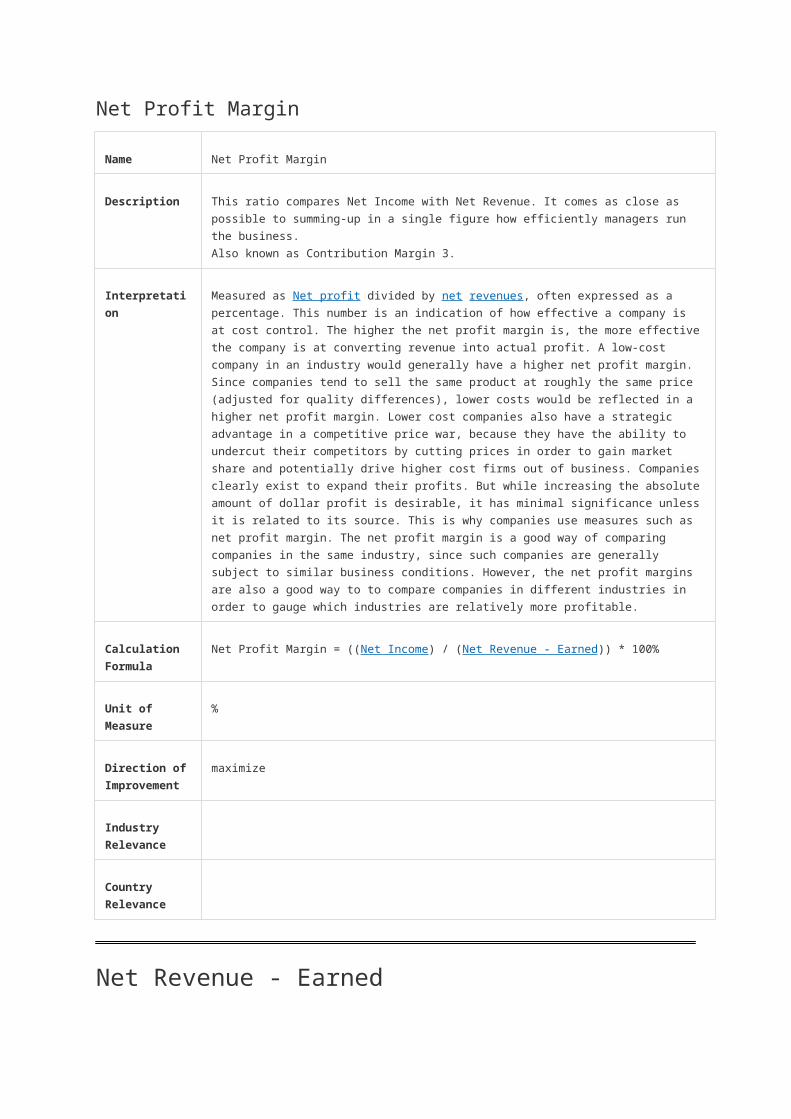
Unit of Measure %
Direction of
Improvement
maximize
Industry
Relevance
Country
Relevance
Net Revenue - Earned
Net Revenue - Earned
Name Net Revenue - Earned
Description Net Revenue - earned is a monetary amount of financial revenues during a specific period,
considering the amounts of discounts and returned merchandise (in contrary to Gross Revenue,
which does not consider these factors). Earned means that the revenues are realized and hence
relevant for the income statement.
Interpretation Net Revenue is a crucial part of any financial analysis. It represents the total finance revenue the
company collected for any goods provided and/or services performed after deducting sales return
and sales discount. Stable growth of net revenue indicates that company is in goods financial
standing. It shows that the product is gaining market share. If the company reports steady net
revenue over a period of time, this generally means that the product has reached its maturity stage
and demand is level.
Calculation
Formula
Net Revenue-Earned = (Gross Revenue - Earned) - ((Sales Deductions) + (Merchandise Returned
from Credit) + (Allowances for Damaged or Missing Goods) + (Freight Out) + (Cash Discounts))
Unit of Measure Currency
Direction of
Improvement
maximize
Industry
Relevance
Generic
Country
Relevance
Generic
Net Revenue - Invoiced
Net Revenue - Invoiced
Name Net Revenue - Invoiced
Description The monetary amount of invoiced revenues during a specific period, considering the amounts of
discounts and returned merchandise. Invoiced means that the amount is posted as receivable,
whereas earned revenues may not have been realized yet. For companies that do not use revenue
recognition method the invoiced and the earned revenues are the same.
Interpretation Net Revenue is a crucial part of any financial analysis. It represents the total finance revenue the
company collected for any goods provided and/or services performed after deducting sales return
and sales discount. Stable growth of net revenue indicates that company is in goods financial
standing. It shows that the product is gaining market share. If the company reports steady net
revenue over a period of time, this generally means that the product has reached its maturity stage
and demand is level.
Calculation
Formula
Net Revenue-Invoiced = (Gross Revenue - Invoiced) - ((Sales Deductions) + ( Merchandise
Returned from Credit) + (Allowances for Damaged or Missing Goods) + (Freight Out) + (Cash
Discounts))
Unit of Measure Currency
Direction of
Improvement
maximize
Industry
Relevance
Country
Relevance
Net Revenue per Full Time Equivalent (FTE)
Net Revenue per Full Time Equivalent (FTE)
Name Net Revenue per Full Time Equivalent (FTE)
Description Net Revenue per Full Time Equivalent is calculated as a company's total net revenue --earned
divided by the number of its full time equivalent. It shows how much revenue each regular
employee generates. This ratio provides information on a company's efficiency within the peer
group.
Interpretation FTE or Full Time Equivalent is a unit of measure of an employee's or group's productivity. An FTE
of 1.0 means that the person, or group of people, is equivalent to a full-time worker. A person who
works half-time is counted as 0.5 FTE. FTE does not include contractual, temporary, or permanent
seasonal positions. An example of group with a full-time billing manager and a clerk who assists
him/her for about 10 hours/week has 1.25 FTE employees. (1 full-time + (40 hours/10 hours)) =
1.25 Net Revenue per Full Time Equivalent is basic measure of productivity. It is useful in
determining whether a corporation is being run efficiently. This ratio is very industry dependent.
Labor intensive businesses generally have low net revenue per FTE. When compared to the other
companies within same industry, it instantly gives a relative comparison of operational efficiency.
The higher the net revenue per FTE, the more efficient the operation, and therefore the more
sustainable and profitable. Another way to look at this is to look at the trend of specific companies.
If the revenue per FTE is stable over several years, it can be an indication that the business model
is still working well. Annual increase in revenue per FTE reveals the extent of productivity growth.
If the revenue per FTE is going down over time, it is an indication that the business is becoming
less efficient.
Calculation
Formula
Net Revenue per Full Time Equivalent = (Net Revenue - Earned) / (Full Time Equivalent)
Unit of Measure Currency
Direction of
Improvement
maximize
Industry
Relevance
Generic
Country
Relevance
Generic

Operating Profit - Earned
Operating Profit - Earned
Name Operating Profit - Earned
Description Operating Profit - Earned resulting from substracting operating expenses from Gross Profit-
Earned. It equals to the total operating result before interest, taxes and the financial result in the
Income Statement. * * * * Operating Profit excludes income and expenditure from unusual, non-
recurring or discontinued activities. In the US the ratio is also known as EBIT. Note: Operating
Profit is retrieved from the contribution margin analysis, while EBIT is from another data source,
income statement! Therefore this KPI is listed individually. > See "EBIT"
Interpretation Operating Profit is one of the most significant indicators of the company's profitability. It represents
the profit of a company before interest expenses and income taxes. Operating Profit is more focus
on the operating business itself, as it excludes income and expenditure from unusual activities,
and also interest income and expense, as well as taxes related to profitability are mostly the result
of factors. The figures are often used to gauge the financial performance of companies with high
levels of debt and interest expenses. From absolute number perspective, it shows how much profit
the company generates in order to be able to pay interest, taxes and dividends. The larger the
Operating Profit value, the more profitable the company is likely to be. The growth rate of
Operating Profit can be used to evaluate the company's growth. Sequential Operating Profit
increase is mostly due to higher sales and better operational performance. Operating Profit decline
could be mainly due to reduced revenue or increased manufacturing cost and operation costs.
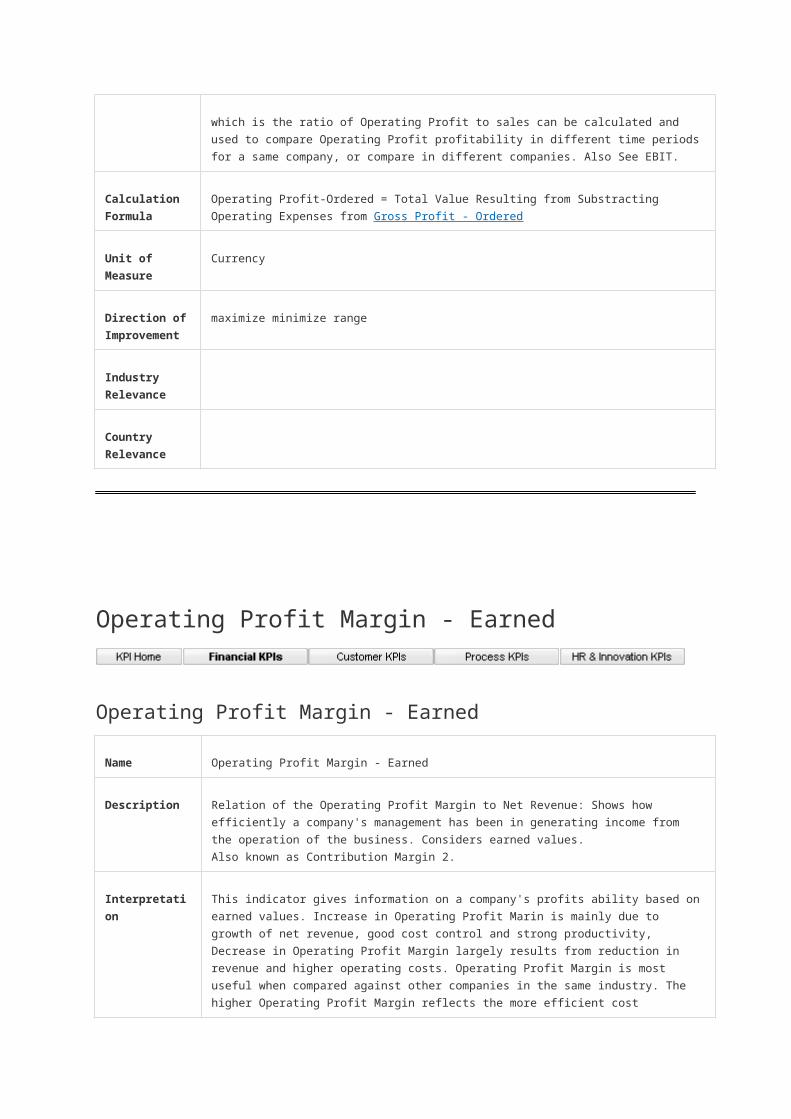
Based on Operating Profit, Operating Profit Margin which is the ratio of Operating Profit to sales
can be calculated and used to compare Operating Profit profitability in different time periods for a
same company, or compare in different companies. Also See EBIT.
Calculation
Formula
Operating Profit-Earned = Total Value Resulting from Substracting Operating Expenses from
Gross Profit - Earned
Unit of Measure Currency
Direction of
Improvement
maximize
Industry
Relevance
Country
Relevance
Operating Profit - Invoiced
Operating Profit - Invoiced
Name Operating Profit - Invoiced
Description Operating Profit - Invoiced resulting from substracting operating expenses from Gross Profit-
Invoiced. * * Operating Profit excludes income and expenditure from unusual, non-recurring or
discontinued activities. In the US the ratio is also known as EBIT. Note: Operating Profit is
retrieved from the contribution margin analysis, while EBIT is from another data source, income
statement! Therefore this KPI is listed individually. > See "EBIT" Invoiced means that Operating
Profit is only relevant to goods and services invoiced.
Interpretation Operating Profit is one of the most significant indicators of the company's profitability. It represents
the profit of a company before interest expenses and income taxes. Operating Profit is more focus
on the operating business itself, as it excludes income and expenditure from unusual activities,
and also interest income and expense, as well as taxes related to profitability are mostly the result
of factors. The figures are often used to gauge the financial performance of companies with high
levels of debt and interest expenses. From absolute number perspective, it shows how much profit
the company generates in order to be able to pay interest, taxes and dividends. The larger the
Operating Profit value, the more profitable the company is likely to be. The growth rate of
Operating Profit can be used to evaluate the company's growth. Sequential Operating Profit
increase is mostly due to higher sales and better operational performance. Operating Profit decline
could be mainly due to reduced revenue or increased manufacturing cost and operation costs.
Based on Operating Profit, Operating Profit Margin which is the ratio of Operating Profit to sales
can be calculated and used to compare Operating Profit profitability in different time periods for a
same company, or compare in different companies. Also See EBIT.
Calculation
Formula
Operating Profit-Invoiced = Total Value Resulting from Substracting Operating Expenses from
Gross Profit - Invoiced
Unit of Measure Currency
Direction of
Improvement
maximize
Industry
Relevance
Country
Relevance

Operating Profit - Ordered
Operating Profit - Ordered
Name Operating Profit - Ordered
Description Operating Profit - Ordered resulting from substracting operating expenses from Gross Profit-
Ordered. The Operating Profit ordered is used to determine the Operating Profit Margin ordered.
The ordered values are useful to calculate Income Statement forecasts.
Interpretation Operating Profit is one of the most significant indicators of the company's profitability. It represents
the profit of a company before interest expenses and income taxes. Operating Profit is more focus
on the operating business itself, as it excludes income and expenditure from unusual activities,
and also interest income and expense, as well as taxes related to profitability are mostly the result
of factors. The figures are often used to gauge the financial performance of companies with high
levels of debt and interest expenses. From absolute number perspective, it shows how much profit
the company generates in order to be able to pay interest, taxes and dividends. The larger the
Operating Profit value, the more profitable the company is likely to be. The growth rate of
Operating Profit can be used to evaluate the company's growth. Sequential Operating Profit
increase is mostly due to higher sales and better operational performance. Operating Profit decline
could be mainly due to reduced revenue or increased manufacturing cost and operation costs.
Based on Operating Profit, Operating Profit Margin which is the ratio of Operating Profit to sales
can be calculated and used to compare Operating Profit profitability in different time periods for a
same company, or compare in different companies. Also See EBIT.
Calculation
Formula
Operating Profit-Ordered = Total Value Resulting from Substracting Operating Expenses from
Gross Profit - Ordered
Unit of Measure Currency
Direction of
Improvement
maximize minimize range
Industry
Relevance
Country
Relevance
Operating Profit Margin - Earned
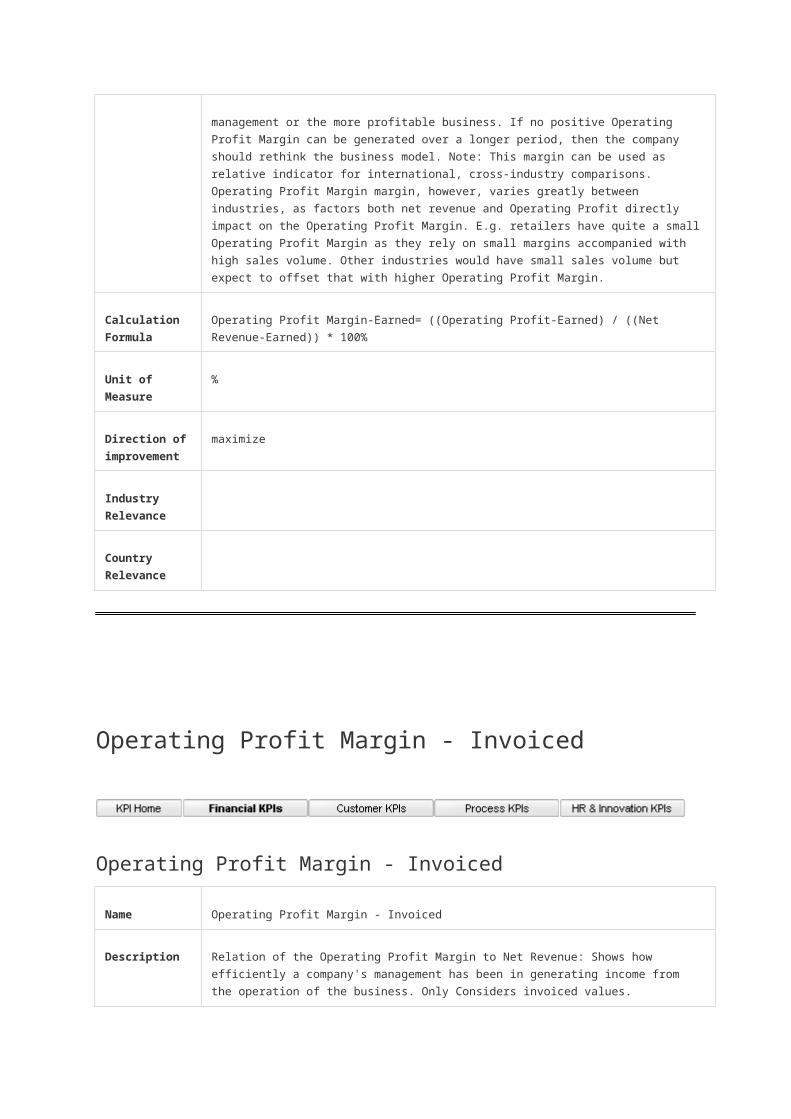
Operating Profit Margin - Earned
Name Operating Profit Margin - Earned
Description Relation of the Operating Profit Margin to Net Revenue: Shows how efficiently a company's
management has been in generating income from the operation of the business. Considers earned
values.
Also known as Contribution Margin 2.
Interpretation This indicator gives information on a company's profits ability based on earned values. Increase in
Operating Profit Marin is mainly due to growth of net revenue, good cost control and strong
productivity, Decrease in Operating Profit Margin largely results from reduction in revenue and
higher operating costs. Operating Profit Margin is most useful when compared against other
companies in the same industry. The higher Operating Profit Margin reflects the more efficient cost
management or the more profitable business. If no positive Operating Profit Margin can be
generated over a longer period, then the company should rethink the business model. Note: This
margin can be used as relative indicator for international, cross-industry comparisons. Operating
Profit Margin margin, however, varies greatly between industries, as factors both net revenue and
Operating Profit directly impact on the Operating Profit Margin. E.g. retailers have quite a small
Operating Profit Margin as they rely on small margins accompanied with high sales volume. Other
industries would have small sales volume but expect to offset that with higher Operating Profit
Margin.
Calculation
Formula
Operating Profit Margin-Earned= ((Operating Profit-Earned) / ((Net Revenue-Earned)) * 100%
Unit of Measure %
Direction of
improvement
maximize
Industry
Relevance
Country
Relevance
Operating Profit Margin - Invoiced
Operating Profit Margin - Invoiced
Name Operating Profit Margin - Invoiced
Description Relation of the Operating Profit Margin to Net Revenue: Shows how efficiently a company's
management has been in generating income from the operation of the business. Only Considers
invoiced values.
Interpretation This indicator gives information on a company's profits ability based on invoiced values. Increase
in Operating Profit Marin is mainly due to growth of net revenue, good cost control and strong
productivity, Decrease in Operating Profit Margin largely results from reduction in revenue and
higher operating costs. Operating Profit Margin is most useful when compared against other
companies in the same industry. The higher Operating Profit Margin reflects the more efficient cost
management or the more profitable business. If no positive Operating Profit Margin can be
generated over a longer period, then the company should rethink the business model. Note: This
margin can be used as relative indicator for international, cross-industry comparisons. Operating
Profit Margin margin, however, varies greatly between industries, as factors both net revenue and
Operating Profit directly impact on the Operating Profit Margin. E.g. retailers have quite a small
Operating Profit Margin as they rely on small margins accompanied with high sales volume. Other
industries would have small sales volume but expect to offset that with higher Operating Profit
Margin.
Calculation
Formula
Operating Profit Margin-Invoiced = ((Operating Profit-Invoiced) / (Net Revenue-Invoiced)) * 100%
Unit of Measure %
Direction of
Improvement
maximize
Industry
Relevance
Country
Relevance
Operating Profit Margin - Ordered
Operating Profit Margin - Ordered
Name Operating Profit Margin - Ordered
Description Relation of the Operating Profit Margin to Net Revenue: Shows how efficiently a company's
management has been in generating income from the operation of the business. Only Considers
ordered values.
Interpretation This indicator gives information on a company's profits ability based on ordered values. Increase in
Operating Profit Marin is mainly due to growth of net revenue, good cost control and strong
productivity, Decrease in Operating Profit Margin largely results from reduction in revenue and
higher operating costs. Operating Profit Margin is most useful when compared against other
companies in the same industry. The higher Operating Profit Margin reflects the more efficient cost
management or the more profitable business. If no positive Operating Profit Margin can be
generated over a longer period, then the company should rethink the business model. Note: This
margin can be used as relative indicator for international, cross-industry comparisons. Operating
Profit Margin margin, however, varies greatly between industries, as factors both net revenue and
Operating Profit directly impact on the Operating Profit Margin. E.g. retailers have quite a small
Operating Profit Margin as they rely on small margins accompanied with high sales volume. Other
industries would have small sales volume but expect to offset that with higher Operating Profit
Margin.
Calculation
Formula
Operating Profit Margin - Ordered =
(Operating Profit - Ordered / Net Revenue - Ordered) * 100%
Unit of Measure %
Direction of
Improvement
maximize
Industry
Relevance
Country
Relevance
Tools
o Business KPIs1. Business KPIs2. Process

Perfect (Purchase) Order
Skip to end of metadata Page restrictions apply Added by Christine Meyer, last edited by Alon Mizrahi on Oct 31, 2011 (view change) show comment
Go to start of metadata
Name Perfect (Purchase) Order
Description
Calculates the percentage of perfect purchase orders among all purchase orders.
The following criteria apply to a perfect order:
right quantitiy
damage free
arrives on-time
arrives at the right location
is filled completly on the first call
is entered correctly
is communicated via a customer-specific medium (e.g. EDI, fax, phone, internet etc)
has no invoicing or collection errors.
Interpretation
This KPI measures the ability of a vendor to deliver to the customers' wishes.
Perfect Order Characteristics:
has the right amount of products; is damage free; arrives on-time; arrives at the right location; is
filled completly on the first call; in entered correctly; is communicated via a customer-specific
medium (e.g. EDI, fax, phone, internet etc); has no invoicing or collection errors.
Calculation
Formula Perfect Order Calculation:
Order Fill-Rate * Order Shipping Accuracy * Damage free order percentage *On-Time Order
Percentage * claim free Order Percentage * Order Entry Accuracy * Order Comm Accuracy *
Order Doc Accuracy
Example Perfect Order Calculation:
has the right amount of products; 97%
is damage free; 98%
arrives on-time; 93%
arrives at the right location; 96%
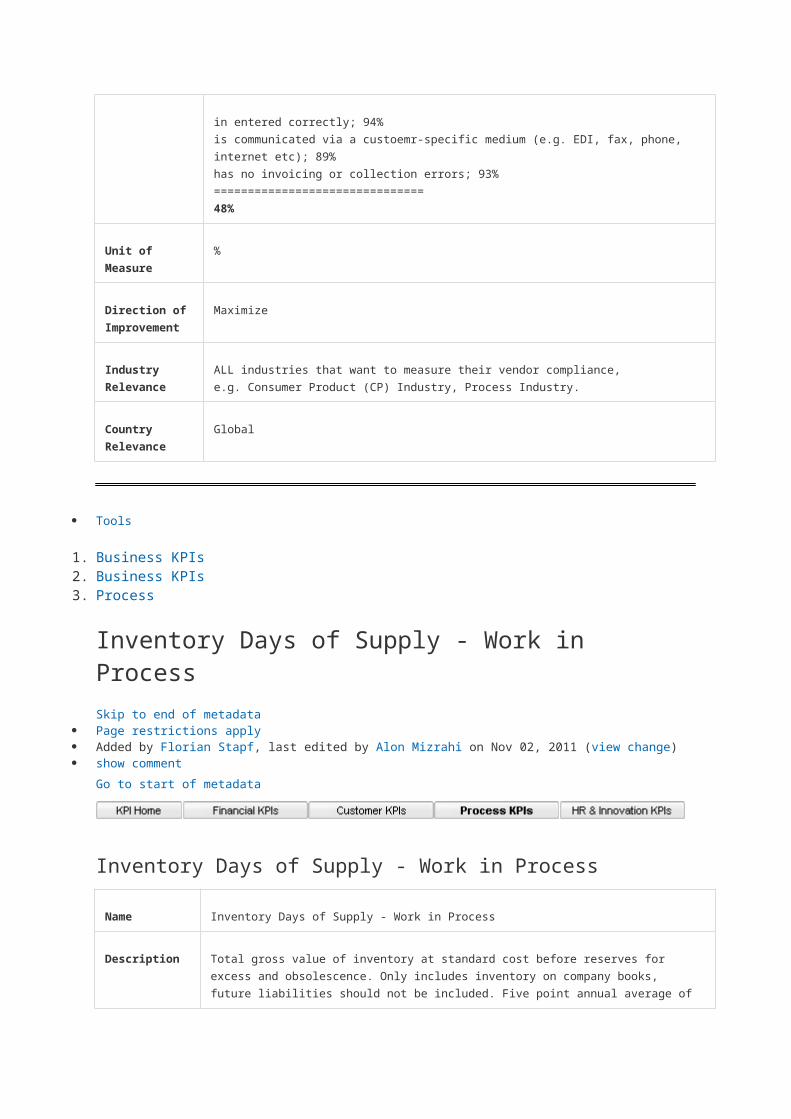
is filled completly on the first call; 72%
in entered correctly; 94%
is communicated via a custoemr-specific medium (e.g. EDI, fax, phone, internet etc); 89%
has no invoicing or collection errors; 93%
===============================
48%

Unit of Measure %
Direction of
Improvement
Maximize
Industry
Relevance
ALL industries that want to measure their vendor compliance,
e.g. Consumer Product (CP) Industry, Process Industry.
Country
Relevance
Global
Tools
o Business KPIs1. Business KPIs2. Process
Inventory Days of Supply - Work in Process
Skip to end of metadata Page restrictions apply Added by Florian Stapf, last edited by Alon Mizrahi on Nov 02, 2011 (view change) show comment
Go to start of metadata
Inventory Days of Supply - Work in Process
Name Inventory Days of Supply - Work in Process
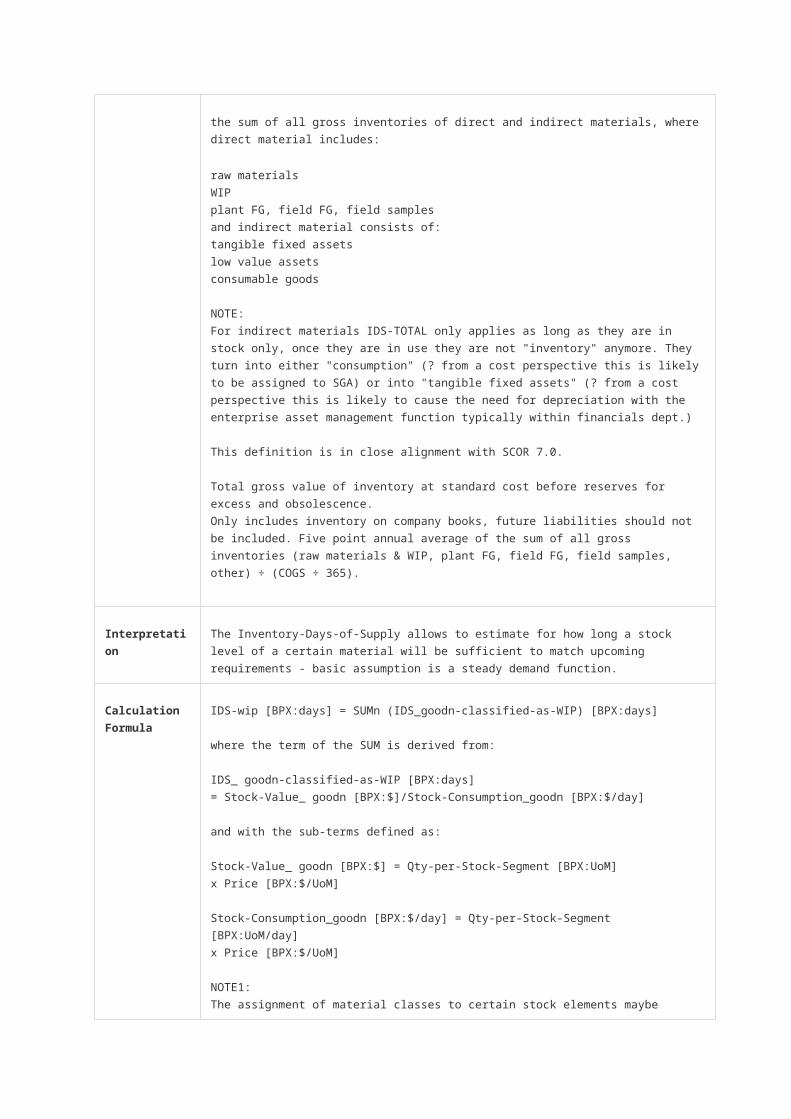
Description Total gross value of inventory at standard cost before reserves for excess and obsolescence. Only
includes inventory on company books, future liabilities should not be included. Five point annual
average of the sum of all gross inventories of direct and indirect materials, where direct material
includes:
raw materials
WIP
plant FG, field FG, field samples
and indirect material consists of:
tangible fixed assets
low value assets
consumable goods
NOTE:
For indirect materials IDS-TOTAL only applies as long as they are in stock only, once they are in
use they are not "inventory" anymore. They turn into either "consumption" (? from a cost

perspective this is likely to be assigned to SGA) or into "tangible fixed assets" (? from a cost
perspective this is likely to cause the need for depreciation with the enterprise asset management
function typically within financials dept.)
This definition is in close alignment with SCOR 7.0.
Total gross value of inventory at standard cost before reserves for excess and obsolescence.
Only includes inventory on company books, future liabilities should not be included. Five point
annual average of the sum of all gross inventories (raw materials & WIP, plant FG, field FG, field
samples, other) ÷ (COGS ÷ 365).
Interpretation The Inventory-Days-of-Supply allows to estimate for how long a stock level of a certain material will
be sufficient to match upcoming requirements - basic assumption is a steady demand function.
Calculation
Formula
IDS-wip [BPX:days] = SUMn (IDS_goodn-classified-as-WIP) [BPX:days]
where the term of the SUM is derived from:
IDS_ goodn-classified-as-WIP [BPX:days]
= Stock-Value_ goodn [BPX:$]/Stock-Consumption_goodn [BPX:$/day]
and with the sub-terms defined as:
Stock-Value_ goodn [BPX:$] = Qty-per-Stock-Segment [BPX:UoM]
x Price [BPX:$/UoM]
Stock-Consumption_goodn [BPX:$/day] = Qty-per-Stock-Segment [BPX:UoM/day]
x Price [BPX:$/UoM]
NOTE1:
The assignment of material classes to certain stock elements maybe customer specific and needs
to be configurable. Details can be derived from Figure 2 and Figure 3.
NOTE2:
It is assumed that the product master contains:
a flag that indicates, what kind of material class a product belongs to (e.g. raw material, semi-
finished product, finished good etc.)
a suitable price that contains actual data per period, since the stock consumption always requires
a period to be specified, the lowest level of granularity will typically be a day (the calculation will
always relate to the past, so the fixed data may be assumed, no more shifts will happen.)
Unit of Measure days
Direction of
Improvement
Meet target value
Industry ALL industries that incorporate physical goods.
Relevance
Country
Relevance
GLOBAL
Tools
o Business KPIs1. Business KPIs2. Process
Inventory Days of Supply - Raw Material
Skip to end of metadata Page restrictions apply Added by Florian Stapf, last edited by Alon Mizrahi on Nov 02, 2011 (view change) show comment
Go to start of metadata
Inventory Days of Supply - Raw Material
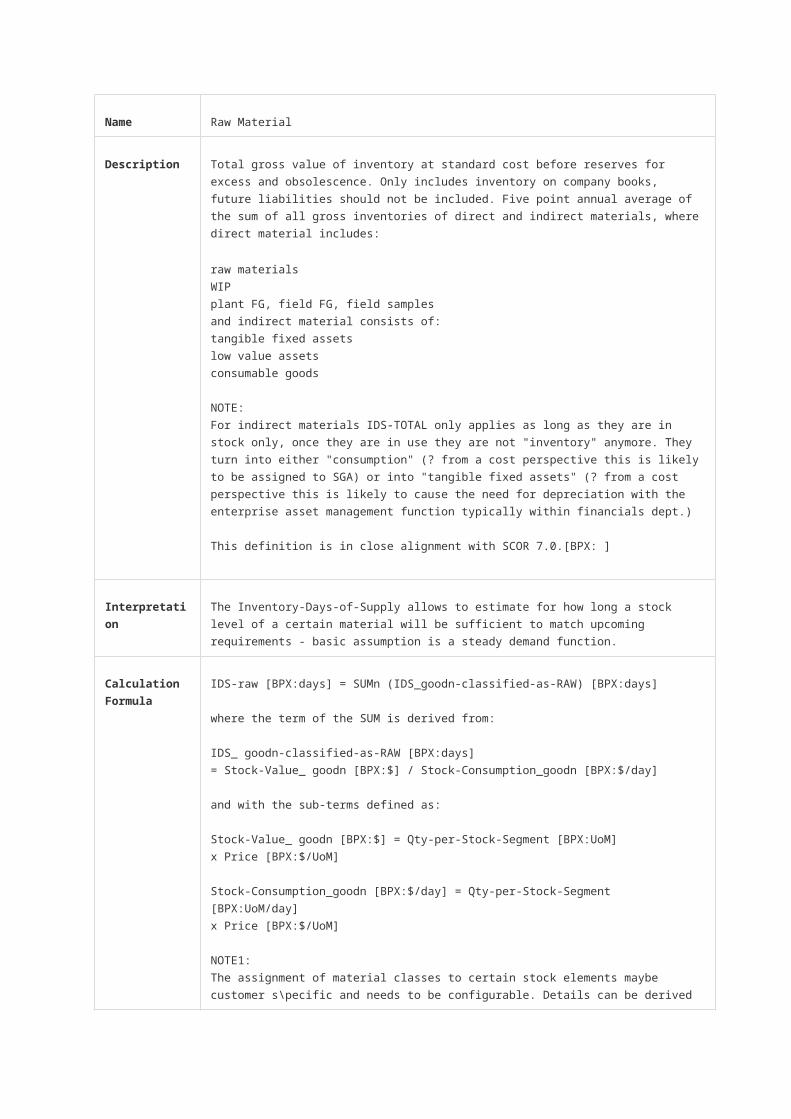
Name Raw Material
Description Total gross value of inventory at standard cost before reserves for excess and obsolescence. Only
includes inventory on company books, future liabilities should not be included. Five point annual
average of the sum of all gross inventories of direct and indirect materials, where direct material
includes:
raw materials
WIP
plant FG, field FG, field samples
and indirect material consists of:
tangible fixed assets
low value assets
consumable goods
NOTE:
For indirect materials IDS-TOTAL only applies as long as they are in stock only, once they are in
use they are not "inventory" anymore. They turn into either "consumption" (? from a cost
perspective this is likely to be assigned to SGA) or into "tangible fixed assets" (? from a cost
perspective this is likely to cause the need for depreciation with the enterprise asset management
function typically within financials dept.)
This definition is in close alignment with SCOR 7.0.[BPX: ]
Interpretation The Inventory-Days-of-Supply allows to estimate for how long a stock level of a certain material will
be sufficient to match upcoming requirements - basic assumption is a steady demand function.
Calculation
Formula
IDS-raw [BPX:days] = SUMn (IDS_goodn-classified-as-RAW) [BPX:days]
where the term of the SUM is derived from:
IDS_ goodn-classified-as-RAW [BPX:days]
= Stock-Value_ goodn [BPX:$] / Stock-Consumption_goodn [BPX:$/day]
and with the sub-terms defined as:
Stock-Value_ goodn [BPX:$] = Qty-per-Stock-Segment [BPX:UoM]
x Price [BPX:$/UoM]
Stock-Consumption_goodn [BPX:$/day] = Qty-per-Stock-Segment [BPX:UoM/day]
x Price [BPX:$/UoM]
NOTE1:
The assignment of material classes to certain stock elements maybe customer s\pecific and needs
to be configurable. Details can be derived from Figure 2 and Figure 3.
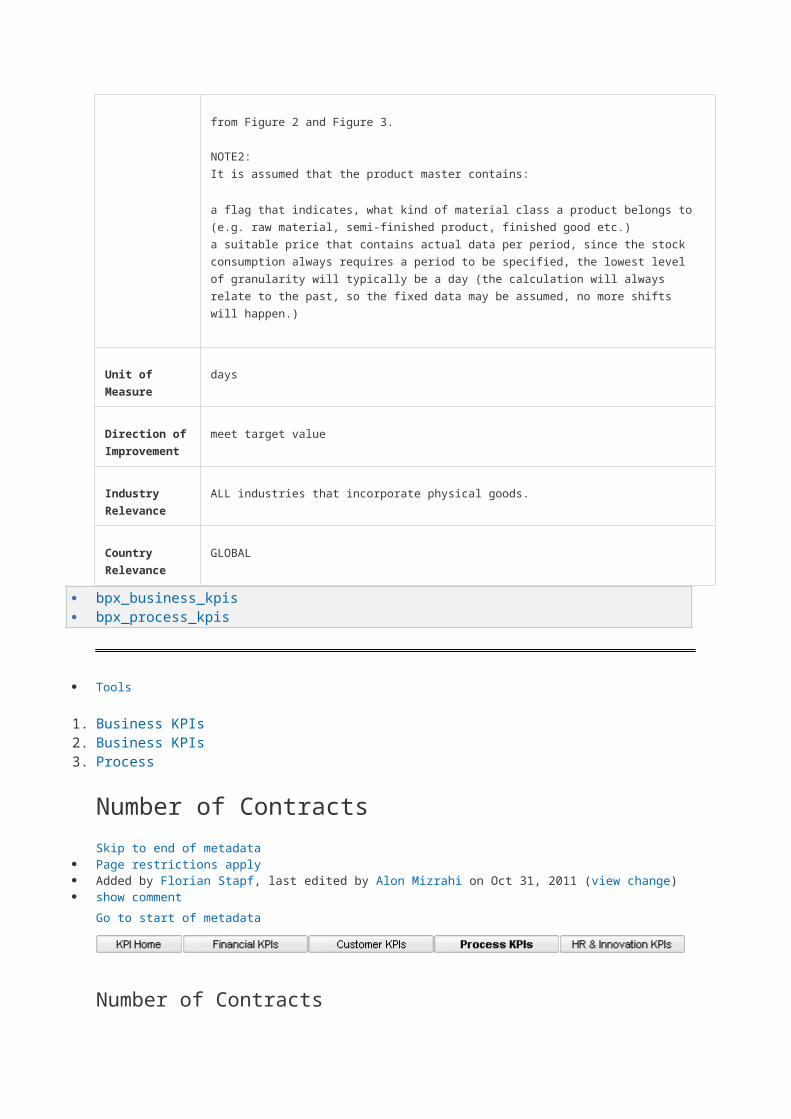
NOTE2:
It is assumed that the product master contains:
a flag that indicates, what kind of material class a product belongs to (e.g. raw material, semi-
finished product, finished good etc.)
a suitable price that contains actual data per period, since the stock consumption always requires
a period to be specified, the lowest level of granularity will typically be a day (the calculation will
always relate to the past, so the fixed data may be assumed, no more shifts will happen.)
Unit of Measure days
Direction of
Improvement
meet target value
Industry
Relevance
ALL industries that incorporate physical goods.
Country
Relevance
GLOBAL
bpx_business_kpis bpx_process_kpis
Tools
o Business KPIs

1. Business KPIs2. Process
Number of Contracts
Skip to end of metadata Page restrictions apply Added by Florian Stapf, last edited by Alon Mizrahi on Oct 31, 2011 (view change) show comment
Go to start of metadata
Number of Contracts
Name Number of Contracts
Description This KPI is defined as the number of maintained purchasing contracts in the system. Only valid
and released contracts are counted.
Interpretation Often the purchasing department wants to control the maximum of purchasing spend. Negotiating
prices and conditions with the supplier and maintaining them in purchasing contracts is the best
way to reach this objective, because then these prices and conditions are available as sources of
supply and can be used for operational purchasing.
Calculation
Formula
Number of Contracts = Number of Valid and Released Contracts Maintained in the System
Unit of Measure number
Direction of
Improvement
maximize
Industry
Relevance
generic
Country
Relevance
generic
1. Business KPIs2. Business KPIs3. Process
Ratio of Purchase Order Items with Product IDS
Skip to end of metadata
Page restrictions apply Added by Florian Stapf, last edited by Alon Mizrahi on Oct 31, 2011 (view change) show comment
Go to start of metadata
Ratio of Purchase Order Items with Product IDS
Name Ratio of Purchase Order Items with Product IDs
Description This KPI is defined as the ratio between the number of purchase order items with reference to a
product ID to the total number of purchase order items. Only sent purchase orders are taken into
account.
Interpretation With this number the buyers get to know if there are many purchase order items with no reference
to a product ID. Very often these purchase orders will have then a free text entry. If the ratio is
low, it is a hint to maintain product master in purchasing, if the purchasing activities shall be
controllable and effective.
Calculation
Formula
Ratio of Purchase Order Items with Product IDs =
((Number of sent purchase order items with a reference to a product ID) / (Total number of sent
purchase order items)) * 100%
Unit of Measure %
Direction of
Improvement
maximize
Industry
Relevance
generic
Country
Relevance
generic
1. Business KPIs2. Business KPIs3. Process
Price Trend
Skip to end of metadata Page restrictions apply Added by Florian Stapf, last edited by Alon Mizrahi on Oct 31, 2011 (view change) show comment
Go to start of metadata
Price Trend
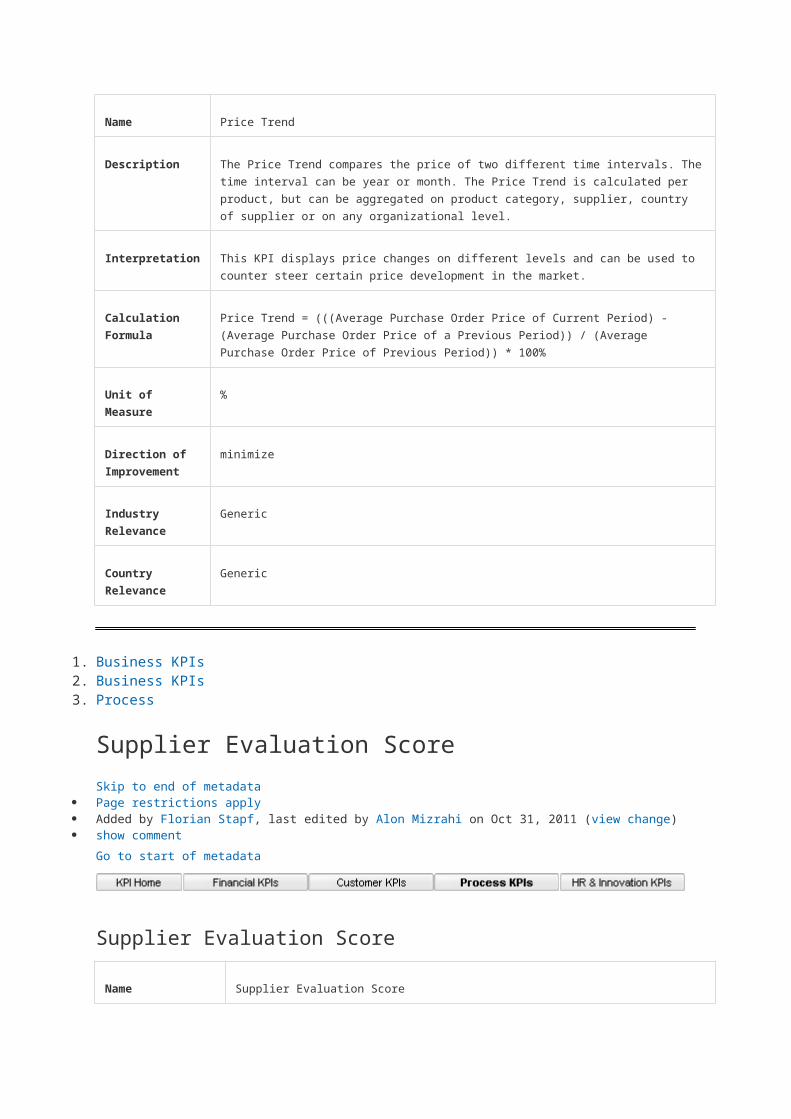
Name Price Trend
Description The Price Trend compares the price of two different time intervals. The time interval can be year
or month. The Price Trend is calculated per product, but can be aggregated on product category,
supplier, country of supplier or on any organizational level.
Interpretation This KPI displays price changes on different levels and can be used to counter steer certain price
development in the market.
Calculation
Formula
Price Trend = (((Average Purchase Order Price of Current Period) - (Average Purchase Order
Price of a Previous Period)) / (Average Purchase Order Price of Previous Period)) * 100%
Unit of Measure %
Direction of
Improvement
minimize
Industry
Relevance
Generic
Country
Relevance
Generic
1. Business KPIs2. Business KPIs3. Process
Supplier Evaluation Score
Skip to end of metadata Page restrictions apply Added by Florian Stapf, last edited by Alon Mizrahi on Oct 31, 2011 (view change) show comment
Go to start of metadata
Supplier Evaluation Score
Name Supplier Evaluation Score

Description The Supplier Evaluation Score is the aggregated result of the manual and automatic
evaluation for a supplier. It is an outcome of the supplier evaluation.
Interpretation This KPI gives an overview how the suppliers perform.
Calculation Formula The calculation of the score is maintained by the user by defining relevant main criteria,
criteria and weighting factors between them.
Unit of Measure %
Direction of
Improvement
maximize
Industry Relevance Generic
Country Relevance Generic
Tools
o Business KPIs1. Business KPIs2. Process
Supplier-On Time Delivery Performance
Skip to end of metadata Page restrictions apply Added by Florian Stapf, last edited by Alon Mizrahi on Oct 31, 2011 (view change) show comment
Go to start of metadata
Supplier-On Time Delivery Performance
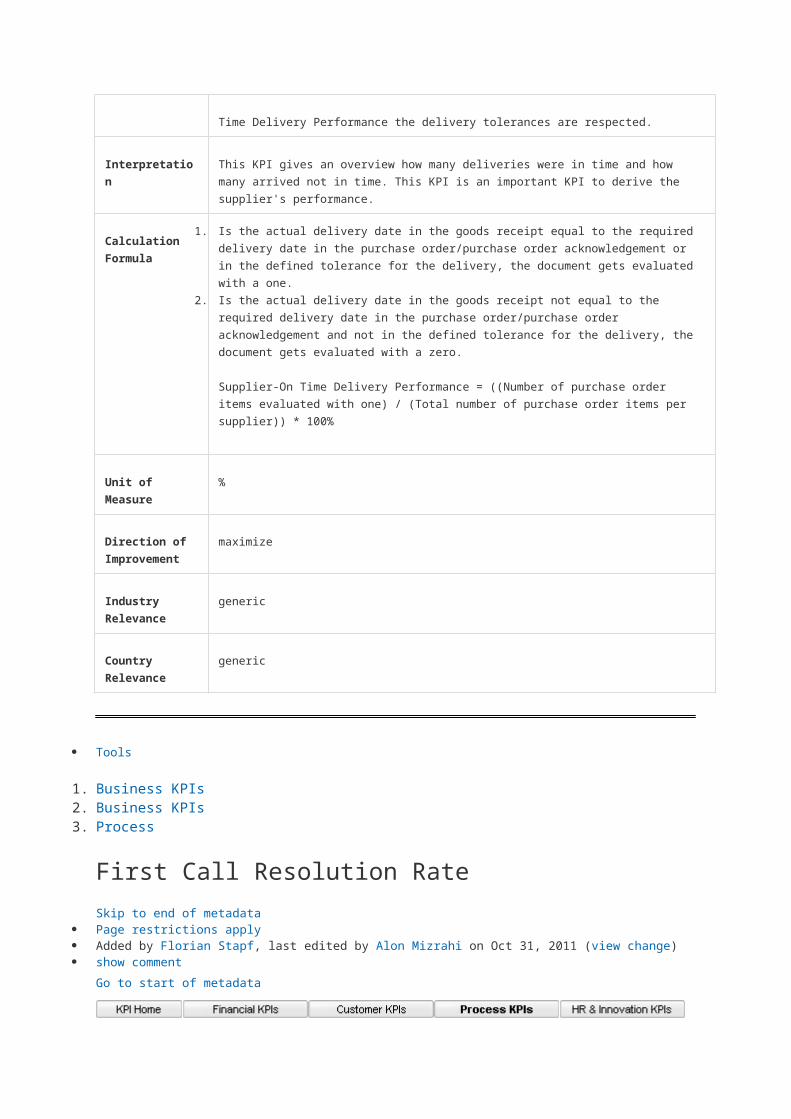
Name Supplier-On Time Delivery Performance
Description The KPI Supplier-On Time Delivery Performance is the comparison of the required delivery date
in the purchase order to the actual goods receipt entry date per supplier. For the calculation of
the Supplier-On Time Delivery Performance the delivery tolerances are respected.
Interpretation This KPI gives an overview how many deliveries were in time and how many arrived not in time.
This KPI is an important KPI to derive the supplier's performance.
Calculation 1. Is the actual delivery date in the goods receipt equal to the required delivery date in the purchase

Formulaorder/purchase order acknowledgement or in the defined tolerance for the delivery, the document
gets evaluated with a one.
2. Is the actual delivery date in the goods receipt not equal to the required delivery date in the
purchase order/purchase order acknowledgement and not in the defined tolerance for the
delivery, the document gets evaluated with a zero.
Supplier-On Time Delivery Performance = ((Number of purchase order items evaluated with one)
/ (Total number of purchase order items per supplier)) * 100%
Unit of Measure %
Direction of
Improvement
maximize
Industry
Relevance
generic
Country
Relevance
generic
Tools
o Business KPIs1. Business KPIs2. Process
First Call Resolution Rate
Skip to end of metadata Page restrictions apply Added by Florian Stapf, last edited by Alon Mizrahi on Oct 31, 2011 (view change) show comment
Go to start of metadata
First Call Resolution Rate
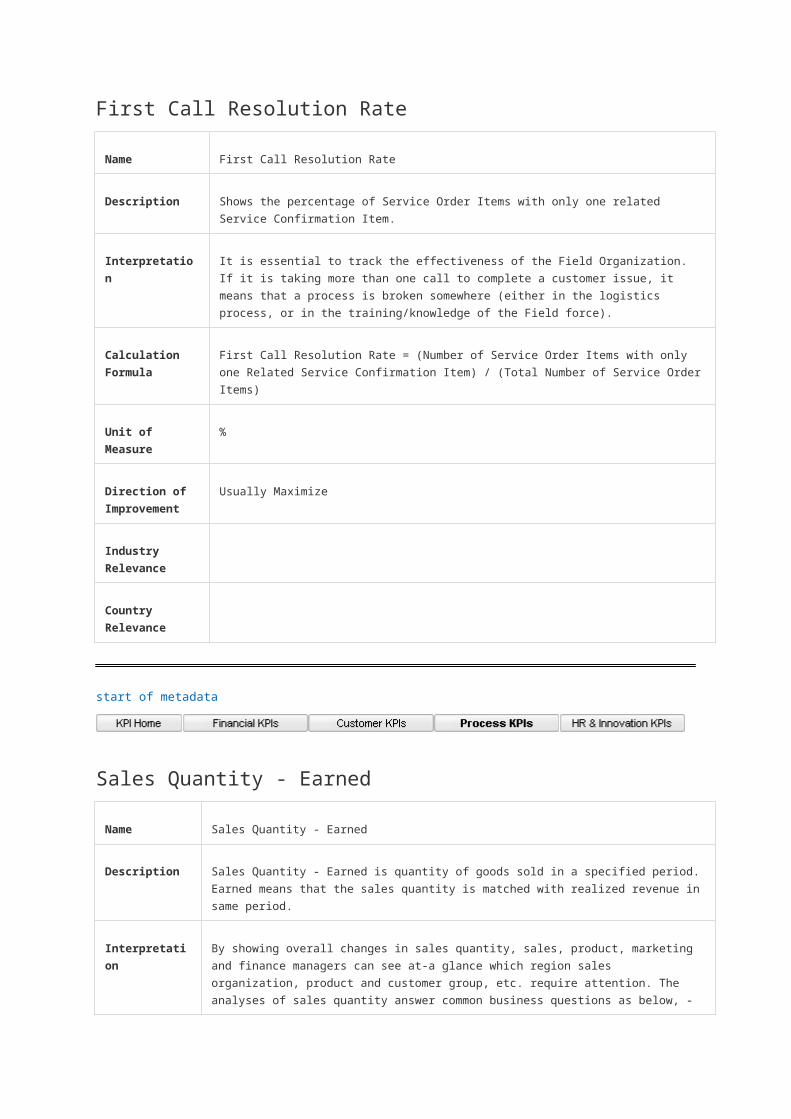
Name First Call Resolution Rate
Description Shows the percentage of Service Order Items with only one related Service Confirmation Item.
Interpretation It is essential to track the effectiveness of the Field Organization. If it is taking more than one call
to complete a customer issue, it means that a process is broken somewhere (either in the
logistics process, or in the training/knowledge of the Field force).
Calculation
Formula
First Call Resolution Rate = (Number of Service Order Items with only one Related Service
Confirmation Item) / (Total Number of Service Order Items)
Unit of Measure %
Direction of
Improvement
Usually Maximize
Industry
Relevance
Country
Relevance
start of metadata
Sales Quantity - Earned
Name Sales Quantity - Earned
Description Sales Quantity - Earned is quantity of goods sold in a specified period. Earned means that the
sales quantity is matched with realized revenue in same period.
Interpretation By showing overall changes in sales quantity, sales, product, marketing and finance managers can
see at-a glance which region sales organization, product and customer group, etc. require
attention. The analyses of sales quantity answer common business questions as below, - Which
products have the greatest sales quantity and the least sales quantity? - What other products are
selling at the same time to the top sales customer? - Which products have declining sales
momentum? - How have sales quantities of product X changed period over period? - What is the
annual sales trend of each product? - How do promotion activities effort in sales quantities? In
general speaking, increase in sales quantity results in sales revenue if sales price and market
requirement remain fairly constant over a period. In reality, however, actual results may be
constrained by various factors, such as promotion campaign, competitors' sales strategy, change
of economics environment etc.
Calculation
Formula
Quantity
Unit of Measure UoM defined in MDM
Direction of
Improvement
maximize

Industry
Relevance
Generic
Country
Relevance
Generic
Tools
o Business KPIs1. Business KPIs2. Process
Sales Quantity - Invoiced
Skip to end of metadata Page restrictions apply Added by Florian Stapf, last edited by Alon Mizrahi on Oct 31, 2011 (view change) show comment
Go to start of metadata
Sales Quantity - Invoiced
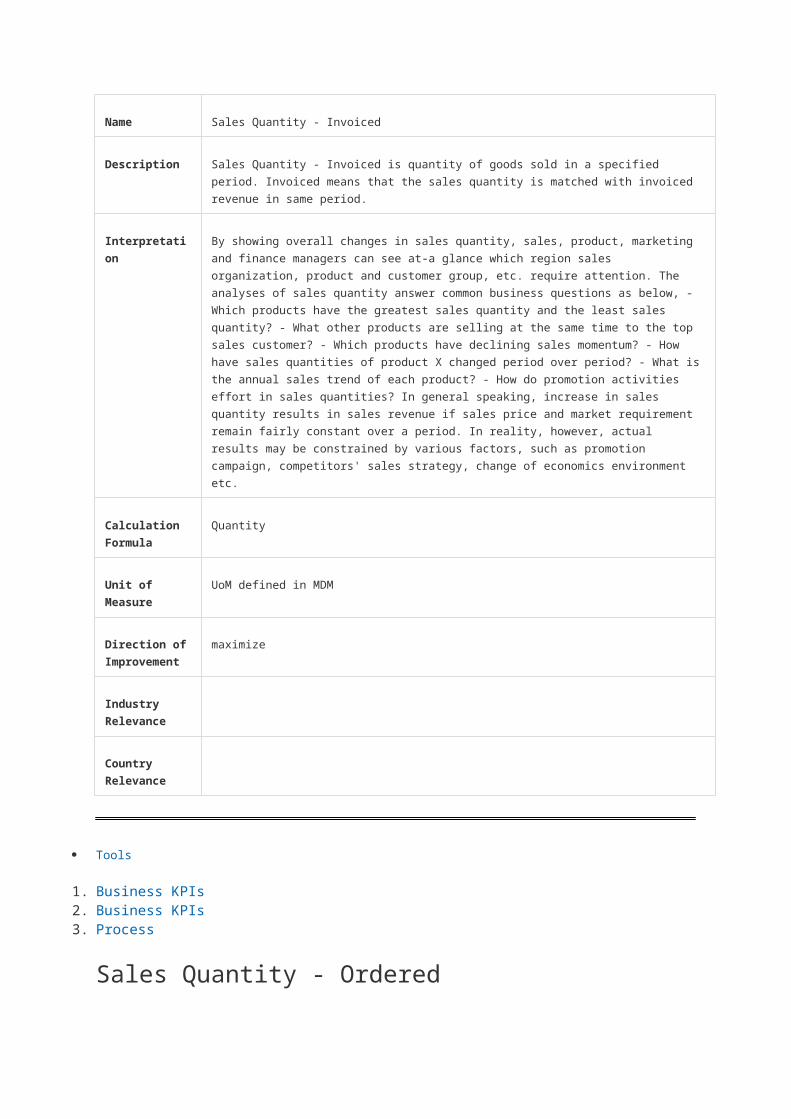
Name Sales Quantity - Invoiced
Description Sales Quantity - Invoiced is quantity of goods sold in a specified period. Invoiced means that the
sales quantity is matched with invoiced revenue in same period.
Interpretation By showing overall changes in sales quantity, sales, product, marketing and finance managers can
see at-a glance which region sales organization, product and customer group, etc. require
attention. The analyses of sales quantity answer common business questions as below, - Which
products have the greatest sales quantity and the least sales quantity? - What other products are
selling at the same time to the top sales customer? - Which products have declining sales
momentum? - How have sales quantities of product X changed period over period? - What is the
annual sales trend of each product? - How do promotion activities effort in sales quantities? In
general speaking, increase in sales quantity results in sales revenue if sales price and market
requirement remain fairly constant over a period. In reality, however, actual results may be
constrained by various factors, such as promotion campaign, competitors' sales strategy, change
of economics environment etc.
Calculation
Formula
Quantity
Unit of Measure UoM defined in MDM
Direction of
Improvement
maximize
Industry
Relevance
Country
Relevance
Tools
o Business KPIs1. Business KPIs2. Process
Sales Quantity - Ordered
Skip to end of metadata Page restrictions apply Added by Florian Stapf, last edited by Alon Mizrahi on Oct 31, 2011 (view change) show comment
Go to start of metadata
Sales Quantity - Ordered
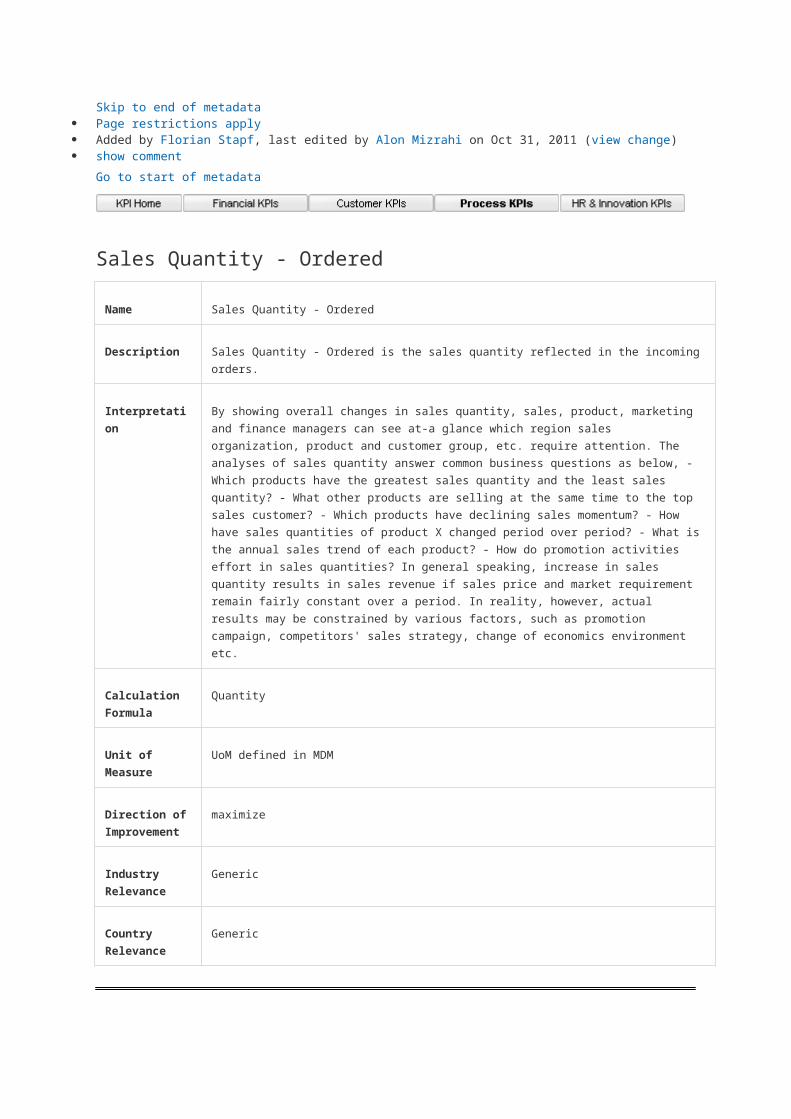
Name Sales Quantity - Ordered
Description Sales Quantity - Ordered is the sales quantity reflected in the incoming orders.
Interpretation By showing overall changes in sales quantity, sales, product, marketing and finance managers can
see at-a glance which region sales organization, product and customer group, etc. require
attention. The analyses of sales quantity answer common business questions as below, - Which
products have the greatest sales quantity and the least sales quantity? - What other products are
selling at the same time to the top sales customer? - Which products have declining sales
momentum? - How have sales quantities of product X changed period over period? - What is the
annual sales trend of each product? - How do promotion activities effort in sales quantities? In
general speaking, increase in sales quantity results in sales revenue if sales price and market
requirement remain fairly constant over a period. In reality, however, actual results may be
constrained by various factors, such as promotion campaign, competitors' sales strategy, change
of economics environment etc.
Calculation
Formula
Quantity
Unit of Measure UoM defined in MDM
Direction of
Improvement
maximize
Industry
Relevance
Generic
Country
Relevance
Generic
Tools
o Business KPIs1. Business KPIs2. Process
Discounts as % of Gross Revenue - Earned
Skip to end of metadata Page restrictions apply Added by Florian Stapf, last edited by Alon Mizrahi on Oct 31, 2011 (view change) show comment
Go to start of metadata
Discounts as % of Gross Revenue - Earned
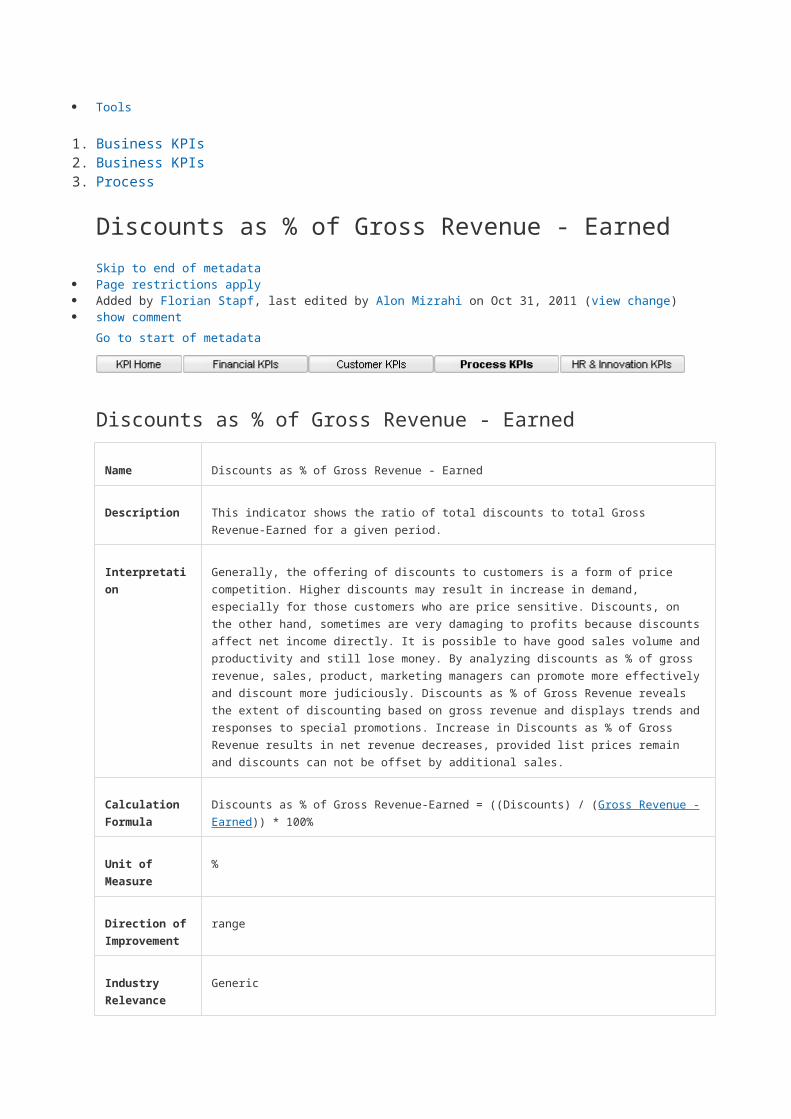
Name Discounts as % of Gross Revenue - Earned
Description This indicator shows the ratio of total discounts to total Gross Revenue-Earned for a given period.
Interpretation Generally, the offering of discounts to customers is a form of price competition. Higher discounts
may result in increase in demand, especially for those customers who are price sensitive.
Discounts, on the other hand, sometimes are very damaging to profits because discounts affect
net income directly. It is possible to have good sales volume and productivity and still lose money.
By analyzing discounts as % of gross revenue, sales, product, marketing managers can promote
more effectively and discount more judiciously. Discounts as % of Gross Revenue reveals the
extent of discounting based on gross revenue and displays trends and responses to special
promotions. Increase in Discounts as % of Gross Revenue results in net revenue decreases,
provided list prices remain and discounts can not be offset by additional sales.
Calculation
Formula
Discounts as % of Gross Revenue-Earned = ((Discounts) / (Gross Revenue - Earned)) * 100%

Unit of Measure %
Direction of
Improvement
range
Industry
Relevance
Generic
Country
Relevance
Generic
Tools
o Business KPIs1. Business KPIs2. Process
Inventory Days of Supply - Direct Materials (IDS-DIR)
Skip to end of metadata Page restrictions apply Added by Florian Stapf, last edited by Alon Mizrahi on Nov 02, 2011 (view change) show comment
Go to start of metadata
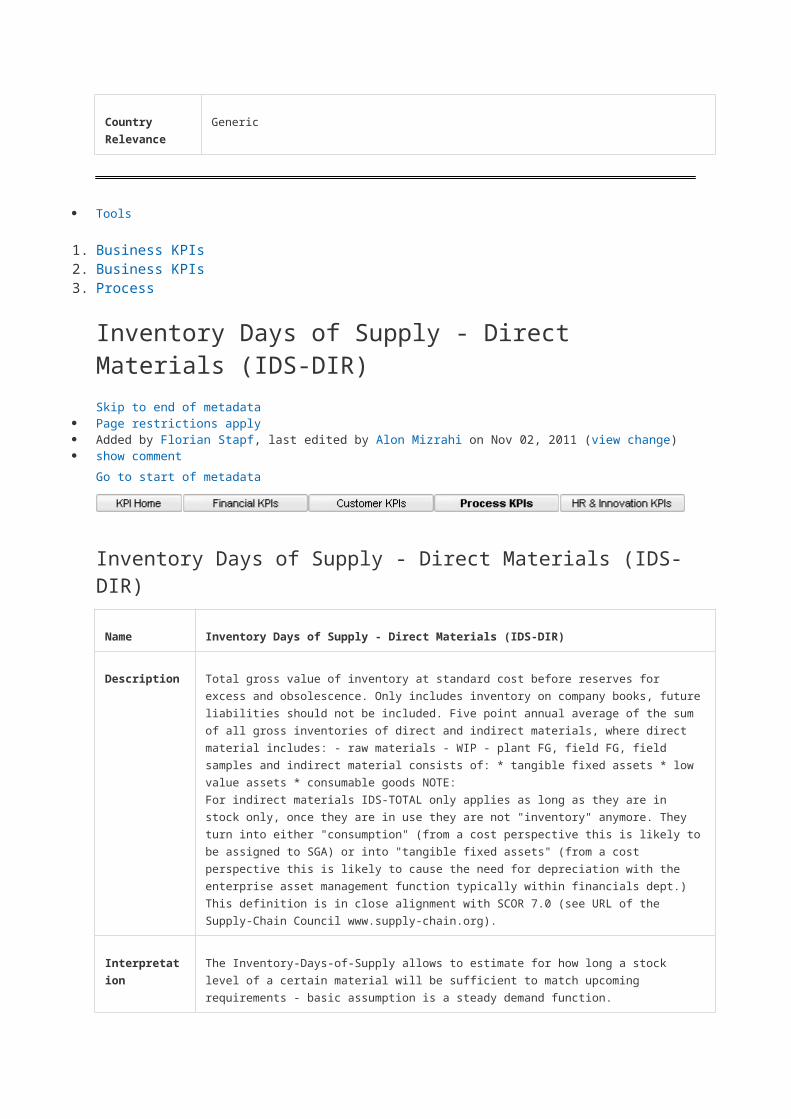
Inventory Days of Supply - Direct Materials (IDS-DIR)
Name Inventory Days of Supply - Direct Materials (IDS-DIR)
Description Total gross value of inventory at standard cost before reserves for excess and obsolescence. Only
includes inventory on company books, future liabilities should not be included. Five point annual
average of the sum of all gross inventories of direct and indirect materials, where direct material
includes: - raw materials - WIP - plant FG, field FG, field samples and indirect material consists of: *
tangible fixed assets * low value assets * consumable goods NOTE:
For indirect materials IDS-TOTAL only applies as long as they are in stock only, once they are in
use they are not "inventory" anymore. They turn into either "consumption" (from a cost perspective
this is likely to be assigned to SGA) or into "tangible fixed assets" (from a cost perspective this is
likely to cause the need for depreciation with the enterprise asset management function typically
within financials dept.) This definition is in close alignment with SCOR 7.0 (see URL of the Supply-
Chain Council www.supply-chain.org).
Interpretation The Inventory-Days-of-Supply allows to estimate for how long a stock level of a certain material will
be sufficient to match upcoming requirements - basic assumption is a steady demand function.
Calculation
Formula
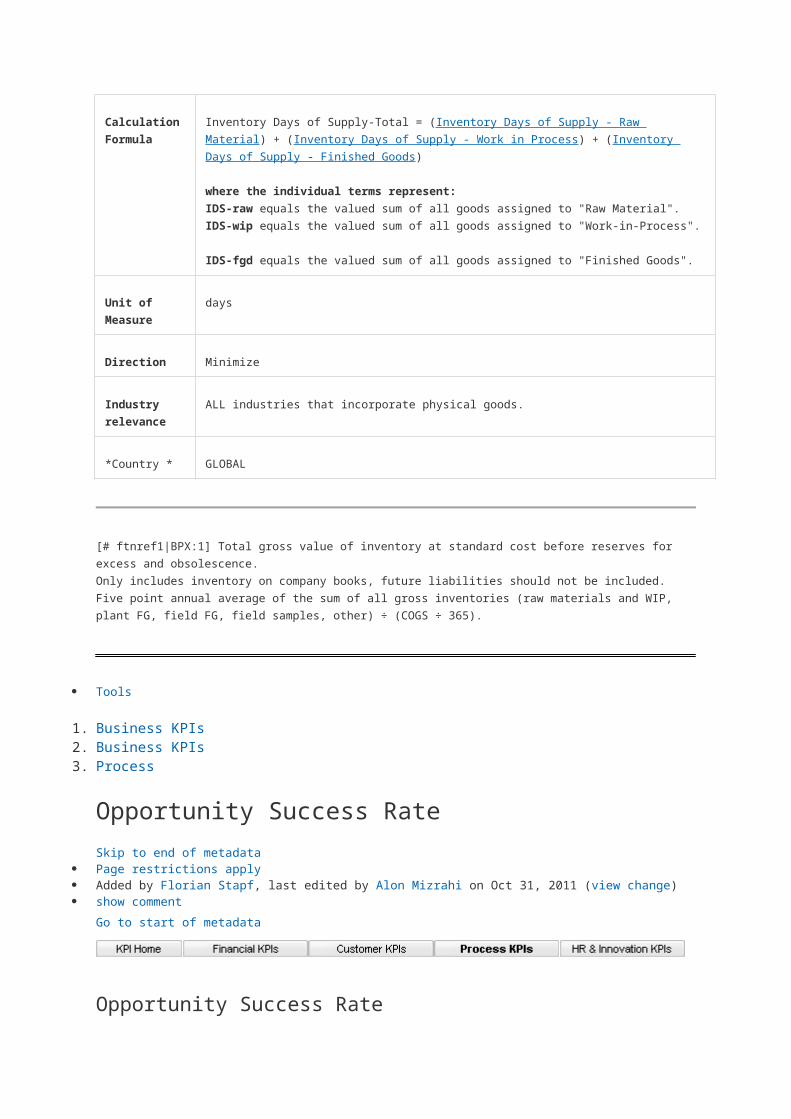
Inventory Days of Supply-Total = (Inventory Days of Supply - Raw Material) + (Inventory Days of
Supply - Work in Process) + (Inventory Days of Supply - Finished Goods)
where the individual terms represent:
IDS-raw equals the valued sum of all goods assigned to "Raw Material".
IDS-wip equals the valued sum of all goods assigned to "Work-in-Process".
IDS-fgd equals the valued sum of all goods assigned to "Finished Goods".
Unit of
Measure
days
Direction Minimize
Industry
relevance
ALL industries that incorporate physical goods.
*Country * GLOBAL
[# ftnref1|BPX:1] Total gross value of inventory at standard cost before reserves for excess and obsolescence.
Only includes inventory on company books, future liabilities should not be included. Five point annual average of the
sum of all gross inventories (raw materials and WIP, plant FG, field FG, field samples, other) ÷ (COGS ÷ 365).
Tools
o Business KPIs1. Business KPIs2. Process
Opportunity Success Rate
Skip to end of metadata Page restrictions apply Added by Florian Stapf, last edited by Alon Mizrahi on Oct 31, 2011 (view change) show comment
Go to start of metadata
Opportunity Success Rate
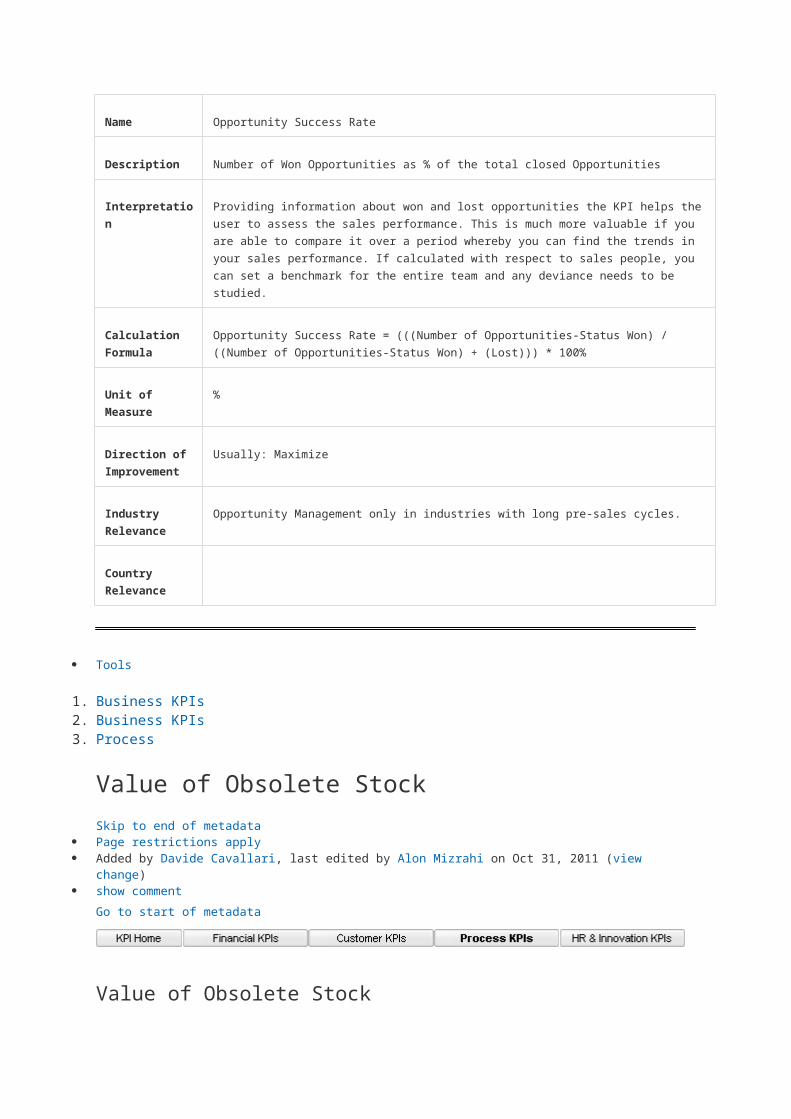
Name Opportunity Success Rate
Description Number of Won Opportunities as % of the total closed Opportunities
Interpretation Providing information about won and lost opportunities the KPI helps the user to assess the sales
performance. This is much more valuable if you are able to compare it over a period whereby you
can find the trends in your sales performance. If calculated with respect to sales people, you can
set a benchmark for the entire team and any deviance needs to be studied.
Calculation
Formula
Opportunity Success Rate = (((Number of Opportunities-Status Won) / ((Number of Opportunities-
Status Won) + (Lost))) * 100%
Unit of Measure %
Direction of
Improvement
Usually: Maximize
Industry
Relevance
Opportunity Management only in industries with long pre-sales cycles.
Country
Relevance
Tools
o Business KPIs1. Business KPIs2. Process
Value of Obsolete Stock
Skip to end of metadata Page restrictions apply Added by Davide Cavallari, last edited by Alon Mizrahi on Oct 31, 2011 (view change) show comment
Go to start of metadata
Value of Obsolete Stock
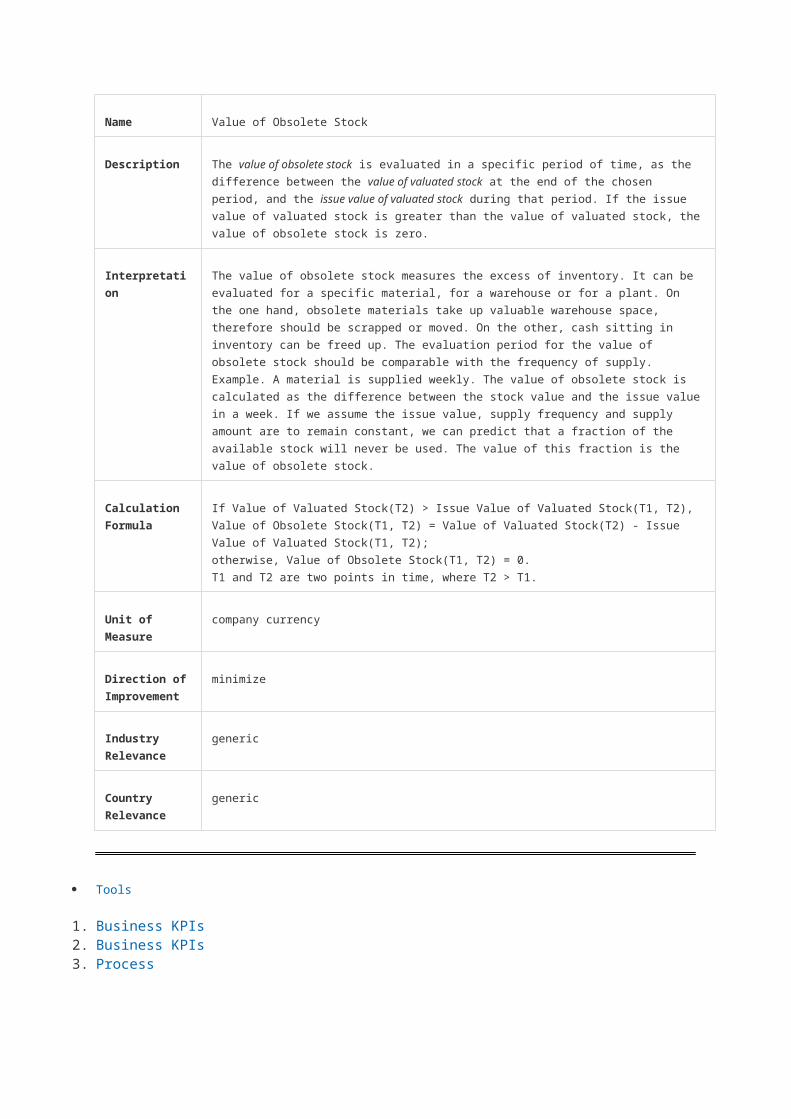
Name Value of Obsolete Stock
Description The value of obsolete stock is evaluated in a specific period of time, as the difference between the
value of valuated stock at the end of the chosen period, and the issue value of valuated stock
during that period. If the issue value of valuated stock is greater than the value of valuated stock,
the value of obsolete stock is zero.
Interpretation The value of obsolete stock measures the excess of inventory. It can be evaluated for a specific
material, for a warehouse or for a plant. On the one hand, obsolete materials take up valuable
warehouse space, therefore should be scrapped or moved. On the other, cash sitting in inventory
can be freed up. The evaluation period for the value of obsolete stock should be comparable with
the frequency of supply.
Example. A material is supplied weekly. The value of obsolete stock is calculated as the difference
between the stock value and the issue value in a week. If we assume the issue value, supply
frequency and supply amount are to remain constant, we can predict that a fraction of the
available stock will never be used. The value of this fraction is the value of obsolete stock.
Calculation
Formula
If Value of Valuated Stock(T2) > Issue Value of Valuated Stock(T1, T2), Value of Obsolete
Stock(T1, T2) = Value of Valuated Stock(T2) - Issue Value of Valuated Stock(T1, T2);
otherwise, Value of Obsolete Stock(T1, T2) = 0.
T1 and T2 are two points in time, where T2 > T1.
Unit of Measure company currency
Direction of
Improvement
minimize
Industry
Relevance
generic
Country
Relevance
generic
Tools
o Business KPIs1. Business KPIs2. Process
Vendors Fill Rate or Supplier performance
Skip to end of metadata Page restrictions apply Added by MURALIDHARA H.N, last edited by Alon Mizrahi on Oct 31, 2011 (view change) show comment
Go to start of metadata
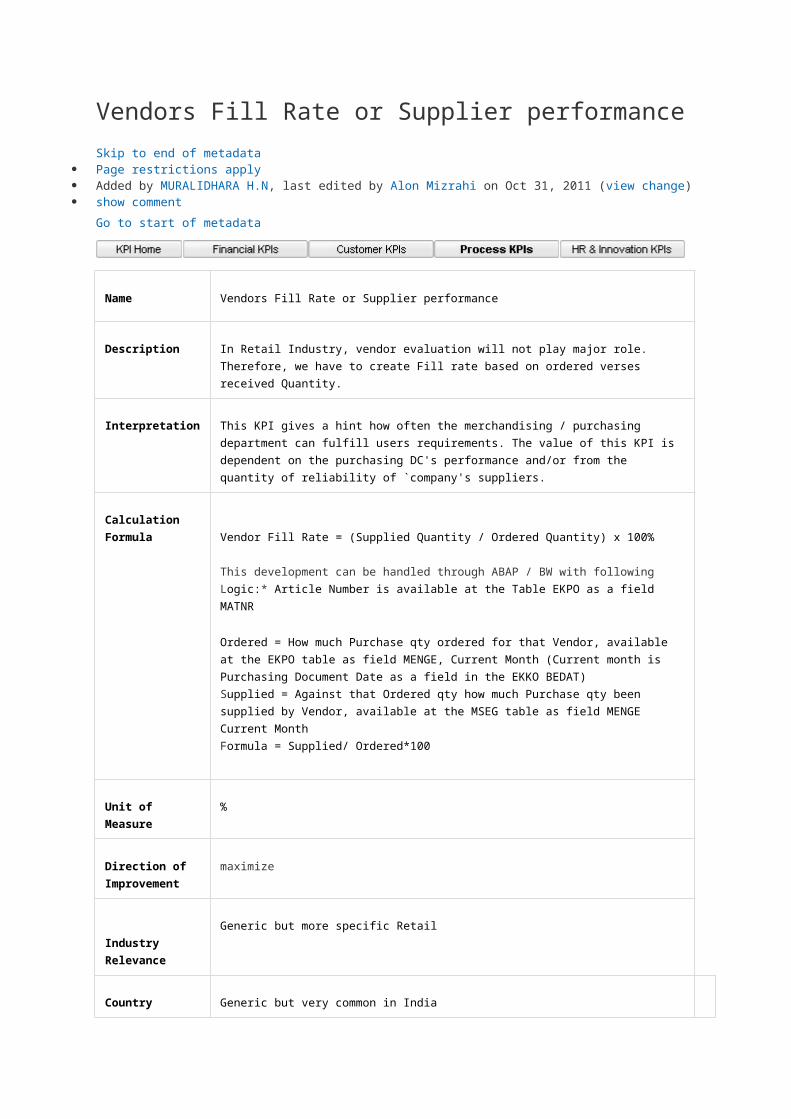
Name Vendors Fill Rate or Supplier performance
Description In Retail Industry, vendor evaluation will not play major role. Therefore, we have to create Fill
rate based on ordered verses received Quantity.
Interpretation This KPI gives a hint how often the merchandising / purchasing department can fulfill users
requirements. The value of this KPI is dependent on the purchasing DC's performance
and/or from the quantity of reliability of `company's suppliers.
Calculation
Formula Vendor Fill Rate = (Supplied Quantity / Ordered Quantity) x 100%
This development can be handled through ABAP / BW with following Logic:* Article Number
is available at the Table EKPO as a field MATNR
Ordered = How much Purchase qty ordered for that Vendor, available at the EKPO table as
field MENGE, Current Month (Current month is Purchasing Document Date as a field in the
EKKO BEDAT)
Supplied = Against that Ordered qty how much Purchase qty been supplied by Vendor,
available at the MSEG table as field MENGE Current Month
Formula = Supplied/ Ordered*100
Unit of Measure %
Direction of
Improvement
maximize
Industry
Relevance
Generic but more specific Retail
Country
Relevance
Generic but very common in India
Tools
o Business KPIs1. Business KPIs2. Process
Average Lead Time of Service Requests
Skip to end of metadata Page restrictions apply Added by Florian Stapf, last edited by Alon Mizrahi on Oct 31, 2011 (view change) show comment
Go to start of metadata
Average Lead Time of Service Requests
Name Average Lead Time of Service Requests
Description Lead time is calculated as the time between creation of a Service Request and the setting of the
request status to Closed. It is displayed in hours. Division by Number of Service Requests gives
the Average Lead Time of Service Requests.
Interpretation Shows the average time required to complete Service Requests within the user's service
organization. It gives an indication of the efficiency of the internal processes, and is an important
factor that can influence customer satisfaction.
Calculation
Formula
Average Lead Time of Service Requests = (Lead Time of Service Requests) / (Number of
Service Requests)
Lead Time of Service Requests =
Time between Creation of a Service Request and the Setting of the Request Status to Closed-in
Hours
Unit of Measure Hours
Direction of
Improvement
Usually Minimize
Industry
Relevance
Country
Relevance
Tools
o Business KPIs1. Business KPIs2. Process
Quote Success Rate
Skip to end of metadata Page restrictions apply Added by Florian Stapf, last edited by Alon Mizrahi on Oct 31, 2011 (view change) show comment
Go to start of metadata
Quote Success Rate
Name Quote Success Rate
Description Order value of the quote items that have actually been converted to sales order items compared
to their original quote value.
Interpretation The Quote Success Rate can be used to analyze the quote value that is actually sold to the
customer. This in turn helps the user to monitor which products or services are popular and to
spot areas where action is required.
Calculation
Formula
Quote Success Rate = (Referred Value) / (Net Value of Accepted Quote Items)
Unit of Measure %
Direction of
Improvement
Usually: Maximize
Industry
Relevance
Country
Rekevance
Tools
o Business KPIs1. Business KPIs2. Process
Average Call Closure Time
Skip to end of metadata Page restrictions apply Added by Florian Stapf, last edited by Alon Mizrahi on Oct 31, 2011 (view change) show comment
Go to start of metadata
Average Call Closure Time
Name Average Call Closure Time
Description Call Closure Time time is calculated as the time between creation of a Service Order and the
setting of the order status to Completed. It is displayed in hours. Division by the Number of
Service Orders gives the Average Call Closure Time.
Interpretation The Average Call Closure Time gives an indication of the efficiency of the internal processes,
and is an important factor that can influence customer satisfaction.
Calculation
Formula
Average Call Closure Time = (Call Closure Time) / (Number of Service Orders)
Call Closure Time =
Time between Creation of a Service Order and the Setting of the Order Status to Completed-in
Hours
Unit of Measure Hours
Direction of
Improvement
Usually Minimize
Industry
Relevance
Country
Relevance
1. Business KPIs2. Business KPIs3. Process
Inventory Days of Supply - Finished Goods
Skip to end of metadata Page restrictions apply Added by Florian Stapf, last edited by Alon Mizrahi on Nov 02, 2011 (view change) show comment
Go to start of metadata
Inventory Days of Supply - Finished Goods
Name Inventory Days of Supply - Finished Goods
Description Total gross value of inventory at standard cost before reserves for excess and obsolescence. Only
includes inventory on company books, future liabilities should not be included. Five point annual
average of the sum of all gross inventories of direct and indirect materials, where direct material
includes:
raw materials
WIP
plant FG, field FG, field samples
and indirect material consists of:
tangible fixed assets
low value assets
consumable goods
NOTE:
For indirect materials IDS-TOTAL only applies as long as they are in stock only, once they are in
use they are not "inventory" anymore. They turn into either "consumption" (? from a cost
perspective this is likely to be assigned to SGA) or into "tangible fixed assets" (? from a cost
perspective this is likely to cause the need for depreciation with the enterprise asset management
function typically within financials dept.)
This definition is in close alignment with SCOR 7.0.
Total gross value of inventory at standard cost before reserves for excess and obsolescence.
Only includes inventory on company books, future liabilities should not be included. Five point
annual average of the sum of all gross inventories (raw materials & WIP, plant FG, field FG, field
samples, other) ÷ (COGS ÷ 365).
Interpretation The Inventory-Days-of-Supply allows to estimate for how long a stock level of a certain material will
be sufficient to match upcoming requirements - basic assumption is a steady demand function.
Calculation
Formula
IDS-fgd [BPX:days] = SUMn (IDS_goodn-classified-as-FGD) / n [BPX:days]
where n is the no. of materials summed up and the term of the SUM is derived from:
IDS_ goodn-classified-as-FGD [BPX:days]
= Stock-Value_ goodn [BPX:$] / Stock-Consumption_goodn [BPX:$/day]
and with the sub-terms defined as:
Stock-Value_ goodn [BPX:$] = Qty-per-Stock-Segment [BPX:UoM]
x Price [BPX:$/UoM]
Stock-Consumption_goodn [BPX:$/day] = Qty-per-Stock-Segment [BPX:UoM/day]
x Price [BPX:$/UoM]
NOTE1:
The assignment of material classes to certain stock elements maybe customer specific and needs
to be configurable. Details can be derived from Figure 2 and Figure 3.
NOTE2:
It is assumed that the product master contains:
a flag that indicates, what kind of material class a product belongs to (e.g. raw material, semi-
finished product, finished good etc.)

a suitable price that contains actual data per period, since the stock consumption always requires
a period to be specified, the lowest level of granularity will typically be a day (the calculation will
always relate to the past, so the fixed data may be assumed, no more shifts will happen.)
Unit of Measure days
Direction of
Improvement
Meet target value
Industry
Relevance
ALL industries that incorporate physical goods.
Country
Relevance
GLOBAL