Embed Size (px)
Citation preview
Resource
Key Parameters of Tumor Epitope ImmunogenicityRevealed Through a Consortium Approach ImproveNeoantigen Prediction
Graphical Abstract
Highlights
d Diverse neoantigen predictions on shared genomic data
from a global consortium
d 37 out of 608 tested peptide-MHCs are bound by patient-
matched T cells
d Epitope presentation and recognition characteristics predict
immunogenicity
d Model-based interventions improve neoantigen prediction
Wells et al., 2020, Cell 183, 1–17October 29, 2020 ª 2020 Elsevier Inc.https://doi.org/10.1016/j.cell.2020.09.015
Authors
Daniel K. Wells, Marit M. van Buuren,
Kristen K. Dang, ..., Ton N. Schumacher,
Pia Kvistborg, Nadine A. Defranoux
[email protected] (D.K.W.),[email protected] (N.A.D.)
In Brief
Genomic tumor sequencing data with
matched measurements of tumor epitope
immunogenicity allows for insights into
the governing parameters of epitope
immunogenicity and generation of
models for effective neoantigen
prediction.
ll

Please cite this article in press as: Wells et al., Key Parameters of Tumor Epitope Immunogenicity Revealed Through a Consortium ApproachImprove Neoantigen Prediction, Cell (2020), https://doi.org/10.1016/j.cell.2020.09.015
ll
Resource
Key Parameters of Tumor Epitope ImmunogenicityRevealed Through a Consortium ApproachImprove Neoantigen PredictionDaniel K. Wells,1,24,26,* Marit M. van Buuren,2,3,24 Kristen K. Dang,4,24 Vanessa M. Hubbard-Lucey,5
Kathleen C.F. Sheehan,6,7 Katie M. Campbell,8 Andrew Lamb,4 Jeffrey P. Ward,9 John Sidney,10
Ana B. Blazquez,11 Andrew J. Rech,1,12 Jesse M. Zaretsky,8 Begonya Comin-Anduix,1,13 Alphonsus H.C. Ng,14
William Chour,15 Thomas V. Yu,4 Hira Rizvi,16 Jia M. Chen,8 Patrice Manning,1 Gabriela M. Steiner,1 Xengie C. Doan,4 TheTumor Neoantigen Selection Alliance, Taha Merghoub,1,17,18 Justin Guinney,4,19 Adam Kolom,1,5 Cheryl Selinsky,1
Antoni Ribas,1,8,9 Matthew D. Hellmann,1,16,17,18 Nir Hacohen,20,21 Alessandro Sette,11,22 James R. Heath,1,14
Nina Bhardwaj,1,11 Fred Ramsdell,1 Robert D. Schreiber,1,6,7,25 Ton N. Schumacher,23,25 Pia Kvistborg,2,25
and Nadine A. Defranoux1,25,*1Parker Institute for Cancer Immunotherapy, San Francisco, CA, USA2Division of Molecular Oncology and Immunology, the Netherlands Cancer Institute, Amsterdam, the Netherlands3T Cell Immunology, Biopharmaceutical New Technologies (BioNTech) Corporation, BioNTech US, Cambridge, MA, USA4Computational Oncology, Sage Bionetworks, Seattle, WA, USA5Anna-Maria Kellen Clinical Accelerator, Cancer Research Institute, New York, NY, USA6Department of Pathology and Immunology, Washington University School of Medicine, St. Louis, St. Louis, MO, USA7The Andrew M. and Jane M. Bursky Center for Human Immunology and Immunotherapy Programs, Washington University School of
Medicine, St. Louis, MO, USA8Division of Hematology and Oncology, Department of Medicine, Johnson Comprehensive Cancer Center, David Geffen School of Medicine,
University of California, Los Angeles, Los Angeles, CA, USA9Division of Oncology, Department of Medicine, Washington University School of Medicine, St. Louis, MO, USA10Division of Vaccine Discovery, La Jolla Institute for Allergy and Immunology, La Jolla, CA, USA11Division of Hematology and Oncology, Tisch Cancer Institute, Icahn School of Medicine at Mount Sinai, New York, NY, USA12Department of Pathology and Laboratory Medicine, Hospital of the University of Pennsylvania, Philadelphia, PA, USA13Department of Surgery, David Geffen School of Medicine, Johnson Comprehensive Cancer Center, University of California, Los Angeles,
Los Angeles, CA, USA14Institute for Systems Biology, Seattle, WA, USA15Division of Biology and Biological Engineering, California Institute of Technology, Pasadena, CA, USA16Druckenmiller Center for Lung Cancer Research, MSKCC, New York, NY, USA17Department of Medicine, MSKCC, New York, NY, USA18Department of Medicine, Weill Cornell Medical College, New York, NY, USA19Biomedical Informatics and Medical Education, University of Washington, Seattle, WA, USA20Broad Institute of MIT and Harvard, Cambridge, MA, USA21Massachusetts General Hospital Cancer Center, Boston, MA, USA22Department of Medicine, University of California, San Diego, La Jolla, CA, USA23Division of Molecular Oncology and Immunology, Oncode Institute, the Netherlands Cancer Institute, Amsterdam, the Netherlands24These authors contributed equally25These authors contributed equally26Lead Contact
*Correspondence: [email protected] (D.K.W.), [email protected] (N.A.D.)
https://doi.org/10.1016/j.cell.2020.09.015
SUMMARY
Many approaches to identify therapeutically relevant neoantigens couple tumor sequencing with bio-informatic algorithms and inferred rules of tumor epitope immunogenicity. However, there are no referencedata to compare these approaches, and the parameters governing tumor epitope immunogenicity remain un-clear. Here, we assembled a global consortium wherein each participant predicted immunogenic epitopesfrom shared tumor sequencing data. 608 epitopes were subsequently assessed for T cell binding in pa-tient-matched samples. By integrating peptide features associated with presentation and recognition, wedeveloped a model of tumor epitope immunogenicity that filtered out 98% of non-immunogenicpeptides with a precision above 0.70. Pipelines prioritizing model features had superior performance, andpipeline alterations leveraging them improved prediction performance. These findings were validated in an
Cell 183, 1–17, October 29, 2020 ª 2020 Elsevier Inc. 1

ll
Please cite this article in press as: Wells et al., Key Parameters of Tumor Epitope Immunogenicity Revealed Through a Consortium ApproachImprove Neoantigen Prediction, Cell (2020), https://doi.org/10.1016/j.cell.2020.09.015
Resource
independent cohort of 310 epitopes prioritized from tumor sequencing data and assessed for T cell binding.This data resource enables identification of parameters underlying effective anti-tumor immunity and is avail-able to the research community.
INTRODUCTION
Somatic alterations are a hallmark of cancer (Hanahan andWein-
berg, 2011). These alterations can result in the generation of
mutated peptide fragments that, when presented on class I ma-
jor histocompatibility complex (MHC I) molecules, elicit a protec-
tive anti-tumor immune response. Such mutant peptides, called
‘‘neoantigens,’’ are hypothesized to comprise an important class
of tumor antigens that drive anti-tumor immunity (Schumacher
and Schreiber, 2015; Tran et al., 2017; Yarchoan et al., 2017).
Neoantigens have long been viewed as promising therapeutic
targets because they are tumor-specific and are not subject to
either pre-existing immune tolerance or likely to generate auto-
immunity. Neoantigen vaccines have been shown to induce tu-
mor rejection of mice bearing transplanted sarcomas (Gubin
et al., 2014). In humans, neoantigen vaccine studies have shown
the ability to generate neoantigen-specific T cells in melanoma
and glioblastoma (Carreno et al., 2015; Keskin et al., 2019) and
are supportive of an ability of these therapies to be protective
against tumor recurrence in melanoma (Ott et al., 2017) and to
induce vaccine-related tumor regression in melanoma (Sahin
et al., 2017). Adoptive transfer of autologous T cell products con-
taining high fractions of neoantigen-specific T cells has gener-
ated tumor regression in a range of cancer types (Tran et al.,
2014, 2016; Yee et al., 2002; Zacharakis et al., 2018) and has
further shown the ability to mediate durable complete regression
in a substantial fraction of patients with metastatic melanoma
(Goff et al., 2016; Rosenberg et al., 2011). Moreover, in these
neoantigen-targeting therapies, documented cases of off-target
immune response against the wild-type non-mutated peptide
are exceptionally rare (Schumacher et al., 2019; Strønen et al.,
2016; Tran et al., 2017) corroborating studies in animal models
showing no evidence of cross-reactivity between mutant pep-
tides and wild-type peptides (Alspach et al., 2019; Gubin et al.,
2014, 2015; Kreiter et al., 2015; Matsushita et al., 2012). Neoan-
tigen-targeting therapies are thus viewed as a safe and effective
approach to generate anti-tumor immune responses (Sahin and
Tureci, 2018; Yamamoto et al., 2019).
The ability to accurately and reproducibly identify neoanti-
gens capable of eliciting a tumor-specific immune response
from available sample material is paramount for the success
of these therapeutic approaches and is still early in develop-
ment (Garcia-Garijo et al., 2019; Hacohen et al., 2013; Nature
Biotechnology, 2017; Vitiello and Zanetti, 2017; Yadav et al.,
2014). Epitope immunogenicity is dependent on a complex
chain of events, including variant expression, peptide pro-
cessing, transport and presentation, and ultimately generation
of a T cell response. Predicting which somatic alterations will
generate immunogenic peptides relies on in silico algorithms
that leverage advances in next generation sequencing
(NGS), associated bioinformatic tools (Finotello et al., 2019;
Fritsch et al., 2014; Richters et al., 2019; Schumacher and Ha-
2 Cell 183, 1–17, October 29, 2020
cohen, 2016), and inferred rules governing epitope immuno-
genicity. These rules typically incorporate the predicted affin-
ity of that epitope to the specific HLA alleles associated with
the subject (Hoof et al., 2009; O’Donnell et al., 2018) as well
as filters and ranking criteria derived from a priori knowledge.
To date, proposed rules have been derived from a heteroge-
neous set of studies using a range of validation techniques
and models (Cohen et al., 2015; Hundal et al., 2016; qukszaet al., 2017; Rajasagi et al., 2014; Richman et al., 2019) and
may be further confounded by inherent biases present in the
single pipeline used to generate candidate epitopes. Although
crowdsourced biomedical research efforts (Saez-Rodriguez
et al., 2016) such as the Dialogue on Reverse Engineering
Assessment and Methods (DREAM) and the Critical Assess-
ment of Genome Interpretation (CAGI), have made substantial
contributions to improving methods for tumor subclonal
reconstruction (Salcedo et al., 2020), predicting phenotype
from exome sequencing (Daneshjou et al., 2017), multi-target
drug identification (Schlessinger et al., 2017), identifying the
effect of CDKN2A variants (Carraro et al., 2017), and others
(Guinney et al., 2017; Hoskins et al., 2017; Keller et al.,
2017; Kreimer et al., 2017), no such effort for neoepitope pre-
diction has been undertaken. To date, there does not yet exist
a comprehensive, unbiased resource with which the key pa-
rameters governing tumor epitope immunogenicity can be
systematically compared. Such a resource would further
enable comparison between different pipelines to improve
neoantigen prediction.
Here, we report on the results obtained by the Tumor Neoan-
tigen Selection Alliance (TESLA), a global community-based
initiative seeking to understand tumor epitope immunogenicity,
improve neoantigen prediction, and ultimately provide a broadly
accessible reference dataset for effective benchmarking. We
identify key parameters governing tumor epitope immunoge-
nicity by analyzing predictions made by multiple independent
pipelines on a common set of tumor samples and using a central-
ized set of validation experiments. Data from TESLA are avail-
able for download and serve as an open benchmark to accel-
erate the development of neoantigen-based therapies (https://
www.synapse.org/#!Synapse:syn21048999).
RESULTS
Consortium StructureTESLA brings together teams of researchers from academia, in-
dustry, andnon-profit groups tocompare their approaches toneo-
antigen prediction through three main principles: (1) all teams are
provided thesamegenomic informationderived fromsubject sam-
ples: tumor/normal whole exome sequencing (WES), tumor RNA-
sequencing, and clinical-grade HLA typing (STAR Methods); (2)
teams use these data to generate neoepitope predictions and re-
turn a ranked list of neoepitopes predicted to bind to the relevant

20 40 60 800
2
4
6
8
Med. Num. Tested
Med
. Num
. Val
idat
ed
B
C
456
32
Subm
issi
ons
ASample Collection:Tumor/normal tissueTILs and/or PBMC
HLA Typing
WES + RNA-seq
TILs & PBMC
Participants PredictNeoepitopes
Peptide Selection
PeptideSynthesis
Epitope ValidationAnalysis of ResultsCompile and ProvideReport
0.6
0
Team
Med
ian
Ove
rlap
1.0
0
-1.0Med
ian
Cor
rela
tion 1.0
0
Med
ian
Ove
rlap
Team
Team
D E
0.01
0.1
1.0
AU
PRC
F
1.0
0AU
PRC
1.0
Frac
. R
anke
d
Median AUPRC0.2 0.6
0.8M
edia
n Fr
ac.
Ran
kedG
0
0
0.5
0
TTIF
Team0.80
Median Frac. Ranked
Med
ian
TTIF
0.25
0
0.500.751.00
0.25
Frac
. Ran
ked
p=3*10-3
rho=0.58
Median AUPRC0.2 0.6
Med
ian
TTIF
0.25
0
p=4*10-4
rho=0.66
yxwvrqponmlkjigfecba d h s t u
456
3Su
bmis
sion
s21
456
3
Subm
issi
ons
21
p=0.04rho=0.42
456
3
Subm
issi
ons
21
yxwvrqponmlkjigfecba d h s t u
yxwv
rqponmlkji
gfe
cba
d
h
stu
yxwvrqponmlkjigfecba d h s t u yxwvrqponmlkjigfecba d h s t u
yxwv
rqponmlkji
gfe
cba
d
h
stu
yxwv
rqponmlkji
gfe
cba
d
h
stu
A*02:01_KLLSFHSVB*44:02_AEYQDMHSYA*03:01_ALYFNSQWKA*06:02_VRINTARPVA*24:04_VYCEEYYLF
10; 49; 28; 36; 57; 2
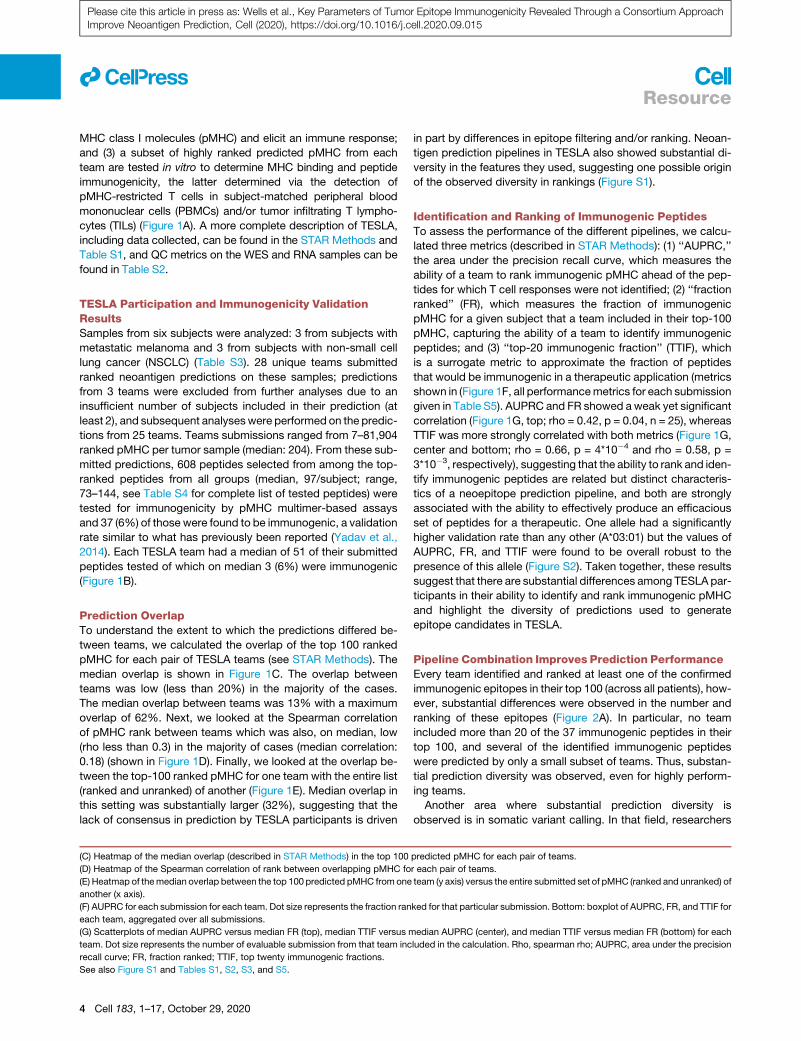
Figure 1. Overview of TESLA Team Performance
(A) Schematic of TESLA.
(B) Scatterplot of median number of peptides tested for immunogenicity (x axis) versus median number of peptides with validated immunogenicity (y axis). Dot
size represents the number of patients a given team submitted for.
(legend continued on next page)
ll
Cell 183, 1–17, October 29, 2020 3
Please cite this article in press as: Wells et al., Key Parameters of Tumor Epitope Immunogenicity Revealed Through a Consortium ApproachImprove Neoantigen Prediction, Cell (2020), https://doi.org/10.1016/j.cell.2020.09.015
Resource
ll
Please cite this article in press as: Wells et al., Key Parameters of Tumor Epitope Immunogenicity Revealed Through a Consortium ApproachImprove Neoantigen Prediction, Cell (2020), https://doi.org/10.1016/j.cell.2020.09.015
Resource
MHC class I molecules (pMHC) and elicit an immune response;
and (3) a subset of highly ranked predicted pMHC from each
team are tested in vitro to determine MHC binding and peptide
immunogenicity, the latter determined via the detection of
pMHC-restricted T cells in subject-matched peripheral blood
mononuclear cells (PBMCs) and/or tumor infiltrating T lympho-
cytes (TILs) (Figure 1A). A more complete description of TESLA,
including data collected, can be found in the STAR Methods and
Table S1, and QC metrics on the WES and RNA samples can be
found in Table S2.
TESLA Participation and Immunogenicity ValidationResultsSamples from six subjects were analyzed: 3 from subjects with
metastatic melanoma and 3 from subjects with non-small cell
lung cancer (NSCLC) (Table S3). 28 unique teams submitted
ranked neoantigen predictions on these samples; predictions
from 3 teams were excluded from further analyses due to an
insufficient number of subjects included in their prediction (at
least 2), and subsequent analyseswere performed on the predic-
tions from 25 teams. Teams submissions ranged from 7–81,904
ranked pMHC per tumor sample (median: 204). From these sub-
mitted predictions, 608 peptides selected from among the top-
ranked peptides from all groups (median, 97/subject; range,
73–144, see Table S4 for complete list of tested peptides) were
tested for immunogenicity by pMHC multimer-based assays
and 37 (6%) of those were found to be immunogenic, a validation
rate similar to what has previously been reported (Yadav et al.,
2014). Each TESLA team had a median of 51 of their submitted
peptides tested of which on median 3 (6%) were immunogenic
(Figure 1B).
Prediction OverlapTo understand the extent to which the predictions differed be-
tween teams, we calculated the overlap of the top 100 ranked
pMHC for each pair of TESLA teams (see STAR Methods). The
median overlap is shown in Figure 1C. The overlap between
teams was low (less than 20%) in the majority of the cases.
The median overlap between teams was 13% with a maximum
overlap of 62%. Next, we looked at the Spearman correlation
of pMHC rank between teams which was also, on median, low
(rho less than 0.3) in the majority of cases (median correlation:
0.18) (shown in Figure 1D). Finally, we looked at the overlap be-
tween the top-100 ranked pMHC for one team with the entire list
(ranked and unranked) of another (Figure 1E). Median overlap in
this setting was substantially larger (32%), suggesting that the
lack of consensus in prediction by TESLA participants is driven
(C) Heatmap of the median overlap (described in STAR Methods) in the top 100
(D) Heatmap of the Spearman correlation of rank between overlapping pMHC fo
(E) Heatmap of themedian overlap between the top 100 predicted pMHC fromone
another (x axis).
(F) AUPRC for each submission for each team. Dot size represents the fraction ran
each team, aggregated over all submissions.
(G) Scatterplots of median AUPRC versus median FR (top), median TTIF versus m
team. Dot size represents the number of evaluable submission from that team inc
recall curve; FR, fraction ranked; TTIF, top twenty immunogenic fractions.
See also Figure S1 and Tables S1, S2, S3, and S5.
4 Cell 183, 1–17, October 29, 2020
in part by differences in epitope filtering and/or ranking. Neoan-
tigen prediction pipelines in TESLA also showed substantial di-
versity in the features they used, suggesting one possible origin
of the observed diversity in rankings (Figure S1).
Identification and Ranking of Immunogenic PeptidesTo assess the performance of the different pipelines, we calcu-
lated three metrics (described in STAR Methods): (1) ‘‘AUPRC,’’
the area under the precision recall curve, which measures the
ability of a team to rank immunogenic pMHC ahead of the pep-
tides for which T cell responses were not identified; (2) ‘‘fraction
ranked’’ (FR), which measures the fraction of immunogenic
pMHC for a given subject that a team included in their top-100
pMHC, capturing the ability of a team to identify immunogenic
peptides; and (3) ‘‘top-20 immunogenic fraction’’ (TTIF), which
is a surrogate metric to approximate the fraction of peptides
that would be immunogenic in a therapeutic application (metrics
shown in (Figure 1F, all performancemetrics for each submission
given in Table S5). AUPRC and FR showed aweak yet significant
correlation (Figure 1G, top; rho = 0.42, p = 0.04, n = 25), whereas
TTIF was more strongly correlated with both metrics (Figure 1G,
center and bottom; rho = 0.66, p = 4*10�4 and rho = 0.58, p =
3*10�3, respectively), suggesting that the ability to rank and iden-
tify immunogenic peptides are related but distinct characteris-
tics of a neoepitope prediction pipeline, and both are strongly
associated with the ability to effectively produce an efficacious
set of peptides for a therapeutic. One allele had a significantly
higher validation rate than any other (A*03:01) but the values of
AUPRC, FR, and TTIF were found to be overall robust to the
presence of this allele (Figure S2). Taken together, these results
suggest that there are substantial differences among TESLA par-
ticipants in their ability to identify and rank immunogenic pMHC
and highlight the diversity of predictions used to generate
epitope candidates in TESLA.
Pipeline Combination Improves Prediction PerformanceEvery team identified and ranked at least one of the confirmed
immunogenic epitopes in their top 100 (across all patients), how-
ever, substantial differences were observed in the number and
ranking of these epitopes (Figure 2A). In particular, no team
included more than 20 of the 37 immunogenic peptides in their
top 100, and several of the identified immunogenic peptides
were predicted by only a small subset of teams. Thus, substan-
tial prediction diversity was observed, even for highly perform-
ing teams.
Another area where substantial prediction diversity is
observed is in somatic variant calling. In that field, researchers
predicted pMHC for each pair of teams.
r each pair of teams.
team (y axis) versus the entire submitted set of pMHC (ranked and unranked) of
ked for that particular submission. Bottom: boxplot of AUPRC, FR, and TTIF for
edian AUPRC (center), and median TTIF versus median FR (bottom) for each
luded in the calculation. Rho, spearman rho; AUPRC, area under the precision

A
B
E F G H
C D
Figure 2. Rational Combination of Neoantigen Predictions Improve Prediction Performance
(A) Overview of each pMHC across all of TESLA that validated in a multimer-based assay. For each pMHC, the rank of that pMHC for a given team is shown.
Places where a team did not identify a particular pMHC in any of their submissions are shown in gray. Bottom: for each peptide, the fraction of time that peptide
was ranked in different ranking groups (left).
(B) Schematic of prediction combination method along with metric calculation.
(legend continued on next page)
ll
Cell 183, 1–17, October 29, 2020 5
Please cite this article in press as: Wells et al., Key Parameters of Tumor Epitope Immunogenicity Revealed Through a Consortium ApproachImprove Neoantigen Prediction, Cell (2020), https://doi.org/10.1016/j.cell.2020.09.015
Resource

ll
Please cite this article in press as: Wells et al., Key Parameters of Tumor Epitope Immunogenicity Revealed Through a Consortium ApproachImprove Neoantigen Prediction, Cell (2020), https://doi.org/10.1016/j.cell.2020.09.015
Resource
have developed strategies to rationally combine predictions
from different callers to improve specificity while maintaining
sensitivity (Callari et al., 2017; quksza et al., 2017). We hypothe-
sized that a similar approach could be beneficial for neoantigen
prediction and sought to identify the criteria under which the
combination of a pair of pipelines would be most likely to
improve neoantigen prediction. For each pair of pipelines that
provided predictions on a given sample, we combined those
predictions by intersecting them and re-ranking them by the
average rank of the remaining pMHC (Figure 2B). For a given
pair of pipelines, the change in predictive ability was captured
as difference from max TTIF of the two inputted predictions on
the same subject. Finally, for each pipeline pair, we defined
twometrics: overlap and relative difference. Briefly, overlap cap-
tures the extent to which pipeline predictions are similar,
whereas relative difference captures the difference in TTIF be-
tween each pipeline pair, for a given subject (depicted in Fig-
ure 2B; STAR Methods). 19% of pipeline combinations demon-
strated improved performance (Figure 2C). Pipeline pairs with
improved performance had a significantly more constrained dis-
tribution of overlap values (Figure 2D, p = 0.016, Kolmogorov-
Smirnov test) and a significantly smaller relative difference (Fig-
ure 2E, p = 0.015, Mann-Whitney U), and these two metrics
were independent (Figure 2F). Larger average TTIF values for
pairs of pipelines were positively correlated with the combined
TTIF values (Figure 2G, rho = 0.75, p < 10�16, Spearman correla-
tion), and pairs of pipelines with improved performance were
significantly more likely to produce combined TTIF values that
were larger than all previously observed TTIF values from single
pipelines for the same patient (OR = 6.06, p = 4*10�9, termed
‘‘global improvement’’). Finally, improved team pairs with
above-median TTIF over all patients were more likely to produce
prediction results that were global improvements (Figure 2F, p =
0.017, Mann-Whitney U). Together, these results suggest an
approach to improving neoantigen prediction that does not rely
on developing a pipeline with best-in-class performance: identify
two pipelines with consistently strong performance that produce
distinct predictions and combine those predictions using an
intersect and rank approach.
Presentation Features of Immunogenic PeptidesWe sought to characterize the features of peptides that were
associated with the presence of detectable antigen-specific
T cells compared to those that were not. The current model of
epitope immunogenicity proposes that for a peptide to elicit an
anti-tumor T cell response, it must first be presented by an
MHC I allele, and subsequently be recognized as foreign by a
T cell (Schreiber et al., 2011). As such, we first considered ‘‘pre-
sentation features’’ hypothesized to be associated with effective
(C) Histogram of average change in combined TTIF. Yellow, combination impro
average.
(D) Density plot of average overlap, stratified by improvement status. Distribution
(E) Boxplot of relative difference stratified by improvement status. *: p < 0.05.
(F) Scatterplot of average overlap by relative difference. Ellipses represent best fi
(G) Combined TTIF by the average of the two initial TTIF values, by team pair and p
a particular value was a global improvement (larger than all previous TTIF values f
improvements stratified by whether average team-pair TTIF is above or below th
6 Cell 183, 1–17, October 29, 2020
antigen presentation: MHC binding affinity, expression of the
originating gene (‘‘tumor abundance’’), expected duration of
peptide-MHC interaction (‘‘binding stability’’), peptide hydro-
phobicity, and mutation position (Chowell et al., 2015; Duan
et al., 2014; Hundal et al., 2016; quksza et al., 2017; Rasmussen
et al., 2016). Peptide features are included in Table S4, and their
calculation is described in STAR Methods. Overall, a wide range
of values for each peptide presentation feature (Figure 3A) and
mutation position (Figure 3B) was observed. We next assessed
if these characteristics differed between immunogenic and
non-immunogenic pMHC. Immunogenic pMHC had significantly
stronger measured binding affinity (Figure 3C; p = 4*10�6, Mann-
Whitney U), significantly higher tumor abundance (Figure 3D; p =
0.01, Mann-Whitney U), significantly higher binding stability (Fig-
ure 3E, p = 1.4*10�4, Mann-Whitney U), and were significantly
less hydrophobic (Figure 3F, p = 0.04, Mann-Whitney U) than
non-immunogenic tested pMHC. As seen previously (Abelin
et al., 2017), pMHC binding affinity was not correlated with tumor
abundance, and high tumor abundance did not compensate for
weak binding affinity in immunogenic pMHC (Figure 3G,
Spearman rho). However, pMHC binding affinity was signifi-
cantly inversely correlated with binding stability (Figure 3H, p <
10�15, Spearman rho), and binding stability was positively corre-
lated with the peptide hydrophobicity (Figure 3I, p = 5*10�9,
Spearman rho), although this association was less pronounced
in immunogenic peptides. Finally, in this dataset, immunogenic
peptides were never derived from mutations that changed the
second amino acid in a peptide (p = 0.006; Fisher exact test),
although this was the most commonly predicted mutation loca-
tion, while they were much more likely to be derived from muta-
tions to the third amino acid (p = 0.003; Fisher exact test; Fig-
ure 3J). We note that the second amino acid is the anchor
residue for peptides of multiple lengths (Chowell et al., 2015).
Furthermore, immunogenic peptides of 10 amino-acid length
were found to be enriched in mutations in the presented residues
of the peptides (position 3 to 7), while no position-dependent
enrichment was found in 9-mers peptides (Figure 3K). Overall,
the majority of tested peptides were 9- and 10-mers, and no as-
sociation was found between peptide length and immunoge-
nicity (Figure S3).
Although each feature considered above was found to be
associated with peptide immunogenicity, interdependence be-
tween features makes it challenging to identify an optimal
threshold set to differentiate immunogenic versus non-immuno-
genic peptides. To overcome this, we developed a repeated-
random-subsample-based method to identify a set of features
and associated threshold values that stratify immunogenic pep-
tides (strategy depicted in Figure 3L, described in STAR
Methods). We applied this method to our peptide set to identify
ves prediction on average; blue, combination is detrimental to prediction on
al difference assessed by Kolmogorov-Smirnov test.
t at one standard deviation. Rho, Spearman rho.
atient. Color represented improvement status (as in C), and shape represents if
or that patient, triangle) or not (circle). (F) Fraction of predictions that are global
e median. *p < 0.05.

A
C
G
J K L
H I
D E F
B
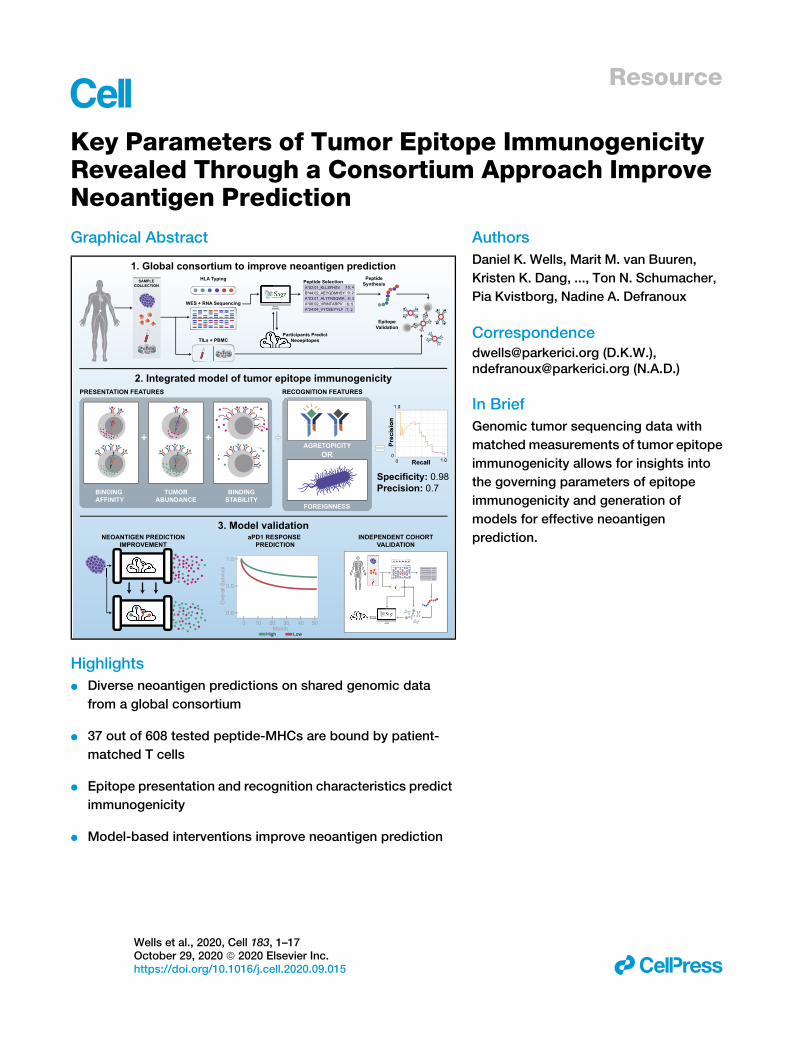
Figure 3. Presentation Features Associated with Peptide Immunogenicity
(A) Histogram of each feature considered.
(B) Heatmap of peptide length compared to mutation position.
(C) Violin plot of binding affinity stratified by peptide immunogenicity. *****: p < 10�5, Mann-Whitney U test.
(D) Violin plot of tumor abundance stratified by peptide immunogenicity. **p < 0.01, Mann-Whitney U test.
(E) Violin plot of binding stability stratified by peptide immunogenicity. ***p < 0.001, Mann-Whitney U test.
(F) Boxplot of peptide hydrophobicity fraction stratified by peptide immunogenicity. *p < 0.05, Mann-Whitney U test.
(G) Scatterplot of binding affinity compared to tumor abundance. Correlation: Spearman rho.
(H) Scatterplot of binding affinity compared to binding stability. Correlation: Spearman rho.
(legend continued on next page)
ll
Cell 183, 1–17, October 29, 2020 7
Please cite this article in press as: Wells et al., Key Parameters of Tumor Epitope Immunogenicity Revealed Through a Consortium ApproachImprove Neoantigen Prediction, Cell (2020), https://doi.org/10.1016/j.cell.2020.09.015
Resource

ll
Please cite this article in press as: Wells et al., Key Parameters of Tumor Epitope Immunogenicity Revealed Through a Consortium ApproachImprove Neoantigen Prediction, Cell (2020), https://doi.org/10.1016/j.cell.2020.09.015
Resource
optimal thresholds for each presentation feature (i.e., binding af-
finity, tumor abundance, binding stability, fraction hydrophobic,
and mutational position)—shown in Figure 3L. 286 (out of the
608) peptides had measurements of all 5 of these variables,
and it is this set we analyzed. Using our approach, we identified
a set of thresholds on these variables that filtered out 93% of
non-immunogenic peptides while maintaining 55% of immuno-
genic peptides (Figure 3L, p = 3.7*10�8, Fisher’s exact test).
This threshold set is composed of binding affinity less than
34 nM, tumor abundance greater than 33 TPM, and binding sta-
bility greater than 1.4 h. Because each of the variables consid-
ered here is associated with robust, durable peptide presenta-
tion, we term any peptide that passes all filters ‘‘presented,’’
and a total of 29 peptides are included in this group (shown in
Figure 3L). Notably, several of the thresholds identified by our
model, including thresholds for minimum binding affinity and tu-
mor abundance, are substantially more stringent than proposed
in existing literature (Bulik-Sullivan et al., 2018; Rajasagi et al.,
2014). Neither peptide hydrophobicity nor mutational position
was found to be important for optimal filtering. Of those immuno-
genic peptides that were filtered out, 50% (5/10) were filtered out
due to low tumor abundance, whereas 40% (4/10) were filtered
out by more than one filter (Figure S4). These results identify
MHC binding affinity, binding stability, and tumor abundance
as crucial presentation-associated parameters associated with
peptide immunogenicity.
Recognition Features of Immunogenic PeptidesWe next considered two peptide features hypothesized to be
associated the absence of pre-existing tolerization: ‘‘agretopic-
ity’’—the ratio of mutant binding affinity to wild-type binding af-
finity (Duan et al., 2014; Ghorani et al., 2018) and ‘‘foreign-
ness’’—TCR recognition probability derived from homology to
known pathogenic peptides in IEDB (Balachandran et al.,
2017; quksza et al., 2017; Richman et al., 2019). We reasoned
that these two features would be associated with immunoge-
nicity only among peptides that were the likeliest to be pre-
sented. Thus, we considered only the 29 pMHC that passed all
of the presentation-associated criteria defined in the previous
section. Specifically, the pMHC in this set all had MHC binding
affinity stronger than 34 nM, tumor abundance greater than 33
TPM, and binding stability greater than 1.4 h. This pMHC set
was comprised of 12 immunogenic peptides and 17 non-immu-
nogenic peptides. For these pMHC, agretopicity and foreignness
were found to be independent of presentation-associated pa-
rameters (Figure 4B). Furthermore, we observed that themajority
of these pMHChad agretopicity greater than 0.1 and foreignness
less than 10�16 (Figure 4C), while smaller subsets were found to
have values that were orders of magnitude smaller (agretopicity,
‘‘group 1’’) or larger (foreignness, ‘‘group 2’’). These subsets of
(I) Scatterplot of binding stability compared to hydrophobicity fraction. Correlatio
(J) Barplot of mutation position, normalized to each subset (immunogenic/non-im
(K) Length-dependent enrichment ofmutational position. Enrichment calculated as
dataset.
(L) Schematic of cross-validation scheme to select feature and threshold set. BA
drophobic; MP, mutation position. Right: contingency table using the optimal str
See also Figures S2, S3, S4, and S5 and Table S4.
8 Cell 183, 1–17, October 29, 2020
low agretopicity or high foreignness pMHC were mutually exclu-
sive (p = 0.005, binomial test). We term the presence of either low
agretopicity or high foreignness as ‘‘recognition’’ and term any
peptide in either group 1 or group 2 as ‘‘recognized.’’ Impor-
tantly, recognition is defined here as purely a property of a pep-
tide, and is not a priori associated with the immunogenicity of
that peptide in a particular patient.
Recognized peptides were strongly enriched in immunogenic
pMHC (Figure 4D, p = 0.003, Fisher’s exact test; odds ratio,
14.3). The significance of this enrichment was found to be
robust to the threshold values of binding affinity, tumor abun-
dance and binding stability used to select the presented set
(Figure S5). Among the 29 presented peptides, those in group
1 were enriched in mutations near anchor residues compared
to those in group 2. (Figure 4E, p = 0.03, Fisher’s exact test).
These results suggest that agretopicity and foreignness are
distinct, mutually exclusive peptide features that together
enrich for presented peptides, which aremore likely to generate
a T cell response.
Our results highlight 4 distinct, independent pMHC features—
strong binding affinity, high tumor abundance, high binding sta-
bility, and peptide recognition—that when all present, greatly
enrich for immunogenicity, and the overlap in these features
across the entire 286 pMHC considered in this analysis is shown
in Figure 4F. The presence of all four features was very strongly
enriched in immunogenic peptides (Figure 4G, p = 6*10�10,
Fisher’s exact test; odds ratio: 51.7), filtering out 98% of non-
immunogenic peptides while preserving 45% of immunogenic
ones. We finally compared the effects of the presentation and
recognition filters using precision recall curves in Figure 4H.
Ranking pMHC only by their measured MHC binding affinity
had a uniform precision less than 20%. Ranking pMHC first by
their presented status and subsequently by MHC binding affinity
had an optimal precision of�50%with 55% recall, while ranking
presented and recognized pMHC and then ranking by MHC
binding affinity had an optimal precision greater than 70% with
a recall of 45% (see STARMethods). Our results support an inte-
grative model of peptide immunogenicity that requires both
MHC presentation and T cell recognition and where T cell recog-
nition can be achieved through low peptide agretopicity or high
peptide foreignness.
Submission Features Associated with PipelinePerformanceBased on these identified characteristics of tumor epitopes, we
hypothesized that neoantigen prediction pipelines that priori-
tized these characteristics would perform better. We addressed
this question by analyzing the core output of each pipeline,
a ranked list of pMHC. For each submitted pMHC list, we
calculated a set of 14 distinct, quantitative features, described
n: Spearman rho.
munogenic) separately. **p < 0.01, Fisher’s exact test.
odds ratio from Fisher’s exact test. Gray denotes pairs that did not occur in our
, binding affinity; TA, tumor abundance; BS, binding stability; FH, fraction hy-
atification parameters (below). p, Fisher’s exact test.

A
D
F
G H
E
B C
Figure 4. Recognition Features Associated with Peptide Immunogenicity
(A) Illustration of agretopicity and foreignness features.
(B) Correlation between recognition and presentation associated features. Correlation calculated with spearman rho. All correlations not significant.
(C) Histograms of agretopicity (left) and foreignness (right) among presented peptides.
(D) Scatterplot of foreignness compared to agretopicity. Color: immunogenicity. Gray boxes denote low agretopicity or high foreignness peptides. Right: con-
tingency table comparing validation status to recognition status among presented peptides. p, Fisher’s exact test; OR, odds ratio.
(E) Barplot of mutation position by low agretopicity or high foreignness. *: P < 0.05.
(F) Upset plot of all four features associated with immunogenicity. Right: total number of peptides with that feature present.
(G) Contingency table over all peptides comparing validation status to presented and recognized status. p, Fisher’s exact test; OR, odds ratio.
(H) Precision-recall curves of peptides ranked only by MHC binding affinity (left), prioritizing presented peptides (center), and prioritizing presented and
recognized peptides (right). Circles represent optimal precision-recall tradeoffs.
ll
Cell 183, 1–17, October 29, 2020 9
Please cite this article in press as: Wells et al., Key Parameters of Tumor Epitope Immunogenicity Revealed Through a Consortium ApproachImprove Neoantigen Prediction, Cell (2020), https://doi.org/10.1016/j.cell.2020.09.015
Resource
***
***
1. Corr.: Rank vs. MHC Binding Affinity
2. Corr: Pred. MHC vs. Measured MHC
3. Max MHC Binding
Cor
rela
tion
−0.8
0.8
Cor
rela
tion
Feat
ure
ID
−0.5
0.5
4. Corr: Rank vs. Tumor Abundance
5. Min. Tumor Abundance
3456
2
789
1011
A
1213
8. Corr: Rank vs. Foreignness
9. Mean Foreignness
12.Frac. Top 100 Presented
13. Frac. Top 100 Recognized
Include Only: Predicted MHCBinding < 34 nM
Include Only: Predicted MHCBinding < 34 nM
1
0
AU
PRC
Orignal New
40
0
Difference0 0.5
40
0
Difference0 0.6
1.0
0
TTIF
Orignal New
C
F
14. Frac. Top 100 Presented & Recognized
B
14
TTIF FR AUPRC
6. Min. Half Life
7. Corr: Rank vs. Half Life
10. Corr: Rank vs. Agretopicity
11. Mean Agretopicity
1.0
0
Include Only: Presented &Recognized
Difference0 0.5 1.0
1
0
AU
PRC
Orignal New
5
0
Include Only: Presented &Recognized
TTIF
Orignal NewDifference0 0.5
5
0
E
H
1
0
AU
PRC
Orignal NewDifference
10
00 0.5 1.0
D Include Only: Presented
1.0
0
TTIF
Orignal NewDifference
0 1.00.5
G Include Only: Presented
10
0
*
*
*
*
*
*
*
*
*
**
** **
***
***
***
***
***
***
***
***
***
***
***
***
***
*** ***
***
9
12
34
56
78
1011
1213
1
14
14
*
**
*
*
*
**
**
**
**
**
***
***
***
******
******
***
***
m=0.5FI =0.94
m=0.28FI =0.92
m=0.08FI=0.38
1.0
m=0.49FI=0.89
m=0.20FI=0.70
***** m=0.09FI=0.67
***
*****
*****
*****
*****
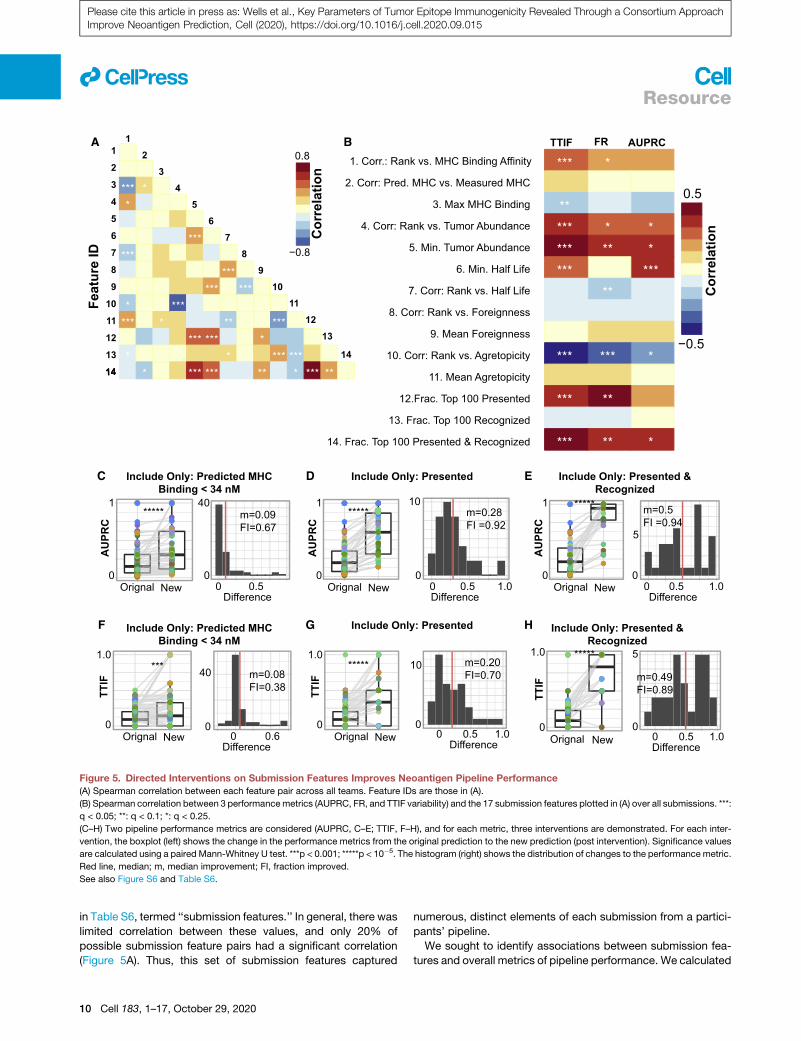
Figure 5. Directed Interventions on Submission Features Improves Neoantigen Pipeline Performance
(A) Spearman correlation between each feature pair across all teams. Feature IDs are those in (A).
(B) Spearman correlation between 3 performancemetrics (AUPRC, FR, and TTIF variability) and the 17 submission features plotted in (A) over all submissions. ***:
q < 0.05; **: q < 0.1; *: q < 0.25.
(C–H) Two pipeline performance metrics are considered (AUPRC, C–E; TTIF, F–H), and for each metric, three interventions are demonstrated. For each inter-
vention, the boxplot (left) shows the change in the performance metrics from the original prediction to the new prediction (post intervention). Significance values
are calculated using a paired Mann-Whitney U test. ***p < 0.001; *****p < 10�5. The histogram (right) shows the distribution of changes to the performance metric.
Red line, median; m, median improvement; FI, fraction improved.
See also Figure S6 and Table S6.
ll
Please cite this article in press as: Wells et al., Key Parameters of Tumor Epitope Immunogenicity Revealed Through a Consortium ApproachImprove Neoantigen Prediction, Cell (2020), https://doi.org/10.1016/j.cell.2020.09.015
Resource
in Table S6, termed ‘‘submission features.’’ In general, there was
limited correlation between these values, and only 20% of
possible submission feature pairs had a significant correlation
(Figure 5A). Thus, this set of submission features captured
10 Cell 183, 1–17, October 29, 2020
numerous, distinct elements of each submission from a partici-
pants’ pipeline.
We sought to identify associations between submission fea-
tures and overall metrics of pipeline performance. We calculated

Time (months)0 10 20 30 40 50
Time (months)0 10 20 30 40 50
Time (months)0 10 20 30 40 50
0
0.5
1.0Su
rviv
al P
roba
bilit
y
0
0.5
1.0
Surv
ival
Pro
babi
lity
0
0.5
1.0
CNBLow High
PNALow High
PRNALow High
Surv
ival
Pro
babi
lity
B C D
55 Melanoma Patients Primary MelanomaCutaneous 55 (100%)
TreatmentNivolumabPembrolizumab
20 (36%)35 (64%)
Previous IpilumumabNo 55 (100%)
SequencingHas WESHas RNA-Seq
55 (100%)55 (100%)
AClassical Neoantigen Burden
Calculate
Prestend NeoantigenAbundance
Presented and RecognizedNeoantigen Abundance
+ +++
+++ + +++ ++++
+ + +
+++++++++ + + ++++ +
++
+++ ++++++ +++
+ ++ +
++++++++++ +++++ +
++ +
+++++ +++ ++++
+ ++++ ++++++ ++ ++++++ +
Log-rank p=0.063Log-rank p=n.s.Log-rank p=n.s.
Figure 6. Predicted and Recognized Neoantigen Abundance Is Associated with Overall Survival to Anti-PD1
(A) Patient cohort table displaying primary type, treatment, previous immunotherapies, and presence of sequencing.
(B) Kaplan-Meier plot of overall survival stratified by CNB-high/low status. p value, log rank test.
(C) Kaplan-Meier plot of overall survival stratified by PNA-high/low status. p value, log rank test.
(D) Kaplan-Meier plot of overall survival stratified by PRNA-high/low status. p value, log rank test. All high/low cutoffs were taken to be the median across the
cohort.
ll
Please cite this article in press as: Wells et al., Key Parameters of Tumor Epitope Immunogenicity Revealed Through a Consortium ApproachImprove Neoantigen Prediction, Cell (2020), https://doi.org/10.1016/j.cell.2020.09.015
Resource
the Spearman correlation between these 14 submission features
and the three performance metrics introduced previously (TTIF,
FR, and AUPRC) (Figure 5B). Numerous submission features
were correlated with TTIF, FR, and AUPRC. Submissions that
prioritized pMHC with stronger MHC binding affinity (feature 1),
more stringently filtered out pMHCwith weakMHC binding affin-
ity (feature 3), low tumor abundance (feature 5), and low binding
stability (feature 6) all performed better across numerous met-
rics. Conversely, submissions that explicitly prioritized peptide
foreignness (features 8 and 9), agretopicity (features 10 and
11), or both (feature 13), without accounting for presentation,
either had no difference in performance or performed worse.
Correlation between predicted binding affinity and measured
binding affinity (feature 2) was not associated with improved pre-
diction performance. Finally, submissions with a large fraction of
their top 100 pMHC presented (feature 12) or presented and
recognized (feature 14) had substantially larger values of TTIF,
FR, and AUPRC. Together, these results demonstrate that sub-
missions that prioritized strong binding affinity, high tumor abun-
dance, and high binding stability, potentially coupled with pep-
tide recognition, had superior performance in TESLA.
Directed Interventions Improve Pipeline PerformanceWe identified traits of neoantigen prediction pipelines that
are correlated with improved ability to rank and identify neoan-
tigens. We next sought to understand if the implementation of
these traits would improve prediction. For AUPRC and TTIF
separately, we implemented a particular intervention on the
filtering and/or ranking in all submissions (Figures 5C–5H).
The three interventions considered were to remove all pMHC
with binding affinity greater than 34 nM (Figures 5C and 5F), re-
move all pMHC that do not pass the presented criteria from
Figure 3 (Figures 5D and 5G), and remove all pMHC that do
not pass both the presented and the recognized criteria from
Figure 4 (Figures 5D and 5G). In all cases, these interventions
significantly improved prediction compared to the initial sub-
mission set. Notably, although filtering on MHC improved only
a fraction of submissions (AUPRC, 67%; TTIF, 38%), these
values were greatly increased upon filtering for presentation
and presentation and recognition. Furthermore, these interven-
tions were rarely detrimental to prediction. Together, these re-
sults demonstrate that neoantigen prediction performance can
be substantially improved through the implementation of pipe-
line interventions identified by TESLA. We also applied these in-
terventions to a set of predictions made by an independent set
of TESLA teams who joined the consortium after peptide selec-
tion was complete. In this setting as well, the interventions
identified here significantly improved neoantigen prediction
(Figure S6).
Predicted and Recognized Neoantigen Abundance IsAssociated with Overall Survival to PD1 BlockadeTumor mutation burden (TMB) has been proposed as a
biomarker for response to immune checkpoint inhibitors (ICI)
(Samstein et al., 2019), however, its predictive value is inconsis-
tent (quksza et al., 2017) and in diseases such melanoma, may
Cell 183, 1–17, October 29, 2020 11

ASample Collection:Tumor/normal tissue pairsPBMC
HLA Typing
WES + RNA-seq
PBMC
Participants PredictNeoepitopes
Peptide Selection PeptideSynthesis
Epitope Validation
B 104
Bin
ding
Affi
nity
(nM
)
1
102
ImmunogenicityTrueFalse
*
CTu
mor
Abu
ndan
ce (
TPM
)
10-2
100
102
ImmunogenicityTrueFalse
**D
Bin
ding
Sta
bilit
y (H
ours
)
1.0
10
ImmunogenicityTrueFalse
1.0
p=0.06
Valid
atio
n St
atus
True
Fals
e
True
7
3
False
299
1
p<10-4 OR=116.5
Presented
Presented: Binding Affinity < 68 nM; Tumor Abundance > 10 TPM;Binding Stability > 1.7 hours
E
p=0.16
Valid
atio
n St
atus
True
Fals
e
True
2
3
False
5
0
OR=Inf.
FRecognized
10-14 10-810-11
Agr
etop
icity 100
10-1
10-2
ForeignnessRecall
0 1.0Recall
0 1.0Recall
0 1.00
0.09
Prec
isio
n
Prec
isio
n
0
0.4
Prec
isio
n
0
1.0Presented
Presented &Recognized
G
Valid
atio
n St
atus
True
Fals
e
True
2
3
False
304
1
OR=348
Presented & Recognized
p<10-5
Include Only: Predicted MHCBinding < 68 nM
Include Only: Predicted MHCBinding < 68 nM
Include Only: Presented &Recognized
Include Only: Presented &Recognized
Include Only: Presented
Include Only: Presented
Orignal New
0.5
0
TTIF
Orignal New
1.0
0
TTIF
Orignal New0
Difference0 0.5
Difference0 0.75
Orignal New
1
0
AU
PRC
Difference0 0.15
2
0Orignal New
1
0
AU
PRC
Difference0 0.75
2
0Orignal New
1
0
AU
PRC
Difference0 1.00.5
2
0
4
0
Difference0 1.0
2
0
I
m=0.05FI=0.67
m=0.26FI=0.67
m=0.32FI=0.67
m=0.5FI=0.67
m=0.57FI=0.8
Recognizedt:Agretopicity < 0.1 orForeignness > 10-16
ImmunogenicNon-immunogenic
H
m=0.1FI=0.429
1.0
TTIF
2
00.5
A*01:01_ATDTNNLNVNYA*02:01_ALDPHSGHFVA*01:01_YLDGKVVDYB*44:02_SELKATVELB*55:01_MPAFYPGPGI
Figure 7. Features Associated with Improved Neoepitope Prediction in a Validation Cohort
(A) Schematic of the validation experiment.
(B) Violin plot of binding affinity stratified by peptide immunogenicity. **: p < 10�2, Mann-Whitney U test.
(legend continued on next page)
ll
12 Cell 183, 1–17, October 29, 2020
Please cite this article in press as: Wells et al., Key Parameters of Tumor Epitope Immunogenicity Revealed Through a Consortium ApproachImprove Neoantigen Prediction, Cell (2020), https://doi.org/10.1016/j.cell.2020.09.015
Resource

ll
Please cite this article in press as: Wells et al., Key Parameters of Tumor Epitope Immunogenicity Revealed Through a Consortium ApproachImprove Neoantigen Prediction, Cell (2020), https://doi.org/10.1016/j.cell.2020.09.015
Resource
be confounded with primary type (Liu et al., 2019). Based on our
results above, we hypothesized that ametric that integrates rele-
vant aspects of both tumor epitope presentation and recognition
may offer improved predictive power for benefit from ICI. Thus,
we developed the metric predicted and recognized neoantigen
abundance (PRNA), the sum abundance of all mutations that
satisfy both the ‘‘presented’’ criteria and the ‘‘recognized’’
criteria (STAR Methods). We sought to determine if this metric
would outperform other metrics which do not incorporate all
relevant features of tumor epitope immunogenicity, by
comparing it to classical neoantigen burden (CNB, an analog
of TMB that filters out only those mutations with MHC binding af-
finity greater than 500 nM) and to the predicted neoantigen abun-
dance (PNA, the sum abundance of all mutations that satisfy the
‘‘presented’’ criteria, STAR Methods). We applied these metrics
to a cohort of 55 melanoma patients homogeneous in treatment
(anti-PD1), primary type (cutaneous), and treatment history (ICI-
naive), who all had whole exome and RNA-sequencing of tumor
biopsy samples before treatment initiation (Liu et al., 2019) (Fig-
ure 6A). On these samples, we calculated CNB, PNA, and PRNA.
Stratifying this patient cohort by the median value of each metric
showed no significant association with CNB or PNA with overall
survival (Figures 6B and 6C, p: log rank test). However, patients
with tumors with above-median PRNA values did have signifi-
cantly longer overall survival than those with below-median
PRNA values (Figure 6D, p = 0.063, log rank test). Furthermore,
PRNA-high patients were �50% more likely to survive longer
than 2 years. These results suggest that the integrated portrait
of epitope immunogenicity developed here may help improve
understanding of response to ICI.
Validation in an Independent CohortTo assess whether the results identified herein are robust
beyond our initial cohort, we identified an independent cohort
of 3 melanoma patients with whole exome tumor-normal DNA
sequencing and tumor RNA sequencing from tissue samples
and for which 310 pMHC had been tested for immunogenicity
using a tetramer-based assay in patient-matched PBMC sam-
ples (Figure S7; Table S7). Of those pMHC tested, 4 were found
to be immunogenic (Figure 7A). In this cohort, immunogenic pep-
tides had significantly stronger binding affinity (Figure 7B, p =
0.012, Mann-Whitney U); significantly higher tumor abundance
(Figure 7C, p = 0.033, Mann-Whitney U), and longer binding sta-
bility (Figure 7D, p = 0.067, Mann-Whitney U). Applying the same
repeated-random-subsample method on these peptides identi-
fied a threshold set that incorporated all three of these features
(C) Violin plot of tumor abundance stratified by peptide immunogenicity. *: p < 0
(D) Violin plot of binding stability stratified by peptide immunogenicity. p = 0.06,
(E) Contingency table using optimal stratification parameters (below). p, Fisher’s
(F) Scatterplot of foreignness compared to agretopicity. Color: immunogenicity. Ri
presented peptides. p, Fisher’s exact test; OR, odds ratio.
(G) Precision-recall curves of peptides ranked only by MHC binding affinity (
recognized peptides (right). Circles represent optimal precision-recall tradeoffs.
(H) Contingency table over all peptides comparing validation status to presented
(I) Two pipeline performance metrics are considered (AUPRC, top; TTIF, bottom
vention, the boxplot (left) shows the change in the performance metrics from the o
shows the distribution of changes to the performance metric. Red line, median;
See also Table S7.
with similar values to our initial cohort and that filtered out 97%
of non-immunogenic peptides while preserving 75% of immuno-
genic ones (Figure 7E, p = 9*10�5, odds ratio: 116.5; Fisher’s
exact test). Of the remaining 10 pMHC that met all of the ‘‘pre-
sented’’ criteria, 100% of immunogenic pMHC also met the
recognition criteria (low agretopicity or high foreignness),
whereas only 28% of non-immunogenic pMHC did (Figure 7F).
Filtering pMHC on both presentation and recognition criteria
achieved a recall of 75% and filtered out 99% of non-immuno-
genic peptides (Figures 7G and 7H; p = 8*10�6, odds ratio:
348, Fisher’s exact test). Finally, to assess if these parameters
were associated with improved neoantigen prediction, we gath-
ered neoepitope predictions from the DNA and RNA sequencing
data from four TESLA participants. Although the predictive ability
of participants on these data was low, potentially owing to
reduced number of identified immunogenic peptide, interven-
tions identical to those on the initial cohort demonstratedmarked
improvement in neoepitope prediction, with the large majority of
submissions showing substantial improvement (Figure 7I).
DISCUSSION
Effective neoantigen prediction relies on understanding the pa-
rameters governing epitope immunogenicity. By directly
measuring epitope immunogenicity in patient-matched T cells,
we uncover features of peptides and pMHC associated with
in vivo immune recognition to construct an integrated model of
tumor epitope immunogenicity. Because candidate epitopes
were drawn from a broad set of prediction pipelines, we
increased the diversity of tested predictions and removed poten-
tial bias associated with using predictions from only a single
pipeline. The importance of the features we identify, such as
agretopicity and foreignness, has previously been hypothesized
from in vitro or otherwise indirect methods, and this is among the
first studies demonstrating their importance in a human cancer
setting. These results comprehensively characterize �50% of
immunogenic tumor epitopes: they are those tumor peptides
that have strong MHC binding affinity and long half-life, are ex-
pressed highly, and have either low agretopicity or high
foreignness.
This work does not address 4 further considerations about
neoepitope immunogenicity. First, the peptides tested were
generated from small somatic variants (SNV and/or indels); com-
plex variant structures such as fusion proteins (Yang et al., 2019),
splice-isoforms (Kahles et al., 2018; Robinson et al., 2019), aber-
rantly expressed introns of mutant genes (Smart et al., 2018),
.05, Mann-Whitney U test.
Mann-Whitney U test.
exact test.
ght: contingency table comparing validation status to recognition status among
left), prioritizing presented peptides (center), and prioritizing presented and
and recognized status. p, Fisher’s exact test. OR, odds ratio.
), and for each metric, three interventions are demonstrated. For each inter-
riginal prediction to the new prediction (post intervention). The histogram (right)
m, median improvement; FI, fraction improved.
Cell 183, 1–17, October 29, 2020 13

ll
Please cite this article in press as: Wells et al., Key Parameters of Tumor Epitope Immunogenicity Revealed Through a Consortium ApproachImprove Neoantigen Prediction, Cell (2020), https://doi.org/10.1016/j.cell.2020.09.015
Resource
modified peptides (Cobbold et al., 2013), or non-proteinaceous
antigens, which are currently difficult to identify using common
genomic approaches, were not considered. In some cases,
however, neoantigens arising from these variants may represent
major classes of highly immunogenic abnormal molecules ex-
pressed in tumor cells (Smith et al., 2019). Second, we focused
our validation efforts on identifying peptides associated with
pre-existing T cell specificities. By definition, these would arise
from tumor neoantigens that are sufficient to drive naturally
occurring immune responses. However, this validation approach
might overlook neoantigens whose immunogenicity could be
enhanced by appropriate vaccination approaches. Third, our
validation approach focused only on MHC-I restricted antigens
and did not take into account the important role that MHC-II
restricted antigens, and more broadly, the role CD4+ T cells,
play in the development of effective immune responses to tu-
mors (Abelin et al., 2019; Alspach et al., 2019; Kreiter et al.,
2015; Ott et al., 2017). Finally, the approach we take here looks
at immunogenicity of tumor antigens in patient-matched sam-
ples and does not address the rules governing epitope immuno-
genicity in the context of allogeneic T cells (Strønen et al., 2016).
Identifying those rules may aid in the development of allogeneic
neoantigen-directed adoptive T cell therapies (Bethune and Jo-
glekar, 2017).
The analysis approach we take attempts to balance between
specificity and sensitivity in the identification of neoepitopes. In
some treatment settings, however, like in RNA-based vaccines
or in searching for tumor-reactive TIL (Sahin et al., 2017; Yama-
moto et al., 2019), specificity is not as serious a challenge, and
the parameter values used here may be tuned to increase sensi-
tivity or other metrics of interest. Furthermore, although this
study identified key parameters governing epitope immunoge-
nicity, the values of those parameters may differ based on the
approach used for DNA/RNA sequencing, binding affinity pre-
diction, and other bioinformatic steps, as well as the type of can-
cer. Notably, the tumor types considered here are characterized
by a high mutational burden originating from exposure to UV ra-
diation (melanoma) or cigarette smoke (NSCLC), which could in-
fluence the peptides included in this study (Hellmann et al., 2018;
Samstein et al., 2019). As such, parameter values in other set-
tings may need further calibration to optimally meet the criteria
for a particular treatment setting and approach. For these rea-
sons, it is our goal that the data assembled here be a resource
for the community to identify new features that differentiate
immunogenic pMHC, calibrate and tune neoepitope prediction
pipelines for particular use cases, and ultimately, be used to
benchmark and improve neoantigen prediction methods.
STAR+METHODS
Detailed methods are provided in the online version of this paper
and include the following:
d KEY RESOURCES TABLE
d RESOURCE AVAILABILITY
14 C
B Lead Contact
B Materials Availability
B Data and Code Availability
ell 183, 1–17, October 29, 2020
d EXPERIMENTAL MODEL AND SUBJECT DETAILS
d METHOD DETAILS
B Subjects, Treatment, and Specimen Collection
B Tissue lysate preparation
B Whole Exome Sequencing and RNA Sequencing
B IDT Exome
B RNA-seq
B Human Leukocyte Antigen (HLA) typing
B Peptide Synthesis
B Neoepitope Predictions
B Workflow Survey
B Process for Choosing Neoepitopes to Test in Valida-
tion Assays
B Validation Experiments
B Class I Peptide Binding Assay (‘HLA binding’)
B MHC Class I Multimer Binding Assay (Flow Cytometry)
B Production of Exchanged Peptide-MHC Class I Mono-
mers –
B Production of Multimer Staining –
B Data Acquisition and Analysis –
B MHC I Nanoparticle Pull-Down Assay (Microscopy)
B Analytic Methods
d QUANTIFICATION AND STATISTICAL ANALYSIS
SUPPLEMENTAL INFORMATION
Supplemental Information can be found online at https://doi.org/10.1016/j.
cell.2020.09.015.
ACKNOWLEDGMENTS
We thank all the subjects who contributed to this study through donation of tu-
mor and blood samples, as well as the research staff at UCLA and MSKCC for
sample collection and processing. We acknowledge Olga Malkova, Diane E.
Bender, Likui Yang, and Tammi Vickery for their work on MHC I multimer bind-
ing assay and nucleic acid isolation and sequencing; Jeff Bluestone, Jeff Ham-
merbacher, Ansuman Satpathy, and Robert Vonderheide for helpful and sup-
portive comments; and David Liu and Eliezer van Allen for help in obtaining
access to published data. TESLA was conceived collaboratively between
the Parker Institute for Cancer Immunotherapy (PICI) and the Cancer Research
Institute (CRI), and primary financial support came from PICI, a not-for-profit
organization. Additional financial support was provided by NIH (R21 AI34127
to A.S.), an NIH training grant (GM08042 to J.M.Z.), a UCLA Tumor Immu-
nology training grant (NIH T32CA009120), the CRI Irvington Postdoctoral
Fellowship Program (to K.M.C.), and the Queen Wilhelmina Cancer Research
Award (to T.N.S.).
AUTHOR CONTRIBUTIONS
Conceptualization, V.M.H.-L., A.K., J.G., F.R., and R.D.S.; Methodology,
D.K.W., N.A.D., K.K.D., J.G., A.K., N.H., A.S., J.R.H., N.B., F.R., R.D.S.,
T.N.S., and P.K.; Software, D.K.W., K.K.D., A.L., A.J.R., T.V.Y., X.C.D., and
the Tumor Neoantigen Selection Alliance; Validation, M.M.v.B., T.N.S., and
P.K.; Formal Analysis: D.K.W. and K.K.D.; Investigation: D.K.W., N.A.D.,
M.M.v.B., K.K.D., K.C.F.S., K.M.C., J.P.W., J.S., A.B.B., B.C.-A., A.H.C.N.,
W.C., G.M.S., and the Tumor Neoantigen Selection Alliance; Resources,
K.K.D., K.C.F.S., A.L., J.P.W., A.J.R., J.M.Z., B.C-A., T.V.Y., H.R., J.M.C.,
P.M., the Tumor Neoantigen Selection Alliance, T.M., J.G., C.S., A.R.,
M.D.H., A.S., J.R.H., N.B., R.D.S., T.N.S., and P.K.S.; Data Curation,
D.K.W., N.A.D., M.M.v.B., K.K.D., K.C.F.S., A.L., T.V.Y., H.R., J.M.C., and
P.K.; Writing – Original Draft, D.K.W. and N.A.D.; Writing – Review & Editing,
D.K.W., N.A.D., M.M.v.B., K.K.D., V.M.H.-L., K.C.F.S., M.D.H., N.H., F.R.,
R.D.S., T.N.S., and P.K.; Visualization, D.K.W. and N.A.D.; Supervision,

ll
Please cite this article in press as: Wells et al., Key Parameters of Tumor Epitope Immunogenicity Revealed Through a Consortium ApproachImprove Neoantigen Prediction, Cell (2020), https://doi.org/10.1016/j.cell.2020.09.015
Resource
N.A.D., D.K.W., M.M.v.B., K.K.D., K.C.F.S.,T.M., J.G., C.S., A.R., M.D.H.,
N.H., A.S., J.R.H., N.B., F.R., R.D.S., T.N.S., and P.K.; Project Administration,
N.A.D., D.K.W., K.K.D., C.S., F.R., and P.K.
DECLARATION OF INTERESTS
D.K.W. is a paid scientific advisor and shareholder in Immunai and receives
research support from Bristol-Myers Squibb. M.M.v.B. is a stockholder and
employee of BioNTech. V.M.H.-L. is an unpaid scientific advisor and holds eq-
uity in FX Biopharma. B.C.-A. has a contract grant with Kite Pharma and is a
member of the Institutional Biosafety Committee (IBC) at Advarra Inc. N.H. is
a stockholder in BioNTech, K.M.C. is a stockholder in Geneoscopy. J.Z. is
an equity/stock holder and consultant to PACT Pharma. A.R. has received
honoraria from consulting with Amgen, Bristol-Myers Squibb, Chugai, Genen-
tech, Merck, Novartis, and Roche, is or has been a member of the scientific
advisory board, and holds stock in Advaxis, Arcus Biosciences, Bioncotech
Therapeutics, Compugen, CytomX, Five Prime, FLX-Bio, ImaginAb, Isoplexis,
Kite-Gilead, Lutris Pharma, Merus, PACT Pharma, Rgenix, and Tango Thera-
peutics. M.D.H. receives research support from Bristol-Myers Squibb, has
been a compensated consultant for Merck, Bristol-Myers Squibb,
AstraZeneca, Genentech/Roche, Nektar, Syndax, Mirati, Shattuck Labs, Im-
munai, Blueprint Medicines, Achilles, and Arcus, received travel support/hon-
oraria from AstraZeneca, Eli Lilly, and Bristol-Myers Squibb, has options from
Shattuck Labs, Immunai, and Arcus, and has a patent filed by his institution
related to the use of tumor mutation burden to predict response to immuno-
therapy (PCT/US2015/062208), which has received licensing fees from
PGDx. P.K. is a consultant for Neon Therapeutics and Personalis. J.R.H. is
board member and founder of Isoplexis and board member and founder of
PACT. F.R. is an advisor/consultant to Equillium Bio, Good Therapeutics, Se-
lectION, Inc., Cascade Drug Development Group, aTyr Pharma, and Lumos
Pharma, and is a founder and holds equity in Sonoma Biotherapeutics.
R.D.S. is a cofounder, scientific advisory boardmember, stockholder, and roy-
alty recipient of Jounce Therapeutics and Neon Therapeutics and is a scientific
advisory board member for A2 Biotherapeutics, BioLegend, Codiak Biosci-
ences, Constellation Pharmaceuticals, NGM Biopharmaceuticals, and Sensei
Biotherapeutics. J.S. and A.S. receive funding from BMS and Gritstone, are
consultants for Turnstone, and perform fee-for-service assays for Neon. A.S.
is a consultant for Gritstone. N.B. receives research funds from Novocure,
Celldex, Ludwig institute, Genentech, Oncovir, Melanoma Research Alliance,
Cancer Research Institute, Leukemia & Lymphoma Society, 485, NYSTEM,
and Regeneron, and is on the advisory boards of Neon, Tempest, Checkpoint
Sciences, Curevac, Primevax, Novartis, Array BioPharma, Roche, and Avidea.
T.N.S. receives research funds from Merck KGaA, is consultant/advisory
board member for Adaptive Biotechnologies, AIMM Therapeutics, Allogene
Therapeutics, Merus, Neogene Therapeutics, Neon Therapeutics, Scenic
Biotech, and Third Rock Ventures, and is a stockholder in AIMM Therapeutics,
Allogene Therapeutics, BioNTech, Merus, Neogene Therapeutics, Scenic
Biotech, and Third Rock Ventures Fund IV and V. A.R. has received honoraria
from consulting with Amgen, Bristol-Myers Squibb, Chugai, Genentech,
Merck, Novartis, Roche, and Sanofi, is or has been a member of the scientific
advisory board, holds stock in Advaxis, Apricity, Arcus Biosciences, Bio-
ncotech Therapeutics, Compugen, CytomX, Five Prime, FLX-Bio, ImaginAb,
Isoplexis, Kite-Gilead, Lutris Pharma, Merus, PACT Pharma, Rgenix, and
Tango Therapeutics, has received research funding from Agilent and from
Bristol-Myers Squibb through Stand Up to Cancer (SU2C), and has received
payment for licensing a patent on non-viral T cell gene editing to Arsenal.
The remaining authors declare no conflicts of interest.
Received: March 30, 2020
Revised: July 8, 2020
Accepted: September 3, 2020
Published: October 9, 2020
REFERENCES
Abelin, J.G., Keskin, D.B., Sarkizova, S., Hartigan, C.R., Zhang, W., Sidney, J.,
Stevens, J., Lane, W., Zhang, G.L., Eisenhaure, T.M., et al. (2017). Mass Spec-
trometry Profiling of HLA-Associated Peptidomes in Mono-allelic Cells En-
ables More Accurate Epitope Prediction. Immunity 46, 315–326.
Abelin, J.G., Harjanto, D., Malloy, M., Suri, P., Colson, T., Goulding, S.P.,
Creech, A.L., Serrano, L.R., Nasir, G., Nasrullah, Y., et al. (2019). Defining
HLA-II Ligand Processing and Binding Rules with Mass Spectrometry En-
hances Cancer Epitope Prediction. Immunity 51, 766–779.
Alspach, E., Lussier, D.M., Miceli, A.P., Kizhvatov, I., DuPage, M., Luoma,
A.M., Meng, W., Lichti, C.F., Esaulova, E., Vomund, A.N., et al. (2019). MHC-
II neoantigens shape tumour immunity and response to immunotherapy. Na-
ture 574, 696–701.
Andersen, R.S., Kvistborg, P., Frøsig, T.M., Pedersen, N.W., Lyngaa, R., Bak-
ker, A.H., Shu, C.J., Straten, Pt., Schumacher, T.N., and Hadrup, S.R. (2012).
Parallel detection of antigen-specific T cell responses by combinatorial encod-
ing of MHC multimers. Nat. Protoc. 7, 891–902.
Balachandran, V.P., quksza, M., Zhao, J.N., Makarov, V., Moral, J.A., Remark,
R., Herbst, B., Askan, G., Bhanot, U., Senbabaoglu, Y., et al. (2017). Identifica-
tion of unique neoantigen qualities in long-term survivors of pancreatic cancer.
Nature 551, 512–516.
Barnes, M.R. (2003). Bioinformatics for Geneticists. (Wiley), pp. 39–70.
Bethune, M.T., and Joglekar, A.V. (2017). Personalized T cell-mediated cancer
immunotherapy: progress and challenges. Curr. Opin. Biotechnol. 48,
142–152.
Bulik-Sullivan, B., Busby, J., Palmer, C.D., Davis, M.J., Murphy, T., Clark, A.,
Busby, M., Duke, F., Yang, A., Young, L., et al. (2018). Deep learning using tu-
mor HLA peptidemass spectrometry datasets improves neoantigen identifica-
tion. Nat. Biotechnol. 37, 55.
Callari, M., Sammut, S.-J., DeMattos-Arruda, L., Bruna, A., Rueda, O.M., Chin,
S.-F., and Caldas, C. (2017). Intersect-then-combine approach: improving the
performance of somatic variant calling in whole exome sequencing data using
multiple aligners and callers. Genome Med. 9, 35.
Carraro, M., Minervini, G., Giollo, M., Bromberg, Y., Capriotti, E., Casadio, R.,
Dunbrack, R., Elefanti, L., Fariselli, P., Ferrari, C., et al. (2017). Performance of
in silico tools for the evaluation of p16INK4a (CDKN2A) variants in CAGI. Hum.
Mutat. 38, 1042–1050.
Carreno, B.M., Magrini, V., Becker-Hapak, M., Kaabinejadian, S., Hundal, J.,
Petti, A.A., Ly, A., Lie, W.-R., Hildebrand, W.H., Mardis, E.R., and Linette,
G.P. (2015). Cancer immunotherapy. A dendritic cell vaccine increases the
breadth and diversity of melanoma neoantigen-specific T cells. Science 348,
803–808.
Chowell, D., Krishna, S., Becker, P.D., Cocita, C., Shu, J., Tan, X., Greenberg,
P.D., Klavinskis, L.S., Blattman, J.N., and Anderson, K.S. (2015). TCR contact
residue hydrophobicity is a hallmark of immunogenic CD8+ T cell epitopes.
Proc. Natl. Acad. Sci. USA 112, E1754–E1762.
Cobbold, M., Pena, H.D.L., Norris, A., Polefrone, J.M., Qian, J., English, A.M.,
Cummings, K.L., Penny, S., Turner, J.E., Cottine, J., et al. (2013). MHCClass I–
Associated Phosphopeptides Are the Targets of Memory-like Immunity in Leu-
kemia. Sci. Transl. Med. 5, 203ra125.
Cohen, C.J., Gartner, J.J., Horovitz-Fried, M., Shamalov, K., Trebska-McGo-
wan, K., Bliskovsky, V.V., Parkhurst, M.R., Ankri, C., Prickett, T.D., Crystal,
J.S., et al. (2015). Isolation of neoantigen-specific T cells from tumor and pe-
ripheral lymphocytes. J. Clin. Invest. 125, 3981–3991.
Daneshjou, R., Wang, Y., Bromberg, Y., Bovo, S., Martelli, P.L., Babbi, G.,
Lena, P.D., Casadio, R., Edwards, M., Gifford, D., et al. (2017). Working toward
precision medicine: Predicting phenotypes from exomes in the Critical
Assessment of Genome Interpretation (CAGI) challenges. Hum. Mutat. 38,
1182–1192.
Duan, F., Duitama, J., Al Seesi, S., Ayres, C.M., Corcelli, S.A., Pawashe, A.P.,
Blanchard, T., McMahon, D., Sidney, J., Sette, A., et al. (2014). Genomic and
bioinformatic profiling of mutational neoepitopes reveals new rules to predict
anticancer immunogenicity. J. Exp. Med. 211, 2231–2248.
Finotello, F., Rieder, D., Hackl, H., and Trajanoski, Z. (2019). Next-generation
computational tools for interrogating cancer immunity. Nat. Rev. Genet. 20,
724–746.
Cell 183, 1–17, October 29, 2020 15

ll
Please cite this article in press as: Wells et al., Key Parameters of Tumor Epitope Immunogenicity Revealed Through a Consortium ApproachImprove Neoantigen Prediction, Cell (2020), https://doi.org/10.1016/j.cell.2020.09.015
Resource
Fritsch, E.F., Rajasagi, M., Ott, P.A., Brusic, V., Hacohen, N., and Wu, C.J.
(2014). HLA-binding properties of tumor neoepitopes in humans. Cancer Im-
munol. Res. 2, 522–529.
Garcia-Garijo, A., Fajardo, C.A., and Gros, A. (2019). Determinants for Neoan-
tigen Identification. Front. Immunol. 10, 1392.
Ghorani, E., Rosenthal, R., McGranahan, N., Reading, J.L., Lynch, M., Peggs,
K.S., Swanton, C., and Quezada, S.A. (2018). Differential binding affinity of
mutated peptides for MHC class I is a predictor of survival in advanced lung
cancer and melanoma. Ann. Oncol. 29, 271–279.
Goff, S.L., Dudley, M.E., Citrin, D.E., Somerville, R.P., Wunderlich, J.R., Dan-
forth, D.N., Zlott, D.A., Yang, J.C., Sherry, R.M., Kammula, U.S., et al.
(2016). Randomized, Prospective Evaluation Comparing Intensity of Lympho-
depletion Before Adoptive Transfer of Tumor-Infiltrating Lymphocytes for Pa-
tients With Metastatic Melanoma. J. Clin. Oncol. 34, 2389–2397.
Grau, J., Grosse, I., and Keilwagen, J. (2015). PRROC: computing and visual-
izing precision-recall and receiver operating characteristic curves in R. Bioin-
formatics 31, 2595–2597.
Gubin, M.M., Zhang, X., Schuster, H., Caron, E., Ward, J.P., Noguchi, T., Iva-
nova, Y., Hundal, J., Arthur, C.D., Krebber, W.-J., et al. (2014). Checkpoint
blockade cancer immunotherapy targets tumour-specific mutant antigens.
Nature 515, 577–581.
Gubin, M.M., Artyomov, M.N., Mardis, E.R., and Schreiber, R.D. (2015). Tumor
neoantigens: building a framework for personalized cancer immunotherapy.
J. Clin. Invest. 125, 3413–3421.
Guinney, J., Wang, T., Laajala, T.D., Winner, K.K., Bare, J.C., Neto, E.C., Khan,
S.A., Peddinti, G., Airola, A., Pahikkala, T., et al.; Prostate Cancer Challenge
DREAMCommunity (2017). Prediction of overall survival for patients with met-
astatic castration-resistant prostate cancer: development of a prognostic
model through a crowdsourced challenge with open clinical trial data. Lancet
Oncol. 18, 132–142.
Hacohen, N., Fritsch, E.F., Carter, T.A., Lander, E.S., andWu, C.J. (2013). Get-
ting personal with neoantigen-based therapeutic cancer vaccines. Cancer Im-
munol. Res. 1, 11–15.
Hanahan, D., and Weinberg, R.A. (2011). Hallmarks of cancer: the next gener-
ation. Cell 144, 646–674.
Hellmann, M.D., Nathanson, T., Rizvi, H., Creelan, B.C., Sanchez-Vega, F.,
Ahuja, A., Ni, A., Novik, J.B., Mangarin, L.M.B., Abu-Akeel, M., et al. (2018).
Genomic Features of Response to Combination Immunotherapy in Patients
with Advanced Non-Small-Cell Lung Cancer. Cancer Cell 33, 843–852.
Henikoff, S., and Henikoff, J.G. (1992). Amino acid substitution matrices from
protein blocks. Proc. Natl. Acad. Sci. USA 89, 10915–10919.
Hoof, I., Peters, B., Sidney, J., Pedersen, L.E., Sette, A., Lund, O., Buus, S.,
and Nielsen, M. (2009). NetMHCpan, a method for MHC class I binding predic-
tion beyond humans. Immunogenetics 61, 1–13.
Hoskins, R.A., Repo, S., Barsky, D., Andreoletti, G., Moult, J., and Brenner,
S.E. (2017). Reports from CAGI: The Critical Assessment of Genome Interpre-
tation. Hum. Mutat. 38, 1039–1041.
Hundal, J., Carreno, B.M., Petti, A.A., Linette, G.P., Griffith, O.L., Mardis, E.R.,
and Griffith, M. (2016). pVAC-Seq: A genome-guided in silico approach to
identifying tumor neoantigens. Genome Med. 8, 11.
Kahles, A., Lehmann, K.-V., Toussaint, N.C., Huser, M., Stark, S.G., Sachsen-
berg, T., Stegle, O., Kohlbacher, O., Sander, C., and Ratsch, G.; Cancer
Genome Atlas Research Network (2018). Comprehensive Analysis of Alterna-
tive Splicing Across Tumors from 8,705 Patients. Cancer Cell 34, 211–224.
Keller, A., Gerkin, R.C., Guan, Y., Dhurandhar, A., Turu, G., Szalai, B., Main-
land, J.D., Ihara, Y., Yu, C.W.,Wolfinger, R., et al.; DREAMOlfaction Prediction
Consortium (2017). Predicting human olfactory perception from chemical fea-
tures of odor molecules. Science 355, 820–826.
Keskin, D.B., Anandappa, A.J., Sun, J., Tirosh, I., Mathewson, N.D., Li, S., Oli-
veira, G., Giobbie-Hurder, A., Felt, K., Gjini, E., et al. (2019). Neoantigen vac-
cine generates intratumoral T cell responses in phase Ib glioblastoma trial. Na-
ture 565, 234–239.
16 Cell 183, 1–17, October 29, 2020
Kreimer, A., Zeng, H., Edwards, M.D., Guo, Y., Tian, K., Shin, S., Welch, R.,
Wainberg, M., Mohan, R., Sinnott-Armstrong, N.A., et al. (2017). Predicting
gene expression in massively parallel reporter assays: A comparative study.
Hum. Mutat. 38, 1240–1250.
Kreiter, S., Vormehr, M., van de Roemer, N., Diken, M., Lower, M., Diekmann,
J., Boegel, S., Schrors, B., Vascotto, F., Castle, J.C., et al. (2015). Mutant MHC
class II epitopes drive therapeutic immune responses to cancer. Nature 520,
692–696.
Kvistborg, P., Shu, C.J., Heemskerk, B., Fankhauser, M., Thrue, C.A., Toebes,
M., van Rooij, N., Linnemann, C., van Buuren, M.M., Urbanus, J.H.M., et al.
(2012). TIL therapy broadens the tumor-reactive CD8(+) T cell compartment
in melanoma patients. OncoImmunology 1, 409–418.
Lagonigro, M.S., De Cecco, L., Carninci, P., Di Stasi, D., Ranzani, T., Rodolfo,
M., and Gariboldi, M. (2004). CTAB-ureamethod purifies RNA frommelanin for
cDNA microarray analysis. Pigment Cell Res. 17, 312–315.
Liu, D., Schilling, B., Liu, D., Sucker, A., Livingstone, E., Jerby-Arnon, L., Zim-
mer, L., Gutzmer, R., Satzger, I., Loquai, C., et al. (2019). Integrative molecular
and clinical modeling of clinical outcomes to PD1 blockade in patients with
metastatic melanoma. Nat. Med. 25, 1916–1927.
quksza, M., Riaz, N., Makarov, V., Balachandran, V.P., Hellmann, M.D., Solo-
vyov, A., Rizvi, N.A., Merghoub, T., Levine, A.J., Chan, T.A., et al. (2017). A neo-
antigen fitness model predicts tumour response to checkpoint blockade
immunotherapy. Nature 551, 517–520.
Matsushita, H., Vesely, M.D., Koboldt, D.C., Rickert, C.G., Uppaluri, R., Ma-
grini, V.J., Arthur, C.D., White, J.M., Chen, Y.-S., Shea, L.K., et al. (2012). Can-
cer exome analysis reveals a T-cell-dependent mechanism of cancer immu-
noediting. Nature 482, 400–404.
O’Donnell, T.J., Rubinsteyn, A., Bonsack, M., Riemer, A.B., Laserson, U., and
Hammerbacher, J. (2018). MHCflurry: Open-Source Class I MHC Binding Af-
finity Prediction. Cell Syst. 7, 129–132.
Ott, P.A., Hu, Z., Keskin, D.B., Shukla, S.A., Sun, J., Bozym, D.J., Zhang, W.,
Luoma, A., Giobbie-Hurder, A., Peter, L., et al. (2017). An immunogenic per-
sonal neoantigen vaccine for patients with melanoma. Nature 547, 217–221.
Peng, S., Zaretsky, J.M., Ng, A.H.C., Chour, W., Bethune, M.T., Choi, J., Hsu,
A., Holman, E., Ding, X., Guo, K., et al. (2019). Sensitive Detection and Analysis
of Neoantigen-Specific T Cell Populations from Tumors and Blood. Cell Rep.
28, 2728–2738.
Rajasagi, M., Shukla, S.A., Fritsch, E.F., Keskin, D.B., DeLuca, D., Carmona,
E., Zhang, W., Sougnez, C., Cibulskis, K., Sidney, J., et al. (2014). Systematic
identification of personal tumor-specific neoantigens in chronic lymphocytic
leukemia. Blood 124, 453–462.
Rasmussen, M., Fenoy, E., Harndahl, M., Kristensen, A.B., Nielsen, I.K., Niel-
sen, M., and Buus, S. (2016). Pan-Specific Prediction of Peptide-MHC Class I
Complex Stability, a Correlate of T Cell Immunogenicity. J. Immunol. 197,
1517–1524.
Richman, L.P., Vonderheide, R.H., and Rech, A.J. (2019). Neoantigen Dissim-
ilarity to the Self-Proteome Predicts Immunogenicity and Response to Immune
Checkpoint Blockade. Cell Syst. 9, 375–382.
Richters, M.M., Xia, H., Campbell, K.M., Gillanders, W.E., Griffith, O.L., and
Griffith, M. (2019). Best practices for bioinformatic characterization of neoan-
tigens for clinical utility. Genome Med. 11, 56.
Robinson, T.J., Freedman, J.A., Abo, M.A., Deveaux, A.E., LaCroix, B., Pa-
tierno, B.M., George, D.J., and Patierno, S.R. (2019). Alternative RNA Splicing
as a Potential Major Source of Untapped Molecular Targets in Precision
Oncology and Cancer Disparities. Clin. Cancer Res. 25, 2963–2968.
Rosenberg, S.A., Yang, J.C., Sherry, R.M., Kammula, U.S., Hughes, M.S.,
Phan, G.Q., Citrin, D.E., Restifo, N.P., Robbins, P.F., Wunderlich, J.R., et al.
(2011). Durable complete responses in heavily pretreated patients with meta-
static melanoma using T-cell transfer immunotherapy. Clin. Cancer Res. 17,
4550–4557.
Saez-Rodriguez, J., Costello, J.C., Friend, S.H., Kellen, M.R., Mangravite, L.,
Meyer, P., Norman, T., and Stolovitzky, G. (2016). Crowdsourcing biomedical

ll
Please cite this article in press as: Wells et al., Key Parameters of Tumor Epitope Immunogenicity Revealed Through a Consortium ApproachImprove Neoantigen Prediction, Cell (2020), https://doi.org/10.1016/j.cell.2020.09.015
Resource
research: leveraging communities as innovation engines. Nat. Rev. Genet. 17,
470–486.
Sahin, U., and Tureci, O. (2018). Personalized vaccines for cancer immuno-
therapy. Science 359, 1355–1360.
Sahin, U., Derhovanessian, E., Miller, M., Kloke, B.-P., Simon, P., Lower, M.,
Bukur, V., Tadmor, A.D., Luxemburger, U., Schrors, B., et al. (2017). Personal-
ized RNA mutanome vaccines mobilize poly-specific therapeutic immunity
against cancer. Nature 547, 222–226.
Salcedo, A., Tarabichi, M., Espiritu, S.M.G., Deshwar, A.G., David, M., Wilson,
N.M., Dentro, S., Wintersinger, J.A., Liu, L.Y., Ko, M., et al.; DREAM SMC-Het
Participants (2020). A community effort to create standards for evaluating tu-
mor subclonal reconstruction. Nat. Biotechnol. 38, 97–107.
Samstein, R.M., Lee, C.-H., Shoushtari, A.N., Hellmann, M.D., Shen, R., Janji-
gian, Y.Y., Barron, D.A., Zehir, A., Jordan, E.J., Omuro, A., et al. (2019). Tumor
mutational load predicts survival after immunotherapy across multiple cancer
types. Nat. Genet. 51, 202–206.
Sano, T., and Cantor, C.R. (1990). Expression of a cloned streptavidin gene in
Escherichia coli. Proc. Natl. Acad. Sci. USA 87, 142–146.
Schlessinger, A., Abagyan, R., Carlson, H.A., Dang, K.K., Guinney, J., and Ca-
gan, R.L. (2017). Multi-targeting Drug Community Challenge. Cell Chem. Biol.
24, 1434–1435.
Schreiber, R.D., Old, L.J., and Smyth, M.J. (2011). Cancer immunoediting:
integrating immunity’s roles in cancer suppression and promotion. Science
331, 1565–1570.
Schumacher, T.N., and Hacohen, N. (2016). Neoantigens encoded in the can-
cer genome. Curr. Opin. Immunol. 41, 98–103.
Schumacher, T.N., and Schreiber, R.D. (2015). Neoantigens in cancer immu-
notherapy. Science 348, 69–74.
Schumacher, T.N., Scheper, W., and Kvistborg, P. (2019). Cancer Neoanti-
gens. Annu. Rev. Immunol. 37, 173–200.
Sidney, J., Southwood, S., Moore, C., Oseroff, C., Pinilla, C., Grey, H.M., and
Sette, A. (2013). Measurement of MHC/Peptide Interactions byGel Filtration or
Monoclonal Antibody Capture. Curr. Protoc. Immunol. 100, 18.3.1–18.3.36.
Smart, A.C., Margolis, C.A., Pimentel, H., He, M.X., Miao, D., Adeegbe, D.,
Fugmann, T., Wong, K.-K., and Van Allen, E.M. (2018). Intron retention is a
source of neoepitopes in cancer. Nat. Biotechnol. 36, 1056–1058.
Smith, C.C., Selitsky, S.R., Chai, S., Armistead, P.M., Vincent, B.G., and Se-
rody, J.S. (2019). Alternative tumour-specific antigens. Nat. Rev. Cancer 19,
465–478.
Strønen, E., Toebes, M., Kelderman, S., van Buuren, M.M., Yang, W., van
Rooij, N., Donia, M., Boschen, M.-L., Lund-Johansen, F., Olweus, J., and
Schumacher, T.N. (2016). Targeting of cancer neoantigens with donor-derived
T cell receptor repertoires. Science 352, 1337–1341.
Toebes, M., Coccoris, M., Bins, A., Rodenko, B., Gomez, R., Nieuwkoop, N.J.,
van de Kasteele, W., Rimmelzwaan, G.F., Haanen, J.B.A.G., Ovaa, H., and
Schumacher, T.N. (2006). Design and use of conditional MHC class I ligands.
Nat. Med. 12, 246–251.
Tran, E., Turcotte, S., Gros, A., Robbins, P.F., Lu, Y.-C., Dudley, M.E.,Wunder-
lich, J.R., Somerville, R.P., Hogan, K., Hinrichs, C.S., et al. (2014). Cancer
immunotherapy based on mutation-specific CD4+ T cells in a patient with
epithelial cancer. Science 344, 641–645.
Tran, E., Robbins, P.F., Lu, Y.-C., Prickett, T.D., Gartner, J.J., Jia, L., Pasetto,
A., Zheng, Z., Ray, S., Groh, E.M., et al. (2016). T-Cell Transfer Therapy Target-
ing Mutant KRAS in Cancer. N. Engl. J. Med. 375, 2255–2262.
Tran, E., Robbins, P.F., and Rosenberg, S.A. (2017). ‘‘Final common pathway’’
of human cancer immunotherapy: targeting random somatic mutations. Nat.
Immunol. 18, 255–262.
Vita, R., Mahajan, S., Overton, J.A., Dhanda, S.K., Martini, S., Cantrell, J.R.,
Wheeler, D.K., Sette, A., and Peters, B. (2019). The Immune Epitope Database
(IEDB): 2018 update. Nucleic Acids Res. 47 (D1), D339–D343.
Vitiello, A., and Zanetti, M. (2017). Neoantigen prediction and the need for vali-
dation. Nat. Biotechnol. 35, 815–817.
Yadav, M., Jhunjhunwala, S., Phung, Q.T., Lupardus, P., Tanguay, J., Bum-
baca, S., Franci, C., Cheung, T.K., Fritsche, J., Weinschenk, T., et al. (2014).
Predicting immunogenic tumour mutations by combining mass spectrometry
and exome sequencing. Nature 515, 572–576.
Yamamoto, T.N., Kishton, R.J., and Restifo, N.P. (2019). Developing neoanti-
gen-targeted T cell-based treatments for solid tumors. Nat. Med. 25,
1488–1499.
Yang, W., Lee, K.-W., Srivastava, R.M., Kuo, F., Krishna, C., Chowell, D., Ma-
karov, V., Hoen, D., Dalin, M.G., Wexler, L., et al. (2019). Immunogenic neoan-
tigens derived from gene fusions stimulate T cell responses. Nat. Med. 25,
767–775.
Yarchoan, M., III, Johnson, B.A., 3rd, Lutz, E.R., Laheru, D.A., and Jaffee, E.M.
(2017). Targeting neoantigens to augment antitumour immunity. Nat. Rev.
Cancer 17, 209–222.
Yee, C., Thompson, J.A., Byrd, D., Riddell, S.R., Roche, P., Celis, E., and
Greenberg, P.D. (2002). Adoptive T cell therapy using antigen-specific CD8+
T cell clones for the treatment of patients with metastatic melanoma: in vivo
persistence, migration, and antitumor effect of transferred T cells. Proc.
Natl. Acad. Sci. USA 99, 16168–16173.
Zacharakis, N., Chinnasamy, H., Black, M., Xu, H., Lu, Y.-C., Zheng, Z., Pa-
setto, A., Langhan, M., Shelton, T., Prickett, T., et al. (2018). Immune recogni-
tion of somatic mutations leading to complete durable regression in metastatic
breast cancer. Nat. Med. 24, 724–730.
Editorial (2017). The problem with neoantigen prediction. Nat. Biotechnol.
35, 97.
Cell 183, 1–17, October 29, 2020 17

ll
Please cite this article in press as: Wells et al., Key Parameters of Tumor Epitope Immunogenicity Revealed Through a Consortium ApproachImprove Neoantigen Prediction, Cell (2020), https://doi.org/10.1016/j.cell.2020.09.015
Resource
STAR+METHODS
KEY RESOURCES TABLE
REAGENT or RESOURCE SOURCE IDENTIFIER
Antibodies
BUV805 mouse anti-human CD45 [clone HI30] BD Bioscience Cat#564915; RRID:AB_2744401
BUV395 mouse anti-human CD3 [clone UCHT1] BD Bioscience Cat#563546; RRID:AB_2744387
AlexaFluor700 mouse anti-human CD8a [clone HIT3a] Biolegend Cat#300919; RRID:AB_528884
FITC mouse anti-human CD16 Antibody [Clone: 3G8] Biolegend Cat#302006; RRID:AB_314206
FITC mouse anti-human CD14 Antibody [Clone: M5E2] Biolegend Cat#301804; RRID:AB_314186
FITC mouse anti-human CD40 Antibody [Clone: 5C3] Biolegend Cat#334306; RRID:AB_1186034
FITC mouse anti-human CD4 Antibody [Clone: SK3] Biolegend Cat#344604; RRID:AB_1937227
FITC mouse anti-human CD19 Antibody [Clone: HIB19] Biolegend Cat#302206; RRID:AB_314236
LIVE∕DEAD� Fixable IR Dead Cell Stain Kit ThermoFisher Cat#L34975
PE-CY7 Streptavidin Life Technologies Cat#501137616
Brilliant Violet 650 Streptavidin Biolegend Cat#405231
Brilliant Violet 605 Streptavidin Biolegend Cat#405229
Brilliant Violet 711 Streptavidin Biolegend Cat#405241
Brilliant Violet 421 Streptavidin Biolegend Cat#405225
Brilliant Violet 510 Streptavidin BD Bioscience Cat#BDB563261
APC Streptavidin Life Technologies Cat#SA1005
PE Streptavidin Biolegend Cat#405204
PE-CF594 Streptavidin BD Bioscience Cat#BDB562318
W6/32 (anti-HLA class I) ATCC HB-95
Bacterial and Virus Strains
BL21-CodonPlus(DE3)-RIPL Competent cells Agilent Technologies Cat#230280
Biological Samples
Tumor lysates from patients with NSCLC This paper N/A
Human PBMCs from patients with metastatic melanoma This paper N/A
Chemicals, Peptides, and Recombinant Proteins
UltraComp eBeads Compensation Beads Life Technologies 01-2222-42
NaN3 Sigma Aldrich Cat# S2002
D-biotin Sigma Aldrich Cat# B4501
HRP anti-human b2-microglobulin BioLegend Cat# 280303
MP1 Influenza A: GILGFVFTL Peptide 2.0 N/A
P1804 EBV1: RVRAYTYSK Peptide 2.0 N/A
PB1 Influenza: VSDGGPNLY Peptide 2.0 N/A
EBV: YVLDHLIVV Peptide 2.0 N/A
1807 EBV: RAKFKQLL Peptide 2.0 N/A
1813 EBV: IVTDFSVIK Peptide 2.0 N/A
1822 Influenza A: SRYWAIRTR Peptide 2.0 N/A
1824 EBV: RRIYDLIEL Peptide 2.0 N/A
EBV6’ EBNAC3:EENLLDFVRF Peptide 2.0 N/A
1803 A3 influenza A: RVLSFIKGTK Peptide 2.0 N/A
Putative neo-antigens for patient samples This paper N/A
Dynabeads MyOne T1 streptavidin-coated NPs
(500 nm radius)
Invitrogen Cat#65602
CellTracker Orange CMRA Dye ThermoFisher Cat#C34551
(Continued on next page)
e1 Cell 183, 1–17.e1–e6, October 29, 2020

Continued
REAGENT or RESOURCE SOURCE IDENTIFIER
Bovine Serum Albumin (BSA) heat-shock fraction Sigma-Aldrich A3059
Critical Commercial Assays
AllPrep DNA/RNA Kit QIAGEN catalog #80204
RNeasy MinElute Clean-up Kit Sigma 52365-50G catalog #52365-50G
KAPA HTP Library Kit (KAPA Biosystems) Roche 7961901001
TruSeq Stranded Total RNA with RiboZero Plus Illumina 20020598
Deposited Data
Whole exome sequencing data (melanoma cohort) Liu et al., 2019 phs000452.v3.p1
Transciptome data (melanoma cohort) Liu et al., 2019 phs000452.v3.p1
Whole exome sequencing data (melanoma and
NSCLC patients)
This paper syn21048999
Oligonucleotides
DNA for NP modification (ssDNA, 50-biotin-) Peng et al., 2019 N/A
DNA for barcoding (ssDNA, 5-Cy5/Cy3/AlexaFluor488/
AlexaFluor750)
Peng et al., 2019 N/A
DNA for streptavidin labeling (ssDNA, 5-NH2-) Peng et al., 2019 N/A
Recombinant DNA
Plasmid containing SAC gene Sano and Cantor, 1990 Addgene Plasmid #17329
HLA-A*02:01 plasmid Andersen et al., 2012 N/A
b-2-microglobulin plasmid Andersen et al., 2012 N/A
Software and Algorithms
FlowJo, LLC version 10.5.3 Becton Dickinson https://www.flowjo.com/solutions/flowjo/downloads/
previous-versions
FacsDiva, BD software version 8 Becton Dickinson https://www.bdbiosciences.com/en-us/instruments/
research-instruments/research-software/flow-
cytometry-acquisition/facsdiva-software
Other
UV-lamp 366nm CAMAG Cat# 022.9070
HiTrap Q HP GE Healthcare Cat# 17-1154-01
ll
Please cite this article in press as: Wells et al., Key Parameters of Tumor Epitope Immunogenicity Revealed Through a Consortium ApproachImprove Neoantigen Prediction, Cell (2020), https://doi.org/10.1016/j.cell.2020.09.015
Resource
RESOURCE AVAILABILITY
Lead ContactFurther information and requests for resources and reagents will be fulfilled by the Lead Contact, Daniel K. Wells (dwells@
parkerici.org).
Materials AvailabilityTetramers used in TESLA are available upon signature of an MTA.
Data and Code AvailabilityTESLA data is available here: https://www.synapse.org/#!Synapse:syn21048999. All molecular data (WES and RNA) from the mel-
anoma cohort can be found in dbGap (accession number phs000452.v3.p1) and clinical variables can be found as supplemental in-
formation in the associated manuscript (Liu et al., 2019). Code to recreate the scoring metrics used in this study can be found here:
https://github.com/ParkerICI/tesla.
EXPERIMENTAL MODEL AND SUBJECT DETAILS
All clinical investigation was conducted according to the principles expressed in the Declaration of Helsinki. Written informed consent
was obtained from the participants. Samples were collected under Institutional Review Board (IRB).
Cell 183, 1–17.e1–e6, October 29, 2020 e2

ll
Please cite this article in press as: Wells et al., Key Parameters of Tumor Epitope Immunogenicity Revealed Through a Consortium ApproachImprove Neoantigen Prediction, Cell (2020), https://doi.org/10.1016/j.cell.2020.09.015
Resource
METHOD DETAILS
Subjects, Treatment, and Specimen CollectionThe study was conducted with samples from subjects with metastatic melanoma or non-small cell lung cancer (NSCLC), previously
collected and stored at UCLA orMSKCC respectively, and for which adequatematched pre-treatment control/tumor biopsywere avail-
able along with baseline and/or on-treatment matched peripheral blood mononuclear cells (PBMCs; melanoma) or tumor lysates
(NSCLC). Collection and genomic analyses of themelanoma tumor biopsies, corresponding normal samples andPBMCwere approved
by UCLA Institutional Review Board 11-001918 and 11-003066. Collection and genomic analyses of the NSCLC tumor biopsies, cor-
responding normal samples and tumor lysates were approved by MSKCC Institutional Review Board 06-107. In all cases, tumor bi-
opsies used in genetic analyses were snap-frozen by immediate immersion in liquid nitrogen for genetic analyses. PBMCs were pre-
pared from fresh whole blood by Ficoll-Paque density gradient centrifugation and cryopreserved. Tissue lysate was prepared as
described below. Additional information on the subjects with melanoma and NSCLC included in this analysis can be found in Table S3.
Tissue lysate preparationTumor sample lysate was prepared using theMiltenyi gentleMACSOcto Dissociator (Bergish, Germany). Briefly, tumor samples were
placed in a 100mm culture dish in serum free RPML medium and minced into small pieces (1-3mm3) with sterile scalpels. Minced
tumor was submerged in 10mL of disassociating solution in a C tube and subsequently incubated at 37�C using the Human Tumor
Dissociation cycle ‘‘1 hour with continuous shaking’’ in the gentleMACS Octo Dissociator. Once complete, tumor was passed
through a 100 mM sterile cell strainer (BD Falcon) on a 50mL conical tube and spun at 1500 RPM for 7 minutes in a refrigerated centri-
fuge. Cells were resuspended in freezing media at a concentration of approximately 3 million cells/mL and transferred into 1mL cryo-
vial aliquots. Cells were stored at �80�C in a slow freeze container, and transferred to liquid nitrogen for long term storage.
Whole Exome Sequencing and RNA SequencingBoth DNA and RNA were co-extracted from snap-frozen tumor biopsies using the QIAGEN AllPrep Kit according to the manufac-
turer’s instructions (QIAGEN, Valencia, CA). Melanin, a known inhibitor of enzymatic reactions, coprecipitates with the RNA, therefore
the RNA required further purification performed as described (Lagonigro et al., 2004), modifiedwith a RNeasy (QIAGEN, Valencia, CA)
column-based clean-up to remove the additives used to bind the melanin.
IDT ExomeAutomated (dual indexes) were constructed with 200-250ng of genomic DNA utilizing the KAPA HTP Library Kit (KAPA Biosystems)
according to the manufacturer’s instructions. Automated libraries were performed on the SciClone NGS (Perkin Elmer) instrument
targeting 200-250bp inserts. Samples were pooled in a 1:1 ratio and processed through the capture pipeline in the McDonnell
Genome Institute at Washington University School of Medicine (St. Louis, MO). Libraries were pooled prior to capture hybridizations
with IDT Exome Library IDT xGen Exome Research Panel that spans a 39 Mb target region (19,396 genes). Capture processing was
performed following the company protocol. KAPA qPCR was used to quantify the libraries and determine the appropriate concen-
tration to produce optimal recommended cluster density on a HiSeq4000 v2 (PE150bp) sequencing run. Sample pools were
sequenced on two lanes of an Illumina HiSeq4000 v2 (PE150bp) instrument. All sequencing runs were completed according theman-
ufacturer’s recommendations (Illumina Inc, San Diego, CA)
RNA-seqManual libraries (single indexes) were constructed utilizing Illumina TruSeq Stranded total RNA kit (Illumina) (100-500ng of total RNA)
according to the manufacturer’s instructions. KAPA qPCR was used to quantify the libraries and determine the appropriate concen-
tration to produce optimal recommended cluster density on a HiSeq4000 v2 (PE150bp) sequencing run. Final pool of samples were
sequenced across two lanes HiSeq4000. All sequencing runs were completed according the manufacturer’s recommendations (Il-
lumina Inc, San Diego, CA).
Human Leukocyte Antigen (HLA) typingClinical grade (six-digit) HLA typing was obtained for each subject from the normal DNA by Histogenetics (Ossining, NY)
Peptide SynthesisPeptides > 90% pure by analytical HPLC were synthesized by New England Peptides (Gardner, MA).
Neoepitope PredictionsOnce sequencing of samples was completed, fastq files of tumor DNA sequence, tumor RNA sequence, and normal DNA sequence
were uploaded to Sage Bionetworks Synapse platform (https://synapse.org/) along with clinical grade HLA typing information. These
data were made accessible to the consortium participating teams to identify neoepitopes using their respective prediction pipeline.
To enable comparison across the different pipelines, all participants were required to align sequence data to GRCh38 (Ensembl).
All participants were required to submit three files for each sample for which they predicted neoepitopes:
e3 Cell 183, 1–17.e1–e6, October 29, 2020

ll
Please cite this article in press as: Wells et al., Key Parameters of Tumor Epitope Immunogenicity Revealed Through a Consortium ApproachImprove Neoantigen Prediction, Cell (2020), https://doi.org/10.1016/j.cell.2020.09.015
Resource
d A ranked list of neoepitopes and the HLA allele those neoepitopes were identified with
d An unranked list of filtered neoepitopes and the HLA allele those neoepitopes were identified with
d A list of identified variants
Additional requirements, including a detailed description of each of the above files is found in Table S1. Teamswere asked to com-
plete their predictions in 6 weeks after downloading the data.
Workflow SurveyAs part of their submissions, the teams were asked to include a description of the steps included in their neoantigen prediction work-
flow in a numbered list in a text file. These free text workflow descriptions were manually reviewed, and a representative list of com-
mon workflow steps was compiled. To do this, each step of each workflow was added to a cumulative list if that step was deemed
substantially different from other steps already present on the list. This process established a controlled vocabulary for describing
those steps. The vocabulary was then organized into groups of steps performing a similar higher-level function, e.g., ‘‘variant calling,’’
‘‘variant filtering’’ and ‘‘peptide ranking.’’ Then, each step in each workflow was annotated with the controlled vocabulary to make
sure that each workflow was represented by the vocabulary. Finally, a workflow survey was created such that each team was asked
to provide a binary response about whether their workflow included each step defined by the controlled vocabulary. The survey con-
tained 6 high-level categories each containing 3-11 specific steps.
Process for Choosing Neoepitopes to Test in Validation AssaysFor each sample used in TESLA there is capacity to test between 100-200 neoepitopes for immunogenicity. Given that each partici-
pating team submitted 5-100,000 peptides for each sample, a sub-set of peptides for validation had to be selected. To do this, we
focused on ensuring that each participant would have roughly the same number and quality (ranking) of peptides validated (‘‘fair-
ness’’) while also making sure that, if there are differences between the algorithms, we would be able to detect them (‘‘distinguish-
ability’’). These principles were constrained by the fact that some peptides are too hydrophobic (or otherwise hard tomake/use) to be
used in our assays, as well as the fact that not every neoepitope can be tested in every assay due to HLA restriction requirements. In
practice, we used the following guidelines to choose peptides:
d To the extent possible, each participant had their top 5 neoepitopes selected, taking into account the MHC for which they are
restricted
d Additionally, neoepitopes that were the most recurrently ranked in the top 50 by all participants were also selected taking into
consideration the amount of biological material available for testing, the demand for each assay and theMHC constraints for all
four assays.
50 was chosen as a cutoff to reflect the upper bound on the current number of epitopes that can be included in a personalized
therapeutic approach.
Validation ExperimentsSelected peptides were evaluated in a set of experiments all together referred as ‘validation experiments’. Validation experiments
include HLA binding and immunological analyses that assess the presence of existing T cells able to recognize the selected peptide.
Class I Peptide Binding Assay (‘HLA binding’)Classical competition assays to quantitatively measure peptide binding to class I MHCmolecules are based on the inhibition of bind-
ing of an allele-specific, high affinity radiolabeled peptide to purifiedMHCmolecules, andwere performed as detailed elsewhere (Sid-
ney et al., 2013). Briefly, 0.1-1 nMof radiolabeled peptidewas co-incubated at room temperaturewith 1 mM to 1 nMof purifiedMHC in
the presence of a cocktail of protease inhibitors and 1 mM b2-microglobulin. Following a two-day incubation, MHC-bound radioac-
tivity was determined by capturing MHC/peptide complexes on W6/32 (anti-HLA class I) antibody coated Lumitrac 600 plates
(Greiner Bio-one, Frickenhausen, Germany), and measuring bound cpm using the TopCount (Packard Instrument Co., Meriden,
CT) microscintillation counter. In the case of competitive assays, the concentration of peptide yielding 50% inhibition of the binding
of the radiolabeled peptide was calculated. Under the conditions utilized, where [label] < [MHC] and IC50R [MHC], themeasured IC50
values are reasonable approximations of the true Kd values. Each competitor peptide was tested at six different concentrations
covering a 100,000-fold dose range, and in three ormore independent experiments. As a control, the unlabeled version of the respec-
tive radiolabeled probe also was tested in each experiment.
MHC Class I Multimer Binding Assay (Flow Cytometry)Multimer binding assays were performed independently by two groups: (A) The Immunomonitoring Laboratory [IML], Washington
University in Saint Louis, USA, and (B) Netherlands Cancer Institute [NKI], Amsterdam, NL. Similar approaches were followed by
both groups for multimer construction, T cell binding and detection, as described below unless mentioned otherwise.
Cell 183, 1–17.e1–e6, October 29, 2020 e4

ll
Please cite this article in press as: Wells et al., Key Parameters of Tumor Epitope Immunogenicity Revealed Through a Consortium ApproachImprove Neoantigen Prediction, Cell (2020), https://doi.org/10.1016/j.cell.2020.09.015
Resource
Production of Exchanged Peptide-MHC Class I Monomers –MHC I monomers refolded with an ultraviolet light-cleavable conditional ligand were prepared as previously described (Andersen
et al., 2012; Toebes et al., 2006). In brief, recombinant HLA heavy chains and human b2-microglobulin light chain were produced
in Escherichia coli (Agilent Technologies), isolated from inclusion bodies and refolded in the presence of UV-cleavable peptides.
Monomers were captured by anion exchange (HiTrap QHP, GE), biotinylated, and purified by gel filtration FPLC (A) or HPLC (B). Spe-
cific peptide-MHC I (pMHC I) complexes were then generated by UV-induced ligand exchange in a 96 well plate and the peptides’
exchange were verified by a sandwich like ELISA. In brief, pMHC I complexes loaded with UV-sensitive peptide (100 mg/mL-1) were
subjected to 366 nm UV light (Camag) for 1 h at 4�C in the presence of rescue peptide (200 mM). Re-folded monomer was detected
using anti- b2 microglobulin. Monomers were also exchanged with viral peptides which bind to distinct HLA alleles, included as pos-
itive and negative controls for staining (MP1 Influenza A: GILGFVFTL, P1804 EBV1: RVRAYTYSK, PB1 Influenza: VSDGGPNLY, EBV:
YVLDHLIVV, 1807 EBV: RAKFKQLL, 1813 EBV: IVTDFSVIK, 1822 Influenza A: SRYWAIRTR, 1824 EBV: RRIYDLIEL, EBV6’ EBNA-
C3:EENLLDFVRF, and 1803 A3 influenza A: RVLSFIKGTK).
Production of Multimer Staining –pMHC I multimers were generated using fluorescent streptavidin (SA) conjugates. For each pMHC I monomer, conjugation was per-
formed with two fluorochromes. Mixtures were incubated for 30 min on ice. NaN3 (0.02%wt/vol) and an excess of D-biotin (26.4 mM,
Sigma) was added to block residual binding sites. For T cells staining, the pMHC I multimers were collected and centrifuged for 2 mi-
nutes at 10.000 rpm, before being added to the subject PBMC or tumor lysates, and incubated at 37�C for 15minutes. Subsequently,
anti-CD45, anti-CD8, a ‘dump channel’ mix including: anti-CD4, anti-CD14, anti-CD16,and anti-CD19, and anti-CD3 was used for
positive gating (Biolegend). A marker for living cells (LIVE∕DEAD� Fixable IR Dead Cell Stain Kit) was added for a 20 minute incu-
bation on ice as previously described (Kvistborg et al., 2012). All incubations were done in the dark.
Data Acquisition and Analysis –Before flow cytometric analysis, cells were washed twice. Data were acquired on a BD LSR Fortessa X-20 (A) or a BD Symphony A5
(B) following instrument compensation using UltraComp eBeads, and analyzed using Diva Software v8 and Flowjo v9.9.6 (A) or
FlowJo v10.5.3 or earlier v10 packages (B). A given peptide is considered ‘validated’ when peptide-specific T cells are detected
and confirmed in an independent staining experiment conducted with new reagents including a different set of fluorescent dyes.
Example data from this workflow are shown in Figure S7.
MHC I Nanoparticle Pull-Down Assay (Microscopy)The nanoparticle (NP) pulldown method utilizes multiple reagents that can be prepared ahead of time and assembled just prior to use
and is described in detail elsewhere (Peng et al., 2019). Briefly, these include streptavidin-coated magnetic NPs (500 nm radius, Invi-
trogen Dynabeads MyOne T1), biotinylated neoantigen pMHC I monomers, cysteine-modified streptavidin (SAC) scaffold (Sano and
Cantor, 1990), and ssDNA oligomers that are amine-modified (oligomer #1), biotinylated (oligomer #2), and dye-labeled (oligomer #3).
Oligomer #1 is appended to the cysteine site on the SAC scaffold via maleimide HyNic/S-4FB crosslinkers (TriLink BioTechnol-
ogies, LLC) to make SAC-DNA. Oligomer #2, which has hybridization regions for oligomer #1 (on SAC-DNA) and oligomer #3, is
attached to the NPs to make NP-DNA. The NPs, which have up to > 105 sites for DNA attachment, were prepared according to
the manufacturer’s protocol. Briefly, the NPs are mixed with oligomer #2 at a 1:20 ratio, and excess oligomers were removed by
washing the NPs three times with PBS. A pMHC I monomer library element is added to SAC-DNA at a 4:1 ratio to form the pMHC
I multimer-DNA. This multimer is then attached to the NP-DNA via DNA hybridization (between multimer-bound oligomer #1 and
NP-bound oligomer #2). The dye-labeled oligomer #3 is then hybridized onto one of the additional sites on oligomer #2. The oligomer
#2 and #3 were chosen so that a given neoantigen is associated with a unique dye color in multiplex analyses. A fully assembled
neoepitopes multimer/NP reagent contains > 104 neoepitopes multimers per NP and is referred to as a pNP.
In a typical assay, four colors are used to enable 3-plex analysis. Cells are stained with CellTracker Orange CMRA (a fluorescent
dye retained in live cells, ThermoFisher), and 3 sets of pNPs, each with a unique fluorophore (Alexa Fluor 488, Cy5, or Alexa Fluor 750)
are used to pulldown up to 3 distinct neoantigen-specific T cell populations in parallel. Thus, for a 15-element library, 5 sets of mea-
surements are performed, with eachmeasurement using about 10,000 CD8+ PBMCs and 75million pNPs (�25million pNPs for each
antigen specificity).
Live CD8+ PBMCs are sorted by FACS or negatively enriched using MACS (Miltenyi biotec). Before analysis, the sorted cells are
stained with CellTracker Orange, treated with DNase, and non-selective cells are removed using a small library of irrelevant pNPs.
The processed cells are then incubated with a 3-element pNP library for 15-30min, andNP-labeled cells are then enriched bymagnet
pulldown. The enriched T cells are washed once with 0.5% BSA in PBS to remove unlabeled cells. The NP-labeled cells are then
loaded into a hemocytometer and imaged by bright field and 4-color fluorescent microscopy. Cells that are specific for a given neo-
antigen are identified as those that are fluorescent in only CellTracker Orange and a single additional fluorophore from one set of pNP
(typically 5-20 pNPs are labeled on each specific T cell). Dead, barely viable, or non-selective cells are found to be non-selectively
labeled bymultiple pNP library elements. For the experiments described here, assays were carried out in 4-5 replicates for each neo-
epitope pMHC I, using different vials of thawed PBMCs. Cells that are called as positive for a specific neoantigen were observed in at
2 of those runs, with multiple detection per run.
e5 Cell 183, 1–17.e1–e6, October 29, 2020

ll
Please cite this article in press as: Wells et al., Key Parameters of Tumor Epitope Immunogenicity Revealed Through a Consortium ApproachImprove Neoantigen Prediction, Cell (2020), https://doi.org/10.1016/j.cell.2020.09.015
Resource
Analytic MethodsPeptide Overlap
Peptide overlap was calculated as the length of the intersection of two lists, normalized to the length of the first list.
Area Under the Precision Recall Curve (AUPRC)
AUPRC was calculated using the ‘pr.curve’ function in the PRROC package (Grau et al., 2015) with default parameters.
Fraction Ranked (FR)
Fraction ranked is calculated as the fraction of all peptides with detected immunogenicity for a particular subject that were included in
the top 100 ranked pMHC by a participant. A cutoff of 100 peptides was chosen to calculate FR to normalize for differing numbers of
pMHC submitted by each team. The value of 100was chosen in particular to ensure consistency with other analyses and to be reflec-
tive of the total number of epitopes which might be considered for inclusion in a personalized therapeutic.
Top-20 Immunogenic Fraction (TTIF)
Top-20 immunogenic fraction for a particular subject and participant is calculated as the ratio of the top-20 ranked pMHC with de-
tected immunogenicity to the total number of top-20 pMHC which were tested for immunogenicity. As TTIF was designed to assess
the therapeutic efficacy of a specific peptide set, the threshold of 20 was selected since therapeutic vaccine platforms reported to
date have included �20 neoepitopes (Ott et al., 2017; Sahin et al., 2017).
Foreignness
Peptide foreignness was calculated as described previously (quksza et al., 2017). Briefly, candidate epitopes were aligned against
the Immune Epitope Database and Analysis Resource (Vita et al., 2019), the TCR recognition probability was calculated using the
multistate thermodynamic model introduced in the above. All parameters for the original approach were maintained; specifically,
alignments were performed against the BLOSUM62 amino acid similarity matrix (Henikoff and Henikoff, 1992) and required to be
gapless; a = 26; k = 4.87. Foreignness for all peptides tested in TESLA are provided in Table S4, and were calculated using the anti-
gen.garnish package available here: https://github.com/immune-health/antigen.garnish
Binding Stability
Binding stability was calculated using NetMHCStabPan (Rasmussen et al., 2016) using default parameters.
Hydrophobicity Fraction
Hydrophobicity fraction was calculated as the fraction of peptide residues that were hydrophobic. Hydrophobic residues were
considered to be ‘‘V,’’ ‘‘I,’’ ‘‘L,’’ ‘‘F,’’ ‘‘M,’’ ‘‘W,’’ and ‘‘C’’ (Barnes, 2003)
Parameter Selection via Repeated Random Subsampling
For each continuous parameter (MHC binding affinity, MHC binding stability, tumor abundance, hydrophobicity fraction) a range of
values covering two orders inmagnitude was generated while for binary features (mutation position) both levels were considered. For
each unique parameter combination, 10 random subsets of 70%of tested peptides (with immunogenic/non-immunogenic ratio equal
to the whole dataset) were selected and stratified using the given features. Immunogenicity stratification was calculated using a
Fisher exact test. The parameter set with the smallest average p value over all random subsets was chosen to be the one with
the best overall stratification ability.
Optimal Precision/Recall Cutoff
Optimal precision recall cutoff was chosen as the maximum of the precision/recall sum.
Predicted Neoantigen Abundance
Potential immunogenic peptides were generated using a previously generated set of mutation calls (Liu et al., 2019) and predicted
MHC binding affinity was assigned using NetMHCPan4.0. Predicted neoantigen abundance was taken as the sum of the normalized
transcripts per million (TPM) of the mutations which passed all ‘‘presented’’ filters from Figure 3L (excluding the abundance filter) –
specifically, MHC binding affinity stronger than 34 nM andMHC binding stability longer than 1.4 hours, andmutational position not 2.
Predicted and Recognized Neoantigen Abundance
Potential immunogenic p eptides were generated using a previously generated set of mutation calls (Liu et al., 2019) and predicted
MHC binding affinity was assigned using NetMHCPan4.0. Predicted and recognized neoantigen abundance was taken as the sum of
the normalized transcripts per million (TPM) of the mutations which passed all ‘‘presented’’ features (excluding the abundance filter,
identical to predicted neoantigen abundance) and the ‘‘recognized’ filters from Figure 4D – specifically, peptide agretopicity less than
0.1 or peptide foreignness greater than 10�16.
QUANTIFICATION AND STATISTICAL ANALYSIS
All statistical analysis was performed in base R. The statistical test used were two-sided (where applicable) and are indicated in the
text and/or figure legends. The ‘‘n’’ for each analysis, where n could represent pMHC, number of participants, number of submis-
sions, or similar, is indicated in the main text or in figure legends of relevant analyses. Significance was set at p < 0.05 and p values
between 0.05 and 0.1 were reported in their numerical form. Non-parametric methods were used for all statistical analyses obviating
any assumption of normality for any assessed metric.
Cell 183, 1–17.e1–e6, October 29, 2020 e6

Supplemental Figures
Figure S1. Pipeline Traits of Each TESLA Team, Related to Figure 1
Each team responded to a 49-question survey with yes/no questions about their pipeline. 22/25 teams responded to the survey (88% response rate).
llResource

Figure S2. Immunogenicity of Peptides by MHC Allele, Related to Figure 3
(A) Scatterplot of median number of peptides tested for immunogenicity (x axis) versus median number of peptides with validated immunogenicity, by allele. p:
Fisher exact test. (B) Transformed p value for Fisher exact test between validation counts of each allele pair. (C) Left: Median AUPRC for each team, including
A*03:01 (x axis) versus excluding A*03:01 (y axis). Correlation: Spearman rho. Center: Median FR for each team, including A*03:01 (x axis) versus excluding
A*03:01 (y axis). Correlation: Spearman rho. Right: Median TTIF for each team, including A*03:01 (x axis) versus excluding A*03:01 (y axis). Correlation:
Spearman rho.
llResource

Figure S3. Peptide Length and Immunogenicity, Related to Figure 3
(A) Counts of each peptide length by immunogenic (green) and non-immunogenic (red) status. (B) Normalized fraction of peptides of each length for immunogenic
and non-immunogenic peptides separately. No significant difference in fraction immunogenic is seen in any peptide length (Fisher exact test). (C) Violin plot of
peptide length stratified by immunogenicity. Difference not significant (Mann-Whitney U).
llResource

Figure S4. Features of Immunogenic Peptides that Do Not Pass Presented Criteria, Related to Figure 3
(A) Upset plot of the three ways to fail the presented criteria and the overlap between each of those groups. (B) The number of filters not passed for each
immunogenic peptide.
llResource

Figure S5. Sensitivity Analysis of Immunogenicity Enrichment in Recognized Peptides by Presentation-Associated Parameter Values,
Related to Figure 4
For each of the three presentation associated parameters, we iterate over approximately an order of magnitude in parameter values: Specifically, we iterate over
the following ranges: Binding Affinity: [15nM, 16nM, 17nM,. 200nM]; Binding Stability: [0.2 hours, 0.3 hours,. 3 hours]; Tumor Abundance: [5 TPM, 6TPM,.50
TPM]. For each single parameter value, we hold the other two parameters at their previously identified values (Binding Affinity: 34nM; Binding Stability: 1.4 hours;
Tumor Abundance; 33 TPM). Peptides are stratified based on the updated threshold set and the relationship between peptide recognition and immunogenicity is
tested on the reduced set of presented peptides (those that pass all three filters) using a Fisher exact test. A-C: Univariate sensitivity tests. Line plot of p value from
resulting Fisher test for each of the three presentation parameters considered. Black line is at p = 0.05. D-E: Bivariate sensitivity tests. In each panel, values of two
parameters are iterated over and the resulting p value plotted.
llResource

Figure S6. Directed Interventions on Submission Features Improves Neoantigen Pipeline Performance in a Separate Set of TESLA partic-
ipants, Related to Figure 5
Two pipeline performance metrics are considered (AUPRC, panels A-C; TTIF, panels D-F), and for each metric three interventions are demonstrated. For each
intervention, the boxplot (Left) shows the change in the performance metrics from the original prediction to the new prediction (post intervention). Significance
values are calculated using a paired Mann-Whitney U test. *p < 0.05; ***p < 10�3. The histogram (Right) shows the distribution of changes to the performance
metric. Red line: median; m: median improvement; FI: fraction improved.
llResource

Figure S7. Representative Tetramer Staining, Related to STAR Methods
(A) Patient derived PBMCwere stained with a cocktail of reagents to isolate CD45+ live cells. These were further gated positively for CD3 and negatively for CD4,
CD14, CD16, CD19 andCD40. Singlets were further gated on CD3+CD8+ T cells. (B) Cells were stained with HLA-A*03:01 tetramers exchangedwith a panel of 23
neoantigen peptides as well as positive control A*03:01 binding peptide Infl A-8’ (green box) and negative control peptides 1803 and 1804 (purple box). All
tetramers were barcoded and cells were stained with tetramers that displayed two distinct fluorochrome labels. Positive peptide P10 boxed in red. (C) Peptide
staining map. (D) Frequency of gated positive cells and cell counts.
llResource