Embed Size (px)
Citation preview
1(67)
Key International Comparison of AC-DC Current Transfer Standards CCEM-K12
Final Report
Dr Ilya Budovsky National Measurement Institute, Australia
September 2012

2(67)
Table of Contents
1. Introduction ....................................................................................................... 3 2. Participants and organisation of the comparison .......................................... 3 3. Travelling standards and measurement instructions .................................... 6 4. Methods of measurement ................................................................................. 8 5. Repeated measurements of the pilot laboratory ............................................ 9 6. Measurement results ....................................................................................... 10 7. Withdrawals..................................................................................................... 29 8. Follow-up comparisons ................................................................................... 29 9. Summary and conclusions .............................................................................. 29 10. References ........................................................................................................ 29 Appendix 1: Degrees of equivalence between pairs of NMIs ............................ 30 Appendix 2. Uncertainty Budgets ........................................................................ 37 Technical Protocol ................................................................................................. 58
3(67)
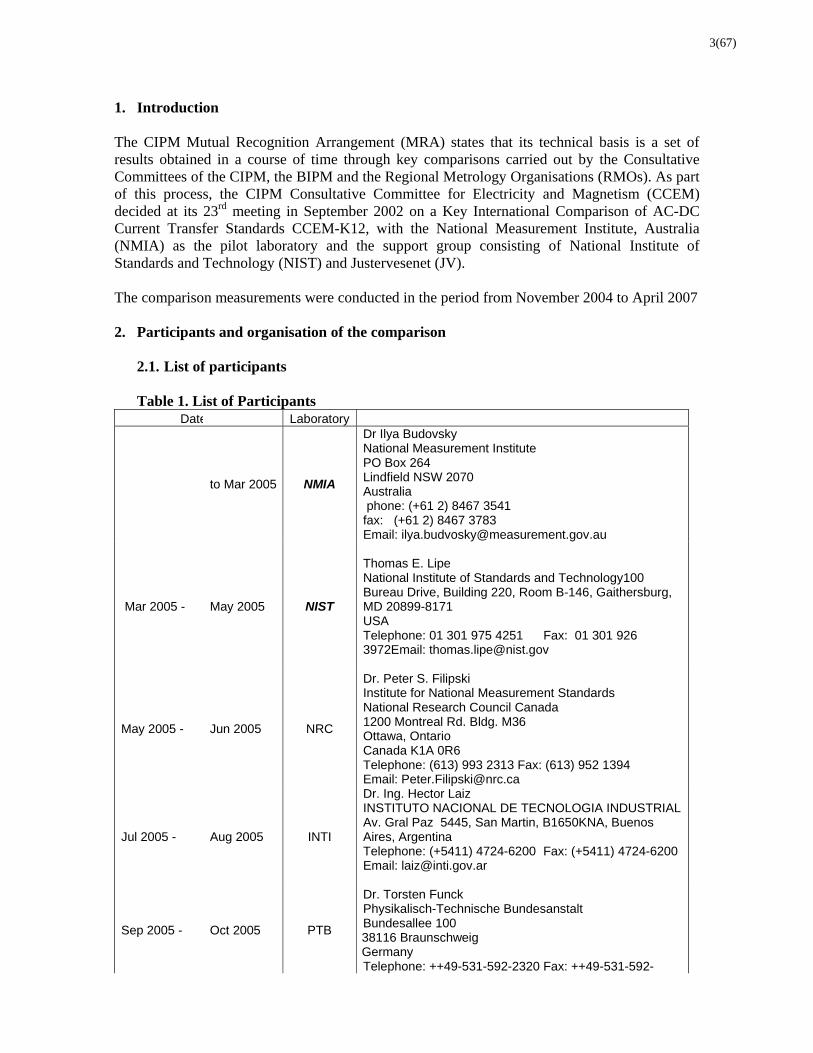
1. Introduction The CIPM Mutual Recognition Arrangement (MRA) states that its technical basis is a set of results obtained in a course of time through key comparisons carried out by the Consultative Committees of the CIPM, the BIPM and the Regional Metrology Organisations (RMOs). As part of this process, the CIPM Consultative Committee for Electricity and Magnetism (CCEM) decided at its 23rd meeting in September 2002 on a Key International Comparison of AC-DC Current Transfer Standards CCEM-K12, with the National Measurement Institute, Australia (NMIA) as the pilot laboratory and the support group consisting of National Institute of Standards and Technology (NIST) and Justervesenet (JV). The comparison measurements were conducted in the period from November 2004 to April 2007 2. Participants and organisation of the comparison
2.1. List of participants Table 1. List of Participants
Date Laboratory
to Mar 2005 NMIA
Dr Ilya Budovsky National Measurement Institute PO Box 264 Lindfield NSW 2070 Australia phone: (+61 2) 8467 3541 fax: (+61 2) 8467 3783 Email: [email protected]
Mar 2005 - May 2005 NIST
Thomas E. Lipe National Institute of Standards and Technology100 Bureau Drive, Building 220, Room B-146, Gaithersburg, MD 20899-8171 USA Telephone: 01 301 975 4251 Fax: 01 301 926 3972Email: [email protected]
May 2005 - Jun 2005 NRC
Dr. Peter S. Filipski Institute for National Measurement Standards National Research Council Canada 1200 Montreal Rd. Bldg. M36 Ottawa, Ontario Canada K1A 0R6 Telephone: (613) 993 2313 Fax: (613) 952 1394 Email: [email protected]
Jul 2005 - Aug 2005 INTI
Dr. Ing. Hector Laiz INSTITUTO NACIONAL DE TECNOLOGIA INDUSTRIAL Av. Gral Paz 5445, San Martin, B1650KNA, Buenos Aires, Argentina Telephone: (+5411) 4724-6200 Fax: (+5411) 4724-6200 Email: [email protected]
Sep 2005 - Oct 2005 PTB
Dr. Torsten Funck Physikalisch-Technische Bundesanstalt Bundesallee 100 38116 Braunschweig Germany Telephone: ++49-531-592-2320 Fax: ++49-531-592-
4(67)
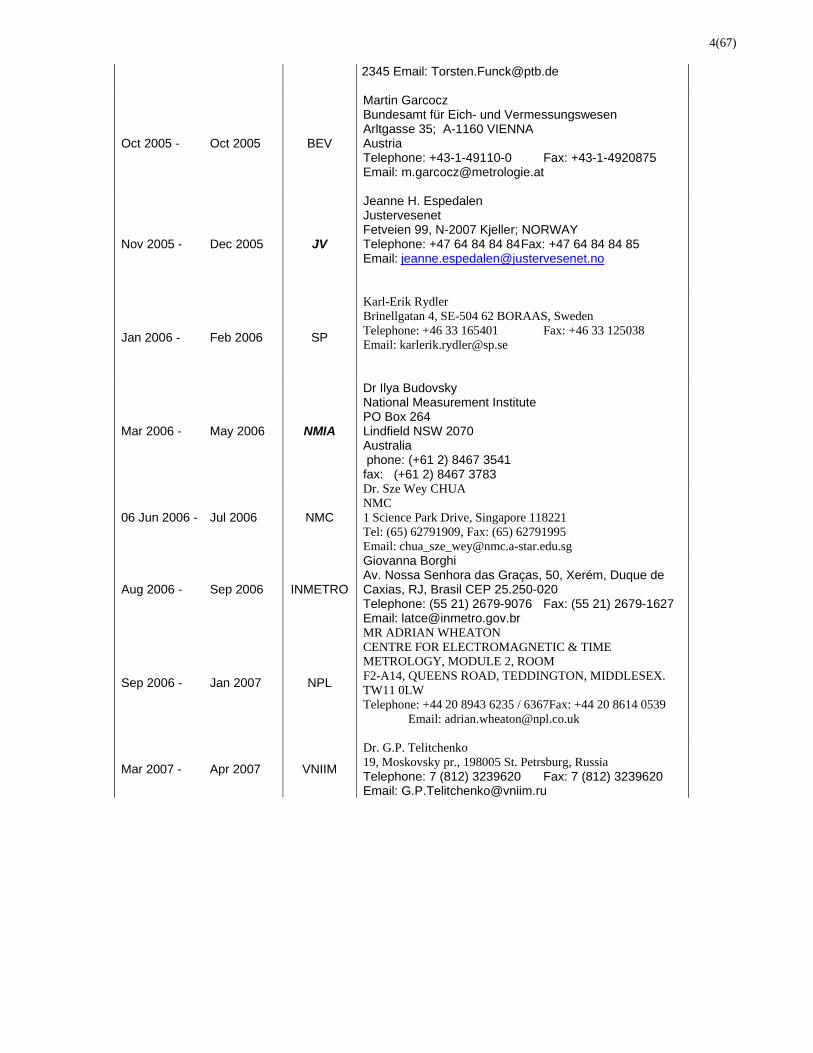
2345 Email: [email protected]
Oct 2005 - Oct 2005 BEV
Martin Garcocz Bundesamt für Eich- und Vermessungswesen Arltgasse 35; A-1160 VIENNA Austria Telephone: +43-1-49110-0 Fax: +43-1-4920875 Email: [email protected]
Nov 2005 - Dec 2005 JV
Jeanne H. Espedalen Justervesenet Fetveien 99, N-2007 Kjeller; NORWAY Telephone: +47 64 84 84 84 Fax: +47 64 84 84 85 Email: [email protected]
Jan 2006 - Feb 2006 SP
Karl-Erik Rydler Brinellgatan 4, SE-504 62 BORAAS, Sweden Telephone: +46 33 165401 Fax: +46 33 125038 Email: [email protected]
Mar 2006 - May 2006 NMIA
Dr Ilya Budovsky National Measurement Institute PO Box 264 Lindfield NSW 2070 Australia phone: (+61 2) 8467 3541 fax: (+61 2) 8467 3783
06 Jun 2006 - Jul 2006 NMC
Dr. Sze Wey CHUA NMC 1 Science Park Drive, Singapore 118221 Tel: (65) 62791909, Fax: (65) 62791995 Email: [email protected]
Aug 2006 - Sep 2006 INMETRO
Giovanna Borghi Av. Nossa Senhora das Graças, 50, Xerém, Duque de Caxias, RJ, Brasil CEP 25.250-020 Telephone: (55 21) 2679-9076 Fax: (55 21) 2679-1627 Email: [email protected]
Sep 2006 - Jan 2007 NPL
MR ADRIAN WHEATON CENTRE FOR ELECTROMAGNETIC & TIME METROLOGY, MODULE 2, ROOM F2-A14, QUEENS ROAD, TEDDINGTON, MIDDLESEX. TW11 0LW Telephone: +44 20 8943 6235 / 6367Fax: +44 20 8614 0539 Email: [email protected]
Mar 2007 - Apr 2007 VNIIM
Dr. G.P. Telitchenko 19, Moskovsky pr., 198005 St. Petrsburg, Russia Telephone: 7 (812) 3239620 Fax: 7 (812) 3239620 Email: [email protected]
5(67)
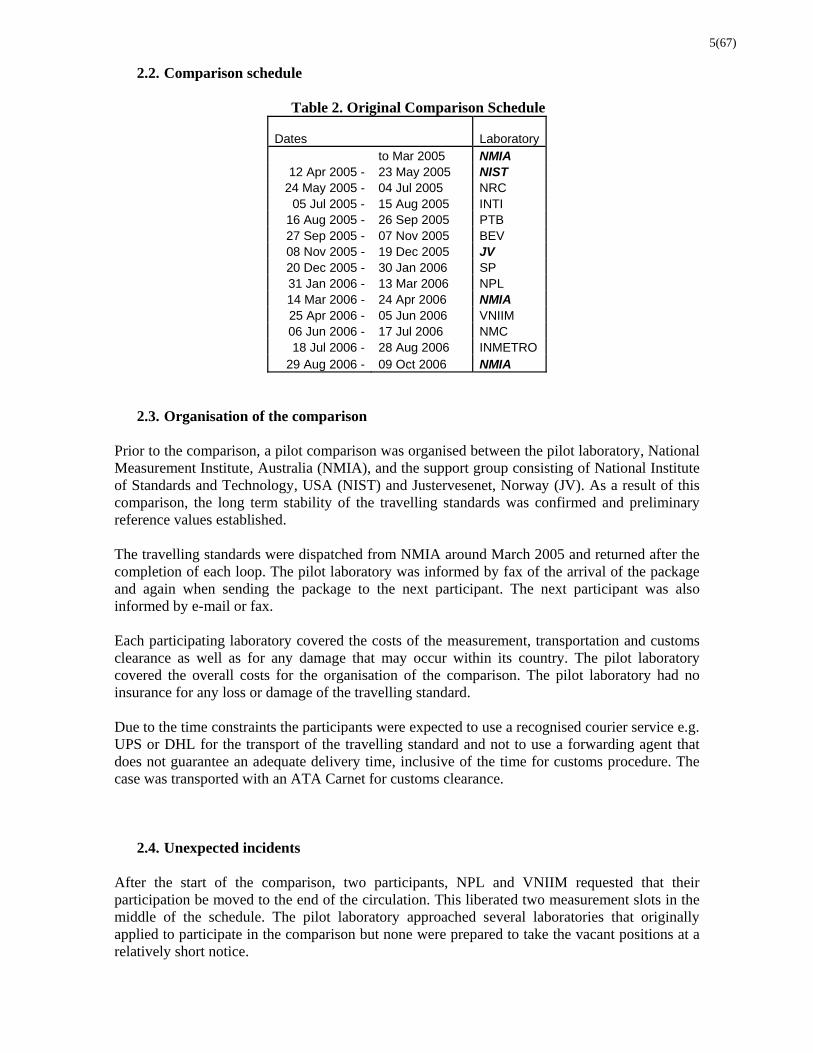
2.2. Comparison schedule
Table 2. Original Comparison Schedule Dates Laboratory to Mar 2005 NMIA
12 Apr 2005 - 23 May 2005 NIST 24 May 2005 - 04 Jul 2005 NRC
05 Jul 2005 - 15 Aug 2005 INTI 16 Aug 2005 - 26 Sep 2005 PTB 27 Sep 2005 - 07 Nov 2005 BEV 08 Nov 2005 - 19 Dec 2005 JV 20 Dec 2005 - 30 Jan 2006 SP 31 Jan 2006 - 13 Mar 2006 NPL 14 Mar 2006 - 24 Apr 2006 NMIA 25 Apr 2006 - 05 Jun 2006 VNIIM 06 Jun 2006 - 17 Jul 2006 NMC 18 Jul 2006 - 28 Aug 2006 INMETRO
29 Aug 2006 - 09 Oct 2006 NMIA
2.3. Organisation of the comparison Prior to the comparison, a pilot comparison was organised between the pilot laboratory, National Measurement Institute, Australia (NMIA), and the support group consisting of National Institute of Standards and Technology, USA (NIST) and Justervesenet, Norway (JV). As a result of this comparison, the long term stability of the travelling standards was confirmed and preliminary reference values established. The travelling standards were dispatched from NMIA around March 2005 and returned after the completion of each loop. The pilot laboratory was informed by fax of the arrival of the package and again when sending the package to the next participant. The next participant was also informed by e-mail or fax. Each participating laboratory covered the costs of the measurement, transportation and customs clearance as well as for any damage that may occur within its country. The pilot laboratory covered the overall costs for the organisation of the comparison. The pilot laboratory had no insurance for any loss or damage of the travelling standard. Due to the time constraints the participants were expected to use a recognised courier service e.g. UPS or DHL for the transport of the travelling standard and not to use a forwarding agent that does not guarantee an adequate delivery time, inclusive of the time for customs procedure. The case was transported with an ATA Carnet for customs clearance.
2.4. Unexpected incidents After the start of the comparison, two participants, NPL and VNIIM requested that their participation be moved to the end of the circulation. This liberated two measurement slots in the middle of the schedule. The pilot laboratory approached several laboratories that originally applied to participate in the comparison but none were prepared to take the vacant positions at a relatively short notice.
6(67) In 2006 NPL chose a little known courier company to send the travelling standards to VNIIM. After the measurements at VNIIM were completed in April 2007 the same courier took possession of the standards to send them back to the pilot laboratory. Following this, all contact with the courier ceased, leading to eventual loss of the standards. Since, prior to their disappearance, the travelling standards exhibited exceptional stability, the CCEM working group on low-frequency standards decided in June 2008 to accept the results of the comparison as valid without the final measurement by NMIA.
3. Travelling standards and measurement instructions
3.1. Description of the travelling standards
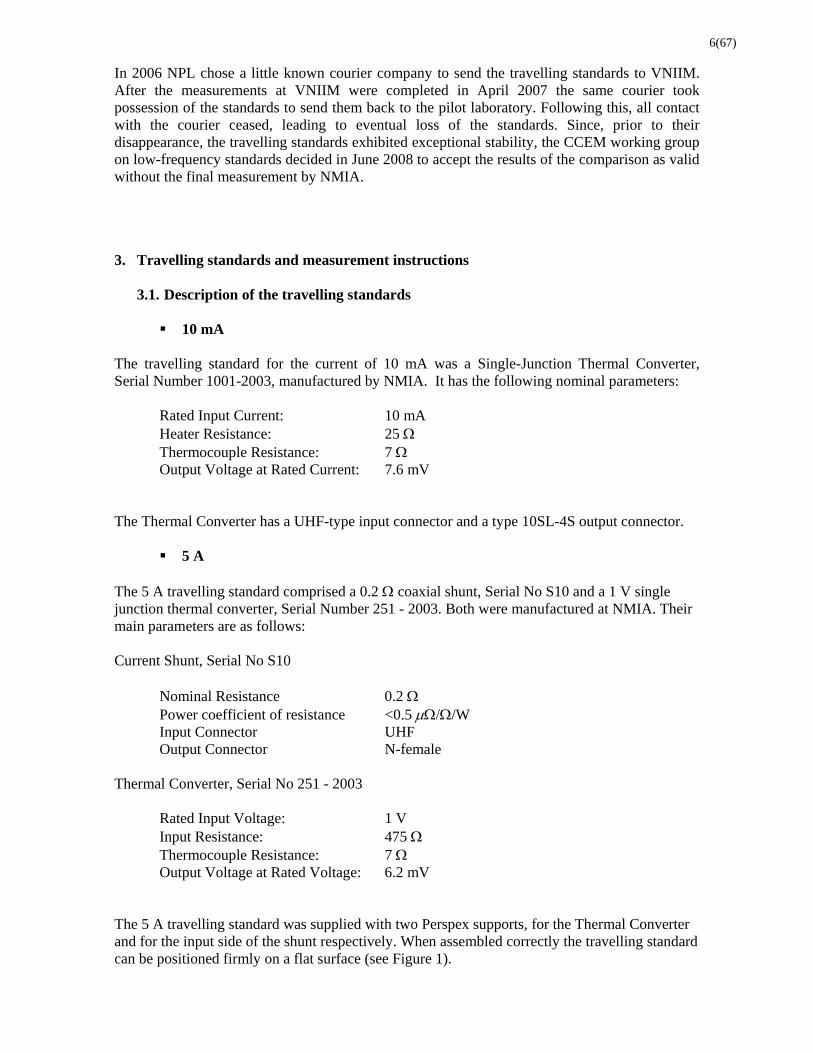
10 mA The travelling standard for the current of 10 mA was a Single-Junction Thermal Converter, Serial Number 1001-2003, manufactured by NMIA. It has the following nominal parameters:
Rated Input Current: 10 mA Heater Resistance: 25 Thermocouple Resistance: 7 Output Voltage at Rated Current: 7.6 mV
The Thermal Converter has a UHF-type input connector and a type 10SL-4S output connector.
5 A The 5 A travelling standard comprised a 0.2 coaxial shunt, Serial No S10 and a 1 V single junction thermal converter, Serial Number 251 - 2003. Both were manufactured at NMIA. Their main parameters are as follows: Current Shunt, Serial No S10
Nominal Resistance 0.2 Power coefficient of resistance <0.5 /W Input Connector UHF Output Connector N-female
Thermal Converter, Serial No 251 - 2003
Rated Input Voltage: 1 V Input Resistance: 475 Thermocouple Resistance: 7 Output Voltage at Rated Voltage: 6.2 mV
The 5 A travelling standard was supplied with two Perspex supports, for the Thermal Converter and for the input side of the shunt respectively. When assembled correctly the travelling standard can be positioned firmly on a flat surface (see Figure 1).

7(67)
Figure 1 Physical layout of the 5A travelling standard
3.2. Quantities to be measured and measurement conditions
Ac-dc current transfer difference was defined as
dc
dcac
I
II
where Iac is an rms ac current, and Idc is a dc current which, when reversed, produces the same mean output response as the rms
ac current. Differences were expressed in microamperes per ampere (A/A) and a positive sign
signifies that more ac than dc current was required for the same output response.
3.3. Measurement instructions
The following detailed instructions were given to the participants. Upon receiving the package, check input and output resistances of the two thermal
converters. Check also that there is a high resistance (>100 M) between the input and the output. In making these preliminary measurements, make sure not to exceed the nominal current of the thermal converters (for input resistance), 1 mA (for output resistance) and 100 V between the heater and the thermocouple. In case of any failure, inform the pilot laboratory immediately.

8(67) The ac-dc transfer difference is to be measured for the “Lo” position of the travelling
standard, i.e. with both its input and output earthed. The connection to earth must remain at all times to protect the thermocouple.
Care should be taken not to apply current above nominal, which may destroy the travelling standards.
Recommended ambient conditions are temperature (23±1)°C and relative humidity (50±5)%.
At least 30 minutes should be allowed for stabilisation after the fist application of current. The measurement frequency should be within 1 % of its nominal value. The frequency
and its uncertainty must be reported. Sufficient delay time should be used between successive applications of alternating and
direct current. Note that the thermal converter used in the 5A travelling standard has a time constant of approximately 4 seconds.
The ac-dc difference of each travelling standard was to be measured at its nominal current and the following frequencies: Mandatary: 10 Hz, 55 Hz, 1 kHz, 10 kHz Optional: 20 kHz, 50 kHz, 100 kHz. 4. Methods of measurement Table 3. Reference standards and measurement methods at 10 mA
Laboratory Reference Standard Measurement Method Source of Traceability
NMIA Micropotentiometer SJTC Direct Comparison In-house
NIST 3D MJTC, SJTC Direct Comparison In-house
NRC MJTC10kHz, CJTC20 kHz Direct Comparison In-house
INTI PMJTC Direct Comparison PTB
PTB QPMJTC Direct Comparison In-house
BEV PMJTC1kHz, SJTC10 kHz Direct Comparison In-house
JV PMJT Direct Comparison PTB
SP MJTC1kHz, SJTC10 kHz Direct Comparison In-house
NMC PMJTC Direct Comparison PTB
INMETRO Fluke A40 Shunt +SJTC Direct Comparison PTB
NPL Guildline MJTC Direct Comparison In-house
VNIIM SJTC Direct Comparison In-house
9(67) Table 4. Reference standards and measurement methods at 5 A
Laboratory Reference Standard Measurement Method Source of Traceability
NMIA NMIA Shunt + SJTC Direct Comparison In-house
NIST NIST Shunt + SJTC Build-up In-house
NRC NRC Shunt + SJTC Build-up In-house
INTI Shunt + PMJTC Build-up In-house
PTBHolt Shunt + PMJTC, JV Shunt
+ PMJTCBuild-up In-house
BEV BEV Shunt + PMJTC Build-up In-house
JV JV Shunt + PMJTC Build-up In-house
SP SP Shunt + PMJTC Build-up In-house
NMC Holt Shunt + PMJTC Build-up In-house
INMETRO Fluke A40A Shunt +SJTC Direct Comparison PTB
NPL Shunt + SJTC Build-up In-house
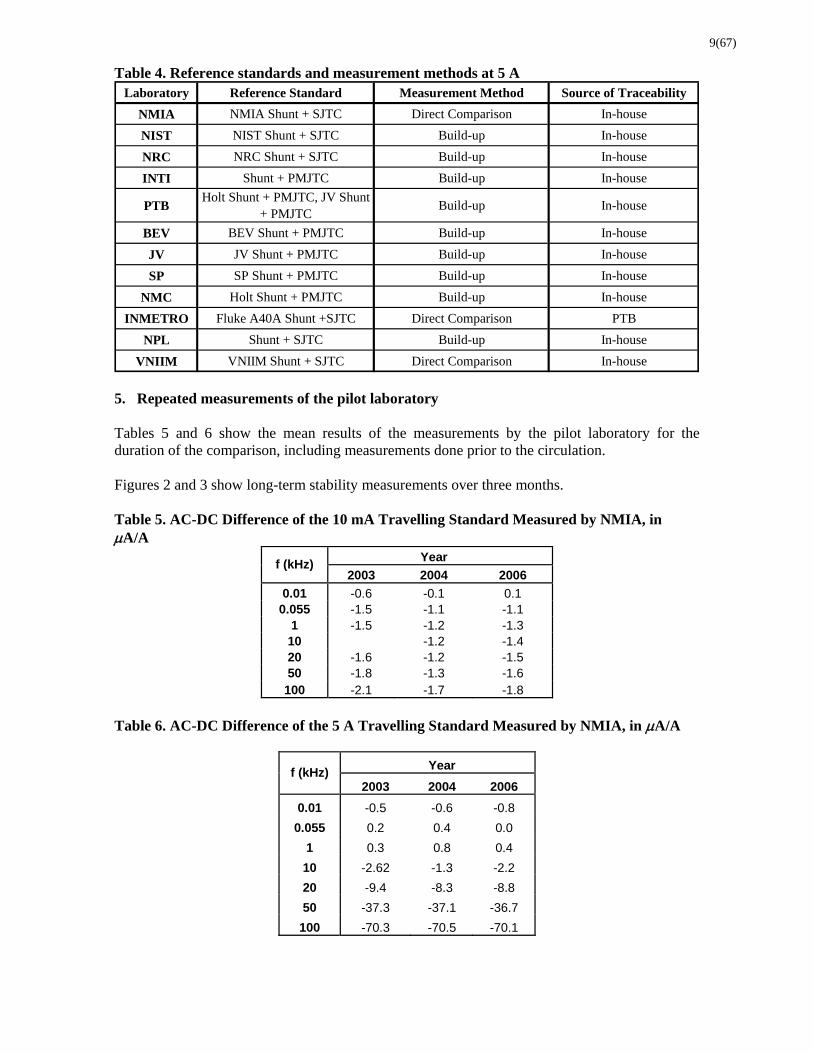
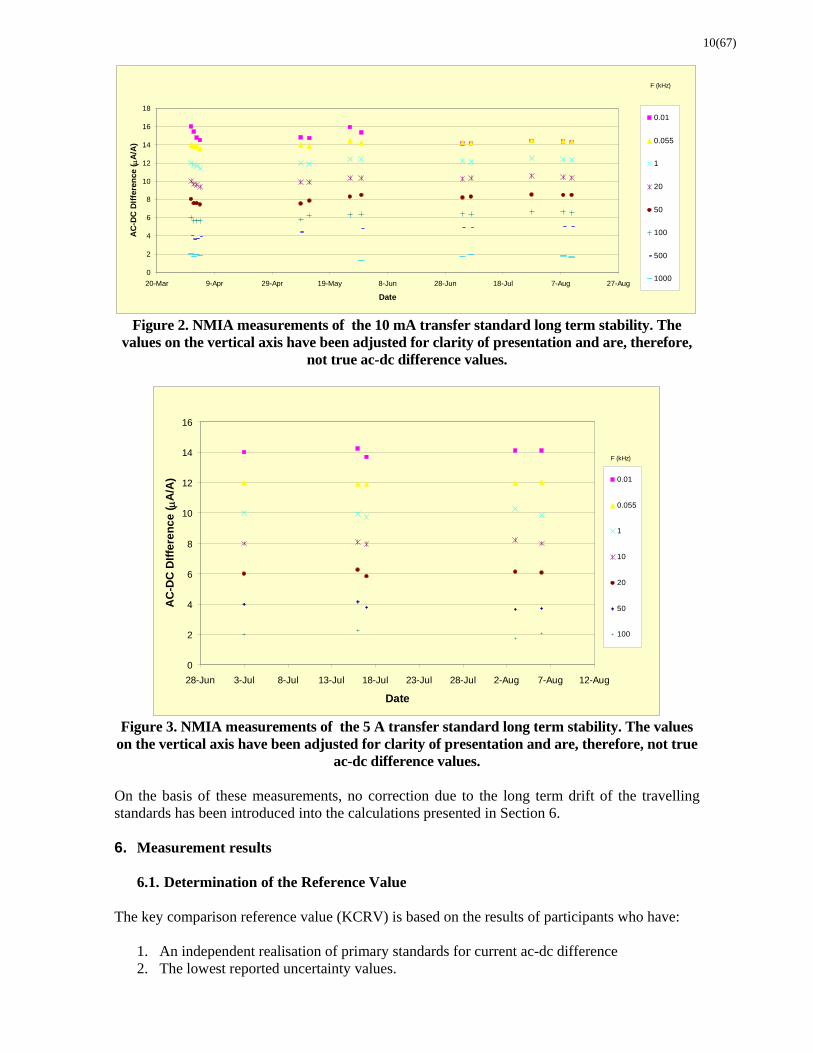
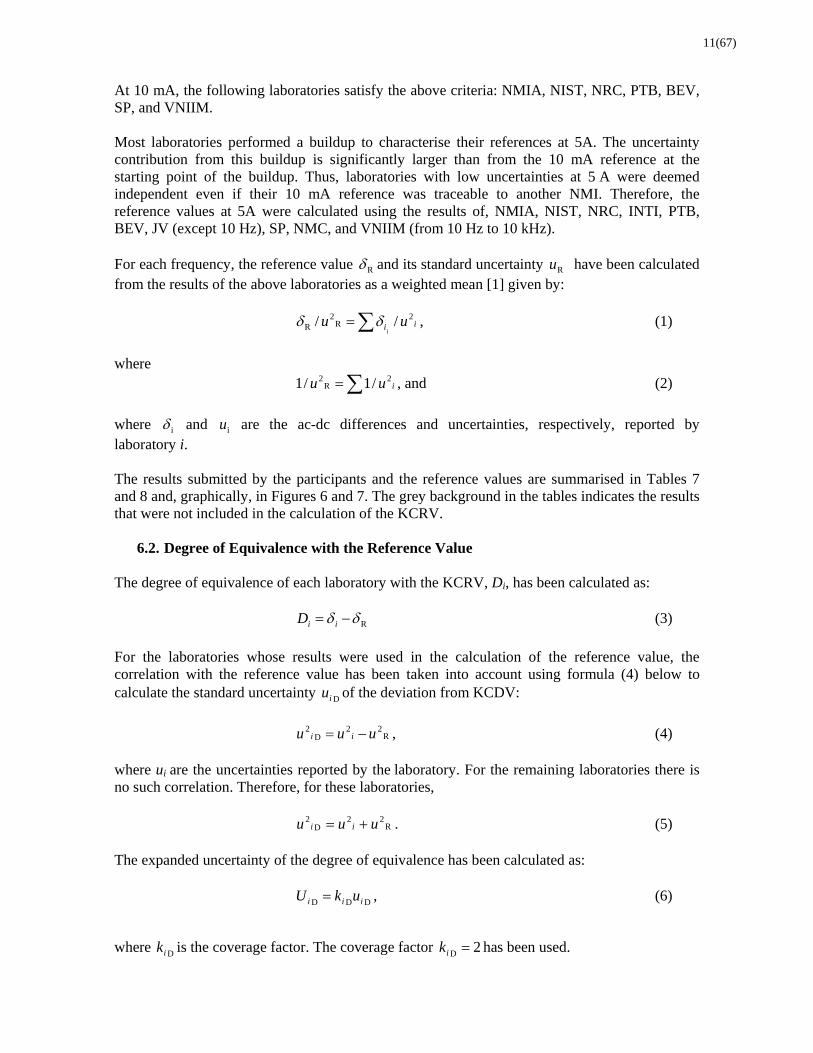
VNIIM VNIIM Shunt + SJTC Direct Comparison In-house 5. Repeated measurements of the pilot laboratory Tables 5 and 6 show the mean results of the measurements by the pilot laboratory for the duration of the comparison, including measurements done prior to the circulation. Figures 2 and 3 show long-term stability measurements over three months. Table 5. AC-DC Difference of the 10 mA Travelling Standard Measured by NMIA, in A/A
Year f (kHz)
2003 2004 2006
0.01 -0.6 -0.1 0.1 0.055 -1.5 -1.1 -1.1
1 -1.5 -1.2 -1.3 10 -1.2 -1.4 20 -1.6 -1.2 -1.5 50 -1.8 -1.3 -1.6
100 -2.1 -1.7 -1.8
Table 6. AC-DC Difference of the 5 A Travelling Standard Measured by NMIA, in A/A
Year f (kHz)
2003 2004 2006
0.01 -0.5 -0.6 -0.8
0.055 0.2 0.4 0.0
1 0.3 0.8 0.4
10 -2.62 -1.3 -2.2
20 -9.4 -8.3 -8.8
50 -37.3 -37.1 -36.7
100 -70.3 -70.5 -70.1
10(67)
0
2
4
6
8
10
12
14
16
18
20-Mar 9-Apr 29-Apr 19-May 8-Jun 28-Jun 18-Jul 7-Aug 27-Aug
Date
AC
-DC
DIf
fere
nce
( A
/A)
0.01
0.055
1
20
50
100
500
1000
F (kHz)
Figure 2. NMIA measurements of the 10 mA transfer standard long term stability. The
values on the vertical axis have been adjusted for clarity of presentation and are, therefore, not true ac-dc difference values.
0
2
4
6
8
10
12
14
16
28-Jun 3-Jul 8-Jul 13-Jul 18-Jul 23-Jul 28-Jul 2-Aug 7-Aug 12-Aug
Date
AC
-DC
DIf
fere
nc
e (A
/A) 0.01
0.055
1
10
20
50
100
F (kHz)
Figure 3. NMIA measurements of the 5 A transfer standard long term stability. The values
on the vertical axis have been adjusted for clarity of presentation and are, therefore, not true ac-dc difference values.
On the basis of these measurements, no correction due to the long term drift of the travelling standards has been introduced into the calculations presented in Section 6. 6. Measurement results
6.1. Determination of the Reference Value The key comparison reference value (KCRV) is based on the results of participants who have:
1. An independent realisation of primary standards for current ac-dc difference 2. The lowest reported uncertainty values.
11(67) At 10 mA, the following laboratories satisfy the above criteria: NMIA, NIST, NRC, PTB, BEV, SP, and VNIIM. Most laboratories performed a buildup to characterise their references at 5A. The uncertainty contribution from this buildup is significantly larger than from the 10 mA reference at the starting point of the buildup. Thus, laboratories with low uncertainties at 5 A were deemed independent even if their 10 mA reference was traceable to another NMI. Therefore, the reference values at 5A were calculated using the results of, NMIA, NIST, NRC, INTI, PTB, BEV, JV (except 10 Hz), SP, NMC, and VNIIM (from 10 Hz to 10 kHz). For each frequency, the reference value R and its standard uncertainty Ru have been calculated from the results of the above laboratories as a weighted mean [1] given by:
ii uui
2R
2R // , (1)
where
iuu 2R
2 /1/1 , and (2)
where i and iu are the ac-dc differences and uncertainties, respectively, reported by laboratory i.
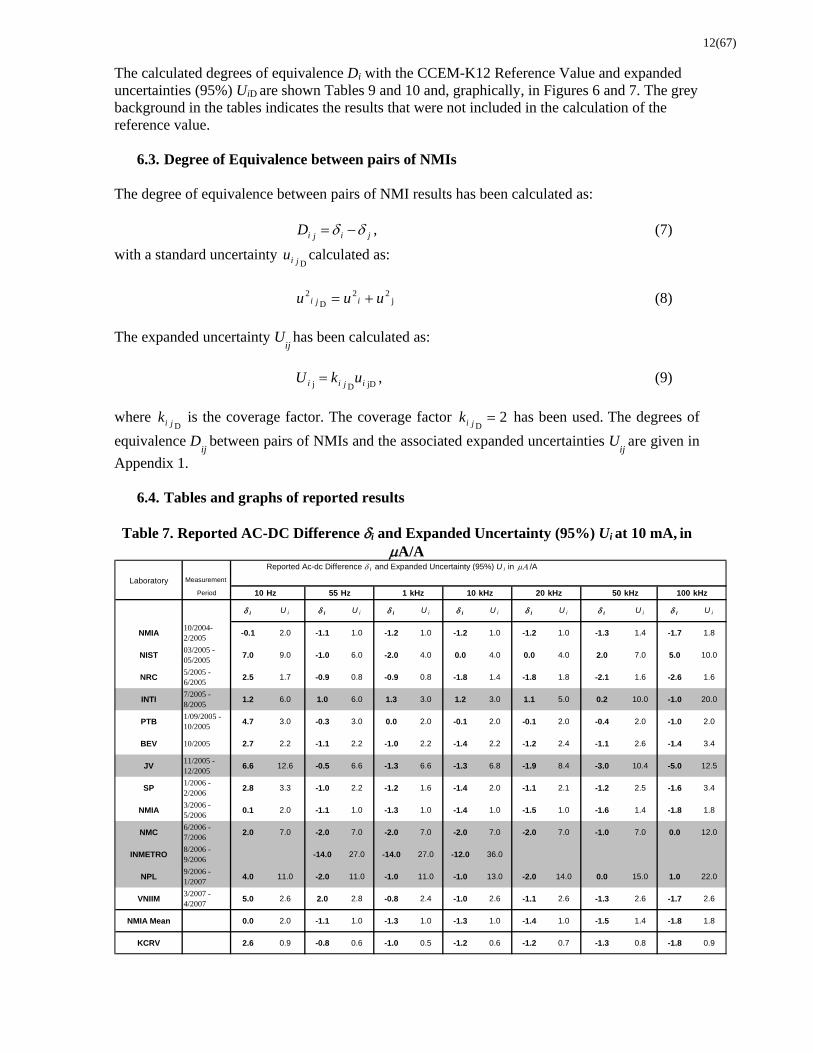
The results submitted by the participants and the reference values are summarised in Tables 7 and 8 and, graphically, in Figures 6 and 7. The grey background in the tables indicates the results that were not included in the calculation of the KCRV.
6.2. Degree of Equivalence with the Reference Value The degree of equivalence of each laboratory with the KCRV, Di, has been calculated as:
R iiD (3)
For the laboratories whose results were used in the calculation of the reference value, the correlation with the reference value has been taken into account using formula (4) below to calculate the standard uncertainty Diu of the deviation from KCDV:
R
22D
2 uuu ii , (4) where ui are the uncertainties reported by the laboratory. For the remaining laboratories there is no such correlation. Therefore, for these laboratories,
R22
D2 uuu ii . (5)
The expanded uncertainty of the degree of equivalence has been calculated as:
DDD iii ukU , (6)
where Dik is the coverage factor. The coverage factor 2D ik has been used.
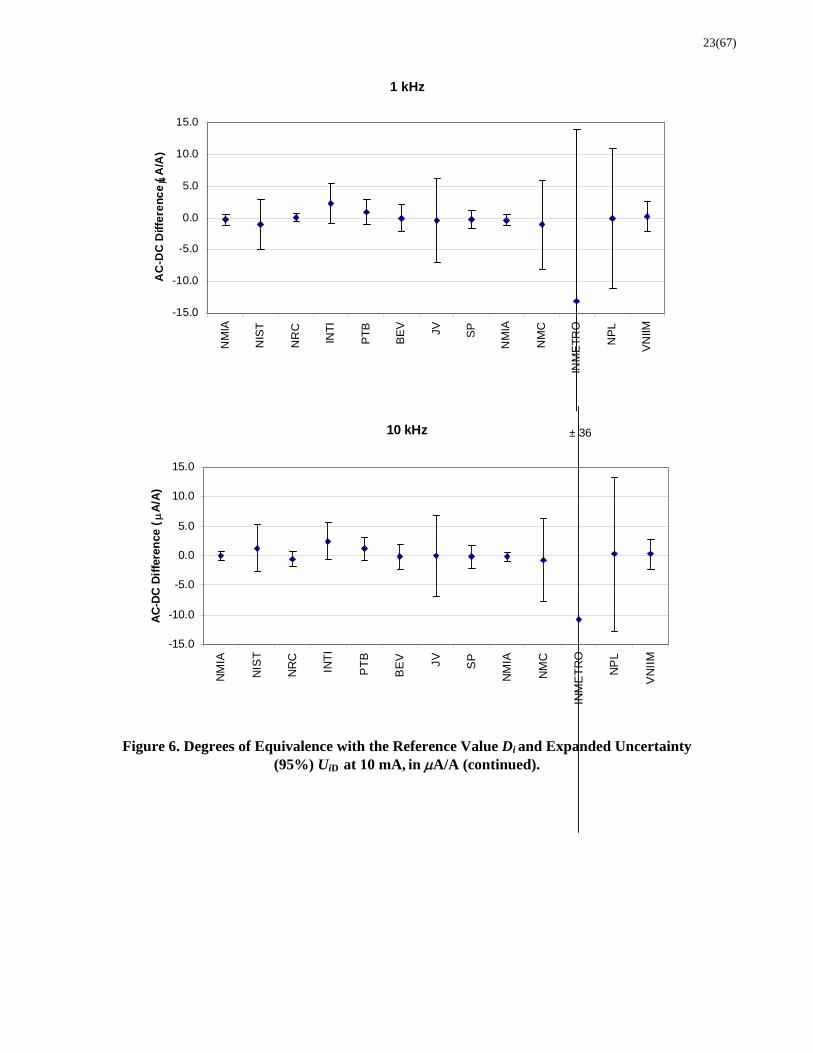
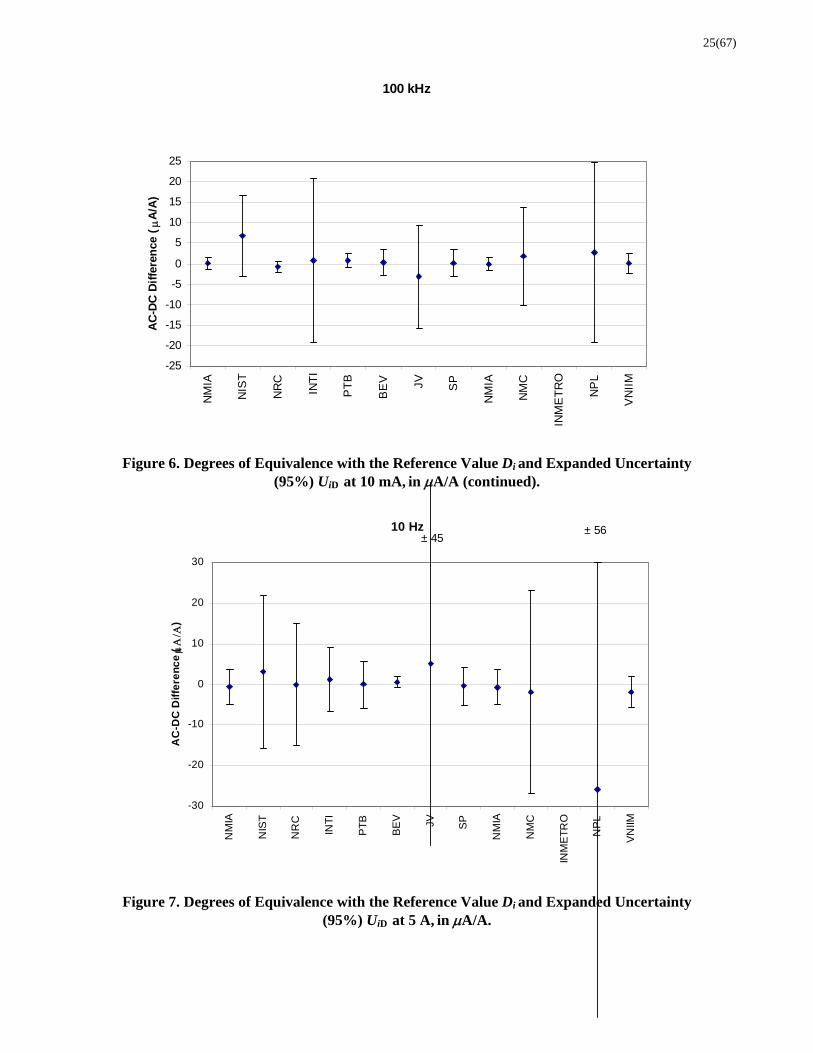
12(67) The calculated degrees of equivalence Di with the CCEM-K12 Reference Value and expanded uncertainties (95%) UiD are shown Tables 9 and 10 and, graphically, in Figures 6 and 7. The grey background in the tables indicates the results that were not included in the calculation of the reference value.
6.3. Degree of Equivalence between pairs of NMIs
The degree of equivalence between pairs of NMI results has been calculated as:
jijiD , (7)
with a standard uncertainty Djiu calculated as:
j
22D
2 uuu iji (8)
The expanded uncertainty U
ij has been calculated as:
jDDj ijii ukU , (9)
where Djik is the coverage factor. The coverage factor 2
Djik has been used. The degrees of
equivalence Dij
between pairs of NMIs and the associated expanded uncertainties Uij
are given in
Appendix 1.
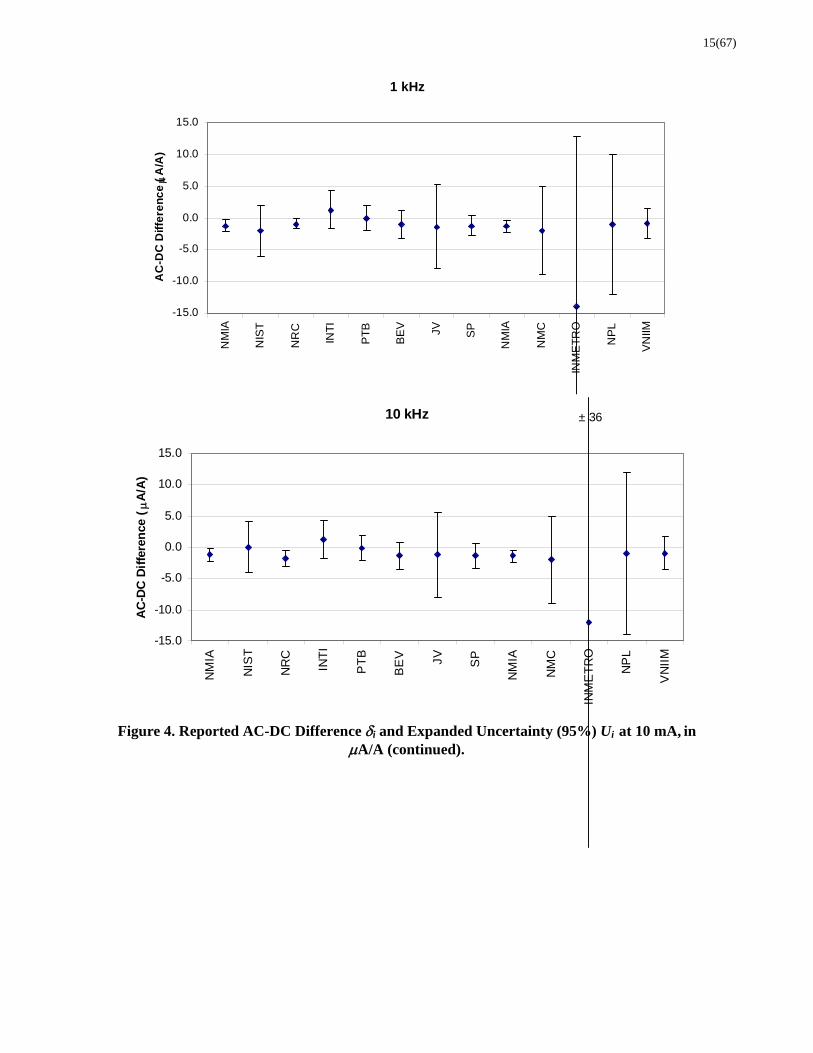
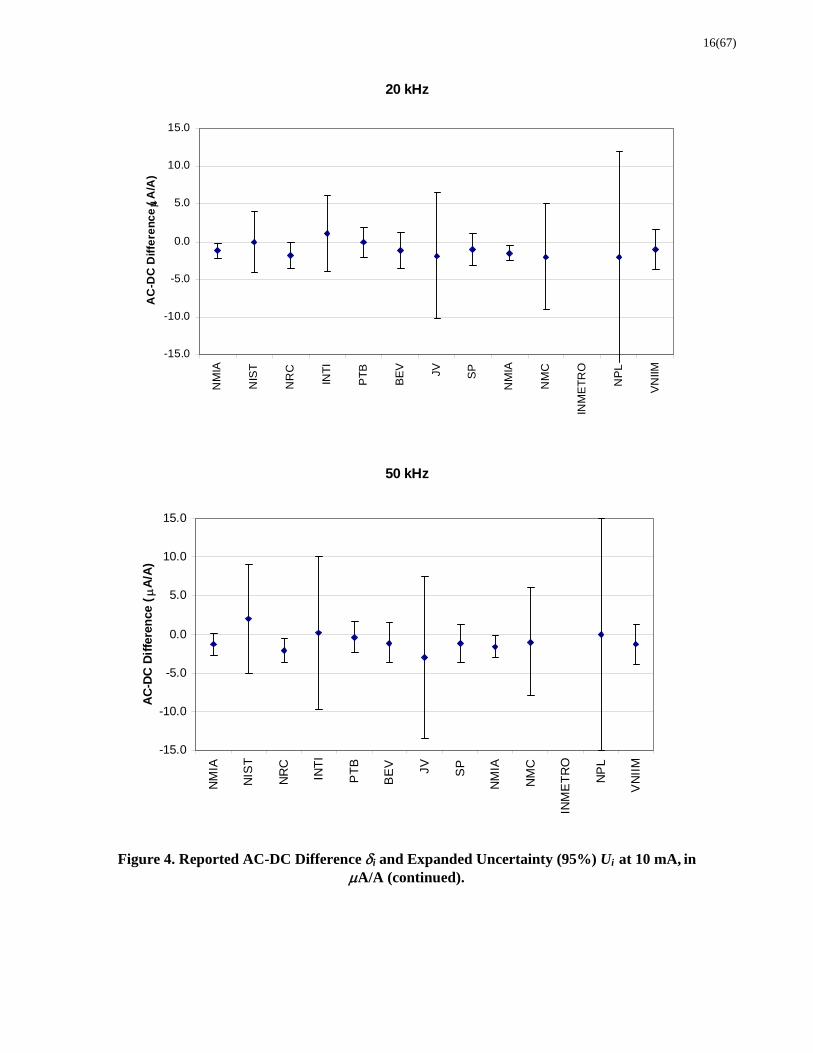
6.4. Tables and graphs of reported results Table 7. Reported AC-DC Difference i and Expanded Uncertainty (95%) Ui at 10 mA, in
A/A Reported Ac-dc Difference i and Expanded Uncertainty (95%) U i in /A
Laboratory Measurement
Period 10 Hz 55 Hz 1 kHz 10 kHz 20 kHz 50 kHz 100 kHz
i U i i U i i U i i U i i U i i U i i U i
NMIA10/2004-2/2005
-0.1 2.0 -1.1 1.0 -1.2 1.0 -1.2 1.0 -1.2 1.0 -1.3 1.4 -1.7 1.8
NIST03/2005 -05/2005
7.0 9.0 -1.0 6.0 -2.0 4.0 0.0 4.0 0.0 4.0 2.0 7.0 5.0 10.0
NRC5/2005 -6/2005
2.5 1.7 -0.9 0.8 -0.9 0.8 -1.8 1.4 -1.8 1.8 -2.1 1.6 -2.6 1.6
INTI7/2005 -8/2005
1.2 6.0 1.0 6.0 1.3 3.0 1.2 3.0 1.1 5.0 0.2 10.0 -1.0 20.0
PTB1/09/2005 - 10/2005
4.7 3.0 -0.3 3.0 0.0 2.0 -0.1 2.0 -0.1 2.0 -0.4 2.0 -1.0 2.0
BEV 10/2005 2.7 2.2 -1.1 2.2 -1.0 2.2 -1.4 2.2 -1.2 2.4 -1.1 2.6 -1.4 3.4
JV11/2005 -12/2005
6.6 12.6 -0.5 6.6 -1.3 6.6 -1.3 6.8 -1.9 8.4 -3.0 10.4 -5.0 12.5
SP1/2006 - 2/2006
2.8 3.3 -1.0 2.2 -1.2 1.6 -1.4 2.0 -1.1 2.1 -1.2 2.5 -1.6 3.4
NMIA3/2006 -5/2006
0.1 2.0 -1.1 1.0 -1.3 1.0 -1.4 1.0 -1.5 1.0 -1.6 1.4 -1.8 1.8
NMC6/2006 -7/2006
2.0 7.0 -2.0 7.0 -2.0 7.0 -2.0 7.0 -2.0 7.0 -1.0 7.0 0.0 12.0
INMETRO8/2006 -9/2006
-14.0 27.0 -14.0 27.0 -12.0 36.0
NPL9/2006 -1/2007
4.0 11.0 -2.0 11.0 -1.0 11.0 -1.0 13.0 -2.0 14.0 0.0 15.0 1.0 22.0
VNIIM3/2007 -4/2007
5.0 2.6 2.0 2.8 -0.8 2.4 -1.0 2.6 -1.1 2.6 -1.3 2.6 -1.7 2.6
NMIA Mean 0.0 2.0 -1.1 1.0 -1.3 1.0 -1.3 1.0 -1.4 1.0 -1.5 1.4 -1.8 1.8
KCRV 2.6 0.9 -0.8 0.6 -1.0 0.5 -1.2 0.6 -1.2 0.7 -1.3 0.8 -1.8 0.9

13(67)
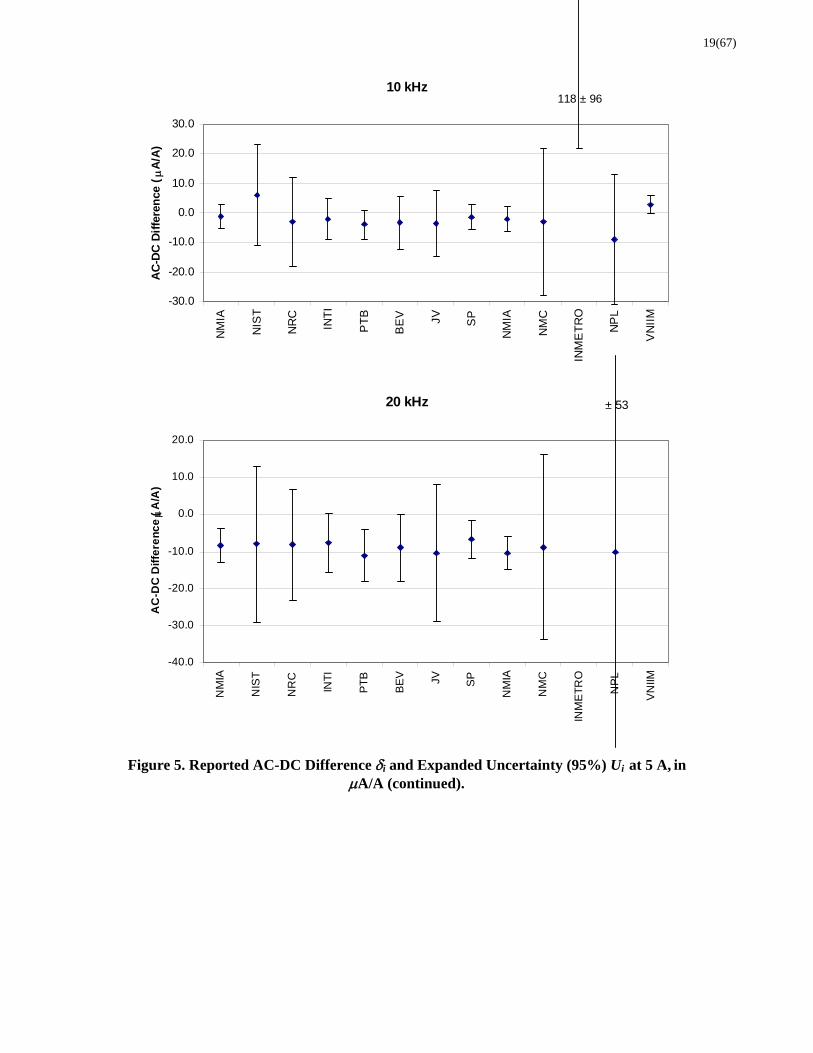
Table 8. Reported AC-DC Difference i and Expanded Uncertainty (95%) Ui at 5 A, in
A/A Laboratory Measurement
Period 10 Hz 55 Hz 1 kHz 10 kHz 20 kHz 50 kHz 100 kHz
i U i i U i i U i i U i i U i i U i i U i
NMIA10/2004-2/2005
-0.6 4.5 0.4 4.1 0.8 4.1 -1.3 4.2 -8.3 4.5 -37.1 8.0 -70.5 12.0
NIST03/2005 -05/2005
3.0 19.0 4.0 18.0 3.0 17.0 6.0 17.0 -8.0 21.0 -33.0 27.0 -91.0 33.0
NRC5/2005 -6/2005
-0.1 15.0 -0.2 14.0 -0.6 14.0 -3.1 15.0 -8.2 15.0 -35.6 20.0 -76.6 31.0
INTI7/2005 -8/2005
1.2 8.0 -1.2 7.0 3.4 5.0 -2.1 7.0 -7.7 8.0 -31.1 13.0 -65.2 22.0
PTB1/09/2005 - 10/2005
0.0 6.0 0.0 4.0 0.0 4.0 -4.0 5.0 -11.0 7.0 -36.0 9.0 -66.0 11.0
BEV 10/2005 0.5 2.0 0.0 2.0 0.0 2.0 -3.2 9.0 -9.0 9.0 -32.9 9.6 -59.1 12.6
JV11/2005 -12/2005
5.0 44.6 1.8 13.2 -0.5 10.6 -3.6 11.0 -10.4 18.4 -36.5 25.2 -68.8 38.4
SP1/2006 - 2/2006
-0.5 4.9 -0.7 4.2 -0.9 3.9 -1.4 4.3 -6.7 5.1 -31.0 10.0 -56.0 15.0
NMIA3/2006 -5/2006
-0.8 4.5 0.0 4.1 0.4 4.1 -2.2 4.2 -10.3 4.5 -37.8 8.0 -69.9 12.0
NMC6/2006 -7/2006
-2.0 25.0 -1.0 25.0 -2.0 25.0 -3.0 25.0 -8.8 25.0 -36.7 25.0 -70.1 44.0
INMETRO8/2006 -9/2006
-1.0 91.0 24.0 91.0 118.0 96.0
NPL9/2006 -1/2007
-26.0 56.0 8.0 25.0 -2.0 24.0 -9.0 22.0 -10.0 53.0 -56.0 84.0 -80.0 166.0
VNIIM3/2007 -4/2007
-2.0 4.0 -2.4 4.0 2.0 3.4 2.8 3.2
NMIA Mean -0.7 4.5 0.2 4.1 0.6 4.1 -1.8 4.2 -9.3 4.5 -37.5 8.0 -70.2 12.0
KCRV -0.1 1.5 -0.3 1.4 0.5 1.3 -0.6 1.8 -8.6 2.6 -34.5 4.0 -65.3 5.7

14(67)
10 Hz
-10.0
-5.0
0.0
5.0
10.0
15.0
20.0
NM
IA
NIS
T
NR
C
INT
I
PT
B
BE
V JV SP
NM
IA
NM
C
INM
ET
RO
NP
L
VN
IIM
AC
-DC
Dif
fere
nc
e (
A/A
)
55 Hz
-15.0
-10.0
-5.0
0.0
5.0
10.0
15.0
NM
IA
NIS
T
NR
C
INT
I
PT
B
BE
V JV SP
NM
IA
NM
C
INM
ET
RO
NP
L
VN
IIM
AC
-DC
Dif
fere
nce
(
A/A
)
Figure 4. Reported AC-DC Difference i and Expanded Uncertainty (95%) Ui at 10 mA, in
A/A
15(67)
1 kHz
-15.0
-10.0
-5.0
0.0
5.0
10.0
15.0
NM
IA
NIS
T
NR
C
INT
I
PT
B
BE
V JV SP
NM
IA
NM
C
INM
ET
RO
NP
L
VN
IIM
AC
-DC
Dif
fere
nc
e (
A/A
)
10 kHz
-15.0
-10.0
-5.0
0.0
5.0
10.0
15.0
NM
IA
NIS
T
NR
C
INT
I
PT
B
BE
V JV SP
NM
IA
NM
C
INM
ET
RO
NP
L
VN
IIM
AC
-DC
Dif
fere
nce
(
A/A
)
± 36
Figure 4. Reported AC-DC Difference i and Expanded Uncertainty (95%) Ui at 10 mA, in
A/A (continued).
16(67)
20 kHz
-15.0
-10.0
-5.0
0.0
5.0
10.0
15.0
NM
IA
NIS
T
NR
C
INT
I
PT
B
BE
V JV SP
NM
IA
NM
C
INM
ET
RO
NP
L
VN
IIM
AC
-DC
Dif
fere
nc
e (
A/A
)
50 kHz
-15.0
-10.0
-5.0
0.0
5.0
10.0
15.0
NM
IA
NIS
T
NR
C
INT
I
PT
B
BE
V JV SP
NM
IA
NM
C
INM
ET
RO
NP
L
VN
IIM
AC
-DC
Dif
fere
nce
(
A/A
)
Figure 4. Reported AC-DC Difference i and Expanded Uncertainty (95%) Ui at 10 mA, in
A/A (continued).

17(67)
100 kHz
-25.0
-20.0
-15.0
-10.0
-5.0
0.0
5.0
10.0
15.0
20.0
25.0
NM
IA
NIS
T
NR
C
INT
I
PT
B
BE
V JV SP
NM
IA
NM
C
INM
ET
RO
NP
L
VN
IIM
AC
-DC
Dif
fere
nce
(
A/A
)
Figure 4. Reported AC-DC Difference i and Expanded Uncertainty (95%) Ui at 10 mA, in
A/A (continued).
10 Hz
-30.0
-20.0
-10.0
0.0
10.0
20.0
30.0
NM
IA
NIS
T
NR
C
INT
I
PT
B
BE
V JV SP
NM
IA
NM
C
INM
ET
RO
NP
L
VN
IIM
AC
-DC
Dif
fere
nc
e (
)
± 45± 56
Figure 5. Reported AC-DC Difference i and Expanded Uncertainty (95%) Ui at 5 A, in
A/A

18(67)
55 Hz
-30.0
-20.0
-10.0
0.0
10.0
20.0
30.0
NM
IA
NIS
T
NR
C
INT
I
PT
B
BE
V JV SP
NM
IA
NM
C
INM
ET
RO
NP
L
VN
IIM
AC
-DC
Dif
fere
nce
(
A/A
)
± 91
1 kHz
-30.0
-20.0
-10.0
0.0
10.0
20.0
30.0
NM
IA
NIS
T
NR
C
INT
I
PT
B
BE
V JV SP
NM
IA
NM
C
INM
ET
RO
NP
L
VN
IIM
AC
-DC
Dif
fere
nc
e (
A/A
)
± 91
Figure 5. Reported AC-DC Difference i and Expanded Uncertainty (95%) Ui at 5 A, in
A/A (continued).
19(67)
10 kHz
-30.0
-20.0
-10.0
0.0
10.0
20.0
30.0
NM
IA
NIS
T
NR
C
INT
I
PT
B
BE
V JV SP
NM
IA
NM
C
INM
ET
RO
NP
L
VN
IIM
AC
-DC
Dif
fere
nce
(
A/A
)
118 ± 96
20 kHz
-40.0
-30.0
-20.0
-10.0
0.0
10.0
20.0
NM
IA
NIS
T
NR
C
INT
I
PT
B
BE
V JV SP
NM
IA
NM
C
INM
ET
RO
NP
L
VN
IIM
AC
-DC
Dif
fere
nc
e (
A/A
)
± 53
Figure 5. Reported AC-DC Difference i and Expanded Uncertainty (95%) Ui at 5 A, in A/A (continued).

20(67)
50 kHz
-70.0
-60.0
-50.0
-40.0
-30.0
-20.0
-10.0
0.0
10.0
20.0
30.0
NM
IA
NIS
T
NR
C
INT
I
PT
B
BE
V JV SP
NM
IA
NM
C
INM
ET
RO
NP
L
VN
IIM
AC
-DC
Dif
fere
nc
e (
A/A
)
100 kHz
-130.0
-120.0
-110.0
-100.0
-90.0
-80.0
-70.0
-60.0
-50.0
-40.0
-30.0
-20.0
-10.0
0.0
NM
IA
NIS
T
NR
C
INT
I
PT
B
BE
V JV SP
NM
IA
NM
C
INM
ET
RO
NP
L
VN
IIM
AC
-DC
Dif
fere
nce
(A
/A)
± 166
Figure 5. Reported AC-DC Difference i and Expanded Uncertainty (95%) Ui at 5 A, in A/A (continued).

21(67)
6.5. Tables and Graphs of Degrees of Equivalence with the Reference Value
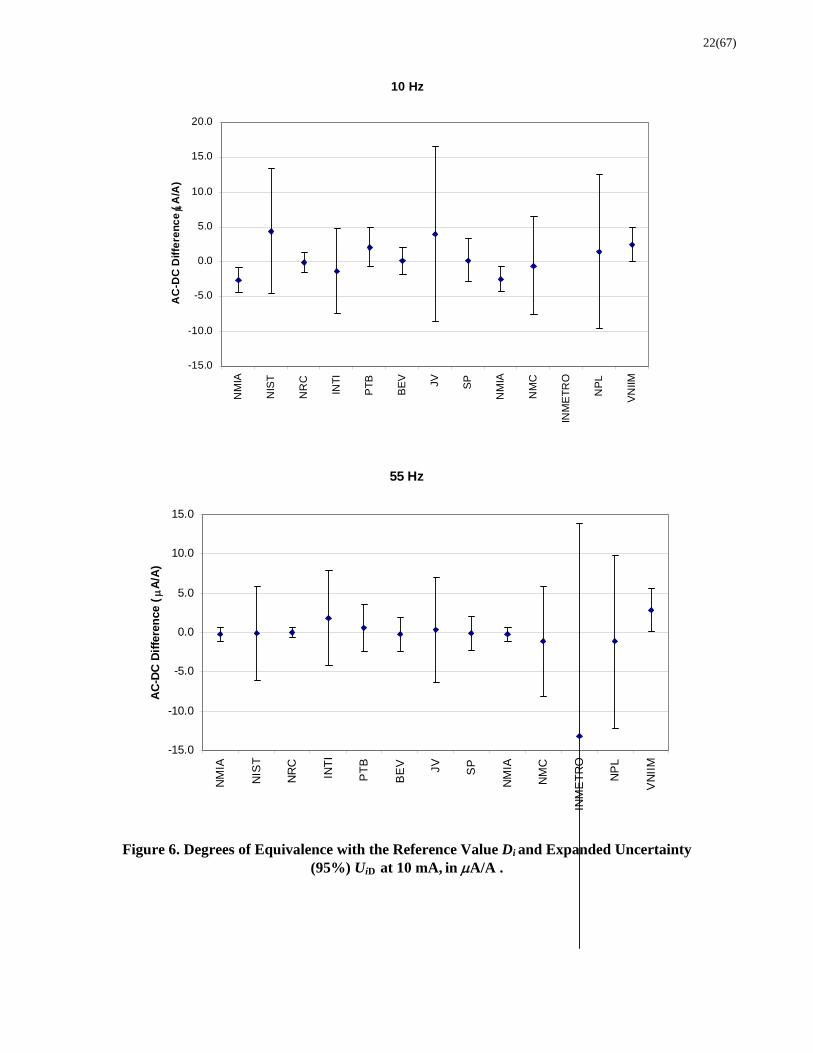
Table 9. Degrees of Equivalence Di and Expanded Uncertainty (95%) UiD at 10 mA, in A/A
10 Hz 55 Hz 1 kHz 10 kHz 20 kHz 50 kHz 100 kHz
D i U i D D i U i D D i U i D D i U i D D i U i D D i U i D D i U i D
NMIA -2.6 1.8 -0.3 0.8 -0.3 0.9 -0.1 0.8 -0.2 0.7 -0.1 1.2 0.0 1.6
NIST 4.4 9.0 -0.2 6.0 -1.0 4.0 1.2 3.9 1.2 3.9 3.3 7.0 6.8 10.0
NRC -0.1 1.4 -0.1 0.6 0.1 0.6 -0.6 1.2 -0.6 1.7 -0.8 1.4 -0.8 1.3
INTI -1.4 6.1 1.8 6.0 2.3 3.0 2.4 3.1 2.3 5.0 1.5 10.0 0.8 20.0
PTB 2.1 2.9 0.5 2.9 1.0 1.9 1.1 1.9 1.1 1.9 0.9 1.8 0.8 1.8
BEV 0.1 2.0 -0.3 2.1 0.0 2.1 -0.2 2.1 0.0 2.3 0.2 2.5 0.4 3.3
JV 4.0 12.6 0.3 6.6 -0.4 6.6 0.0 6.8 -0.7 8.4 -1.7 10.4 -3.2 12.5
SP 0.2 3.2 -0.2 2.1 -0.2 1.5 -0.2 1.9 0.1 2.0 0.1 2.4 0.2 3.3
NMIA -2.5 1.8 -0.3 0.8 -0.3 0.9 -0.2 0.8 -0.3 0.7 -0.3 1.2 0.0 1.6
NMC -0.6 7.1 -1.2 7.0 -1.0 7.0 -0.8 7.0 -0.8 7.0 0.3 7.0 1.8 12.0
INMETRO -13.2 27.0 -13.0 27.0 -10.8 36.0
NPL 1.4 11.0 -1.2 11.0 0.0 11.0 0.2 13.0 -0.8 14.0 1.3 15.0 2.8 22.0
VNIIM 2.4 2.4 2.8 2.7 0.2 2.3 0.2 2.5 0.1 2.5 0.0 2.5 0.1 2.4
LaboratoryDegrees of Equivalence with the CEEM-K12 Reference Value D i and Expanded Uncertainty (95%) U i D in /A
Table 10. Degrees of Equivalence Di and Expanded Uncertainty (95%) UiD at 5 A, in A/A
10 Hz 55 Hz 1 kHz 10 kHz 20 kHz 50 kHz 100 kHz
D i U i D D i U i D D i U i D D i U i D D i U i D D i U i D D i U i D
NMIA -0.6 4.2 0.5 3.9 0.1 3.9 -1.2 3.8 -0.7 3.7 -3.0 6.9 -4.9 10.6
NIST 3.1 18.9 4.3 17.9 2.5 16.9 6.6 16.9 0.6 20.8 1.5 26.7 -25.7 32.5
NRC 0.0 14.9 0.1 13.9 -1.1 13.9 -2.5 14.9 0.4 14.8 -1.1 19.6 -11.3 30.5
INTI 1.3 7.9 -0.9 6.9 2.9 4.8 -1.5 6.8 0.9 7.6 3.4 12.4 0.1 21.3
PTB 0.1 5.8 0.3 3.8 -0.5 3.8 -3.4 4.7 -2.4 6.5 -1.5 8.1 -0.7 9.4
BEV 0.6 1.3 0.3 1.5 -0.5 1.5 -2.6 8.8 -0.4 8.6 1.6 8.7 6.2 11.3
JV 5.1 44.6 2.1 13.3 -1.0 10.7 -3.0 11.2 -1.8 18.6 -2.0 25.5 -3.5 38.8
SP -0.4 4.7 -0.4 4.0 -1.4 3.7 -0.8 3.9 1.9 4.4 3.5 9.2 9.3 13.9
NMIA -0.7 4.2 0.4 3.9 -0.1 3.9 -1.6 3.8 -1.7 3.7 -3.3 6.9 -4.6 10.6
NMC -1.9 25.0 -0.7 25.0 -2.5 25.0 -2.4 24.9 -0.2 24.9 -2.2 24.7 -4.9 43.6
INMETRO -0.7 91.0 23.5 91.0 118.6 96.0
NPL -25.9 56.0 8.3 25.0 -2.5 24.0 -8.4 22.1 -1.4 53.1 -21.5 84.1 -14.7 166.1
VNIIM -1.9 3.7 -2.1 3.8 1.5 3.1 3.4 2.6
LaboratoryDegrees of Equivalence with the CEEM-K12 Reference Value D i and Expanded Uncertainty (95%) U i D in /A
22(67)
10 Hz
-15.0
-10.0
-5.0
0.0
5.0
10.0
15.0
20.0
NM
IA
NIS
T
NR
C
INT
I
PT
B
BE
V JV SP
NM
IA
NM
C
INM
ET
RO
NP
L
VN
IIM
AC
-DC
Dif
fere
nc
e (
A/A
)
55 Hz
-15.0
-10.0
-5.0
0.0
5.0
10.0
15.0
NM
IA
NIS
T
NR
C
INT
I
PT
B
BE
V JV SP
NM
IA
NM
C
INM
ET
RO
NP
L
VN
IIM
AC
-DC
Dif
fere
nce
(
A/A
)
Figure 6. Degrees of Equivalence with the Reference Value Di and Expanded Uncertainty (95%) UiD at 10 mA, in A/A .
23(67)
1 kHz
-15.0
-10.0
-5.0
0.0
5.0
10.0
15.0
NM
IA
NIS
T
NR
C
INT
I
PT
B
BE
V JV SP
NM
IA
NM
C
INM
ET
RO
NP
L
VN
IIM
AC
-DC
Dif
fere
nc
e (
A/A
)
10 kHz
-15.0
-10.0
-5.0
0.0
5.0
10.0
15.0
NM
IA
NIS
T
NR
C
INT
I
PT
B
BE
V JV SP
NM
IA
NM
C
INM
ET
RO
NP
L
VN
IIM
AC
-DC
Dif
fere
nce
(
A/A
)
± 36
Figure 6. Degrees of Equivalence with the Reference Value Di and Expanded Uncertainty (95%) UiD at 10 mA, in A/A (continued).

24(67)
20 kHz
-15.0
-10.0
-5.0
0.0
5.0
10.0
15.0
NM
IA
NIS
T
NR
C
INT
I
PT
B
BE
V JV SP
NM
IA
NM
C
INM
ET
RO
NP
L
VN
IIM
AC
-DC
Dif
fere
nc
e (
A/A
)
50 kHz
-15
-10
-5
0
5
10
15
NM
IA
NIS
T
NR
C
INT
I
PT
B
BE
V JV SP
NM
IA
NM
C
INM
ET
RO
NP
L
VN
IIM
AC
-DC
Dif
fere
nce
(A
/A)
Figure 6. Degrees of Equivalence with the Reference Value Di and Expanded Uncertainty
(95%) UiD at 10 mA, in A/A (continued).
25(67)
100 kHz
-25
-20
-15
-10
-5
0
5
10
15
20
25
NM
IA
NIS
T
NR
C
INT
I
PT
B
BE
V JV SP
NM
IA
NM
C
INM
ET
RO
NP
L
VN
IIM
AC
-DC
Dif
fere
nce
(
A/A
)
Figure 6. Degrees of Equivalence with the Reference Value Di and Expanded Uncertainty
(95%) UiD at 10 mA, in A/A (continued).
10 Hz
-30
-20
-10
0
10
20
30
NM
IA
NIS
T
NR
C
INT
I
PT
B
BE
V JV SP
NM
IA
NM
C
INM
ET
RO
NP
L
VN
IIM
AC
-DC
Dif
fere
nc
e (
)
± 45± 56
Figure 7. Degrees of Equivalence with the Reference Value Di and Expanded Uncertainty (95%) UiD at 5 A, in A/A.
26(67)
55 Hz
-30
-20
-10
0
10
20
30
NM
IA
NIS
T
NR
C
INT
I
PT
B
BE
V JV SP
NM
IA
NM
C
INM
ET
RO
NP
L
VN
IIM
AC
-DC
Dif
fere
nce
(
A/A
)
± 91
1 kHz
-30
-20
-10
0
10
20
30
NM
IA
NIS
T
NR
C
INT
I
PT
B
BE
V JV SP
NM
IA
NM
C
INM
ET
RO
NP
L
VN
IIM
AC
-DC
Dif
fere
nc
e (
A/A
)
± 91
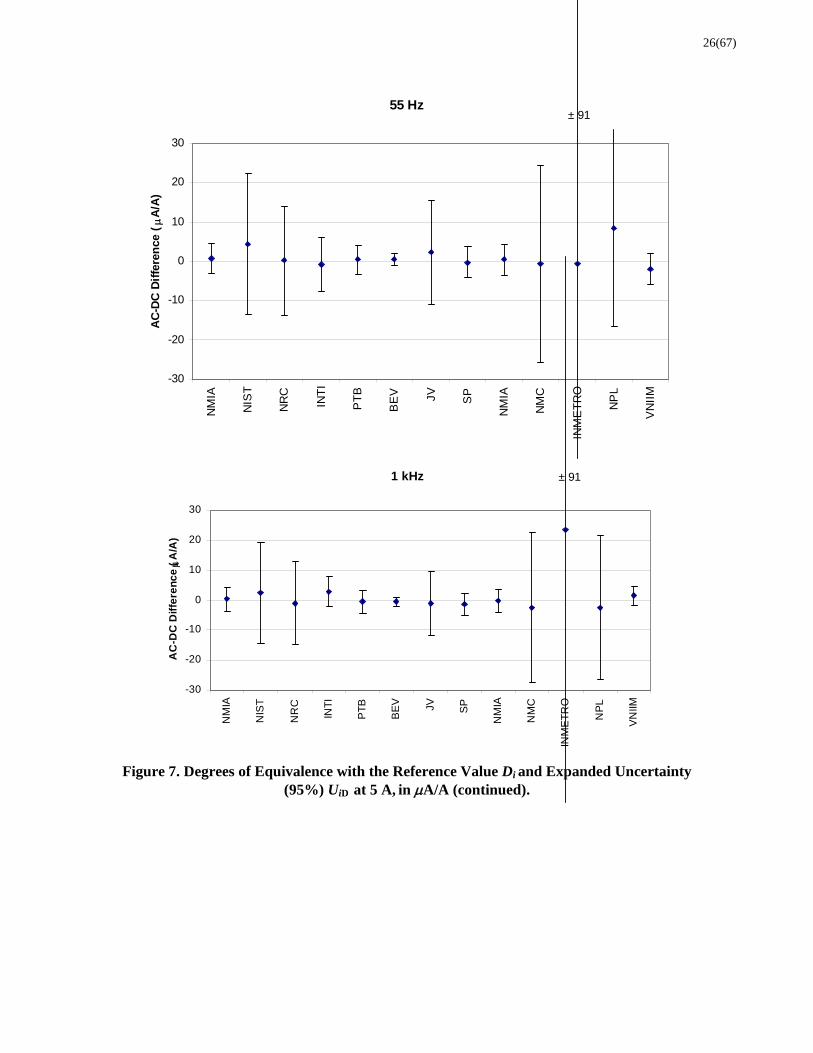
Figure 7. Degrees of Equivalence with the Reference Value Di and Expanded Uncertainty
(95%) UiD at 5 A, in A/A (continued).

27(67)
10 kHz
-30
-20
-10
0
10
20
30
NM
IA
NIS
T
NR
C
INT
I
PT
B
BE
V JV SP
NM
IA
NM
C
INM
ET
RO
NP
L
VN
IIM
AC
-DC
Dif
fere
nce
(
A/A
)
118 ± 96
20 kHz
-30
-20
-10
0
10
20
30
NM
IA
NIS
T
NR
C
INT
I
PT
B
BE
V JV SP
NM
IA
NM
C
INM
ET
RO
NP
L
VN
IIM
AC
-DC
Dif
fere
nc
e (
A/A
)
± 53
Figure 7. Degrees of Equivalence with the Reference Value Di and Expanded Uncertainty (95%) UiD at 5 A, in A/A (continued).

28(67)
50 kHz
-30
-20
-10
0
10
20
30
NM
IA
NIS
T
NR
C
INT
I
PT
B
BE
V JV SP
NM
IA
NM
C
INM
ET
RO
NP
L
VN
IIM
AC
-DC
Dif
fere
nc
e (
A/A
)
±84
100 kHz
-50
-40
-30
-20
-10
0
10
20
30
40
50
NM
IA
NIS
T
NR
C
INT
I
PT
B
BE
V JV SP
NM
IA
NM
C
INM
ET
RO
NP
L
VN
IIM
AC
-DC
Dif
fere
nce
(
A/A
)
± 166
Figure 7. Degrees of Equivalence with the Reference Value Di and Expanded Uncertainty
(95%) UiD at 5 A, in A/A (continued).

29(67) 7. Withdrawals and corrections One NMI found a calculation error in its 5 A, 10 Hz result which was corrected at the Report A stage. 8. Follow-up comparisons No bilateral follow-up comparisons have been requested, however most Regional Metrology Organisations (RMOs) are expected to run a regional key comparison with results linked to those presented in this report. 9. Summary and conclusions The circulation of the travelling standards in the CIPM key comparison CCEM-K12 of ac-dc current transfer difference began in March 2005 and was completed in April 2007. The travelling standards were lost on their way from the last participant to the pilot laboratory. Since, prior to their disappearance, the travelling standards exhibited exceptional stability, the CCEM working group on low-frequencies decided in June 2008 to accept the results of the comparison as valid without the final measurement by the pilot laboratory. The ac-dc transfer differences of the travelling standards have been measured at 10 mA and 5 A and at the frequencies 10 Hz, 55 Hz, 1 kHz, 10 kHz, 20 kHz, 50 kHz, 100 kHz. The key comparison reference values (KCRV) were calculated as the weighted mean of the results of the NMIs with independent realisations of primary standards and low reported uncertainties. The degrees of equivalence with the KCRV and between pairs of NMIs have been determined for the measurement points and show very good agreement. All but three of the calculated degrees of equivalence with the KCRV are within the limits of the expanded uncertainties. 10. References [1] C.F. Dietrich, Uncertainty, Calibration and Probability, Adam Hilger, Bristol, UK, 1991

30(67)
Appendix 1: Degrees of equivalence between pairs of NMIs Table 1. Degrees of equivalence 10 mA, 10 Hz
D i j U i j D i j U i j D i j U i j D i j U i j D i j U i j D i j U i j D i j U i j D i j U i j D i j U i j D i j U i j D i j U i j
NMIA -7.0 9.1 -2.5 2.3 -1.2 6.3 -4.7 3.4 -2.7 2.7 -6.6 12.8 -2.8 3.6 -2.0 7.3 -4.0 11.2 -5.0 3.0NIST 7.0 9.1 4.5 9.1 5.8 10.8 2.3 9.4 4.3 9.2 0.4 15.5 4.2 9.5 5.0 11.4 3.0 14.2 2.0 9.3NRC 2.5 2.3 -4.5 9.1 1.3 6.2 -2.2 3.2 -0.2 2.5 -4.1 12.7 -0.3 3.5 0.5 7.2 -1.5 11.1 -2.5 2.8INTI 1.2 6.3 -5.8 10.8 -1.3 6.2 -3.5 6.7 -1.5 6.4 -5.4 14.0 -1.6 6.8 -0.8 9.3 -2.8 12.6 -3.8 6.5PTB 4.7 3.4 -2.3 9.4 2.2 3.2 3.5 6.7 2.0 3.5 -1.9 13.0 1.9 4.3 2.7 7.6 0.7 11.4 -0.3 3.7BEV 2.7 2.7 -4.3 9.2 0.2 2.5 1.5 6.4 -2.0 3.5 -3.9 12.8 -0.1 3.7 0.7 7.3 -1.3 11.2 -2.3 3.1JV 6.6 12.8 -0.4 15.5 4.1 12.7 5.4 14.0 1.9 13.0 3.9 12.8 3.8 13.0 4.6 14.5 2.6 16.8 1.6 12.9SP 2.8 3.6 -4.2 9.5 0.3 3.5 1.6 6.8 -1.9 4.3 0.1 3.7 -3.8 13.0 0.8 7.7 -1.2 11.5 -2.2 4.0
NMC 2.0 7.3 -5.0 11.4 -0.5 7.2 0.8 9.3 -2.7 7.6 -0.7 7.3 -4.6 14.5 -0.8 7.7 -2.0 13.1 -3.0 7.5NPL 4.0 11.2 -3.0 14.2 1.5 11.1 2.8 12.6 -0.7 11.4 1.3 11.2 -2.6 16.8 1.2 11.5 2.0 13.1 -1.0 11.3
VNIIM 5.0 3.0 -2.0 9.3 2.5 2.8 3.8 6.5 0.3 3.7 2.3 3.1 -1.6 12.9 2.2 4.0 3.0 7.5 1.0 11.3
NISTNMIA INTI VNIIMSP NMC NPLPTB BEV JVNRC
Table 2. Degrees of equivalence 10 mA, 55 Hz
D i j U i j D i j U i j D i j U i j D i j U i j D i j U i j D i j U i j D i j U i j D i j U i j D i j U i j D i j U i j D i j U i j D i j U i j
NMIA -0.1 6.0 -0.2 1.0 -2.1 6.1 -0.8 3.1 0.0 2.3 -0.6 6.7 -0.1 2.3 0.9 7.1 12.9 27.0 0.9 11.0 -3.1 2.9NIST 0.1 6.0 -0.1 6.0 -2.0 8.5 -0.7 6.7 0.1 6.3 -0.5 8.9 0.0 6.3 1.0 9.2 13.0 27.7 1.0 12.5 -3.0 6.6NRC 0.2 1.0 0.1 6.0 -1.9 6.1 -0.6 3.0 0.2 2.2 -0.4 6.6 0.1 2.2 1.1 7.0 13.1 27.0 1.1 11.0 -2.9 2.8INTI 2.1 6.1 2.0 8.5 1.9 6.1 1.3 6.7 2.1 6.4 1.5 9.0 2.0 6.4 3.0 9.3 15.0 27.7 3.0 12.6 -1.0 6.6PTB 0.8 3.1 0.7 6.7 0.6 3.0 -1.3 6.7 0.8 3.6 0.2 7.2 0.7 3.6 1.7 7.6 13.7 27.2 1.7 11.4 -2.3 4.0BEV 0.0 2.3 -0.1 6.3 -0.2 2.2 -2.1 6.4 -0.8 3.6 -0.6 7.0 -0.1 3.0 0.9 7.3 12.9 27.1 0.9 11.2 -3.1 3.5JV 0.6 6.7 0.5 8.9 0.4 6.6 -1.5 9.0 -0.2 7.2 0.6 7.0 0.5 7.0 1.5 9.7 13.5 27.8 1.5 12.9 -2.5 7.2SP 0.1 2.3 0.0 6.3 -0.1 2.2 -2.0 6.4 -0.7 3.6 0.1 3.0 -0.5 7.0 1.0 7.3 13.0 27.1 1.0 11.2 -3.0 3.5
NMC -0.9 7.1 -1.0 9.2 -1.1 7.0 -3.0 9.3 -1.7 7.6 -0.9 7.3 -1.5 9.7 -1.0 7.3 12.0 27.9 0.0 13.1 -4.0 7.5INMETRO -12.9 27.0 -13.0 27.7 -13.1 27.0 -15.0 27.7 -13.7 27.2 -12.9 27.1 -13.5 27.8 -13.0 27.1 -12.0 27.9 -12.0 29.2 -16.0 27.1
NPL -0.9 11.0 -1.0 12.5 -1.1 11.0 -3.0 12.6 -1.7 11.4 -0.9 11.2 -1.5 12.9 -1.0 11.2 0.0 13.1 12.0 29.2 -4.0 11.4VNIIM 3.1 2.9 3.0 6.6 2.9 2.8 1.0 6.6 2.3 4.0 3.1 3.5 2.5 7.2 3.0 3.5 4.0 7.5 16.0 27.1 4.0 11.4
JVNRCNISTNMIA INTI VNIIMSP NMC INMETRO NPLPTB BEV
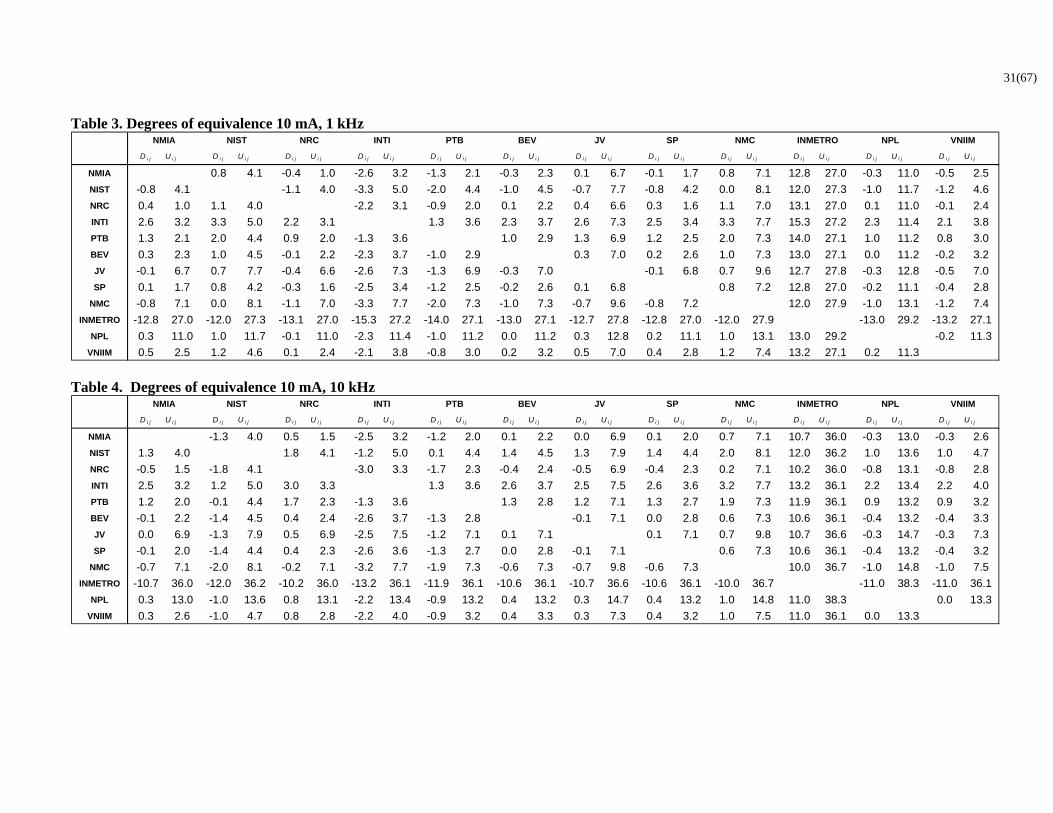
31(67)
Table 3. Degrees of equivalence 10 mA, 1 kHz
D i j U i j D i j U i j D i j U i j D i j U i j D i j U i j D i j U i j D i j U i j D i j U i j D i j U i j D i j U i j D i j U i j D i j U i j
NMIA 0.8 4.1 -0.4 1.0 -2.6 3.2 -1.3 2.1 -0.3 2.3 0.1 6.7 -0.1 1.7 0.8 7.1 12.8 27.0 -0.3 11.0 -0.5 2.5
NIST -0.8 4.1 -1.1 4.0 -3.3 5.0 -2.0 4.4 -1.0 4.5 -0.7 7.7 -0.8 4.2 0.0 8.1 12.0 27.3 -1.0 11.7 -1.2 4.6
NRC 0.4 1.0 1.1 4.0 -2.2 3.1 -0.9 2.0 0.1 2.2 0.4 6.6 0.3 1.6 1.1 7.0 13.1 27.0 0.1 11.0 -0.1 2.4
INTI 2.6 3.2 3.3 5.0 2.2 3.1 1.3 3.6 2.3 3.7 2.6 7.3 2.5 3.4 3.3 7.7 15.3 27.2 2.3 11.4 2.1 3.8
PTB 1.3 2.1 2.0 4.4 0.9 2.0 -1.3 3.6 1.0 2.9 1.3 6.9 1.2 2.5 2.0 7.3 14.0 27.1 1.0 11.2 0.8 3.0
BEV 0.3 2.3 1.0 4.5 -0.1 2.2 -2.3 3.7 -1.0 2.9 0.3 7.0 0.2 2.6 1.0 7.3 13.0 27.1 0.0 11.2 -0.2 3.2
JV -0.1 6.7 0.7 7.7 -0.4 6.6 -2.6 7.3 -1.3 6.9 -0.3 7.0 -0.1 6.8 0.7 9.6 12.7 27.8 -0.3 12.8 -0.5 7.0
SP 0.1 1.7 0.8 4.2 -0.3 1.6 -2.5 3.4 -1.2 2.5 -0.2 2.6 0.1 6.8 0.8 7.2 12.8 27.0 -0.2 11.1 -0.4 2.8
NMC -0.8 7.1 0.0 8.1 -1.1 7.0 -3.3 7.7 -2.0 7.3 -1.0 7.3 -0.7 9.6 -0.8 7.2 12.0 27.9 -1.0 13.1 -1.2 7.4
INMETRO -12.8 27.0 -12.0 27.3 -13.1 27.0 -15.3 27.2 -14.0 27.1 -13.0 27.1 -12.7 27.8 -12.8 27.0 -12.0 27.9 -13.0 29.2 -13.2 27.1
NPL 0.3 11.0 1.0 11.7 -0.1 11.0 -2.3 11.4 -1.0 11.2 0.0 11.2 0.3 12.8 0.2 11.1 1.0 13.1 13.0 29.2 -0.2 11.3
VNIIM 0.5 2.5 1.2 4.6 0.1 2.4 -2.1 3.8 -0.8 3.0 0.2 3.2 0.5 7.0 0.4 2.8 1.2 7.4 13.2 27.1 0.2 11.3
VNIIMSP NMC INMETRO NPLJVNRCNISTNMIA INTI PTB BEV
Table 4. Degrees of equivalence 10 mA, 10 kHz
D i j U i j D i j U i j D i j U i j D i j U i j D i j U i j D i j U i j D i j U i j D i j U i j D i j U i j D i j U i j D i j U i j D i j U i j
NMIA -1.3 4.0 0.5 1.5 -2.5 3.2 -1.2 2.0 0.1 2.2 0.0 6.9 0.1 2.0 0.7 7.1 10.7 36.0 -0.3 13.0 -0.3 2.6
NIST 1.3 4.0 1.8 4.1 -1.2 5.0 0.1 4.4 1.4 4.5 1.3 7.9 1.4 4.4 2.0 8.1 12.0 36.2 1.0 13.6 1.0 4.7
NRC -0.5 1.5 -1.8 4.1 -3.0 3.3 -1.7 2.3 -0.4 2.4 -0.5 6.9 -0.4 2.3 0.2 7.1 10.2 36.0 -0.8 13.1 -0.8 2.8
INTI 2.5 3.2 1.2 5.0 3.0 3.3 1.3 3.6 2.6 3.7 2.5 7.5 2.6 3.6 3.2 7.7 13.2 36.1 2.2 13.4 2.2 4.0
PTB 1.2 2.0 -0.1 4.4 1.7 2.3 -1.3 3.6 1.3 2.8 1.2 7.1 1.3 2.7 1.9 7.3 11.9 36.1 0.9 13.2 0.9 3.2
BEV -0.1 2.2 -1.4 4.5 0.4 2.4 -2.6 3.7 -1.3 2.8 -0.1 7.1 0.0 2.8 0.6 7.3 10.6 36.1 -0.4 13.2 -0.4 3.3
JV 0.0 6.9 -1.3 7.9 0.5 6.9 -2.5 7.5 -1.2 7.1 0.1 7.1 0.1 7.1 0.7 9.8 10.7 36.6 -0.3 14.7 -0.3 7.3
SP -0.1 2.0 -1.4 4.4 0.4 2.3 -2.6 3.6 -1.3 2.7 0.0 2.8 -0.1 7.1 0.6 7.3 10.6 36.1 -0.4 13.2 -0.4 3.2
NMC -0.7 7.1 -2.0 8.1 -0.2 7.1 -3.2 7.7 -1.9 7.3 -0.6 7.3 -0.7 9.8 -0.6 7.3 10.0 36.7 -1.0 14.8 -1.0 7.5
INMETRO -10.7 36.0 -12.0 36.2 -10.2 36.0 -13.2 36.1 -11.9 36.1 -10.6 36.1 -10.7 36.6 -10.6 36.1 -10.0 36.7 -11.0 38.3 -11.0 36.1
NPL 0.3 13.0 -1.0 13.6 0.8 13.1 -2.2 13.4 -0.9 13.2 0.4 13.2 0.3 14.7 0.4 13.2 1.0 14.8 11.0 38.3 0.0 13.3
VNIIM 0.3 2.6 -1.0 4.7 0.8 2.8 -2.2 4.0 -0.9 3.2 0.4 3.3 0.3 7.3 0.4 3.2 1.0 7.5 11.0 36.1 0.0 13.3
JVNRCNISTNMIA INTI PTB BEV VNIIMSP NMC INMETRO NPL

32(67)
Table 5. Degrees of equivalence 10 mA, 20 kHz
D i j U i j D i j U i j D i j U i j D i j U i j D i j U i j D i j U i j D i j U i j D i j U i j D i j U i j D i j U i j D i j U i j
NMIA -1.4 4.0 0.5 1.8 -2.5 5.1 -1.3 2.0 -0.2 2.4 0.5 8.5 -0.3 2.1 0.7 7.1 0.7 14.0 -0.3 2.6NIST 1.4 4.0 1.8 4.3 -1.1 6.4 0.1 4.4 1.2 4.6 1.9 9.3 1.1 4.4 2.0 8.1 2.0 14.6 1.1 4.7NRC -0.5 1.8 -1.8 4.3 -2.9 5.3 -1.7 2.5 -0.6 2.8 0.1 8.6 -0.7 2.6 0.2 7.2 0.2 14.1 -0.7 3.0INTI 2.5 5.1 1.1 6.4 2.9 5.3 1.2 5.4 2.3 5.5 3.0 9.8 2.2 5.4 3.1 8.7 3.1 14.9 2.2 5.6PTB 1.3 2.0 -0.1 4.4 1.7 2.5 -1.2 5.4 1.1 3.0 1.8 8.6 1.0 2.7 1.9 7.3 1.9 14.1 1.0 3.1BEV 0.2 2.4 -1.2 4.6 0.6 2.8 -2.3 5.5 -1.1 3.0 0.7 8.7 -0.1 3.0 0.8 7.4 0.8 14.2 -0.1 3.4JV -0.5 8.5 -1.9 9.3 -0.1 8.6 -3.0 9.8 -1.8 8.6 -0.7 8.7 -0.8 8.7 0.1 11.0 0.1 16.4 -0.8 8.8SP 0.3 2.1 -1.1 4.4 0.7 2.6 -2.2 5.4 -1.0 2.7 0.1 3.0 0.8 8.7 0.9 7.3 0.9 14.2 0.0 3.2
NMC -0.7 7.1 -2.0 8.1 -0.2 7.2 -3.1 8.7 -1.9 7.3 -0.8 7.4 -0.1 11.0 -0.9 7.3 0.0 15.7 -0.9 7.5NPL -0.7 14.0 -2.0 14.6 -0.2 14.1 -3.1 14.9 -1.9 14.1 -0.8 14.2 -0.1 16.4 -0.9 14.2 0.0 15.7 -0.9 14.2
VNIIM 0.3 2.6 -1.1 4.7 0.7 3.0 -2.2 5.6 -1.0 3.1 0.1 3.4 0.8 8.8 0.0 3.2 0.9 7.5 0.9 14.2
VNIIMSP NMC NPLJVNRCNISTNMIA INTI PTB BEV
Table 6. Degrees of equivalence 10 mA, 50 kHz
D i j U i j D i j U i j D i j U i j D i j U i j D i j U i j D i j U i j D i j U i j D i j U i j D i j U i j D i j U i j D i j U i j
NMIA -3.5 7.1 0.7 1.8 -1.7 10.1 -1.1 2.2 -0.4 2.7 1.5 10.5 -0.3 2.6 -0.5 7.1 -1.5 15.1 -0.2 2.7NIST 3.5 7.1 4.1 7.1 1.8 12.2 2.4 7.2 3.1 7.4 5.0 12.5 3.2 7.3 3.0 9.9 2.0 16.6 3.3 7.4NRC -0.7 1.8 -4.1 7.1 -2.3 10.1 -1.7 2.3 -1.0 2.8 0.9 10.5 -0.9 2.8 -1.1 7.2 -2.1 15.1 -0.8 2.8INTI 1.7 10.1 -1.8 12.2 2.3 10.1 0.6 10.2 1.3 10.3 3.2 14.5 1.4 10.3 1.2 12.3 0.2 18.1 1.5 10.3PTB 1.1 2.2 -2.4 7.2 1.7 2.3 -0.6 10.2 0.7 3.1 2.6 10.6 0.8 3.0 0.6 7.3 -0.4 15.1 0.9 3.1BEV 0.4 2.7 -3.1 7.4 1.0 2.8 -1.3 10.3 -0.7 3.1 1.9 10.7 0.1 3.4 -0.1 7.5 -1.1 15.2 0.2 3.5JV -1.5 10.5 -5.0 12.5 -0.9 10.5 -3.2 14.5 -2.6 10.6 -1.9 10.7 -1.8 10.7 -2.0 12.6 -3.0 18.3 -1.7 10.7SP 0.3 2.6 -3.2 7.3 0.9 2.8 -1.4 10.3 -0.8 3.0 -0.1 3.4 1.8 10.7 -0.2 7.4 -1.2 15.2 0.1 3.4
NMC 0.5 7.1 -3.0 9.9 1.1 7.2 -1.2 12.3 -0.6 7.3 0.1 7.5 2.0 12.6 0.2 7.4 -1.0 16.6 0.3 7.5NPL 1.5 15.1 -2.0 16.6 2.1 15.1 -0.2 18.1 0.4 15.1 1.1 15.2 3.0 18.3 1.2 15.2 1.0 16.6 1.3 15.2
VNIIM 0.2 2.7 -3.3 7.4 0.8 2.8 -1.5 10.3 -0.9 3.1 -0.2 3.5 1.7 10.7 -0.1 3.4 -0.3 7.5 -1.3 15.2
VNIIMSP NMC NPLJVNRCNISTNMIA INTI PTB BEV

33(67)
Table 7. Degrees of equivalence 10 mA, 100 kHz
D i j U i j D i j U i j D i j U i j D i j U i j D i j U i j D i j U i j D i j U i j D i j U i j D i j U i j D i j U i j D i j U i j
NMIA -6.8 10.1 0.9 2.1 -0.8 20.1 -0.8 2.4 -0.4 3.6 3.2 12.6 -0.2 3.6 -1.8 12.1 -2.8 22.1 -0.1 2.9NIST 6.8 10.1 7.6 10.0 6.0 22.4 6.0 10.1 6.4 10.5 10.0 16.0 6.6 10.5 5.0 15.6 4.0 24.2 6.7 10.3NRC -0.9 2.1 -7.6 10.0 -1.6 20.1 -1.6 2.2 -1.2 3.5 2.4 12.6 -1.0 3.5 -2.6 12.1 -3.6 22.1 -0.9 2.8INTI 0.8 20.1 -6.0 22.4 1.6 20.1 0.0 20.1 0.4 20.3 4.0 23.6 0.6 20.3 -1.0 23.4 -2.0 29.8 0.7 20.2PTB 0.8 2.4 -6.0 10.1 1.6 2.2 0.0 20.1 0.4 3.7 4.0 12.7 0.6 3.7 -1.0 12.2 -2.0 22.1 0.7 3.0BEV 0.4 3.6 -6.4 10.5 1.2 3.5 -0.4 20.3 -0.4 3.7 3.6 13.0 0.2 4.6 -1.4 12.5 -2.4 22.3 0.3 4.1JV -3.2 12.6 -10.0 16.0 -2.4 12.6 -4.0 23.6 -4.0 12.7 -3.6 13.0 -3.4 13.0 -5.0 17.4 -6.0 25.3 -3.3 12.8SP 0.2 3.6 -6.6 10.5 1.0 3.5 -0.6 20.3 -0.6 3.7 -0.2 4.6 3.4 13.0 -1.6 12.5 -2.6 22.3 0.1 4.1
NMC 1.8 12.1 -5.0 15.6 2.6 12.1 1.0 23.4 1.0 12.2 1.4 12.5 5.0 17.4 1.6 12.5 -1.0 25.1 1.7 12.3NPL 2.8 22.1 -4.0 24.2 3.6 22.1 2.0 29.8 2.0 22.1 2.4 22.3 6.0 25.3 2.6 22.3 1.0 25.1 2.7 22.2
VNIIM 0.1 2.9 -6.7 10.3 0.9 2.8 -0.7 20.2 -0.7 3.0 -0.3 4.1 3.3 12.8 -0.1 4.1 -1.7 12.3 -2.7 22.2
VNIIMSP NMC NPLJVNRCNISTNMIA INTI PTB BEV
Table 8. Degrees of equivalence 5 A, 10 Hz
D i j U i j D i j U i j D i j U i j D i j U i j D i j U i j D i j U i j D i j U i j D i j U i j D i j U i j D i j U i j D i j U i j
NMIA -3.7 19.4 -0.6 15.5 -1.9 8.9 -0.7 7.2 -1.2 4.5 -5.7 44.8 -0.2 6.3 1.3 25.3 25.3 56.2 1.3 5.6NIST 3.7 19.4 3.1 24.1 1.8 20.5 3.0 19.8 2.5 19.0 -2.0 48.5 3.5 19.5 5.0 31.3 29.0 59.1 5.0 19.3NRC 0.6 15.5 -3.1 24.1 -1.3 16.9 -0.1 16.0 -0.6 15.0 -5.1 47.1 0.4 15.6 1.9 29.1 25.9 58.0 1.9 15.4INTI 1.9 8.9 -1.8 20.5 1.3 16.9 1.2 9.8 0.7 8.0 -3.8 45.3 1.7 9.1 3.2 26.2 27.2 56.6 3.2 8.7PTB 0.7 7.2 -3.0 19.8 0.1 16.0 -1.2 9.8 -0.5 6.0 -5.0 45.0 0.5 7.5 2.0 25.6 26.0 56.3 2.0 6.9BEV 1.2 4.5 -2.5 19.0 0.6 15.0 -0.7 8.0 0.5 6.0 -4.5 44.6 1.0 4.9 2.5 25.0 26.5 56.0 2.5 4.0JV 5.7 44.8 2.0 48.5 5.1 47.1 3.8 45.3 5.0 45.0 4.5 44.6 5.5 44.9 7.0 51.1 31.0 71.6 7.0 44.8SP 0.2 6.3 -3.5 19.5 -0.4 15.6 -1.7 9.1 -0.5 7.5 -1.0 4.9 -5.5 44.9 1.5 25.4 25.5 56.2 1.5 6.0
NMC -1.3 25.3 -5.0 31.3 -1.9 29.1 -3.2 26.2 -2.0 25.6 -2.5 25.0 -7.0 51.1 -1.5 25.4 24.0 61.3 0.0 25.2NPL -25.3 56.2 -29.0 59.1 -25.9 58.0 -27.2 56.6 -26.0 56.3 -26.5 56.0 -31.0 71.6 -25.5 56.2 -24.0 61.3 -24.0 56.1
VNIIM -1.3 5.6 -5.0 19.3 -1.9 15.4 -3.2 8.7 -2.0 6.9 -2.5 4.0 -7.0 44.8 -1.5 6.0 0.0 25.2 24.0 56.1
JVNRCNISTNMIA INTI VNIIMSP NMC NPLPTB BEV
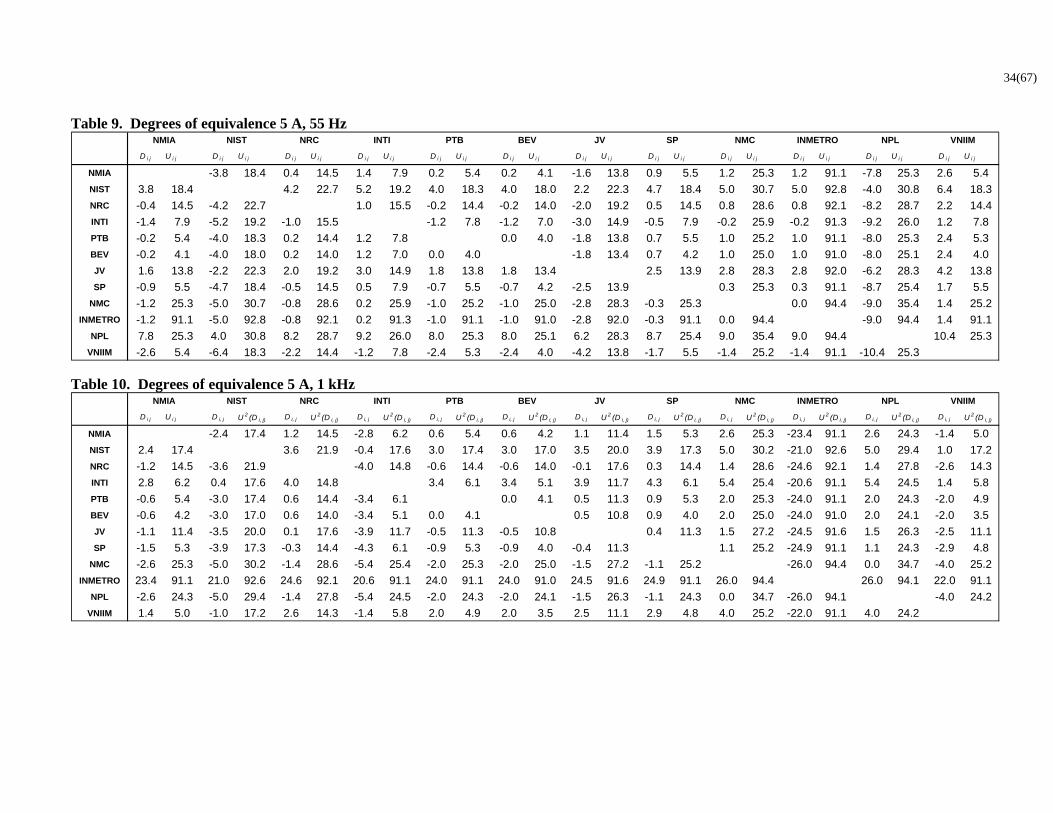
34(67)
Table 9. Degrees of equivalence 5 A, 55 Hz
D i j U i j D i j U i j D i j U i j D i j U i j D i j U i j D i j U i j D i j U i j D i j U i j D i j U i j D i j U i j D i j U i j D i j U i j
NMIA -3.8 18.4 0.4 14.5 1.4 7.9 0.2 5.4 0.2 4.1 -1.6 13.8 0.9 5.5 1.2 25.3 1.2 91.1 -7.8 25.3 2.6 5.4NIST 3.8 18.4 4.2 22.7 5.2 19.2 4.0 18.3 4.0 18.0 2.2 22.3 4.7 18.4 5.0 30.7 5.0 92.8 -4.0 30.8 6.4 18.3NRC -0.4 14.5 -4.2 22.7 1.0 15.5 -0.2 14.4 -0.2 14.0 -2.0 19.2 0.5 14.5 0.8 28.6 0.8 92.1 -8.2 28.7 2.2 14.4INTI -1.4 7.9 -5.2 19.2 -1.0 15.5 -1.2 7.8 -1.2 7.0 -3.0 14.9 -0.5 7.9 -0.2 25.9 -0.2 91.3 -9.2 26.0 1.2 7.8PTB -0.2 5.4 -4.0 18.3 0.2 14.4 1.2 7.8 0.0 4.0 -1.8 13.8 0.7 5.5 1.0 25.2 1.0 91.1 -8.0 25.3 2.4 5.3BEV -0.2 4.1 -4.0 18.0 0.2 14.0 1.2 7.0 0.0 4.0 -1.8 13.4 0.7 4.2 1.0 25.0 1.0 91.0 -8.0 25.1 2.4 4.0JV 1.6 13.8 -2.2 22.3 2.0 19.2 3.0 14.9 1.8 13.8 1.8 13.4 2.5 13.9 2.8 28.3 2.8 92.0 -6.2 28.3 4.2 13.8SP -0.9 5.5 -4.7 18.4 -0.5 14.5 0.5 7.9 -0.7 5.5 -0.7 4.2 -2.5 13.9 0.3 25.3 0.3 91.1 -8.7 25.4 1.7 5.5
NMC -1.2 25.3 -5.0 30.7 -0.8 28.6 0.2 25.9 -1.0 25.2 -1.0 25.0 -2.8 28.3 -0.3 25.3 0.0 94.4 -9.0 35.4 1.4 25.2INMETRO -1.2 91.1 -5.0 92.8 -0.8 92.1 0.2 91.3 -1.0 91.1 -1.0 91.0 -2.8 92.0 -0.3 91.1 0.0 94.4 -9.0 94.4 1.4 91.1
NPL 7.8 25.3 4.0 30.8 8.2 28.7 9.2 26.0 8.0 25.3 8.0 25.1 6.2 28.3 8.7 25.4 9.0 35.4 9.0 94.4 10.4 25.3VNIIM -2.6 5.4 -6.4 18.3 -2.2 14.4 -1.2 7.8 -2.4 5.3 -2.4 4.0 -4.2 13.8 -1.7 5.5 -1.4 25.2 -1.4 91.1 -10.4 25.3
VNIIMSP NMC INMETRO NPLJVNRCNISTNMIA INTI PTB BEV
Table 10. Degrees of equivalence 5 A, 1 kHz
D i j U i j D i, j U 2 (D i, j) D i, j U 2 (D i, j) D i, j U 2 (D i, j) D i, j U 2 (D i, j) D i, j U 2 (D i, j) D i, j U 2 (D i, j) D i, j U 2 (D i, j) D i, j U 2 (D i, j) D i, j U 2 (D i, j) D i, j U 2 (D i, j) D i, j U 2 (D i, j)
NMIA -2.4 17.4 1.2 14.5 -2.8 6.2 0.6 5.4 0.6 4.2 1.1 11.4 1.5 5.3 2.6 25.3 -23.4 91.1 2.6 24.3 -1.4 5.0
NIST 2.4 17.4 3.6 21.9 -0.4 17.6 3.0 17.4 3.0 17.0 3.5 20.0 3.9 17.3 5.0 30.2 -21.0 92.6 5.0 29.4 1.0 17.2
NRC -1.2 14.5 -3.6 21.9 -4.0 14.8 -0.6 14.4 -0.6 14.0 -0.1 17.6 0.3 14.4 1.4 28.6 -24.6 92.1 1.4 27.8 -2.6 14.3
INTI 2.8 6.2 0.4 17.6 4.0 14.8 3.4 6.1 3.4 5.1 3.9 11.7 4.3 6.1 5.4 25.4 -20.6 91.1 5.4 24.5 1.4 5.8
PTB -0.6 5.4 -3.0 17.4 0.6 14.4 -3.4 6.1 0.0 4.1 0.5 11.3 0.9 5.3 2.0 25.3 -24.0 91.1 2.0 24.3 -2.0 4.9
BEV -0.6 4.2 -3.0 17.0 0.6 14.0 -3.4 5.1 0.0 4.1 0.5 10.8 0.9 4.0 2.0 25.0 -24.0 91.0 2.0 24.1 -2.0 3.5
JV -1.1 11.4 -3.5 20.0 0.1 17.6 -3.9 11.7 -0.5 11.3 -0.5 10.8 0.4 11.3 1.5 27.2 -24.5 91.6 1.5 26.3 -2.5 11.1
SP -1.5 5.3 -3.9 17.3 -0.3 14.4 -4.3 6.1 -0.9 5.3 -0.9 4.0 -0.4 11.3 1.1 25.2 -24.9 91.1 1.1 24.3 -2.9 4.8
NMC -2.6 25.3 -5.0 30.2 -1.4 28.6 -5.4 25.4 -2.0 25.3 -2.0 25.0 -1.5 27.2 -1.1 25.2 -26.0 94.4 0.0 34.7 -4.0 25.2
INMETRO 23.4 91.1 21.0 92.6 24.6 92.1 20.6 91.1 24.0 91.1 24.0 91.0 24.5 91.6 24.9 91.1 26.0 94.4 26.0 94.1 22.0 91.1
NPL -2.6 24.3 -5.0 29.4 -1.4 27.8 -5.4 24.5 -2.0 24.3 -2.0 24.1 -1.5 26.3 -1.1 24.3 0.0 34.7 -26.0 94.1 -4.0 24.2
VNIIM 1.4 5.0 -1.0 17.2 2.6 14.3 -1.4 5.8 2.0 4.9 2.0 3.5 2.5 11.1 2.9 4.8 4.0 25.2 -22.0 91.1 4.0 24.2
JVNRCNISTNMIA INTI PTB BEV VNIIMSP NMC INMETRO NPL

35(67)
Table 11. Degrees of equivalence 5 A, 10 kHz
D i j U i j D i j U i j D i j U i j D i j U i j D i j U i j D i j U i j D i j U i j D i j U i j D i j U i j D i j U i j D i j U i j D i j U i j
NMIA -7.8 17.3 1.3 15.4 0.3 7.7 2.2 6.0 1.4 9.6 1.8 11.8 -0.4 5.4 1.2 25.2 -119.8 96.1 7.2 22.4 -4.6 4.6
NIST 7.8 17.3 9.1 22.5 8.1 18.2 10.0 17.5 9.2 19.1 9.6 20.2 7.4 17.3 9.0 30.1 -112.0 97.5 15.0 27.8 3.2 17.1
NRC -1.3 15.4 -9.1 22.5 -1.0 16.3 0.9 15.6 0.1 17.3 0.5 18.6 -1.7 15.4 -0.1 29.0 -121.1 97.2 5.9 26.6 -5.9 15.1
INTI -0.3 7.7 -8.1 18.2 1.0 16.3 1.9 8.2 1.1 11.1 1.5 13.0 -0.7 7.8 0.9 25.8 -120.1 96.3 6.9 23.1 -4.9 7.2
PTB -2.2 6.0 -10.0 17.5 -0.9 15.6 -1.9 8.2 -0.8 10.0 -0.4 12.1 -2.6 6.1 -1.0 25.4 -122.0 96.1 5.0 22.6 -6.8 5.3
BEV -1.4 9.6 -9.2 19.1 -0.1 17.3 -1.1 11.1 0.8 10.0 0.4 14.2 -1.8 9.6 -0.2 26.4 -121.2 96.4 5.8 23.8 -6.0 9.2
JV -1.8 11.8 -9.6 20.2 -0.5 18.6 -1.5 13.0 0.4 12.1 -0.4 14.2 -2.2 11.8 -0.6 27.3 -121.6 96.7 5.4 24.7 -6.4 11.5
SP 0.4 5.4 -7.4 17.3 1.7 15.4 0.7 7.8 2.6 6.1 1.8 9.6 2.2 11.8 1.6 25.2 -119.4 96.1 7.6 22.4 -4.2 4.7
NMC -1.2 25.2 -9.0 30.1 0.1 29.0 -0.9 25.8 1.0 25.4 0.2 26.4 0.6 27.3 -1.6 25.2 -121.0 99.2 6.0 33.3 -5.8 25.1
INMETRO 119.8 96.1 112.0 97.5 121.1 97.2 120.1 96.3 122.0 96.1 121.2 96.4 121.6 96.7 119.4 96.1 121.0 99.2 127.0 98.5 115.2 96.1
NPL -7.2 22.4 -15.0 27.8 -5.9 26.6 -6.9 23.1 -5.0 22.6 -5.8 23.8 -5.4 24.7 -7.6 22.4 -6.0 33.3 -127.0 98.5 -11.8 22.2
VNIIM 4.6 4.6 -3.2 17.1 5.9 15.1 4.9 7.2 6.8 5.3 6.0 9.2 6.4 11.5 4.2 4.7 5.8 25.1 -115.2 96.1 11.8 22.2
VNIIMSP NMC INMETRO NPLJVNRCNISTNMIA INTI PTB BEV
Table 12. Degrees of equivalence 5 A, 20 kHz
D i j U i j D i j U i j D i j U i j D i j U i j D i j U i j D i j U i j D i j U i j D i j U i j D i j U i j D i j U i j
NMIA -1.3 21.2 -1.1 15.2 -1.6 8.4 1.7 7.5 -0.3 9.4 1.1 18.9 -2.6 5.7 -0.5 25.1 0.7 53.2NIST 1.3 21.2 0.2 25.5 -0.3 22.2 3.0 21.8 1.0 22.5 2.4 27.9 -1.3 21.3 0.8 32.4 2.0 57.0NRC 1.1 15.2 -0.2 25.5 -0.5 16.6 2.8 16.1 0.8 17.1 2.2 23.7 -1.5 15.4 0.6 28.9 1.8 55.1INTI 1.6 8.4 0.3 22.2 0.5 16.6 3.3 10.0 1.3 11.5 2.7 20.1 -1.0 8.7 1.1 26.0 2.3 53.6PTB -1.7 7.5 -3.0 21.8 -2.8 16.1 -3.3 10.0 -2.0 10.8 -0.6 19.7 -4.3 7.8 -2.2 25.7 -1.0 53.5BEV 0.3 9.4 -1.0 22.5 -0.8 17.1 -1.3 11.5 2.0 10.8 1.4 20.5 -2.3 9.7 -0.2 26.3 1.0 53.8JV -1.1 18.9 -2.4 27.9 -2.2 23.7 -2.7 20.1 0.6 19.7 -1.4 20.5 -3.7 19.1 -1.6 31.0 -0.4 56.2SP 2.6 5.7 1.3 21.3 1.5 15.4 1.0 8.7 4.3 7.8 2.3 9.7 3.7 19.1 2.1 25.2 3.3 53.2
NMC 0.5 25.1 -0.8 32.4 -0.6 28.9 -1.1 26.0 2.2 25.7 0.2 26.3 1.6 31.0 -2.1 25.2 1.2 58.6NPL -0.7 53.2 -2.0 57.0 -1.8 55.1 -2.3 53.6 1.0 53.5 -1.0 53.8 0.4 56.2 -3.3 53.2 -1.2 58.6
JVNRCNISTNMIA INTI PTB BEV SP NMC NPL
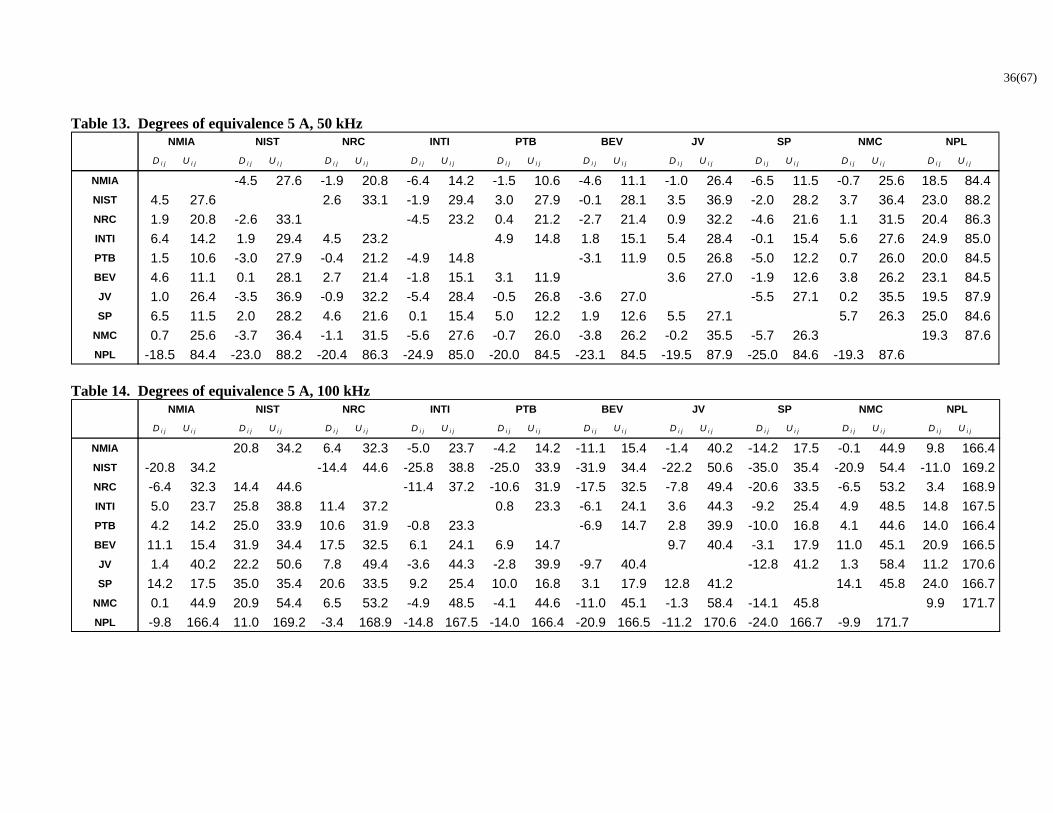
36(67)
Table 13. Degrees of equivalence 5 A, 50 kHz
D i j U i j D i j U i j D i j U i j D i j U i j D i j U i j D i j U i j D i j U i j D i j U i j D i j U i j D i j U i j
NMIA -4.5 27.6 -1.9 20.8 -6.4 14.2 -1.5 10.6 -4.6 11.1 -1.0 26.4 -6.5 11.5 -0.7 25.6 18.5 84.4NIST 4.5 27.6 2.6 33.1 -1.9 29.4 3.0 27.9 -0.1 28.1 3.5 36.9 -2.0 28.2 3.7 36.4 23.0 88.2NRC 1.9 20.8 -2.6 33.1 -4.5 23.2 0.4 21.2 -2.7 21.4 0.9 32.2 -4.6 21.6 1.1 31.5 20.4 86.3INTI 6.4 14.2 1.9 29.4 4.5 23.2 4.9 14.8 1.8 15.1 5.4 28.4 -0.1 15.4 5.6 27.6 24.9 85.0PTB 1.5 10.6 -3.0 27.9 -0.4 21.2 -4.9 14.8 -3.1 11.9 0.5 26.8 -5.0 12.2 0.7 26.0 20.0 84.5BEV 4.6 11.1 0.1 28.1 2.7 21.4 -1.8 15.1 3.1 11.9 3.6 27.0 -1.9 12.6 3.8 26.2 23.1 84.5JV 1.0 26.4 -3.5 36.9 -0.9 32.2 -5.4 28.4 -0.5 26.8 -3.6 27.0 -5.5 27.1 0.2 35.5 19.5 87.9SP 6.5 11.5 2.0 28.2 4.6 21.6 0.1 15.4 5.0 12.2 1.9 12.6 5.5 27.1 5.7 26.3 25.0 84.6
NMC 0.7 25.6 -3.7 36.4 -1.1 31.5 -5.6 27.6 -0.7 26.0 -3.8 26.2 -0.2 35.5 -5.7 26.3 19.3 87.6NPL -18.5 84.4 -23.0 88.2 -20.4 86.3 -24.9 85.0 -20.0 84.5 -23.1 84.5 -19.5 87.9 -25.0 84.6 -19.3 87.6
JVNRCNISTNMIA INTI PTB BEV SP NMC NPL
Table 14. Degrees of equivalence 5 A, 100 kHz
D i j U i j D i j U i j D i j U i j D i j U i j D i j U i j D i j U i j D i j U i j D i j U i j D i j U i j D i j U i j
NMIA 20.8 34.2 6.4 32.3 -5.0 23.7 -4.2 14.2 -11.1 15.4 -1.4 40.2 -14.2 17.5 -0.1 44.9 9.8 166.4
NIST -20.8 34.2 -14.4 44.6 -25.8 38.8 -25.0 33.9 -31.9 34.4 -22.2 50.6 -35.0 35.4 -20.9 54.4 -11.0 169.2
NRC -6.4 32.3 14.4 44.6 -11.4 37.2 -10.6 31.9 -17.5 32.5 -7.8 49.4 -20.6 33.5 -6.5 53.2 3.4 168.9
INTI 5.0 23.7 25.8 38.8 11.4 37.2 0.8 23.3 -6.1 24.1 3.6 44.3 -9.2 25.4 4.9 48.5 14.8 167.5
PTB 4.2 14.2 25.0 33.9 10.6 31.9 -0.8 23.3 -6.9 14.7 2.8 39.9 -10.0 16.8 4.1 44.6 14.0 166.4
BEV 11.1 15.4 31.9 34.4 17.5 32.5 6.1 24.1 6.9 14.7 9.7 40.4 -3.1 17.9 11.0 45.1 20.9 166.5
JV 1.4 40.2 22.2 50.6 7.8 49.4 -3.6 44.3 -2.8 39.9 -9.7 40.4 -12.8 41.2 1.3 58.4 11.2 170.6
SP 14.2 17.5 35.0 35.4 20.6 33.5 9.2 25.4 10.0 16.8 3.1 17.9 12.8 41.2 14.1 45.8 24.0 166.7
NMC 0.1 44.9 20.9 54.4 6.5 53.2 -4.9 48.5 -4.1 44.6 -11.0 45.1 -1.3 58.4 -14.1 45.8 9.9 171.7
NPL -9.8 166.4 11.0 169.2 -3.4 168.9 -14.8 167.5 -14.0 166.4 -20.9 166.5 -11.2 170.6 -24.0 166.7 -9.9 171.7
JVNRCNISTNMIA INTI PTB BEV SP NMC NPL

37(67) Appendix 2. Uncertainty Budgets NMIA, Australia Measurement Current : 10 mA
Type A
or B10 Hz 55 Hz 1 kHz 10 kHz 20 kHz 50 kHz 100 kHz
Reference Pot TCC 0.9 0.2 0.2 0.2 0.2 0.2 0.2 B Normal
Type A 0.1 0.1 0.1 0.1 0.1 0.2 0.3 A Normal
Connectors 0.4 0.3 0.3 0.3 0.3 0.3 0.3 B NormalMeasurement Setup 0 0 0 0 0.1 0.1 0.1 B NormalBead Leakage 1.0 0.4 0.4 0.4 0.4 0.4 0.5 B Normal
Combined unc (k =1): 1.0 0.5 0.5 0.5 0.5 0.7 0.9
Expanded unc: 2.0 1.0 1.0 1.0 1.0 1.4 1.8
Standard Uncertainty (A/A)at frequency DistributionContribution of:
Measurement Current : 5 A
Type A
or B
10 Hz 55 Hz 1 kHz 10 kHz 20 kHz 50 kHz 100 kHz
5 A Reference
Reference TVC 0.6 0.4 0.4 0.4 0.4 1 1.5 B Normal
Type A 0.2 0.2 0.2 0.2 0.2 0.2 0.2 A Normal
Connectors 0.1 0.1 0.1 0.1 0.1 0.3 0.8 B NormalMeasurement Setup 0.3 0.2 0.2 0.2 0.2 0.3 0.4 B Normal(a) TVC 0.7 0.5 0.5 0.5 0.5 1.1 1.8Pot Resistor 1 1 1 1 1 2.2 2.2 B NormalType A 0.8 0.8 0.8 0.8 0.8 0.8 1.6 A NormalMeasurement Setup 0.3 0.2 0.2 0.2 0.2 0.3 0.4 B NormalCurrent Dependence 0.8 0.8 0.8 0.8 0.8 1.2 1.8 B Normal(b) Shunt 1.5 1.5 1.5 1.5 1.5 2.6 3.3 B Normal(c) Loading Effect 0.1 0.1 0.1 0.1 0.5 2.0 4.0 B Normal(d) Stability 1 1 1 1 1 1 1 B Normal
Comparison MeasurementsReference Total (a)…(d) 0.2 0.2 0.2 0.2 0.2 0.2 0.2 B NormalType A 0.4 0.3 0.3 0.3 0.3 0.3 0.5 A NormalMeasurement Setup 0.2 0.3 0.3 0.3 0.3 0.3 0.5 B NormalConnectors 2.0 1.9 1.9 1.9 2.0 3.7 5.6 B Normal
Combined unc (k=1): 2.3 2.0 2.0 2.1 2.3 4.0 6.0Expanded unc: 4.5 4.1 4.1 4.2 4.5 8.0 12.0
Contribution of:
Standard Uncertainty (A/A)Distributionat frequency

38(67) NIST, USA Remarks: 10 mA current converter calibrated using 3D multijunction thermal converter primary standard and single junction reference standard. 5 A converter calibrated using precision bifilar shunt in combination with reference thermoelement. Measurement Current : 10 mA
Standard Uncertainty / 10-6 at frequency
Contribution of:
10 Hz 55 Hz 1 kHz 10
kHz 20
kHz 50
kHz 100 kHz
Type A or B
Distri-bution
Primary/Reference Standards (includes buildup from primary standards and frequency extension from 1 kHz)
0.58 0.42 0.42 0.42 0.89 1.64 1.80
B Normal
Pooled Standard Deviation for primary intercomparisons and reference buildup
0.50 0.29 0.29 0.29 0.29 0.45 0.55
A Normal
NIST Comparator System
2.20 1.11 0.68 0.68 0.68 1.06 1.31 B Normal
Uncertainties for NIST standards
Stability 2.50 1.70 0.75 0.75 0.75 1.70 2.00 B Uniform
Bead 1.00 0.80 0.20 0.20 0.70 2.00 2.90 B Uniform
Reproducibility 1.00 1.00 0.80 0.80 0.80 1.00 1.25 B Uniform
Total contribution from NIST standards (k = 1)
3.70 2.45 1.40 1.40 1.74 3.45 4.38 B Normal
Comparison of CCEM-K12 to NIST standards
Pooled Standard Deviation for CCEM-K12 comparison 0.70 0.90 0.90 0.80 0.80 0.30 0.30
A Normal
NIST Comparator System
2.20 1.11 0.68 0.68 0.68 1.06 1.31 B Normal
Stability of CCEM-K12
0.60 0.70 0.67 0.49 0.67 0.49 1.34 B Uniform
Combined unc (k=1) 4.40 2.92 1.92 1.82 2.14 3.65 4.77
Expanded unc: 8.80 5.84 3.84 3.63 4.28 7.30 9.55
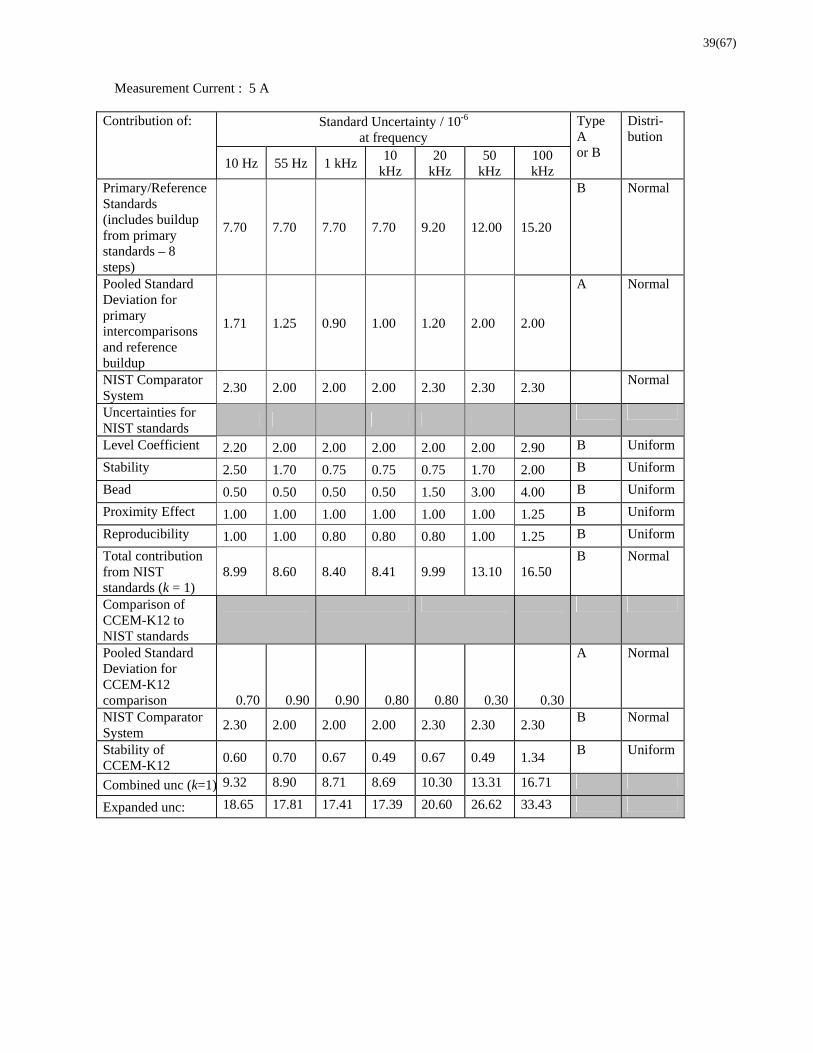
39(67) Measurement Current : 5 A
Standard Uncertainty / 10-6 at frequency
Contribution of:
10 Hz 55 Hz 1 kHz 10
kHz 20
kHz 50
kHz 100 kHz
Type A or B
Distri-bution
Primary/Reference Standards (includes buildup from primary standards – 8 steps)
7.70 7.70 7.70 7.70 9.20 12.00 15.20
B Normal
Pooled Standard Deviation for primary intercomparisons and reference buildup
1.71 1.25 0.90 1.00 1.20 2.00 2.00
A Normal
NIST Comparator System
2.30 2.00 2.00 2.00 2.30 2.30 2.30 Normal
Uncertainties for NIST standards
Level Coefficient 2.20 2.00 2.00 2.00 2.00 2.00 2.90 B Uniform
Stability 2.50 1.70 0.75 0.75 0.75 1.70 2.00 B Uniform
Bead 0.50 0.50 0.50 0.50 1.50 3.00 4.00 B Uniform
Proximity Effect 1.00 1.00 1.00 1.00 1.00 1.00 1.25 B Uniform
Reproducibility 1.00 1.00 0.80 0.80 0.80 1.00 1.25 B Uniform
Total contribution from NIST standards (k = 1)
8.99 8.60 8.40 8.41 9.99 13.10 16.50 B Normal
Comparison of CCEM-K12 to NIST standards
Pooled Standard Deviation for CCEM-K12 comparison 0.70 0.90 0.90 0.80 0.80 0.30 0.30
A Normal
NIST Comparator System
2.30 2.00 2.00 2.00 2.30 2.30 2.30 B Normal
Stability of CCEM-K12
0.60 0.70 0.67 0.49 0.67 0.49 1.34 B Uniform
Combined unc (k=1) 9.32 8.90 8.71 8.69 10.30 13.31 16.71
Expanded unc: 18.65 17.81 17.41 17.39 20.60 26.62 33.43

40(67) NRC, Canada

41(67)
INTI, Argentina Measurement Current : 10 mA
Standard Uncertainty (A/A) at frequency Contribution of:
10 Hz 55 Hz 1 kHz 10 kHz 20 kHz 50 kHz 100 kHz
Type A or B
Distribution
Standard deviation of 12 measurements
0,2 0,2 0,2 0,2 0,2 0,2 0,2 A n
AC-DC transfer difference of the standard
3,0 3,0 1,0 1,0 2,0 5,0 10,0 B n
Measuring setup 0,4 0,4 0,4 0,6 0,9 0,8 1,5 A n
Stability of Keithley 182-1
6,1·10-11 6,1·10-11 6,1·10-11 6,1·10-11 6,1·10-11 6,1·10-11 6,1·10-11 B r
Stability of Keithley 182-2
3,9·10-11 3,9·10-11 3,9·10-11 3,9·10-11 3,9·10-11 3,9·10-11 3,9·10-11 B r
AC-DC transfer difference due to connectors
0,1 0,1 0,1 0,1 0,1 0,1 0,1 B r
Combined unc (k=1) 3,0 3,0 1,1 1,2 2,2 5,0 10,1
Expanded unc: 6,0 6,0 2,2 2,4 4,4 10,0 20,2
Measurement Current : 5 A
Standard Uncertainty (A/A) at frequency Contribution of:
10 Hz 55 Hz 1 kHz 10 kHz 20 kHz 50 kHz 100 kHz
Type A or B
Distribution
Standard deviation of 12 measurements
1,0 0,4 0,8 0,9 0,8 1,0 1,0 A n
AC-DC transfer difference of the standard
3,7 3,4 2,2 3,5 3,9 6,1 10,7 B n

42(67)
Stability of Keithley 182-1
6,1·10-11 6,1·10-11 6,1·10-11 6,1·10-11 6,1·10-11 6,1·10-11 6,1·10-11 B r
Stability of Keithley 182-2
3,9·10-11 3,9·10-11 3,9·10-11 3,9·10-11 3,9·10-11 3,9·10-11 3,9·10-11 B r
AC-DC transfer difference due to connectors
0,1 0,1 0,1 0,2 0,2 0,3 0,5 B r
Combined unc (k=1) 3,8 3,4 2,3 3,5 3,9 6,2 10,7
Expanded unc: 7,6 6,8 4,6 7,0 7,8 12,4 21,4
43(67)
PTB, Germany The following sources of uncertainties have been taken into account [3]: Comparison at 10 mA Model equation: = Q+C
with Q: Transfer difference of the calculable QPMJTC
C: Measured transfer difference in comparison additional uncertainties: uA: Standard deviation of twelve comparisons
uM: Maximum deviation from the mean when using different setups
At frequencies below 1kHz the transfer difference has been additionally determined as described in [4].

44(67)
10 Hz
Parameter Xi xi or si Distribution u(xi) ci ui(y) ui2(y) eff i ui
4(y)/eff i
Q 0,3 µA/A normal 0,30 µA/A 1 0,30 µA/A 0,090 (µA/A)² 50 1,620E-4 (µA/A)^4
C 0,1 µA/A normal 0,10 µA/A 1 0,10 µA/A 0,010 (µA/A)² 50 2,000E-6 (µA/A)^4
Standard deviation 0,7 µA/A normal 0,20 µA/A 1 0,20 µA/A 0,041 (µA/A)² 11 1,516E-4 (µA/A)^4
Max. dev. from mean 2,0 µA/A rectangular 1,15 µA/A 1 1,15 µA/A 1,333 (µA/A)² 10.000 1,778E-4 (µA/A)^4
1,21 µA/A 1,474 (µA/A)² 4.405 4,934E-4 (µA/A)^4
2,43 µA/A k = 2
55 Hz
Parameter Xi xi or si Distribution u(xi) ci ui(y) ui2(y) eff i ui
4(y)/eff i
Q 0,2 µA/A normal 0,20 µA/A 1 0,20 µA/A 0,040 (µA/A)² 50 3,200E-5 (µA/A)^4
C 0,1 µA/A normal 0,10 µA/A 1 0,10 µA/A 0,010 (µA/A)² 50 2,000E-6 (µA/A)^4
Standard deviation 0,7 µA/A normal 0,20 µA/A 1 0,20 µA/A 0,041 (µA/A)² 11 1,516E-4 (µA/A)^4
Max. dev. from mean 1,0 µA/A rectangular 0,58 µA/A 1 0,58 µA/A 0,333 (µA/A)² 10.000 1,111E-5 (µA/A)^4
0,65 µA/A 0,424 (µA/A)² 915 1,967E-4 (µA/A)^4
1,30 µA/A k = 2
1000 Hz
Parameter Xi xi or si Distribution u(xi) ci ui(y) ui2(y) eff i ui
4(y)/eff i
Q 0,0 µA/A normal 0,00 µA/A 1 0,00 µA/A 0,000 (µA/A)² 50 0,000E+0 (µA/A)^4
C 0,1 µA/A normal 0,10 µA/A 1 0,10 µA/A 0,010 (µA/A)² 50 2,000E-6 (µA/A)^4
Standard deviation 0,7 µA/A normal 0,20 µA/A 1 0,20 µA/A 0,041 (µA/A)² 11 1,516E-4 (µA/A)^4
Max. dev. from mean 1,0 µA/A rectangular 0,58 µA/A 1 0,58 µA/A 0,333 (µA/A)² 10.000 1,111E-5 (µA/A)^4
0,62 µA/A 0,384 (µA/A)² 896 1,647E-4 (µA/A)^4
1,24 µA/A k = 2
10.000 Hz
Parameter Xi xi or si Distribution u(xi) ci ui(y) ui2(y) eff i ui
4(y)/eff i
Q 0,0 µA/A normal 0,00 µA/A 1 0,00 µA/A 0,000 (µA/A)² 50 0,000E+0 (µA/A)^4
C 0,1 µA/A normal 0,10 µA/A 1 0,10 µA/A 0,010 (µA/A)² 50 2,000E-6 (µA/A)^4
Standard deviation 0,7 µA/A normal 0,20 µA/A 1 0,20 µA/A 0,041 (µA/A)² 11 1,516E-4 (µA/A)^4
Max. dev. from mean 1,0 µA/A rectangular 0,58 µA/A 1 0,58 µA/A 0,333 (µA/A)² 10.000 1,111E-5 (µA/A)^4
0,62 µA/A 0,384 (µA/A)² 896 1,647E-4 (µA/A)^4
1,24 µA/A k = 2
45(67)
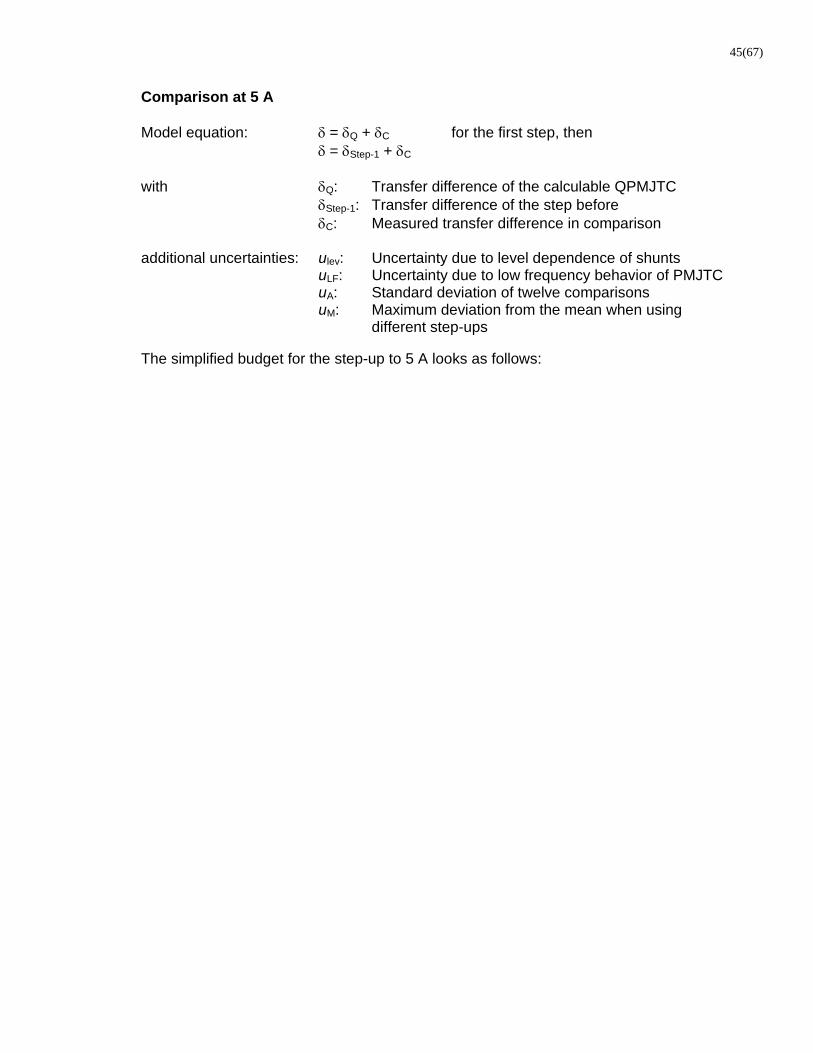
Comparison at 5 A Model equation: = Q + C for the first step, then = Step-1 + C with Q: Transfer difference of the calculable QPMJTC Step-1: Transfer difference of the step before
C: Measured transfer difference in comparison additional uncertainties: ulev: Uncertainty due to level dependence of shunts uLF: Uncertainty due to low frequency behavior of PMJTC uA: Standard deviation of twelve comparisons
uM: Maximum deviation from the mean when using different step-ups
The simplified budget for the step-up to 5 A looks as follows:

46(67)
Influencing Std. meas. uncertainty u in µA/A at the frequencies in kHz
quantity
0,010
0,055 1 10 20 50 100 200 500 1.000
Q117-ITee
u(Chip) 0,3 0,2 0,0 0,0 0,0 0,0 0,0 0,0 0,1 0,2
u(Connector) 0,0 0,0 0,0 0,0 0,0 0,0 0,1 0,2 0,4 0,7
u(S) 0,30 0,20 0,00 0,00 0,00 0,00 0,10 0,20 0,41 0,73
U(S) k=2 1 1 1 1 1 1 1 1 1 2
30 mA (PMJTC + JV30mA vs. Q117)
u(Q117) 0,3 0,2 0,0 0,0 0,0 0,0 0,1 0,2 0,4 0,7
u(A) 0,4 0,2 0,2 0,2 0,2 0,2 0,2 0,2 0,2 0,3
u(C) 0,1 0,1 0,1 0,1 0,1 0,1 0,1 0,1 0,1 0,1
u(10mA) 0,51 0,30 0,22 0,22 0,22 0,22 0,24 0,30 0,5 0,8
U(10mA) k=2 2 2 2 2 2 2 2 2 3 4
100 mA (PMJTC + JV100mA vs. Q117)
u(Q117) 0,3 0,2 0,0 0,0 0,0 0,0 0,1 0,2 0,4 0,7
u(A) 0,4 0,2 0,2 0,2 0,2 0,2 0,2 0,2 0,3 0,5
u(C) 0,2 0,2 0,2 0,2 0,2 0,2 0,2 0,2 0,2 0,3
levy 0,1 0,1 0,1 0,1 0,1 0,1 0,1 0,1 0,2 0,3
uLF 0,4 0,0 0,0 0,0 0,0 0,0 0,0 0,0 0,0 0,0
u(mA) 0,68 0,36 0,30 0,30 0,30 0,30 0,32 0,36 0,6 1,0
U(mA) k=2 2 2 2 2 2 2 2 2 3 5
300 mA (PMJTC + JV300mA vs. PMJTC + JV100mA)
u(Step-1) 0,7 0,4 0,3 0,3 0,3 0,3 0,3 0,4 0,6 1,0
u(A) 0,4 0,2 0,2 0,2 0,2 0,2 0,2 0,2 0,3 0,5
u(C) 0,2 0,2 0,2 0,2 0,2 0,2 0,2 0,2 0,2 0,3
levy 0,3 0,3 0,1 0,3 0,3 0,3 0,5 0,5 0,7 1,0
uLF 0,4 0,0 0,0 0,0 0,0 0,0 0,0 0,0 0,0 0,0
u(mA) 1,0 0,55 0,42 0,51 0,51 0,51 0,66 0,68 1,0 1,5
U(mA) k=2 2 2 2 2 2 2 2 2 3 5
1 A (PMJTC + JV1A vs. PMJTC + JV300mA)
u(Step-1) 1,0 0,5 0,4 0,5 0,5 0,5 0,7 0,7 1,0 1,5
u(A) 0,4 0,2 0,2 0,2 0,2 0,2 0,2 0,2 0,3 0,5
u(C) 0,2 0,2 0,2 0,2 0,2 0,2 0,2 0,2 0,2 0,3
levy 1,0 1,0 1,0 1,0 1,0 1,0 1,5 1,5 2,0 3,0
uLF 0,4 0,0 0,0 0,0 0,0 0,0 0,0 0,0 0,0 0,0
u(A) 1,5 1,2 1,1 1,2 1,2 1,2 1,7 1,7 2,3 3,4
U(A) k=2 4 3 3 3 3 3 4 4 5 8
3 A (PMJTC + JV3A vs. PMJTC + JV1A)
u(Step-1) 1,5 1,2 1,1 1,2 1,2 1,2 1,7 u(A) 0,4 0,2 0,2 0,2 0,2 0,2 0,2 u(C) 0,2 0,2 0,2 0,2 0,2 0,2 0,2 levy 1,0 1,0 1,0 1,5 2,0 3,0 3,5 uLF 0,4 0,0 0,0 0,0 0,0 0,0 0,0 u(A) 1,9 1,6 1,5 1,9 2,3 3,2 3,9 U(1A) k=2 4 4 4 4 5 7 8
47(67)
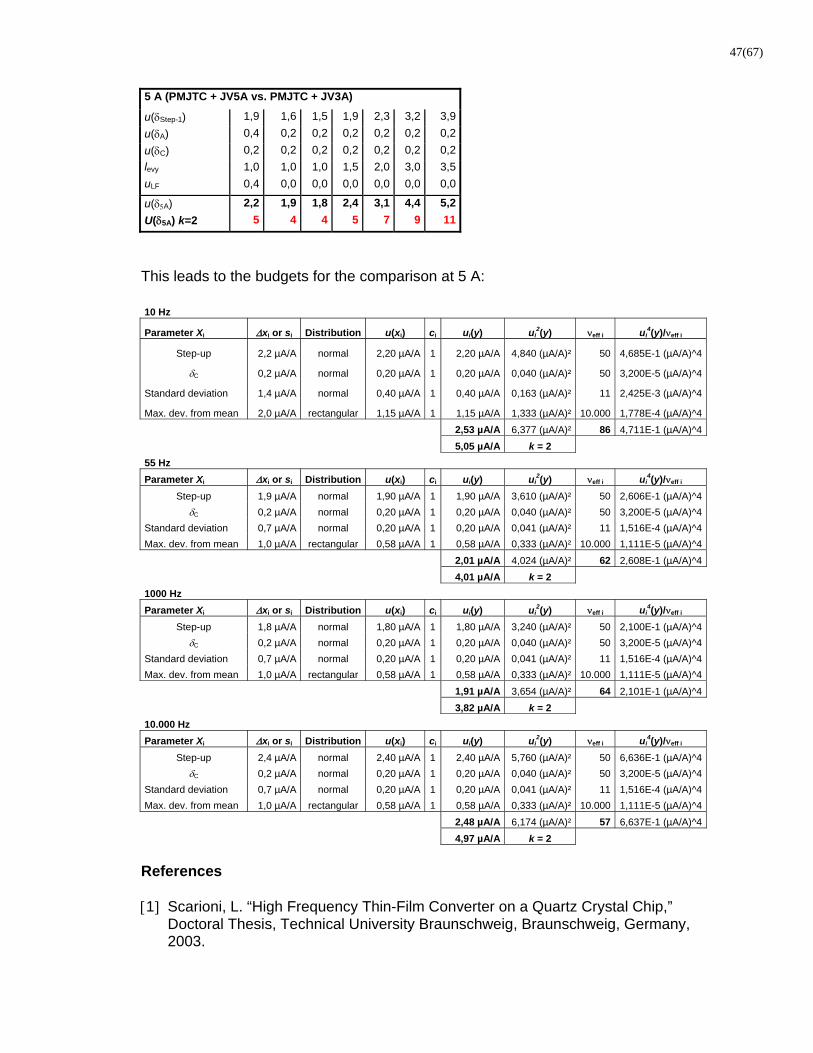
5 A (PMJTC + JV5A vs. PMJTC + JV3A)
u(Step-1) 1,9 1,6 1,5 1,9 2,3 3,2 3,9 u(A) 0,4 0,2 0,2 0,2 0,2 0,2 0,2 u(C) 0,2 0,2 0,2 0,2 0,2 0,2 0,2 levy 1,0 1,0 1,0 1,5 2,0 3,0 3,5 uLF 0,4 0,0 0,0 0,0 0,0 0,0 0,0 u(A) 2,2 1,9 1,8 2,4 3,1 4,4 5,2 U(5A) k=2 5 4 4 5 7 9 11
This leads to the budgets for the comparison at 5 A: 10 Hz
Parameter Xi xi or si Distribution u(xi) ci ui(y) ui2(y) eff i ui
4(y)/eff i
Step-up 2,2 µA/A normal 2,20 µA/A 1 2,20 µA/A 4,840 (µA/A)² 50 4,685E-1 (µA/A)^4
C 0,2 µA/A normal 0,20 µA/A 1 0,20 µA/A 0,040 (µA/A)² 50 3,200E-5 (µA/A)^4
Standard deviation 1,4 µA/A normal 0,40 µA/A 1 0,40 µA/A 0,163 (µA/A)² 11 2,425E-3 (µA/A)^4
Max. dev. from mean 2,0 µA/A rectangular 1,15 µA/A 1 1,15 µA/A 1,333 (µA/A)² 10.000 1,778E-4 (µA/A)^4
2,53 µA/A 6,377 (µA/A)² 86 4,711E-1 (µA/A)^4
5,05 µA/A k = 2
55 Hz
Parameter Xi xi or si Distribution u(xi) ci ui(y) ui2(y) eff i ui
4(y)/eff i
Step-up 1,9 µA/A normal 1,90 µA/A 1 1,90 µA/A 3,610 (µA/A)² 50 2,606E-1 (µA/A)^4
C 0,2 µA/A normal 0,20 µA/A 1 0,20 µA/A 0,040 (µA/A)² 50 3,200E-5 (µA/A)^4
Standard deviation 0,7 µA/A normal 0,20 µA/A 1 0,20 µA/A 0,041 (µA/A)² 11 1,516E-4 (µA/A)^4
Max. dev. from mean 1,0 µA/A rectangular 0,58 µA/A 1 0,58 µA/A 0,333 (µA/A)² 10.000 1,111E-5 (µA/A)^4
2,01 µA/A 4,024 (µA/A)² 62 2,608E-1 (µA/A)^4
4,01 µA/A k = 2
1000 Hz
Parameter Xi xi or si Distribution u(xi) ci ui(y) ui2(y) eff i ui
4(y)/eff i
Step-up 1,8 µA/A normal 1,80 µA/A 1 1,80 µA/A 3,240 (µA/A)² 50 2,100E-1 (µA/A)^4
C 0,2 µA/A normal 0,20 µA/A 1 0,20 µA/A 0,040 (µA/A)² 50 3,200E-5 (µA/A)^4
Standard deviation 0,7 µA/A normal 0,20 µA/A 1 0,20 µA/A 0,041 (µA/A)² 11 1,516E-4 (µA/A)^4
Max. dev. from mean 1,0 µA/A rectangular 0,58 µA/A 1 0,58 µA/A 0,333 (µA/A)² 10.000 1,111E-5 (µA/A)^4
1,91 µA/A 3,654 (µA/A)² 64 2,101E-1 (µA/A)^4
3,82 µA/A k = 2
10.000 Hz
Parameter Xi xi or si Distribution u(xi) ci ui(y) ui2(y) eff i ui
4(y)/eff i
Step-up 2,4 µA/A normal 2,40 µA/A 1 2,40 µA/A 5,760 (µA/A)² 50 6,636E-1 (µA/A)^4
C 0,2 µA/A normal 0,20 µA/A 1 0,20 µA/A 0,040 (µA/A)² 50 3,200E-5 (µA/A)^4
Standard deviation 0,7 µA/A normal 0,20 µA/A 1 0,20 µA/A 0,041 (µA/A)² 11 1,516E-4 (µA/A)^4
Max. dev. from mean 1,0 µA/A rectangular 0,58 µA/A 1 0,58 µA/A 0,333 (µA/A)² 10.000 1,111E-5 (µA/A)^4
2,48 µA/A 6,174 (µA/A)² 57 6,637E-1 (µA/A)^4
4,97 µA/A k = 2
References 1 Scarioni, L. “High Frequency Thin-Film Converter on a Quartz Crystal Chip,”
Doctoral Thesis, Technical University Braunschweig, Braunschweig, Germany, 2003.

48(67)
[2] Scarioni, L.; Klonz, M.; Funck, T., “Quartz planar multijunction thermal converter as a new ac-dc current transfer standard up to 1 MHz“ IEEE Trans. Instrum. Meas. 54 (2005), 2, 799 – 802
3 Klonz, M.; Laiz, H.; Spiegel, T.; Bittel, P., “AC-DC Current Transfer Step-Up and
Step-Down Calibration and Uncertainty Calculation,” IEEE Trans. Instrum. Meas., 51, (2002), 2, 1027 - 1034
[4] Funck, T.; Kampik, M.; Kessler, E.; Klonz, M.; Laiz, H.; Lapuh, R., “Determination of
the ac-dc voltage transfer difference of high voltage transfer standards at low frequencies“ IEEE Trans. Instrum. Meas. 54 (2005), 2, 807 – 809
49(67)
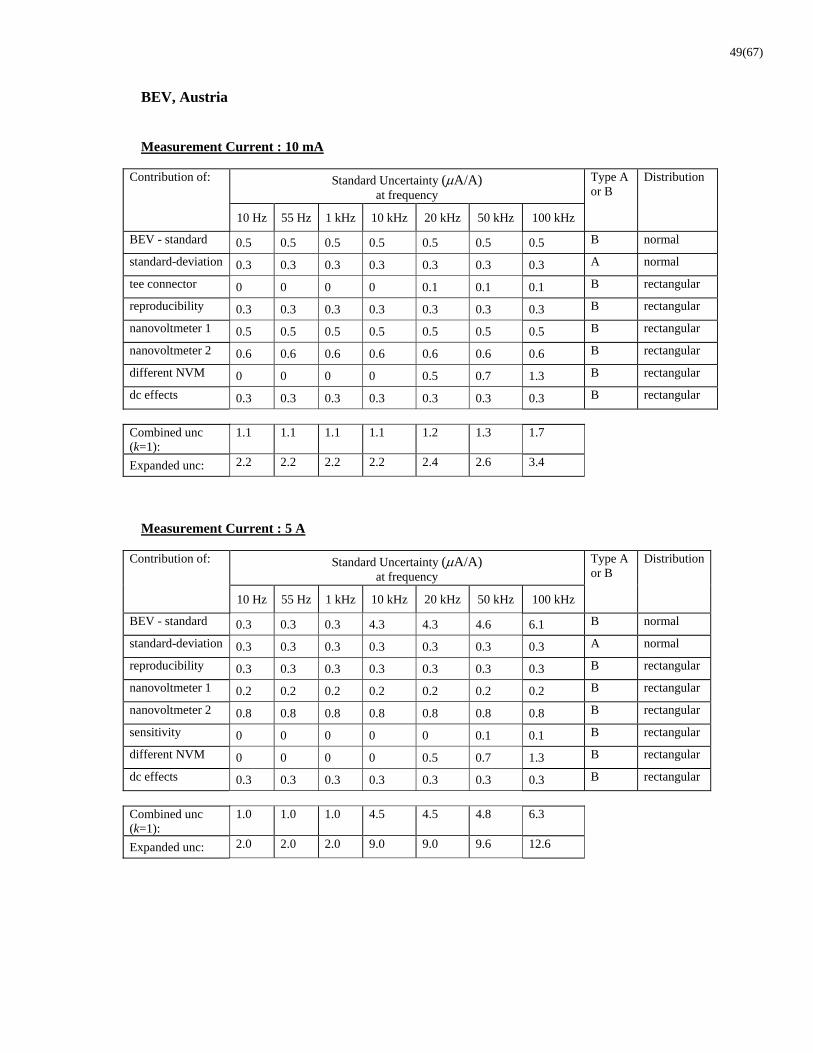
BEV, Austria Measurement Current : 10 mA
Standard Uncertainty (A/A) at frequency
Contribution of:
10 Hz 55 Hz 1 kHz 10 kHz 20 kHz 50 kHz 100 kHz
Type A or B
Distribution
BEV - standard 0.5 0.5 0.5 0.5 0.5 0.5 0.5 B normal
standard-deviation 0.3 0.3 0.3 0.3 0.3 0.3 0.3 A normal
tee connector 0 0 0 0 0.1 0.1 0.1 B rectangular
reproducibility 0.3 0.3 0.3 0.3 0.3 0.3 0.3 B rectangular
nanovoltmeter 1 0.5 0.5 0.5 0.5 0.5 0.5 0.5 B rectangular
nanovoltmeter 2 0.6 0.6 0.6 0.6 0.6 0.6 0.6 B rectangular
different NVM 0 0 0 0 0.5 0.7 1.3 B rectangular
dc effects 0.3 0.3 0.3 0.3 0.3 0.3 0.3 B rectangular
Combined unc (k=1):
1.1 1.1 1.1 1.1 1.2 1.3 1.7
Expanded unc: 2.2 2.2 2.2 2.2 2.4 2.6 3.4
Measurement Current : 5 A
Standard Uncertainty (A/A) at frequency
Contribution of:
10 Hz 55 Hz 1 kHz 10 kHz 20 kHz 50 kHz 100 kHz
Type A or B
Distribution
BEV - standard 0.3 0.3 0.3 4.3 4.3 4.6 6.1 B normal
standard-deviation 0.3 0.3 0.3 0.3 0.3 0.3 0.3 A normal
reproducibility 0.3 0.3 0.3 0.3 0.3 0.3 0.3 B rectangular
nanovoltmeter 1 0.2 0.2 0.2 0.2 0.2 0.2 0.2 B rectangular
nanovoltmeter 2 0.8 0.8 0.8 0.8 0.8 0.8 0.8 B rectangular
sensitivity 0 0 0 0 0 0.1 0.1 B rectangular
different NVM 0 0 0 0 0.5 0.7 1.3 B rectangular
dc effects 0.3 0.3 0.3 0.3 0.3 0.3 0.3 B rectangular
Combined unc (k=1):
1.0 1.0 1.0 4.5 4.5 4.8 6.3
Expanded unc: 2.0 2.0 2.0 9.0 9.0 9.6 12.6

50(67)
JV, Norway Uncertainty calculations have been performed according to the guidelines in “Guide to the Uncertainties in Measurements”. The main uncertainty contributions at each frequency are uref uncertainty in the reference standard. ustep total uncertainty resulting from current step-up. This can be decomposed into sm Standard deviation of the mean uT Unsymmetry of “T” connection. This is considered to accumulate linearly. ulin Lienarity and drift of DVM usf Uncertainty from scale factors uP Power dependency (only relevant below 100 Hz for PMJTCs) Smobj Standard deviation in the mean for the object measurement. In addition one contribution from each of uT, ulin and usf for the measurement of the object. For 10 mA, 10 Hz, the uncertainty calculation is shown in table 3, and 5 A,10 Hz in table 4. The calculations for 5 A, 100 kHz are shown in table 5.
Table 3. 10 mA, 10 Hz uncertainty calculation
Table 4. 5A, 10 Hz uncertainty calculations.
Est. Value Estimated[µA/A] Distribution Sensitivity Contribution Deg. of freed.
s m 0,49 1 1 0,49 9
u ref 6 1 1 6 1,00E+02
u lin 1 1 1 1 1,00E+02
u sf 0,40 1 1 0,4 9
u P 0,1 1 1 0,1 1,00E+02
u T 0,2 1 1 0,2 1,00E+02
Standard uncertainty (k=1): 6,32 9,1E+06
Est. Value Estimated[µA/A] Distribution Sensitivity Contribution Deg. of freed.
s m 0,40 1 1 0,40 9
u ref + u step 22,03 1 1 22,03 1,00E+03
u lin 1 1 1 1 1,00E+02
u sf 0,40 1 1 0,4 9
u P 0,1 1 1 0,1 1,00E+02
u T 0,2 1 1 0,2 1,00E+02
Standard uncertainty (k=1): 22,26 4,2E+06
51(67)
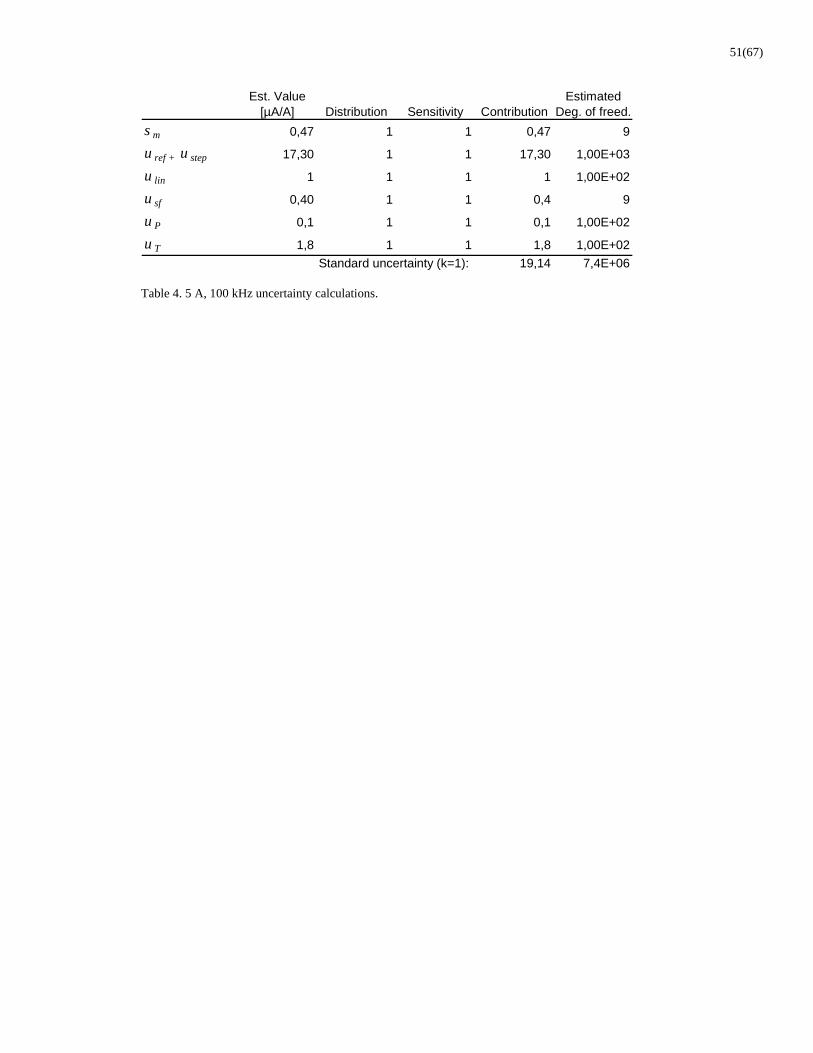
Table 4. 5 A, 100 kHz uncertainty calculations.
Est. Value Estimated[µA/A] Distribution Sensitivity Contribution Deg. of freed.
s m 0,47 1 1 0,47 9
u ref + u step 17,30 1 1 17,30 1,00E+03
u lin 1 1 1 1 1,00E+02
u sf 0,40 1 1 0,4 9
u P 0,1 1 1 0,1 1,00E+02
u T 1,8 1 1 1,8 1,00E+02
Standard uncertainty (k=1): 19,14 7,4E+06
52(67)
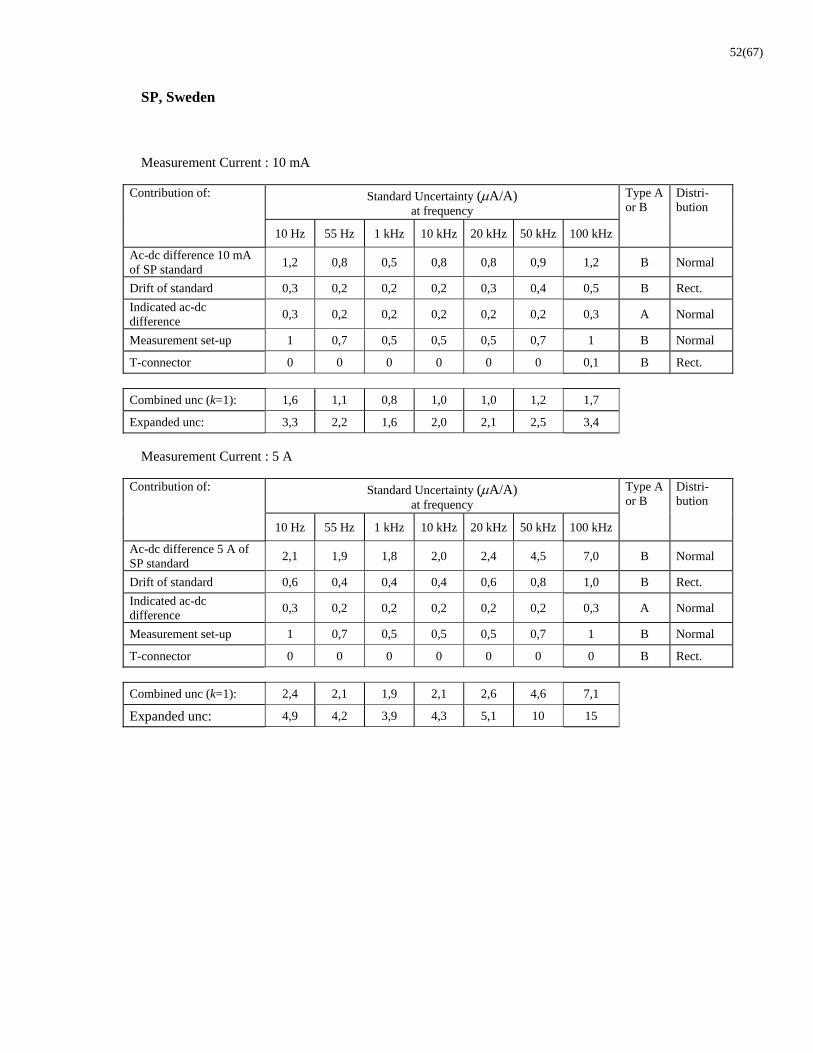
SP, Sweden Measurement Current : 10 mA
Standard Uncertainty (A/A) at frequency
Contribution of:
10 Hz 55 Hz 1 kHz 10 kHz 20 kHz 50 kHz 100 kHz
Type A or B
Distri-bution
Ac-dc difference 10 mA of SP standard
1,2 0,8 0,5 0,8 0,8 0,9 1,2 B Normal
Drift of standard 0,3 0,2 0,2 0,2 0,3 0,4 0,5 B Rect.
Indicated ac-dc difference
0,3 0,2 0,2 0,2 0,2 0,2 0,3 A Normal
Measurement set-up 1 0,7 0,5 0,5 0,5 0,7 1 B Normal
T-connector 0 0 0 0 0 0 0,1 B Rect.
Combined unc (k=1): 1,6 1,1 0,8 1,0 1,0 1,2 1,7
Expanded unc: 3,3 2,2 1,6 2,0 2,1 2,5 3,4
Measurement Current : 5 A
Standard Uncertainty (A/A) at frequency
Contribution of:
10 Hz 55 Hz 1 kHz 10 kHz 20 kHz 50 kHz 100 kHz
Type A or B
Distri-bution
Ac-dc difference 5 A of SP standard
2,1 1,9 1,8 2,0 2,4 4,5 7,0 B Normal
Drift of standard 0,6 0,4 0,4 0,4 0,6 0,8 1,0 B Rect.
Indicated ac-dc difference
0,3 0,2 0,2 0,2 0,2 0,2 0,3 A Normal
Measurement set-up 1 0,7 0,5 0,5 0,5 0,7 1 B Normal
T-connector 0 0 0 0 0 0 0 B Rect.
Combined unc (k=1): 2,4 2,1 1,9 2,1 2,6 4,6 7,1
Expanded unc: 4,9 4,2 3,9 4,3 5,1 10 15
53(67)
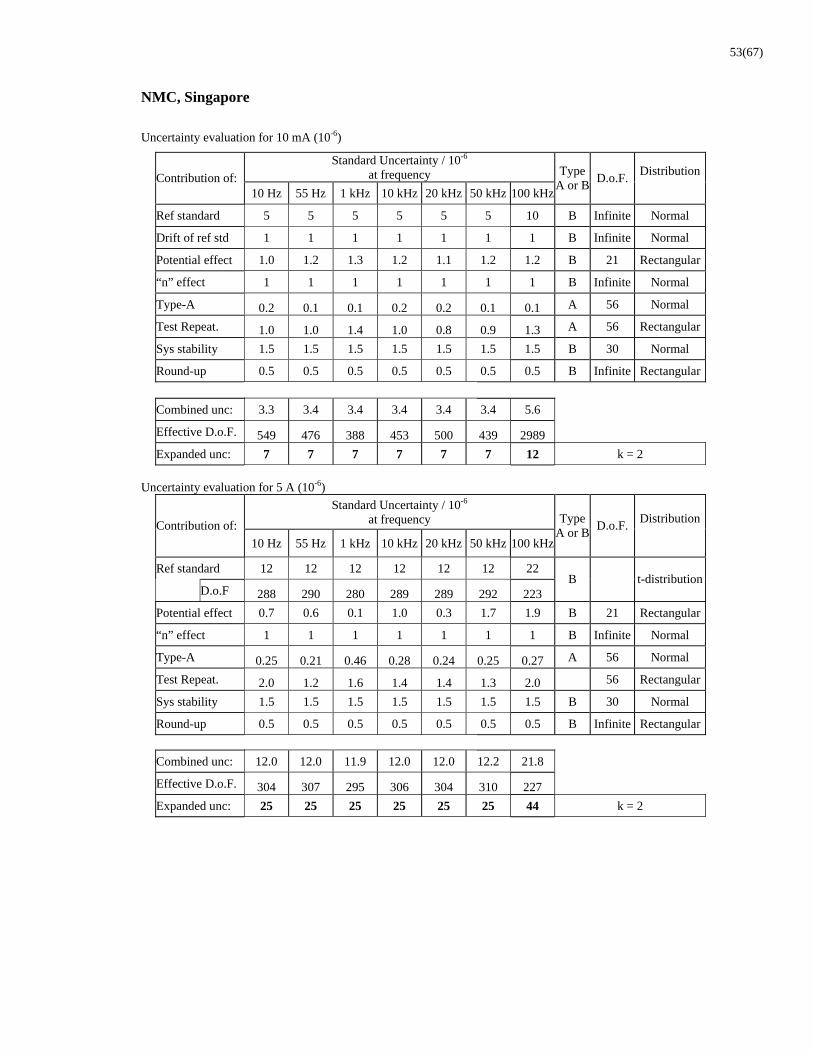
NMC, Singapore
Uncertainty evaluation for 10 mA (10-6)
Standard Uncertainty / 10-6 at frequency Contribution of:
10 Hz 55 Hz 1 kHz 10 kHz 20 kHz 50 kHz 100 kHz
Type A or B
D.o.F. Distribution
Ref standard 5 5 5 5 5 5 10 B Infinite Normal
Drift of ref std 1 1 1 1 1 1 1 B Infinite Normal
Potential effect 1.0 1.2 1.3 1.2 1.1 1.2 1.2 B 21 Rectangular
“n” effect 1 1 1 1 1 1 1 B Infinite Normal
Type-A 0.2 0.1 0.1 0.2 0.2 0.1 0.1 A 56 Normal
Test Repeat. 1.0 1.0 1.4 1.0 0.8 0.9 1.3 A 56 Rectangular
Sys stability 1.5 1.5 1.5 1.5 1.5 1.5 1.5 B 30 Normal
Round-up 0.5 0.5 0.5 0.5 0.5 0.5 0.5 B Infinite Rectangular
Combined unc: 3.3 3.4 3.4 3.4 3.4 3.4 5.6
Effective D.o.F. 549 476 388 453 500 439 2989
Expanded unc: 7 7 7 7 7 7 12 k = 2
Uncertainty evaluation for 5 A (10-6)
Standard Uncertainty / 10-6 at frequency Contribution of:
10 Hz 55 Hz 1 kHz 10 kHz 20 kHz 50 kHz 100 kHz
Type A or B
D.o.F. Distribution
Ref standard 12 12 12 12 12 12 22
D.o.F 288 290 280 289 289 292 223 B t-distribution
Potential effect 0.7 0.6 0.1 1.0 0.3 1.7 1.9 B 21 Rectangular
“n” effect 1 1 1 1 1 1 1 B Infinite Normal
Type-A 0.25 0.21 0.46 0.28 0.24 0.25 0.27 A 56 Normal
Test Repeat. 2.0 1.2 1.6 1.4 1.4 1.3 2.0 56 Rectangular
Sys stability 1.5 1.5 1.5 1.5 1.5 1.5 1.5 B 30 Normal
Round-up 0.5 0.5 0.5 0.5 0.5 0.5 0.5 B Infinite Rectangular
Combined unc: 12.0 12.0 11.9 12.0 12.0 12.2 21.8
Effective D.o.F. 304 307 295 306 304 310 227
Expanded unc: 25 25 25 25 25 25 44 k = 2

54(67)
INMETRO, Brazil Measurement Current : 10 mA
Contribution of: Standard Uncertainty (A/A) at frequency
Type A or B
Distribution
55 Hz 1 kHz 10 kHz 50 kHz 100 kHz
reproducibility 1 1 1 1 1 A Normal
Reference standard 20 20 30 30 38 B Normal
n coefficient of standard
50 50 50 50 50 B Rectangular
standard drift 10 10 10 15 20 B Rectangular
set-up procedure:
standard voltmeter stability
0,5e-3 0,5e-3 0,5e-3 0,5e-3 0,5e-3 B Rectangular
travel. voltmeter stability
2,2e-3 2,2e-3 2,2e-3 2,2e-3 2,2e-3 B Rectangular
DC source uncertainty
10 10 10 3 3 B Normal
Transconductance amplifier uncertainty
20 20 B Rectangular
connectors AC-DC difference
7 7 10 10 12 B Rectangular
Combined unc (k=1): 13,22 13,22 17,80 18,32 23,34
Expanded unc: 27 27 36 42 51
Measurement Current : 5 A
Contribution of: Standard Uncertainty (A/A) at frequency
Type A or B
Distribution
55 Hz 1 kHz 10 kHz 50 kHz 100 kHz
reproducibility 2 3 5 6 7 A Normal
Reference standard 50 50 50 70 117 B Normal
n coefficient of standard
50 50 50 50 50 B Rectangular
standard drift 30 30 40 40 40 B Rectangular
set-up procedure:
standard voltmeter stability
0,5e-3 0,5e-3 0,5e-3 0,5e-3 0,5e-3 B Rectangular
travel. voltmeter stability
5,5e-3 5,5e-3 5,5e-3 5,5e-3 5,5e-3 B Rectangular
DC source uncertainty
16 16 3 3 3 B Normal
amplifier uncertainty 55 55 50 50 50 B Rectangular connectors AC-DC difference
7 7 10 10 12 B Rectangular
Combined unc (k=1): 31,71 31,71 42,67 49,21 68,08

55(67)
Expanded unc: 91 91 96 104 141

56(67)
NPL, United Kingdom
Divisor 10 Hz 55 Hz 1 kHz 10 kHz 20 kHz 50 kHz 100 kHzRectangular 2.0 2.0 2.0 2.0 2.0 2.0 2.0Normal 3.0 3.0 3.0 3.0 3.0 3.0 3.0Rectangular 2.0 2.0 2.0 2.0 2.0 2.0 2.0Normal 1.0 1.0 1.0 1.0 1.0 1.0 1.0Rectangular 0.6 0.0 0.0 0.0 0.0 0.0 0.0Rectangular 3.0 3.0 3.0 4.0 5.0 6.0 10.0Normal 2.0 1.2 1.1 2.0 1.6 1.9 1.9
11.2 10.7 10.6 12.4 13.5 15.2 22.1>100 >100 >100 >100 >100 >100 >100
Table 1 - Break Down of Uncertainty Calculations for Current Level of 10 mA
Freq Dependant Bridge ErrorsTypical ScatterFreq Dependant Bridge ErrorsTypical ScatterLevel DependancyNetwork/Potential of Housing
Degrees of Freedomrss x2
Repeatability
Divisor 10 Hz 55 Hz 1 kHz 10 kHz 20 kHz 50 kHz 100 kHzRectangular 11.0 7.7 9.4 7.8 8.1 10.3 13.3Rectangular 24.0 6.0 0.0 0.0 0.0 0.0 0.0Rectangular 7.0 7.0 7.0 7.0 25.0 40.0 80.0Rectangular 2.0 2.0 2.0 2.0 2.0 2.0 2.0Normal 1.0 1.0 1.0 1.0 1.0 1.0 1.0Normal 5.6 1.0 1.2 1.1 1.8 4.3 16.4
55.9 24.5 24.0 21.6 52.9 83.2 165.5>100 >100 >100 >100 >100 >100 >100
rss x2Degrees of Freedom
Level Dependancy
Table 2 - Break Down of Uncertainty Calculations for Current Level of 5 A
Build Up Uncertainty
Network/Potential of HousingFreq Dependant Bridge ErrorsTypical ScatterRepeatability

57(67)
VNIIM, Russia Measurement Current : 10 mA
Standard Uncertainty (A/A) at frequency
Contribution of:
10 Hz 55 Hz 1 kHz 10 kHz 20 kHz 50 kHz 100 kHz
Type A or B
Distri-bution
Reference Standard 1.1 1.1 1.1 1.1 1.1 1.2 1.5 UB
Setup 0.15 0.15 0.15 0.15 0.15 0.15 0.15 UB
Capacitance between thermal converters
0.07 0.07 0.07 0.07 0.07 0.15 0.15 UB
Temperature fluctuations
0.28 0.28 0.28 0.28 0.28 0.28 0.28 UB
Type A 0.5 0.8 0.13 0.56 0.58 0.33 0.51 UA
Combined unc (k=1): 1.26 1.41 1.16 1.28 1.29 1.27 1.33
Expanded unc: 1.3 1.4 1.2 1.3 1.3 1.3 1.3
Measurement Current : 5 A
Standard Uncertainty (A/A) at frequency
Contribution of:
10 Hz 55 Hz 1 kHz 10 kHz 20 kHz 50 kHz 100 kHz
Type A or B
Distri-bution
Reference Standard 1.5 1.5 1.5 1.5 UB
Setup 0.15 0.15 0.15 0.15 UB
Temperature fluctuations
0.28 0.28 0.28 0.28 UB
Capacitance between reference and shunt
0.07 0.07 0.07 0.07 UB
Type A 1.3 1.1 0.73 0.5 UA
Combined unc (k=1): 2.0 1.9 1.7 1.6
Expanded unc: 2.0 2.0 1.7 1.6
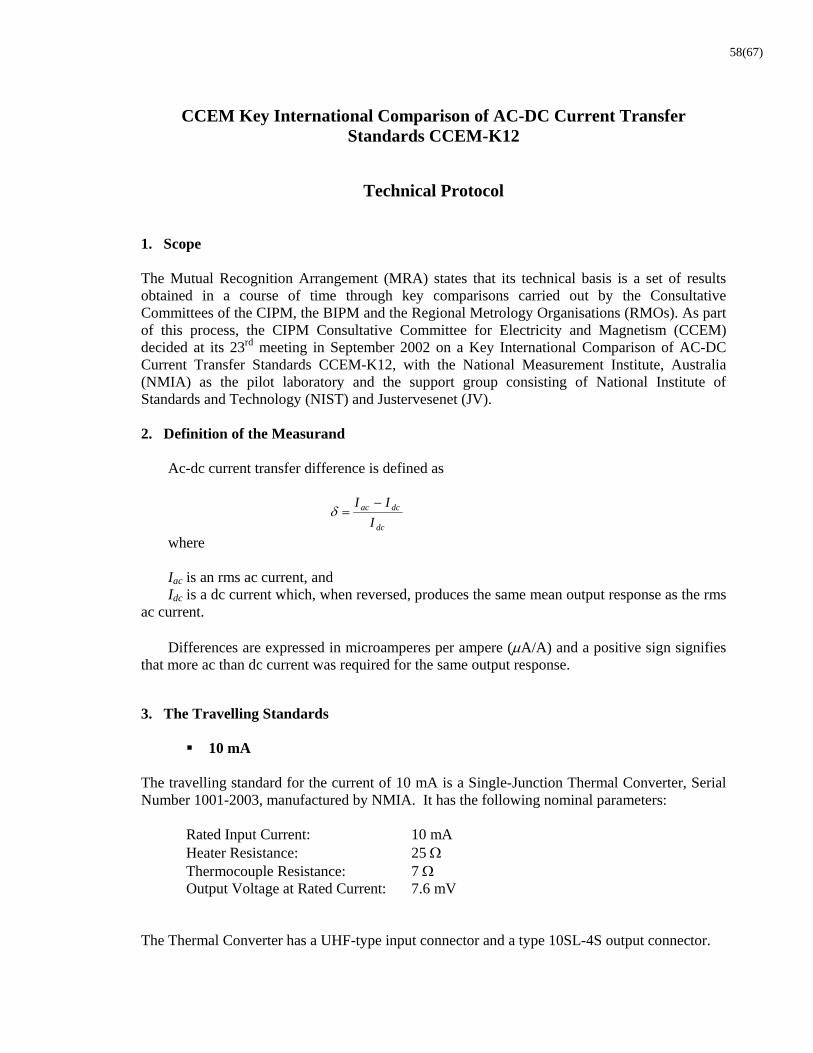
58(67)
CCEM Key International Comparison of AC-DC Current Transfer
Standards CCEM-K12
Technical Protocol
1. Scope The Mutual Recognition Arrangement (MRA) states that its technical basis is a set of results obtained in a course of time through key comparisons carried out by the Consultative Committees of the CIPM, the BIPM and the Regional Metrology Organisations (RMOs). As part of this process, the CIPM Consultative Committee for Electricity and Magnetism (CCEM) decided at its 23rd meeting in September 2002 on a Key International Comparison of AC-DC Current Transfer Standards CCEM-K12, with the National Measurement Institute, Australia (NMIA) as the pilot laboratory and the support group consisting of National Institute of Standards and Technology (NIST) and Justervesenet (JV). 2. Definition of the Measurand
Ac-dc current transfer difference is defined as
dc
dcac
I
II
where Iac is an rms ac current, and Idc is a dc current which, when reversed, produces the same mean output response as the rms
ac current. Differences are expressed in microamperes per ampere (A/A) and a positive sign signifies
that more ac than dc current was required for the same output response.
3. The Travelling Standards
10 mA The travelling standard for the current of 10 mA is a Single-Junction Thermal Converter, Serial Number 1001-2003, manufactured by NMIA. It has the following nominal parameters:
Rated Input Current: 10 mA Heater Resistance: 25 Thermocouple Resistance: 7 Output Voltage at Rated Current: 7.6 mV
The Thermal Converter has a UHF-type input connector and a type 10SL-4S output connector.

59(67)
5 A The 5 ampere travelling standard comprises a 0.2 coaxial shunt, Serial No S10 and a 1 V single junction thermal converter, serial number 251 - 2003. Both have been manufactured at NMIA. Their main parameters are as follows: Current Shunt, Serial No S10
Nominal Resistance 0.2 Power coefficient of resistance <0.5 /W Input Connector UHF Output Connector N-female
Thermal Converter, Serial No 251 - 2003
Rated Input Voltage: 1 V Input Resistance: 475 Thermocouple Resistance: 7 Output Voltage at Rated Voltage: 6.2 mV
The 5 A travelling standard is supplied with two Perspex supports, for the Thermal Converter and for the input side of the shunt respectively. When assembled correctly the travelling standard can be positioned firmly on a flat surface (see Figure 1).
Figure 2 Physical layout of the 5A travelling standard
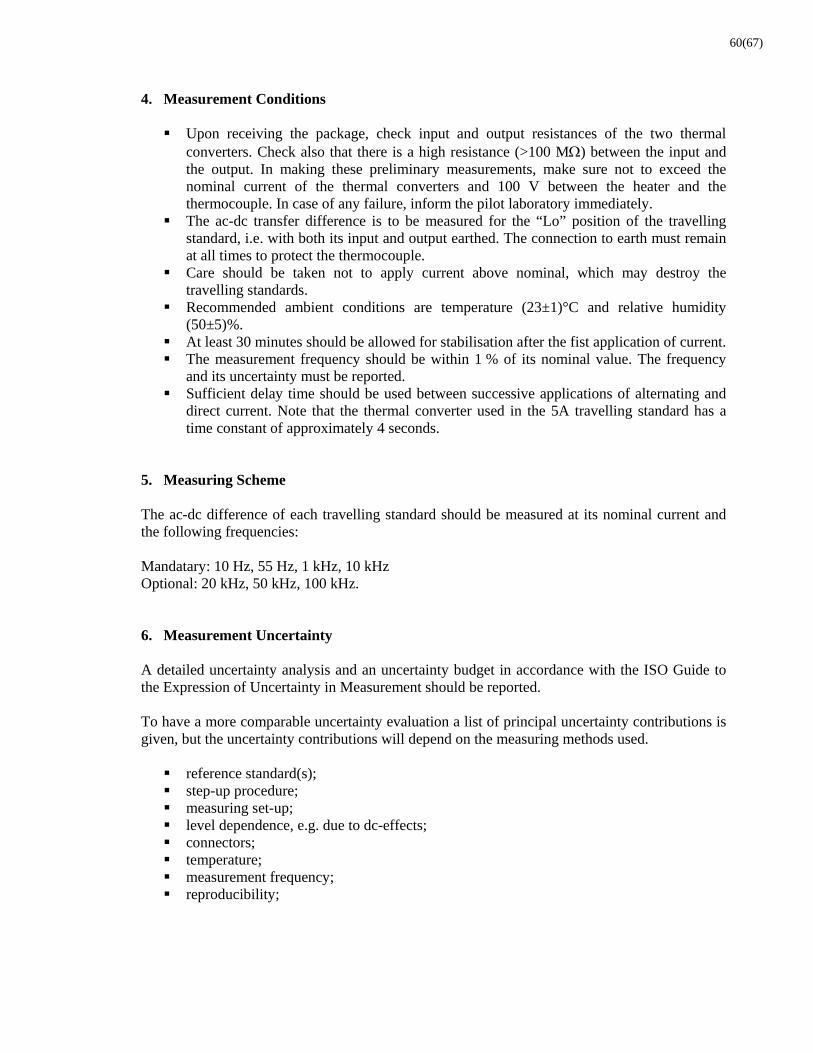
60(67)
4. Measurement Conditions Upon receiving the package, check input and output resistances of the two thermal
converters. Check also that there is a high resistance (>100 M) between the input and the output. In making these preliminary measurements, make sure not to exceed the nominal current of the thermal converters and 100 V between the heater and the thermocouple. In case of any failure, inform the pilot laboratory immediately.
The ac-dc transfer difference is to be measured for the “Lo” position of the travelling standard, i.e. with both its input and output earthed. The connection to earth must remain at all times to protect the thermocouple.
Care should be taken not to apply current above nominal, which may destroy the travelling standards.
Recommended ambient conditions are temperature (23±1)°C and relative humidity (50±5)%.
At least 30 minutes should be allowed for stabilisation after the fist application of current. The measurement frequency should be within 1 % of its nominal value. The frequency
and its uncertainty must be reported. Sufficient delay time should be used between successive applications of alternating and
direct current. Note that the thermal converter used in the 5A travelling standard has a time constant of approximately 4 seconds.
5. Measuring Scheme The ac-dc difference of each travelling standard should be measured at its nominal current and the following frequencies: Mandatary: 10 Hz, 55 Hz, 1 kHz, 10 kHz Optional: 20 kHz, 50 kHz, 100 kHz. 6. Measurement Uncertainty A detailed uncertainty analysis and an uncertainty budget in accordance with the ISO Guide to the Expression of Uncertainty in Measurement should be reported. To have a more comparable uncertainty evaluation a list of principal uncertainty contributions is given, but the uncertainty contributions will depend on the measuring methods used. reference standard(s); step-up procedure; measuring set-up; level dependence, e.g. due to dc-effects; connectors; temperature; measurement frequency; reproducibility;

61(67)
7. Report of the Comparison Each participant is asked to submit a report within one month after completing the measurements. The report should contain at least the following: Detailed description of the measurement setup and the reference standard; Definition of the measurand; Detailed description of the measurement procedure; A statement of traceability, if the national standard is not considered to be a primary
standard The measurement results; The ambient conditions of the measurement: the temperature and the humidity with limits
of variation A complete uncertainty budget in accordance with the principles of the ISO Guide to the
Expression of Uncertainty in Measurement. The participants are also asked to report a summary of the measurement results, Appendix 1. Please also send the report and the summary by e-mail. The pilot laboratory will inform a participating laboratory if there is a large deviation between the results of the laboratory and the preliminary reference values. No other information on the results will be communicated before the completion of the circulation. 8. Transportation and Customs Transportation is at each laboratory’s own responsibility and cost. Due to the time
constraints please use a recognised courier service e.g. UPS or DHL for the transport of the travelling standard. Do not use a forwarding agent that does not guarantee an adequate delivery time, inclusive of the time for customs procedure
The case will be transported with an ATA Carnet for customs clearance. Please take special care to ensure that the carnet always stays with the package.
On receipt of the case, unpack the devices carefully and check for any damage. The list of contents of the packing case should also be checked. Also check carefully that the carnet has been stamped on entry into your country.
Before sending the case out, check the packing list and ensure everything is enclosed. Ensure that the carnet is packed outside the case for easy access by Customs and ensure that the carnet is stamped by Customs on exit from your country.
9. Circulation of the Travelling Standards The time schedule is shown in Table 1. As the comparison must to be finished within a reasonable period of time, only six weeks are allowed for each participant, including the time of transportation.

62(67)
Table 1 Schedule for the CCEM-K12 Key Comparison of Ac-dc Current Transfer
Dates Laboratory
to Mar 2005 NMIA05 Apr 2005 - 16 May 2005 NRC
17 May 2005 - 27 Jun 2005 INTI28 Jun 2005 - 08 Aug 2005 NIST09 Aug 2005 - 19 Sep 2005 PTB20 Sep 2005 - 31 Oct 2005 BEV01 Nov 2005 - 12 Dec 2005 JV13 Dec 2005 - 23 Jan 2006 SP24 Jan 2006 - 06 Mar 2006 NPL07 Mar 2006 - 17 Apr 2006 NMIA18 Apr 2006 - 29 May 2006 VNIIM
30 May 2006 - 10 Jul 2006 SPRING11 Jul 2006 - 21 Aug 2006 NMIA
* Bold letters indicate the pilot laboratory and support group If unforeseen circumstances prevent a laboratory from carrying out its measurements within the agreed time period, it should send the travelling standard without delay to the laboratory next in line. If time permits, the laboratory will be able to carry out measurements at a later time. 10. Organisation The pilot laboratory for the comparison is the National Measurement Institute, Australia (NMIA). The support group consists of Mr Joe Kinard, National Institute of Standards and Technology, USA (NIST) and Dr Harald Slinde, Justervesenet, Norway (JV). The travelling standards will be dispatched from NMIA around April 2004 and will return after the completion of each loop. The number of loops will depend on the number of participants. Please inform the pilot laboratory of the arrival of the package by e-mail or fax. Please inform the pilot laboratory again of the details when sending the package to the next participant, and also inform the next participant by e-mail or fax. A relevant fax form is enclosed in Appendix 4. Prepare the transport to the next participant so the travelling standard can be sent immediately after the measurements are completed. Each participating laboratory covers the costs of the measurement, transportation and customs clearance as well as for any damage that may occur within its country. The pilot laboratory covers the overall costs for the organisation of the comparison. The pilot laboratory has no insurance for any loss or damage of the travelling standard.

63(67)
11. Comparison Coordinator Any questions related to the Comparison should be directed the Comparison Coordinator: Dr Ilya Budovsky National Measurement Institute PO Box 264 Lindfield NSW 2070 Australia phone: (+61 2) 8467 3541 fax: (+61 2) 8467 3783 email: [email protected]

64(67)
Appendix 1. Summary of Results CCEM Key International Comparison of AC-DC Current Transfer Standards CCEM-K12 Please also send this information by e-mail. Institute: Date of measurements: Remarks: Measurement Results:
Measured ac-dc current difference / 10-6 at frequency Current
10 Hz 55 Hz 1 kHz 10 kHz 20 kHz 50 kHz 100 kHz
10 mA
5A
Expanded Uncertainty:
Expanded Uncertainty / 10-6 at frequency Current
10 Hz 55 Hz 1 kHz 10 kHz 20 kHz 50 kHz 100 kHz
10 mA
5A
Measurement Frequency:
Nominal Frequency Current
10 Hz 55 Hz 1 kHz 10 kHz 20 kHz 50 kHz 100 kHz
Meas. Frequency
Expanded Uncertainty
Environmental parameters:
Min Max Remarks
Ambient temperature (ºC)
Relative humidity (%)
65(67)
Appendix 2. Summary of Uncertainty Budget CCEM Key International Comparison of AC-DC Current Transfer Standards CCEM-K12 Please also send this information by e-mail. Institute: Date: Remarks: Measurement Current : 10 mA
Standard Uncertainty / 10-6 at frequency
Contribution of:
10 Hz 55 Hz 1 kHz 10 kHz 20 kHz 50 kHz 100 kHz
Type A or B
Distri-bution
Combined unc (k=1):
Expanded unc:
Measurement Current : 5 A
Standard Uncertainty / 10-6 at frequency
Contribution of:
10 Hz 55 Hz 1 kHz 10 kHz 20 kHz 50 kHz 100 kHz
Type A or B
Distri-bution
Combined unc (k=1):
Expanded unc:

66(67)
Appendix 3. Packing List CCEM Key International Comparison of AC-DC Current Transfer Standards CCEM-K12 1. Single Junction Thermal Converter, NMIA Serial No 1001 – 2003 2. Single Junction Thermal Converter, NMIA Serial No 251 – 2003 3. Current Shunt, NMIA Serial No S10 4. Thermal Converter Output Cable 5. Supports (2) 6. This Protocol
67(67)
Appendix 4 Forms for Notifying Receipt and Shipment of Artefact CCEM Key International Comparison of AC-DC Current Transfer Standards CCEM-K12
ARTEFACTS RECEIVED To:…(sender and coordinator)…. The package was received at ……..(name of laboratory)…. on …(date).. The condition when it was received was *in good physical and working order *damaged – (explain) __________________ (name of participant) ___________________________________________________________________
ARTEFACTS SHIPPED To: (recipient and coordinator) The package was shipped through ….(shipper)….. on …(date).. The shippers agent in the recipient country is ……….…(agent name and contact details)………………….. Shipping Details: Expected date of arrival at destination country:………….. Shipped: door-to-door / port –to – port Air Way Bill No. (house): …………………. If available: Master Air Way Bill No: Flight details: _____________________ (Name of Participant)