Embed Size (px)
Citation preview
Investor contact: Jennifer Thompson, 612.303.0778 | Media contact: Jeff Shelman, 612.422.1423
PROFITABILITY METRICS 3Q21 2Q21 3Q20 Return on average assets (%) 1.45 1.44 1.17Return on average common equity (%) 15.9 16.3 12.8Return on tangible common equity (%) (a) 20.2 20.9 16.6Net interest margin (%) 2.53 2.53 2.67Efficiency ratio (%) (a) 58.4 59.0 56.6
INCOME STATEMENT (b) 3Q21 2Q21 3Q20 Net interest income (taxable-equivalent basis) $3,197 $3,164 $3,252Noninterest income $2,693 $2,619 $2,712Net income attributable to U.S. Bancorp $2,028 $1,982 $1,580Diluted earnings per common share $1.30 $1.28 $.99Dividends declared per common share $.46 $.42 $.42
BALANCE SHEET (b) 3Q21 2Q21 3Q20 Average total loans $296,739 $294,284 $311,018Average total deposits $431,487 $429,210 $405,523Net charge-off ratio .20% .25% .66%Book value per common share (period end) $32.22 $31.74 $30.93Basel III standardized CET1 (c) 10.2% 9.9% 9.4%
(a) See Non-GAAP Financial Measures reconciliation on page 16(b) Dollars in millions, except per share data(c) CET1 = Common equity tier 1 capital ratio
CEO Commentary
3Q21 Key Financial Data 3Q21 Highlights
In the Spotlight
• Net income of $2,028 million and diluted earnings per commonshare of $1.30
• Return on average assets of 1.45% and return on averagecommon equity of 15.9%
• Net revenue of $5,890 million, including $3,197 million of netinterest income and $2,693 million of noninterest income
• Positive operating leverage on a linked quarter basis driven by2.8% linked quarter noninterest income growth• Payments revenue increased 3.6%• Trust and investment management fees increased 2.9%
• Average total earning assets growth of 3.5% year-over-year
• Average total deposits growth of 6.4% year-over-year
• Allowance for credit losses declined $310 million during thequarter given improving economic outlook and credit trends
• CET1 capital ratio increased to 10.2% at September 30, 2021,compared with 9.4% at September 30, 2020
U.S. Bancorp to acquire MUFG Union Bank U.S. Bancorp has entered into a definitive agreement to acquire MUFG Union Bank’s core regional banking franchise for approximately $8 billion, including $5.5 billion in cash and approximately 44 million shares of U.S. Bancorp common stock. The acquisition would add more than 1 million consumer customers and about 190,000 small business customers on the West Coast in addition to approximately $58 billion in loans and $90 billion in deposits. The acquisition will provide benefits for both customers and the communities served by the combined organization through improved technology, expanded products and customer choice. The transaction is expected to close in the first half of 2022.
Award-winning Mobile App The U.S. Bank Mobile App was ranked first among banking apps by industry benchmarking firm Keynova in its 3Q 2021 scorecard. The firm evaluates the top 17 banks on more than 200 criteria across four main categories: functionality, ease of use, privacy and security, and quality and availability.
U.S. Bank to launch fleet industry Voyager Mastercard U.S. Bank and Mastercard have partnered on a new card for fleet-related expenses. The new U.S. Bank Voyager Mastercard will build on U.S. Bank’s existing Voyager card, which allows customers to pay for fuel, fleet maintenance and other expenses at more than 320,000 merchant locations. Now customers can use a single card to pay for fleet-related expenses at any merchant that accepts Mastercard, providing unprecedented flexibility to support fleet operations and productivity on two major networks.
U.S. Bank Acquires Small Business Payments Software Company In September, U.S. Bank acquired Bento Technologies, known as Bento for Business, a fintech company based in Chicago and San Francisco that provides payment and expense management services to small and mid-size businesses. The acquisition is part of U.S. Bank’s vision to bring payments and banking services together to simplify cash flow and money management for small businesses.
U.S. Bancorp Reports Third Quarter 2021 Results • Net income of $2.0 billion and net revenue of $5.9 billion• Return on average assets of 1.45% and return on average common
equity of 15.9%• Common Equity Tier 1 capital ratio of 10.2% and strong levels of liquidity
“In the third quarter we generated net revenue of $5.9 billion, net income of $2.0 billion, and a return on tangible common equity of over 20%. Our results were supported by continued momentum across our fee businesses, a pick-up in loan growth, and improvement in our efficiency ratio. Credit quality was once again better than expected and for the third straight quarter our net charge-off ratio hit a record low level. We continue to supplement our organic growth by utilizing excess capital for strategically sound, financially attractive acquisitions. During the quarter we acquired Bento Technologies, which expands the capabilities of our payments ecosystem, and entered into a definitive agreement to acquire MUFG Union Bank’s core regional banking franchise. These acquisitions provide strategic and secular growth opportunities that will allow U.S. Bank to continue to deliver industry leading results for years to come. I want to thank all our employees for their continued hard work and dedication to serving all of our stakeholders.”
— Andy Cecere, Chairman, President and CEO, U.S. Bancorp
2
U.S. Bancorp Third Quarter 2021 Results
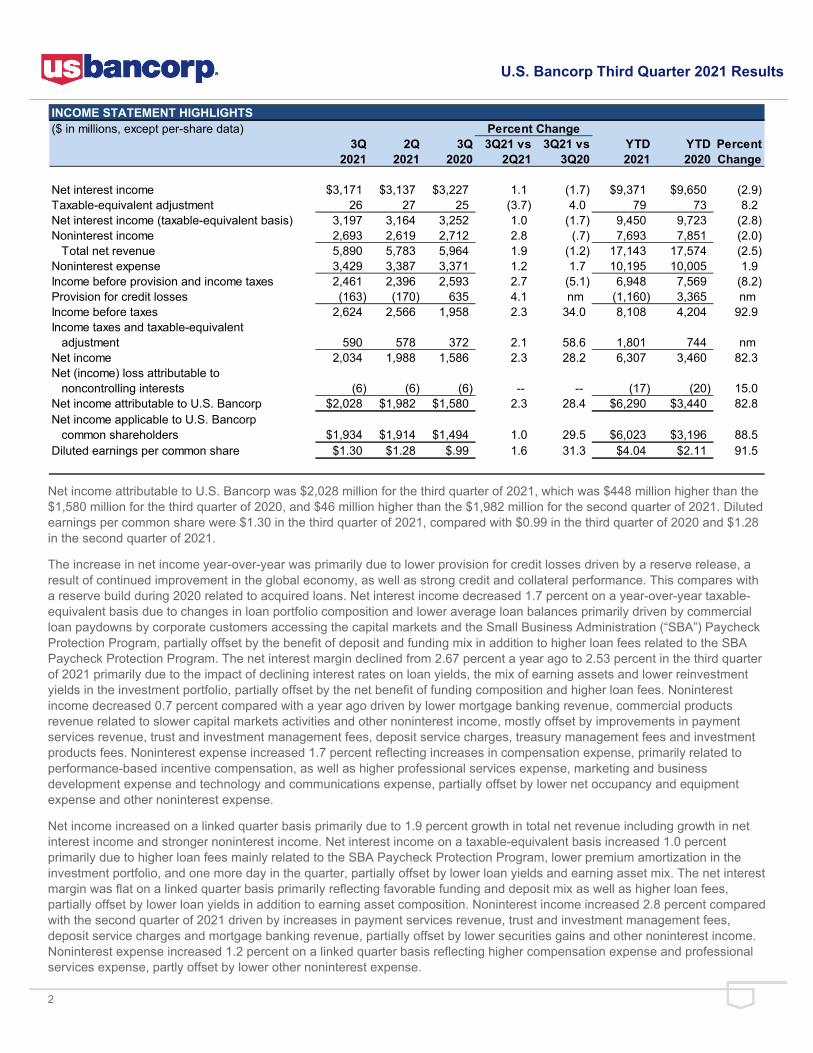
INCOME STATEMENT HIGHLIGHTS($ in millions, except per-share data) Percent Change
3Q 2Q 3Q 3Q21 vs 3Q21 vs YTD YTD Percent2021 2021 2020 2Q21 3Q20 2021 2020 Change
Net interest income $3,171 $3,137 $3,227 1.1 (1.7) $9,371 $9,650 (2.9)Taxable-equivalent adjustment 26 27 25 (3.7) 4.0 79 73 8.2Net interest income (taxable-equivalent basis) 3,197 3,164 3,252 1.0 (1.7) 9,450 9,723 (2.8)Noninterest income 2,693 2,619 2,712 2.8 (.7) 7,693 7,851 (2.0) Total net revenue 5,890 5,783 5,964 1.9 (1.2) 17,143 17,574 (2.5)Noninterest expense 3,429 3,387 3,371 1.2 1.7 10,195 10,005 1.9Income before provision and income taxes 2,461 2,396 2,593 2.7 (5.1) 6,948 7,569 (8.2)Provision for credit losses (163) (170) 635 4.1 nm (1,160) 3,365 nm Income before taxes 2,624 2,566 1,958 2.3 34.0 8,108 4,204 92.9Income taxes and taxable-equivalent adjustment 590 578 372 2.1 58.6 1,801 744 nm Net income 2,034 1,988 1,586 2.3 28.2 6,307 3,460 82.3Net (income) loss attributable to noncontrolling interests (6) (6) (6) -- -- (17) (20) 15.0Net income attributable to U.S. Bancorp $2,028 $1,982 $1,580 2.3 28.4 $6,290 $3,440 82.8Net income applicable to U.S. Bancorp common shareholders $1,934 $1,914 $1,494 1.0 29.5 $6,023 $3,196 88.5Diluted earnings per common share $1.30 $1.28 $.99 1.6 31.3 $4.04 $2.11 91.5
Net income attributable to U.S. Bancorp was $2,028 million for the third quarter of 2021, which was $448 million higher than the $1,580 million for the third quarter of 2020, and $46 million higher than the $1,982 million for the second quarter of 2021. Diluted earnings per common share were $1.30 in the third quarter of 2021, compared with $0.99 in the third quarter of 2020 and $1.28 in the second quarter of 2021.
The increase in net income year-over-year was primarily due to lower provision for credit losses driven by a reserve release, a result of continued improvement in the global economy, as well as strong credit and collateral performance. This compares with a reserve build during 2020 related to acquired loans. Net interest income decreased 1.7 percent on a year-over-year taxable-equivalent basis due to changes in loan portfolio composition and lower average loan balances primarily driven by commercial loan paydowns by corporate customers accessing the capital markets and the Small Business Administration (“SBA”) Paycheck Protection Program, partially offset by the benefit of deposit and funding mix in addition to higher loan fees related to the SBA Paycheck Protection Program. The net interest margin declined from 2.67 percent a year ago to 2.53 percent in the third quarter of 2021 primarily due to the impact of declining interest rates on loan yields, the mix of earning assets and lower reinvestment yields in the investment portfolio, partially offset by the net benefit of funding composition and higher loan fees. Noninterest income decreased 0.7 percent compared with a year ago driven by lower mortgage banking revenue, commercial products revenue related to slower capital markets activities and other noninterest income, mostly offset by improvements in payment services revenue, trust and investment management fees, deposit service charges, treasury management fees and investment products fees. Noninterest expense increased 1.7 percent reflecting increases in compensation expense, primarily related to performance-based incentive compensation, as well as higher professional services expense, marketing and business development expense and technology and communications expense, partially offset by lower net occupancy and equipment expense and other noninterest expense.
Net income increased on a linked quarter basis primarily due to 1.9 percent growth in total net revenue including growth in net interest income and stronger noninterest income. Net interest income on a taxable-equivalent basis increased 1.0 percent primarily due to higher loan fees mainly related to the SBA Paycheck Protection Program, lower premium amortization in the investment portfolio, and one more day in the quarter, partially offset by lower loan yields and earning asset mix. The net interest margin was flat on a linked quarter basis primarily reflecting favorable funding and deposit mix as well as higher loan fees, partially offset by lower loan yields in addition to earning asset composition. Noninterest income increased 2.8 percent compared with the second quarter of 2021 driven by increases in payment services revenue, trust and investment management fees, deposit service charges and mortgage banking revenue, partially offset by lower securities gains and other noninterest income. Noninterest expense increased 1.2 percent on a linked quarter basis reflecting higher compensation expense and professional services expense, partly offset by lower other noninterest expense.
3
U.S. Bancorp Third Quarter 2021 Results
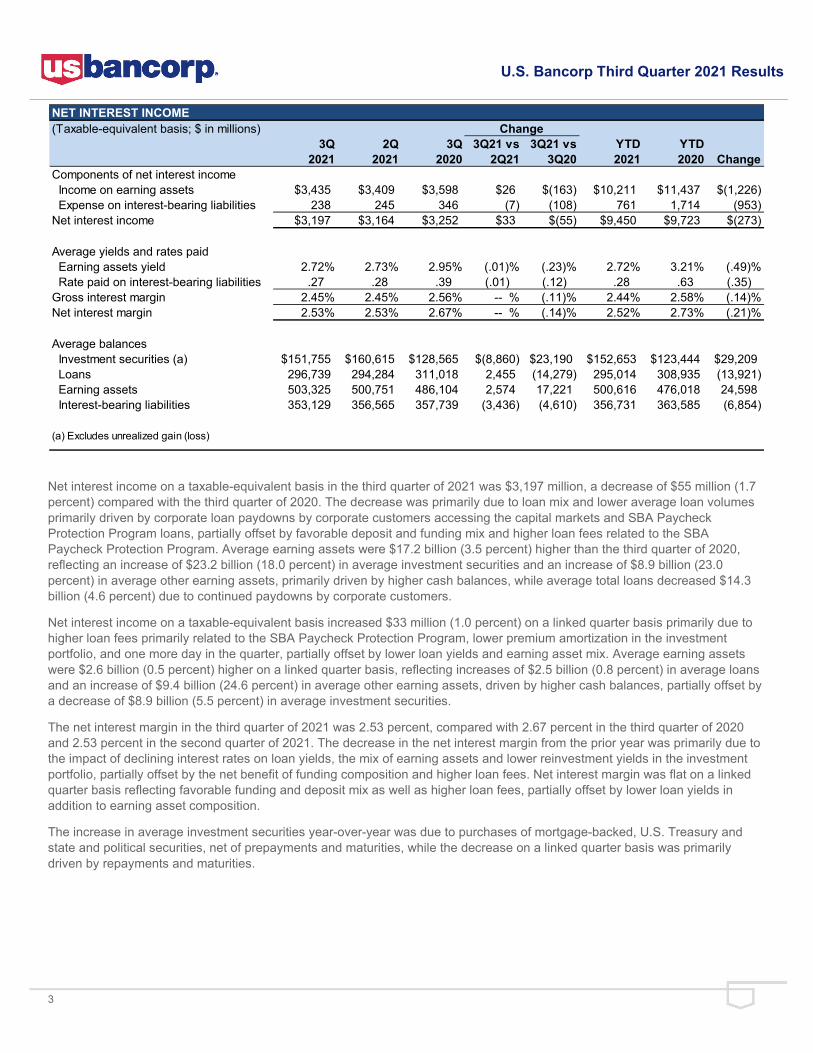
NET INTEREST INCOME(Taxable-equivalent basis; $ in millions) Change
3Q 2Q 3Q 3Q21 vs 3Q21 vs YTD YTD2021 2021 2020 2Q21 3Q20 2021 2020 Change
Components of net interest income Income on earning assets $3,435 $3,409 $3,598 $26 $(163) $10,211 $11,437 $(1,226) Expense on interest-bearing liabilities 238 245 346 (7) (108) 761 1,714 (953)Net interest income $3,197 $3,164 $3,252 $33 $(55) $9,450 $9,723 $(273)
Average yields and rates paid Earning assets yield 2.72% 2.73% 2.95% (.01)% (.23)% 2.72% 3.21% (.49)% Rate paid on interest-bearing liabilities .27 .28 .39 (.01) (.12) .28 .63 (.35) Gross interest margin 2.45% 2.45% 2.56% -- % (.11)% 2.44% 2.58% (.14)%Net interest margin 2.53% 2.53% 2.67% -- % (.14)% 2.52% 2.73% (.21)%
Average balances Investment securities (a) $151,755 $160,615 $128,565 $(8,860) $23,190 $152,653 $123,444 $29,209 Loans 296,739 294,284 311,018 2,455 (14,279) 295,014 308,935 (13,921) Earning assets 503,325 500,751 486,104 2,574 17,221 500,616 476,018 24,598 Interest-bearing liabilities 353,129 356,565 357,739 (3,436) (4,610) 356,731 363,585 (6,854)
(a) Excludes unrealized gain (loss)
Net interest income on a taxable-equivalent basis in the third quarter of 2021 was $3,197 million, a decrease of $55 million (1.7 percent) compared with the third quarter of 2020. The decrease was primarily due to loan mix and lower average loan volumes primarily driven by corporate loan paydowns by corporate customers accessing the capital markets and SBA Paycheck Protection Program loans, partially offset by favorable deposit and funding mix and higher loan fees related to the SBA Paycheck Protection Program. Average earning assets were $17.2 billion (3.5 percent) higher than the third quarter of 2020, reflecting an increase of $23.2 billion (18.0 percent) in average investment securities and an increase of $8.9 billion (23.0 percent) in average other earning assets, primarily driven by higher cash balances, while average total loans decreased $14.3 billion (4.6 percent) due to continued paydowns by corporate customers.
Net interest income on a taxable-equivalent basis increased $33 million (1.0 percent) on a linked quarter basis primarily due to higher loan fees primarily related to the SBA Paycheck Protection Program, lower premium amortization in the investment portfolio, and one more day in the quarter, partially offset by lower loan yields and earning asset mix. Average earning assets were $2.6 billion (0.5 percent) higher on a linked quarter basis, reflecting increases of $2.5 billion (0.8 percent) in average loans and an increase of $9.4 billion (24.6 percent) in average other earning assets, driven by higher cash balances, partially offset by a decrease of $8.9 billion (5.5 percent) in average investment securities.
The net interest margin in the third quarter of 2021 was 2.53 percent, compared with 2.67 percent in the third quarter of 2020 and 2.53 percent in the second quarter of 2021. The decrease in the net interest margin from the prior year was primarily due to the impact of declining interest rates on loan yields, the mix of earning assets and lower reinvestment yields in the investment portfolio, partially offset by the net benefit of funding composition and higher loan fees. Net interest margin was flat on a linked quarter basis reflecting favorable funding and deposit mix as well as higher loan fees, partially offset by lower loan yields in addition to earning asset composition.
The increase in average investment securities year-over-year was due to purchases of mortgage-backed, U.S. Treasury and state and political securities, net of prepayments and maturities, while the decrease on a linked quarter basis was primarily driven by repayments and maturities.
4
U.S. Bancorp Third Quarter 2021 Results
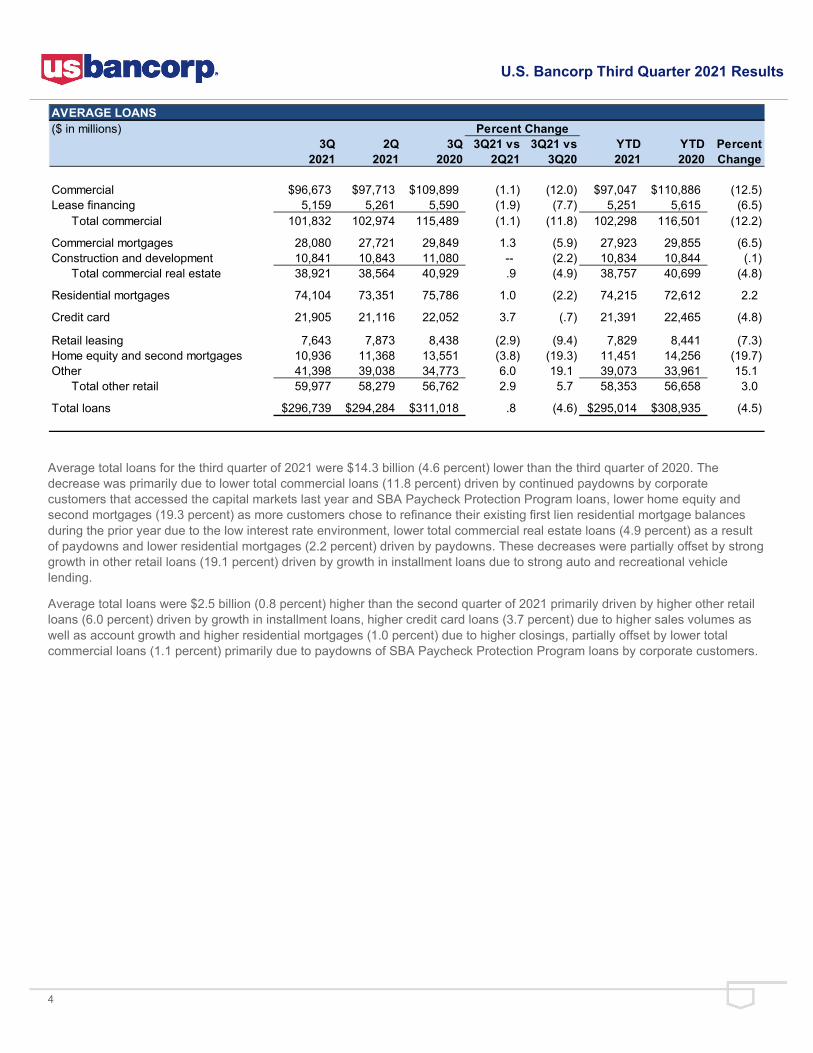
AVERAGE LOANS($ in millions) Percent Change
3Q 2Q 3Q 3Q21 vs 3Q21 vs YTD YTD Percent2021 2021 2020 2Q21 3Q20 2021 2020 Change
Commercial $96,673 $97,713 $109,899 (1.1) (12.0) $97,047 $110,886 (12.5)Lease financing 5,159 5,261 5,590 (1.9) (7.7) 5,251 5,615 (6.5) Total commercial 101,832 102,974 115,489 (1.1) (11.8) 102,298 116,501 (12.2) Commercial mortgages 28,080 27,721 29,849 1.3 (5.9) 27,923 29,855 (6.5)Construction and development 10,841 10,843 11,080 -- (2.2) 10,834 10,844 (.1) Total commercial real estate 38,921 38,564 40,929 .9 (4.9) 38,757 40,699 (4.8)
Residential mortgages 74,104 73,351 75,786 1.0 (2.2) 74,215 72,612 2.2
Credit card 21,905 21,116 22,052 3.7 (.7) 21,391 22,465 (4.8)
Retail leasing 7,643 7,873 8,438 (2.9) (9.4) 7,829 8,441 (7.3)Home equity and second mortgages 10,936 11,368 13,551 (3.8) (19.3) 11,451 14,256 (19.7)Other 41,398 39,038 34,773 6.0 19.1 39,073 33,961 15.1 Total other retail 59,977 58,279 56,762 2.9 5.7 58,353 56,658 3.0
Total loans $296,739 $294,284 $311,018 .8 (4.6) $295,014 $308,935 (4.5)
Average total loans for the third quarter of 2021 were $14.3 billion (4.6 percent) lower than the third quarter of 2020. The decrease was primarily due to lower total commercial loans (11.8 percent) driven by continued paydowns by corporate customers that accessed the capital markets last year and SBA Paycheck Protection Program loans, lower home equity and second mortgages (19.3 percent) as more customers chose to refinance their existing first lien residential mortgage balances during the prior year due to the low interest rate environment, lower total commercial real estate loans (4.9 percent) as a result of paydowns and lower residential mortgages (2.2 percent) driven by paydowns. These decreases were partially offset by strong growth in other retail loans (19.1 percent) driven by growth in installment loans due to strong auto and recreational vehicle lending.
Average total loans were $2.5 billion (0.8 percent) higher than the second quarter of 2021 primarily driven by higher other retail loans (6.0 percent) driven by growth in installment loans, higher credit card loans (3.7 percent) due to higher sales volumes as well as account growth and higher residential mortgages (1.0 percent) due to higher closings, partially offset by lower total commercial loans (1.1 percent) primarily due to paydowns of SBA Paycheck Protection Program loans by corporate customers.
5
U.S. Bancorp Third Quarter 2021 Results
AVERAGE DEPOSITS($ in millions) Percent Change
3Q 2Q 3Q 3Q21 vs 3Q21 vs YTD YTD Percent2021 2021 2020 2Q21 3Q20 2021 2020 Change
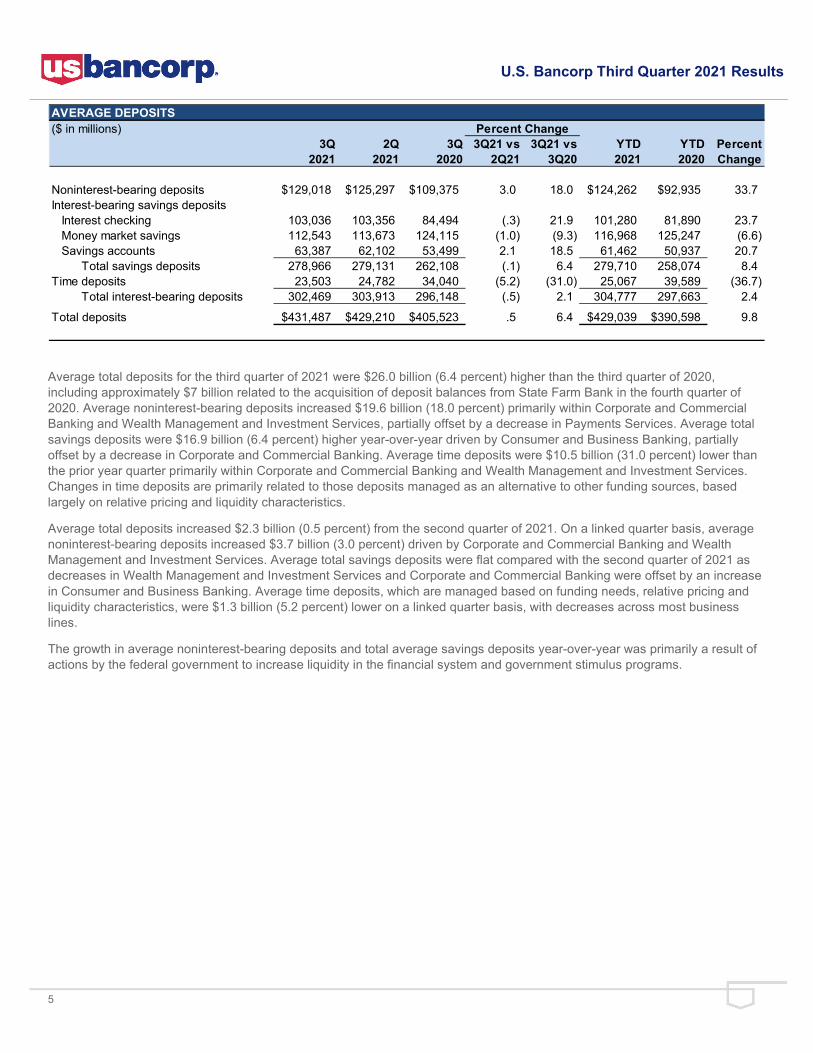
Noninterest-bearing deposits $129,018 $125,297 $109,375 3.0 18.0 $124,262 $92,935 33.7Interest-bearing savings deposits Interest checking 103,036 103,356 84,494 (.3) 21.9 101,280 81,890 23.7 Money market savings 112,543 113,673 124,115 (1.0) (9.3) 116,968 125,247 (6.6) Savings accounts 63,387 62,102 53,499 2.1 18.5 61,462 50,937 20.7 Total savings deposits 278,966 279,131 262,108 (.1) 6.4 279,710 258,074 8.4Time deposits 23,503 24,782 34,040 (5.2) (31.0) 25,067 39,589 (36.7) Total interest-bearing deposits 302,469 303,913 296,148 (.5) 2.1 304,777 297,663 2.4
Total deposits $431,487 $429,210 $405,523 .5 6.4 $429,039 $390,598 9.8
Average total deposits for the third quarter of 2021 were $26.0 billion (6.4 percent) higher than the third quarter of 2020, including approximately $7 billion related to the acquisition of deposit balances from State Farm Bank in the fourth quarter of 2020. Average noninterest-bearing deposits increased $19.6 billion (18.0 percent) primarily within Corporate and Commercial Banking and Wealth Management and Investment Services, partially offset by a decrease in Payments Services. Average total savings deposits were $16.9 billion (6.4 percent) higher year-over-year driven by Consumer and Business Banking, partially offset by a decrease in Corporate and Commercial Banking. Average time deposits were $10.5 billion (31.0 percent) lower than the prior year quarter primarily within Corporate and Commercial Banking and Wealth Management and Investment Services. Changes in time deposits are primarily related to those deposits managed as an alternative to other funding sources, based largely on relative pricing and liquidity characteristics.
Average total deposits increased $2.3 billion (0.5 percent) from the second quarter of 2021. On a linked quarter basis, average noninterest-bearing deposits increased $3.7 billion (3.0 percent) driven by Corporate and Commercial Banking and Wealth Management and Investment Services. Average total savings deposits were flat compared with the second quarter of 2021 as decreases in Wealth Management and Investment Services and Corporate and Commercial Banking were offset by an increase in Consumer and Business Banking. Average time deposits, which are managed based on funding needs, relative pricing and liquidity characteristics, were $1.3 billion (5.2 percent) lower on a linked quarter basis, with decreases across most business lines.
The growth in average noninterest-bearing deposits and total average savings deposits year-over-year was primarily a result of actions by the federal government to increase liquidity in the financial system and government stimulus programs.
6
U.S. Bancorp Third Quarter 2021 Results
NONINTEREST INCOME($ in millions) Percent Change
3Q 2Q 3Q 3Q21 vs 3Q21 vs YTD YTD Percent2021 2021 2020 2Q21 3Q20 2021 2020 Change
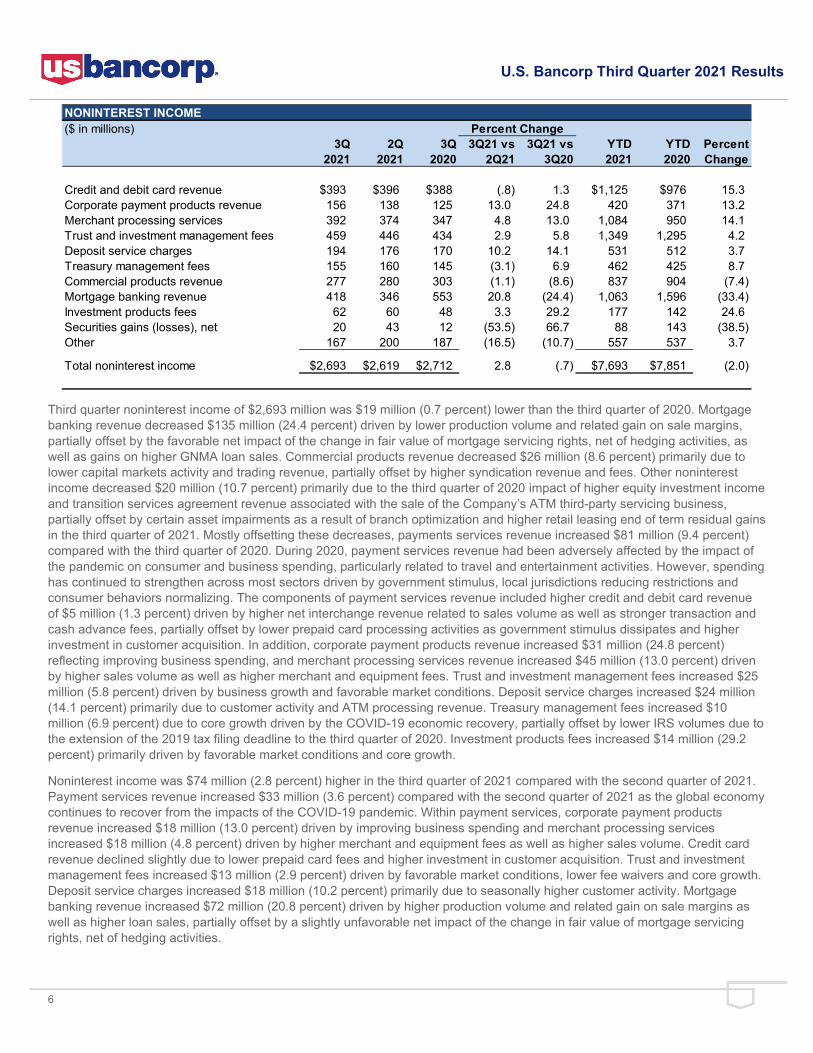
Credit and debit card revenue $393 $396 $388 (.8) 1.3 $1,125 $976 15.3Corporate payment products revenue 156 138 125 13.0 24.8 420 371 13.2Merchant processing services 392 374 347 4.8 13.0 1,084 950 14.1Trust and investment management fees 459 446 434 2.9 5.8 1,349 1,295 4.2Deposit service charges 194 176 170 10.2 14.1 531 512 3.7Treasury management fees 155 160 145 (3.1) 6.9 462 425 8.7Commercial products revenue 277 280 303 (1.1) (8.6) 837 904 (7.4)Mortgage banking revenue 418 346 553 20.8 (24.4) 1,063 1,596 (33.4)Investment products fees 62 60 48 3.3 29.2 177 142 24.6Securities gains (losses), net 20 43 12 (53.5) 66.7 88 143 (38.5)Other 167 200 187 (16.5) (10.7) 557 537 3.7
Total noninterest income $2,693 $2,619 $2,712 2.8 (.7) $7,693 $7,851 (2.0)
Third quarter noninterest income of $2,693 million was $19 million (0.7 percent) lower than the third quarter of 2020. Mortgage banking revenue decreased $135 million (24.4 percent) driven by lower production volume and related gain on sale margins, partially offset by the favorable net impact of the change in fair value of mortgage servicing rights, net of hedging activities, as well as gains on higher GNMA loan sales. Commercial products revenue decreased $26 million (8.6 percent) primarily due to lower capital markets activity and trading revenue, partially offset by higher syndication revenue and fees. Other noninterest income decreased $20 million (10.7 percent) primarily due to the third quarter of 2020 impact of higher equity investment income and transition services agreement revenue associated with the sale of the Company’s ATM third-party servicing business, partially offset by certain asset impairments as a result of branch optimization and higher retail leasing end of term residual gains in the third quarter of 2021. Mostly offsetting these decreases, payments services revenue increased $81 million (9.4 percent) compared with the third quarter of 2020. During 2020, payment services revenue had been adversely affected by the impact of the pandemic on consumer and business spending, particularly related to travel and entertainment activities. However, spending has continued to strengthen across most sectors driven by government stimulus, local jurisdictions reducing restrictions and consumer behaviors normalizing. The components of payment services revenue included higher credit and debit card revenue of $5 million (1.3 percent) driven by higher net interchange revenue related to sales volume as well as stronger transaction and cash advance fees, partially offset by lower prepaid card processing activities as government stimulus dissipates and higher investment in customer acquisition. In addition, corporate payment products revenue increased $31 million (24.8 percent) reflecting improving business spending, and merchant processing services revenue increased $45 million (13.0 percent) driven by higher sales volume as well as higher merchant and equipment fees. Trust and investment management fees increased $25 million (5.8 percent) driven by business growth and favorable market conditions. Deposit service charges increased $24 million (14.1 percent) primarily due to customer activity and ATM processing revenue. Treasury management fees increased $10 million (6.9 percent) due to core growth driven by the COVID-19 economic recovery, partially offset by lower IRS volumes due to the extension of the 2019 tax filing deadline to the third quarter of 2020. Investment products fees increased $14 million (29.2 percent) primarily driven by favorable market conditions and core growth.
Noninterest income was $74 million (2.8 percent) higher in the third quarter of 2021 compared with the second quarter of 2021. Payment services revenue increased $33 million (3.6 percent) compared with the second quarter of 2021 as the global economy continues to recover from the impacts of the COVID-19 pandemic. Within payment services, corporate payment products revenue increased $18 million (13.0 percent) driven by improving business spending and merchant processing services increased $18 million (4.8 percent) driven by higher merchant and equipment fees as well as higher sales volume. Credit card revenue declined slightly due to lower prepaid card fees and higher investment in customer acquisition. Trust and investment management fees increased $13 million (2.9 percent) driven by favorable market conditions, lower fee waivers and core growth. Deposit service charges increased $18 million (10.2 percent) primarily due to seasonally higher customer activity. Mortgage banking revenue increased $72 million (20.8 percent) driven by higher production volume and related gain on sale margins as well as higher loan sales, partially offset by a slightly unfavorable net impact of the change in fair value of mortgage servicing rights, net of hedging activities.
7
U.S. Bancorp Third Quarter 2021 Results
NONINTEREST EXPENSE($ in millions) Percent Change
3Q 2Q 3Q 3Q21 vs 3Q21 vs YTD YTD Percent2021 2021 2020 2Q21 3Q20 2021 2020 Change
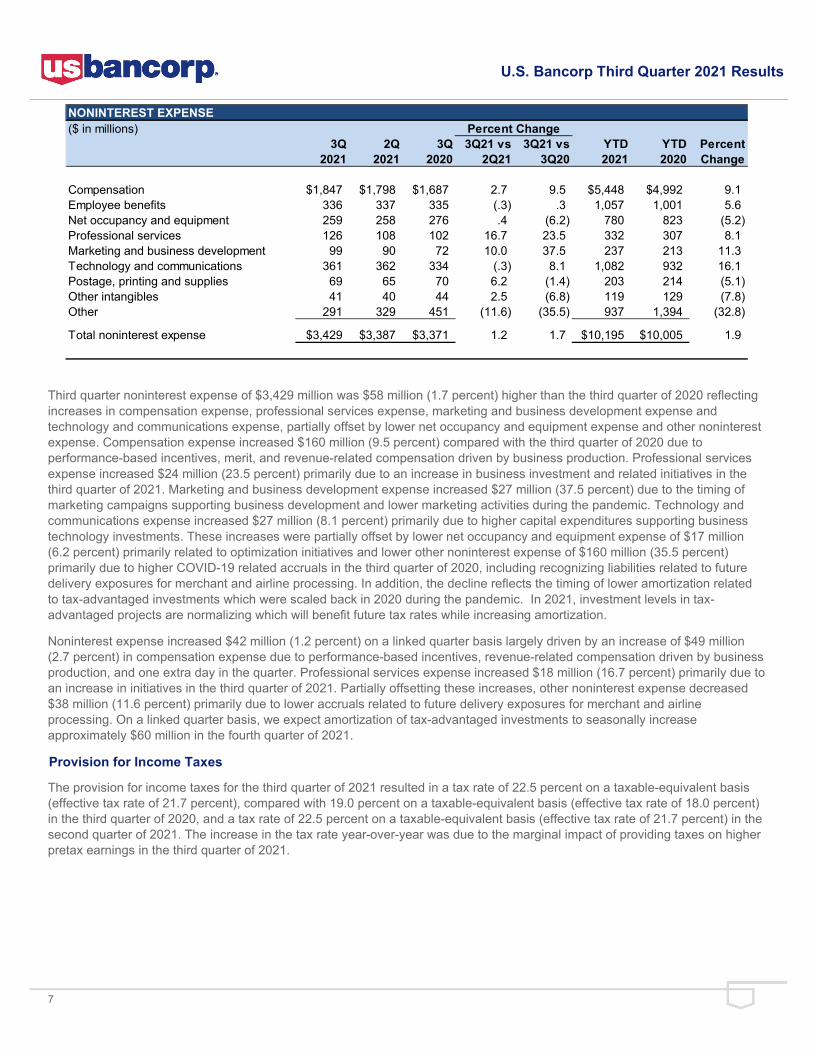
Compensation $1,847 $1,798 $1,687 2.7 9.5 $5,448 $4,992 9.1Employee benefits 336 337 335 (.3) .3 1,057 1,001 5.6Net occupancy and equipment 259 258 276 .4 (6.2) 780 823 (5.2)Professional services 126 108 102 16.7 23.5 332 307 8.1Marketing and business development 99 90 72 10.0 37.5 237 213 11.3Technology and communications 361 362 334 (.3) 8.1 1,082 932 16.1Postage, printing and supplies 69 65 70 6.2 (1.4) 203 214 (5.1)Other intangibles 41 40 44 2.5 (6.8) 119 129 (7.8)Other 291 329 451 (11.6) (35.5) 937 1,394 (32.8) Total noninterest expense $3,429 $3,387 $3,371 1.2 1.7 $10,195 $10,005 1.9
Third quarter noninterest expense of $3,429 million was $58 million (1.7 percent) higher than the third quarter of 2020 reflecting increases in compensation expense, professional services expense, marketing and business development expense and technology and communications expense, partially offset by lower net occupancy and equipment expense and other noninterest expense. Compensation expense increased $160 million (9.5 percent) compared with the third quarter of 2020 due to performance-based incentives, merit, and revenue-related compensation driven by business production. Professional services expense increased $24 million (23.5 percent) primarily due to an increase in business investment and related initiatives in the third quarter of 2021. Marketing and business development expense increased $27 million (37.5 percent) due to the timing of marketing campaigns supporting business development and lower marketing activities during the pandemic. Technology and communications expense increased $27 million (8.1 percent) primarily due to higher capital expenditures supporting business technology investments. These increases were partially offset by lower net occupancy and equipment expense of $17 million (6.2 percent) primarily related to optimization initiatives and lower other noninterest expense of $160 million (35.5 percent) primarily due to higher COVID-19 related accruals in the third quarter of 2020, including recognizing liabilities related to future delivery exposures for merchant and airline processing. In addition, the decline reflects the timing of lower amortization related to tax-advantaged investments which were scaled back in 2020 during the pandemic. In 2021, investment levels in tax-advantaged projects are normalizing which will benefit future tax rates while increasing amortization.
Noninterest expense increased $42 million (1.2 percent) on a linked quarter basis largely driven by an increase of $49 million (2.7 percent) in compensation expense due to performance-based incentives, revenue-related compensation driven by business production, and one extra day in the quarter. Professional services expense increased $18 million (16.7 percent) primarily due to an increase in initiatives in the third quarter of 2021. Partially offsetting these increases, other noninterest expense decreased $38 million (11.6 percent) primarily due to lower accruals related to future delivery exposures for merchant and airline processing. On a linked quarter basis, we expect amortization of tax-advantaged investments to seasonally increase approximately $60 million in the fourth quarter of 2021.
Provision for Income Taxes
The provision for income taxes for the third quarter of 2021 resulted in a tax rate of 22.5 percent on a taxable-equivalent basis (effective tax rate of 21.7 percent), compared with 19.0 percent on a taxable-equivalent basis (effective tax rate of 18.0 percent) in the third quarter of 2020, and a tax rate of 22.5 percent on a taxable-equivalent basis (effective tax rate of 21.7 percent) in the second quarter of 2021. The increase in the tax rate year-over-year was due to the marginal impact of providing taxes on higher pretax earnings in the third quarter of 2021.

8
U.S. Bancorp Third Quarter 2021 Results
ALLOWANCE FOR CREDIT LOSSES($ in millions) 3Q 2Q 1Q 4Q 3Q
2021 % (a) 2021 % (a) 2021 % (a) 2020 % (a) 2020 % (a)Balance, beginning of period $6,610 $6,960 $8,010 $8,010 $7,890Net charge-offs Commercial 13 .05 26 .11 52 .22 142 .56 167 .60 Lease financing 1 .08 1 .08 4 .30 8 .57 11 .78 Total commercial 14 .05 27 .11 56 .22 150 .56 178 .61 Commercial mortgages 1 .01 -- -- (12) (.17) 82 1.12 85 1.13 Construction and development 12 .44 -- -- 5 .19 2 .07 (2) (.07) Total commercial real estate 13 .13 -- -- (7) (.07) 84 .83 83 .81 Residential mortgages (10) (.05) (10) (.05) (5) (.03) (7) (.04) (3) (.02) Credit card 111 2.01 148 2.81 144 2.76 165 2.99 201 3.63 Retail leasing 1 .05 (1) (.05) 1 .05 9 .43 20 .94 Home equity and second mortgages (3) (.11) (3) (.11) (2) (.07) (3) (.09) (2) (.06) Other 21 .20 19 .20 36 .40 43 .48 38 .43 Total other retail 19 .13 15 .10 35 .25 49 .34 56 .39 Total net charge-offs 147 .20 180 .25 223 .31 441 .58 515 .66Provision for credit losses (163) (170) (827) 441 635Balance, end of period $6,300 $6,610 $6,960 $8,010 $8,010Components Allowance for loan losses $5,792 $6,026 $6,343 $7,314 $7,407 Liability for unfunded credit commitments 508 584 617 696 603Total allowance for credit losses $6,300 $6,610 $6,960 $8,010 $8,010Gross charge-offs $266 $314 $374 $556 $611Gross recoveries $119 $134 $151 $115 $96Allowance for credit losses as a percentage of Period-end loans 2.12 2.23 2.36 2.69 2.61 Nonperforming loans 695 649 617 654 678 Nonperforming assets 667 624 579 617 631
(a) Annualized and calculated on average loan balances
9
U.S. Bancorp Third Quarter 2021 Results
The Company’s provision for credit losses for the third quarter of 2021 was a benefit of $163 million, which was $7 million higher than the prior quarter and $798 million lower than the third quarter of 2020. During 2021, factors affecting economic conditions, including passing of additional government stimulus, widespread vaccine availability in the U.S. and reduced levels of new virus cases, have contributed to an economic recovery. However, economic uncertainty remains associated with rising inflationary concerns, additional virus variants and lack of a clear path to government funding. In addition to these factors, expected loss estimates consider various factors including customer specific information impacting changes in risk ratings, projected delinquencies and potential effects of diminishing liquidity without support of mortgage forbearance and direct federal stimulus. Currently, consumer credit trends continue to perform better than expected, while select commercial portfolios continue to be monitored for structural shifts associated with the pandemic.
Total net charge-offs in the third quarter of 2021 were $147 million, compared with $180 million in the second quarter of 2021, and $515 million in the third quarter of 2020. The net charge-off ratio was 0.20 percent in the third quarter of 2021, compared with 0.25 percent in the second quarter of 2021 and 0.66 percent in the third quarter of 2020. Net charge-offs decreased $33 million (18.3 percent) compared with the second quarter of 2021 associated with improving economic conditions, borrower liquidity and strong asset prices in the market that support repayment and recovery on problem loans. Net charge-offs decreased $368 million (71.5 percent) compared with the third quarter of 2020 reflecting improvement across all loan categories.
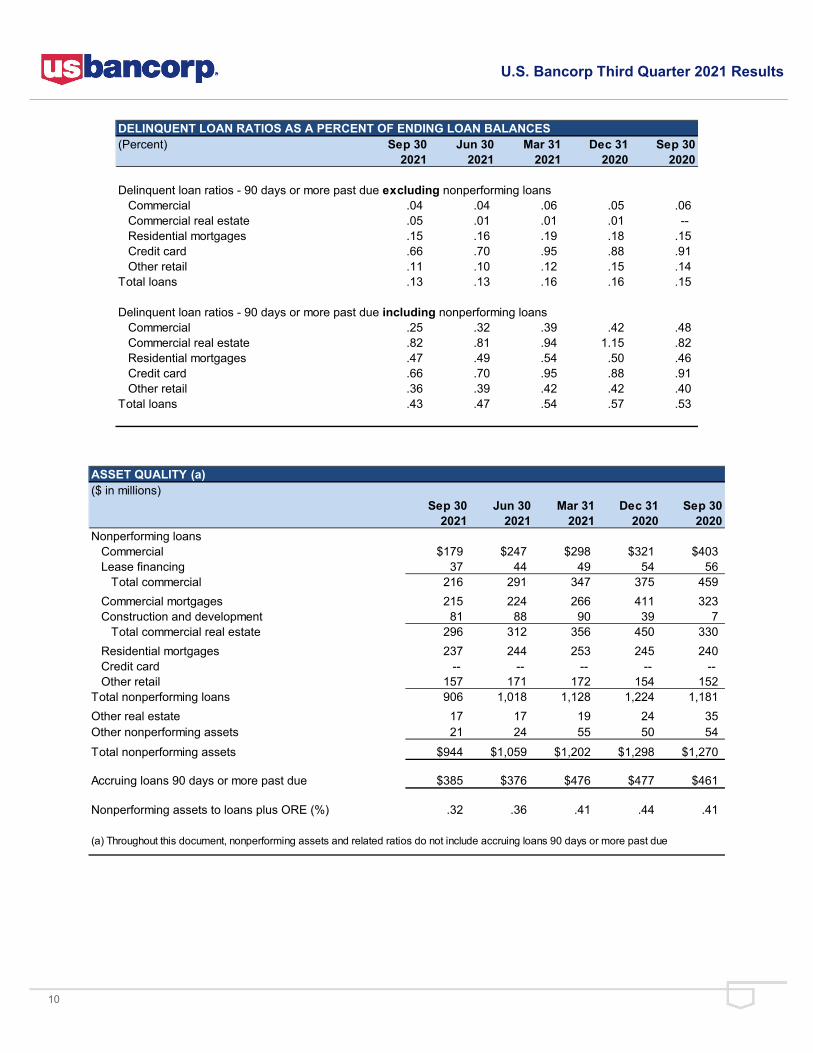
The allowance for credit losses was $6,300 million at September 30, 2021, compared with $6,610 million at June 30, 2021, and $8,010 million at September 30, 2020. The decrease on a linked quarter basis was driven by continued strong credit and collateral performance and incremental improvement in the economy, partially offset by increased economic uncertainty compared with the reserve build during 2020 driven by the concerns associated with the economic impact of COVID-19. The ratio of the allowance for credit losses to period-end loans was 2.12 percent at September 30, 2021, compared with 2.23 percent at June 30, 2021, and 2.61 percent at September 30, 2020. The ratio of the allowance for credit losses to nonperforming loans was 695 percent at September 30, 2021, compared with 649 percent at June 30, 2021, and 678 percent at September 30, 2020.
Nonperforming assets were $944 million at September 30, 2021, compared with $1,059 million at June 30, 2021, and $1,270 million at September 30, 2020. The ratio of nonperforming assets to loans and other real estate was 0.32 percent at September 30, 2021, compared with 0.36 percent at June 30, 2021, and 0.41 percent at September 30, 2020. The year-over-year and linked quarter decrease in nonperforming assets was primarily due to decreases in total commercial nonperforming loans and commercial mortgage nonperforming loans. Accruing loans 90 days or more past due were $385 million at September 30, 2021, compared with $376 million at June 30, 2021, and $461 million at September 30, 2020. The Company expects credit quality to return to more normalized levels over time as the economy rebounds and consumer spending resumes. However, some manageable levels of elevated nonperforming assets in certain industries and loan categories impacted by the pandemic may experience longer recovery periods.
10
U.S. Bancorp Third Quarter 2021 Results
DELINQUENT LOAN RATIOS AS A PERCENT OF ENDING LOAN BALANCES(Percent) Sep 30 Jun 30 Mar 31 Dec 31 Sep 30
2021 2021 2021 2020 2020
Delinquent loan ratios - 90 days or more past due excluding nonperforming loans Commercial .04 .04 .06 .05 .06 Commercial real estate .05 .01 .01 .01 -- Residential mortgages .15 .16 .19 .18 .15 Credit card .66 .70 .95 .88 .91 Other retail .11 .10 .12 .15 .14Total loans .13 .13 .16 .16 .15
Delinquent loan ratios - 90 days or more past due including nonperforming loans Commercial .25 .32 .39 .42 .48 Commercial real estate .82 .81 .94 1.15 .82 Residential mortgages .47 .49 .54 .50 .46 Credit card .66 .70 .95 .88 .91 Other retail .36 .39 .42 .42 .40Total loans .43 .47 .54 .57 .53
ASSET QUALITY (a)($ in millions)
Sep 30 Jun 30 Mar 31 Dec 31 Sep 302021 2021 2021 2020 2020
Nonperforming loans Commercial $179 $247 $298 $321 $403 Lease financing 37 44 49 54 56 Total commercial 216 291 347 375 459 Commercial mortgages 215 224 266 411 323 Construction and development 81 88 90 39 7 Total commercial real estate 296 312 356 450 330 Residential mortgages 237 244 253 245 240 Credit card -- -- -- -- -- Other retail 157 171 172 154 152Total nonperforming loans 906 1,018 1,128 1,224 1,181Other real estate 17 17 19 24 35Other nonperforming assets 21 24 55 50 54Total nonperforming assets $944 $1,059 $1,202 $1,298 $1,270
Accruing loans 90 days or more past due $385 $376 $476 $477 $461
Nonperforming assets to loans plus ORE (%) .32 .36 .41 .44 .41
(a) Throughout this document, nonperforming assets and related ratios do not include accruing loans 90 days or more past due
11
U.S. Bancorp Third Quarter 2021 Results
COMMON SHARES(Millions) 3Q 2Q 1Q 4Q 3Q
2021 2021 2021 2020 2020
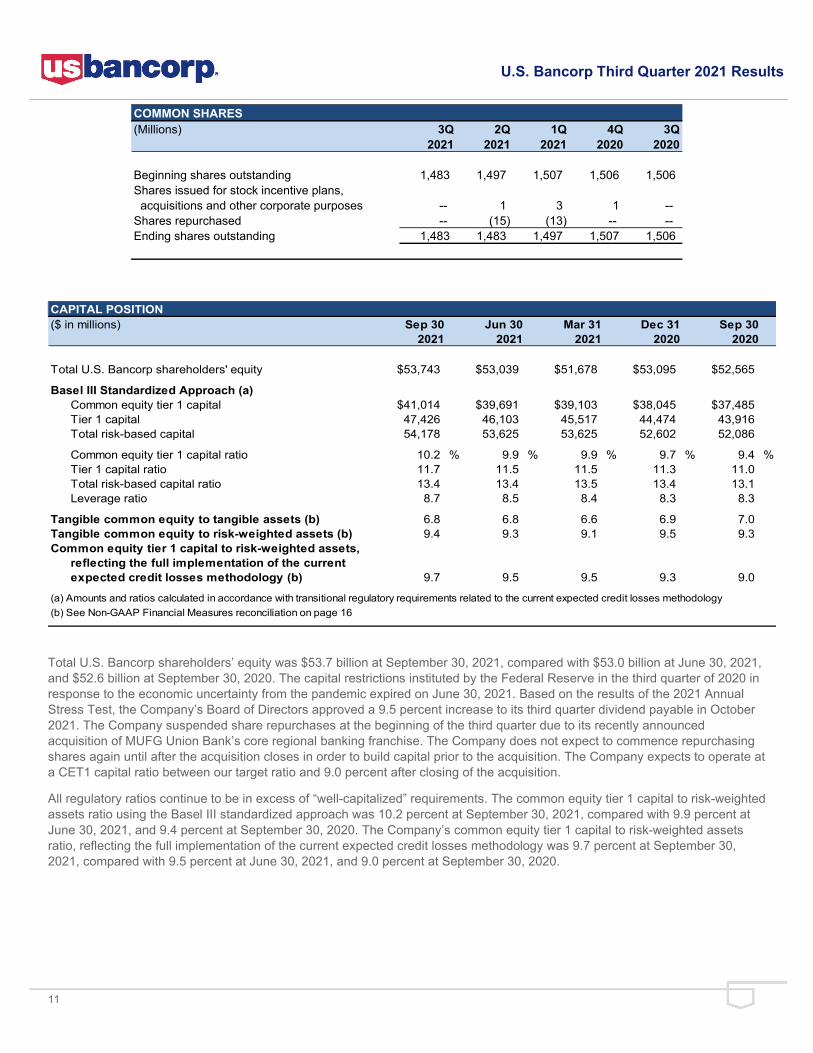
Beginning shares outstanding 1,483 1,497 1,507 1,506 1,506Shares issued for stock incentive plans, acquisitions and other corporate purposes -- 1 3 1 --Shares repurchased -- (15) (13) -- --Ending shares outstanding 1,483 1,483 1,497 1,507 1,506
CAPITAL POSITION($ in millions) Sep 30 Jun 30 Mar 31 Dec 31 Sep 30
2021 2021 2021 2020 2020
Total U.S. Bancorp shareholders' equity $53,743 $53,039 $51,678 $53,095 $52,565
Basel III Standardized Approach (a) Common equity tier 1 capital $41,014 $39,691 $39,103 $38,045 $37,485 Tier 1 capital 47,426 46,103 45,517 44,474 43,916 Total risk-based capital 54,178 53,625 53,625 52,602 52,086
Common equity tier 1 capital ratio 10.2 % 9.9 % 9.9 % 9.7 % 9.4 % Tier 1 capital ratio 11.7 11.5 11.5 11.3 11.0 Total risk-based capital ratio 13.4 13.4 13.5 13.4 13.1 Leverage ratio 8.7 8.5 8.4 8.3 8.3
Tangible common equity to tangible assets (b) 6.8 6.8 6.6 6.9 7.0Tangible common equity to risk-weighted assets (b) 9.4 9.3 9.1 9.5 9.3Common equity tier 1 capital to risk-weighted assets,
reflecting the full implementation of the current expected credit losses methodology (b) 9.7 9.5 9.5 9.3 9.0
(a) Amounts and ratios calculated in accordance with transitional regulatory requirements related to the current expected credit losses methodology (b) See Non-GAAP Financial Measures reconciliation on page 16
Total U.S. Bancorp shareholders’ equity was $53.7 billion at September 30, 2021, compared with $53.0 billion at June 30, 2021, and $52.6 billion at September 30, 2020. The capital restrictions instituted by the Federal Reserve in the third quarter of 2020 in response to the economic uncertainty from the pandemic expired on June 30, 2021. Based on the results of the 2021 Annual Stress Test, the Company’s Board of Directors approved a 9.5 percent increase to its third quarter dividend payable in October 2021. The Company suspended share repurchases at the beginning of the third quarter due to its recently announced acquisition of MUFG Union Bank’s core regional banking franchise. The Company does not expect to commence repurchasing shares again until after the acquisition closes in order to build capital prior to the acquisition. The Company expects to operate at a CET1 capital ratio between our target ratio and 9.0 percent after closing of the acquisition.
All regulatory ratios continue to be in excess of “well-capitalized” requirements. The common equity tier 1 capital to risk-weighted assets ratio using the Basel III standardized approach was 10.2 percent at September 30, 2021, compared with 9.9 percent at June 30, 2021, and 9.4 percent at September 30, 2020. The Company’s common equity tier 1 capital to risk-weighted assets ratio, reflecting the full implementation of the current expected credit losses methodology was 9.7 percent at September 30, 2021, compared with 9.5 percent at June 30, 2021, and 9.0 percent at September 30, 2020.
12
U.S. Bancorp Third Quarter 2021 Results
On Thursday, October 14, 2021, at 7 a.m. CT, Chairman, President and Chief Executive Officer Andy Cecere and Vice Chair and Chief Financial Officer Terry Dolan will host a conference call to review the financial results. The conference call will be available online or by telephone. To access the webcast and presentation, visit U.S. Bancorp’s website at usbank.com and click on “About Us,” “Investor Relations” and “Webcasts & Presentations.” To access the conference call from locations within the United States and Canada, please dial 866.316.1409. Participants calling from outside the United States and Canada, please dial 706.634.9086. The conference ID number for all participants is 7689764. For those unable to participate during the live call, a recording will be available at approximately 10 a.m. CT on Thursday, October 14 and will be accessible until Thursday, October 21 at 10:59 p.m. CT. To access the recorded message within the United States and Canada, please dial 855.859.2056. If calling from outside the United States and Canada, please dial 404.537.3406 to access the recording. The conference ID is 7689764.
U.S. Bancorp, with nearly 70,000 employees and $567 billion in assets as of September 30, 2021, is the parent company of U.S. Bank National Association. The Minneapolis-based company serves millions of customers locally, nationally and globally through a diversified mix of businesses: Consumer and Business Banking; Payment Services; Corporate & Commercial Banking; and Wealth Management and Investment Services. The company has been recognized for its approach to digital innovation, social responsibility, and customer service, including being named one of the 2021 World’s Most Ethical Companies and Fortune’s most admired superregional bank. Learn more at usbank.com/about.
“Safe Harbor” Statement under the Private Securities Litigation Reform Act of 1995:
This press release contains forward-looking statements about U.S. Bancorp. Statements that are not historical or current facts, including statements about beliefs and expectations, are forward-looking statements and are based on the information available to, and assumptions and estimates made by, management as of the date hereof. These forward-looking statements cover, among other things, anticipated future revenue and expenses and the future plans and prospects of U.S. Bancorp. Forward-looking statements involve inherent risks and uncertainties, and important factors could cause actual results to differ materially from those anticipated. The COVID-19 pandemic is adversely affecting U.S. Bancorp, its customers, counterparties, employees, and third-party service providers, and the ultimate extent of the impacts on its business, financial position, results of operations, liquidity, and prospects is uncertain. Continued deterioration in general business and economic conditions or turbulence in domestic or global financial markets could adversely affect U.S. Bancorp’s revenues and the values of its assets and liabilities, reduce the availability of funding to certain financial institutions, lead to a tightening of credit, and increase stock price volatility. In addition, changes to statutes, regulations, or regulatory policies or practices could affect U.S. Bancorp in substantial and unpredictable ways. U.S. Bancorp’s results could also be adversely affected by changes in interest rates; further increases in unemployment rates; deterioration in the credit quality of its loan portfolios or in the value of the collateral securing those loans; deterioration in the value of its investment securities; legal and regulatory developments; litigation; increased competition from both banks and non-banks; civil unrest; changes in customer behavior and preferences; breaches in data security, including as a result of work-from-home arrangements; failures to safeguard personal information; effects of mergers and acquisitions and related integration; effects of critical accounting policies and judgments; and management’s ability to effectively manage credit risk, market risk, operational risk, compliance risk, strategic risk, interest rate risk, liquidity risk and reputation risk. In addition, U.S. Bancorp’s proposed acquisition of MUFG Union Bank presents risks and uncertainties, including, among others: the risk that the cost savings, any revenue synergies and other anticipated benefits of the proposed acquisition may not be realized or may take longer than anticipated to be realized; the possibility that the proposed acquisition, including the integration of MUFG Union Bank, may be more costly or difficult to complete than anticipated; delays in closing the proposed acquisition; and the failure of required governmental approvals to be obtained or any other closing conditions in the definitive purchase agreement to be satisfied.
About U.S. Bancorp
Investor Conference Call
Forward-looking Statements
13
U.S. Bancorp Third Quarter 2021 Results
For discussion of these and other risks that may cause actual results to differ from expectations, refer to U.S. Bancorp’s Annual Report on Form 10-K for the year ended December 31, 2020, on file with the Securities and Exchange Commission, including the sections entitled “Corporate Risk Profile” and “Risk Factors” contained in Exhibit 13, and all subsequent filings with the Securities and Exchange Commission under Sections 13(a), 13(c), 14 or 15(d) of the Securities Exchange Act of 1934. In addition, factors other than these risks also could adversely affect U.S. Bancorp’s results, and the reader should not consider these risks to be a complete set of all potential risks or uncertainties. Forward-looking statements speak only as of the date hereof, and U.S. Bancorp undertakes no obligation to update them in light of new information or future events.
In addition to capital ratios defined by banking regulators, the Company considers various other measures when evaluating capital utilization and adequacy, including:
• Tangible common equity to tangible assets • Tangible common equity to risk-weighted assets • Common equity tier 1 capital to risk-weighted assets, reflecting the full implementation of the current expected credit losses
methodology, and • Return on tangible common equity.
These capital measures are viewed by management as useful additional methods of evaluating the Company’s utilization of its capital held and the level of capital available to withstand unexpected negative market or economic conditions. Additionally, presentation of these measures allows investors, analysts and banking regulators to assess the Company’s capital position relative to other financial services companies. These capital measures are not defined in generally accepted accounting principles (“GAAP”), or are not currently effective or defined in banking regulations. In addition, certain of these measures differ from currently effective capital ratios defined by banking regulations principally in that the currently effective ratios, which are subject to certain transitional provisions, temporarily exclude the impact of the 2020 adoption of accounting guidance related to impairment of financial instruments based on the current expected credit losses methodology. As a result, these capital measures disclosed by the Company may be considered non-GAAP financial measures. Management believes this information helps investors assess trends in the Company’s capital adequacy.
The Company also discloses net interest income and related ratios and analysis on a taxable-equivalent basis, which may also be considered non-GAAP financial measures. The Company believes this presentation to be the preferred industry measurement of net interest income as it provides a relevant comparison of net interest income arising from taxable and tax-exempt sources. In addition, certain performance measures, including the efficiency ratio and net interest margin utilize net interest income on a taxable-equivalent basis.
There may be limits in the usefulness of these measures to investors. As a result, the Company encourages readers to consider the consolidated financial statements and other financial information contained in this press release in their entirety, and not to rely on any single financial measure. A table follows that shows the Company’s calculation of these non-GAAP financial measures.
Non-GAAP Financial Measures
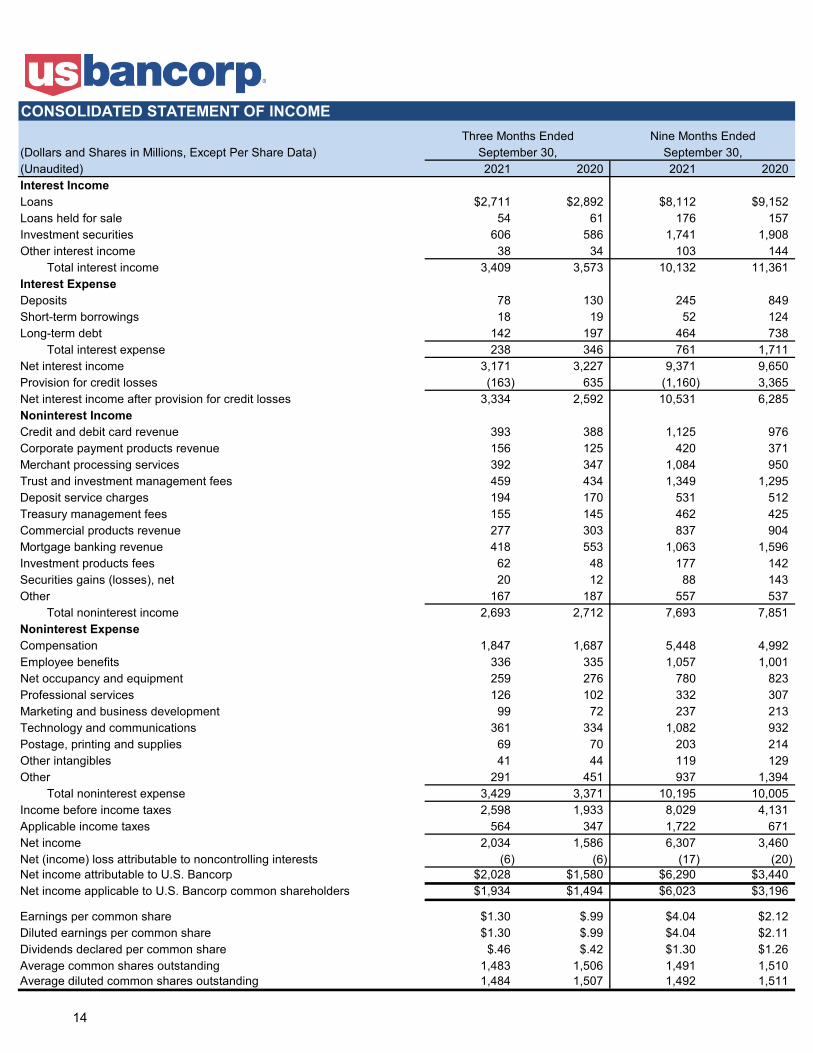
Three Months Ended Nine Months Ended(Dollars and Shares in Millions, Except Per Share Data) September 30, September 30,(Unaudited) 2021 2020 2021 2020Interest Income Loans $2,711 $2,892 $8,112 $9,152Loans held for sale 54 61 176 157Investment securities 606 586 1,741 1,908Other interest income 38 34 103 144 Total interest income 3,409 3,573 10,132 11,361Interest Expense Deposits 78 130 245 849Short-term borrowings 18 19 52 124Long-term debt 142 197 464 738 Total interest expense 238 346 761 1,711Net interest income 3,171 3,227 9,371 9,650Provision for credit losses (163) 635 (1,160) 3,365Net interest income after provision for credit losses 3,334 2,592 10,531 6,285Noninterest Income Credit and debit card revenue 393 388 1,125 976Corporate payment products revenue 156 125 420 371Merchant processing services 392 347 1,084 950Trust and investment management fees 459 434 1,349 1,295Deposit service charges 194 170 531 512Treasury management fees 155 145 462 425Commercial products revenue 277 303 837 904Mortgage banking revenue 418 553 1,063 1,596Investment products fees 62 48 177 142Securities gains (losses), net 20 12 88 143Other 167 187 557 537 Total noninterest income 2,693 2,712 7,693 7,851Noninterest Expense Compensation 1,847 1,687 5,448 4,992Employee benefits 336 335 1,057 1,001Net occupancy and equipment 259 276 780 823Professional services 126 102 332 307Marketing and business development 99 72 237 213Technology and communications 361 334 1,082 932Postage, printing and supplies 69 70 203 214Other intangibles 41 44 119 129Other 291 451 937 1,394 Total noninterest expense 3,429 3,371 10,195 10,005Income before income taxes 2,598 1,933 8,029 4,131Applicable income taxes 564 347 1,722 671Net income 2,034 1,586 6,307 3,460Net (income) loss attributable to noncontrolling interests (6) (6) (17) (20)Net income attributable to U.S. Bancorp $2,028 $1,580 $6,290 $3,440Net income applicable to U.S. Bancorp common shareholders $1,934 $1,494 $6,023 $3,196
Earnings per common share $1.30 $.99 $4.04 $2.12Diluted earnings per common share $1.30 $.99 $4.04 $2.11Dividends declared per common share $.46 $.42 $1.30 $1.26Average common shares outstanding 1,483 1,506 1,491 1,510Average diluted common shares outstanding 1,484 1,507 1,492 1,511
CONSOLIDATED STATEMENT OF INCOME
14
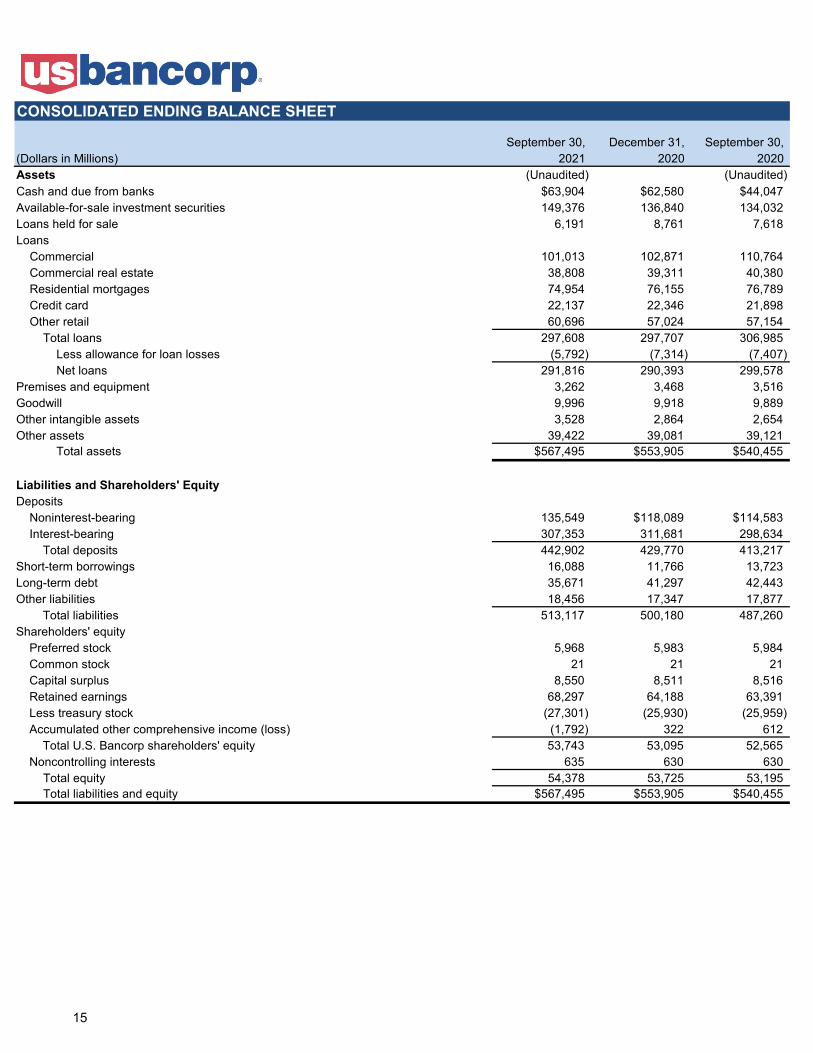
September 30, December 31, September 30, (Dollars in Millions) 2021 2020 2020 Assets (Unaudited) (Unaudited)Cash and due from banks $63,904 $62,580 $44,047Available-for-sale investment securities 149,376 136,840 134,032Loans held for sale 6,191 8,761 7,618Loans Commercial 101,013 102,871 110,764 Commercial real estate 38,808 39,311 40,380 Residential mortgages 74,954 76,155 76,789 Credit card 22,137 22,346 21,898 Other retail 60,696 57,024 57,154 Total loans 297,608 297,707 306,985 Less allowance for loan losses (5,792) (7,314) (7,407) Net loans 291,816 290,393 299,578Premises and equipment 3,262 3,468 3,516Goodwill 9,996 9,918 9,889Other intangible assets 3,528 2,864 2,654Other assets 39,422 39,081 39,121 Total assets $567,495 $553,905 $540,455
Liabilities and Shareholders' Equity Deposits Noninterest-bearing 135,549 $118,089 $114,583 Interest-bearing 307,353 311,681 298,634 Total deposits 442,902 429,770 413,217Short-term borrowings 16,088 11,766 13,723Long-term debt 35,671 41,297 42,443Other liabilities 18,456 17,347 17,877 Total liabilities 513,117 500,180 487,260Shareholders' equity Preferred stock 5,968 5,983 5,984 Common stock 21 21 21 Capital surplus 8,550 8,511 8,516 Retained earnings 68,297 64,188 63,391 Less treasury stock (27,301) (25,930) (25,959) Accumulated other comprehensive income (loss) (1,792) 322 612 Total U.S. Bancorp shareholders' equity 53,743 53,095 52,565 Noncontrolling interests 635 630 630 Total equity 54,378 53,725 53,195 Total liabilities and equity $567,495 $553,905 $540,455
CONSOLIDATED ENDING BALANCE SHEET
15
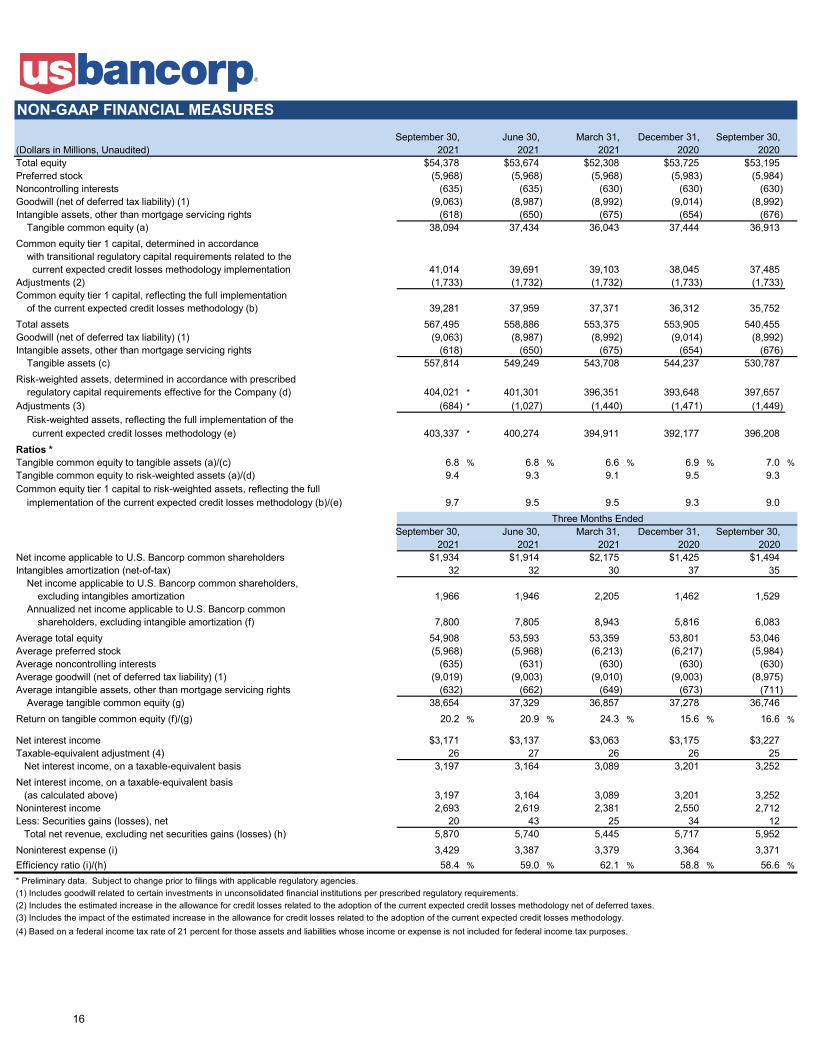
September 30, June 30, March 31, December 31, September 30, (Dollars in Millions, Unaudited) 2021 2021 2021 2020 2020Total equity $54,378 $53,674 $52,308 $53,725 $53,195Preferred stock (5,968) (5,968) (5,968) (5,983) (5,984)Noncontrolling interests (635) (635) (630) (630) (630)Goodwill (net of deferred tax liability) (1) (9,063) (8,987) (8,992) (9,014) (8,992)Intangible assets, other than mortgage servicing rights (618) (650) (675) (654) (676) Tangible common equity (a) 38,094 37,434 36,043 37,444 36,913Common equity tier 1 capital, determined in accordance with transitional regulatory capital requirements related to the current expected credit losses methodology implementation 41,014 39,691 39,103 38,045 37,485Adjustments (2) (1,733) (1,732) (1,732) (1,733) (1,733)Common equity tier 1 capital, reflecting the full implementation of the current expected credit losses methodology (b) 39,281 37,959 37,371 36,312 35,752Total assets 567,495 558,886 553,375 553,905 540,455Goodwill (net of deferred tax liability) (1) (9,063) (8,987) (8,992) (9,014) (8,992)Intangible assets, other than mortgage servicing rights (618) (650) (675) (654) (676) Tangible assets (c) 557,814 549,249 543,708 544,237 530,787Risk-weighted assets, determined in accordance with prescribed regulatory capital requirements effective for the Company (d) 404,021 * 401,301 396,351 393,648 397,657Adjustments (3) (684) * (1,027) (1,440) (1,471) (1,449) Risk-weighted assets, reflecting the full implementation of the current expected credit losses methodology (e) 403,337 * 400,274 394,911 392,177 396,208Ratios *Tangible common equity to tangible assets (a)/(c) 6.8 % 6.8 % 6.6 % 6.9 % 7.0 %Tangible common equity to risk-weighted assets (a)/(d) 9.4 9.3 9.1 9.5 9.3 Common equity tier 1 capital to risk-weighted assets, reflecting the full implementation of the current expected credit losses methodology (b)/(e) 9.7 9.5 9.5 9.3 9.0
September 30, June 30, March 31, December 31, September 30, 2021 2021 2021 2020 2020
Net income applicable to U.S. Bancorp common shareholders $1,934 $1,914 $2,175 $1,425 $1,494Intangibles amortization (net-of-tax) 32 32 30 37 35 Net income applicable to U.S. Bancorp common shareholders, excluding intangibles amortization 1,966 1,946 2,205 1,462 1,529 Annualized net income applicable to U.S. Bancorp common shareholders, excluding intangible amortization (f) 7,800 7,805 8,943 5,816 6,083Average total equity 54,908 53,593 53,359 53,801 53,046Average preferred stock (5,968) (5,968) (6,213) (6,217) (5,984)Average noncontrolling interests (635) (631) (630) (630) (630)Average goodwill (net of deferred tax liability) (1) (9,019) (9,003) (9,010) (9,003) (8,975)Average intangible assets, other than mortgage servicing rights (632) (662) (649) (673) (711) Average tangible common equity (g) 38,654 37,329 36,857 37,278 36,746Return on tangible common equity (f)/(g) 20.2 % 20.9 % 24.3 % 15.6 % 16.6 %
Net interest income $3,171 $3,137 $3,063 $3,175 $3,227Taxable-equivalent adjustment (4) 26 27 26 26 25 Net interest income, on a taxable-equivalent basis 3,197 3,164 3,089 3,201 3,252Net interest income, on a taxable-equivalent basis (as calculated above) 3,197 3,164 3,089 3,201 3,252Noninterest income 2,693 2,619 2,381 2,550 2,712Less: Securities gains (losses), net 20 43 25 34 12 Total net revenue, excluding net securities gains (losses) (h) 5,870 5,740 5,445 5,717 5,952Noninterest expense (i) 3,429 3,387 3,379 3,364 3,371Efficiency ratio (i)/(h) 58.4 % 59.0 % 62.1 % 58.8 % 56.6 %
* Preliminary data. Subject to change prior to filings with applicable regulatory agencies. (1) Includes goodwill related to certain investments in unconsolidated financial institutions per prescribed regulatory requirements.(2) Includes the estimated increase in the allowance for credit losses related to the adoption of the current expected credit losses methodology net of deferred taxes.(3) Includes the impact of the estimated increase in the allowance for credit losses related to the adoption of the current expected credit losses methodology.(4) Based on a federal income tax rate of 21 percent for those assets and liabilities whose income or expense is not included for federal income tax purposes.
NON-GAAP FINANCIAL MEASURES
Three Months Ended
16
Supplemental Consolidated
Schedules 3Q 2021
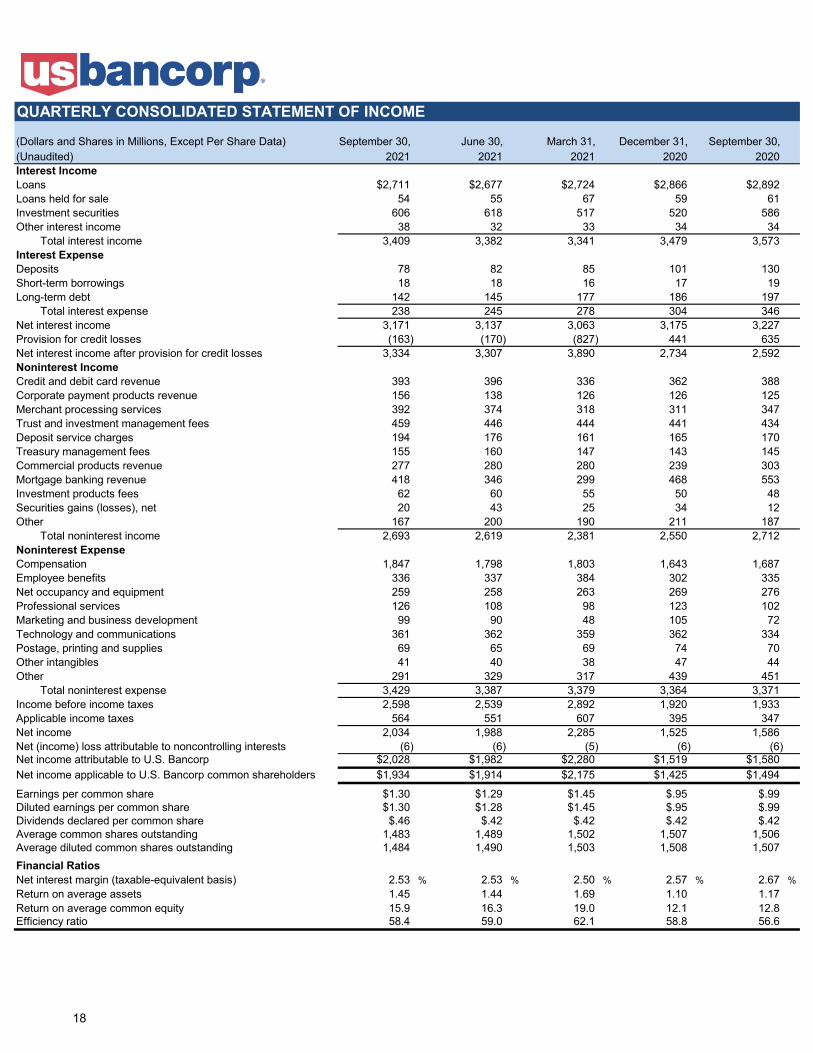
(Dollars and Shares in Millions, Except Per Share Data) September 30, June 30, March 31, December 31, September 30, (Unaudited) 2021 2021 2021 2020 2020Interest Income Loans $2,711 $2,677 $2,724 $2,866 $2,892Loans held for sale 54 55 67 59 61Investment securities 606 618 517 520 586Other interest income 38 32 33 34 34 Total interest income 3,409 3,382 3,341 3,479 3,573Interest Expense Deposits 78 82 85 101 130Short-term borrowings 18 18 16 17 19Long-term debt 142 145 177 186 197 Total interest expense 238 245 278 304 346Net interest income 3,171 3,137 3,063 3,175 3,227Provision for credit losses (163) (170) (827) 441 635Net interest income after provision for credit losses 3,334 3,307 3,890 2,734 2,592Noninterest Income Credit and debit card revenue 393 396 336 362 388Corporate payment products revenue 156 138 126 126 125Merchant processing services 392 374 318 311 347Trust and investment management fees 459 446 444 441 434Deposit service charges 194 176 161 165 170Treasury management fees 155 160 147 143 145Commercial products revenue 277 280 280 239 303Mortgage banking revenue 418 346 299 468 553Investment products fees 62 60 55 50 48Securities gains (losses), net 20 43 25 34 12Other 167 200 190 211 187 Total noninterest income 2,693 2,619 2,381 2,550 2,712Noninterest Expense Compensation 1,847 1,798 1,803 1,643 1,687Employee benefits 336 337 384 302 335Net occupancy and equipment 259 258 263 269 276Professional services 126 108 98 123 102Marketing and business development 99 90 48 105 72Technology and communications 361 362 359 362 334Postage, printing and supplies 69 65 69 74 70Other intangibles 41 40 38 47 44Other 291 329 317 439 451 Total noninterest expense 3,429 3,387 3,379 3,364 3,371Income before income taxes 2,598 2,539 2,892 1,920 1,933Applicable income taxes 564 551 607 395 347Net income 2,034 1,988 2,285 1,525 1,586Net (income) loss attributable to noncontrolling interests (6) (6) (5) (6) (6)Net income attributable to U.S. Bancorp $2,028 $1,982 $2,280 $1,519 $1,580Net income applicable to U.S. Bancorp common shareholders $1,934 $1,914 $2,175 $1,425 $1,494
Earnings per common share $1.30 $1.29 $1.45 $.95 $.99Diluted earnings per common share $1.30 $1.28 $1.45 $.95 $.99Dividends declared per common share $.46 $.42 $.42 $.42 $.42Average common shares outstanding 1,483 1,489 1,502 1,507 1,506Average diluted common shares outstanding 1,484 1,490 1,503 1,508 1,507Financial Ratios Net interest margin (taxable-equivalent basis) 2.53 % 2.53 % 2.50 % 2.57 % 2.67 %Return on average assets 1.45 1.44 1.69 1.10 1.17Return on average common equity 15.9 16.3 19.0 12.1 12.8Efficiency ratio 58.4 59.0 62.1 58.8 56.6
QUARTERLY CONSOLIDATED STATEMENT OF INCOME
18
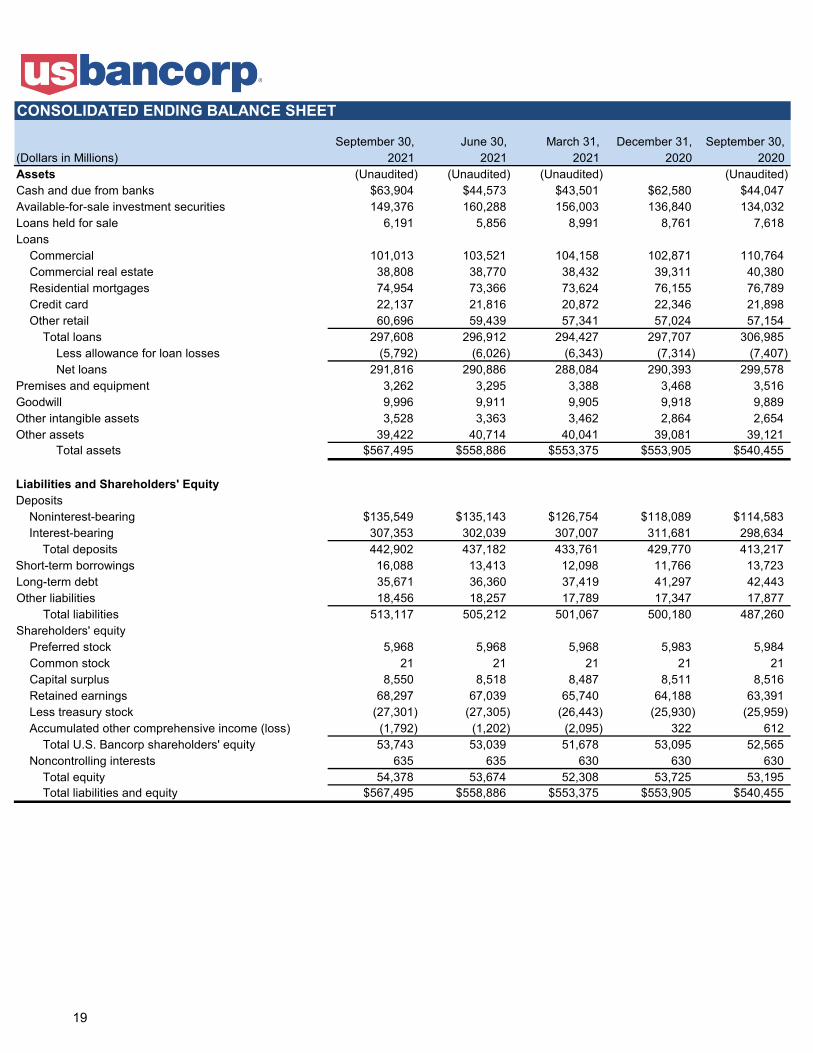
September 30, June 30, March 31, December 31, September 30, (Dollars in Millions) 2021 2021 2021 2020 2020 Assets (Unaudited) (Unaudited) (Unaudited) (Unaudited)Cash and due from banks $63,904 $44,573 $43,501 $62,580 $44,047Available-for-sale investment securities 149,376 160,288 156,003 136,840 134,032Loans held for sale 6,191 5,856 8,991 8,761 7,618Loans Commercial 101,013 103,521 104,158 102,871 110,764 Commercial real estate 38,808 38,770 38,432 39,311 40,380 Residential mortgages 74,954 73,366 73,624 76,155 76,789 Credit card 22,137 21,816 20,872 22,346 21,898 Other retail 60,696 59,439 57,341 57,024 57,154 Total loans 297,608 296,912 294,427 297,707 306,985 Less allowance for loan losses (5,792) (6,026) (6,343) (7,314) (7,407) Net loans 291,816 290,886 288,084 290,393 299,578Premises and equipment 3,262 3,295 3,388 3,468 3,516Goodwill 9,996 9,911 9,905 9,918 9,889Other intangible assets 3,528 3,363 3,462 2,864 2,654Other assets 39,422 40,714 40,041 39,081 39,121 Total assets $567,495 $558,886 $553,375 $553,905 $540,455
Liabilities and Shareholders' Equity Deposits Noninterest-bearing $135,549 $135,143 $126,754 $118,089 $114,583 Interest-bearing 307,353 302,039 307,007 311,681 298,634 Total deposits 442,902 437,182 433,761 429,770 413,217Short-term borrowings 16,088 13,413 12,098 11,766 13,723Long-term debt 35,671 36,360 37,419 41,297 42,443Other liabilities 18,456 18,257 17,789 17,347 17,877 Total liabilities 513,117 505,212 501,067 500,180 487,260Shareholders' equity Preferred stock 5,968 5,968 5,968 5,983 5,984 Common stock 21 21 21 21 21 Capital surplus 8,550 8,518 8,487 8,511 8,516 Retained earnings 68,297 67,039 65,740 64,188 63,391 Less treasury stock (27,301) (27,305) (26,443) (25,930) (25,959) Accumulated other comprehensive income (loss) (1,792) (1,202) (2,095) 322 612 Total U.S. Bancorp shareholders' equity 53,743 53,039 51,678 53,095 52,565 Noncontrolling interests 635 635 630 630 630 Total equity 54,378 53,674 52,308 53,725 53,195 Total liabilities and equity $567,495 $558,886 $553,375 $553,905 $540,455
CONSOLIDATED ENDING BALANCE SHEET
19
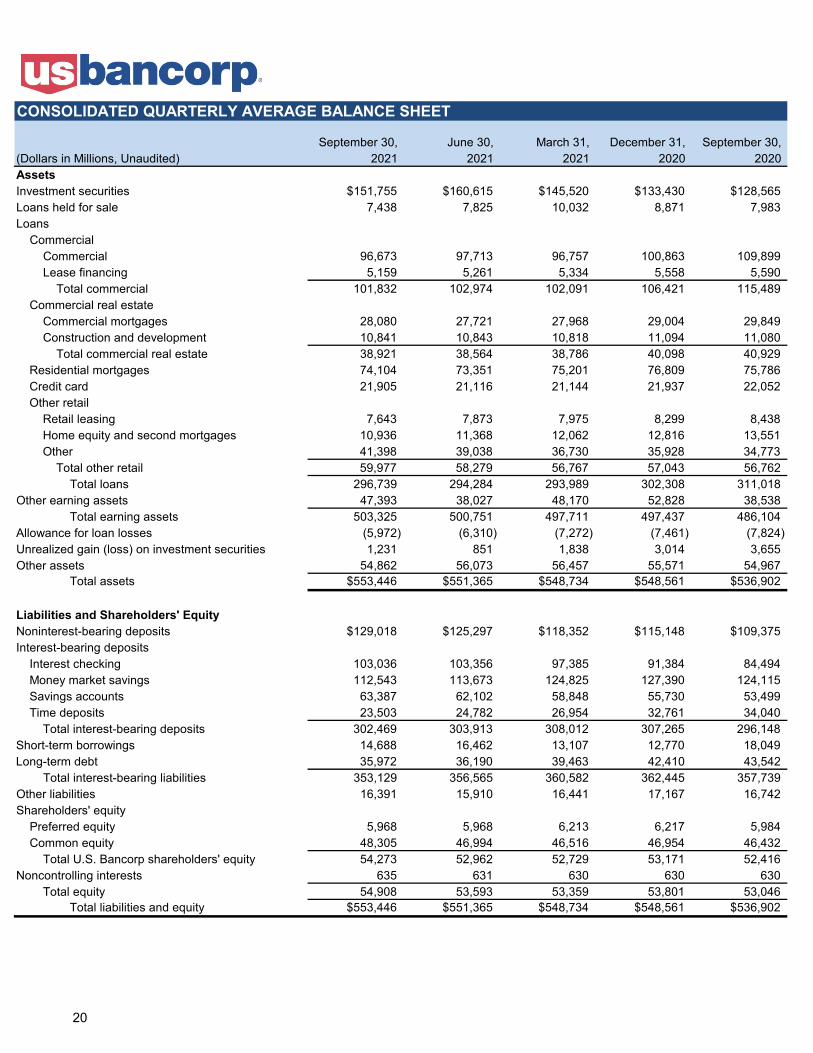
September 30, June 30, March 31, December 31, September 30, (Dollars in Millions, Unaudited) 2021 2021 2021 2020 2020 Assets Investment securities $151,755 $160,615 $145,520 $133,430 $128,565Loans held for sale 7,438 7,825 10,032 8,871 7,983Loans Commercial Commercial 96,673 97,713 96,757 100,863 109,899 Lease financing 5,159 5,261 5,334 5,558 5,590 Total commercial 101,832 102,974 102,091 106,421 115,489 Commercial real estate Commercial mortgages 28,080 27,721 27,968 29,004 29,849 Construction and development 10,841 10,843 10,818 11,094 11,080 Total commercial real estate 38,921 38,564 38,786 40,098 40,929 Residential mortgages 74,104 73,351 75,201 76,809 75,786 Credit card 21,905 21,116 21,144 21,937 22,052 Other retail Retail leasing 7,643 7,873 7,975 8,299 8,438 Home equity and second mortgages 10,936 11,368 12,062 12,816 13,551 Other 41,398 39,038 36,730 35,928 34,773 Total other retail 59,977 58,279 56,767 57,043 56,762 Total loans 296,739 294,284 293,989 302,308 311,018 Other earning assets 47,393 38,027 48,170 52,828 38,538 Total earning assets 503,325 500,751 497,711 497,437 486,104 Allowance for loan losses (5,972) (6,310) (7,272) (7,461) (7,824) Unrealized gain (loss) on investment securities 1,231 851 1,838 3,014 3,655 Other assets 54,862 56,073 56,457 55,571 54,967 Total assets $553,446 $551,365 $548,734 $548,561 $536,902
Liabilities and Shareholders' Equity Noninterest-bearing deposits $129,018 $125,297 $118,352 $115,148 $109,375Interest-bearing deposits Interest checking 103,036 103,356 97,385 91,384 84,494 Money market savings 112,543 113,673 124,825 127,390 124,115 Savings accounts 63,387 62,102 58,848 55,730 53,499 Time deposits 23,503 24,782 26,954 32,761 34,040 Total interest-bearing deposits 302,469 303,913 308,012 307,265 296,148 Short-term borrowings 14,688 16,462 13,107 12,770 18,049 Long-term debt 35,972 36,190 39,463 42,410 43,542 Total interest-bearing liabilities 353,129 356,565 360,582 362,445 357,739 Other liabilities 16,391 15,910 16,441 17,167 16,742 Shareholders' equity Preferred equity 5,968 5,968 6,213 6,217 5,984 Common equity 48,305 46,994 46,516 46,954 46,432 Total U.S. Bancorp shareholders' equity 54,273 52,962 52,729 53,171 52,416 Noncontrolling interests 635 631 630 630 630 Total equity 54,908 53,593 53,359 53,801 53,046 Total liabilities and equity $553,446 $551,365 $548,734 $548,561 $536,902
CONSOLIDATED QUARTERLY AVERAGE BALANCE SHEET
20

For the Three Months Ended September 30,2021 2020
Yields Yields (Dollars in Millions) Average and Average and (Unaudited) Balances Interest Rates Balances Interest Rates Assets Investment securities $151,755 $624 1.64 % $128,565 $602 1.87 % 18.0 %Loans held for sale 7,438 54 2.92 7,983 61 3.06 (6.8)Loans (b) Commercial 101,832 711 2.77 115,489 718 2.48 (11.8) Commercial real estate 38,921 303 3.09 40,929 341 3.31 (4.9) Residential mortgages 74,104 604 3.25 75,786 687 3.62 (2.2) Credit card 21,905 569 10.30 22,052 583 10.51 (.7) Other retail 59,977 532 3.52 56,762 572 4.01 5.7 Total loans 296,739 2,719 3.64 311,018 2,901 3.72 (4.6)Other earning assets 47,393 38 .31 38,538 34 .35 23.0 Total earning assets 503,325 3,435 2.72 486,104 3,598 2.95 3.5Allowance for loan losses (5,972) (7,824) 23.7Unrealized gain (loss) on investment securities 1,231 3,655 (66.3)Other assets 54,862 54,967 (.2) Total assets $553,446 $536,902 3.1
Liabilities and Shareholders' Equity Noninterest-bearing deposits $129,018 $109,375 18.0 %Interest-bearing deposits Interest checking 103,036 5 .02 84,494 7 .04 21.9 Money market savings 112,543 50 .17 124,115 68 .22 (9.3) Savings accounts 63,387 2 .01 53,499 5 .04 18.5 Time deposits 23,503 21 .35 34,040 50 .58 (31.0) Total interest-bearing deposits 302,469 78 .10 296,148 130 .17 2.1Short-term borrowings 14,688 18 .49 18,049 19 .43 (18.6)Long-term debt 35,972 142 1.57 43,542 197 1.80 (17.4) Total interest-bearing liabilities 353,129 238 .27 357,739 346 .39 (1.3)Other liabilities 16,391 16,742 (2.1)Shareholders' equity Preferred equity 5,968 5,984 (.3) Common equity 48,305 46,432 4.0 Total U.S. Bancorp shareholders' equity 54,273 52,416 3.5 Noncontrolling interests 635 630 .8 Total equity 54,908 53,046 3.5 Total liabilities and equity $553,446 $536,902 3.1Net interest income $3,197 $3,252Gross interest margin 2.45 % 2.56 %Gross interest margin without taxable-equivalent increments 2.43 2.54
Percent of Earning Assets Interest income 2.72 % 2.95 %Interest expense .19 .28Net interest margin 2.53 % 2.67 %Net interest margin without taxable-equivalent increments 2.51 % 2.65 %
(a) Interest and rates are presented on a fully taxable-equivalent basis based on a federal income tax rate of 21 percent. (b) Interest income and rates on loans include loan fees. Nonaccrual loans are included in average loan balances.
CONSOLIDATED DAILY AVERAGE BALANCE SHEET AND RELATED YIELDS AND RATES (a)
% Change Average Balances
21
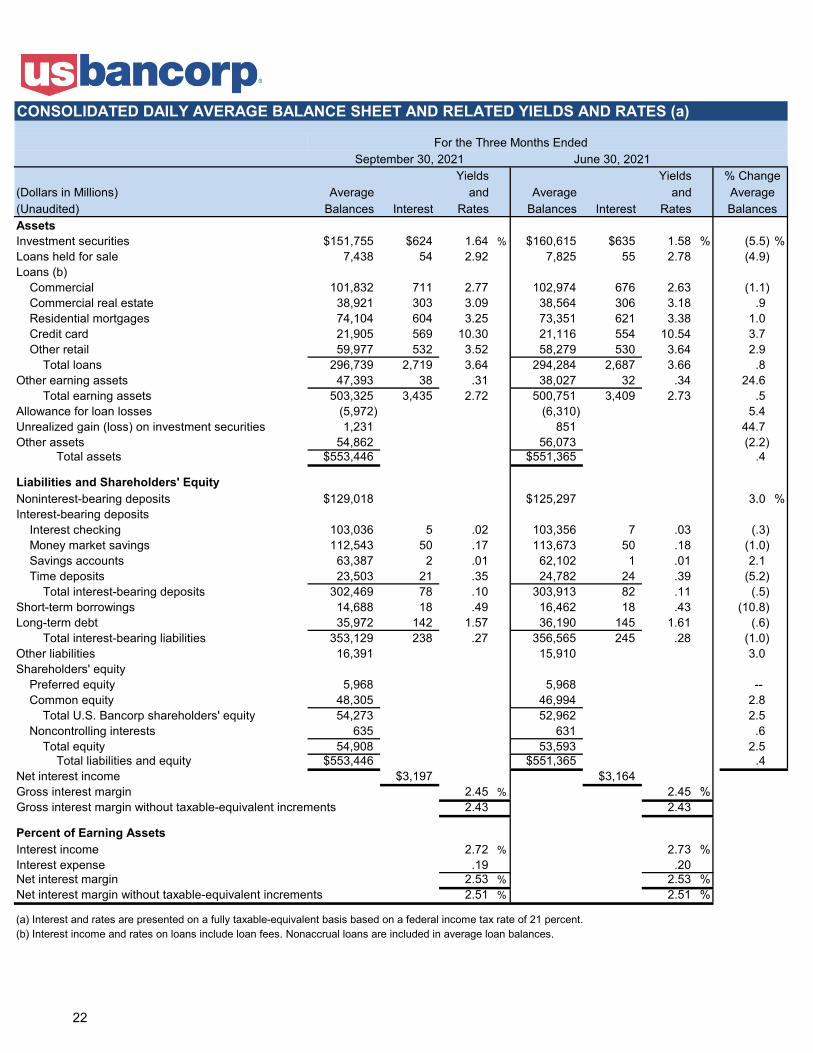
For the Three Months EndedSeptember 30, 2021 June 30, 2021
Yields Yields (Dollars in Millions) Average and Average and (Unaudited) Balances Interest Rates Balances Interest Rates Assets Investment securities $151,755 $624 1.64 % $160,615 $635 1.58 % (5.5) %Loans held for sale 7,438 54 2.92 7,825 55 2.78 (4.9)Loans (b) Commercial 101,832 711 2.77 102,974 676 2.63 (1.1) Commercial real estate 38,921 303 3.09 38,564 306 3.18 .9 Residential mortgages 74,104 604 3.25 73,351 621 3.38 1.0 Credit card 21,905 569 10.30 21,116 554 10.54 3.7 Other retail 59,977 532 3.52 58,279 530 3.64 2.9 Total loans 296,739 2,719 3.64 294,284 2,687 3.66 .8Other earning assets 47,393 38 .31 38,027 32 .34 24.6 Total earning assets 503,325 3,435 2.72 500,751 3,409 2.73 .5Allowance for loan losses (5,972) (6,310) 5.4Unrealized gain (loss) on investment securities 1,231 851 44.7Other assets 54,862 56,073 (2.2) Total assets $553,446 $551,365 .4
Liabilities and Shareholders' Equity Noninterest-bearing deposits $129,018 $125,297 3.0 %Interest-bearing deposits Interest checking 103,036 5 .02 103,356 7 .03 (.3) Money market savings 112,543 50 .17 113,673 50 .18 (1.0) Savings accounts 63,387 2 .01 62,102 1 .01 2.1 Time deposits 23,503 21 .35 24,782 24 .39 (5.2) Total interest-bearing deposits 302,469 78 .10 303,913 82 .11 (.5)Short-term borrowings 14,688 18 .49 16,462 18 .43 (10.8)Long-term debt 35,972 142 1.57 36,190 145 1.61 (.6) Total interest-bearing liabilities 353,129 238 .27 356,565 245 .28 (1.0)Other liabilities 16,391 15,910 3.0Shareholders' equity Preferred equity 5,968 5,968 -- Common equity 48,305 46,994 2.8 Total U.S. Bancorp shareholders' equity 54,273 52,962 2.5 Noncontrolling interests 635 631 .6 Total equity 54,908 53,593 2.5 Total liabilities and equity $553,446 $551,365 .4Net interest income $3,197 $3,164Gross interest margin 2.45 % 2.45 %Gross interest margin without taxable-equivalent increments 2.43 2.43
Percent of Earning Assets Interest income 2.72 % 2.73 %Interest expense .19 .20Net interest margin 2.53 % 2.53 %Net interest margin without taxable-equivalent increments 2.51 % 2.51 %
(a) Interest and rates are presented on a fully taxable-equivalent basis based on a federal income tax rate of 21 percent.(b) Interest income and rates on loans include loan fees. Nonaccrual loans are included in average loan balances.
CONSOLIDATED DAILY AVERAGE BALANCE SHEET AND RELATED YIELDS AND RATES (a)
% Change Average Balances
22

For the Nine Months Ended September 30,2021 2020
Yields Yields (Dollars in Millions) Average and Average and (Unaudited) Balances Interest Rates Balances Interest Rates Assets Investment securities $152,653 $1,793 1.57 % $123,444 $1,953 2.11 % 23.7 %Loans held for sale 8,422 176 2.79 6,352 157 3.31 32.6Loans (b) Commercial 102,298 2,060 2.69 116,501 2,492 2.86 (12.2) Commercial real estate 38,757 914 3.15 40,699 1,129 3.71 (4.8) Residential mortgages 74,215 1,870 3.36 72,612 1,985 3.65 2.2 Credit card 21,391 1,701 10.63 22,465 1,794 10.66 (4.8) Other retail 58,353 1,594 3.65 56,658 1,783 4.20 3.0 Total loans 295,014 8,139 3.69 308,935 9,183 3.97 (4.5)Other earning assets 44,527 103 .31 37,287 144 .52 19.4 Total earning assets 500,616 10,211 2.72 476,018 11,437 3.21 5.2Allowance for loan losses (6,513) (6,656) 2.1Unrealized gain (loss) on investment securities 1,304 2,863 (54.5)Other assets 55,792 53,155 5.0 Total assets $551,199 $525,380 4.9
Liabilities and Shareholders' Equity Noninterest-bearing deposits $124,262 $92,935 33.7 %Interest-bearing deposits Interest checking 101,280 18 .02 81,890 58 .10 23.7 Money market savings 116,968 150 .17 125,247 474 .51 (6.6) Savings accounts 61,462 5 .01 50,937 42 .11 20.7 Time deposits 25,067 72 .38 39,589 275 .93 (36.7) Total interest-bearing deposits 304,777 245 .11 297,663 849 .38 2.4Short-term borrowings 14,758 52 .47 21,335 127 .80 (30.8)Long-term debt 37,196 464 1.67 44,587 738 2.21 (16.6) Total interest-bearing liabilities 356,731 761 .28 363,585 1,714 .63 (1.9)Other liabilities 16,247 16,294 (.3)Shareholders' equity Preferred equity 6,049 5,984 1.1 Common equity 47,278 45,952 2.9 Total U.S. Bancorp shareholders' equity 53,327 51,936 2.7 Noncontrolling interests 632 630 .3 Total equity 53,959 52,566 2.7 Total liabilities and equity $551,199 $525,380 4.9Net interest income $9,450 $9,723Gross interest margin 2.44 % 2.58 %Gross interest margin without taxable-equivalent increments 2.42 2.56
Percent of Earning Assets Interest income 2.72 % 3.21 %Interest expense .20 .48Net interest margin 2.52 % 2.73 %Net interest margin without taxable-equivalent increments 2.50 % 2.71 %
(a) Interest and rates are presented on a fully taxable-equivalent basis based on a federal income tax rate of 21 percent. (b) Interest income and rates on loans include loan fees. Nonaccrual loans are included in average loan balances.
CONSOLIDATED DAILY AVERAGE BALANCE SHEET AND RELATED YIELDS AND RATES (a)
% Change Average Balances
23
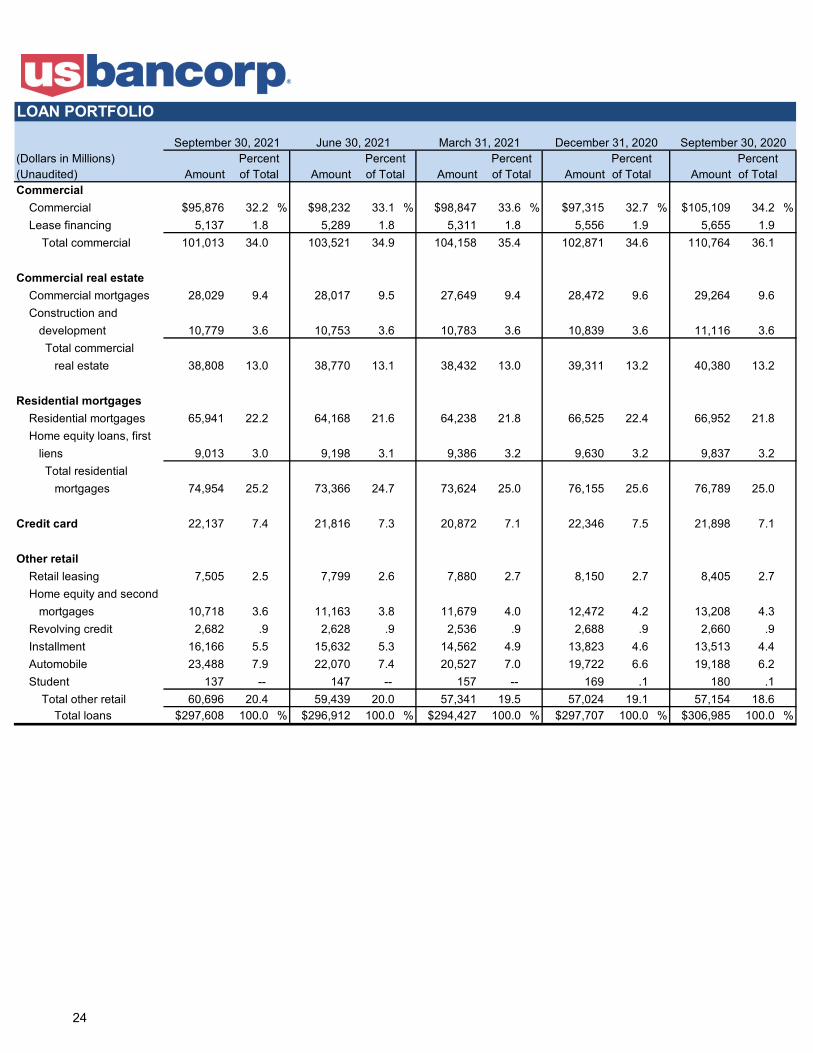
(Dollars in Millions) Percent Percent (Unaudited) Amount Amount Amount Amount of Total Amount of Total Commercial Commercial $95,876 32.2 % $98,232 33.1 % $98,847 33.6 % $97,315 32.7 % $105,109 34.2 % Lease financing 5,137 1.8 5,289 1.8 5,311 1.8 5,556 1.9 5,655 1.9 Total commercial 101,013 34.0 103,521 34.9 104,158 35.4 102,871 34.6 110,764 36.1
Commercial real estate Commercial mortgages 28,029 9.4 28,017 9.5 27,649 9.4 28,472 9.6 29,264 9.6 Construction and
development 10,779 3.6 10,753 3.6 10,783 3.6 10,839 3.6 11,116 3.6 Total commercial
real estate 38,808 13.0 38,770 13.1 38,432 13.0 39,311 13.2 40,380 13.2
Residential mortgages Residential mortgages 65,941 22.2 64,168 21.6 64,238 21.8 66,525 22.4 66,952 21.8 Home equity loans, first
liens 9,013 3.0 9,198 3.1 9,386 3.2 9,630 3.2 9,837 3.2 Total residential mortgages 74,954 25.2 73,366 24.7 73,624 25.0 76,155 25.6 76,789 25.0
Credit card 22,137 7.4 21,816 7.3 20,872 7.1 22,346 7.5 21,898 7.1
Other retail Retail leasing 7,505 2.5 7,799 2.6 7,880 2.7 8,150 2.7 8,405 2.7 Home equity and second
mortgages 10,718 3.6 11,163 3.8 11,679 4.0 12,472 4.2 13,208 4.3 Revolving credit 2,682 .9 2,628 .9 2,536 .9 2,688 .9 2,660 .9 Installment 16,166 5.5 15,632 5.3 14,562 4.9 13,823 4.6 13,513 4.4 Automobile 23,488 7.9 22,070 7.4 20,527 7.0 19,722 6.6 19,188 6.2 Student 137 -- 147 -- 157 -- 169 .1 180 .1 Total other retail 60,696 20.4 59,439 20.0 57,341 19.5 57,024 19.1 57,154 18.6 Total loans $297,608 100.0 % $296,912 100.0 % $294,427 100.0 % $297,707 100.0 % $306,985 100.0 %
Percent Percent Percent of Total of Total of Total
LOAN PORTFOLIO
September 30, 2021 June 30, 2021 March 31, 2021 December 31, 2020 September 30, 2020
24


![3Q21 [ENG] Results Presentation-Analyst](https://img.pdfslide.us/doc/110x75/62059ee21708c43c2d4570d9/3q21-eng-results-presentation-analyst.jpg)