Embed Size (px)
Citation preview

Key Figures – Eurofins Scientific Group
Revenues in EUR million EBITDA in EUR million
Operating Cash Flow Average Number of Full Time
in EUR million Employees (FTE)
EUR = Euro 5Y CAGR = Five Year Compound Annual Growth Rate
Average Number of Full Time Employees (FTE) = average weighted number of employees, expressed as full time equivalent (FTE)

2
Disclaimer THIS DOCUMENT IS NEITHER A FINANCIAL PROSPECTUS NOR AN OFFICIAL AUTHORISED DOCUMENT, NOR A SWORN TRANSLATION THEREOF. THIS DOCUMENT DOES NOT CONSTITUTE OR FORM A PART OF ANY OFFER FOR SALE OR SUBSCRIPTION OF OR SOLICITATION OF ANY OFFER TO BUY OR SUBSCRIBE ANY SECURITIES OF THE COMPANY NOR SHALL IT OR ANY PART OF IT FORM THE BASIS OF OR BE RELIED UPON IN CONNECTION WITH ANY DECISION TO PURCHASE SECURITIES OF THE COMPANY OR ENTER IN ANY CONTRACT WITH OR COMMITMENT TO THE COMPANY OR WHATSOEVER. IN ANY CASE AND FOR THE AVOIDANCE OF DOUBT, NEITHER THIS DOCUMENT NOR ANY COPY OF THIS DOCUMENT MAY BE TAKEN OR TRANSMITTED INTO THE UNITED STATES OF AMERICA, ITS TERRITORIES OR POSSESSIONS (THE “UNITED STATES”) OR DISTRIBUTED, DIRECTLY OR INDIRECTLY, IN THE UNITED STATES OR TO ANY NATIONAL OR ANY RESIDENT THEREOF OR ANY CORPORATION, PARTNERSHIP OR OTHER ENTITY CREATED OR ORGANISED UNDER THE LAWS OF THE UNITED STATES OR STATES THEREOF. NEITHER THIS DOCUMENT NOR ANY COPY OF THIS DOCUMENT MAY BE TAKEN OR TRANSMITTED INTO CANADA OR JAPAN OR DISTRIBUTED OR RE-DISTRIBUTED IN CANADA OR JAPAN OR TO ANY INDIVIDUAL OUTSIDE CANADA OR JAPAN WHO IS A RESIDENT OF CANADA OR JAPAN. ANY FAILURE TO COMPLY WITH THESE RESTRICTIONS MAY CONSTITUTE A VIOLATION OF THE SECURITIES LAWS OF THE UNITED STATES, CANADA OR JAPAN. IN THE UNITED KINGDOM, THIS DOCUMENT IS FOR DISTRIBUTION ONLY TO PERSONS WHO ARE AUTHORISED PERSONS OR EXEMPTED PERSONS WITHIN THE MEANING OF THE FINANCIAL SERVICES ACT 1986 OR ANY ORDER MADE THEREUNDER OR TO PERSONS OF A KIND DESCRIBED IN ARTICLE 11(3) OF THE FINANCIAL SERVICES ACT 1986, ORDER 1996 (AS AMENDED). IN THE REST OF THE WORLD, THIS DOCUMENT SHALL ONLY BE DISTRIBUTED AS AND IF PERMITTED BY LAW. THE COMPANY HAS TAKEN REASONABLE CARE TO ENSURE THAT THE FACTS STATED IN THIS DOCUMENT ARE TRUE AND ACCURATE IN ALL MATERIAL RESPECTS BUT MAKES NO REPRESENTATIONS OR WARRANTIES REGARDING THE RELIABILITY OR ABSENCE OF MATERIAL ERRORS OR OMISSIONS IN OR FROM THIS DOCUMENT. INFORMATION CONTAINED HEREIN IS BASED ON SOURCES BELIEVED TO BE RELIABLE BUT IS NEITHER ALL INCLUSIVE NOR GUARANTEED BY OUR COMPANY. NO PERSON HAS BEEN AUTHORISED TO GIVE ANY INFORMATION OR MAKE ANY REPRESENTATION NOT CONTAINED IN THE COMPANY’S “ANNUAL REPORT” WHICH CAN BE OBTAINED FROM GROUP HEADQUARTERS AND ANY INFORMATION GIVEN OR REPRESENTATION MADE BY ANY PERSON WHICH IS NOT CONTAINED IN THE COMPANY’S “ANNUAL REPORT” MAY NOT BE RELIED UPON AS BEING AUTHORISED BY THE COMPANY OR ANY OF ITS SUBSIDIARIES OR ANY OF THEIR RESPECTIVE EMPLOYEES, OFFICERS OR AGENTS. THIS PUBLICATION CONTAINS FORWARD-LOOKING STATEMENTS AND ESTIMATES THAT INVOLVE RISKS AND UNCERTAINTIES. THE FORWARD-LOOKING STATEMENTS AND ESTIMATES CONTAINED HEREIN REPRESENT THE JUDGEMENT OF EUROFINS SCIENTIFIC AS OF THE DATE OF THE PUBLICATION. THESE FORWARD-LOOKING STATEMENTS ARE NOT GUARANTEES FOR FUTURE PERFORMANCE AND THE EVENTS DISCUSSED IN THIS DOCUMENT MAY NOT OCCUR. EUROFINS SCIENTIFIC DISCLAIMS ANY INTENT OR OBLIGATION TO UPDATE ALL OR ONE OF THESE FORWARD-LOOKING STATEMENTS AND ESTIMATES. BY ACCEPTING THIS DOCUMENT, YOU AGREE TO BE BOUND BY THE FOREGOING INSTRUCTIONS AND LIMITATIONS.
Shareholders’ information Listing
Euronext Paris (IPO on 24.10.1997)
Segments/ Indexes
Paris: Euronext 100, SBF 120, STOXX Europe 600, MSCI Europe Industry Group/ Prime Sector
Healthcare/Healthcare Providers
International Securities Identification Code (ISIN)
FR0000038259 Tickers
Paris: Reuters EUFI.PA, Bloomberg ERF FP
Nominal Capital (at 31.12.2016)
EUR 1,692,597.00 (16,925,970 x EUR 0.10) Simplified Ownership Structure
Free Float 62.1% Martin Family 37.9%
2016 Share Price development
Eurofins Scientific: 25.8% SBF 120: 4.7% Euronext 100 Index: 3.0% CAC 40 Index: 4.9% Euro Stoxx 50 Index: 0.7% Nasdaq Composite Index: 7.5% Dow Jones Industrial Average Index: 13.4% Since its IPO in 1997 Eurofins has been one of the best performing shares in Europe, with a CAGR (Compound Annual Growth Rate) of its share price of 33% as of December 31
st, 2016.
Analyst coverage
Berenberg Josh Puddle Bryan Garnier Bruno de La Rochebrochard Exane BNP Paribas Allen Wells Gilbert Dupont Guillaume Cuvillier Goldman Sachs Suhasini Varanasi HSBC Murielle André-Pinard Jefferies Will Kirkness Kepler Cheuvreux David Cerdan Mainfirst Mourad Lahmidi Natixis Kathleen Gailliot Oddo Christophe-Raphaël Ganet Portzamparc Arnaud Guérin Société Générale Jean-Michel Belanger
Investor Relations
Eurofins Scientific Group Phone: +32 2 769 7383 E-mail: [email protected]
Internet
www.eurofins.com
3
Contents
I. MANAGEMENT REPORT as of 31/12/2016 .............................................................................................. 4
1 Key Performance Indicators (KPIs) ......................................................................................................... 4
2 Message from the CEO ............................................................................................................................. 5
3 The business ............................................................................................................................................. 6
4 Financial and operating review ................................................................................................................ 9
5 Social & environmental information as of 31/12/2016............................................................................ 14
6 Risk factors ............................................................................................................................................... 16
7 Eurofins Scientific SE, the group parent company ................................................................................ 29
8 Corporate Governance ............................................................................................................................. 29
II. CORPORATE GOVERNANCE .................................................................................................................. 30
1 Corporate Governance Charter of Eurofins ............................................................................................ 30
2 Corporate Governance Statements for the period ended on December 31st, 2016 ............................ 37
3 Statement of persons responsible for the annual report ...................................................................... 46
III. ANNUAL FINANCIAL STATEMENTS ....................................................................................................... 47
1 Consolidated Financial Statements ........................................................................................................ 47
2 Auditor’s Report on Eurofins Scientific SE’s Consolidated Financial Statements ............................. 106
3 Annual accounts - EUROFINS SCIENTIFIC S.E. ..................................................................................... 108
4 Auditor’s Report on Eurofins Scientific SE’s Annual Accounts ........................................................... 120

4
I. MANAGEMENT REPORT as of 31/12/2016
1 Key Performance Indicators (KPIs) Developments in some of Eurofins’ Key Performance Indicators (KPIs), as illustrated by the charts below, are discussed in detail in later sections of this report.
Average Number of Full Time Employees = average weighted number of employees, expressed as full time equivalent (FTE)
Revenues EUR m Adjusted EBITDA EUR m
Operating Cash Flow EUR m Average Number of Full Time Employees
(FTE)
Net Profit EUR m Earnings Per Share EUR (Basic total)

5
2 Message from the CEO
I am pleased to report another excellent set of results in 2016 from Eurofins, with organic growth nearly double our annual objective. During the year, we made significant progress towards both our financial and operational objectives.
Some of the highlights of 2016 include:
Over 9% organic growth9 for the full year 2016,
representing the highest annual level since the 2008 recession.
Group Adjusted1 EBITDA
3 margin of 18.9%
(+40bp), marking solid progress towards our mid-term profitability objective.
91% earnings uplift as reported EPS exceeds EUR 10 for the first time (EUR 10.88).
Strong cash generation with 40% growth in Free Cashflow to the Firm.
Significant balance sheet strengthening with leverage down to 1.16x net debt/adjusted EBITDA at the end of 2016 compared to 2.54x at the end of 2015.
Acquisitions program above EUR 200m objective: 27 acquisitions with total annualised revenues of above EUR 220m closed in 2016 at reasonable multiples well within historical average (ca. 1x EV/Sales).
Increasing proficiency in start-up investments: 91 start-ups in 10 years (2007-2016), average of 20 start-ups launched per year since 2014. Laboratories from the last completed start-ups program (2010-2013) reached break-even in 2014 and generated 22% revenue growth and 19% EBITDA margin in 2016.
With 89% of Group revenues now generating 21.3% EBITDA margin, Eurofins is able to continue investing for future growth such as the roll-out of multiple start-up laboratories in high-growth markets, as well as deliver profit improvements and earnings.
Operationally, we continue to make steady progress on key initiatives including the addition of 46,000m2 of state-of-the-art laboratory surface in 2016 alone, development and commercialization of many innovative tests to better serve our clients, internal development of tailor-made IT solutions that should further elevate the Eurofins laboratory network ahead of its peers, and the roll-out of over 20 new start-up laboratories in 2016.
In view of the positive developments in our start-up investment program as detailed on page 7 of the press release, the Group has significantly accelerated the current program which commenced in 2014, to open 76 start-up laboratories by the end of 2017.
Start-ups complement the Group’s acquisition strategy, and provide a compelling alternative in markets or segments where acquisition prices are too high. Start-up investments therefore allow the Group to enter or reinforce its leadership in high-growth markets without putting value creation at risk by overpaying for acquisitions.
In addition, despite investments to strengthen barriers to entry and secure future growth drivers, the Group continues to optimize its capital structure, successfully de-levering the balance sheet to 1.16x net debt to adjusted EBITDA, and deliver strong cash generation, with a 40% increase in free cash flow to the firm in 2016.
Therefore, whilst the strong growth outlook of the existing businesses allows the Group to be selective to ensure that we maintain financial discipline with regards to acquisitions, our strong balance sheet means that Eurofins is better-positioned than ever to respond to large, compelling opportunities as and when they arise.
In view of the continued positive trends, we confirm the 2017 objectives initially announced in September 2016 of achieving revenues and adjusted EBITDA close to EUR 2.9bn and EUR 550m respectively, at current exchange rates, based on an objective of 5% organic growth and EUR 200m from acquisitions. Furthermore, in light of these results and the continued positive outlook for the Group, the management will be proposing a 38% increase in dividends to EUR 2 per share.
Overall, the Group’s performance in the first of its 5-year plan bodes well for the achievement of our mid-term objectives of reaching EUR 4bn of revenues and EUR 800m of adjusted EBITDA by 2020.
I would like to thank and compliment our teams in the 39 countries where we operate laboratories around the world for their outstanding dedication and performance in what was once again the best year ever for Eurofins as well as thank our clients and shareholders for their continued support.
Sincerely,
Dr. Gilles G. Martin CEO
Dated February 23, 2017
(See definitions of the financial terms discussed on page 13).

6
3 The business
Eurofins Scientific – A global leader in bioanalysis
Eurofins Scientific through its subsidiaries (hereinafter sometimes “Eurofins” or “the Group”) believes it is the world leader in food, environment and pharmaceutical products testing and that it is also one of the global independent market leaders in certain testing and laboratory services for agroscience, genomics, discovery pharmacology and for supporting clinical studies. In addition, Eurofins is one of the key emerging players in specialty clinical diagnostic testing in Europe and the USA.
With more than 27,000 staff in a network of companies operating in 310 laboratories across 39 countries, Eurofins offers a portfolio of over 130,000 analytical methods for evaluating the safety, identity, composition, authenticity, origin, traceability and purity of biological substances and products, as well as for clinical diagnostic. The Group provides its customers with high-quality services, accurate results on time, and expert advice by its highly qualified staff.
Eurofins is committed to pursuing its dynamic growth strategy by expanding both its technology portfolio and its geographic reach. Through R&D and acquisitions, the Group draws on the latest developments in the field of biotechnology and analytical chemistry to offer its clients unique analytical solutions and a very comprehensive range of testing methods.
As one of the most innovative and quality oriented international companies in its industry, Eurofins believes it is ideally positioned to support its clients’ increasingly stringent quality and safety standards and the expanding demands of regulatory authorities and healthcare practitioners around the world.
Our Vision: To be the world leader in the
bioanalytical testing market.
Our Mission: To contribute to global health and
safety by providing our customers with high quality laboratory and advisory services whilst creating opportunities for our employees and generating sustainable shareholder value.
Our Values: Achievement of our Mission is based on
Eurofins "Core Values", which commit us to Customer Focus, Quality, Competence & Team Spirit and Integrity.
History and Strategy of Eurofins
Eurofins was founded in 1987 with 4 employees to market the SNIF-NMR technology, a patented analytical method used to verify the origin and purity of several types of food and beverages and identify sophisticated fraud not detectable by other methods. Today Eurofins operates a network of 310 state-of-the-art laboratories across 39 countries in Europe, North and South America and Asia-Pacific employing more than 27,000 staff, and offering a portfolio of over 130,000 reliable analytical methods.
Investments in start-up laboratories in several countries, including in emerging markets, along with focused acquisitions, have substantially increased the range of Eurofins’ offerings in its customers’ key markets around the world. Eurofins has also started
seeing the benefits from its intensive investment programmes in the past. The results have been reflected in a significantly enlarged network of state-of-the-art laboratories and Competence Centres, increased efficiency across the Group, and higher shares in most of the markets where the Group historicaly operates.
Eurofins is committed to supporting its clients’ objectives of ensuring that their products reach the best possible quality and safety levels in all markets in which they operate and supporting medical practitioners and patients with innovative diagnostic services. Eurofins intends to continue to develop and acquire a unique range of state-of-the-art analytical technologies as well as expand its geographical reach in order to support its clients’ increasingly stringent quality and safety standards and the expanding demands of regulatory authorities and its customers, including healthcare practitioners, around the world.
Eurofins is a global network of laboratories providing a large range of bioanalytical testing services. The Group believes it is the world leader in food and feed, environment and pharmaceutical products testing and ranks among the top five global providers of central laboratory and genomic services for research
1.
Eurofins’ mission is to contribute to the health and safety of all by providing its customers with high quality laboratory and advisory services. It operates in a range of clearly defined markets that are considered to have high growth potential and where competition is generally fragmented.
Eurofins is structured as a decentralised network of independent companies. Each of the Group’s businesses develops plans to enable it to fulfil its mission and objectives. The Group does not operate under one single strategy, but with several that are specific to each market in which its subsidiary companies operate. In general, Eurofins companies and groups thereof constituting regional or global business lines employ all or a combination of the following to build strong positions and defendable barriers-to entry:
Use advanced technologies, supported by a high level of R&D and bespoke IT solutions;
Deliver standardised, accredited services of high quality;
Leverage Eurofins’ growing global network of laboratories and service/product portfolio to generate scale effects and be a first choice provider; and
Strive to become, over time, and remain the number one or number two service provider in every market in which the Group operates.
Eurofins is a decentralised network of independent laboratories operating across various segments and geographies. Each laboratory strives for operational excellence and aspires to be the best partner for its client by leveraging the Group's network capabilities,
1 Wells Fargo Securities, Equity research, Pharma Services, Appendix 3 – 2011

7
through sharing of know-how and best practices, IT infrastructure and solutions, logistics and financial resources. This has been achieved and successfully replicated across many countries and market segments to date. The Group aims to achieve growth through organic development (selling more to existing customers and attracting new customers) and acquisitions which give access to new customers, geographic markets, technology, and innovation.
Industry Overview
The market for Testing, Inspection and Certification Services (TICS)
Bioanalytical testing (defined by Eurofins as testing all products or substances that we eat, drink, ingest, inhale or come in contact with our bodies) is a relatively new market that started expanding significantly only a few decades ago, particularly for third party service providers. Despite the ongoing consolidation process, the market is still highly fragmented with a large number of smaller and medium sized laboratories offering a limited technological portfolio, regional presence and customer reach
2. In contrast, the Eurofins Group and
a few large international peers offer customers a large range of analytical services, as well as support across multiple countries around the world.
Given the fragmentation and complexity of the bioanalytical testing market, many companies provide services addressing various subsegments of the market. However, Eurofins does not consider any other company to be an exact competitor in all the segments and geographies in which it operates. Equity and credit research analysts often cite Intertek, Bureau Veritas and SGS as comparable listed TICS companies for their valuation purposes
3. In the
pharmaceutical area, Quintiles and Charles River are sometimes cited.
The Clinical Diagnostics market
The clinical diagnostics market comprises assays, instruments, and services that help in the diagnosis and treatment of diseases. Since 2014 Eurofins has been focusing a large part of its investments in this sector with a special focus, on innovative specialized diagnostic services with a growing genetic and genomic component. As further detailed below under paragraph “Global Clinical Diagnostics market growth drivers” the market is expected to grow
4 as effective
diagnosis enables a more personalized medicine – i.e., allow healthcare professionals to better diagnose and prescribe more accurate treatment for each patient.
Multiple companies provide either specialized or routine clinical diagnostic testing services, or both, depending on their technologies, or scientific
2 KPMG Corporate Finance, Test and Measurement newsletter Q1 2016 3 More generally, the Group considers the following international companies to have
activities in competition with its activities, even if only partially : ALS Global, Aptuit,
Bureau Veritas, Charles River, Dekra, DNV-GL, Icon, Idexx, Intertek, Labcorp/Covance,
LGC, Merieux Nutrisciences/Silliker, MIRACA, Quest Diagnostics, Quintiles, SGS, SRL, the
TÜV group, UL. This list is by nature non exhaustive, and evolutive over time. It is
provided for illustration purposes only 4 http://www.transparencymarketresearch.com/clinical-laboratory-services-market.html says they expect 5.8% CAGR 2013-2019
expertise, or the relevant regulations. The competitive landscape is therefore highly localized, and in certain geographies, competition is along the lines of specialization or branches of medical science. Financial analysts typically cite Labcorp, Quest Diagnostics, Sonic Healthcare, among others, as comparable peers to Eurofins’ clinical diagnostics activities.
Growth drivers
Eurofins management believes that several significant trends and factors are supportive of the continued growth of the market in which it operates. Some of these trends include:
The broader bioanalytical testing market growth drivers
Wealth & Life Expectation
Thanks to sufficient food, modern technology, healthcare, and medical coverage in industrialised countries, most people can live comfortably and grow old healthily. As the average wealth in these countries increases, the demand even for expensive pharmaceuticals enabling people to enjoy better lives is growing. The aversion to risk that may be associated with some food and consumer products and contamination of the environment is also increasing as people become more aware of the issues that surround them.
New Technologies
New technologies open new perspectives for applications in the pharmaceutical, food, and environmental markets. In recent years, the food industry has developed many new products which apply new technologies and processes, such as “functional food”, a food given an additional function (often one related to health promotion or disease prevention) by adding new ingredients or more of existing ingredients.
Eurofins benefits from both the needs of its customers to test the application of new technologies and to test and control their products. The Group is capable of developing new methods to help develop and register new pharmaceutical products and to track and analyse, for example, residues of pesticides, pharmaceutical substances, allergens or GMOs in a wide range of food products. Increasingly sensitive analytical equipment and methods also act as a driver for better quality assurance and to detect substances that people were not previously aware of or able to measure.
Consumer Protection
Along with the development of new technologies and a rising standard of living in the industrialised countries, consumers are becoming increasingly aware of product safety and quality and are averse to any health risks linked with food, pharmaceuticals or the environment. The demand for higher quality goods and services, and the associated requirement for testing, are also driven by increasingly strict regulations introduced by governmental authorities, the European Commission, the US Food and Drug Administration or worldwide standardisation bodies in the pharmaceutical, food and environmental markets.
8
Globalisation
As businesses increasingly look to global markets for their suppliers, they also become more exposed to the additional risks that are created by this global sourcing. The wider the supply chain becomes, the greater and more complex the risk of quality divergence across the chain becomes and hence the need for testing.
In addition to Europe and North America, Eurofins is able to meet clients’ needs across the globe including in an increasing number of supply chain locations in South America, Eastern Europe, and Asia. By operating laboratories in many of the countries where suppliers of food ingredients or agriculture commodities exist, Eurofins has a clear understanding of the global conditions and regulations and possibilities to test at source. Furthermore, Eurofins also offers a reliable standard of high quality and extensive expertise in those local markets for global customers with worldwide operations.
One-stop-service provider
Eurofins aims to provide its customers with as wide a range of analytical services as possible. The main way in which this is achieved is through Eurofins market-leading testing portfolio of over 130,000 tests. In addition, most large customers benefit from having dedicated account managers. This account manager can draw on the possibility of a large number of Eurofins laboratories, some being very specialized. Eurofins in turn is able to allow each laboratory in the Group to focus on their own area of expertise and yet retain customers through being able to offer the complete range of tests provided by most laboratories in the Group or in one Business Line.
Brand Protection
In times of enhanced quality and safety consciousness of consumers, global marketing of products and international media coverage, brands are very valuable and highly vulnerable assets that need constant protection. By carrying out a large range of analyses as part of pro-active quality assurance programmes, Eurofins supports its global customers in maintaining the integrity of their brands.
Outsourcing
To run in-house or government/public laboratories, as a rule, is seldom cost effective and therefore outsourcing to a global supplier, such as Eurofins, is becoming increasingly common. An outsourcing deal can represent a win-win situation for both sides. It allows the outsourcing partner to use its capital more efficiently, turn fixed costs into variable costs, and to benefit from Eurofins’ expertise in operating laboratories. On the other hand, Eurofins gains a long-term partnership with the customer, allowing both parties to concentrate on their core businesses.
The Clinical Diagnostics market growth drivers
Demographics
Eurofins believes that as world population grows and ages, the need for earlier and more sophisticated diagnosis and treatment of diseases will likely drive up the demand for laboratory diagnostic services.
According to a recent market study, the global clinical laboratory services market is estimated to grow at a CAGR of 6.4% per annum from USD 196.9bn in 2015 to USD 342.3bn by 2024
5.
Medical/scientific innovations
Technological innovations relevant to medicine could lead to earlier or more accurate diagnosis and treatment of diseases
6. Advances in genomics, for
example, are expected to lead to advanced diagnostic tests, which in turn could bring the healthcare system closer to personalized medicine, which relies on individualised diagnostic and prognostic testing
7.
Based on such individualised testing physicians may prescribe the most effective healthcare treatments or lifestyle changes for individual patients.
8
The increased availability of healthcare data, including those resulting from modern sequencing technologies frequently referred to as “next generation DNA sequencing” and continually improving ability to analyze such data at the patient level is likely to open new possibilities to positively impact diagnosis and treatment of diseases.
Prevention and wellness
The increasing burden of healthcare costs on government and healthcare agencies has advanced the case for better control of medical and laboratory diagnostic costs but also for greater focus on early diagnosis and prevention. In some cases, healthcare providers and payers (governments or insurance agencies) increasingly recognize the value of diagnostics as a means to improve health and reduce the cost of healthcare through early detection, prevention, and more effective treatment.
There is no guarantee that these growth trends will remain or materialize, or that the industry, or indeed Eurofins' businesses and operations may not be negatively influenced or impacted by a variety of factors and possible events. Please refer to the Risk Factors Section on Commercial risks, Technological risks, Industrial risks and other factors that could have a negative impact on the laboratory testing industry and Eurofins' growth and financial results.
5 https://www.gminsights.com/pressrelease/clinical-laboratory-services-market 6 http://www.marketsandmarkets.com/Market-Reports/ivd-in-vitro-diagnostics-market-
703.html 7 http://www.mordorintelligence.com/industry-reports/global-in-vitro-diagnostics-market-growth-trends-and-forecasts-2014-2020-industry?gclid=CNnSio6Y-MwCFY5ZhgodQuMJEA 8 http://ww2.frost.com/news/press-releases/vitro-diagnostics-players-go-global-says-frost-sullivan-us-and-europe-markets-slow-down/

9
4 Financial and operating review
Revenues
Revenues grew 16.0% to EUR 699.3m in the fourth quarter, bringing revenues for the full year 2016 to EUR 2,536.6m, representing year-on-year increase of 30.1%, of which over 9% was organic. Currency translation had a limited impact of -0.3% during the year. Taking the annualized revenues of all the acquisitions completed during the year, 2016 pro-forma revenues were EUR 2,658.6m.
(note 4.1 of the notes to the consolidated financial statement)
Revenues generated by Eurofins’ businesses in North America, its largest market, increased by 24.9% to EUR 803.6m, comprising nearly 32% of total Group revenues. In France, Eurofins’ second largest market with nearly 25% of total Group sales, revenues increased 69.3% to EUR 625.9m. Revenue contribution from Germany, which makes up 11% of Group revenues, was EUR 279.4m in 2016, representing growth of 11.6%, most of which was organic. The Group’s businesses in the Benelux achieved revenues of EUR 191.2m, representing 7.5% of total Group revenues, and an increase of 20.9% compared to 2015. The Nordic businesses generated EUR 172.4m of revenues in 2016, making up nearly 7% of total sales. Revenues from the UK & Ireland grew 26.8% to EUR 122.0m, as the strong performance from the pharmaceutical testing business offset the exit from some water testing segments. Lastly, revenue contribution from Eurofins’ businesses in Asia Pacific and in emerging markets increased 27.1% to EUR 342.1m, as the Group continues to expand its footprint in these markets.
Profitability
Group adjusted EBITDA increased 32.9% to EUR 479.6m in 2016 as margin expanded by 40bp to 18.9% driven by the strong revenue growth and profitability improvements in both the mature businesses and those that had been recently transferred out of the start-up/businesses in reorganization perimeter. The mature businesses of the Group, i.e. excluding start-ups and acquisitions in significant restructuring, generated EUR 2,254.3m of revenues during the period, implying that the margin for these businesses further expanded to 21.3%. Start-ups and businesses in restructuring or reorganization generated the remaining EUR 282.3m of revenues, which means that these businesses now account for 11.1% of total Group revenues, compared to 12.5% in 2015.
Start-up losses and restructuring costs as disclosed in the separately disclosed items
2 (SDI) were EUR
18.5m in 2016, representing 3.9% of the total EBITDA generated by the mature businesses of the Group, a further reduction compared to the 4.4% level in 2015 despite the acceleration in the Group’s start-up investments and the finalization of some of the reorganization of its discovery services business in the US, the site consolidation programs in the UK and Benelux, and the relocation of its US genomics business to Louisville, KY.
Even with multiple investments for future growth that are temporarily dilutive, reported EBITDA margin still expanded by 50bp to 18.2% as reported EBITDA increased by 33.6% to EUR 461.1m due to strong top line growth and economies of scale, allowing continued profit expansion in the Group’s mature businesses.
Adjusted EBITAS4 increased 35.3% to EUR 357.6m
despite the 27.6% year-on-year increase in depreciation and amortization, due largely to the elevated capital expenditures in recent years. The strong growth in profitability resulted in a 36.5% growth in reported EBITAS to EUR 319.4m as EBITAS margin expanded by 60bp to 12.6% during the year. Non-cash stock option charge and net acquisition-related expenses grew only modestly by 4.3% resulting in a growth of 42.3% in reported EBIT for the Group to EUR 281.9m.
Finance costs in 2016 were EUR 70.8m, remaining stable at 2.8% of total revenues, despite the cost of
EUR million 2016 % of Group
2015 % of Group
North America 803.6 31.7 643.2 33.0 France 625.9 24.7 369.6 19.0 Germany 279.4 11.0 250.4 12.8 Benelux 191.2 7.5 158.1 8.1 Nordic Region 172.4 6.8 163.3 8.4 UK & Ireland 122.0 4.8 96.2 4.9 Other 342.1 13.5 269.2 13.8 Total 2,536.6 100.0 1,950.1 100.0
Revenues EUR m
Revenues : Geographical Breakdown
Adjusted EBITDA EUR m
10
carrying more than EUR 820m of unused cash on the balance sheet at year-end and a similar amount throughout 2016. Adjusted Financial Result remained stable at -1.9% of Revenues.
The income tax expense has decreased by more than 500bps to 26.8% of the profit before income taxes. This is the result of some exceptional finance income and the measures put in place by management to achieve an optimum tax structure, including the recognition of deferred tax assets where applicable.
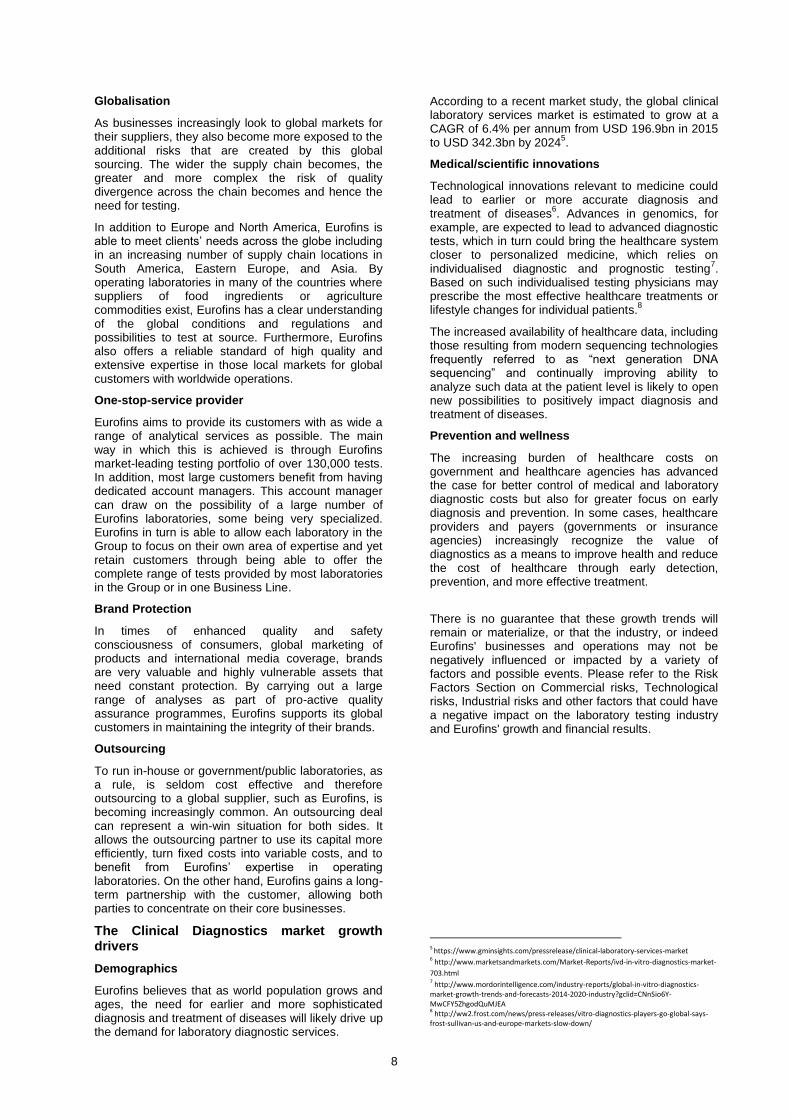
Adjusted net profit5 stood at EUR 221.6m for 2016.
Due to the strong revenue growth and profit improvement, and with finance costs stable relative to revenues, reported net profit nearly doubled to EUR 174.0m during the year, translating to a 90.6% uplift in the Group’s basic earnings per share (EPS)
6, which
exceeded EUR 10 for the first time, at EUR 10.88.
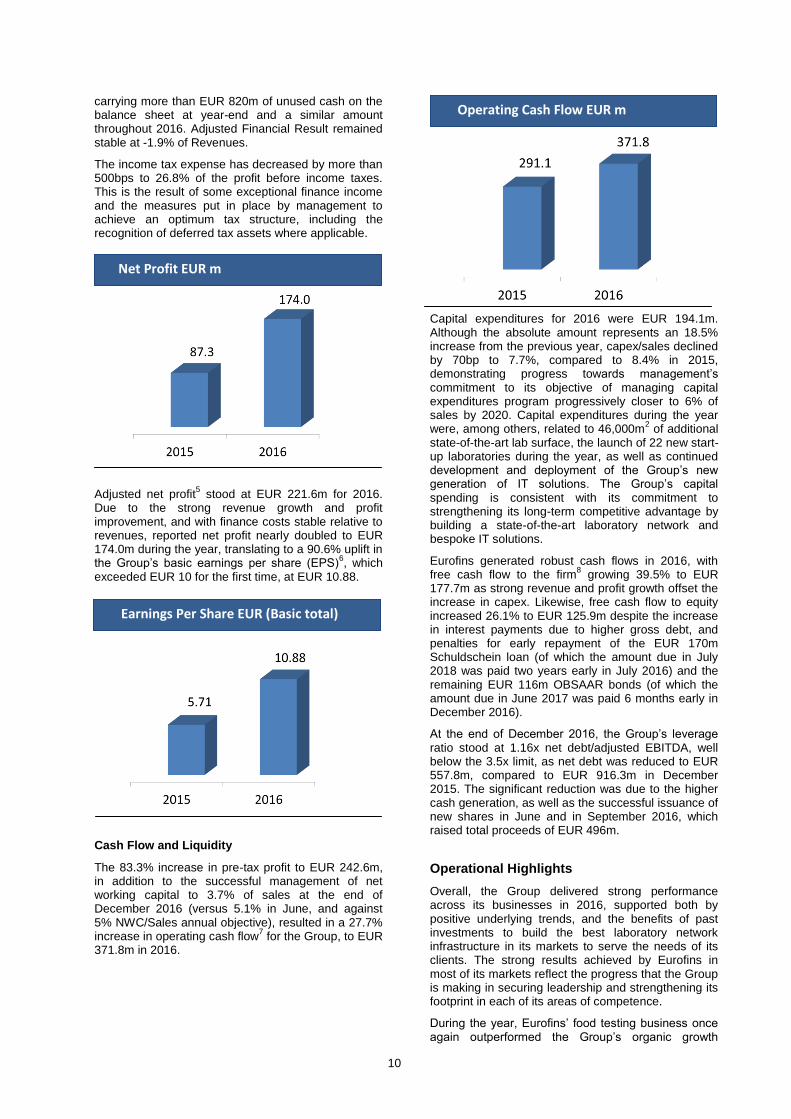
Cash Flow and Liquidity
The 83.3% increase in pre-tax profit to EUR 242.6m, in addition to the successful management of net working capital to 3.7% of sales at the end of December 2016 (versus 5.1% in June, and against 5% NWC/Sales annual objective), resulted in a 27.7% increase in operating cash flow
7 for the Group, to EUR
371.8m in 2016.
Capital expenditures for 2016 were EUR 194.1m. Although the absolute amount represents an 18.5% increase from the previous year, capex/sales declined by 70bp to 7.7%, compared to 8.4% in 2015, demonstrating progress towards management’s commitment to its objective of managing capital expenditures program progressively closer to 6% of sales by 2020. Capital expenditures during the year were, among others, related to 46,000m
2 of additional
state-of-the-art lab surface, the launch of 22 new start-up laboratories during the year, as well as continued development and deployment of the Group’s new generation of IT solutions. The Group’s capital spending is consistent with its commitment to strengthening its long-term competitive advantage by building a state-of-the-art laboratory network and bespoke IT solutions.
Eurofins generated robust cash flows in 2016, with free cash flow to the firm
8 growing 39.5% to EUR
177.7m as strong revenue and profit growth offset the increase in capex. Likewise, free cash flow to equity increased 26.1% to EUR 125.9m despite the increase in interest payments due to higher gross debt, and penalties for early repayment of the EUR 170m Schuldschein loan (of which the amount due in July 2018 was paid two years early in July 2016) and the remaining EUR 116m OBSAAR bonds (of which the amount due in June 2017 was paid 6 months early in December 2016).
At the end of December 2016, the Group’s leverage ratio stood at 1.16x net debt/adjusted EBITDA, well below the 3.5x limit, as net debt was reduced to EUR 557.8m, compared to EUR 916.3m in December 2015. The significant reduction was due to the higher cash generation, as well as the successful issuance of new shares in June and in September 2016, which raised total proceeds of EUR 496m.
Operational Highlights
Overall, the Group delivered strong performance across its businesses in 2016, supported both by positive underlying trends, and the benefits of past investments to build the best laboratory network infrastructure in its markets to serve the needs of its clients. The strong results achieved by Eurofins in most of its markets reflect the progress that the Group is making in securing leadership and strengthening its footprint in each of its areas of competence.
During the year, Eurofins’ food testing business once again outperformed the Group’s organic growth
Net Profit EUR m
Earnings Per Share EUR (Basic total)
Operating Cash Flow EUR m

11
objective, driven by rising awareness among consumers and across the food industry of the need for more systematic testing
9, and the Group’s
capability to often respond to the industry’s needs better than any other laboratory testing service provider. Strong performance from some of the Group’s environment testing businesses, notably air and water testing in France and Germany, partially offset some of the impact of slower economic activity in the rest of Europe, as well as the continued weakness in the US environment testing market. Although organic growth in environment testing for 2016 was lower than the Group average, the business is well-positioned for growth due to the scale of its network.
Organic growth generated by the Group’s pharmaceutical testing business remained well above the Group’s 5% objective in 2016, on the back of further growth acceleration in pharmaceutical products testing, and as the Group unwinds and starts to see the benefits of the reorganization of its discovery services business, as well as the steady build-up of the order book in the central laboratory business. In the broader industry, the steady number of applications for FDA approvals
10, and strong growth in
drug sales11
, are supportive of the underlying fundamentals for the pharma testing business in the medium term. The Group’s clinical testing business continues to gain traction, following several acquisitions in the US and in Europe. Innovation continues to be a solid growth driver in US clinical testing, while in Europe, the Group continues to roll-out its strategic footprint. In both markets, Eurofins continues to leverage its expertise in genomics, and more broadly in pharmaceutical testing.
Business developments by market
Positive trends continue to drive the growth in Eurofins’ businesses in North America. Regulatory catch-up remains a key growth driver for the food testing market, and Eurofins continues to gain market share, as reflected in the high single-digit organic growth generated by the Group’s US food testing business. Eurofins’ pharma testing businesses in the US delivered another solid performance in 2016, with strong organic growth in biopharma products testing driven by continued growth in drug sales and new drug applications, as well as strengthening central lab order book. The completion of the site reorganization programme in its discovery services business has also started to bear fruit, as reflected in good organic growth generated by the business in 2016. In addition, Eurofins has further expanded its footprint with the launch of medical device testing to add to its comprehensive pharma testing competencies, reinforce its market leadership, and secure additional
9https://ec.europa.eu/food/sites/food/files/safety/docs/rasff_annual_report_2015.pdf
10http://www.fda.gov/downloads/Drugs/DevelopmentApprovalProcess/DrugInnovation/UCM536693.pdf
11 http://www.fiercepharma.com/sales-and-marketing/drug-sales-expected-to-top-1-3t-2018?utm_medium=nl&utm_source=internal
growth driver. Organic growth in environment testing was somewhat below Group objective as market consolidation continues to be the main driver, which should purge oversupply in the market in due course. The Group’s specialty clinical diagnostics businesses contributed good organic growth in spite of strengthening reimbursement headwinds in H2 as the laboratories expand their sales forces to accelerate the commercialization of their tests and invest in further development of new innovative tests and services.
In France, organic growth was in-line with Group objective as the clinical testing businesses, which account for over half of revenues in France, generated better than expected growth despite the annual adjustments in reimbursements being fully applied in Q4, according to the French health authority budget. The food testing business performed strongly during the year on continued market share gains supported by capacity expansion driven by innovation, such as the launch of the Maldi-TOF
12 technology which
significantly reduces turn-around time and increases capacity for microbiology testing. In addition, Eurofins continues to leverage its international network to become the preferred laboratory partner for clients with equally wide footprint. For example, the Group’s flagship food laboratory in Nantes gained the German QS accreditation to test for pesticides in fruits and vegetables, allowing Eurofins to partner with customers whose products are shipped in markets requiring such certification. Likewise, the selection of Eurofins by the ANEEFEL
13 as one of a handful of
reference laboratories in France to serve the fruit and vegetable industry gives access to an important market, and is another demonstration of the Group’s capabilities. The Group’s environment testing business in France also generated organic growth above Group objective driven by market share gains and positive trends especially in indoor air testing. The water testing business also delivered solid performance on the back of recently-won public tenders (“Agence de l’Eau Seine Normandie” and “Agence de l’Eau Loire Bretagne”) as well as increased volumes from existing customers. The clinical diagnostics testing business also generated better than expected growth, validating the Group’s strategy of building a differentiated platform focused on building regional leadership and leading the market for specialized, highly-innovative diagnostic tests.
Business trends remained strong in Germany during the year. The food testing business continues to strengthen, generating the highest revenue growth in five years, with growing scale effect reflected in higher activities from cross-selling initiatives, as well as higher share of incremental market volumes driven by new regulations such as those addressing potential contaminants from packaging materials. Increasingly harmonised service offering from different Eurofins laboratories was reflected in greater penetration and higher volumes from key global food customers. The Group’s environment testing business in Germany also delivered strong performance reflecting continued growth even in a mature market.
12 Matrix Assisted Laser Desorption Ionization Time-of-Flight 13 Association Nationale des Expéditeurs et Exportateurs de Fruits et Légumes

12
The Group’s businesses in the Benelux performed strongly, driven by new businesses won such as the new contract for groundwater analysis in Belgium. Eurofins’ Nordic businesses continue to generate robust growth despite high market share across the region as it benefits from past investments which strengthened its ability to continually expand the services it can provide to clients, resulting in increased share of clients’ testing spend. In the UK & Ireland, the strong performance from the pharmaceutical testing business offset the exit from some water testing segments.
Eurofins’ businesses in emerging markets and Asia Pacific delivered solid performance as the Group continued to expand its footprint, especially in Asia Pacific, both organically and through acquisitions.
Acquisitions & Outsourcing
In 2016, Eurofins completed 27 acquisitions representing total annualised revenues in excess of EUR 220m. The acquisitions either strengthen Eurofins’ leadership in existing markets, or further develop the Group’s expanding footprint in its newer markets, such as in clinical diagnostics testing, or in Asia Pacific.
In January, Eurofins acquired Sinensis Life Sciences, a leading provider of pharmaceutical product testing and cGMP Quality Control (QC) services in the Netherlands, further reinforcing the Group’s global leadership in this area of pharmaceutical products testing. In the same month, Eurofins also acquired Biotech-Germande SAS, one of the leading players in the environmental clinical testing and hospital hygiene market, as well as in medical device evaluation in France. Biotech-Germande complements Eurofins' growing footprint in the testing market for the healthcare sector in France. In March, Eurofins further strengthened its pharmaceutical products testing footprint with the acquisition of ams Laboratories and Advantar, two leading independent analytical and cGMP Quality Control (QC) service providers in Australia, and the US West Coast respectively. In April, Eurofins acquired PerkinElmer, Inc.’s U.S. prenatal screening laboratory services business PerkinElmer Labs/NTD, a reference laboratory in the US for first and second trimester prenatal screening. The acquisition strengthens Eurofins’ growing footprint in the genetics segment of the specialty clinical diagnostic testing market.
Eurofins completed the acquisition of EAC Corporation from Asahi Industries in Japan in May. EAC should reinforce the Group’s local footprint as well as its platform to further deploy the Group’s analytical expertise especially in water and dioxin testing. As part of the acquisition, Asahi and Eurofins entered into an exclusive service contract for a period of 3 years. At the end of May, Eurofins strengthened its leadership in the French food testing market with the acquisition of Agro-Analyses SAS, one of the leading analytical service providers supporting the food retail and catering sectors in France. In June, Eurofins acquired Bureau de Wit BV, one of the main laboratory service providers focused on food and water safety testing for the food production, hotel and catering sectors in The Netherlands. In July, the Group successfully closed the acquisition of Exova’s
food, water and pharmaceutical testing business in the UK & Ireland, reinforcing Eurofins’ existing footprint as well as expanding client reach in the UK and Ireland.
In September, Eurofins strengthened its footprint in the specialty clinical diagnostics market with the acquisition of VRL Laboratories, one of the leading laboratories in pre-transplant testing for the eligibility determination for Donors of Human Cells, Tissues, and Cellular and Tissue-Based Products (HCT/Ps) in the US. In the same month, Eurofins further reinforced its clinical diagnostics footprint in Europe with the acquisition of Megalab, one of the top five clinical diagnostic laboratory groups in Spain. Towards the end of the year, the Group further expanded its presence in North America with the acquisition of Exova’s environment testing business in Eastern Canada, and in Latin America with the acquisition of ASL Análises Ambientais, one of the leading environment testing service providers in Brazil.
Infrastructure
Eurofins delivered 46,000m2 of the 106,000m
2 of
laboratory surface planned to come on stream by the end of 2017 as part of its ongoing investment program to build the largest and most efficient state-of-the-art laboratory network in its industry. Between 2005 and 2016, Eurofins has added or brought to the most modern standards over 380,000m
2 of laboratory
space.
In-line with the positive outlook in the US domestic testing market, the Group is further expanding its laboratory campus in Lancaster, already the largest independent single-site laboratory in the world, with a planned 17,200m
2 extension to be completed by the
end of 2018, of which 1,600m2 is expected to come on
stream by the end of this year. Boston Heart Diagnostics (BHD) has also completed the extension of its testing facilities in Framingham, MA, which has increased its laboratory surface by over 40% to 9,300m
2. In Asia Pacific, the Group is on track to
complete the expansion of its main Chinese food testing laboratory in Suzhou, as well as the construction of new food testing laboratories in Australia and Singapore by the end of 2017. These projects follow the completion of the Group’s new laboratories in Hong Kong and India, as well as the multiple site upgrade and expansion projects in Australia and New Zealand in 2015. In addition to infrastructure expansion, the Group is also undertaking several site rationalization projects with part or full site upgrades, consolidating several small sites into fewer but larger industrialized sites, or simply moving some businesses into our large campuses to maximize synergies and optimize efficiencies across our businesses. The move to consolidate several small sites to a large campus in Hamburg is expected to be completed by 2019, as are the site consolidation programs in Benelux and Sweden.
Encouraged by the strong performance from its start-up laboratories, with the newly-opened laboratories from the latest start-up program (launched in 2014) generating 101% revenue growth in 2016, and the 18
13
laboratories from the previous program (launched in 2010) generating 22% revenue growth and 19% EBITDA margin in 2016, the Group has accelerated its current start-ups program. Between 2014 and the end of 2017, Eurofins plans to open 76 green-field laboratories (from the original 35 announced in 2015), which would mean an average of 20 start-ups launched per year during that period. This would take total start-ups launched by the Group to 110 laboratories between 2007 and 2017.
Post-closing events
Since the beginning of 2017, Eurofins completed the acquisition of one small clinical diagnostic testing laboratory in Ireland, one small German environmental testing laboratory and a pharma product testing laboratory in France.
Outlook
The management of Eurofins confirms the 2017 objectives initially announced in September 2016 of achieving revenues and adjusted EBITDA close to EUR 2.9bn and EUR 550m respectively, at current exchange rates, based on an objective of 5% organic growth and EUR 200m from acquisitions. Trends remain positive across the Group’s businesses, and Eurofins is on track for the achievement of its mid-term objectives of reaching EUR 4bn of revenues and EUR 800m of adjusted EBITDA by 2020.
1 Adjusted – reflects the ongoing performance of the mature and recurring activities excluding “separately disclosed items”. 2 Separately disclosed items - includes one-off costs from integration, reorganisation, discontinued operations and other non-recurring income and costs, temporary losses and other costs related to network expansion, start-ups and new acquisitions undergoing significant restructuring, non-cash accounting charges for stock options and free shares, impairment of goodwill, amortisation of acquired intangible assets, negative goodwill, discontinued activities and transaction costs related to acquisitions as well as income from reversal of such costs and from unused amounts due for business acquisitions, net finance costs related to borrowing and investing excess cash and one-off financial effects and the related tax effects. (Details in Note 2.3 of the 2016 Consolidated Financial Statements). 3 EBITDA – Earnings before interest, taxes, depreciation and amortisation, non-cash accounting charges for stock options and free shares, impairment of goodwill, amortisation of acquired intangible assets, negative goodwill, discontinued activities and transaction costs related to acquisitions as well as income from unused amounts due for business acquisitions. 4 EBITAS – Earnings before interest, taxes, non-cash accounting charges for stock options and free shares, impairment of goodwill, amortisation of acquired intangible assets, negative goodwill, discontinued activities and transaction costs related to acquisitions as well as income from unused amounts due for business acquisitions. 5 Net Profit – Net profit for equity holders after non-controlling interests but before payment to Hybrid capital holders 6 Basic EPS – earnings per share (basic) total (to equity holders before payment of dividends to Hybrid capital holders) 7 Operating Cash Flow – Net cash provided by operating activities (after tax) 8 Free Cash Flow to the Firm –Operating Cash Flow, less Net capex 9 Organic growth for a given period (Q1, Q2, Q3, Half Year, Nine Months or Full Year) - is an APM (Alternative Performance Measure) calculating the growth in revenues during that period between 2 successive years for the same scope of businesses using the same exchange rates but excluding discontinued activities. For the purpose of organic growth calculation for year Y, the relevant scope used is the scope of businesses that have been consolidated in the Group's income statement of the previous financial year (Y-1). Revenue contribution from companies acquired in the course of Y-1 but not consolidated for the full year are adjusted as if they had been consolidated as from 1st January Y-1. All revenues from businesses acquired since 1st January Y are excluded from the calculation. Eurofins provides in the Income Statement certain alternative performance measures (non-IFRS information such as “Adjusted Results1 and Separately Disclosed Items2”) that exclude certain items because of the nature of these items and the impact they have on the analysis of underlying business performance and trends. In addition, Eurofins shows the following measures: “EBITDA3, EBITAS4” in the Income Statement and “Organic growth9” with the objective to be close and consistent with the information used in internal Group reporting to measure the performance of Group companies and information published by other companies in the sector. Management believes that providing these APMs (Alternative Performance Measures) enhances investors' understanding of the company’s core operating results and future
prospects, consistent with how management measures and forecasts the company’s performance, especially when comparing such results to previous periods or forecasts and to the performance of our competitors. This information should be considered in addition to, but not in lieu of, information prepared in accordance with IFRS.
Dated February 23, 2017
14
5 Social & environmental information as of 31/12/2016
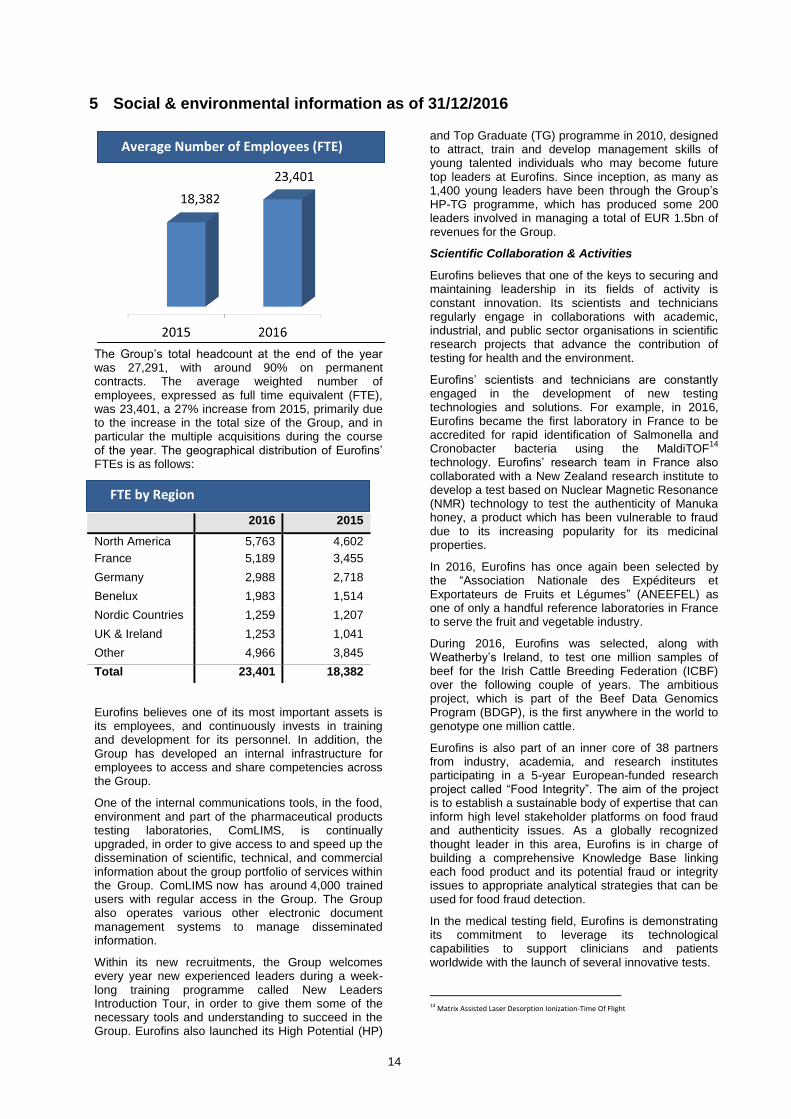
The Group’s total headcount at the end of the year was 27,291, with around 90% on permanent contracts. The average weighted number of employees, expressed as full time equivalent (FTE), was 23,401, a 27% increase from 2015, primarily due to the increase in the total size of the Group, and in particular the multiple acquisitions during the course of the year. The geographical distribution of Eurofins’ FTEs is as follows:
Eurofins believes one of its most important assets is its employees, and continuously invests in training and development for its personnel. In addition, the Group has developed an internal infrastructure for employees to access and share competencies across the Group.
One of the internal communications tools, in the food, environment and part of the pharmaceutical products testing laboratories, ComLIMS, is continually upgraded, in order to give access to and speed up the dissemination of scientific, technical, and commercial information about the group portfolio of services within the Group. ComLIMS now has around 4,000 trained users with regular access in the Group. The Group also operates various other electronic document management systems to manage disseminated information.
Within its new recruitments, the Group welcomes every year new experienced leaders during a week-long training programme called New Leaders Introduction Tour, in order to give them some of the necessary tools and understanding to succeed in the Group. Eurofins also launched its High Potential (HP)
and Top Graduate (TG) programme in 2010, designed to attract, train and develop management skills of young talented individuals who may become future top leaders at Eurofins. Since inception, as many as 1,400 young leaders have been through the Group’s HP-TG programme, which has produced some 200 leaders involved in managing a total of EUR 1.5bn of revenues for the Group.
Scientific Collaboration & Activities
Eurofins believes that one of the keys to securing and maintaining leadership in its fields of activity is constant innovation. Its scientists and technicians regularly engage in collaborations with academic, industrial, and public sector organisations in scientific research projects that advance the contribution of testing for health and the environment.
Eurofins’ scientists and technicians are constantly engaged in the development of new testing technologies and solutions. For example, in 2016, Eurofins became the first laboratory in France to be accredited for rapid identification of Salmonella and Cronobacter bacteria using the MaldiTOF
14
technology. Eurofins’ research team in France also collaborated with a New Zealand research institute to develop a test based on Nuclear Magnetic Resonance (NMR) technology to test the authenticity of Manuka honey, a product which has been vulnerable to fraud due to its increasing popularity for its medicinal properties.
In 2016, Eurofins has once again been selected by the “Association Nationale des Expéditeurs et Exportateurs de Fruits et Légumes” (ANEEFEL) as one of only a handful reference laboratories in France to serve the fruit and vegetable industry.
During 2016, Eurofins was selected, along with Weatherby’s Ireland, to test one million samples of beef for the Irish Cattle Breeding Federation (ICBF) over the following couple of years. The ambitious project, which is part of the Beef Data Genomics Program (BDGP), is the first anywhere in the world to genotype one million cattle.
Eurofins is also part of an inner core of 38 partners from industry, academia, and research institutes participating in a 5-year European-funded research project called “Food Integrity”. The aim of the project is to establish a sustainable body of expertise that can inform high level stakeholder platforms on food fraud and authenticity issues. As a globally recognized thought leader in this area, Eurofins is in charge of building a comprehensive Knowledge Base linking each food product and its potential fraud or integrity issues to appropriate analytical strategies that can be used for food fraud detection.
In the medical testing field, Eurofins is demonstrating its commitment to leverage its technological capabilities to support clinicians and patients worldwide with the launch of several innovative tests.
14 Matrix Assisted Laser Desorption Ionization-Time Of Flight
2016 2015
North America 5,763 4,602
France 5,189 3,455
Germany 2,988 2,718
Benelux 1,983 1,514
Nordic Countries 1,259 1,207
UK & Ireland 1,253 1,041
Other 4,966 3,845
Total 23,401 18,382
Average Number of Employees (FTE)
FTE by Region

15
During 2016, Diatherix launched ABRx™, the most comprehensive genetic resistance diagnostic on the market. In July, Viracor-IBT received Emergency Use Authorization (EUA) from the U.S. Food and Drug Administration (FDA) for its Zika Virus Real-time RT-PCR assay, a proprietary real-time RT-PCR assay intended for the qualitative detection of RNA from Zika virus in humans. Also in 2016, Boston Heart Diagnostics (BHD) launched Life Plan 2.0, the next generation of its scientifically-designed nutrition and lifestyle plan that provides patients at risk for cardiovascular disease with a highly personalized strategy to help them take control of their heart health.
In Europe, Biomnis launched a protocol, developed in partnership with Onco Drug Personalized Medicine (ODPM), that can help patients avoid certain severe toxic effects that can be caused by chemotherapy treatments.
Social and Charitable Initiatives
Beyond the Group's business activities, several Eurofins companies also contribute to various social projects and charitable work as part of their continuous commitment to contribute to the improvement of health and social conditions of everyone. Locally, many of its subsidiaries and laboratories engage in social activities and donate to charitable organisations independently, over and above those undertaken at Group level. Eurofins has been a long-term contributor to Plan International (https://plan-international.org) whose objective is to alleviate child poverty, and ProGreffe (http://www.progreffe.com), an organisation dedicated to research to improve organ transplants. Eurofins is also a supporter of Unicef (http://www.unicef.org/index.php), whose mission is to enhance children's rights, their development and survival. Eurofins also did contribute to the Red Cross (http://www.icrc.org/eng/), an organisation focused on providing humanitarian help for people affected by conflict and armed violence worldwide. For more information on this topic, please visit http://www.eurofins.com/about-us/corporate-social-responsibility/charitable-donations/. Environmental Information
By the very nature of its business, Eurofins’ testing activities allow us to play a direct role in contributing to the health and safety of all, and in building a sustainable future for our environment. Furthermore, within Eurofins, we are ever mindful of the impact of our activities on the environment. Eurofins' food and environmental testing services directly support the responsible use and minimisation of such things as pesticides, heavy metals, dioxins, persistent organic pollutants and chemical contaminants that are harmful to humans and the planet.
In general, the activity of Eurofins as a provider of testing and analysis services necessitates the use of limited amounts of water, raw material and energy (principally electricity and liquid nitrogen).
Some of the Group’s companies in Brazil and Northern Europe already use renewable energy
wherever possible such as that generated by wind, water or sun. Several laboratories also use energy created by recycled heat or from waste-fired energy generators.
Environmental Risk Management
Several Eurofins laboratories have developed and set up dedicated training programmes to good practice in terms of environmental risk management (e.g. safe use of chemicals and their application, proper waste disposal, autoclaving systems for decontamination, etc.). Some of the laboratories have their own department or person responsible for safety ("Safety Officer") which carries out regular inspection and internal training on the issues of safety and the protection of the environment. Eurofins actively encourages its business leaders to introduce and adopt best practices to ensure that our sites and operations are consistent with our mission of contributing to health and safety, which includes protection of the environment. One of our flagship laboratories in Lancaster, PA, for example, has undertaken the following commitments:
Reduction of carbon footprint by over 25,000 pounds of CO2 annually.
Procurement of 100% renewable electricity for its 259,000 square-foot facility.
Efforts to update lab equipment with new ENERGY STAR® rated equipment when possible.
Water monitoring programs that have already led to significant reduction in water consumption at the site.
Energy conservation efforts such as the use of CFL, T8 replacements and LED lighting; installation of motion sensors in offices, restrooms and hallways to turn off lights during times of inactivity; signage on fume hoods to prompt employees to lower sashes when not in use and reminders to turn off computers/monitors when not in use. These measures have reduced the overall heat load in the buildings by approximately 40 tons/year.
Implementation of a user-friendly, campus-wide recycling program. In addition to recycling aluminum, plastic and glass, Eurofins Lancaster Laboratories also recycles cardboard, batteries, magazines and stainless steel/HPLC columns. The company also partners with a local organization to recycle electronics.
Across our businesses, we strongly encourage environmentally conscious choices in an effort to reduce our impact on the environment. Several sites have established teams of environmentally conscious employees who work together to reduce consumption, encourage recycling, promote conservation and educate the workforce for the goals of improving the efficiency, reducing costs and minimizing the environmental impact of our operations. At Eurofins, we are committed to identifying and encouraging adoption of best practices for environmental protection and sustainaibility across our sites. For more information on this topic, please visit http://www.eurofins.com/about-us/corporate-social-responsibility/environment/.
16
6 Risk factors
Eurofins’ decisions, plans and objectives for the future are based on its management’s current views and expectations of the risks facing the business.
Eurofins’ management considers the following list to be as comprehensive as can reasonably be expected and does not consider there to be any other significant risks than those listed, given the current operating environment and without prejudice to any new or highly unusual events taking place. Nevertheless, Eurofins may be significantly affected by risks that its management has not identified or considered not to be material or the measures it undertook to avoid or limit those risks may not prove effective.
Some risks faced by Eurofins, whether they are mentioned in the following list or not, may arise from external factors beyond Eurofins’ control.
Where mitigations are mentioned in the following list, there is no guarantee that such mitigation actions will be effective, in whole or in part, to remove or reduce the effect of the risk. Some specific risks are also mentioned in the notes to the periodical financial statements.
1. Commercial risks
Changes in the market
Eurofins operates mainly in the food, pharmaceutical, environmental and clinical testing markets as well as individual testing, which are relatively less cyclical and less susceptible to the full impact of economic downturns than many other sectors. This is because of the basic underlying human need to consume food and drink and the consumer and governmental demands, certainly in more affluent and developed countries, that food and drink be safe for consumption. The pharmaceutical testing business is supported by the growth in pharmaceutical products development and use as well as by the search for new and more effective drugs within the framework of new drug development programmes. The environmental testing market is driven by regulations that are enforced in an increasing number of countries around the world.
In 2016, the global economy, especially in Europe, continued to struggle with sluggish growth and persistent uncertainty. The slower growth and consequent funding squeeze may negatively impact some of Eurofins’ customers, or governments may be forced to suspend or revoke regulations and reduce testing frequency to ease financial burden, which would directly impact our industry. If this were to be the case then the impact on Eurofins’ net worth, financial position and operating results could be severe, including the remote possibility of a cessation of the business.
Regulations and the regulatory environment
Eurofins also has businesses where regulatory supervision extends not only to the analytical process, but also to fee structures and/or schedules. This is particularly relevant in the clinical diagnostics market, where third-party payers, such as government/healthcare agencies and insurers have increased their efforts to control the cost, utilization and delivery of health care services. Reductions of reimbursement from these third-party payers, changes in policy regarding coverage of tests or other requirements for payment, such as prior authorization from a physician or the payer or qualified practitioner’s signature on test requisitions, may have a material adverse impact on the Company’s business. General Regulatory Risk
Many of the services Eurofins provides and the conduct of such services are subject to or influenced by laws and regulations that highly regulate the Group’s business or the businesses of the Group’s customers. Future government policies may adversely affect the supply of, demand for, and prices of Group services; restrict Eurofins’ ability to do business in its existing and target markets; and adversely affect the Group’s revenues and operating results. Eurofins’ operating results could be affected by changes in other governmental policies, mandates, and regulations including monetary, fiscal and environmental policies, laws, regulations, acquisition approvals, and other activities of governments, agencies, and similar organizations. These risks include but are not limited to changes in a country’s or region’s economic or political conditions, local labor conditions and regulations, reduced protection of intellectual property rights, changes in the regulatory or legal environment, restrictions on currency exchange activities, currency exchange fluctuations, burdensome taxes, enforceability of legal agreements and judgments, and adverse tax, administrative agency or judicial outcomes. International risks and uncertainties, including changing social and economic conditions as well as terrorism, political hostilities, and war, could limit our ability to transact business in individual markets and could adversely affect our revenues and operating results. Certain Service Line Regulatory Risk
Certain of the Group’s service lines are subject to more stringent legal and regulatory requirements governing such activities, and the Group or its subsidiaries may face substantial fines and penalties, and such service line business activities may be impacted, if we fail to comply. In particular, the Group’s medical diagnostic business is subject to or impacted by extensive and frequently changing healthcare laws and regulations, (especially in the United States at both the federal and state levels and in France), as well as in other jurisdictions in which the Group engages in such business. While Eurofins seek to conduct our medical diagnostic business in compliance with all applicable laws

17
regulating such business, many of the laws and regulations applicable to such business, especially in the US and France, are vague or indefinite and have not always been fully or partly interpreted by courts, including many of those relating to:
billing and reimbursement of clinical testing;
certification or licensure of clinical laboratories;
the anti-self-referral and anti-kickback laws and regulations;
the laws and regulations administered by the Food and Drug Administration (“FDA");
the corporate practice of medicine;
operational, personnel and quality requirements intended to ensure that clinical testing services are accurate, reliable and timely;
physician fee splitting;
relationships with physicians and hospitals;
safety and health of laboratory employees;
protection of patient’s data;
handling, transportation and disposal of medical specimens, infectious and hazardous waste and radioactive materials; and
the control of laboratories by medical “biologists” practitioners in France.
These laws and regulations applicable to Eurofins activity may be interpreted or applied by a prosecutorial, regulatory or judicial authority in a manner that could require us to make changes in our operations, including our pricing and/or billing practices. We may not be able to maintain, renew or secure required permits, licenses or any other regulatory approvals needed to operate our medical diagnostic or other businesses. If we fail to comply with applicable laws and regulations, or if we fail to maintain, renew or obtain necessary permits, licenses and approvals, we could suffer civil and criminal penalties, fines, financial claims, exclusion from participation in governmental healthcare programs and the loss of various licenses, certificates and authorizations necessary to operate our medical diagnostic and/or other businesses, as well as incur additional liabilities from third-party claims. If any of the foregoing were to occur, our reputation could be damaged and important business relationships with third parties could be adversely affected. Some of our businesses may regularly receive requests for information from governmental authorities (and occasionally subpoenas in US).
For example, several companies in the cardiac biomarker laboratory services business, including the Group’s Boston Heart Diagnostics (BHD) subsidiary, are currently cooperating with investigations that the US Department of Health and Human Services, Office of Inspector General (OIG), is conducting in conjunction with the US Department of Justice (DOJ) related, in part, to payments made to physicians for services performed in connection with blood specimen processing and handling services. Two qui tam cases were filed against BHD. The US government declined to intervene in these for the time being but one or both of these cases may continue for a long time and may create a liability / cost in excess of the indemnified recoverable values from the acquisition of BHD. Although BHD is fully cooperating with the OIG and DOJ and vigorously defending the qui tam suits,
neither BHD nor the Group can at this time estimate what, if any, impact these matters and any results from these matters could have on our bioanalytics business in general or our medical diagnostics business in particular. We also are subject in the US from time to time to qui tam claims brought by former employees or other “whistleblowers.” The governments and insurance companies continue to strengthen their scrutiny and enforcement efforts against perceived healthcare fraud. Legislative provisions relating to healthcare fraud and abuse provide government enforcement personnel substantially increased funding, powers, penalties, and remedies to pursue suspected cases of fraud and abuse. In addition, the US Government has substantial leverage in negotiating settlements since the amount of potential damages far exceeds the rates at which we are reimbursed for our services, and the government has the remedy of excluding a non-compliant provider from participation in the Medicare and Medicaid programs. Regardless of merit or eventual outcome, these types of investigations and related litigation can result in:
diversion of management time and attention;
expenditure of large amounts of cash on legal fees, costs and payment of damages;
limitations on our ability to continue some of our operations;
enforcement actions, fines and penalties or the assertion of private litigation claims and damages;
decreased demand for our services ; and/or
injury to our reputation. Although Eurofins believes that Group operations are in compliance, in all material respects, with applicable laws and regulations with respect to our medical diagnostic services, both in the US and in other countries where Eurofins operate, there can be no assurance that a regulatory agency or tribunal would not reach a different conclusion. Moreover,

18
even when an investigation is resolved favorably, the process may be time-consuming and the legal costs and diversion of management focus may be extensive. Insurance companies covering health care costs may also refuse payments to Eurofins companies, threaten or launch legal actions, in connection to violation of laws or their policies. Changes in applicable laws and regulations with respect to our medical diagnostic business or our other service lines may result in existing practices becoming more restricted, or subject existing or proposed services to additional costs, delay, modification, withdrawal or reconsideration. Such changes also could require Eurofins to modify its business objectives. Regulatory Approval, Accreditation and Professional Licensing Risks
Eurofins is required to obtain and hold permits, licenses and other regulatory approvals from, and to comply with operating and security standards of, numerous governmental bodies. Failure to maintain or renew necessary permits, licenses or approvals, or to comply with required standards, could have an adverse effect on our results of operations and financial condition. Group customers may require evidence of various professional licensing and accreditation as part of their selection of a provider of bioanalytical services and various governmental and regulatory authorities may mandate certain accreditations and professional licensing in connection with the performance of various services, especially with regard to the medical diagnostics market. Although Eurofins believe its operations are in compliance with all material accreditation and professional licensing requirements, there can be no assurance that it will always be able to obtain accreditations and professional licenses necessary or desirable for its business in each jurisdiction in which it operates or seeks to operate. A material delay in obtaining, the failure to obtain, or the withdrawal or revocation of material licenses, approvals, or other authorizations could have a material adverse effect on individual operations within the Group or, more broadly, could have a negative effect on the Group’s overall operations. Deregulation Risk
From time to time efforts are made to limit or prohibit the disclosure of information that might be revealed by various bioanalytical testing we offer or may offer in the future. For example, in the United States various groups oppose mandatory and/or voluntarily labeling of genetically modified (GMO) foods. Likewise various groups and governments have opposed mandatory and/or voluntarily labeling of the country of origin for assorted foods, including pursuant to various international trade agreements. Although Eurofins deems it to be unlikely, a material relaxation of certain regulations or a prohibition on certain types of disclosure could have a negative impact on the demand for, or growth of, certain of our services. Likewise, our toxicology testing businesses, which currently compose a small part of the Group’s overall business, could be negatively
affected by a ban on or limitations on this type of testing in specific jurisdictions or by other successful actions taken by groups opposed to such testing. Changes in regulations that, for example, streamline procedures or relax approval standards with respect to pharmaceuticals could reduce the need for our pharmaceutical bioanalytics services. If companies regulated by the FDA and other national regulatory authorities where Eurofins operates were subject to such deregulation, we could have fewer business opportunities and our revenues could decrease, possibly materially. Despite the foregoing and similar actions, Eurofins believes the current trend of increasing demand for verification and security is more likely to lead to greater regulation of, and disclosure with respect to, products subject to bioanalytical testing. Customer and credit risk
The clients of Eurofins are very varied in number, in size and in location. They belong to top global companies (e.g. global food & beverages producers, or retailers for our Food & Feed testing activities; 9 out of the top 10 global pharmaceutical companies for our Biopharma testing activities; consulting and sampling companies for our Environmental testing activities) as well as small independent companies in each segment. Eurofins’ performance and value are influenced by many stakeholders, including employees, customers, suppliers and strategic partners. To minimise risk and exposure Eurofins does not rely on a single customer or supplier contract. There are at present no significant dependencies on suppliers or individual customers. Nonetheless, whilst the Eurofins Group is not dependent on any one external entity, certain subsidiaries may have more significant exposure to one client, or a small group of clients, relative to the size of those subsidiaries. In 2016, no customer was responsible for more than 2% of overall Group sales. The majority of our customers’ contracts can be terminated upon short notice. Customers terminate or delay their contracts for a variety of reasons. The loss, reduction in scope or delay of a large contract or the loss or delay of multiple contracts could adversely affect our business, although our contracts frequently entitle us to receive the costs of winding down the terminated projects, as well as all fees earned by us up to the time of termination. Some contracts also entitle us to a termination fee but this is not always or often the case. Eurofins believes its customer base is diverse. Furthermore, based on the general credit profile and quality of the Group’s customers, Eurofins believes the risk of bad debts or the insolvency of its customers is generally low. Eurofins periodically reviews its customer accounts and considers its provision for doubtful accounts and bad debts to be appropriate. Severe or long-lasting adverse changes in the global economy in general or in particular individual markets could have an adverse effect on our customers and, in turn, increase the Group’s credit risk or decrease the demand for its services.

19
Contractor and Supplier Risks
Successful delivery of Eurofins’ services to its customers is dependent on complex technologies utilizing equipment and materials from multiple suppliers. Failure to deliver services may lead to a reduction in Eurofin’s expected revenue and could impact the Company’s credibility to both existing and potential customers. Therefore stability in the business strategies of the Company’s suppliers is also important to the successful functioning of Eurofins. The Company utilizes certain third party contractors, vendors, and suppliers in the ordinary course of its business. Individual laboratories subcontract on an ad hoc basis for specific technical know-how or services, to address production capacity demands or limitations or for other reasons related to specific applications or services. The main suppliers to the business are in the following main categories: laboratory equipment, laboratory consumables (these first two often overlap), information technology (IT), and logistics. In each category, the Group utilizes multiple suppliers and does not believe it is dependent on any major supplier. The Group believes there are currently additional available subcontractors, vendors, and suppliers for all of our subcontracted service needs, laboratory equipment and consumables supply needs, and contracted IT needs. However, a full range of subcontract services, suppliers, and vendors may not be locally available in all of the Group’s markets and localized disruptions could adversely affect our operations for a limited period of time. The Group seeks to minimize its subcontractor, vendor, and supplier risk through a professional sourcing and contracting process and in-house production capacity for some critical items. During the sourcing process, the Group reviews the risk profile of most major vendors and assesses the criticality and availability of their services and supplies to the Group Business. Despite these initiatives, plans, and procedures, such measures may not be adequate or implemented properly or sufficiently to prevent business disruption in every instance or major price increase by or dependency from certain suppliers, and Eurofins is subject to various risks and potential liability in the case of errors by its subcontractors.
Market expansion, establishment of new companies and business segments, internationalisation
Eurofins bases a large part of its future growth on expected penetration of new regional markets. Even though Eurofins has been able to accumulate extensive experience in doing business internationally in the past and already has contacts in the various target regions for its international growth strategy, the risks in executing the Group’s business strategy in and for new markets could lead to a delay or even a failure in implementation of Eurofins’ international growth strategy, attempts at market development, and entry into new markets. Such failure could have a material adverse effect on
Eurofins’ net worth, financial position and operating results.
Expansion and Acquisition Risks
It is the strategic approach of Eurofins to acquire companies, new laboratories, and technologies in order to obtain access to complementary technologies and to expand the Group's market position in Europe, North America, and Asia as well as in other parts of the world. Our business has experienced substantial expansion in the past and such expansion and any future expansion could strain Group resources if not properly managed. Future rapid expansion could strain Group operational, human, and financial resources. In order to manage expansion, Eurofins must:
continue to improve operating, administrative, and information systems;
accurately predict future personnel and resource needs to meet customer commitments;
track the progress of ongoing client projects; and
attract and retain qualified management, sales, professional, scientific, and technical operating personnel.
If Eurofins does not take these actions and is not able to manage the expanded business, the expanded business may be less successful than anticipated. Eurofins may be required to allocate existing or future resources to the expanded business, that in either case, the Group would have otherwise allocated to another part of our business. Some of the companies we acquire may not develop as planned, breach agreements with clients or regulatory or accounting rules and even ultimately fail. This could cause major financial losses and the need for substantial write offs for Eurofins. If Eurofins is unable to successfully execute its acquisition strategies and successfully integrate acquired businesses, our business, results of operations and financial condition could be adversely impacted. Historically, Eurofins’ growth strategy has been based in part on our ability to acquire existing businesses, services or technologies. We do not know whether in the future we will be able to:
identify suitable businesses or technologies to buy;
successfully perform business diligence and identify all materials risks associated with the acquisition;
complete the purchase of any such businesses or technologies on terms acceptable to Eurofins;
20
successfully integrate the operations of acquired businesses into the Group;
obtain financing necessary for an acquisition at all or on commercially acceptable terms; or
retain key personnel and customers of acquired businesses.
We compete with other potential buyers for the acquisition of existing businesses and technology. This competition may result in fewer opportunities to purchase companies that are for sale. It may also result in higher purchase prices for the businesses that we want to purchase. We may also spend time and money investigating and negotiating with potential acquisition targets but not complete the transaction. Any future or past acquisition could involve other risks, including liability risks and reputational damage to the Group as a result of unprofessional or lower quality business practices of acquired operations, the assumption of additional liabilities and expenses, issuances of potentially dilutive securities or interest-bearing debt, transaction costs, and diversion of management's attention from other business concerns. From time to time, Eurofins may enter into contingent agreements such as an earn-out agreement with the sellers of acquired companies for which calculations are typically based on the fulfilment of certain conditions by a pre-determined date. From time to time, such agreements lead to disputes, or even litigation. It cannot be excluded that in the future that one or more of these disputes could cause costs above those provisioned in the Group accounts. For more information on such risks, please see the notes to the 2016 consolidated financial statements (note 3.14).
Competition
The bioanalytics industry is highly competitive. We often compete for business not only with other, often independent bioanalytics companies, but also with internal analytics departments within some of our customers or governments. If we do not compete successfully, especially with respect to the competitive advantage of outsourcing analytics requirements to companies such as ours, our business will suffer. The industry is highly fragmented, with numerous smaller specialized companies and a handful of full-service companies with global capabilities similar to ours. Increased competition might lead to price and other forms of competition that might adversely affect our operating results. As a result of competitive pressures, our industry has experienced consolidation in recent years and we expect such trend toward consolidation to continue. This trend is likely to produce more competition among the larger companies for both customers and acquisition
candidates. Bioanalytic testing companies generally compete on:
regulatory compliance record;
reputation for on-time quality performance;
quality systems;
previous experience;
medical and scientific expertise in specific testing and diagnostic areas;
scope of services;
quality of data and related services;
financial viability;
database management;
statistical and regulatory services;
ability to recruit scientists and other personnel;
ability to integrate information technology with systems to optimize research efficiency;
accreditation and quality of facilities;
international presence with strategically located facilities; and
price.
Eurofins is confident in its know-how and expertise accumulated by its scientific teams, in particular in its database of methods and test results. Nevertheless, there is no certainty that it will have the necessary resources in order to successfully deal with changes in the market, a process of consolidation, or the entry of new competitors into its markets.
Some of the current and potential competitors have longer business experience or greater financial resources or marketing capacities at their disposal than Eurofins. Some have a better-known name in their market segment and a larger customer base. Eurofins proceeds from the assumption that the market for the supply of analytical testing methods will become more concentrated.
It also cannot be ruled out that financially powerful market participants, such as food or water companies or other large corporations may enter into competition with Eurofins and create challenges that Eurofins will have to overcome.
Cost pressures, price falls and profit margins
As a result of competition and improvement of testing technologies, test prices do and can fall,

21
especially for the most common and standard tests. It is impossible to rule out further significant price reductions in the market for food, pharmaceutical, clinical or environmental analysis. At the same time, due to factors such as inflation, Eurofins’ costs could grow due to increased expenses for personnel, materials and other supplies/resources. Although Eurofins will attempt to maintain or improve profit margins through measures to increase scale and cost efficiency, there can be no certainty that Eurofins’ profit margins may not significantly decrease in the future. Sustained erosion of its margins would have adverse effects on Eurofins’ net worth, financial position and operating results and even its very existence.
2. Financial Risks
Liquidity risk
Eurofins has entered into several loan and credit facility agreements to ensure the Group has sufficient financial liquidity to be able to respond swiftly to strategic opportunities.
Eurofins periodically carries out reviews of the liquidity risk and considers itself able to face its current financial obligations. In regards to the current economic environment it should be noted that Eurofins and its subsidiaries are compliant with the criteria of the most important respective lines of credit and at this time do not anticipate any particular liquidity problems or issues regarding the financial covenants within the near future.
The Group’s ability to generate sufficient cash flows from operations to make scheduled payments on our debt obligations will depend on our future financial performance, which will be affected by a range of economic, competitive, regulatory, legislative, and business factors, many of which are outside of our control. If Eurofins is unable to meet debt service obligations or comply with covenants, a default under debt agreements would occur. To avoid a possible default or upon a default, Eurofins could be forced to reduce or delay the completion or expansion of new laboratories and technologies, sell assets, obtain additional equity capital, or refinance or restructure its debt. In order to finance parts of the acquisition and expansion costs, the Company and its subsidiaries have entered into several loan and facility agreements as described in this report. Such loans and facilities are either based on a fixed rate or on a variable rate. The variation risk of some loans and facilities with a variable interest rate in the Company and in some of its subsidiaries has been partially hedged by various financial instruments (e.g., swap with a fixed rate or cap with a maximum interest rate covering a certain period). However, as there are certain lines of credit that are still based on a variable rate, it cannot be excluded that the interest rate concerning these loans will rise in the future. This could have an adverse effect on the Company's liquidity, financial position, and operating results.
For more information on financial risk management, please see the notes to the 2016 consolidated financial statements (note 4.2).
Future capital requirements risk
Eurofins’ strategic growth, particularly the acquisition of new laboratories and technologies in order to obtain access to complementary technologies and to expand Eurofins’ market position in different continents, requires the extensive use of resources. Eurofins believes that it has sufficient internal funds for its current needs. It cannot be ruled out, however, that Eurofins may determine that it is necessary or desirable to acquire additional funds through public or private financing, including external and equity capital financing or other agreements. Any additional acquisition of equity capital may have a dilutive effect for shareholders, while external financing may subject Eurofins to restrictions in dividend payouts or other restrictions.
In light of the current economic uncertainty, and the volatility in the capital markets, particularly in Europe, it is also possible that adequate funds may not be available at all, at the proper time, or under acceptable conditions, either through procurement via the capital markets or other means. If additional financing is limited or unavailable, Eurofins could be forced to limit the planned expansion of its business activities. Furthermore, if Eurofins’ business activities are incurring deficits at that point in time, and should additional Eurofins funds be unavailable to finance its business activity, it cannot be ruled out that Eurofins will be unable to maintain its operational business activity.
Interest rate risk
As previously noted Eurofins’ exposure to the risk of changes in market interest rates relates to variable interest rate indebtedness and hedging activities. To mitigate the Group’s exposure to interest rates changes, Eurofins has entered into several and in the future might enter into additional hedging contracts in order to limit the potential impact of adverse changes in interest rates. However, there are no guarantees that such contracts would be sufficient to fully protect the Group in the event of large interest rate volatility. Also hedging contracts entered into may have negative consequences on its income statement (paying interests based on higher rates than market in a given period) and balance sheet (derivative accounting on hedging instruments) which could have a material adverse effect on the Group's net worth, financial position and operating results.
Foreign currency risk
Eurofins’ reported financial performance can be impacted by changes in foreign currencies (both transaction and translation related). To mitigate the Group’s exposure to currency fluctuations, Eurofins might enter into several hedging contracts in order to limit the potential impact of adverse changes in

22
foreign currency fluctuations. However, there are no guarantees that such contracts would be sufficient to fully protect the Group in the event of large volatility in one or more foreign currencies. Also hedging contracts entered into may have negative consequences on its income statement and balance sheet (derivative accounting on hedging instruments) which could have a material adverse effect on the Group's net worth, financial position and operating results.
Counterparty risk
Eurofins exposure relates to the potential default of a counterparty holding financial assets (cash and cash equivalents held for trading financial assets, loans receivable and derivative instruments), with the maximum exposure being equal to the carrying amount of these instruments. The counterparty risk from a cash management perspective is sometimes reduced by the implementation of several cash pools, accounts and related paying platforms with different counterparties.
To mitigate the counterparty risk, Eurofins endeavours to mainly deal with recognised financial institutions with an appropriate credit rating. All counterparties are generally financial institutions which are regulated and controlled by the national financial supervisory authorities in their respective countries.
For more information on market and counterparty risks, please see the notes to the 2016 consolidated financial statements (note 4.5).
Revenues and results variability
Revenues and results depend on many factors and may not reach the level expected by the Group or by analysts or even already reached on previous results. Eurofins’ revenues vary from one quarter to another because of the seasonality of its activities (with a traditionally low cycle at the beginning of the year) and it is expected that these fluctuations shall carry on. Eurofins’ revenues may also vary from one accounting year to another. Fluctuations in Eurofins’ revenues can have a strong impact on various factors within the business. These factors include the continued acceptance of the existing services offered by the Group, the acceptance of future services offered by the Group, changes in the prices of services, changes in terms of staff and employees, increasing competition, economic and market conditions, the financial health of or consolidation between Eurofins’ customers, legal changes that could have an impact on Eurofins’ activities, and other economic factors. Fluctuations in Eurofins’ revenues and results may have an additional significant impact on the level and volatility of Eurofins’ stock price.
3. Technological risks
Rapid Technological Change Risks
The Group’s future success depends on our ability to keep pace with rapid technological changes that
could make our services and products less competitive or obsolete. The bioanalytics industry generally and, more specifically, biologic, genomics, and medical testing are subject to increasingly rapid technological changes. Our competitors or others might develop technologies, services or products that are more effective or commercially attractive than our current or future technologies, services or products, or that render our technologies, services or products less competitive or obsolete. If competitors introduce superior technologies, services or products and we cannot make enhancements to ours to remain competitive, our competitive position and, in turn, our business, revenues, and financial condition, would be materially and adversely affected.
Patents
Our bioanalytics business is dependent, in part, on our ability to obtain patents in various jurisdictions on our current and future technologies and services, to defend our patents and protect our trade secrets and to operate without infringing on the proprietary rights of others. There can be no assurance that our patents will not be challenged by third parties or that, if challenged, those patents will be held valid. In addition, there can be no assurance that any technologies or products developed by us will not be challenged by third parties owning patent rights and, if challenged, will be held not to infringe on those patent rights. The expense involved in any patent litigation can be significant. We also rely on unpatented proprietary technology, and there can be no assurance that others will not independently develop or obtain similar products or technologies.
Eurofins attempts to obtain patent protection as deemed appropriate for its inventions from the appropriate patent offices. The prosecution and/or defence of this protection can involve a great deal of time and entail significant costs. There is no guarantee that all of the applications for patents filed will successfully pass the examination process. As noted above, there is a risk that Eurofins could be subjected to patent litigation with third parties and that an examination process could end with a negative result for Eurofins. The loss of material patents, material successful infringement claims or the costs of litigation, all could have a negative effect on the net worth, financial position and operating results of Eurofins.
In addition, it cannot be ruled out that patent rights will not be identified in the future that can significantly impair Eurofins’ business activities. For example, no guarantee can be given that the research conducted by Eurofins and its patent attorneys has actually uncovered all relevant patents/patent applications. Likewise, it is possible for competitors to develop technology processes that Eurofins would like to use, but with respect to which Eurofins cannot obtain a license nor have the rights thereto invalidated. Eurofins is aware and has been aware from time to time of various potential infringements of its patents or copies of its technology but in view of the limited impact of these on Eurofins’ markets so far and the cost, duration
23
and uncertainty of legal action, Eurofins has not generally deemed necessary to take legal actions. It cannot be ruled out that these infringements or copies make a larger impact on existing or future markets in which Eurofins operates or may seek to operate with a corresponding negative impact on Eurofins’ operations or results of operations.
Infringement of property rights
Industrial property rights allow patent infringement litigation to be initiated to obtain injunctive relief and compensatory damages. Claims for commensurate compensation can be asserted in legal action based on published patent applications. Competitors can be prevented from using the patented technology based on an enforceable judgment.
It may also become necessary to take legal action against third parties that infringe upon the (licensed) patents of Eurofins or patents Eurofins will receive in the future, and to defend against patent infringement litigation brought by third parties. Furthermore, if a completely or partially legally valid patent of a third party or a patent subject to an opposition procedure or national invalidity proceedings is the subject of patent infringement litigation brought by a third party against Eurofins, and if the court hearing the case were to decide that Eurofins has infringed upon the patent, the court could prohibit the further use of the analytical method and could award the third party compensatory damages for the past patent infringement. In addition, Eurofins could be a plaintiff in litigation concerning its own patents and not win the case or fail to be successful to the extent necessary. In this case, for example, a third party could bring competing technologies to market, resulting in a negative effect on Eurofins’ business activities and its net worth, financial position and operating results. Such patent disputes can extend over long periods of time and tie up significant Eurofins personnel and its financial potential.
Neither Eurofins nor its patent attorneys can guarantee that patent rights of third parties do not exist that could impair the business operations of Eurofins. In addition, there is no certainty that a national court will not interpret the scope of protection offered by the patent of a third party differently than Eurofins and its patent attorneys. This could result in Eurofins or one of its business partners being charged with patent infringement and not succeeding in invalidating the patent alleged to be infringed, although neither Eurofins nor its patent attorneys had viewed the corresponding action in this document as a patent infringement or had viewed the patent not strong enough to withstand legal proceedings.
Licenses and research contracts
Eurofins’ business involves entering into license, collaboration and other agreements with third parties relating to the development of the technologies and products both as licensor and licensee. There is no guarantee that Eurofins will be able to negotiate commercially acceptable licenses
or other agreements necessary for the future exploitation of its technologies and products or that any of its licenses or other agreements will be successful. In addition, there is no guarantee that Eurofins’ collaborative partners will not pursue or develop competing technologies or products, either on their own or in collaboration with others. Eurofins’ license agreements are generally for a fixed term and, prior to the expiry of such term, may be terminated in certain circumstances, some of which may be beyond the control of Eurofins. There is no certainty that license agreements that expire or are terminated will be renewed or replaced which could have an adverse effect on Eurofins’ business, financial condition, operating results and prospects.
Information Security Risks
Attacks on our IT systems, or failure or delays in these systems or their interconnections, including failures resulting from our systems could disrupt our operations and cause the loss of confidential information, customers and business opportunities or otherwise adversely impact our business. IT systems are used extensively in virtually all aspects of our business, including clinical testing, test reporting, billing, customer service, logistics, and management of data. Our success depends, in part, on the continued and uninterrupted performance of our IT systems. IT systems may be vulnerable to damage, disruptions and shutdown from a variety of sources, including telecommunications or network failures, human acts, and natural disasters. Unauthorized persons may seek to obtain intellectual property and other confidential information like client or patient data that we house on our IT systems. Moreover, despite the security measures we have implemented, our IT systems may be subject to physical or electronic intrusions, computer viruses, unauthorized tampering and similar disruptive problems. A failure of our network or data gathering procedures could impede the processing of data, delivery of databases and services, customer orders and day-to-day management of our business and could result in the corruption or loss of data and ultimately to the failure of our operations. While we have disaster recovery plans for parts of our operations, and are continuously extending those plans and updating our methodologies and have taken precautionary measures to prevent or minimize vulnerabilities in our IT systems, including the loss or theft of intellectual property and other confidential information that we house on our systems, they might not adequately protect us. Since 2013, we have continued to update and upgrade our IT systems and strengthen precautionary measures to reduce the risk of, and to detect and respond to, future cyber threats including through regular monitoring of our systems and implementation of various “best practices”. However, cyber threats and the consequences of human error or system failures are constantly evolving, thereby increasing the difficulty of detecting and successfully defending against them. Breaches of our network or data security could

24
disrupt the security of our internal systems and business applications, impair our ability to provide services to our customers, compromise intellectual property or confidential information or otherwise adversely impact our business. There can be no assurances that our precautionary measures will prevent or successfully defend against cyber threats, human errors or system failures that could have a significant impact on our business. Despite any precautions we take, damage from fire, floods, hurricanes, power loss, telecommunications failures, computer viruses, break-ins and similar events at our computer facilities could result in interruptions in the flow of data to our servers and from our servers to our customers. In addition, any failure by our computer environment to provide our required data communications capacity could result in interruptions in our service. In the event of a delay in the delivery of data, we could be required to transfer our data collection operations to an alternative provider of server hosting services. Such a transfer could result in delays in our ability to deliver our products and services to our customers. Additionally, significant delays in the planned delivery of system enhancements, improvements and inadequate performance of the systems once they are completed could damage our reputation and harm our business. Finally, long-term disruptions in the infrastructure caused by events such as natural disasters, sabotage, cyber crime, the outbreak of war, the escalation of hostilities and acts of terrorism, particularly involving cities in which we have offices, could adversely and fatally affect our businesses. Although we carry cybercrime insurance, our coverage might not be adequate to compensate us for all risks and losses that may occur.
Confidential Information
Eurofins has confidentiality agreements with numerous customers not to disclose the results of analyses or other confidential information. If Eurofins were to fail to comply with these agreements or laws concerning patient data privacy, Eurofins could suffer financial penalties.
As a mitigating measure, it is a general rule that new staff members are contractually committed not to reveal any technology or any results of analysis; access to the whole database is limited to a low number of staff. Staff in sensitive positions are often contractually bound by post-contractual non-compete clauses in those countries where these are generally practised and permitted by law.
Nonetheless, it is impossible to categorically rule out detrimental risk to Eurofins from the disclosure of confidential information to outside parties. Unauthorized access to Eurofins’ proprietary information or to clients’ or patients’ data in the Group’s computers or online tools could cause significant damage.
Research & development projects
In the past Eurofins has participated in various research and development (R&D) projects.
Currently, there are several internal and collaborative research and development projects running including projects with the European Union. In the past, the majority of research projects undertaken by Eurofins have led to the successful application of new analytical methods. However, investment in R&D by its very nature presents a risk. The potential products and services to which we devote R&D resources might never be successfully developed or commercialized by the Group for numerous reasons, including:
inability to develop products or services that address our customers’ needs;
inability to bring the products or services to market in a cost-effective or competitive manner;
inability to obtain regulatory approvals in a timely manner or at all;
competitive products or services with superior performance;
patent conflicts or unenforceable intellectual property rights;
lack of demand for the particular product or services; and
other factors that could make the product uneconomical or infeasible.
Incurring material R&D expenses for potential products or services that are not successfully developed and/or commercialised could have a material adverse effect on our business, financial condition, prospects and stock price, especially in light of the fact that returns on investment may only be realized over an extended period of time or not at all.
4. Industrial risks
Partial or total destruction of the testing databases
Eurofins maintains databases containing information on almost all of its available tests, in addition to data such as isotopic and other analytical fingerprints on products capable of analysis by Eurofins, and which represent an integral part of its technological advance.
If the databases were to be corrupted, damaged, or destroyed, Eurofins’ business could be adversely affected. To limit the risk of a partial or total destruction, the main databases are kept in a cluster of high availability datacentres interconnected via high-speed communication lines. To further ensure availability, Eurofins and its subsidiaries systematically apply off-site back-ups of the databases.

25
Environmental Contamination risks
Our business uses biological and hazardous materials, which could injure people or violate laws, resulting in liability that could adversely impact our financial condition and business. Our activities involve the controlled use of potentially harmful biological materials, as well as hazardous materials, solvents and other chemicals, and various radioactive compounds. While our risk may be mitigated by the relatively small quantities of such materials used, we cannot completely eliminate the risk of accidental contamination or injury from the use, storage, handling or disposal of these materials including in the case of error, accident, fire or other damage to our facilities or in the case of the failure of specialized companies which often dispose of such materials for us to comply with their contractual and regulatory obligations. While Eurofins maintains insurance for environmental liabilities at levels which the Group believes are appropriate, in the event of contamination or injury, we could be held liable for damages that result, and any liability could exceed our insurance coverage and ability to pay. Any contamination or injury could also damage our image and reputation, which is critical to obtaining new business. In addition, we are subject to one or more levels of laws and regulations in the countries in which we operate governing the use, storage, handling and disposal of these materials and specified waste products as well as the remediation to be taken in the event of an environmental incident or damage to bio-diversity. The cost of compliance with these laws and regulations is significant and if changes are made to impose additional requirements, these costs could increase and have an adverse impact on our financial condition and results of operations.
Professional Liability
As a general matter, providers of (bio)analytical services may be subject to lawsuits alleging negligence, errors and omissions or other similar legal claims. These lawsuits could involve claims for substantial damages. For example, Eurofins’ business contains the potential risk of substantial liability for damages in the event of analytical errors where Eurofins and its subsidiaries not only verify the authenticity of the products analysed, but also look to detect dangerous components (pathogens, prions, pesticides, asbestos, mycotoxins, dioxins, toxic substances, etc.). Since these results may be relied upon and used in the marketing activities of Eurofins’ clients, such negligence, errors or omissions in the (reporting of the results of the) analyses could potentially lead to Eurofins’ clients being forced to organise a product recall or suffering other financial losses.Potential errors could even have a wider impact on consumers’ health or property. In the event that Eurofins would be found responsible for these damages, its liability could be very large. Errors or omissions in the analyses performed by Eurofins’ clinical diagnostics division could also potentially impact patients’ health.
Although Eurofins practices quality assurance programmes and staff training designed to prevent
errors in its laboratories, the risk of human error or accident can never be totally ruled out.
As a first line of defence however, the service contracts entered into by Eurofins for the analysis of samples and products generally provide that Eurofins’ liability for damages is limited to circumstances directly arising from the samples or products that have been examined by Eurofins. Eurofins believes that these clauses when applicable and enforceable by law substantially limit the liability in case of an analytical error. However, any professional liability litigation could also have an adverse impact on our client base and reputation.
The second line of defence in place is part of Eurofins’ business and risk management policy, where a global and centralised general and professional liability insurance program has been set up.
Insurances
As part of Eurofins’ risk management policy, various global and centralised insurance policies have been rolled out, covering different types of risks, such as damage to Eurofins’ assets and associated financial losses, liabilities as well as other insurance policies required for its activities. In 2016, Eurofins continued its policy of centralising insurance programs, enabling it to improve coverage, while gaining more visibility on the different local insurances and keeping overall insurance costs under control. For confidentiality reasons, insurers and insured limits cannot be disclosed.
In the frame of its global insurance programs, the Group has taken out for some or most of its companies the following insurance policies among other coverage:
Property Damage & Business Interruption Insurance, including terrorism coverage;
General, Products and Professional Liability Insurance;
Environmental Liability Insurance;
Employment Practices Liability Insurance;
Directors and Officers Liability Insurance (D&O);
Cyber Insurance.
The subject of the D&O policy is to cover the insured Eurofins’ Directors and Officers including some key managers (such as the Chief Executive Officer, the main operating and scientific directors, and some other executive managers), as well as the Directors and Officers of companies controlled by the Group, for any pecuniary consequences of loss or damage resulting from any claims brought against them, binding their civil liability whether individual or joint, and attributable to any professional misconduct, whether actual or alleged,
26
committed by them in performing their managerial duties.
This policy is also subject to certain conditions and restrictions of common practice for similar contracts.
In addition, the Group’s subsidiaries have subscribed to relevant insurance policies according to local regulations and practices. These policies particularly aim to cover the insured company for the financial consequences of:
damage affecting its assets and properties;
business interruption resulting therefrom;
third party liabilities;
worker’s compensation / employer’s liability where applicable;
motor third party liability;
as well as any other mandatory local insurance cover.
As noted above, Eurofins believes it has procured sufficient insurance coverage at reasonable terms and conditions and that save for catastrophic damages, its insurance policies and coverage limits provide sufficient protection for Eurofins’ present requirements. Insured limits are being reviewed by Eurofins and its insurance brokers on a regular basis (taking into account the insurance market evolution, historical claims within Eurofins’ industry practice as well as Eurofins’ growth and exposure to potential claims) and where needed, amended. Up to the present time, Eurofins has very rarely been subject to substantial proven liability. However, it cannot be guaranteed that claims for damages will not be asserted against Eurofins in the future, that Eurofins’ insurance coverage will prove to be sufficient in all cases or that Eurofins will not sustain losses outside the scope or limits of its insurance coverage.
Although Eurofins believes that the present reserves if any for professional liability claims are sufficient to cover currently estimated exposures, it is possible that the Group or individual subsidiaries may incur liabilities in excess of these recorded reserves where they exist.
Claims in excess of recorded reserves if any and/or applicable insurance coverage could have adverse effects on Eurofins’ net worth, financial position, operating results (principally costs of services) and cash flows in the period that reserve estimates are adjusted or paid. In addition, successful major claims could also have a negative impact on Eurofins’ image and reputation.
5. Other risks
Risk of loss of key employees
Eurofins has a number of key employees with highly specialised skills or leadership talent and extensive experience in their fields. If one or more of these key employees were to leave, Eurofins may have
difficulty replacing them. Eurofins attempts to mitigate the risk of losing key employees by retention programmes, succession planning, and long-term incentive plans.
Eurofins may be unable to retain key employees or attract new highly qualified employees which could have a negative impact on Eurofins’ business, financial situation or results of operations.
Tax risks
Eurofins conducts its business activities in many different countries and is potentially subject to tax liabilities in multiple tax jurisdictions.
Eurofins believes its tax returns, which it prepares in cooperation with its local tax advisers/ accountants, are accurate and complete and that the Group has established adequate tax provisions and reserves. Accordingly, in the event of an external tax audit, Eurofins does not expect any material changes to its tax assessment notices or any additional tax liability. However, Eurofins may be subject to additional tax liability, including late payment interest and/or penalties, in particular if the tax authorities' interpretation of the facts or laws should differ.
These unforeseen tax claims may arise through a large number of reasons including identification of a taxable presence of a non-indigenous group company in a taxing jurisdiction, transfer pricing adjustments, revision of allowable expenses, application of indirect taxes on certain business transactions after the event, and disallowance of the benefits of a tax treaty. In addition, Eurofins may be subject to tax law changes in a taxing jurisdiction leading to retroactive tax claims.
Unforeseen tax claims or tax liabilities could have adverse effects on Eurofins’ cash flow and thereby have adverse effects on its net worth, financial position and operating results.
Risks of litigation
Disputes in relation to Eurofins’ business arise from time to time and can result in legal or arbitration proceedings. The outcome of these proceedings cannot be predicted. A negative outcome in a substantial litigation or arbitration case could have a material impact on Eurofins’ business and financial position.
Currently there are a few claims which have been threatened or asserted in pending litigation or arbitration proceedings concerning Eurofins and/or its subsidiaries and affiliates in the ordinary course of business or as a result of acquisitions.
For example, in 2007 Spin Master Ltd., a Canadian corporation, sued in various US jurisdictions several Eurofins Group companies questioning the correctness of tests performed by one company of the Group. The defence of that company in this litigation is handled by its Professional Liability Insurers and lawyers. A court decision is expected in 2017 or 2018.

27
As quoted in the paragraph “Certain Service Line Regulatory Risk” of the Report, the Group’s Boston Heart Diagnostics (BHD) subsidiary is currently cooperating with an investigation that the US Department of Health and Human Services, Office of Inspector General (OIG), is conducting in conjunction with the US Department of Justice (DOJ) related in part, to payments made to physicians for services performed in connection with blood specimen processing and handling services and vigorously defending two associated qui tam lawsuits. Please refer to said paragraph for more details.
Internal Controls Risks
Eurofins is enhancing its Internal Control platform to deploy necessary measures to manage existing and potential financial and operational risks, including measures aimed at limiting incidents that could lead to claims against Eurofins and its subsidiaries (see Section I.5 Internal Control).
If we are unable to maintain effective internal control over financial reporting or disclosure controls and procedures, the accuracy and timeliness of our financial reporting may be adversely affected. Maintaining effective internal controls over financial reporting is necessary for us to produce reliable financial statements. Moreover, we must maintain effective disclosure controls and procedures in order to provide reasonable assurance that the information required to be reported in our reports is recorded, processed, summarized and reported on a timely basis and that such information is accumulated and communicated to our management to allow timely decisions regarding required disclosure. If we are unable to maintain effective internal controls over financial reporting or disclosure controls and procedures or remediate any material weakness, it could result in a material misstatement of our consolidated financial statements that could require a restatement or other disclosures in which event investor confidence in the accuracy and timeliness of our financial reports and other disclosures could be adversely impacted, and the market price of our securities could be negatively impacted.
Fraud/ethical risks
Eurofins has implemented various systems of quality assurance in the largest part of its laboratories that are designed to ensure consistent procedures and traceability of results. Additionally, both local finance departments, Group finance teams, and Group Internal Audit as well as external auditors, perform regular controls and audit checks. Eurofins also encourages all internal and external parties to report in a confidential and secure manner suspicious situations and facts. One of Eurofins’ core values is integrity, which states that it is committed to ethics as one of its highest values. Attempts to incite customers or partners to commit unethical steps are not permitted in the Group. However, it is not possible to rule out the possibility of employee fraud or corruption. These could have a
very damaging impact on Eurofins and even put its existence at risk.
Volatility of the market price of shares
The shares of Eurofins have been listed on Euronext Paris since 25 October 1997.
The market price of Eurofins’ securities may be volatile. Any securities traded on a securities exchange are subject to risk factors which affect their price. Over time, global securities markets have experienced price fluctuations, which have been unrelated to the operating performance of the affected companies. Some of the factors that could negatively affect the price of Eurofins’ securities include:
general market and economic conditions, including disruptions, downgrades, credit events and perceived problems in the credit markets;
actual or anticipated variations in the quarterly operating results or distributions;
changes in the investments or asset composition of Eurofins;
write-downs or perceived credit or liquidity issues affecting the assets of Eurofins;
market perception of Eurofins, its business and assets;
the level of indebtedness of Eurofins and/or adverse market reaction to any indebtedness incurred in the future;
additions or departures of Eurofins’ key personnel;
changes in market valuations of similar companies;
litigation or regulatory actions and
speculation in the press or investment community.
These risk factors are generally unpredictable and may have implications that are unrelated or disproportionate to the operating performance of the listed entity. There can be no assurance that the market price of Eurofins’ securities will not experience significant fluctuations in the future, including fluctuations that are unrelated to the performance of Eurofins.
Significant shareholding
The current shareholders Dr. Gilles G. Martin and family and Dr. Yves-Loïc Martin, directly or through their holdings in Analytical Bioventures SCA, together hold a total of 37.9% of the shares of Eurofins and 56.5% of the voting rights as of 31 December 2016. Free float is 62.1% of Eurofins’ capital stock and 43.5% of the voting rights.
Due to the significant shareholding of the current shareholders, Dr. Gilles G. Martin and family, Dr. Yves-Loïc Martin and Analytical Bioventures SCA are together in a position to control the outcome of important business decisions that require shareholders consent, regardless of the voting behaviour of other shareholders and may

28
further increase their percentage of voting rights in the Company due to issuance of more beneficiary units. This or some decisions taken could have a material adverse impact on the results and value of the company and the minority shares and reduces the liquidity of the shares.
Future sales or issuances of a substantial number of Eurofins’ securities in the public markets, or the perception of such sales or issuances, could depress the trading price of Eurofins’ securities. Eurofins cannot predict the effect that future sales or issuances of Eurofins’ securities or other equity related securities would have on the market price of Eurofins’ securities. Eurofins may need additional funds in the future and Eurofins may issue additional Eurofins securities in lieu of incurring indebtedness which may dilute existing holders of Eurofins securities or Eurofins may issue securities that have rights and privileges that are more favourable than the rights and privileges accorded to holders of Eurofins shares.
Unforeseen high impact risk
Eurofins’ operations may be subject to unforeseen events which are highly improbable and may have a significant negative impact on its business activities, financial situation and operating performance. Due to the unforeseen nature of such events, it is difficult to mitigate the impact of such events or predict the nature or extent of the damage. Such unforeseen events may have a material adverse effect on the Group's net worth, financial position and operating results.
Reliability of opinions and predictions
All assumptions, opinions and expectations that do not represent facts based upon the past are expressly the opinions and predictions of Eurofins’ management. Opinions and forward-looking statements, are identified by expressions such as "planned", "expected", "believes", "assumes", "holds the view", "to the extent known" and similar formulations. Such statements reflect the management’s current opinions regarding possible future events, which are by their nature uncertain and thus subject to risks. All forward-looking statements are subject to various risks and uncertainties. Actual events and results may differ substantially from expectations due to a variety of factors. Eurofins undertakes neither obligation nor commitment to revise or update these opinions or forward-looking statements as a result of new information rendering these statements no longer accurate or timely.
Dated February 23, 2017

29
7 Eurofins Scientific SE, the group parent company
Eurofins Scientific SE (“Eurofins” or the “Company”) is the parent company at the head of the Eurofins Group. The Company is governed by Luxembourg law and has its registered office located at 23 Val Fleuri, L-1526 Luxembourg - Grand-Duchy of Luxembourg and registered under number RCS Luxembourg B 167775.
An important role of Eurofins as a holding company is to manage its investments and the financing of the activities of its subsidiaries.
In 2016, Eurofins recorded total financial income of EUR 87.5m, compared to EUR 91.2m in the previous year, of which the dividends received from its direct subsidiaries amount to EUR 70.0m in 2016 versus EUR 82.0m in 2015. Operating expenses including staff costs in 2016 were unchanged to EUR 2.6m compared to 2015. Interest payable and similar expenses increased compared to the previous year at EUR 91.9m. The tax expense in 2016 was EUR 0.5m. Therefore, Eurofins’ loss for 2016 stood at EUR 5.6m, versus a profit of EUR 13.5m in 2015.
The documents that can be legally required by authorized persons (such as shareholders, directors, etc.) are available at the registered office.
8 Corporate Governance
The corporate governance statements that shall legally be included in the management report and notably those as set forth in the law of 19 May 2006 on takeover bids, as amended (the “Takeover Law”) are disclosed in Part II of this management report and shall be deemed to be part of it.

30
II. CORPORATE GOVERNANCE
Eurofins has its registered office located in Luxembourg and its shares are listed in France on the regulated market of Euronext Paris. Eurofins falls under the supervision of the Commission de Surveillance du Secteur Financier (“CSSF”) in accordance with the law of 11 January 2008 on transparency requirements for issuers of securities, as amended (the “Transparency Law”) and shall also be supervised by the Autorité des Marchés Financiers (“AMF”) for the purpose of the Market Abuse Regulation (EU) No 596/2014 that came into effect on July 3, 2016 on insider dealing and market manipulation (The “Market Abuse Regulation”).
Eurofins’ corporate governance practices are governed by Luxembourg laws and its articles of association (the “Articles”).
Eurofins makes efforts to orient its corporate governance towards the general principles of corporate governance set forth in the Ten Principles of Corporate Governance of the Luxembourg Stock Exchange (available at https://www.bourse.lu/corporate-governance) (the “Ten Principles”).
The first part of Section II discusses the Corporate Governance Charter of Eurofins, which provides an overview of the corporate governance practices of Eurofins, while the second part sets out the Corporate Governance Statements for the period ended on 31 December 2016.
1 Corporate Governance Charter of Eurofins
The primary purpose of the present Corporate Governance Charter is to consolidate the corporate governance rules and procedures applied by Eurofins in one document. The Corporate Governance Charter shall be updated as often as necessary in order to provide an accurate reflection of Eurofins’ corporate governance framework and to reflect new rules which may be adopted from time to time by Eurofins in order to enhance its corporate governance.
1.1 Management structure
The governance structure of Eurofins is composed of the Board of Directors which is assisted by the Group Operating Council (as defined below) and an audit committee (the “Audit Committee”). The role of the Board of Directors is defined as being of a stewardship nature, providing the framework for the operations of the Group Operating Council’s activities. Once a year, the Board of Directors, as well as the Audit Committee, shall conduct a self-evaluation of their composition, organization, operations and diversification in order to identify potential areas for improvement.
1.1.1 The Board of Directors
Under the Eurofins’ Articles, as supplemented by the internal regulations of the Board of Directors, the Board of Directors is composed of, and functions as follows.
a. Role
The Board of Directors shall be responsible for the management of Eurofins. It is responsible for the performance of all acts of administration necessary or useful in furtherance of the corporate purpose of Eurofins, except for matters reserved by Luxembourg law or the Articles to the general meeting of shareholders.
The core of the mission of the Board of Directors is contained in the following non-exhaustive list:
- The Board of Directors discusses the Group strategy, significant operational initiatives, and material investments or divestments, and monitors the Group performance;
- The Board of Directors ensures the
quality of the information provided to the shareholders as well as to the financial markets through the accounts and the financial communication;
- The Board of Directors shall specifically
decide on the values and objectives of Eurofins, its strategy and key policies in implementing them and the level of risk acceptable to Eurofins. It draws up the annual, periodic and consolidated accounts and budget;
- The Board of Directors shall endeavour to ensure that the necessary financial and human resources are available, in order to enable Eurofins to reach its objectives;
- The Board of Directors shall draw up the
main categories of risks faced by Eurofins, such as financial risk, strategic risk, operational risk, legal and regulatory risk, reputational risk, and other risks. The Board of Directors shall determine the risks that require particularly close monitoring;
- The Board of Directors shall draw up a
code of business ethics; and
- The Board of Directors selects the Directors for their nomination by the general meeting of shareholders.

31
b. Composition and Appointment
The Articles provide that the Directors are elected, renewed or removed by the general meeting of shareholders by a simple majority of votes cast for a four-year term and may be re-elected.
Other than as set out in the Articles, no shareholder has any specific right to elect, renew or remove Directors. In case of vacancy of the office of a Director appointed by the general meeting of shareholders, the remaining Directors so appointed may fill the vacancy on a provisional basis. In such circumstances, the next general meeting of shareholders shall make the permanent appointment.
The Articles do not require Directors to be shareholders of Eurofins.
The Directors are bound by the Group Code of Ethics of the Company and the Insider Dealing Policy of the Company, in particular regarding insider information.
The Board of Directors shall be composed of at least two independent Directors.
The Directors shall be selected due to their knowledge, experience and qualification to carry out their mandate.
The Board of Directors shall appoint a Chairman, who shall prepare the agenda for board meetings. The Chairman shall ensure that the procedures relating to the Board meetings, the preparation of meetings, deliberations, and for taking and implementing decisions, are correctly applied.
c. Functioning
The Board of Directors meets when convened by the Chairman of the Board of Directors by any means, even verbally or by telephone in urgent cases. The Board of Directors meets as often as required in the interest of Eurofins and each time it deems appropriate, at least every three months, on notice of its Chairman at the registered office or at any other place indicated in the notice. The Board of Directors shall dedicate an item on the agenda of one of its meetings to discussing its operations, the effective fulfilment of its remit, and compliance with good governance rules at least once every two years.
If the Board of Directors has not met for more than two months, one third of the Directors may request the Chairman to convene a meeting with a specific agenda. In case of urgency, any Director is entitled to do so. In order for a meeting of the Board of Directors to be validly held, a majority of the Directors must be present or represented.
In the absence of the Chairman, the Board of Directors will appoint by majority vote of the Directors present or represented at the meeting a chairman for the meeting in question. For any meeting of the Board of Directors, a Director may designate another Director to represent him or her and vote in his or her name, provided that the Director so designated may not represent more than one of his or her colleagues at any time.
Meetings of the Board of Directors can be held by means of video conference or other telecommunications technologies permitting the identification of the Directors. Board of Directors’ meetings held by such means of communication shall
be deemed to be held at the registered office of Eurofins.
Prior to each meeting, the Directors are entitled to receive all information required for the performance of their duties and may obtain any documents they consider useful.
The performance of the Directors is discussed at Board of Directors’ meetings within the context of the performance of each of the business lines that these Directors are responsible for if applicable.
Decisions of the Board of Directors are made by a majority of the Directors present and represented at a validly constituted meeting. Each Director has one voting right and in case of a division of votes, the Chairman shall have a casting vote.
d. Conflict of Interest and Confidentiality
(i) Conflict of Interest
Each Director shall take care to avoid any direct or indirect conflict of interest with Eurofins. Directors shall inform the Board of Directors of a real or potential risk of conflict of interest with Eurofins or its direct or indirect controlled subsidiaries, and shall abstain from deliberating or voting on the issue concerned in accordance with applicable legal provisions. Any abstention due to a conflict of interest shall be indicated in the minutes of the Board of Directors’ meeting and disclosed at the next shareholders’ general meeting, in accordance with applicable legal provisions.
(ii) Confidentiality
During and after their functions, the Directors are strictly bound by a confidentiality commitment regarding the content of any debates and deliberations of the Board of Directors as well as any information they have been provided by reason of their functions, excluding where such disclosure is required by a legal provision.
As regards information obtained in the course of their duties that have not yet been made public, Directors shall regard themselves as bound by an obligation of professional secrecy that goes beyond the mere duty of discretion as stipulated by the relevant laws.
1.1.2 Executive Management of Eurofins
a. Role & Composition
The day-to-day management of Eurofins is entrusted to an executive committee (the “Group Operating Council”) composed of the operational and functional international business leaders of the Group as listed on the Eurofins Group corporate website http://www.eurofins.com/investor-relations/corporate-governance/group-operating-council/, and presided by a chief executive officer (the “Chief Executive Officer”). The Group Operating Council provides assistance to the Board of Directors in different specialised areas of expertise.

32
b. Appointment of the Executive Management
The Chief Executive Officer is appointed by the Board of Directors. For rapid decision making process in a relatively young organisation like Eurofins, operating in a rapidly moving industry, the Board of Directors has decided not to separate the functions of Chief Executive Officer and Chairman of the Board of Directors. The Board of Directors sets the duration of his term of office, provided that such period shall not exceed the term of office of the Directors. The Chief Executive Officer may be removed at any time by the Board of Directors.
The Board of Directors shall ensure that the members of the Group Operating Council have the skills required to fulfil their responsibilities.
c. Approval of certain significant matters
The Group Operating Council meets with the Board of Directors at least once every quarter.
The functions of the members of the Group Operating Council are framed by their objectives, annual budgetary limits and a monitoring procedure of important decisions which are cascaded throughout the Group.
In the decentralized model used by Eurofins certain important or non customary decisions are governed on an approval system. For each level of decision, the approver of important decisions is precisely defined and signatures are required. These important decisions pertain to M&A, sites expansion, non budgeted investments, key personnel compensation, the financing and insurance policies, net working capital management, and certain large transactions with other companies outside the Group, the Group legal organisation as well as certain general commercial terms.
1.1.3 The Audit Committee The Audit Committee shall be composed and shall function in accordance with its internal regulations which are summarized as follows.
a. Role
The Audit Committee assists the Board of Directors in carrying out its responsibilities in relation to corporate policies, internal control, risk monitoring, and financial and regulatory reporting practices. The Audit Committee has an oversight function and provides a link between the internal and external auditors, and the Board of Directors. The Audit Committee is assisted as appropriate by the Group Finance and Administration teams.
(i) Financial Reporting
The Audit Committee monitors and discusses with the Board of Directors and the external auditor the integrity of the preliminary results, the half-year information and the annual financial statements reviewing significant financial and reporting judgments which they contain
before reporting to the Board of Directors focusing particularly on the quality and appropriateness of:
- critical accounting policies and practices; - financial reporting disclosures and changes
thereto; - areas involving significant judgment,
estimation or uncertainty in the Group’s financial results;
- the clarity of disclosures; - significant implemented adjustments resulting
from the audit or review; - compliance with financial reporting standards
and relevant financial and governance reporting requirements;
- monitoring of the integrity of other formal announcements relating to Eurofins' financial performance, reviewing significant financial reporting judgments contained in them; and
- monitoring of the compliance with statutory and stock exchange requirements for financial reporting.
ii) Internal controls and risk management systems
The Audit Committee reviews and makes recommendations to the Board of Directors on the nature and extent of the significant risks Eurofins is willing to take in achieving its strategic objectives. It shall assist the Board of Directors to establish a “risk control system”.
The Audit Committee also reviews Eurofins’ internal financial controls and internal control and risk management systems, and reviews and reports to the Board of Directors on the statements to be included in the annual report concerning internal control and risk management.
It monitors and reviews the scope, extent and effectiveness of the activity of the Group in relation to compliance before reporting to the Board of Directors.
The Audit Committee may also consider management’s response to any material external or internal audit recommendations; and review management’s and the internal auditor’s reports on the effectiveness of systems for internal control, financial reporting and risk management.
iii) Risk
The Audit Committee shall advise the Board of Directors on Eurofins’ overall risk appetite, tolerance and strategy, taking account of the current and prospective macroeconomic and financial environment. This includes overseeing and advising the Board of Directors on the current risk exposures of Eurofins and future risk strategy. The Audit Committee reviews regularly Eurofins’ capability to identify and manage new risk types, and keeps under review Eurofins’ overall risk assessment processes.

33
iv) Compliance, whistle blowing and
fraud
The Audit Committee shall ensure that Eurofins’ guidelines on whistleblowing are observed and shall review Eurofins’ procedures for detecting fraud. The Audit Committee shall keep under review the adequacy and effectiveness of Eurofins’ compliance function.
v) Internal Audit
The Audit Committee shall be informed of the internal auditor’s work program and shall receive periodic summaries of his work. The Audit Committee may make recommendations regarding the internal auditor’s work program. It shall monitor the effectiveness of the internal audit function and make sure that the internal auditor(s) has/have adequate resources to perform the tasks entrusted to him/them. The Audit Committee shall make recommendations regarding the selection, appointment, and dismissal of the internal auditor(s). In the event that the internal auditor(s) resign(s), the Audit Committee shall investigate the reasons for that resignation, and shall make recommendations regarding any measures that are needed.
vi) External Audit
The Audit Committee reviews and makes recommendations to the Board of Directors for it to put to the shareholders for their approval in general meeting in relation to the appointment, re-appointment and removal of the external auditor.
The Audit Committee has oversight with regards to the relationship with the external auditor including discussions about the nature and scope of the audit (including any significant ventures, investments or operations which are not subject to audit).
The Audit Committee reviews and monitors the external auditor’s independence and objectivity and the effectiveness of the audit process taking into account relevant professional and regulatory requirements including reviewing and monitoring the external auditor’s quality control procedures and steps taken by the external auditor to respond to changes in regulatory and other requirements.
The Audit Committee shall be informed of the external auditor’s work program and shall receive a report from the latter describing all existing relationships between the external auditor on the one hand and Eurofins and its group on the other hand. It may submit recommendations regarding the external auditor’s work program.
b. Composition and Appointment
The Audit Committee is composed of three members who are appointed by the Board of Directors for a period of up to three years which may be extended for further periods of up to three years. The Board of Directors shall appoint the Audit Committee’s chairman who shall be an independent non-executive director.
c. Functioning
The Audit Committee shall meet at least three times a year at appropriate times in the reporting and audit cycle, and otherwise as required. The quorum necessary for the transaction of business shall be two. A duly convened meeting of the Audit Committee at which a quorum is present shall be competent to exercise all or any of the authorities, powers and discretions vested in or exercisable by the Audit Committee. The Group’s secretary or his or her representative
shall act as the Secretary of the Audit Committee (the
“Audit Committee’s Secretary”).
Meetings of the Audit Committee shall be called by the Audit Committee’s Secretary at the request of any of its members or of the external auditor, or of the Chairman of the Board of the Directors if deemed necessary. The Audit Committee’s Secretary shall record the minutes of the proceedings and decisions of all meetings, including the names of those in attendance. The draft minutes of meetings shall be promptly circulated to all members of the Audit Committee, and circulated to all members of the Board of Directors once approved. The Audit Committee shall make whatever recommendations to the Board it deems appropriate on any area within its remits where action or improvement is needed.
1.1.4 Internal control and internal audit
a. Role
Internal control in Eurofins balances the objectives of the Group, such as maximising shareholder returns through strong growth in revenues and profits, both organically and by acquisitions, building barriers to entry through investment in state-of-the-art technology, all at the same time as managing the risks inherent in the business and the protection of shareholders’ interests. Internal control aims at achieving the following objectives:
- Reliability of the accounting and financial information;
- Realisation and optimisation of operational decisions;
- Compliance with rules and regulations; and
- Safeguarding the assets of the Group.
Eurofins Scientific S.E. is the holding company at the head of the Group and has an important role to manage its investments and the financing of the activities of its subsidiaries, to provide support, to facilitate communication and to develop resources that are available Group-wide. The decentralised organisation of the Group in autonomous clusters and business units enables the subsidiaries to make decisions at the ground level and

34
to maintain some independence. Strategic choices are determined and approved at a central level. The internal control process falls within this framework of a decentralised organisation in terms of roles and responsibilities, policies and procedures. This aims to assure that the Group takes the necessary measures to manage the existing and potential risks for the Group’s financial position and objectives. At an operational level, the internal control procedures are disseminated by the local managers to their teams. At a functional level, internal control aims at:
- Assuring reliable financial statements that provide a true and fair view of Eurofins’ activities, liabilities and assets;
- Promoting better effectiveness by seeking and deploying best practices within the Group and by defining the directors’ role and responsibilities as part of the control environment of the Group;
- Encouraging support for the managerial guidelines, the Group’s procedures and any other compulsory or statutory obligation; and
- Assuring the protection of the Group’s assets by spot checking the accuracy and the reliability of the accounting information during the internal audit reviews: the controls notably focus on the protection of the assets, the separation of the tasks, the respect of the internal procedures in terms of approval of investing and updating the property, plant and equipment database.
b. Functioning
Compliance with the Group’s internal policies and procedures is overseen by the internal audit team. Their role is to ensure that the operations are conducted according to high standards by providing an independent, objective assurance and by advising on best practices. The Group’s internal control and financial procedures are reviewed and updated on a regular basis, and are readily accessible to the relevant employees via Eurofins’ intranet. The internal audit function supports the Group in accomplishing its objectives by evaluating and improving the effectiveness of risk management, controls and governance process.
1.1.5 Financial Information
a. Production of financial information
One of the main functions of internal control and the Audit Committee is to ensure that financial statements provide a true and fair view of Eurofins’ activities. The financial reporting process is managed according to the Group’s internal reporting systems using a dedicated software by the financial controlling team. Regular reporting
Each subsidiary or business unit submits a pro-forma financial report on a monthly basis (income statement, balance sheet and cash flow), with additional key business metrics highlighted, such as comparable data (budget and prior periods), working capital ratios and free cash generation.
As well as being able to monitor each business units’ performance, the controlling and internal control functions check the consistency and reliability of the results, along with the consistent application of the correct accounting principles applied by the different national finance directors in accordance with the Group’s accounting policies. Quarterly statutory consolidation
In addition to the monthly reporting, each subsidiary has to produce:
- a quarterly consolidation manual;
- a quarterly review of budgeted KPIs per business unit;
- a quarterly review of the overhead costs (management, sales and marketing, IT, etc) and of the capital expenditures; and
- from time to time (at least on an annual basis), a report - containing profit and loss, balance sheet, cashflow and change in equity statements - which has been subject to a limited review by the external auditors.
The consolidation documents are approved by the finance directors of each country, having vouched for its accuracy and the reliability of the information contained therein. A dedicated software is used in the consolidation of this information and the production of the financial statements. b. Publication of financial information
Eurofins publishes its half-year and annual financial reports with a press release discussing the operating and financial developments in detail, with a full income statement, balance sheet and cash flow statement, as well as the relevant interim notes. In the interest of transparency and to provide sufficient visibility in terms of its progress, Eurofins also publishes revenue developments for the first and third quarter of the year, as well as some information on the trading patterns for the period. c. Annual Budget Process
Eurofins prepares a formal budget each year, which encourages financial discipline and helps management plan activities and allocate resources accordingly. Each business unit submits the following information, which has to be authorized by the Group Operating Council and the Board of Directors:
- An analysis of the competitive landscape and Key Success Factors.
- An estimated monthly and yearly income statement for the coming year containing:
- revenue and cost projections;
- a detailed plan to monitor the development of personnel costs;
- an itemised budget for capital expenditure;
- operational KPIs;
- a balance sheet and cash flow statement per legal entity with a strong focus on the Days of

35
Sales Outstanding and Net Working Capital in % of Revenues
A mid-term plan with a three year horizon is drawn up at the same time with a simplified income statement and specific indicators for each business unit.
1.1.6 Group Code of Ethics
The Group’s mission, vision and values and the “Group Code of Ethics” determine the behaviours and professional conduct expected from employees and leaders of the Group’s companies. These documents represent some key Eurofins’ standards for all the Directors and employees of Eurofins companies and are made available to all Eurofins’ employees through the Company’s website and intranet. Eurofins Values (what we stand for / what is important to us) Customer Focus
- Delivering Customer satisfaction by listening to and exceeding customer expectations
- Adding value for our customers through our services
- Seeking innovative solutions to help our customers achieve their goals
Quality
- Delivering quality in all our work; providing accurate results on time
- Using the best appropriate technology and methods
- Seeking to improve or change our processes for the better
Competence and Team Spirit
- Employing a team of talented and competent staff
- Investing in training and creating good career opportunities
- Recognising and encouraging outstanding performance
Integrity
- Behaving ethically in all our business and financial activities
- Demonstrating respect towards our customers and our staff
- Operating responsible environmental policies
Eurofins also has a whistleblowing point of contact that is readily accessible for all employees via Eurofins’ intranet and also on Eurofins website. This point of contact is intended to encourage and enable employees and/or external parties to confidentially raise serious concerns internally so that Eurofins can address and correct inappropriate conduct and actions that breach the above mentioned Group Code of Ethics.
1.1.7 External Control
As required pursuant to Article 69 of the Luxembourg law of 19 December 2002 on the register of commerce and companies and the accounting and the annual accounts of undertakings, as amended (The “Trade and Companies Register Law”), the general meeting of the shareholders of Eurofins shall appoint an external auditor for the statutory audit of the stand-alone and consolidated annual accounts of the Company.
1.2 Shareholders’ meetings
The general meeting of shareholders shall have the widest powers to adopt or ratify any action relating to the Company.
Ordinary and extraordinary Shareholders' Meetings deliberate in accordance with conditions of quorum and majority set forth and the powers expressly granted by law and the Articles.
a. Ordinary shareholders’ meetings
An ordinary meeting of shareholders (the “Annual General Meeting”) shall be held annually at the date and time indicated in the Articles and shall approve the stand-alone and consolidated financial statements. It shall determine the allocation of profits and grant discharge to the Directors for the performance of their duties for the previous financial year.
b. Extraordinary shareholders’ meetings
Extraordinary general meetings of shareholders shall be called to deliberate on any decision having as direct or indirect effect to amend the Articles of the Company.
c. Notices and Agenda
Shareholders' meetings are convened by the Board of Directors, or by any person empowered to do so as set forth by law.
The Shareholders' meetings are convened and held in accordance with the conditions set forth by law and the Articles. The meetings are convened at the registered office or in any other location indicated in the notice.
d. Access to meetings and voting rights
Each share entitles its holder to one vote. All shareholders, regardless of the number of shares they own, may attend Shareholders’ meetings and deliberations in person or via proxy, by providing proof of their identity. The rights of shareholders to participate and vote at Shareholders’ meeting are determined in relation to the number of shares held on the date falling 14 calendar days before the date of the Shareholders’ meeting at midnight (Luxembourg time) (the “Record Date”). To be able to participate to the general meeting each shareholder shall indicate to Eurofins in writing its intention to do so at the latest at the Record Date.
In case the shares are held by the shareholder through a system of payment and delivery of financial instruments, or in case the shares are held by a

36
financial intermediary acting as a professional depositary, the shareholder who intends to participate to the Shareholders’ meeting is required to request a certificate certifying the number of shares he/she holds at the Record Date from its intermediary and the shareholder must present the certificate to Eurofins no later than five (5) days prior to the general meeting. In case of vote by correspondence through a voting form, only the voting forms received by Eurofins at least three (3) days at midnight prior to the date of the Shareholders' Meeting shall be taken into account.
The holder of shares not residing in the Grand-Duchy of Luxembourg may be represented at the general meeting by any intermediary subject to the appointment of the intermediary by written notification to Eurofins by electronic means or by post as specified in the notice convening the General Meeting. The Shareholders' meetings can be held by way of video-conferencing or any other means of telecommunication, like the internet, that must enable the identification of shareholders under the terms and conditions set forth by law then currently in force.
Shareholders attending the meeting by video-conferencing or any other means of telecommunication that enables them to be identified, under the terms and conditions set forth by law, are considered as present to determine the quorum and majority.
1.3 Remuneration Policy
The Board of Directors is entrusted with the drawing up of a remuneration policy for the Directors and the Chief Executive Officer.
The rules and principles used to determine the remuneration, benefits-in-kind and bonuses of the Directors and the Chief Executive Officer are not determined by the Board of Directors on a collective basis.
The evolution from year to year of the remuneration, benefits in kind and bonuses of the Chief Executive Officer and the other Board of Directors’ members are based on their functions, duties and responsibilities and on the results and performance of the Group, as well as on individual achievement of annual objectives.
For competitive reasons, the Board of Directors has decided not to disclose publicly the criteria for remuneration or compensation (including in the event of redundancy) of members of the Board and of the Group Operating Council.
1.4 Share Dealings
Directors, Officers and employees who are in possession of inside information must, for as long as this information has not been made public, refrain from directly or indirectly entering into (or recommending others to enter into) any transaction involving the financial instruments of Eurofins and from disclosing such information to third parties, especially but not limited to during the following black-out periods:
(i) the continual period starting 30 calendar days before the publication of the annual or half-yearly financial information and ending the day after the publication of the relevant information;
(ii) the continual period starting 15 calendar days before the publication of the quarterly financial information and ending the day after the publication of the relevant information;
(iii) the continual period starting on the date on which the relevant person becomes aware of an inside Information and ending the day after Eurofins publicly releases this information.
Inside information is information of a precise nature which has not yet been made public and which relates directly or indirectly to one or more issuers, or to one or more financial instruments, and which if it were made public would be likely to have a significant effect on the prices of the financial instruments in question or on the price of related derivative financial instruments.
Pursuant to Article 19 of the 569/2014 EU Market Abuse Regulation (the “Market Abuse Regulation”) the persons discharging managerial responsibilities (and persons closely associated with them) must declare within three working days to the Commission de Surveillance du Secteur Financier “CSSF” and to
Eurofins the existence of all and any transactions conducted on their account, such as the acquisition, transfer, subscription or trading, of Eurofins’ financial instruments.
Eurofins has enacted a strict insider dealing policy applicable to any employees and Directors, Officers subject to Market Abuse Regulation.

37
2 Corporate Governance Statements for the period ended on December 31st, 2016
2.1 Management
2.1.1 Board of Directors
a. Composition
The Board of Directors is currently composed of five members, two of whom are Non-executive, Independent Directors. Each year, the Board of Directors reviews the suitability of each of its independent members according to the Ten Principles. The members of the Board of Directors are:
- Dr. Gilles Martin: Chairman of the Board and Chief Executive Officer of the Eurofins Scientific Group, graduated from Ecole Centrale in Paris. He subsequently obtained a Master of Science from Syracuse University (New York) and a PhD in Statistics and Applied Mathematics. Founding the original Eurofins Scientific Nantes food authenticity laboratory in 1987, Dr. Martin has expanded this company into a global bioanalytical group of 310 laboratories employing over 27,000 people in 39 countries. He is a member of the Board of Directors of Bruker Corp. (NASDAQ: BRKR), serving as an independent director. Dr. Martin is also a past President of the French Association of private analytical laboratories APROLAB, and of the North American Technical Committee for Juice and Juice Products (TCJJP) and of public bodies supporting innovation and entrepreneurship.
- Yves-Loïc Martin: Executive Director, graduated from Ecole Polytechnique, in Paris, France, and holds a Master’s Degree in Applied Mathematics from University Paris VI and a PhD in Chemometrics from Institut National Paris Grignon. Dr. Yves-Loic Martin joined Eurofins as Quality Assurance Manager in 1992, and assumed the role of Chief Technology Officer in 1998 until 2015, where he was instrumental in setting up the Group’s IT infrastructure and solutions. Beyond his strategic role on Group innovation, he is now responsible for the documentation of some Eurofins important processes and policies, and continues to drive overall improvement of cooperation between IT and operational entities.
- Valérie Hanote: Executive Director, is responsible for the Group’s internal Commercial Laboratory Information Management System (ComLIMS). Mrs Hanote graduated from the Paris Institute of technology for life, food and environmental sciences (AgroParisTech), and has been active for Eurofins since 1991.
- Stuart Anderson was appointed an Independent Non-Executive member of the Board of Directors of Eurofins in 2010. Mr. Anderson is a seasoned professional with many years experience in consumer goods, the food industry and private equity, having previously served as CEO at Wilkinson Sword, Del Monte Fresh Fruit, and at Geest Europe. He is currently a Partner at Pemberton Capital LLP, as well as chairman of two of Pemberton’s investments. Mr. Anderson obtained a degree in Law from the University of Cambridge in the UK, and originally qualified as a solicitor with Freshfields before following an international career in Europe, US and the Middle East.
- Fereshteh Pouchantchi. The appointment of Ms. Pouchantchi as an Independent Non-Executive member of the Board of Directors was confirmed at the Annual General Meeting in April 2014. Ms. Pouchantchi is a finance professional with extensive experience in audit, finance processes and financial administration and compliance. She worked at the Société Européenne de Banque (Luxembourg) for more than 20 years, where she headed up various teams, including the bank’s compliance department. She is currently a director in charge of client relations at Fiduconseil S.àr.l.. Mrs. Pouchantchi holds a doctorate degree in economics from the Université de Paris II and a master in European private Law.
No legal or disciplinary actions against any of the Directors of the Board (or against companies that the person was a director of at the relevant time), and that would be relevant to the role that the Directors have undertaken for the Group, has been taken in the last five years. In the last five years, none of the Directors of the Board has been an officer of a company that entered into a form of external administration because of insolvency during their time as an officer in that company or within a 12-month period afterwards except for Mr. Stuart Anderson.
Board of Directors in 2016
Name Age
Mandate Audit Committee membership
Appointment or Renewal date
expiry in year Y (*)
Gilles Martin 53
Chairman of the Board and Chief Executive Officer
19/04/2016 2020
Yves-Loïc Martin 50 Board Member Audit 19/04/2016 2020
Valérie Hanote 50 Board Member Audit** 19/04/2016 2020
Stuart Anderson 75 Independent Non-Executive Board Member
Audit 19/04/2016 2020
Fereshteh Pouchantchi
62 Independent Non-Executive Board Member
Audit 24/04/2014 2018
* His/Her term of office will expire at the end of the Annual Shareholders’ Meeting called in year Y (see date in the table) to approve the financial statements for fiscal year ending December 31, Y-1
** Mrs Hanote resigned from the Audit Committee at the end of the Annual General Meeting held on 19 April 2016

38
b. Board of Directors’ meetings for the period ended on 31 December 2016
The Board of Directors held 11 meetings in 2016 and the average attendance rate of the Directors at the Board of Directors’ meetings was 72%.
In the course of the meetings held in 2016, discussions concerned among other topics the approval of the consolidated accounts and the parent company’s financial statements, net profit allocation, dividends, capital increase in relation to stock option exercises, drafting the management report and resolutions to be submitted to the Annual General Meeting, convening of the Annual General Meeting, the grant of some corporate guarantees and the preparation of all relevant documents. The discussions also included the appointment and remuneration of the Directors and executives, as well as allocation of stock options, and Directors’ fees.
During the year 2016, the Board of Directors held discussions on the corporate governance of the Group and the Group Operating Council.
During the year 2016, the Board of Directors also held discussions regarding its decision that a nomination committee and a remuneration committee are not needed at this stage in Eurofins, and that it is for the Board of Directors to perform the duties of such committees.
Additionally, the Board of Directors held discussions on a number of financial transactions such as:
- In January 2016: allocation of an employee stock option plan for 2016;
- In March 2016: amendment of Article 12 Bis and insertion of a new Article 12 Ter in the Articles Company;
- In June 2016: fixing of the dividend payment date; approval of various borrowings; issue of 1,000,000 Class B beneficiary units; authorization for a private placement of 606,061 newly-issued shares subscribed by Caisse de dépôt et placement du Québec (CDPQ);
- In September 2016: authorisation for a second capital increase by way of an accelerated off-market offering of up to 800,000 newly-issued shares subscribed by qualified institutional investors; authorisation for a potential new senior bond issuance;
- In December 2016: the decision to redeem in anticipation some debt instruments.
Most importantly, decisions and debates were held on the strategic direction of Eurofins. Following such discussions, the Group’s mid-term objectives were reaffirmed.
All of these decisions were made unanimously by the members of the Board of Directors present or represented.
c. Remuneration
The remuneration of the Board of Directors is determined on a yearly basis by the annual general meeting of shareholders. The Board of Directors allocates this remuneration among its members at its own discretion.
For the year 2016, the remuneration of the members of the Board of Directors is detailed as follows. This remuneration has been paid by the Company and some of its direct and indirect subsidiaries:
All amounts in EUR
Fixed compensation
Variable compensation
Benefits in kind
Supplemental pension plan
Attendance fees to non-
executive directors
Other Total compensation
paid in 2016 (EUR)
Gilles Martin
940 000 0 11 400 9 000 0 0 960 400
Yves-Loïc Martin 322 000 0 0 10 000 0 0 332 000
Valérie Hanote 214 000 0 10 692 15 000 0 0 239 692
Stuart Anderson 0 0 0 0 29,700 0 29,700
Fereshteh Pouchantchi
0 0 0 0 40,500 0 40,500
NB: in addition to the gross remuneration and benefits granted to Dr. Gilles Martin by the Company and its direct and indirect subsidiaries as listed in the above table, it should be noted that other indirect costs and expenses were borne by one or more Eurofins affiliates as part of his duties as Chief Executive Officer of the Group and Chairman of the Board of Directors including but not limited to:
• travel expenses reasonably incurred for his business activities;
• support from a pool of personal assistants in charge of managing Dr. Martin’s schedule, appointments, conference calls, business trips (flights, hotels, car rentals etc.), including from time to time support on private matters and journeys, commensurate with standard practice for CEOs of other international companies of a similar size so as to free up their time for company matters,
• support for preparation of personal annual tax returns.
Board of Directors’ Remuneration for the year 2016
Board of Directors’ Remuneration
39
2.1.2 Chief Executive Officer and Group Operating Council
During the Board of Directors’ meeting held in April 2016, Mr. Gilles Martin was again appointed as Chairman and Chief Executive Officer of Eurofins Scientific SE until the Annual General Meeting of shareholders to be held in 2020 to approve the Company’s financial statements of the fiscal year ending on 31/12/2019.
2.1.3 Audit Committee
a. Composition
The Audit Committee consists of the following members:
- Fereshteh Pouchantchi (Audit Committee Chair)
- Stuart Anderson - Dr. Yves Loïc Martin
b. Audit Committee’s meetings for the period ended on 31 December 2016
The Audit Committee held four meetings in 2016 and the attendance rate of the Directors at the Audit Committee’s meeting was 88%
15.
During 2016, the Audit Committee reviewed the full year 2015 and half-year 2016 financial statements, and the implementation of new IFRS developments that could impact Eurofins’ accounts. It discussed the impact of the audit reform in Luxembourg on the role of the Audit Committee and its implications in terms of audit control and new requirements of public disclosure. The Audit Committee also reviewed the following as part of its duties:
- update on the the Finance blue print progress (process documentation) and deployment of the Microsoft Dynamics AX solution
- analysis of the risk management annual survey results and its implications in terms of control environment improvements and minimum control requirements for most risk sensitive areas
- information security policy improvements related to communication in order to prevent or minimize the risk of fraud and strengthening of security resources and business continuity plans
- update on recent internal audit missions carried out across the Group.
For more information on financial risk management, please refer to the notes to the 2016 consolidated financial statements (note 4.2).
2.1.4 External auditor The Luxembourg société coopérative PricewaterhouseCoopers registered with the
15 The Audit Committee was still composed of 4 members in February. Mrs Hanote resigned from the Audit Committee on 19 April 2016.
Luxembourg Trade and Companies Register under number B 65477 was appointed as external auditor of the Company for the statutory and consolidated financial statements audit of the annual accounts of Eurofins for the year ending as at 31
st December
2016, drawn up in accordance with the Luxembourgish Generally Accepted Accounting Principles (“Luxembourg GAAP”) and International Financial Reporting Standards (IFRS) respectively.
2.2 Shares and shareholders
2.2.1 Share capital As of 31 December 2016, the Company’s share capital amounts to one million six hundred and ninety-two thousand five hundred and ninety-seven Euros (EUR 1,692,597.00) divided into sixteen million nine hundred and twenty-five thousand nine hundred and seventy (16,925,970) shares of ten cents (EUR 0.10) of nominal value each, all of the same category.
There are no charges attached to shares neither minimal shareholding requirements for Directors of the Company.
On 29 June 2016, the issued share capital was increased by EUR 60,606.10 by the creation of 606,061 new shares issued as a result of a private placement subscribed by Caisse de dépôt et placement du Québec.
The Board of Directors held on 28 June 2016 approved the increase in share capital and the Chairman decided on 29 June 2016 to update Article 7 of Eurofins’ Articles as follows:
Article 7 – Share Capital
The share capital amounts to one million, five hundred and ninety-nine thousand, five hundred and eighty-two Euros (EUR 1,599,582.00), divided into fifteen million, nine hundred and ninety-five thousand, eight hundred and twenty (15,995,820) shares of ten cents (EUR 0.10) of nominal value each, all of the same category.
On 12 September 2016, the issued share capital was increased by EUR 80,000.00 by the creation of 800,000 new shares issued as a result of an off-market offering subscribed by qualified institutional investors.
The Board of Directors held on 5 September 2016 approved the increase in share capital and the Chairman decided on 8 September 2016 to update Article 7 of Eurofins’ Articles as follows:
Article 7 – Share Capital
The share capital amounts to one million, six hundred and eighty-six thousand, one hundred and seventy-six Euros and fifty cents (EUR 1,686,176.50), divided into sixteen million, eight hundred and sixty-one thousand, seven hundred and sixty-five (16,861,765) shares of ten cents (EUR 0.10) of nominal value each, all of the same category.

40
a. Potential increases in share capital
(i) Stock options
As part of the stock option plans in 2016, 216,660 options were granted by the Board of Directors. Not all of these options granted in 2016 were new options but some were options previously granted to beneficiaries who had lost their right to exercise them and were granted to new beneficiaries under new conditions.
In 2016, 129,801 options were exercised during the year.
Two new stock option plans were decided by the Board of Directors on 21 January 2016 and on 1
st
August 2016.
The details of the current stock option plans are as follows:
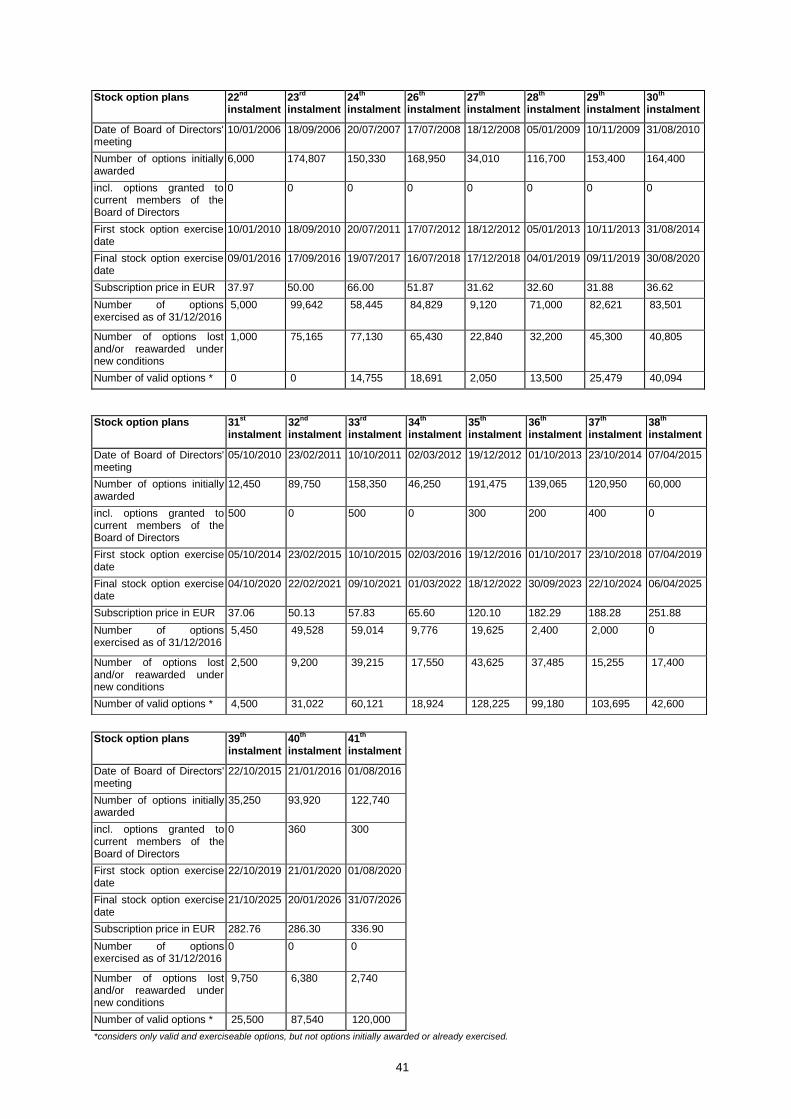
41
Stock option plans 22nd
instalment
23rd
instalment
24th
instalment
26th
instalment
27th
instalment
28th
instalment
29th
instalment
30th
instalment
Date of Board of Directors' meeting
10/01/2006 18/09/2006 20/07/2007 17/07/2008 18/12/2008 05/01/2009 10/11/2009 31/08/2010
Number of options initially awarded
6,000 174,807 150,330 168,950 34,010 116,700 153,400 164,400
incl. options granted to current members of the Board of Directors
0 0 0 0 0 0 0 0
First stock option exercise date
10/01/2010 18/09/2010 20/07/2011 17/07/2012 18/12/2012 05/01/2013 10/11/2013 31/08/2014
Final stock option exercise date
09/01/2016 17/09/2016 19/07/2017 16/07/2018 17/12/2018 04/01/2019 09/11/2019 30/08/2020
Subscription price in EUR 37.97 50.00 66.00 51.87 31.62 32.60 31.88 36.62
Number of options exercised as of 31/12/2016
5,000 99,642 58,445 84,829 9,120 71,000 82,621 83,501
Number of options lost and/or reawarded under new conditions
1,000 75,165 77,130 65,430 22,840 32,200 45,300 40,805
Number of valid options * 0 0 14,755 18,691 2,050 13,500 25,479 40,094
Stock option plans 39th
instalment
40th
instalment
41th
instalment
Date of Board of Directors' meeting
22/10/2015 21/01/2016 01/08/2016
Number of options initially awarded
35,250 93,920 122,740
incl. options granted to current members of the Board of Directors
0 360 300
First stock option exercise date
22/10/2019 21/01/2020 01/08/2020
Final stock option exercise date
21/10/2025 20/01/2026 31/07/2026
Subscription price in EUR 282.76 286.30 336.90
Number of options exercised as of 31/12/2016
0 0 0
Number of options lost and/or reawarded under new conditions
9,750 6,380 2,740
Number of valid options * 25,500 87,540 120,000 *considers only valid and exerciseable options, but not options initially awarded or already exercised.
Stock option plans 31st
instalment 32
nd
instalment 33
rd
instalment 34
th
instalment 35
th
instalment 36
th
instalment 37
th
instalment 38
th
instalment
Date of Board of Directors' meeting
05/10/2010 23/02/2011 10/10/2011 02/03/2012 19/12/2012 01/10/2013 23/10/2014 07/04/2015
Number of options initially awarded
12,450 89,750 158,350 46,250 191,475 139,065 120,950 60,000
incl. options granted to current members of the Board of Directors
500 0 500 0 300 200 400 0
First stock option exercise date
05/10/2014 23/02/2015 10/10/2015 02/03/2016 19/12/2016 01/10/2017 23/10/2018 07/04/2019
Final stock option exercise date
04/10/2020 22/02/2021 09/10/2021 01/03/2022 18/12/2022 30/09/2023 22/10/2024 06/04/2025
Subscription price in EUR 37.06 50.13 57.83 65.60 120.10 182.29 188.28 251.88
Number of options exercised as of 31/12/2016
5,450 49,528 59,014 9,776 19,625 2,400 2,000 0
Number of options lost and/or reawarded under new conditions
2,500 9,200 39,215 17,550 43,625 37,485 15,255 17,400
Number of valid options * 4,500 31,022 60,121 18,924 128,225 99,180 103,695 42,600

42
(ii) BSA and BSAAR warrants
In June 2010, Eurofins issued OBSAAR bonds (French acronym for “Obligations à bons de souscription et/ou d’acquisition d’actions remboursables”) for a nominal amount of EUR 175,995,654. The associated 295,990 BSAAR warrants were admitted to trading on Euronext Paris on 30 June 2012 under the ISIN code FR0010891796 and may be exercised to obtain 1 share of Eurofins Scientific SE for 2 BSAAR warrants up to 29/06/2017 for a subscription price of EUR 40 per share.
During the year 2016, 698 of these FR0010891796 BSAAR warrants were converted into 349 new shares and 15,886 BSAAR warrants were still outstanding as of 31/12/2016.
The Chief Executive Officer acting in the name and on behalf of the Board of Directors in compliance with article 8Bis of Eurofins’ Articles (see 3 below), decided on 1
st July 2014, to issue 117,820 non
listed BSA (French acronym for “Bons de souscription d’actions”) called “2014 BSA Leaders Warrants” with preferential subscription rights reserved to a certain number of executive leaders of the Eurofins group selected by Eurofins in consideration of their key management duties and responsibilities and the contribution they may bring to the enhancement of the value of the shares of Eurofins and who may wish to invest in a long-term equity-linked instrument. Each 2014 BSA Leaders Warrant gives the holder the right to subscribe to one (1) new share of Eurofins at a price of EUR 281.58 per share representing the issuance of up to 117,820 new shares of Eurofins. The exercise period is from 1
st July 2018 to 30 June 2022.
Further details on these warrants can be found in note 4.7 to the consolidated financial statements.
(iii) Free shares
As part of the Company’s long-term incentive program for the Group key personnel and management, and in addition to stock option plans, BSA and BSAAR warrants as described under (i) and (ii) above, the Company’s Board of Directors has decided on 29
th July 2016 to use the possibility
to grant free shares to some employees and directors of Group affiliates and has set a general framework and defined general “Free Share Plan rules” to that effect.
In this context, on 29th
July 2016, the Company’s Board of Directors has granted a first plan of free shares awarded to some Group employees and directors giving access to a maximum number of 5,985 existing and/or new shares of the Company. This free share plan is governed by the general “Free Share Plan rules” and the following specific conditions:
Vesting period: 4 years for the first half of free shares awarded to each beneficiary lapsing between 29/07/2016 and 28/07/2020 inclusive and 5 years for the second half lapsing between 29/07/2016 and 28/07/2021 inclusive;
Exercise period: between 29/07/2020 and 28/07/2026 inclusive for the first half of free shares awarded to each beneficiary and between 29/07/2021 and 28/07/2026 inclusive for the second half.
On 1st August 2016, the Company’s Board of
Directors has granted a second plan of free shares awarded to some Group employees and directors giving access to a maximum number of 4,496 existing and/or new shares of the Company. This free share plan is governed by the general “Free Share Plan rules” and the following specific conditions:
Vesting period: 4 years for the first half of free shares awarded to each beneficiary lapsing between 01/08/2016 and 31/07/2020 inclusive and 5 years for the second half lapsing between 01/08/2016 and 31/07/2021 inclusive;
Exercise period: between 01/08/2020 and 31/07/2026 inclusive for the first half of free shares awarded to each beneficiary and between 01/08/2021 and 31/07/2026 inclusive for the second half.
(iv) Private placement
On 29 June 2016, Eurofins announced the successful private placement of 606,061 new shares subscribed by Caisse de dépôt et placement du Québec (CDPQ) at a subscription price of EUR 330 per share. This transaction provides Eurofins with the ability to potentially accelerate the achievement of its mid-term plan, should the opportunity arise, and create significant incremental shareholder value with limited dilution. CDPQ’s approach of focusing on long-term financial returns on its investment and deploying long-term partnerships with the companies it invests in, which may include supporting larger acquisitions, is entirely consistent with Eurofins’ strategy of deploying capital for long-term value creation and securing flexibility in its future funding.
On 8 September 2016, Eurofins further announced the successful placement of 800,000 new shares subscribed by qualified institutional investors at a subscription price of EUR 370 per share. This transaction further strenghtened the Company’s capital structure and liquidity position.
b. Authorized and non-issued capital
In connection with the transfer of Eurofins’ registered office to Luxembourg, the annual general meeting of 11 January 2012 has approved a new article 8Bis of the Eurofins’ Articles of Association to set an authorized share capital (“capital autorisé”) for a maximum nominal value of EUR 2,500,000 represented by 25,000,000 shares having a nominal value of EUR 0.10 per share.
On 19 April 2016, the shareholders approved the renewal for five additional years (from 29
th June
2016, date of publication of the notarial deed recording the extraordinary general meeting in the

43
then existing Mémorial C. Recueil des Sociétés et Associations, until 29
th June 2021) of the
authorization granted to the Board to increase the Company’s share capital to a maximum nominal value of EUR 2,500,000 (represented by 25,000,000 shares having a nominal value of EUR 0.10 per share) under the terms and conditions that the Board of Directors may determine. The Board of Directors may in particular limit or waive the preferential subscription rights reserved to existing shareholders.
Moreover, Eurofins has issued:
BSA and BSAAR warrants (see par. 2.2.1 (a) (ii) above);
Stock option plans (see par. 2.2.1 (a) (i) above)
Free share plans (see par. 2.2.1 (a) (iii) above)
giving access to existing and/or new shares of Eurofins.
As of 31 December 2016, the maximum number of new shares that may be issued resulting from the
exercise of BSA, BSAAR warrants, free shares and stock options is 972,120, resulting in a potential fully diluted number of shares of 17,898,090.
Consequently, the additional maximum number of new shares that could be issued by Eurofins within the limit of the authorized share capital is 7,101,910.
Besides, new shares issued as well as Eurofins’ existing shares could be listed, in addition to the Paris Stock Exchange, on any other Luxembourg or foreign Stock Exchange to be determined by the Chairman of the Board on the basis of a mandate given by the Board of Directors.
2.2.2 Shareholding Disclosure
The Martin family holds 37.9% of the shares and controls 56.5% of the voting rights in Eurofins as of 31 December 2016.
The free float represents 62.1% of the shares and 43.5% of the voting rights of Eurofins.
The details of the different shares and voting rights held by the shareholders of Eurofins is as follows:
SHAREHOLDERS
SHARES SHARES %
VOTING
RIGHTS
(attached to
shares)
VOTING
RIGHTS
(attached to
Beneficiary
Units Class A)
VOTING
RIGHTS
(attached to
Beneficiary
Units Class B)
TOTAL
VOTING
RIGHTS
% TOTAL
VOTING
RIGHTS
Dr. Gilles G. MARTIN and his family 2 0,0% 2 2 0 4 0,0%
Dr. Yves-Loïc MARTIN 14.546 0,1% 14.546 14.546 0 29.092 0,1%
Analytical Bioventures SCA (1) 6.400.000 37,8% 6.400.000 6.400.000 1.000.000 13.800.000 56,4%
Martin Family (subtotal) 6.414.548 37,9% 6.414.548 6.414.548 1.000.000 13.829.096 56,5%
Treasury shares 0 0,0% 0 0 0 0 0,0%
Free Float 10.511.422 62,1% 10.511.422 118.292 0 10.629.714 43,5%
TOTAL 16.925.970 100,0% 16.925.970 6.532.840 1.000.000 24.458.810 100,0%
Shareholders and voting rights as of 31 December 2016
(1) Private company incorporated in Luxembourg and controlled by Gilles Martin, Yves-Loïc Martin and their family
The Company’s shareholder Analytical Bioventures SCA exercised its right for 1,000,000 of the 6,400,000 shares it owns pursuant to the terms of the new article 12 Ter of the Company’s articles of association as adopted by the AGM of shareholders held on 19 April 2016 to receive 1,000,000 class B beneficiary units (“parts bénéficiaires de catégorie B”) carrying one extra voting right per share, in addition to existing class A beneficiary units carrying one voting right per share.
Subsequently, a number of 1,000,000 class B beneficiary units were issued by the Company on 22 June 2016 in favour of Analytical Bioventures SCA (ABSCA). As a consequence, ABSCA holds as of 22 June 2016:
6,400,000 shares of the Company carrying one voting right each
6,400,000 class A beneficiary units carrying one voting right each
1,000,000 class B beneficiary units carrying one voting right each
Therefore, ABSCA holds 13,800,000 voting rights in aggregate representing 56.4% of the Company’s total voting rights as of 31 December 2016.
2.2.3 General meetings of shareholders held in 2016
The Annual General Meeting of shareholders held on 19 April 2016 adopted inter alia the following resolutions:
(i) Approval of the annual statutory accounts for the financial year ended on 31 December 2015,
(ii) Allocation of results for the financial year ended on 31 December 2015 and approval of a dividend payment of EUR 1.45 per share,
(iii) Discharge granted to the members of the Board of Directors for the performance of their duties as at 31 December 2015,
(iv) Discharge granted to PricewaterhouseCoopers, external auditor, for the execution of his assignment for the financial year ended 31 December 2015 and renewal of its mandate,

44
(v) Renewal of the mandates of Board members for Mr. Gilles Martin, Mr. Yves-Loic Martin, Mr. Stuart Anderson and Mrs. Valérie Hanote,
(vi) Approval of attendance fees for Board members up to 150,000 euros for the fiscal year 2016,
(vii) Renewal of the authorization given to the Board to increase the share capital of the Company within the 2,500,000 euros overall limit of authorized share capital,
(viii) Modification of the Articles of Association of the Company to clarify the framework of the existing beneficiary units and the creation of a new class B of beneficiary units for shares registered in a registered shareholder account for five consecutive years,
(ix) Approval of a worldwide free share plan.
2.3 Annual Statements in relation to the Takeover Law
2.3.1 Share capital structure
Please see above point 2.2.1 – Share capital
2.3.2 Shareholder purchase/sale agreement
With regard to article 11(1)(b) of the Takeover Law, the shares issued by Eurofins are listed on Euronext Paris and are freely transferable.
A shareholders‘ agreement regarding the Martin Family‘s shareholding in Analytical Bioventures SCA was concluded on 5
th September 2008, which
cancels and replaces the preceding one and aims in principal to renew the commitment towards the present management of Eurofins going forward and promote co-operation on a course of action in the event of a take-over bid. This agreement was concluded for a period of eight years, tacitly renewed each year and was made public by a statement disclosed by the French regulatory agency AMF (release n°208C1688 dated 17 September 2008).
2.3.3 Significant Shareholdings
With regard to article 11 (1)(c) of the Takeover Law, Eurofins’ shareholding structure showing each shareholder owning 2.5% or more of Eurofins’ share capital as far as they formally disclosed this to the Company is as follows:
Significant Shareholding as of 31 December 2016
No. of Shares
No. of Stock Options outstanding
Gilles G. Martin
Yves-Loïc Martin
Valérie Hanote
Stuart Anderson
Fereshteh Pouchantchi
1
14,546
1
55
0
0
0
0
1,230
530
Analytical Bioventures SCA, which is controlled by Gilles Martin and Yves-Loïc Martin, holds 6,400,000 shares.
Fidelity Management & Research (FMR) crossed the 7% voting rights threshold with 1,542,161 voting rights as of May 2016, as notified to Eurofins and the CSSF. No other notification has been received from FMR since then.
Eurofins has not been formally notified of any shareholder other than those stated above with an interest in excess of 5% of the voting rights as at 31 December 2016.
2.3.4 Holders of any securities with special control rights
With regard to article 11 (1)(d) of the Takeover Law, in addition to shares representing Eurofins’ issued share capital, a class A beneficiary unit, une « part bénéficiaire de catégorie A» which confers no right to dividends but a right to one vote, is allocated to holders of fully paid-up shares for which proof is provided of registration in the name of the same shareholder for at least three consecutive years as provided for in the Company’s Articles of Association. In case of a capital increase by incorporation of reserves, profits or share premium, the existing holders of beneficiary units will be entitled to additional class A beneficiary units following the issuance of new shares. The Shareholders’ extraordinary meeting of 19 April 2016 also authorised the issuance until 30 June 2021 of a new class B of beneficiary units (“parts bénéficiaires de catégorie B”) which confers no right to dividends but a right to one extra vote for each share of the Company held by holders of fully paid-up shares continuously held under registered form evidencing a holding for at least five (5) years as provided for in the Company’s Articles of Association. In case of a capital increase by incorporation of reserves, profits or share premium, the existing holders of class B beneficiary units will be entitled to additional class B beneficiary units following the issuance of new shares.
2.3.5 System of control of any employee share scheme
With regard to article 11 (1)(e) of the Takeover Law, information on stock-options and BSAAR warrants is

45
available in section 2.2.1 Share capital and notes 2.4, 4.7 and 1.18 to the audited consolidated financial statements.
2.3.6 Restrictions on voting rights
A sanction of suspension of voting rights can be applied to any shareholder (or group of shareholders acting jointly) who has (or have) crossed the thresholds set out (i) in article 10.3 of the Articles (2.5% or any multiple of 2.5% of the Company’s share capital) (ii) and in article 8 (1) of the Transparency Law dated January 11, 2008 (i.e. 5%; 10%; 15%; 20%; 25%; 33 1/3%; 50% and 66 2/3%) without having notified Eurofins accordingly and subject to limited exceptions set out in article 8 of Transparency Law.
Such suspension can be requested by any shareholder holding at least 2.5% of the Company’s share capital, and shall be applicable to voting rights above the thresholds indicated in the Transparency Law and the Articles and for a period of two years, as set out in article 10.3 of the Articles.
2.3.7 Agreements between shareholders
With regard to article 11 (1)(g) of the Takeover Law, there are agreements between shareholders in place as detailed in paragraph 2.3.2 above.
2.3.8 Appointment and replacement of Board Members – amendment of the Articles
With regard to article 11 (1)(h) of the Takeover Law, the Directors are elected by the general meeting of shareholders for four-year terms and may be re-elected or removed.
The rules governing amendments to Eurofins’ Articles are set out in article 20 of Eurofins’ Articles. An extraordinary general meeting, resolving as hereinafter provided, may amend any provisions of Eurofins’ Articles.
Such an extraordinary general meeting shall not validly deliberate unless at least one half of the share capital is present or represented. If this condition is not satisfied, a second meeting may be convened and shall validly deliberate regardless of the proportion of the capital present or represented. At any extraordinary general meeting, resolutions, in order to be adopted, must be carried by at least two-thirds of the votes cast. Votes cast shall not include votes attaching to shares in respect of which the shareholder has not taken part in the vote or has abstained or has returned a blank or invalid vote.
2.3.9 Shares buy-back programme
With regard notably to article 11 (1)(i) of the Takeover Law, the extraordinary general meeting of shareholders held on 16 April 2013 granted the Board of Directors a new share buy-back authorisation whereby the Board of Directors is authorized to purchase Eurofins’ shares on the stock exchange within a period of five (5) years from the date of the publication of the minutes of the extraordinary general meeting of shareholders held on 16 April 2013. The maximum number of shares that may be purchased and/or cancelled is limited to
10% of the total number of shares issued at this date and a maximum buying price of EUR 300.00 per share.
As at 31 December 2016, Eurofins held no shares under this programme.
2.3.10 Any significant agreement to which Eurofins is a party and which takes effect, is altered or terminates upon a change of control
With regard to article 11 (1)(j) of the Takeover Law, such significant agreements to which Eurofins is a party are not disclosed for confidentiality reasons.
Confidential agreements relate to commercial and strategic aspects of the Group to the knowledge of the Board of Directors. Exceptionally, some agreements provide for early repayment in the event of change of control and / or departure of key leaders of the Group at the request of certain credit institutions.
The terms and conditions of Eurofins Deeply subordinated bonds (Deeply Subordinated Fixed to Floating Rate Bonds ISIN XS0881803646) issued in January 2013 (and extended in July 2014) provide for the application of an additional interest rate and a margin of 5% each per annum if a change of control event occurs up to 31 January 2020 and for an additional margin of 5% per annum if a change of control event occurs as from 30 April 2020. If such a change of control occurs, Eurofins has also the option to redeem all (but not part) of outstanding bonds.
The conditions of the bonds issued in November 2013 (Senior unsecured Euro bond ISIN XS0996772876) provide that if a change of control event occurs, bondholders have the option to require Eurofins to redeem all or part of their bonds on a date falling seven days after a 45-day period from the delivery of a change of control notice given by Eurofins to the bondholders. In such case, bonds are redeemed at their principal amount together with all interest accrued until (but excluding) such date.
The conditions of the bonds issued in January 2015 (Senior unsecured Euro bond ISIN XS1174211471) provide that if a change of control event occurs, bondholders have the option to require Eurofins to redeem all or part of their bonds on a date falling seven days after a 45-day period from the delivery of a change of control notice given by Eurofins to the bondholders. In such case, bonds are redeemed at their principal amount together with all interest accrued until (but excluding) such date.
The terms and conditions of Eurofins Deeply subordinated bonds (Deeply Subordinated Fixed to Floating Rate Bonds ISIN XS1224953882) issued in April 2015 provide for the application of an additional interest rate and a margin of 2.5% each per annum, if a change of control event occurs during a fixed rate interest period, as from and including the 60
th calendar day following the change
of control event date and until the redemption of the bonds ; if a change of control event occurs during a floating rate interest period the margin will be increased by 2.5% per annum as from and including the floating rate interest payment date immediately following the 60
th calendar day following the change
of control event date and until the redemption of the bonds. If such a change of control occurs, Eurofins

46
has also the option to redeem all (but not some only) outstanding bonds.
The conditions of the bonds issued in July 2015 (Senior unsecured Euro bond ISIN XS1268496640) provide that if a change of control event occurs, bondholders have the option to require Eurofins to redeem all or part of their bonds on a date falling seven days after a 45-day period from the delivery of a change of control notice given by Eurofins to the bondholders. In such case, bonds are redeemed at their principal amount together with all interest accrued until (but excluding) such date.
2.3.11 Any agreement between Eurofins and its Board Members or employees providing for compensation if they resign or are made redundant without valid reason or if their employment ceases because of a takeover bid
With regard to article 11 (1)(k) of the Takeover Law, there is a table of remuneration of members of the Board of Directors as detailed in section II.2.
Related party transactions
Eurofins management believes that there is no conflict of interest between the duties of Eurofins, any of the members of the Company’s Board of directors and management, and their private interests and / or other duties. Some buildings are rented by Eurofins from property companies indirectly controlled by Analytical Bioventures SCA. Corresponding rents reflect normal market conditions. For more information on related party transactions, please see note 4.10 to the audited consolidated financial statements.
There is no arrangement or understanding with major shareholders, customers, suppliers or others pursuant to which the aforementioned persons have been selected as a member of the Board of Directors or senior management.
Share market
Euronext, Paris
Month
Average
closing price
(€) High (€) Low (€)
Average
daily
volume
('000)
Market cap
(€m)
2015 July 296.38 317.10 266.00 16.5 4,561
August 298.36 312.45 263.45 14.5 4,592
September 286.92 300.35 267.00 15.7 4,416
October 297.13 333.55 269.20 19.9 4,573
November 328.73 356.20 304.40 19.3 5,059
December 329.22 361.65 299.10 19.2 5,067
2016 January 302.26 325.00 279.25 18.6 5,116
February 295.84 338.80 271.25 20.5 5,007
March 316.07 339.25 304.00 21.0 5,350
April 323.10 334.60 311.55 12.6 5,469
May 329.35 348.70 315.00 10.4 5,574
June 329.10 351.80 282.05 16.1 5,570
July 336.94 347.75 323.50 11.6 5,703
August 372.40 390.00 333.60 14.7 6,303
September 387.55 414.90 359.85 22.8 6,560
October 414.84 431.75 403.70 20.9 7,022
November 412.91 437.00 383.35 54.0 6,989
December 403.45 413.00 389.60 26.2 6,829
3 Statement of persons responsible for the annual report
The Board of Directors confirms that, to the best of its knowledge, the annual statutory accounts, prepared in accordance with Luxembourg legal and regulatory requirements, and the consolidated financial statements for the year ended 31 December 2016, prepared in accordance with the International Financial Reporting Standards as adopted by the European Union, give a true and fair view of the assets, liabilities, financial position and profit or loss of Eurofins Scientific SE and its consolidated subsidiaries taken as a whole. In addition, the management report includes a fair review of the development and performance of the business and the position of Eurofins Scientific SE and its consolidated subsidiaries taken as a whole, together with a description of the principal risks and uncertainties that they face. On behalf of the Board of Directors Gilles MARTIN Chairman of the Board of Directors and CEO
Dated February 23, 2017

47
III. ANNUAL FINANCIAL STATEMENTS
1 Consolidated Financial Statements
Consolidated Income Statement January 1, 2016 to December 31, 2016
2016 2015
EUR Thousands Note Adjusted
results 1
Separately disclosed
items 2
Reported results
Adjusted
results 1
Separately disclosed
items 2
Reported results
Revenues 3 4.1 2,536,608 - 2,536,608 1,950,074 - 1,950,074
Operating costs, net 2.1 -2,056,984 -18,547 -2,075,532 -1,589,272 -15,768 -1,605,040
EBITDA 4 479,623 -18,547 461,076 360,802 -15,768 345,034
Depreciation and amortisation 3.1, 3.2 -122,008 -19,688 -141,696 -96,471 -14,560 -111,031
EBITAS 5 357,615 -38,235 319,380 264,331 -30,328 234,003
Non-cash stock option charge and
acquisition-related expenses, net 6 2.4
- -37,433 -37,433 - -35,873 -35,873 EBIT
357,615 -75,668 281,947 264,331 -66,201 198,130
Finance income 2.5 1,594 29,358 30,952 2,034 1,934 3,968 Finance costs 2.5 -50,891 -19,910 -70,801 -40,090 -30,023 -70,113 Share of (loss)/ profit of associates 3.4 509 - 509 373 - 373
Profit before income tax 308,827 -66,220 242,607 226,648 -94,290 132,358 Income tax expense 2.6 -81,362 16,261 -65,101 -59,586 17,348 -42,238
Net profit for the period 227,465 -49,959 177,506 167,062 -76,942 90,120
Attributable to:
Equity holders of the Company 221,643 -47,646 173,997 163,946 -76,630 87,316
Non-controlling interests 5,822 -2,313 3,509 3,116 -312 2,804
Earnings per share (basic) in EUR 4.8
13.86 -2.98 10.88 10.72 -5.01 5.71 - Total - Attributable to hybrid capital investors 1.71 0.52 2.23 1.39 0.64 2.02 - Attributable to equity holders of the Company 12.15 -3.50 8.65 9.33 -5.65 3.69
Earnings per share (diluted) in EUR 4.8
13.07 -2.81 10.26 10.08 -4.71 5.37 - Total - Attributable to hybrid capital investors 1.61 0.49 2.10 1.30 0.60 1.90 - Attributable to equity holders of the Company
11.46 -3.30 8.16 8.77
-5.31 3.46
Weighted average shares outstanding (basic) – in thousands
4.8 15,990 - 15,990 15,291 - 15,291
Weighted average shares outstanding (diluted) – in thousands
4.8 16,957 - 16,957 16,266 - 16,266
1 Adjusted results – reflect the ongoing performance of the mature and recurring activities excluding “separately disclosed items” (Notes 1.28 & 1.29). 2 Separately disclosed items – include one-off costs from integration, reorganisation, discontinued operations and other non-recurring income and costs,
temporary losses and other costs related to network expansion, start-ups and new acquisitions undergoing significant restructuring, non-cash accounting charges for stock options and free shares, impairment of goodwill, amortisation of acquired intangible assets, negative goodwill and transaction costs related to acquisitions as well as income from reversal of such costs and from unused amounts due for business acquisitions, net finance costs related to borrowing and investing excess cash and one-off financial effects and the related tax effects – Details are provided in Note 1.29 & 2.3.
3 Mature and recurring activities represented EUR 2,254m and EUR 1,707m of revenues in 2016 and 2015 respectively. 4 EBITDA – Earnings before interest, taxes, depreciation and amortisation, non-cash accounting charges for stock options and free shares, impairment of
goodwill, amortisation of acquired intangible assets, negative goodwill and transaction costs related to acquisitions as well as income from reversal of such costs and from unused amounts due for business acquisitions.
5 EBITAS – Earnings before interest, taxes, non-cash accounting charges for stock options and free shares, impairment of goodwill, amortisation of acquired
intangible assets, negative goodwill, and transaction costs related to acquisitions as well as income from reversal of such costs and from unused amounts due for business acquisitions.
6 Non-cash stock option charge and acquisition-related expenses – non-cash accounting charges for stock options and free shares, impairment of goodwill,
amortisation of acquired intangible assets, negative goodwill and transaction costs related to acquisitions as well as income from reversal of such costs and from unused amounts due for business acquisitions.

48
Consolidated statement of comprehensive income January 1, 2016 to December 31, 2016
EUR Thousands Note 2016 2015
Net profit for the period 177,506 90,120
Other comprehensive income/ loss (OCI)
Items that may be reclassified subsequently to profit or loss:
Currency translation differences 20,197 35,895
Net investment hedge 4.5 20,899 18,810
Available-for-sale Financial Assets 3.5 -58 1,618
Cash Flow hedge 4.5 6,898 5,464
Income tax on items that may be reclassified 3.17 - -260
Total 47,936 61,527
Items that will not be reclassified to profit or loss :
Retirement benefit obligations 3.15 -5,238 -1,232
Deferred taxes on retirement benefit obligations 3.17 1,310 97
Total -3,928 -1,135
Other comprehensive income for the period, net of tax 44,008 60,392
Total comprehensive income for the period 221,514 150,512
Attributable to: Equity holders of the Company 217,489 147,607
Non-controlling interests 4,025 2,905

49
Consolidated Balance Sheet As of December 31, 2016
EUR Thousands 2016 2015
Note
Property, plant and equipment 3.1 506,818 427,541
Goodwill 3.2 1,584,644 1,411,896
Other intangible assets 3.2 383,209 351,469
Investments in associates 3.4 3,373 14,926
Financial assets and other receivables 3.5 34,154 32,074
Deferred tax assets 3.17 37,804 36,020
Total non-current assets 2,550,002 2,273,926
Inventories 3.6 39,547 37,515
Trade accounts receivable 3.7 524,508 443,236
Prepaid expenses and other current assets 3.8 65,012 60,171
Current income tax assets 38,694 30,954
Derivative financial instruments assets 4.5 85,554 58,676
Cash and cash equivalents 3.9 826,098 793,755
Total current assets 1,579,413 1,424,307
Assets classified as held for sale 3.3 - 1,600
Total assets 4.1 4,129,415 3,699,833
Share capital 3.20 1,693 1,539
Hybrid capital 3.12 600,000 600,000
Other reserves 614,928 113,964
Retained earnings 287,281 158,787
Currency translation differences 123,576 83,050
Total attributable to equity holders of the Company 1,627,477 957,340
Non-controlling interests 3.21 129,237 122,971
Total shareholders' equity
1,756,714 1,080,311
Borrowings 3.10 1,340,359 1,496,555
Derivative financial instruments liabilities 4.5 1,659 6,898
Deferred tax liabilities 3.17 83,911 94,103
Amounts due for business acquisitions 3.14 180,600 193,390
Retirement benefit obligations 3.15 51,113 46,563
Provisions for other liabilities and charges 3.16 5,050 7,044
Total non-current liabilities 1,662,692 1,844,553
Borrowings 3.10 43,519 213,478
Interest and earnings due on hybrid capital 3.11 58,190 51,720
Trade accounts payable 3.13 230,122 197,015
Advance payments received 3.7 23,558 19,551
Deferred revenues 3.7 29,451 24,475
Current income tax liabilities 26,927 18,575
Amounts due for business acquisitions 3.14 43,511 22,561
Provisions for other liabilities and charges 3.16 12,728 14,652
Other current liabilities 3.13 242,003 212,942
Total current liabilities 710,009 774,969
Total liabilities and shareholders' equity 4,129,415 3,699,833
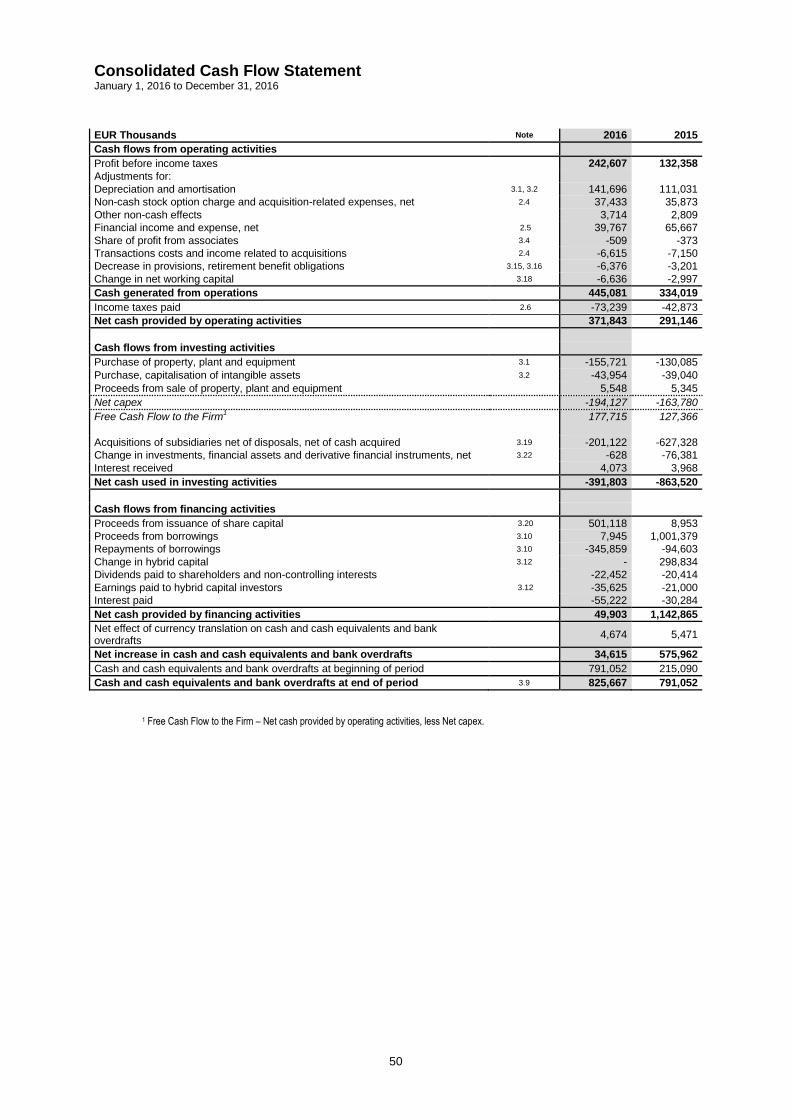
50
Consolidated Cash Flow Statement January 1, 2016 to December 31, 2016 EUR Thousands Note 2016 2015
Cash flows from operating activities
Profit before income taxes 242,607 132,358
Adjustments for:
Depreciation and amortisation 3.1, 3.2 141,696 111,031
Non-cash stock option charge and acquisition-related expenses, net 2.4 37,433 35,873
Other non-cash effects 3,714 2,809
Financial income and expense, net 2.5 39,767 65,667
Share of profit from associates 3.4 -509 -373
Transactions costs and income related to acquisitions 2.4 -6,615 -7,150
Decrease in provisions, retirement benefit obligations 3.15, 3.16 -6,376 -3,201
Change in net working capital 3.18 -6,636 -2,997
Cash generated from operations 445,081 334,019
Income taxes paid 2.6 -73,239 -42,873
Net cash provided by operating activities 371,843 291,146
Cash flows from investing activities
Purchase of property, plant and equipment 3.1 -155,721 -130,085
Purchase, capitalisation of intangible assets 3.2 -43,954 -39,040
Proceeds from sale of property, plant and equipment 5,548 5,345
Net capex
-194,127 -163,780
Free Cash Flow to the Firm1
177,715 127,366
Acquisitions of subsidiaries net of disposals, net of cash acquired 3.19 -201,122 -627,328
Change in investments, financial assets and derivative financial instruments, net 3.22 -628 -76,381
Interest received 4,073 3,968
Net cash used in investing activities -391,803 -863,520
Cash flows from financing activities
Proceeds from issuance of share capital 3.20 501,118 8,953
Proceeds from borrowings 3.10 7,945 1,001,379
Repayments of borrowings 3.10 -345,859 -94,603
Change in hybrid capital 3.12 - 298,834
Dividends paid to shareholders and non-controlling interests -22,452 -20,414
Earnings paid to hybrid capital investors 3.12 -35,625 -21,000
Interest paid -55,222 -30,284
Net cash provided by financing activities 49,903 1,142,865
Net effect of currency translation on cash and cash equivalents and bank overdrafts
4,674 5,471
Net increase in cash and cash equivalents and bank overdrafts 34,615 575,962
Cash and cash equivalents and bank overdrafts at beginning of period 791,052 215,090
Cash and cash equivalents and bank overdrafts at end of period 3.9 825,667 791,052
1 Free Cash Flow to the Firm – Net cash provided by operating activities, less Net capex.

51
Consolidated Statement of Changes in Equity As of December 31, 2016
EUR Thousands Attributable to equity holders of the
Company
Note
Share capital
Other reserves
Currency translation differences
Hybrid capital
Retained earnings
Non-controlling interests
Total equity
Balance at January 1, 2015 1,520 105,510 28,467 300,000 220,985 7,758 664,241
Currency translation differences - - 35,773 - 21 101 35,895
Net investment hedge 4.5 - - 18,810 - - - 18,810
Available-for-sale Financial Assets 3.5 - - - - 1,618 - 1,618
Cash flow hedge 4.5 - - - - 5,464 - 5,464
Actuarial gains and losses on defined benefit pension schemes
3.15 - - - - -1,232 - -1,232
Deferred taxes on Actuarial gains and losses on defined benefit pension schemes
3.17 - - - - 97 - 97
Deferred taxes on net investment hedge
3.17 - - - - -260 - -260
Other comprehensive income (loss) for the period, net of taxes
- - 54,583 - 5,708 101 60,392
Net profit - - - - 87,316 2,804 90,120
Total comprehensive income (loss) for the period
- - 54,583 - 93,024 2,905 150,512
Issue of share capital 3.20 19 8,454 - - 481 8,953 Stock options effects 2.4 - - - - 5,900 - 5,900 Deferred taxes on stock options - - - - 2,068 - 2,068
Issue of hybrid capital 3.12 - - - 300,000 -1,166 - 298,834
Distribution on hybrid capital 3.12 - - - - -30,954 - -30,954
Dividends - - - - -20,070 -344 -20,414
Non-controlling interests arising on business combinations
3.19, 3.21 - - - - -111,000 112,171 1,171
Balance at December 31, 2015 1,539 113,964 83,050 600,000 158,787 122,971 1,080,311
Balance at January 1, 2016
Currency translation differences - - 19,627 - 54 516 20,197
Net investment hedge 4.5 - - 20,899 - - - 20,899
Available-for-sale Financial Assets 3.5 - - - - -58 - -58
Cash flow hedge 4.5 - - - - 6,898 - 6,898
Actuarial gains and losses on defined benefit pension schemes
3.15 - - - - -5,238 - -5,238
Deferred taxes on Actuarial gains and losses on defined benefit pension schemes
3.17 - - - - 1,310 - 1,310
Deferred taxes on net investment hedge
3.17 - - - - - - -
Other comprehensive income (loss) for the period, net of taxes
- - 40,526 - 2,966 516 44,008
Net profit - - - - 173,997 3,509 177,506
Total comprehensive income (loss) for the period
- - 40,526 - 176,963 4,025 221,514
Stock options/ Free shares effects 2.4 - - - - 8,518 - 8,518
Deferred taxes on stock options
- - - - 2,469 - 2,469
Issue of share capital 3.20 154 500,964 - - - - 501,118
Issue of hybrid capital 3.12 - - - - - - -
Distribution on hybrid capital 3.12 - - - - -35,625 - -35,625
Dividends - - - - -22,315 -137 -22,452
Reevaluation of amounts due from business combination
3.14 - - - - -1,031 - -1,031
Non-controlling interests arising on business combinations
3.19, 3.21
- - - - -485 2,377 1,892
Balance at December 31, 2016 1,693 614,928 123,576 600,000 287,281 129,237 1,756,714
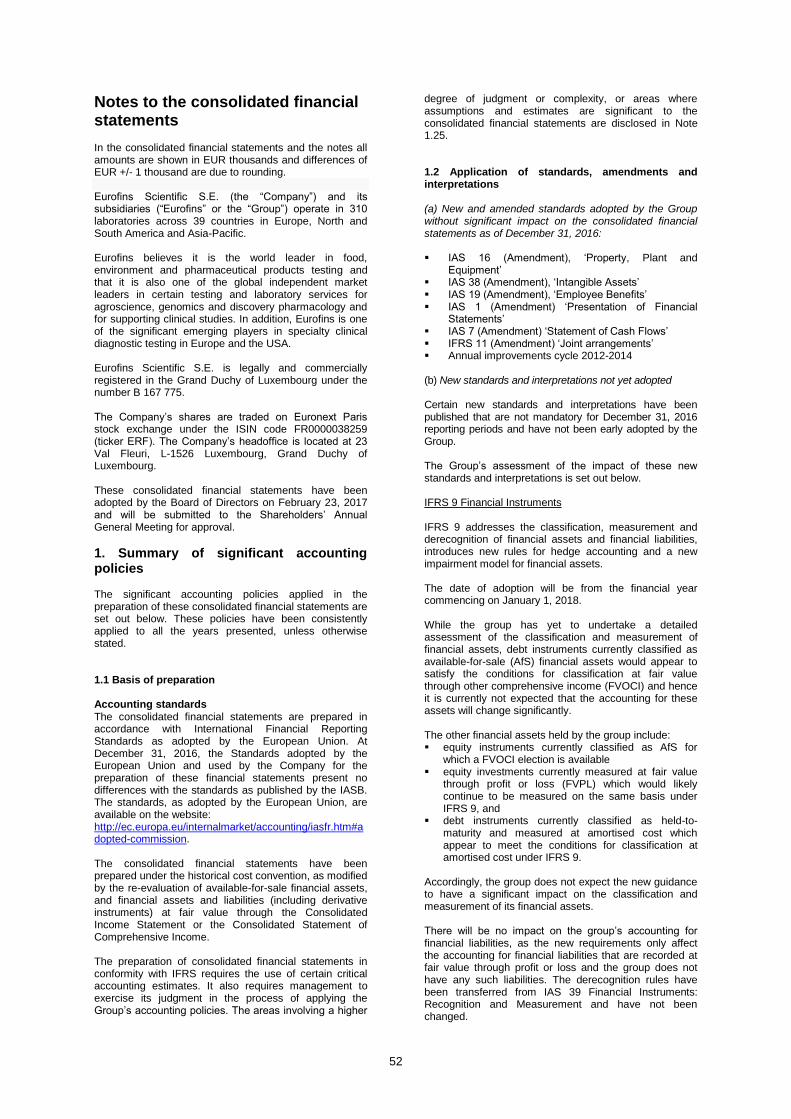
52
Notes to the consolidated financial statements In the consolidated financial statements and the notes all amounts are shown in EUR thousands and differences of EUR +/- 1 thousand are due to rounding. Eurofins Scientific S.E. (the “Company”) and its subsidiaries (“Eurofins” or the “Group”) operate in 310 laboratories across 39 countries in Europe, North and South America and Asia-Pacific. Eurofins believes it is the world leader in food, environment and pharmaceutical products testing and that it is also one of the global independent market leaders in certain testing and laboratory services for agroscience, genomics and discovery pharmacology and for supporting clinical studies. In addition, Eurofins is one of the significant emerging players in specialty clinical diagnostic testing in Europe and the USA. Eurofins Scientific S.E. is legally and commercially registered in the Grand Duchy of Luxembourg under the number B 167 775. The Company’s shares are traded on Euronext Paris stock exchange under the ISIN code FR0000038259 (ticker ERF). The Company’s headoffice is located at 23 Val Fleuri, L-1526 Luxembourg, Grand Duchy of Luxembourg. These consolidated financial statements have been adopted by the Board of Directors on February 23, 2017 and will be submitted to the Shareholders’ Annual General Meeting for approval.
1. Summary of significant accounting policies
The significant accounting policies applied in the preparation of these consolidated financial statements are set out below. These policies have been consistently applied to all the years presented, unless otherwise stated. 1.1 Basis of preparation Accounting standards The consolidated financial statements are prepared in accordance with International Financial Reporting Standards as adopted by the European Union. At December 31, 2016, the Standards adopted by the European Union and used by the Company for the preparation of these financial statements present no differences with the standards as published by the IASB. The standards, as adopted by the European Union, are available on the website: http://ec.europa.eu/internalmarket/accounting/iasfr.htm#adopted-commission. The consolidated financial statements have been prepared under the historical cost convention, as modified by the re-evaluation of available-for-sale financial assets, and financial assets and liabilities (including derivative instruments) at fair value through the Consolidated Income Statement or the Consolidated Statement of Comprehensive Income. The preparation of consolidated financial statements in conformity with IFRS requires the use of certain critical accounting estimates. It also requires management to exercise its judgment in the process of applying the Group’s accounting policies. The areas involving a higher
degree of judgment or complexity, or areas where assumptions and estimates are significant to the consolidated financial statements are disclosed in Note 1.25. 1.2 Application of standards, amendments and interpretations (a) New and amended standards adopted by the Group without significant impact on the consolidated financial statements as of December 31, 2016: IAS 16 (Amendment), ‘Property, Plant and
Equipment’ IAS 38 (Amendment), ‘Intangible Assets’ IAS 19 (Amendment), ‘Employee Benefits’ IAS 1 (Amendment) ‘Presentation of Financial
Statements’ IAS 7 (Amendment) ‘Statement of Cash Flows’ IFRS 11 (Amendment) ‘Joint arrangements’ Annual improvements cycle 2012-2014
(b) New standards and interpretations not yet adopted Certain new standards and interpretations have been published that are not mandatory for December 31, 2016 reporting periods and have not been early adopted by the Group. The Group’s assessment of the impact of these new standards and interpretations is set out below. IFRS 9 Financial Instruments IFRS 9 addresses the classification, measurement and derecognition of financial assets and financial liabilities, introduces new rules for hedge accounting and a new impairment model for financial assets. The date of adoption will be from the financial year commencing on January 1, 2018. While the group has yet to undertake a detailed assessment of the classification and measurement of financial assets, debt instruments currently classified as available-for-sale (AfS) financial assets would appear to satisfy the conditions for classification at fair value through other comprehensive income (FVOCI) and hence it is currently not expected that the accounting for these assets will change significantly. The other financial assets held by the group include: equity instruments currently classified as AfS for
which a FVOCI election is available equity investments currently measured at fair value
through profit or loss (FVPL) which would likely continue to be measured on the same basis under IFRS 9, and
debt instruments currently classified as held-to-maturity and measured at amortised cost which appear to meet the conditions for classification at amortised cost under IFRS 9.
Accordingly, the group does not expect the new guidance to have a significant impact on the classification and measurement of its financial assets. There will be no impact on the group’s accounting for financial liabilities, as the new requirements only affect the accounting for financial liabilities that are recorded at fair value through profit or loss and the group does not have any such liabilities. The derecognition rules have been transferred from IAS 39 Financial Instruments: Recognition and Measurement and have not been changed.
53
The Group believes that IFRS 9 new standard will allow it to better reflect its current hedging practice. As a general rule, more hedge relationships might be eligible for hedge accounting, as the standard introduces a more principles-based approach. While the Group has yet to undertake a detailed assessment, it would appear that the group’s current hedge relationships would qualify as continuing hedges upon the adoption of IFRS 9. Accordingly, the group does not expect a significant impact on the accounting for its hedging relationships. The new impairment model requires the recognition of impairment provisions based on expected credit losses (ECL) rather than only incurred credit losses as is the case under IAS 39. It applies to financial assets classified at amortised cost, debt instruments measured at FVOCI, contract assets under IFRS 15 Revenue from Contracts with Customers, lease receivables, loan commitments and certain financial guarantee contracts. While the group has not yet undertaken a detailed assessment of how its impairment provisions would be affected by the new model, it may result in an earlier recognition of credit losses. The new standard also introduces expanded disclosure requirements and changes in presentation. These are expected to change the nature and extent of the group’s disclosures about its financial instruments particularly in the year of the adoption of the new standard. IFRS 15 Revenue from contracts with customers The IASB has issued a new standard for the recognition of revenue. This will replace IAS 18 which covers contracts for goods and services and IAS 11 which covers construction contracts from January 1, 2018. The new standard is based on the principle that revenue is recognised when control of a good or service transfers to a customer – so the notion of control replaces the existing notion of risks and rewards. A new five-step process must be applied before revenue can be recognised: identify contracts with customers identify the separate performance obligation determine the transaction price of the contract allocate the transaction price to each of the
separate performance obligations, and recognise the revenue as each performance
obligation is satisfied. Key changes to current practice are: Any bundled goods or services that are distinct
must be separately recognised, and any discounts or rebates on the contract price must generally be allocated to the separate elements.
Revenue may be recognised earlier than under current standards if the consideration varies for any reasons (such as for incentives, rebates, performance fees, royalties, success of an outcome etc) – minimum amounts must be recognised if they are not at significant risk of reversal.
The point at which revenue is able to be recognised may shift: some revenue which is currently recognised at a point in time at the end of a contract may have to be recognised over the contract term and vice versa.
There are new specific rules on licenses, warranties, non-refundable upfront fees and, consignment arrangements, to name a few.
As with any new standard, there are also increased disclosures.
These accounting changes may have flow-on effects on the Group business practices regarding systems,
processes and controls, compensation and bonus plans, contracts, tax planning and investor communications. At this stage, the Group estimates the impact of the new rules on the group’s financial statements as limited as: . The Group derives revenue from the transfer of services at a point of time, and/or over time, depending on the business activity. . The Group does not incur material costs to obtain contracts with customers, does not operate customer loyalty programme and does not provide a right to return in the course of its business. The Group has few long term fixed price contracts. . The Group does not expect to have any contracts where the period between the transfer of the promised services and payment from the customer exceeds one year. As a consequence, the Group does not adjust any of the transaction prices for the time value of the money. The Group will make more detailed assessments of the impact over the next twelve months. IFRS 16 Leases IFRS 16 was issued in January 2016. It will result in almost all leases being recognised on the balance sheet, as the distinction between operating and finance leases is removed. Under the new standard, an asset (the right to use the leased item) and a financial liability to pay rentals are recognised. The only exceptions are short-term and low-value leases. The accounting for lessors will not significantly change. The standard will affect primarily the accounting for the group’s operating leases for buildings, equipment and cars. As at the reporting date, the group has non-cancellable operating lease commitments of EUR 332.6m, see Note 4.4. However, the Group has not yet determined to what extent these commitments will result in the recognition of an asset and a liability for future payments and how this will affect the group’s profit and classification of cash flows. Some of the commitments may be covered by the exception for short-term and low-value leases and some commitments may relate to arrangements that will not qualify as leases under IFRS 16. At this stage, the Group does not intend to adopt the standard before its effective date from year commencing on January 1, 2019. 1.3 Consolidation Subsidiaries Subsidiaries are all entities over which the Group has control. The Group controls an entity when the Group is exposed to, or has rights to variable returns from its involvement with the entity and has the ability to affect those returns through its power over the entity. The existence and effect of potential voting rights that are currently exercisable and cross put and call options agreements are considered when assessing whether the Group controls another entity. Subsidiaries are fully consolidated from the date on which control is transferred to the Group. They are no longer consolidated from the date such control ceases. The Group applies the acquisition method to account for business combinations. The consideration transferred for

54
the acquisition of a subsidiary is the fair value of the assets transferred, the liabilities incurred to the former owners of the acquiree and the equity interests issued by the Group. The consideration transferred includes the fair value of any asset or liability resulting from a contingent consideration arrangement. Identifiable assets acquired and liabilities and contingent liabilities assumed in a business combination are measured initially at their fair values at the acquisition date. The Group recognises any non-controlling interest in the acquiree on an acquisition-by-acquisition basis, either at fair value or at the non-controlling interest’s proportionate share of the recognised amounts of acquiree’s identifiable net assets. Acquisition-related costs are expensed as incurred. If the business combination is achieved in stages, the carrying value of the Group’s previously held equity interest in the acquiree is re-measured to fair value at the acquisition date; any gains or losses arising from such re-measurement are recognised in profit or loss. All inter-company transactions, balances and unrealised gains and losses on transactions between Group companies are eliminated. When necessary, accounting policies for subsidiaries are changed to ensure consistency with the policies adopted by the Group. The companies acquired at the end of the year are not consolidated if their contribution in terms of total assets, sales and net profit is not material in comparison with the consolidated accounts. They will be consolidated as from 1
st of January of the following year.
The Group holds no special purpose entities that are not consolidated. When the Group ceases to have control any retained interest in the entity is re-measured to its fair value at the date when control is lost, with the change in carrying amount recognised in profit and loss. A listing of the Group’s subsidiaries is set out in Note 5. The financial effect of the acquisition and disposal of subsidiaries is described in Note 3.19. The annual closing date of the individual financial statements is December 31. Transactions with non-controlling interests (“NCI”) Transactions with non-controlling interests that do not result in loss of control are accounted for as equity transactions, which means as transactions with the owners in their capacity as owners. For purchases from non-controlling interests after the initial control of the entity, the differences between fair value of any consideration paid and the relevant share acquired of the carrying value of net assets of the entity are recorded in equity. Gains and losses on disposals to non-controlling interests are also recorded in equity. Put and call options at acquisition time When the Group takes control of a subsidiary, it may enter into obligations to acquire the shares held by minority shareholders (put options) and concurrently benefits from the option to acquire these same shares (call options). These agreements are accounted for as follows: In case of cross put and call options exercisable at
a fixed price, Management considers these instruments as being exercised as the risks and rewards are in substance transferred to the Group from inception. As such, non-controlling interests are not recognised in the Balance Sheet and the Income Statement.
In case of cross put and call options at a variable price resulting from a business combination completed after the first application of IFRS 3R, Management considers whether the risks and rewards are actually transferred to the Group: o Where it is determined that risks and rewards
did not transfer to the Group, non-controlling interests are recognised in the Income Statement and the Balance Sheet.
o Where it is determined that risks and rewards did transfer to the Group upon entering into the cross put and calls, non-controlling interests are not recognised in the Balance Sheet and the Income Statement.
In addition a financial liability reflecting the put option element of the transaction is recognised for an amount corresponding to the present value of the redemption amount of the put option. Such financial liability is recognised from the equity attributable to holders of the Company. Any post-acquisition adjustment to the initial value on the put liability on non-controlling interests is booked to profit and loss. The Group is also closely monitoring the guidelines of the IASB and the IFRIC, which could lead to an amendment of specific standards on the treatment of such put options granted to holders of non-controlling interests. In case of cross put and call options at a variable price resulting from a business combination completed prior to the first application of IFRS 3R, the goodwill in progress is calculated by the difference between the put liability and the non-controlling interest value. Any post-acquisition adjustments to the original value on the put liability are also recorded in “goodwill in progress”. Associates Associates are all entities over which the Group has significant influence but no control, generally accompanying a shareholding of between 20% and 50% of the voting rights. Investments in associates are accounted for using the equity method of accounting. Under the equity method, the investment is initially recognised at cost, and the carrying amount is increased or decreased to recognise the investor’s share of the profit or loss of the associate after the date of acquisition. Joint arrangements The Group has no joint arrangements. 1.4 Goodwill Goodwill represents the excess of the cost of an acquisition over the fair value of the Group’s share in the net assets of the acquired subsidiary at the date of acquisition. If the cost of acquisition is less than the fair value of the net assets of the subsidiary acquired, the difference is recognised directly in the Income Statement (bargain purchase or negative goodwill). In accordance with IFRS 3R, the Group has twelve months from the acquisition date to finalise the allocation of the purchase price over the fair values of the acquiree’s identifiable assets and liabilities. IFRS 3R allows an accounting policy choice, available on a transaction by transaction basis, to measure non-controlling interests (NCI) either at: fair value (‘full goodwill method’), or the NCI's proportionate share of net assets of the
acquiree (‘partial goodwill method’).

55
Goodwill on acquisition of associates is included in “investments in associates”. 1.5 Intangible assets Intangible assets (software development costs and software licences) are booked at historical value, revised periodically in case of impairment. They are amortised over their estimated useful life of 3 years. Other intangible assets (customer relationships, brands) acquired as part of an acquisition of a business are capitalised separately from goodwill if their fair value can be measured reliably. Customer relationships and Brands have a finite useful life. They are valued according to the Income Approach. Customer relationships are valued using the discounted cash flow method using an appropriate discount rate (WACC) over a maximum period of 15 years. The value is based on the sales acquired using an annual percentage of attrition after deduction of the contributory assets charges (remuneration of the fixed assets, working capital, workforce and brands). Customer relationships are amortised on a straight-line basis over their estimated useful lives. For outsourcing deals signed with a sales contract, the amortisation period is aligned with respect to the duration of the contract. Brands are assessed on the basis of their royalty potential in relation to the annual sales, net of taxes. Brands are amortised on a systematic basis over their estimated useful lives (maximum period of 25 years). 1.6 Development costs The IT development costs (e.g. Laboratory information management systems) are capitalised under the criteria of IAS 38: It is technically feasible to complete the software
products so that it will be available for use; Management intends to complete the software
products and use it; There is an ability to use the software products; It can be demonstrated how the software products
can generate probable future economic benefits; Adequate technical, financial and other resources to
complete the development and to use the software products are available;
The expenditure attributable to the software product during its development can be reliably measured.
Development costs that are directly attributable to the design and testing of identifiable and unique software products controlled by the Group, and that will probably generate economic benefits exceeding costs beyond one year, are recognised as intangible assets. Directly attributable costs include the software development employee costs and an appropriate portion of relevant overheads. Software development costs recognised as assets are amortised over their estimated useful lives which do not exceed three years. Business development costs are recognised as an expense as they do not currently correspond to the criteria of capitalising development costs as described in IAS 38. 1.7 Property, plant and equipment Fixed assets are stated at historical cost less depreciation. Depreciation on fixed assets is calculated using the straight-line method to write off their cost to their
residual values over their estimated useful lives as follows:
Buildings and leasehold improvements5-20 years Machinery and laboratory equipment 5 years Office equipment, furniture and vehicles 3-5 years
Land is not depreciated as it is deemed to have an indefinite life. The assets’ residual values and useful lives are reviewed, and adjusted if appropriate, at each Balance Sheet date. An asset’s carrying amount is written down immediately to its recoverable amount if the asset’s carrying amount is greater than its estimated recoverable amount. 1.8 Finance and Operating Leases The Group leases certain property, plant and equipment. Leases of property, plant and equipment, where the Group has substantially all the risks and rewards of ownership, are classified as finance leases. Finance leases are capitalised at the lease’s commencement at the lower of the fair value of the leased property and the present value of the minimum lease payments. Each lease payment is allocated between the liability and finance charges. The interest element of the finance charge is charged to the income statement over the lease period. The property, plant and equipment acquired under finance leasing contracts are depreciated over the shorter period of the lease term or the asset useful life, unless it is reasonably certain that the Group will obtain ownership by the end of the lease term, in that case the depreciation period is the useful life. Leases in which a significant portion of the risks and rewards of ownership are retained by the lessor are classified as operating leases. Payments made under operating leases (net of any incentives received from the lessor) are charged to the Income Statement on a straight-line basis over the period of the lease. 1.9 Impairment of non-financial assets Assets that have an indefinite useful life (goodwill) are not subject to amortisation and are tested for impairment annually or if objective evidence of impairment loss. Assets that are subject to amortisation (e.g. customer relationship, brands) are reviewed for impairment whenever events or changes in circumstances indicate that the carrying value may not be recoverable. An impairment loss is recognised for the amount by which the asset’s carrying value exceeds its recoverable value. The recoverable amount is the higher of an asset’s fair value less costs of disposal and value in use. For the purposes of assessing impairment, assets including goodwill are grouped at the lowest levels for which there are separately identifiable cash flows (cash-generating units). The allocation of goodwill is made to those cash-generating units or group of cash-generating units that are expected to benefit from the business combination in which the goodwill arose. Each of those cash-generating units represents an operating segment (Note 4.1). The asset’s fair value less costs to sell of the cash-generating unit corresponds to an estimate based on financial multiples calculated on: the average revenues of the last two years ; the average adjusted EBITDA & EBITAS over the
last two years. The financial multiples are validated annually by comparison with the valuation and the price of take-overs of comparable companies.

56
The value in use is estimated by the discounted cash flows method using an appropriate discount rate (WACC). This rate is adapted to each cash-generating unit. The estimates of future cash flows and the discount rates are determined on a pre-tax basis. The debt/equity ratio is taken independently of the Group’s capital structure. The cost of debt has been determined taking into account prevailing economic conditions and the time horizon of expected cash flows. The valuation of the value in use is determined using reasonable assumptions (WACC, organic growth), based on a projected five-year period. The determination includes the net cash flows from disposal at the end of the useful life (terminal value). Goodwill impairment reviews are undertaken annually or more frequently if events of changes in circumstances indicate a potential impairment. Any impairment is recognised immediately as an expense and is not subsequently reversed. Gains and losses on the disposal of an entity include the carrying amount of goodwill relating to the entity sold. Non-financial assets other than goodwill are reviewed at each reporting date for possible reversal of an impairment loss that may have taken place. 1.10 Financial assets The Group classifies its financial assets in the following categories: financial assets at fair value through profit or loss, loans and receivables and available-for-sale financial assets. The classification depends on the purpose for which the financial assets were acquired. When securities classified as available-for-sale are sold or impaired, the accumulated fair value adjustments recognised in OCI are reclassified to the Income Statement. Loans and receivables are carried at amortised cost using the effective interest method. The fair values of quoted investments are based on bid prices at year-end. If the market for a financial asset is not active (or for unlisted securities), the Group calculates a fair value by using valuation techniques. The fair value of short term financial assets and liabilities is considered to be the value at the Balance Sheet date in view of the short maturity of this instrument. The Group assesses at the end of each reporting period whether there is objective evidence that a financial asset or group of financial assets is impaired. 1.11 Inventories The inventory of consumables consists primarily of chemical products. Inventories are stated at the lower amount between cost and net realisable value. Cost is determined using the first-in, first-out (FIFO) method. Net realisable value is the estimated selling price in the ordinary course of business, less applicable variable selling expenses. The above inventories are usually used within 2 years of their purchase. 1.12 Trade accounts receivable Trade accounts receivable are recognised initially at fair value and subsequently measured at amortised cost using the effective interest method, less provision for impairment.
Trade accounts receivable correspond to amounts invoiced, accrued or due by clients for analysis in progress, depending on the stage of completion of the analysis/work performed. A provision for impairment of trade receivables is established when there is objective evidence that the Group will not be able to collect all the amounts due, according to the original terms of sale. This risk is assessed in a prudent and standardised way with particular regard to the age of the account, the customer status, the country and the fact of invoices being subject to dispute. For governmental organisations as well as healthcare insurance providers, in the case of its US clinical diagnostic testing services, the Group regularly assesses the state of its billing operations and the level of payer’s reimbursements based on specific facts and circumstances and historical recoverability data in order to identify issues which may impact the collection of these receivables. This individual review by third-party payor grouping of all outstanding amounts is carried out at least at the end of each year and half year, especially to assess the difference between the invoices issued and the expected amounts to be recovered based on the scale of reimbursement for the patient. This review is based on the period that the receivables have been outstanding and the historical collection experience from the payers. An allowance is then recorded to reduce the gross revenue to the amount expected to be collected. Those revenue allowances are recorded as a reduction in revenue in the period that the services are performed. Changes in estimates related to revenue allowances are recorded as an increase or decrease to revenue in the period that the changes are identified. Bad debts are written off during the year in which they are identified. 1.13 Cash and cash equivalents and bank overdrafts For the purposes of the Balance Sheet, cash and cash equivalents include cash in hand, deposits held at call with banks, and investments in money market instruments highly liquid (with original maturities of three months or less that can be sold at any time). Bank overdrafts are shown within borrowings in current liabilities on the Balance Sheet. 1.14 Share capital Ordinary shares are classified as equity. Incremental costs directly attributable to the issue of new ordinary shares or options are shown in equity as a deduction, net of tax, from the proceeds. Where the Company or its subsidiaries purchase the Company’s equity share capital, the consideration paid including any attributable incremental costs net of income taxes is deducted from total shareholders’ equity as treasury shares until the shares are cancelled. If such shares are subsequently sold or reissued, any consideration received is included in shareholders’ equity. 1.15 Provisions Provisions for restructuring costs, legal claims and environmental restoration are recognised when the Group has a present legal or constructive obligation as a result of past events, it is more likely than not that an outflow of resources will be required to settle the obligation, and the amount has been reliably estimated. Restructuring
57
provisions comprise lease termination penalties and employee termination payments. Provisions are not recognised for future operating losses. Provisions are measured at the present value of the expenditure expected to be required to settle the obligation using a pre-tax rate that reflects current market assessments of the time value of money and the risks specific to the obligation. The increase in the provision due to passage of time is recognised as interest expense. 1.16 Employee benefits Pension obligations Group companies operate various pension schemes. The schemes are generally funded through payments to insurance companies, determined by periodic actuarial calculations. The Group has both defined benefit and defined contribution plans. A defined contribution plan is a pension plan under which the Group pays fixed contributions into a separate entity. The Group has no legal or constructive obligation to pay further contributions if the fund does not hold sufficient assets to pay all employees the benefits relating to employee service in the current and prior periods. A defined benefit plan is a pension plan that is not a defined contribution plan. Typically defined benefit plans define an amount of pension benefit that an employee will receive on retirement, usually dependent on one or more factors such as age, years of service and compensation. In accordance with IAS 19R the liability recognised in the Balance Sheet in respect of defined benefit pension plans is the present value of the defined benefit obligation at the Balance Sheet date less the fair value of plan assets. The defined benefit obligation is calculated or reviewed annually by independent actuaries using the projected unit credit method. The present value of the defined benefit obligation is determined by discounting the estimated future cash outflows using interest rates of high-quality corporate bonds (Iboxx AA) that are denominated in the currency in which the benefits will be paid, and that have terms to maturity approximating to the terms of the related pension liability. Actuarial gains and losses arising from experience adjustments, law changes and changes in actuarial assumptions are recognised immediately in Other Comprehensive Income as they occur. Past services (including those resulting from plan amendments) are recognised immediately in income. For defined contribution plans, the Group pays contributions to publicly or privately administered pension insurance plans on a mandatory, contractual or voluntary basis. The Group has no further payment obligations once the contributions have been paid. The contributions are recognised as employee benefit expense when they are due. Share-based compensation The Group operates a number of equity settled, share-based compensation plans. The fair value of the employee services received in exchange for the grant of the options is recognised as an expense over the vesting period and the counterpart is accounted for in equity. The total amount to be expensed over the vesting period is determined by reference to the fair value of the options granted. The proceeds received net of any directly attributable transaction costs are credited to share capital (nominal value) and other reserves when the options are exercised.
Profit sharing and bonus plans The Group recognises a liability and an expense for bonuses and profit-sharing schemes based on a formula that takes into consideration the profit attributable to the company’s shareholders after certain adjustments. The Group recognises a provision where contractually obliged or where there is a past practice that has created a constructive obligation. 1.17 Borrowings Borrowings are recognised initially at fair value, net of transaction costs incurred. Borrowings are subsequently recorded at amortised cost. Borrowings are classified as current liabilities unless the Group has an unconditional right to defer settlement of the liability for at least 12 months after the Balance Sheet date. The costs of the transaction are deducted from the debt and are expensed along the maturity of the borrowings. 1.18 OBSAAR Bonds IAS 32 states that the issuer of a hybrid bond comprising elements of debt and equity will post these elements separately: The first element (the bond) is considered to be a
form of debt characterised by the existence of a contractual obligation to the issuer to give to the holder of the financial instrument liquid assets or other financial assets.
The second element (the redeemable share subscription warrant, BSAAR) is considered to be an equity instrument giving the bearer the option of buying into the issuer’s share capital.
Paragraph 31 of IAS 32 requires that when the initial carrying amount of a compound financial instrument is allocated to its equity and liability components, the equity component is assigned the residual amount after deducting from the fair value of the instrument as a whole the amount separately determined for the liability component. In accordance with paragraph 32 of IAS 32, the carrying amount of the liability component corresponds to the fair value of a similar liability that does not have an associated equity component. The value in terms of equity is not re-evaluated during the lifetime of the BSAAR. If the warrant is exercised, liquid assets received as part of the capital increase will be posted directly in equity. The debt element was recognised at amortised cost, as recommended by IAS 39. The carrying value of the liability component was included in the line “OBSAAR Bonds” (Note 3.10). This instrument has been fully repaid in 2016. 1.19 Hybrid Capital The structure of the Hybrid Capital ensures that it is recognised as a component of equity in accordance with IAS 32 as the conditions below are met: No contractual obligation to redeem the instrument. No contractual obligation to pay the coupon
For this reason, the tax-deductible interest payments are not included in interest expense, but accounted for in the same way as dividend obligations to shareholders. The

58
distribution and the cost of issue are booked before tax in the equity. 1.20 Current and deferred income taxes The current income tax charge is calculated on the basis of the tax laws enacted or substantively enacted at the Balance Sheet date in the countries where the Company’s subsidiaries and associates operate and generate taxable income. Deferred income tax is provided for, using the liability method, on temporary differences arising between the tax bases of assets and liabilities and their carrying values in the consolidated financial statements. Deferred income tax is determined using tax rates (and laws) that have been enacted or substantially enacted at the Balance Sheet date and are expected to apply when the related deferred income tax is realised or the deferred income tax liability is settled. The principal temporary differences arise from depreciation on property, plant and equipment, provisions for pensions and tax losses carried forward. Deferred income tax assets are recognised to the extent that it is probable that future taxable profit will be available against which the temporary differences can be utilised. Deferred income tax is provided on temporary differences arising on investments in subsidiaries and associates, except where the timing of the reversal of the temporary difference is controlled by the Group and it is probable that the temporary difference will not reverse in the foreseeable future. Deferred income tax assets and liabilities are offset when there is a legally enforceable right to set off current tax assets against current tax liabilities and when the deferred taxes relate to the same fiscal authority. 1.21 Trade accounts payable Trade accounts payable are recognised initially at fair value and subsequently measured at amortised cost using the effective interest method. 1.22 Amounts due for business acquisitions Amounts due for business acquisitions are mainly comprised of: amounts due to former shareholders of acquired
companies for the fair value amount based on achievement of objectives (in general based for the major part on the operating profit) ;
the liability of the “put and call options” (part related to the transaction with non-controlling interests) at initial acquisition time.
Amounts due for business acquisitions are also accounted for at the fair value of the expected cash flow. The variation of the liability related to the decreasing time value is accounted for in the Income Statement as a financial expense. All re-estimations of the amounts due for business acquisitions after the initial period of twelve months of allocation of the purchase price are booked in the Income Statement as an acquisition-related expense (except for the put option on non-controlling interests contracted before IFRS 3R accounted for as “goodwill in progress”).
If all or part of the acquisition price of certain acquired laboratories is paid in Eurofins shares (new or existing shares): the amount due is accounted for in “Amounts due for
business acquisitions” in the case where the acquisition contract stipulates a fixed monetary amount payable in a variable number of Eurofins shares (number to be calculated at the moment of payment);
the amount due is accounted for in “retained earnings” in the case where the acquisition contract stipulates a fixed number of Eurofins shares.
1.23 Revenue recognition Eurofins provides analytical solutions and the most comprehensive range of testing methods to clients from a wide range of industries including the pharmaceutical, food and environmental sectors. Revenue comprises the fair value of the consideration received or receivable for the sale of services and goods in the ordinary course of the Group’s activities.
As a service provider Eurofins has to apply the revenue recognition rules for rendering of services (IAS 18 §20-28). With respect to revenue arising from the rendering of services, the accounting for those revenues depends on whether the outcome of a transaction can be estimated reliably or not:
If the outcome of a transaction involving the rendering of services can be measured reliably, the revenue associated with the transaction will be recognised by reference to the stage of completion (percentage of completion method). Therefore the revenue for all transactions which can be estimated on a reliable basis corresponds to the revenue agreed in the contract, multiplied by the stage of completion of the work performed (i.e. recognising the margin based on the percentage of work completed).
If the outcome of a transaction involving the rendering of services cannot be measured reliably, revenue will be recognised only to the extent of the incurred expenses as long as they are recoverable.
Expected losses are recognised when it is probable that total contract costs will exceed total contract revenue, the expected loss shall be recognised as an expense immediately.
Due to the continuous improvement of processes and systems the outcome for an increasing number of transactions can be measured on a reliable basis. Therefore for more and more new transactions the percentage of completion method is used to determine the revenue at the end of each reporting period. The stage of completion of an analysis is determined by the services performed to date as a percentage of the total analysis to be performed as an analysis is usually performed following different stages until the issuance of the final report. As stated in 1.12, for its US clinical diagnostic testing services, the Group recognises revenues when the testing process is complete and test results are reported to the ordering physician. The sales are generally billed to three types of payers: clients, patients and third parties such as HMOs (Health Managed Organizations), PPOs (Preferred Provider Organizations), Medicare and Medicaid.

59
Clients For clients (e.g. hospitals, reference laboratories, physicians’ offices who wish a direct-pay arrangement or biopharma companies seeking clinical testing services), sales are recorded on a fee-for-service basis at the Company’s client list price, less any negotiated discount. Patients Patients typically need to pay what is not covered by their insurance or falls under the deductible, co-pays and/or co-insurance of their insurance coverage, as defined by individual payer plan coverage policies and as required by applicable state guidelines. If not covered by insurance, patients typically pay list price or, if offered, a discounted amount from list price for advance payment of testing procedures. Collection from patients is often difficult and only a part of amounts due is often eventually collected. Third-party payers The Company bills third-party payers under fee-for-service agreements. Fee-for-service third-party payers are billed at the Company's patient fee schedule amount or at prices pre-agreed with the respective payor and third-party revenue is recorded net of contractual discounts. These discounts are recorded at the transaction level at the time of sale based on a fee schedule that is maintained for each third-party payer. A large part of the Company’s third-party sales are recorded using an actual or contracted fee schedule at the time of sale. For the remaining third-party sales, the most recent collection rate estimates are maintained for each payer to recognize revenue. Adjustments to the estimated payment amounts are recorded at the time of final collection and settlement of each transaction as an adjustment to Revenue. The Company periodically adjusts these estimated collection rates based upon historical payment trends, using the most recent two years of historical data. Historical collection statistics are grouped according to logical clusters of payers that have the same or similar payment coherence. Any exceptional event (e.g. important cash payment from a third party) is carefully reviewed with the objective to ensure a stable and accurate statistical model for revenue recognition. 1.24 Earnings per share Basic earnings per share are calculated by dividing the net profit attributable to equity holders of the Group by the weighted average number of ordinary shares in issue during the year, excluding ordinary shares purchased by the Company and held as treasury shares. For the diluted earnings per share, the weighted average number of ordinary shares in issue is adjusted to assume conversion of all such options into shares which are in the money at the current share price. The Company has the following categories of dilutive potential for ordinary shares: stock options, free shares, BSAAR, BSA warrants and partial and optional acquisition price payments in Eurofins shares. The net profit attributable to shareholders of the Group is obtained by deducting from the net profit the part that is directly attributable to hybrid capital investors. 1.25 Significant accounting judgments and estimates Judgments:
By applying the Group’s accounting policies described above, management has made the following judgments that have significant effects on the amounts recognised in the financial statements (apart from those involving
estimates, which are dealt with in the following paragraphs). Revenue recognition To use the percentage of completion method to measure the outcome of its services, the Group reviews annually the improvement of both operational and financial processes and systems (Note 1.23). In its US clinical diagnostic testing services, the Group regularly assesses the state of its billing operations and the level of payer’s reimbursements based on specific facts and circumstances and historical recoverability data in order to identify issues which may impact the collection of these receivables. Those revenue allowances are recorded as a reduction in revenue in the period that the services are performed. Change in estimates related to revenue allowances are recorded as an increase or decrease to revenue in the period that the changes are identified. Use of estimates:
The preparation of consolidated financial statements in compliance with IFRS requires management to make estimates and assumptions that affect the reported amounts of assets and liabilities and the disclosure of contingent assets and liabilities at the date of the financial statements, as well as the reported amounts of income and expenses during the period. These estimates and assumptions are based on past experience and on various other factors, including the prevailing economic environment. Actual amounts may differ from those obtained through the use of these estimates and assumptions. The estimates and assumptions that have a significant risk of causing a material adjustment to the carrying amounts of assets and liabilities within the next financial year are discussed below: Provision for other liabilities and charges Management estimates the provisions based on the circumstances relating to each specific event and upon currently available information. However, given the inherent difficulties in estimating liabilities in these areas (e.g. termination payment to employees upon leaving the Group, environmental and legal and warranty claims on services rendered), it cannot be guaranteed that additional costs will not be incurred beyond the amounts accrued. Estimated impairment of goodwill The Group tests at least annually if goodwill has suffered any impairment (Note 1.9). The recoverable amounts of cash-generating units are determined based on the higher of value-in-use and fair value less costs to sell calculations. The value in use calculation is based on discount rate and future cash flows. The fair value less costs to sell calculation is based on multiples of EBITDA/ EBITAS and revenues. Variable acquisition price calculation The Group reviews frequently the variable acquisition price calculations. The formulas are based on current and/or future profitability of the acquired companies. Thereafter, these amounts are re-estimated each year (Note 1.3). Valuation of intangible assets acquired in a business combination The Group estimates for each acquisition the value of the potential intangible asset related to an acquisition (e.g. customer relationships, brand names) based on discount rate and future cash flows of each asset (Note 1.5).

60
Valuation of fixed assets acquired in a business combination The Group estimates for each acquisition the value of the fixed assets related to an acquisition and particularly on lands and buildings based on external valuations (Note 1.3). Deferred tax assets recognition The Group reviews deferred tax assets on an annual basis, and recognises deferred tax assets for temporary differences and tax loss carry forwards to the extent that it deems probable that future taxable profit will be generated against which these can be utilized. Judgment is required by management in estimating the probability, timing and amount of future taxable profit (Note 1.20). Income taxes The Group operates in 39 countries and is subject to a wide range of complex tax laws and regulations. At any point in time it is normal for there to be a number of open years in any particular territory which may be subject to enquiry by local authorities. Where the effects of laws and regulations are unclear, estimates are used in determining the liability for the tax to be paid on profits which are recognised in the financial statements. The Group considers the estimates, assumptions and judgments to be reasonable; however, this can involve complex issues which may take a number of years to resolve. The final determination of prior year tax liabilities could be different from the estimates reflected in the financial statements (Note 1.20). Pension benefits The present value of the pension obligations depends on a number of factors that are determined on an actuarial basis using a number of assumptions. The assumptions used in determining the net cost (income) for pensions include the discount rate. Any change in these assumptions will impact carrying amount of pension obligations (Note 1.16). 1.26 Segment reporting The reportable segments are identified in accordance with IFRS 8. Reportable segments are based on geographical areas. The Group is very decentralised with a large number of small and medium size companies in many countries. The financial performance of the Group is reviewed at the level of individual legal entities or even within these companies at the level of the Business Units (“BU”) by the Chief Operating Decision Maker (“CODM”) or its representatives with the input of the BU leaders. Aggregates are done on different levels. They may vary depending on changes in management, organisation or leadership. The CODM is reviewing several sets of financial information, based mainly on products and services, leaders in charge and on the Group’s geographical areas. The rapid evolving nature of the Group also results in a constant adaptation of the matrix of its organisation. Within Eurofins, the nature of services, the nature of the production processes, the type or class of customers for its products and services; the methods used to provide its services; and the nature of the regulatory environment have highly similar economic characteristics. For example, similar long-term average gross margins are expected for all our businesses. The Chief Operating Decision Maker allocates resources and assesses performance of the Group's operating segments.
The Chief Operating Decision Maker has made a determination that the provision of financial information by geographical areas is more meaningful to the readers of the consolidated financial statements because it believes that the regions where the Group operates should be the main business performance differentiator going forward. 1.27 Foreign currencies Items included in the financial statements of each of the Group’s entities are measured using the currency of the primary economic environment in which the entity operates (“the functional currency”). The consolidated financial statements are presented in Euro, which is the Company’s functional and presentation currency. Income statements of foreign entities are translated into Euro at average exchange rates for the year and the balance sheets are translated at year end exchange rates ruling on the 31
st of December.
Currency translation differences arising from the retranslation of the net investment in foreign subsidiaries are booked into “currency translation differences” in shareholders’ equity, net of tax if applicable. Goodwill and fair value adjustments arising on the acquisition of a foreign entity are treated as assets and liabilities of the foreign entity and translated at the closing rate. Foreign currency transactions in Group companies are accounted for at the exchange rates prevailing at the date of the transactions: gains and losses resulting from the settlement of such transactions and from the translation of monetary assets and liabilities denominated in foreign currencies at year end exchange rates are recognised in the Income Statement. 1.28 Income Statement presentation Eurofins is providing in the Income Statement certain information not required by IFRS (“Adjusted Results and Separately Disclosed Items” columns) that excludes certain items because of the nature of these items and the impact they have on the analysis of the underlying business performance and trends. See also Note 1.29 Separately Disclosed Items. In addition, Eurofins shows EBITDA, EBITAS, Net profit and Earnings per share as defined in the notes to the Income Statement with the objective to be close and consistent with the information used in internal Group reporting to measure the performance of Group companies and information published by other companies in the sector. Management believes that providing this information enhances investors' understanding of the Group’s core operating results and future prospects, consistent with how management measures and forecasts the Group’s performance, especially when comparing such results to previous periods or objectives and to the performance of our competitors. This enables Eurofins to demonstrate the underlying profitability of the business – i.e. what the performance would be if the investments as described in Note 1.29 were not undertaken. In the interest of full transparency, Eurofins discloses both the adjusted results (i.e. without the separately disclosed items) and full reported results (i.e. including the separately disclosed items).

61
This information should be considered in addition to, but not in lieu of, information prepared in accordance with IFRS. 1.29 Separately disclosed items In order to present the performance of the Group in a clear, consistent and comparable format, certain items are disclosed separately in the Income Statement. Separately disclosed items include: One-off costs from integrations, reorganisations and
discontinued operations; Other non-recurring income and costs for all Group
companies; Temporary losses and other costs related to
network expansion, start-ups and new acquisitions undergoing significant restructuring;
Non-cash accounting charges for stock options and free shares;
impairment of goodwill, amortisation of acquired intangible assets, negative goodwill;
Income from reversal of such costs and from unused amounts due for business acquisitions;
Net finance costs related to borrowing and investing excess cash and one-off financial effects
Transaction costs (incl. long term incentives) related to acquisitions;
And all the related tax effects of the items listed above.
Reorganisation costs, such as reducing overhead and consolidating facilities, are included in the Separately Disclosed Items as Management believes that these effects are not indicative of our normal operating income and expenses. Certain gains/losses are also disclosed separately, as they are either isolated or cannot be expected to occur again with any regularity or predictability and as Management believes are not indicative of our normal operating gains and losses. These include for example, gains or losses from items such as the sale of a business or real estate, gains or losses on significant litigation-related matters and discontinued operations. Start-ups or acquisitions in significant restructuring are new companies or business activities established to develop an existing business model, transfer technology or a specific strategy. They are generally greenfield operations, or, in certain cases, newly-acquired businesses bought to achieve a target market share in a given geography that are not operating optimally, but that have the potential to operate efficiently and profitably once restructured or reorganised to the Eurofins model. However the reorganisation measures required are so large that they have a significant negative impact on the ongoing business of the Company. Start-ups are generally undertaken in new markets, and in particular emerging markets, where there are often limited viable options for acquisitions or in developed markets when Eurofins transfers technology developed by its R&D and Competence Centers abroad. Given that the costs or operating losses incurred in the start-up or restructuring phase are temporary and should cease within a 3-5 year period on average, it is management’s view that they should be disclosed separately. Whilst the timeframe for these temporary costs or losses is finite, and should cease gradually, the businesses should continue to generate revenues for the Group indefinitely, and these are therefore not considered temporary.
Start-up activities go through various stages of development before reaching optimal efficiency levels, and can take several years to become profitable. The development process includes the creation or construction of the laboratory, hiring the appropriate staff, obtaining relevant accreditations, deployment of the IT infrastructure and dedicated IT solutions, developing the sales and marketing channels, and building up volumes and the revenue base. In general, start-up periods last for 2 to 3 years in mature markets and 2 to 5 years in emerging markets. A business will generally no longer be considered as a start-up or an acquisition in significant restructuring when: The Group’s systems, structure and processes
have been deployed; It has been audited, accredited and qualified and
used by the relevant regulatory bodies and the targeted client base;
It no longer requires above-average annual capital expenditures, exceptional restructuring or abnormally large costs with respect to their current revenues for deploying new Group IT systems (Note 2.3).
The list of entities classified as start-ups or acquisitions in significant restructuring is reviewed at the beginning of the year and is relevant for the whole year. Temporary losses and other costs related to network expansion, start-ups and new acquisitions undergoing significant restructuring are included in the Separately Disclosed Items as these are investments in future growth prospects and distort the judgement of the underlying performance of the mature businesses of the Group. Separately disclosed items also include non-cash accounting charges for stock options and free shares, impairment of goodwill, and amortisation of acquired intangible assets, recording of negative goodwill as well as income from reversal of such costs and from unused amounts due for business acquisitions as all these transactions are without cash impact in the consolidated financial statements. Furthermore the amortisation of acquired intangible assets is included because a significant portion of the purchase price for acquisitions may be allocated to intangible assets. All transaction costs and long term incentives related to acquisitions during the year are disclosed separately. There are a number of different professionals that may assist throughout the process of planning, negotiating, due diligence, and closing of the transaction. Examples include intermediaries (investment bankers or business brokers), legal professionals (lawyers) and accounting professionals. These costs are specific and directly related to the transaction and are usually paid at or around the closing of the relevant transaction. These costs are disclosed separately also due to the fact that if the Group would stop the external growth, i.e. the acquisitions, and would only focus on internal growth, all these costs would disappear instantly and the EBIT would increase mechanically. Furthermore, these costs do not correspond to Eurofins’ business of providing analytical solutions to our customers. Net finance costs related to excess cash and one-off financial effects correspond to cash earmarked for future investments/ acquisitions and not needed for the existing business. Excess cash is calculated as the difference between the total consolidated cash balance at month-end and the minimum liquidity position required to operate the business, as based on a percentage of sales (5% of the annualised last 3 months revenues for 2016 and 2015) and split proportionately between Equity,

62
Gross debt and hybrid capital. The finance cost related to excess cash is then calculated using the weighted average interest rate of each debt instrument and coupon on hybrid capital on the balance sheet of the Company. Management believes that the separate disclosure of these items enhances investors' understanding of the Group’s core operating results and future prospects and allows better comparisons of operating results which are consistent over time and with peer companies. 1.30 Assets classified as held for sale Non-current assets are classified as assets held for sale and stated at the lower of carrying amount and fair value less costs to sell if their carrying amount is recovered principally through a sale transaction rather than through a continuing of use. The assets are available for immediate sale. The appropriate level of management is committed to a plan to sell the asset, and an active program to locate a buyer and complete the plan as initiated. The asset is actively marketed for sale at a price that is reasonable in relation to its current fair value. 1.31 Fair value measurement of land and buildings and assets classified as held for sale For purchase price allocation or in case of changes in circumstances indicating a potential impairment, the fair value measurement of the land and buildings is performed by independent advisors, according to Level 2 methodology. Fair value of land and buildings is derived using the sales comparison approach. The most significant input into this valuation approach is the price per square meter. 1.32 Derivative financial instruments and hedging activities Derivatives are initially recognised at fair value on the date a derivative contract is entered into and are subsequently re-measured at their fair value. The method of recognising the resulting gain or loss depends on whether the derivative is designated as a hedging instrument, and if so, the nature of the item being hedged. The Group designates certain derivatives as hedges of a particular risk associated with a recognised asset or liability or a highly probable forecast transaction (cash flow hedge) or a net investment in a foreign operation. The Group documents at the inception of the transaction the relationship between hedging instruments and hedged items, as well as its risk management objectives and strategy for undertaking various hedging transactions. The Group also documents its assessment, both at hedge inception and on an on-going basis, of whether the derivatives that are used in hedging transactions are highly effective in offsetting changes in fair values or cash flows of hedged items. The fair values of various derivative instruments used for hedging purposes and movements on the hedging reserve in other comprehensive income are disclosed in Note 4.5. The full fair value of a hedging derivative is classified as a non-current asset or liability when the remaining maturity of the hedged item is more than 12 months and as a current asset or liability when the remaining maturity of the hedged item is less than 12 months.
Cash flow hedge: The effective portion of changes in the fair value of derivatives that are designated and qualified as cash flow hedges are recognised in other comprehensive income. The gain or loss relating to the ineffective portion is recognised immediately in the Income Statement within “Finance costs”. Amounts accumulated in equity are reclassified to profit or loss in the periods when the hedged item affects profit or loss. The gain or loss relating to the effective portion of interest rate swaps hedging variable rate borrowings is recognised in the income statement within ‘Finance costs’. When a hedging instrument expires or is sold, or when a hedge no longer meets the criteria for hedge accounting, any cumulative gain or loss existing in equity at that time remains in equity and is recognised when the forecast transaction is ultimately recognised in the income statement. Net investment hedge: Hedges of net investments in foreign operations are accounted for similarly to cash flow hedges. Any gain or loss on the hedging is recognised in other comprehensive income. The gain or loss relating to the ineffective portion is recognised in the income statement. Gains and losses accumulated in equity are included in the income statement when the foreign operation is partially disposed of or sold. Derivatives that do not qualify for hedge accounting: Certain derivative instruments do not qualify for hedge accounting. Changes in the fair value of any derivative instrument that does not qualify for hedge accounting are recognised immediately in the Income Statement.

63
2. Notes to the Income Statement 2.1 Operating costs, net
EUR Thousands 2016 2015
Cost of purchased materials and services
897,508 685,154
Personnel expenses 1,178,148 915,177
Other operating income and expenses, net
-124 -4,709
Total 2,075,532 1,605,040
2.2 Full Time Equivalent and total Headcount Weighted average Full Time Equivalent (FTE)
2016 2015
Benelux 1,983 1,514
France 5,189 3,455
Germany 2,988 2,718
North America 5,763 4,602
Nordic Region 1,259 1,207
UK & Ireland 1,253 1,041
Other 4,966 3,845
Total FTE 23,401 18,382
By the end of the year 2016, the total headcount within the Group reached 27,291 employees (22,518 in 2015). 2.3 Separately disclosed items
EUR Thousands 2016 2015
One-off costs from integration, reorganisation, discontinued operations, and other non-recurring income and costs
-14,736 -16,308
Temporary losses and other costs related to network expansion, start-ups and new acquisitions undergoing significant restructuring
-3,813 540
EBITDA impact -18,547 -15,768
Depreciation costs specific to start-ups and new acquisitions undergoing significant restructuring
-19,688 -14,560
EBITAS impact -38,235 -30,328
Non-cash stock option charge and acquisition-related expenses
-37,433 -35,873
Finance cost related to excess cash and one-off financial effects
9,448 -28,089
Tax effect from the adjustment of all separately disclosed items
16,261 17,348
Total impact on Net Profit -49,959 -76,942
Non-controlling interests of separately disclosed items
2,313 312
Total impact on earnings attributable to equity holders
-47,646 -76,630
Total impact on earnings attributable to hybrid capital investors
-8,257 -9,731
For 2016, the one-off costs from integration, reorganisation, discontinued operations, and other non-recurring costs mainly consist of several site rationalization projects that involved consolidating several small sites into fewer but larger more efficient sites, or simply moving some businesses into our large campuses, either to streamline and optimize efficiencies or maximize synergies across businesses: In France, Eurofins is combining 3 laboratories into 1
larger site in Aix en Provence;
In the US, the program to integrate Eurofins discovery services business (Cerep, Panlabs and DDS Millipore), which includes site rationalization, is completed;
the closure and sale of one building in the UK; In the US, the consolidation and rationalisation in
one site of several environmental testing laboratories located on the West coast.
For 2015, the one-off costs from integration, reorganisation, discontinued operations, and other non-recurring costs mainly consisted of several site rationalization projects that involved consolidating several small sites into fewer but larger more efficient sites, or simply moving some businesses into our large campuses, either to streamline and optimize efficiencies or maximize synergies across businesses: In Europe, Eurofins was shifting several multi-
building or multi-location laboratories in Germany into its large, single-site campus in Hamburg;
The Group was also undertaking a site consolidation project to bring several small laboratories into 2 large sites in The Netherlands and Belgium;
In Sweden, Eurofins combined 2 laboratories into 1 larger site in Uppsala;
In the US, the final step in the move of the genetic testing lab from Hunstville to Louisville was carried out in December 2015;
In the US, the program to integrate Eurofins discovery services business (Cerep, Panlabs and DDS Millipore), which includes site rationalization, was still underway.
In the US, the consolidation in one site of several environmental testing laboratories on the West coast was initiated.
In 2016, start-ups and new acquisitions in significant restructuring generated operating losses of EUR -3,813K at EBITDA level and operating losses of EUR -23,501K at EBITAS level. The temporary losses related to the launch of its second start-up program to support the next growth cycle, in different states in the US to support the growth in food testing activities, in new countries such as Australia, Hungary, Bulgaria, in new environment laboratories in Poland and Portugal and the launch of several clinical genetic testing laboratories in the US, India and Japan. In the US, Eurofins is accelerating its network expansion program, launched in 2014, to reinforce its footprint in the rapidly-growing domestic food testing market. The Group has completed two food microbiology testing laboratories in Lancaster, PA, and in Mounds View, MN, and is constructing 10 small and medium-sized microbiology testing laboratories across the country for samples where rapid initiation of analyses is critical. In France, Eurofins is launching 6 start-up laboratories to optimize its footprint in water testing and reinforce its leading position in the broader environment testing market in the country. Following the re-organization of the water testing business during the IPL restructuring, Eurofins is now setting-up 6 satellite laboratories, taking its nationwide coverage across 13 satellite laboratories, complementing the large, regional central laboratory for water testing in Maxeville. During 2015, in preparation for future acquisitions as part of its 2020 development plan, the Group issued new debt and hybrid capital instruments for a total amount of EUR 1,300m (Notes 3.10 & 3.12). In 2016, the Group raised total gross proceeds of EUR 501m following issuance of new shares (Note 3.20). In 2016, the average monthly cash balance, net of overdrafts was EUR 725m (EUR 826m at year-end) to be compared to EUR 678m in 2015 (EUR 791m at year-end). This led to a large average month-end excess cash above the amount required to run

64
the existing business of EUR 600m in 2016 vs EUR 585m in 2015. The borrowing and investment of this excess cash have generated net finance costs of EUR -12,150K on the financial result and an impact of -8,257K on the earnings attributable to hybrid capital investors in 2016 vs an amount of EUR -12,111K on the financial result and an impact of -9,731K on the earnings attributable to hybrid capital investors in 2015. The one-off financial effects have a positive impact of EUR +21,598K on the financial result in 2016 versus a negative impact of -15,978K in 2015. 2.4 Non-cash accounting charge for stock options, free shares and acquisition-related expenses, net
EUR Thousands 2016 2015
Non-cash accounting charge for stock options
8,518 5,900
Loss (Gain) on disposal -2,357 -
Negative goodwill -109 -
Amortisation of acquired intangible assets
31,153 23,073
Transaction costs related to acquisitions
6,615 7,150
Unused amounts due for business acquisitions (Note 3.14)
-6,387 -11,331
Impairment of Goodwill - 11,081
Acquisition-related expenses, net 28,915 29,973
Total 37,433 35,873
Non-cash accounting charge for stock options and free shares Stock options/free shares are granted to selected managers and employees. The exercise price of the granted options is approximately equal to the market price on the date of the grant. Options/free shares are conditional on the employee completing the vesting period (4 to 5 years). The options/free shares are exercisable after the vesting period and have a contractual option term of ten years. The average expected exercise option period is considered on year later (5 to 6 years). The Group has no legal or constructive obligation to repurchase or settle the options in cash. The fair value of options/free shares granted during the period is determined using the Black-Scholes valuation model. An annual risk-free interest rate of 3% was used for the January 2016 plan and of 2.7% for the July/August 2016 plans (in 2015: 3.0%). The volatility measured is based on statistical analysis of daily share prices over the last three years. For 2016, the volatility amounts to 30% for the January 2016 plan and 31.3% for the July/August 2016 plan (amounted to 29.6% for the April 2015 plan and 29.5% for the October 2015 plan).
Plan
Number of stock options
initially granted
Average expected exercise
option period
(Years)
Average subscription price (EUR)
Weighted average
fair value of
options (EUR)
31/08/2010 164,400 5/6 36.62 15/16 05/10/2010 12,450 5/6 37.06 15/16 23/02/2011 89,750 5/6 50.13 20/22 10/10/2011 158,350 5/6 57.83 24/26 02/03/2012 46,250 5/6 65.60 25/27 19/12/2012 191,475 5/6 120.10 41/45 01/10/2013 139,065 5/6 182.29 61/67 23/10/2014 120,950 5/6 188.28 61/67 07/04/2015 60,000 5/6 251.88 80/88 22/10/2015 35,250 5/6 282.76 89/99 21/01/2016 93,920 5/6 286.30 91/101 01/08/2016 122,740 5/6 336.90 109/120
The movements in the number of share options are described in Note 4.7.
Plan
Number of free shares
initially granted
Average expected exercise
option period
(Years)
Weighted average fair value
of free shares (EUR)
29/07/2016 5,985 5/6 444/455 01/08/2016 4,496 5/6 446/457
The movements in the number of free shares are described in Note 4.7. 2.5 Financial result
EUR Thousands 2016 2015
Derivative financial instrument (Note 4.5)
26,879 -
Other Financial income 4,073 3,968
Finance income 30,952 3,968
Interest expense on borrowings -6,818 -5,444
Interest expense on pensions -1,046 -1,451
Bonds interest expense -42,768 -33,404
Schuldschein interest expense -5,550 -8,133 Additional Schuldschein interest due to early repayment
-5,267 -
Derivative financial instrument (Note 4.5)
-1,659 -16,141
Net foreign exchange gain/ loss -386 -477 Discounted cash flow charge on amounts due for business acquisitions
-4,700 -2,839
Discounted cash flow charge on bonds issuance costs
-2,607 -2,224
Finance costs -70,801 -70,113
Financial result, net -39,849 -66,145

65
2.6 Income tax expense EUR Thousands 2016 2015
Current tax -83,220 -44,596 Deferred tax (Note 3.17) 18,119 2,358
Income tax expense -65,101 -42,238
The tax on the Group’s profit before tax differs from the theoretical amount that would arise using the weighted average tax rate applicable to profits of the consolidated entities as follows: EUR Thousands 2016 2015
Result before income tax 242,607 132,358
Tax calculated at domestic rates applicable to profits in the respective countries
-74,007 -42,392
Theoretical tax charge rate 30.5% 32.0%
Other income taxes1 -11,117 -8,206
Tax impact of non-deductible expenses
-10,498 -6,820
Tax impact of income taxed at a reduced tax rate
33,097 21,918
Tax impact of shares of profit of associates
72 113
Tax impact of deductible expenses not accounted for in the Income Statement
11,461 2,340
Tax impact of tax losses not recognised
-16,597 -18,814
Utilisation of previously unrecognised tax losses
5,320 8,289
Re-measurement of deferred taxes
322 761
Adjustment in respect of prior years
-3,174 486
Minimum Income tax - -72 Tax credit 21 159
Income tax expense -65,101 -42,238 Actual income tax expense rate 26.8% 31.9%
1 This line includes other income taxes based on the
results as CVAE (“cotisation sur la valeur ajoutée des entreprises”) in France, IRAP (“imposta regionale sulle attività produttive”) in Italy and withholding taxes paid on some transactions such as dividends/ royalties. The movement in deferred tax assets and liabilities during the year is detailed in Note 3.17. The income tax paid for each period is the following:
EUR Thousands 2016 2015
Income tax paid -73,239 -42,873
The change in theoretical tax charge rate is primarily due to the change in weighted distribution of taxable results before income tax of the different countries where the Group operates. The adjustment in respect of prior years is mainly related to a tax audit in Germany. The utilisation of previously unrecognised tax losses is detailed in Note 3.17.

66
3. Notes on the Balance Sheet and Cash flow statement 3.1 Property, plant and equipment
EUR Thousands Assets in progress
Land, buildings and leasehold
improvements
Machinery and laboratory equipment
Office equipment,
furniture and vehicles
Total
Year 2015 Opening net book amount 23,073 117,861 157,065 25,748 323,747
Currency translation differences 762 4,625 3,797 -106 9,079 Change of scope 2,669 28,341 22,976 7,154 61,140 Additions 12,593 36,581 62,506 18,405 130,085 Disposals - -3,967 -1,835 -946 -6,747 Depreciation charge - -17,255 -57,335 -15,173 -89,763
Closing net book amount 39,097 166,186 187,175 35,083 427,541
Cost or valuation 39,097 298,341 595,231 149,244 1,081,913 Accumulated depreciation - -132,154 -408,056 -114,162 -654,371
Net book amount at December 31, 2015 39,097 166,186 187,175 35,083 427,541
Year 2016 Opening net book amount 39,097 166,186 187,175 35,083 427,541
Currency translation differences 1,080 3,058 3,244 545 7,927 Change of scope 0 14,210 16,896 2,134 33,241 Additions -5,562 59,732 79,929 21,622 155,721 Disposals - -4,277 -2,969 -389 -7,634 Depreciation charge - -24,190 -67,709 -18,079 -109,979
Closing net book amount 34,614 214,720 216,567 40,916 506,818
Cost or valuation 34,614 351,012 698,325 158,977 1,242,928 Accumulated depreciation - -136,292 -481,758 -118,060 -736,110
Net book amount at December 31, 2016 34,614 214,720 216,567 40,916 506,818
Leased machinery/equipment and building included in the above table, where Eurofins is a lessee under finance lease are as follows: EUR Thousands 2016 2015
Capitalised cost of finance leases 62,216 68,390
Accumulated depreciation -47,012 -51,551
Net book amount 15,204 16,840
3.2 Intangible assets
EUR Thousands
Intangibles assets
related to acquisition
1
Brands Software2
Other intangible assets
Total
Year 2015
Opening net book amount 131,707 16,858 44,248 721 193,534 Currency translation differences 9,338 1,383 718 3 11,441 Change in consolidation scope 128,098 18,997 2,474 2,227 151,796 Additions - - 39,030 10 39,040 Disposals - - - -1 -1 Amortisation charge -17,559 -5,514 -20,853 -415 -44,342
Closing net book amount 251,583 31,724 65,617 2,545 351,469
Cost 294,427 43,122 175,913 4,883 518,345 Accumulated amortisation -42,844 -11,398 -110,296 -2,338 -166,876
Net book amount at December 31, 2015 251,583 31,724 65,617 2,545 351,469
Year 2016
Opening net book amount 251,583 31,724 65,617 2,545 351,469 Currency translation differences 5,831 560 367 13 6,770 Change in consolidation scope 39,996 3,171 518 230 43,915 Additions - - 44,882 -928 43,954 Disposals - - -29 0 -28 Amortisation charge -23,721 -7,432 -30,097 -1,620 -62,870
Closing net book amount 273,689 28,023 81,257 240 383,209
Cost 344,093 47,299 219,462 1,693 612,546 Accumulated amortisation -70,404 -19,276 -138,204 -1,453 -229,337
Net book amount at December 31, 2016 273,689 28,023 81,257 240 383,209 1 Intangible assets related to acquisitions are mainly related to customer relationship and some technology/ intangible property and non-compete agreements assets
recognised during the purchase price allocation.
2 Software includes EUR 28.7m internal development costs capitalised in 2016.

67
Goodwill 2016 2015
EUR Thousands
Opening net book amount 1,411,896 679,030 Currency translation differences
24,030 31,571
Change in consolidation scope
148,718 712,376
Impairment - -11,081
Closing net book amount 1,584,644 1,411,896
- Cost 1,597,692 1,424,944 Accumulated impairment charge
-13,048 -13,048
Net book amount 1,584,644 1,411,896
The change in scope is detailed per legal entity in Note 5.1. The change in consolidation scope (intangible assets related to acquisitions: EUR 39,996K, brands: EUR 3,171K and goodwill: EUR 148,718K) for a total amount of EUR 191,885K relates to: New acquisitions of the period: EUR 190,646K, Adjustments during the 12-month window period of
previous acquisitions: EUR 788K, Change in “goodwill in progress”: EUR 450K (transaction
with non-controlling interests). The “goodwill in progress” is accounted for as an agreement to buy out the minority shareholders resulting from cross put and call options closed prior to the first application of IFRS 3R (Note 1.3) and represents an amount of EUR 1,766K as at December 31, 2016 (EUR 1,242K as at December 31, 2015). Impairment test for goodwill The calculation model description is provided in Note 1.9. A cash-generating unit (CGU) corresponds to the lowest level of assets or group of assets for which there are separately identifiable cash flows. CGUs are based on the following geographical areas: Benelux, France, Germany, North America, Nordic countries, UK and Ireland, Other Countries, which is an aggregate of others CGUs. Recently-acquired subsidiaries can be followed up individually in case of significant contingent consideration due during the years following the acquisition. The following is a summary of goodwill allocation for each operating segment as of December 31, 2016:
Opening Currency
translation Change of
scope1
Impair-ment
Closing EUR Thousands
Benelux 86,167 - 16,559 - 102,726
France 487,710 - 37,555 - 525,265
Germany 63,146 - 2,599 - 65,744
North America
576,935 24,660 33,275 - 634,870
Nordic Region
78,943 -441 8,853 - 87,355
UK & Ireland
51,004 -5,549 2,774 - 48,229
Other 66,568 5,360 48,526 - 120,455
Total 1,411,896 24,030 148,718 - 1,584,644 1 including reclassification from Ireland to France in connection with Biomnis
acquisition
The recoverable amount of all CGUs is determined based on value-in-use calculations. These calculations use pre-tax cash flow projections based on financial budgets approved by management covering a three-year period. Cash flows for years four and five are extrapolated using the estimated growth rates stated below. The Group reviews the
assumptions used regularly and brings them in line with the data observed on the market. The key assumptions used for value-in-use calculations in 2016 are as follows:
Compounded annual volume
growth rate
1
Long term
growth rate
2
Pre-tax Discount
rate
Recoverable amount of the
CGU EUR Thousands
Benelux 2.0% 2.0% 7.33% 422,439
France 2.2% 2.0% 8.83% 1,780,181
Germany 2.2% 2.0% 8.08% 1,039,412
North America
2.4% 2.0% 11.84% 1,157,710
Nordic Region
1.6% 1.5% 8.19% 440,447
UK & Ireland 2.2% 2.0% 9.02% 175,419
Other 2.8% 2.5% 10.80% 598,644 1 Compounded annual volume revenues growth rate in the initial five-year period
2 Weighted average growth rate used to extrapolate cash flows beyond the initial
five-year period
The key assumptions used for value-in-use calculations in 2015 were as follows:
Compounded annual volume
growth rate
1
Long term
growth rate
2
Pre-tax Discount
rate
Recoverable amount of the
CGU EUR Thousands
Benelux 1.8% 2.0% 8.93% 274,984
France 2.4% 2.0% 10.34% 1,303,310
Germany 2.4% 2.0% 9.63% 763,718
North America
3.4% 2.0% 11.62% 1,128,357
Nordic Region
1.9% 1.5% 9.51% 438,493
UK & Ireland 2.4% 2.0% 9.67% 144,157
Other 3.0% 2.5% 11.53% 422,282
Management determined as a key assumption the compounded annual volume growth rate for each CGU. The volume of sales in each period is the main driver for revenue and costs. The compounded annual volume growth rate is based on past performance and management’s expectations of market development. The long term growth rates used reflect specific risks relating to the relevant operating segments. The EBITAS margin used is between 10% and 17% of the revenues depending on geographic area for 2016, with an improvement in subsequent years. Financial information with respect to Revenues and EBITAS per CGU are not provided for confidentiality reasons because they would affect the Group's acquisition model. In 2016, no impairment is required as these values are above the carrying value of each CGU. In 2015, a goodwill impairment charge was recorded for an amount of EUR 11,081K for the company Anatech in Brazil. The downturn of the economic situation in Brazil and the release of the provision for earn-outs (amounts due for business acquisitions) were considered as indicators of loss in value of this company. As the amounts of the impairment charge and the release of the provision for earn-outs were

68
quite close, there was no material impact on the Group’s net profit. In 2016, Anatech improved its financial performance compared to 2015 (strong organic growth above 15% and improving EBITDA margin). Given this performance and the expected development of the business, no further impairment on the remaining goodwill (EUR 6.9m) has been considered necessary. A potential impairment of another EUR 0.6m-0.8m would be recorded if the WACC rate would increase by 1 percentage point or if the EBITDA margin were reduced by 200 basis points versus the company’s objectives. Sensitivity analysis: Rising the WACC rate by 1 percentage point in the value in use would not result in any impairment in goodwill. In EUR millions and multiple
Goodwill, net
value in use
1/
Goodwill, net
Benelux 103 3.2x France 525 2.7x Germany 66 12.3x North America 635 1.4x Nordic Region 87 4.2x UK & Ireland 48 2.9x Other 120 4.0x 1 WACC rate increased by 1%
Reducing Revenues, EBITDA, EBITAS ratios by 25% used for the valuation of assets less costs of disposal would not result in any impairment in goodwill either. 3.3 Assets classified as held for sale EUR Thousands 2016 2015
Opening net book amount 1,600 3,323 Exceptional depreciation - -900 Decrease -1,600 -823
Closing net book amount - 1,600
At the end of December 2015, the non-current assets held for sale were related to a building in Villebon (France) owned through a finance lease by the company Eurofins CEREP SA (EUR 1,600K). The building was sold in December 2016 for an amount of EUR 1,600K with no impact on the financial statements. 3.4 Investments in associates EUR Thousands 2016 2015
Opening net book amount 14,926 2,887 Currency translation differences 203 124 Change of scope -12,001 12,067 Disposals - -318 Dividends received -264 -207 Share of profit of associates 509 373
Closing net book amount 3,373 14,926
The amount disclosed under change of scope for 2015 is related to the acquisition of NM Group of Laboratories (NML) (Malaysia), Water & Waste Gesellschaft für Umweltschutz und chemische Laboratorien GmbH, Phyliae SAS, Histolog SL and Radonlab closed in November and December 2015 respectively (Note 5.1). These investments were fully consolidated as from January 1, 2016.
Other investments in associates were as follows: Main associates undertaking: Revenues
Net profit
Total assets
Equity % of
interest EUR Thousands
At December 31, 2016
Fasmac Co. Ltd. (JP) 10,319 711 7,900 5,725 41%
Eurofins Laboratoire Cœur de France SAEML (FR)
5,408 443 2,665 1,141 49%
Z.F.D GmbH 1,421 13 1,024 699 33%
ProBase Pharma BV 122 10 71 -3 50%
At December 31, 2015
Fasmac Co. Ltd. (JP) 7,730 221 7,033 4,835 41%
Eurofins Laboratoire Cœur de France SAEML (FR)
5,965 552 2,932 1,151 49%
Z.F.D GmbH 1,520 167 970 742 33%
3.5 Financial assets and other receivables EUR Thousands 2016 2015
Opening net book amount 32,074 23,264 Currency translation differences 537 957 Change of scope 709 4,541 Increase 3,310 3,212 Decrease -2,418 -1,518 Revaluation through OCI of Available for sale financial assets
-58 1,618
Closing net book amount 34,154 32,074
EUR Thousands 2016 2015
Available for sale financial assets 4,730 4,713 Lease and other deposits 29,424 27,361
Closing net book amount 34,154 32,074
Available for sale financial assets mainly relate to an investment in the company Vimta Labs Limited in India for EUR 4,730K (15.09% share ownership at the end of 2016). Vimta Labs Limited is publicly listed on the Bombay stock exchange (India). 3.6 Inventories EUR Thousands 2016 2015
Inventories 41,093 38,756 Provision for inventories -1,546 -1,241
Closing net book amount 39,547 37,515
The cost of inventories recognised as an expense during the period and included in “Operating costs, net” amounts to EUR 318,857K (2015: EUR 229,841K).

69
3.7 Trade accounts receivable
EUR Thousands 2016 20151
Trade accounts receivable - gross and expected amounts
1
459,592 393,715
Provision for impairment of receivables
-27,962 -27,734
Accrued sales 26,494 21,555 Amounts due by customers for analysis in progress
66,384 55,700
Trade accounts receivable 524,508 443,236
Advance payments received -23,558 -19,551 Deferred revenues -29,451 -24,475
Total Trade accounts receivable, net
471,499 399,210
1 offset for US Clinical Testing for EUR 50m as the revenues are recorded based
on expected amounts and shown the Trade accounts receivable for their expected amounts – see notes 1.12 and 1.23
The ageing of the gross trade accounts receivable as at December 31, 2016 is as follows: EUR Thousands 2016 2015
1
Not overdue 315,981 263,618 Overdue for less than 90 days 109,800 93,225 Overdue for more than 90 days but not more than 360 days
19,403 18,711
Overdue for more than 360 days 5,294 8,461 Individual bad debts 9,114 9,700
Total 459,592 393,715 1 see above for US Clinical Testing
Overdues for more than 90 days are for circa EUR 1.2m related to Governmental organisations. As of December 31, 2016, trade accounts receivable, net of VAT, were impaired for an amount of EUR 27,962K. Movements in the provision for impairment of trade accounts receivable are detailed as follows: EUR Thousands 2016 20151
Opening net book amount 27,734 15,108 Exchange differences 229 1 Change of scope 3,110 14,568 Net variation -3,111 -1,943
Closing net book amount 27,962 27,734 1 excluding for US Clinical Testing of the differences between gross and expected
revenues– see notes 1.12 and 1.23
The maximum exposure to credit risk at the reporting date is the carrying value of the trade accounts receivable mentioned above. The Group does not hold any collateral as security. For more details regarding the credit risk of the Group, refer to note 4.2. 3.8 Prepaid expenses and other current assets EUR Thousands 2016 2015
Prepaid expenses 22,432 20,510 Other receivables 42,580 39,661
Total 65,012 60,171
3.9 Cash and cash equivalents, bank overdrafts and net debt
EUR Thousands 2016 2015
Short term deposits with banks 506,019 591,101 Cash in hand 320,079 202,655
Cash & cash equivalents 826,098 793,755 Bank overdrafts -431 -2,703
Cash and cash equivalents less bank overdrafts
825,667 791,052
The short term deposits with banks consist of money market funds as well as interest bearing accounts and deposit certificates in Euros. At the end of the year, the carrying amount reflected above is the fair value based on the market price as they are quoted on active markets. EUR Thousands 2016 2015
Bank borrowings and leases liabilities
90,760 300,860
Bonds 1,293,118 1,409,171 Cash and cash equivalents -826,098 -793,755
Net debt 557,780 916,276
3.10 Borrowings EUR Thousands 2016 2015 Variation of borrowings
At beginning of year 1,707,330 708,702 Currency translation differences 1,686 5,273 Change of scope 9,738 84,355 Increase of borrowings 7,945 1,001,379 Repayment of borrowings -345,859 -94,603 Amortisation of bond costs 2,607 2,224
At end of year 1,383,446 1,707,330
Bank overdrafts 431 2,703
Total Borrowings 1,383,878 1,710,033
EUR Thousands Analysis of current borrowings
2016 2015
Bank borrowings 39,010 147,189 Bonds
1 -1,646 57,021
Bank overdrafts 431 2,703 Lease liabilities 5,724 6,565
Total current borrowings 43,519 213,478 1 Bond issuance costs
EUR Thousands Analysis of non-current borrowings
2016 2015
Bank borrowings 37,123 134,129 Bonds 1,294,764 1,352,151 Lease liabilities 8,472 10,275
Total non-current borrowings 1,340,359 1,496,555
Total borrowings 1,383,878 1,710,033
The repayment periods of the current borrowings are as follows:
EUR Thousands Total Up to 3 months
3-6 months
Over 6 months
Lease liabilities 5,724 1,431 2,862 1,431 Bank borrowings 39,009 24,384 9,269 5,355 Bonds -1,646 -411 -823 -411 Bank overdrafts 431 431
Total current borrowings
43,519 25,835 11,309 6,375
In addition, a number of bilateral credit facilities with Eurofins banks are not used at the end of 2016.

70
“Schuldschein” promissory note In July 2011, Eurofins concluded a EUR 170m Schuldschein loan (“Certificate of Indebtedness”). The loan is redeemable in full at maturity of 5 and 7 years, with interest rates based on Euribor 6 months (variable tranches) or mid-swap 5 and 7 year rates plus a margin of 1.80% or 2.20% p.a., respectively. In July 2016, the entire nominal amount of the Schuldschein of EUR 170,000K has been repaid. OBSAAR 2010 In June 2010, the Company issued OBSAAR bonds (French acronym for “Obligations à bons de souscription et/ou d’acquisition d’actions remboursables”) for a nominal amount of EUR 176m (excluding the bank commissions) which have been allocated to the debt component for EUR 175.5m and equity for EUR 0.5m. The conditions of this issue are detailed in a prospectus approved by the French financial markets authority (AMF) on 28 May 2010 under visa 10-155. This is a combination of a debt element (bond) and an equity element (warrant) issued simultaneously but split out immediately upon issue and traded separately. Both instruments are listed on Euronext Paris with two different ISIN codes: The bonds have been listed on Euronext Paris since
June 29, 2010 under ISIN FR0010891770; The BSAAR have been listed on Euronext Paris since
June 30, 2012 under ISIN FR0010891796. The OBSAAR debt component is not convertible into shares. The principal characteristics are as follows: 295,990 bonds, in denominations of EUR 594.60 each; Interest rate: Euribor 3 months + 1.75% p.a. payable on a
quarterly basis; Redemption: in three equal tranches on June 29, 2015,
June 29, 2016 and June 29, 2017; 1 warrant (BSAAR) is attached to each bond (Obligation),
ie. a total of 295,990 warrants, 2 warrants giving the right to subscribe or purchase 1 new or existing Eurofins Scientific S.E. share at a price of EUR40 per share between June 30, 2012 and June 29, 2017. Exercise of the warrants will therefore potentially lead to the issue of a maximum of 147,995 new shares, ie. a maximum dilution of 1.04% of the existing number of outstanding shares at the time of the OBSAAR issue.
In June 2016, the second tranche of EUR 58,665K was repaid. In December 2016, the remaining amounting to EUR 58,665K was repaid at par in anticipation in full. Eurobonds Eurobonds November 2018: In November 2013, Eurofins issued a senior unsecured Euro bond for a nominal value of EUR 300m for the first time. The bonds have a five-year maturity (due November 26, 2018), and bear an annual coupon of 3.125%. The bonds have been listed on the Luxembourg Stock Exchange under ISIN XS0996772876. Eurobonds January 2022: In January 2015, Eurofins raised EUR 500m through its second senior unsecured Euro bond public issuance. The bonds have a seven-year maturity (due January 27, 2022) and bear an annual coupon of 2.25% (ACT/ACT). The bonds have been listed, from their issue date (January 27, 2015), on the regulated market of the Luxembourg stock exchange (ISIN XS1174211471).
Eurobonds January 2023: In July 2015, Eurofins raised EUR 500m through a new senior unsecured Euro bond public issuance. The bonds have a 7.5-year maturity (due January 30, 2023) and bear an annual coupon of 3.375% (ACT/ACT). The bonds have been listed from their issue date (July 30, 2015) on the regulated market of the Luxembourg stock exchange (ISIN XS1268496640). 3.11 Interest due on borrowings and earnings due on
hybrid capital
EUR Thousands 2016 2015
Interest due on borrowings 29,019 22,549
Earnings due on 2013/14 hybrid capital
19,274 19,274
Earnings due on 2015 hybrid capital 9,897 9,897
Earnings due on hybrid capital 29,171 29,171
Total 58,190 51,720
3.12 Hybrid capital EUR Thousands 2016 2015
At beginning of year 600,000 300,000
Proceeds from Hybrid capital - 300,000
At end of year 600,000 600,000
The impact of the hybrid capital in the Cash Flow Statement is as follows:
EUR Thousands 2016 2015
2013/14 hybrid dividends 21,000 21,000
2015 hybrid dividends 14,625 -
Earnings paid to hybrid capital investors
35,625 21,000
In January 2013, Eurofins issued a EUR 150m hybrid capital. In July 2014, Eurofins extended the size of its existing hybrid instrument, bringing the overall size of Eurofins' Hybrid capital up to EUR 300m. In cash terms, the July 2014 transaction raised EUR 169m (EUR 164.2m in gross proceeds plus EUR 4.8m on accrued coupon). The hybrid instrument has a perpetual maturity, but is callable at par by Eurofins in January 2020. It is accounted for as 100% equity according to International Financial Reporting Standards (IFRS). It bears a fixed annual coupon of 7.00% for the first seven years until first call, and a coupon of Euribor 3m + 818 bps thereafter if not called. The instrument is listed on the regulated market of the Luxembourg stock exchange (ISIN XS 0881803646).
In April 2015, Eurofins issued a new EUR 300m hybrid capital which brought Eurofins' total hybrid capital to EUR 600m. Similar to the existing instrument, the new hybrid has a perpetual maturity, and is accounted for as 100% equity according to International Financial Reporting Standards (IFRS). It is callable at par by Eurofins on the 8
th year (i.e. on
April 29, 2023). The new hybrid instrument bears a fixed annual coupon of 4.875% for the first 8 years until first call, and a coupon of Euribor 3m + 701 bps thereafter if not called. The securities have been listed from their issue date (April 29, 2015) on the regulated market of the Luxembourg stock exchange (ISIN XS1224953882).

71
A distribution on hybrid capital has been paid for EUR 21.0m in January 2016 (EUR 300m at 7%) and EUR 14.6m in April 2016 (EUR 300m at 4.875%). The impact of the hybrid capital dividend distribution on the equity and of the net profit attributable to hybrid capital holders used for the calculation of the earnings per share is detailed as follows: EUR Thousands 2016 2015
2013/14 hybrid dividend 21,000 21,058 2015 hybrid dividend 14,625 9,897
Total dividend distribution on hybrid capital (Note 4.8)
35,625 30,954
3.13 Trade accounts payable and other current liabilities EUR Thousands 2016 2015
Trade accounts payable 156,228 139,638 Trade accruals payable 73,893 57,378
Total Trade accounts payable 230,122 197,015
Tax and social security payables 78,872 83,007 Tax and social security accruals
1 141,698 107,659
Other payables 21,433 22,276
Other current liabilities 242,003 212,942 1 Including employee, payroll and tax contribution accruals with variable
compensation accruals from 2016 3.14 Amounts due for business acquisitions Amounts due for business acquisitions comprise conditional clauses in the price payable to former shareholders of purchased companies at the estimated amount due. Movements in 2016 are detailed as follows: EUR Thousands 2016 2015
At beginning of year 215,951 44,308 Currency translation differences
3,737 472
Change of scope on new acquisitions
17,180 192,836
Amounts due for business acquisitions paid
-12,101 -13,173
Reversal of amounts due for business acquisitions not paid
-6,387 -11,331
Reevaluation by equity 1,031 - Interest on amounts due for business acquisitions (Note 2.5)
4,700 2,839
At end of year 224,112 215,951
Current 43,511 22,561 Non-current 180,600 193,390
Total 224,112 215,951
The change of scope corresponds to: EUR Thousands 2016 2015
New acquisitions 17,061 192,836 Re-evaluation goodwill within the 12 months period
-345 -
Re-evaluation goodwill in progress
464 -
Change of the year 17,180 192,836
The discount rate used in 2016 is 2.71% (2.25% in 2015). The periods in which the non-current Amounts due for business acquisitions are due are as follows: EUR Thousands 2016 2015
Between 1 and 5 years 165,700 148,580 Over 5 years 14,900 44,810
Total non-current 180,600 193,390
Within the amounts due for business acquisitions, the Group has contingent arrangements in relation with forty-five acquisitions (including put & call options). The assumptions used are based on the business plans provided at acquisition time and reviewed during the first 12 months in case of significant changes, then reviewed every year based on actual performance for multi-year arrangements to re-assess deferred considerations to be paid. This is a level 3 fair value measurement. More detailed price conditions are disclosed below. The companies acquired have already been fully consolidated and the liabilities related to the deferred consideration (including put and call options) are already included in the line “Amounts due for business acquisitions”. EUR Thousands 2016 2015
Transactions with previous shareholders
108,332 112,929
Transactions with NCI - Fixed price 3,883 4,995 Transactions with NCI - Variable price 122,061 114,784 Put and Call prior to the first application of IFRS 3R
1,766 1,242
Discount effects -11,930 -17,999
Total 224,112 215,951
The potential undiscounted amounts of all future payments that the Group could be required to make under these arrangements are estimated between EUR 198m and EUR 258m, depending on changes in financial performance of acquired companies. (i) Transactions with previous shareholders End of January 2015, Eurofins acquired 100% of Boston Heart Diagnostics Corp. (“BHD”) in the United States. The Earn-out Consideration is based on the average EBITDA of the company over the period January 2016 to December 2017. The fair value of the contingent consideration arrangement was estimated at an amount of EUR 57m at December 31, 2016 vs EUR 64m at December 31, 2015 (maximum amount undiscounted). The final instalment will be paid during 2018. In July 2015, Eurofins acquired 100% of Diatherix Laboratories, Inc. ("Diatherix") in the United States. The Earn-out Consideration is based on the average EBITDA of the company over the period July 2015 to June 2017. The fair value of the contingent consideration arrangement was estimated at an undiscounted amount in excess of EUR 20m. The final instalment will be paid in 2017. In September 2016, Eurofins acquired 100% of VRL, Inc. in the United States. The Earn-out Consideration is based on the Revenues & EBITDA of the company over the period September 2016 to August 2017. The fair value of the contingent consideration arrangement was estimated at an undiscounted amount in excess of EUR 3m. The final instalment will be paid in 2017. The other contingent consideration arrangements are individually estimated at less than EUR 3m. (ii) Transactions with non-controlling interests at a fixed price In November 2010, Eurofins Scientific S.E. has entered into a Control and Profit Transfer Agreement with MWG-Biotech AG non-controlling shareholders, for an amount of EUR 2.20 per share. The agreement has been revaluated in 2016 to an amount of EUR 3.20 per share. The number of shares concerned at the end of December 2016 was 501,748.
72
Eurofins completed in March 2013 the acquisition of a 52% majority stake in GCL/Fundación Chile (GCL), the leading food testing service provider in the country. A put and call agreement has been concluded for the remaining 48% of the shares. The call option at fixed price stands at EUR 2.3m according to this agreement. (iii) Transactions with non-controlling interests at a variable price Eurofins completed in 2013 the acquisition of a 91% majority stake in Eurofins Environment Testing Australia Pty Ltd., the largest private environmental testing laboratory network in Australia. A put and call agreement has been concluded for the remaining 9% of the shares. The fair value of the put and call agreement is based on a multiple of the Average EBITDA over the period 2016-2017, payable in 2018. Eurofins acquired in 2013 an 81% majority stake in Agrisearch Services (Australia/ New Zeland). A put and call agreement has been concluded for the remaining 19% of the shares. The fair value of the put and call agreement is based on a multiple of the Average EBITAS over the period 2016-2017, payable in 2018. Eurofins took control in 2015 of a 66% stake in Bio-Access in France. A put and call agreement has been concluded for the remaining 34% of the shares. The fair value of the put and call agreement is based on a multiple of the Average EBITDA, net of Net Debt over the period January 2019 to December 2020 and payable 50% in 2020 and 50% in 2021. The fair value is estimated at an undiscounted amount of EUR 98m (vs 91m at end of 2015). Eurofins acquired in 2015 a 76% stake in Emory Genetics Laboratory (“EGL”) in the United States. A put and call agreement has been concluded for the remaining 24% of the shares. The fair value of the put and call agreement is based on a multiple of the Average EBITDA, net of Net Debt, of the two last years of the put and call agreement ending no sooner than 2021 and payable in the following year. The fair value is estimated at an undiscounted amount in excess of EUR 13m. Eurofins acquired in 2015 a 72% stake in Laboratoire des Pyramides in France. A put and call agreement has been concluded for the remaining 28% of the shares. The fair value of the put and call agreement is based on a multiple of the last year EBITDA, net of Net Debt, at any time. The fair value is estimated at an undiscounted amount in excess of EUR 3m. Other put and call agreements have been signed for the remaining 34% of the shares in France Anapath Holding SAS, for the remaining 12% of the shares in Eurofins Digital Testing Belgium & Poland and for the remaining 25% remaining of the shares in NM Group of Laboratories (Malaysia). The aggregate value of these put and call agreements is estimated at less than EUR 5m as of December 31, 2016. (iv) Transactions with non-controlling interests at a variable price with the method of the “goodwill in progress” prior to the first application of IFRS 3R It concerns two put and call agreements for the remaining 10% of the shares of Eurofins Shanghai Holding Ltd (multiple of the Average EBITA over the period 2016-2017 * 10%, payable in 2018) and 7% of the shares of INLAB GmbH and Institut für Lebensmittelmikrobiologie GmbH (multiple of the Average Net Profit over the period 2019-2020 * 7%, payable in 2021). 3.15 Retirement benefit obligations The Group operates retirement benefit obligations plans in Austria, France, Germany, The Netherlands, Norway, Italy,
Japan, Sweden and Taiwan. These plans concern roughly 8,706 headcount (of which 5,650 headcount in France). We provide hereafter a short description of the main defined benefit plans and of the risks associated thereto: In Sweden, it relates to a defined benefit plan for all employees (ITP 2). The ITP 2 plan can be funded in two different ways, either by paying premiums to Alecta Pensionsförsäkring (a mutual life insurance company) or by using a book reserve system in combination with credit insurance through PRI Pensionsgaranti. Eurofins is using the latter. The ITP 2 pension paid relates to the final salary. The ITP 2 plan does not include any guaranteed compensation for inflation. The cost for the ITP 2 plan can vary significantly between employees depending on age and salary. The age of retirement is 65. A mechanism in the plan will limit any excessive cost for the retirement pension benefit. In France, the “Provision pour indemnité de départ à la retraite” corresponds to a lump sum payment made upon retirement. The lump sum amount is dependent on different factors such as years of service with the company, compensation at retirement age (between age of 63 and 67) and collective agreements. Some companies in France also have some work anniversary awards agreements “médaille du travail”. The lump sum amount is defined by the collective agreement and based on the number of years of service with the company. In Germany, it relates mainly to a defined benefit plan for the employees of CLF (Central Laboratories Friedrichsdorf) and to defined benefit plans for ex-managers of companies acquired by Eurofins (who are no longer employees of these companies). The CLF pension plan consists in a perpetual annuity mainly dependent on final salary and years of service at the age of retirement (between age of 60 and 63). The CLF pension liabilities are updated taking the inflation rate into account. In Japan, the defined benefit plan mainly corresponds to a lump sum payment made upon retirement (age of 60) or upon ending an employment contract with the company. The lump sum amount is dependent on different factors such as years of service and job grade per company retirement rule. In Taiwan, the defined benefit plan corresponds to a lump sum payment made upon retirement. The lump sum amount is dependent on different factors such as years of service, compensation of the final 6 months’ salary preceding retirement. In the Netherlands, some Eurofins employees used to participate in a defined benefit pension scheme executed by the insurance company “Nationale Nederlanden” (NN). This defined benefit pension plan has been terminated at the end of 2016 as all concerned employees have moved to defined contribution pension plans. The remaining retirement benefit obligation in the Netherlands relates to work anniversary award plans ‘Jubilee’. The lump sum amount is defined by the employment conditions and based on the number of years of service. In Italy it relates to the TFR (‘Trattamento di Fine Rapporto’). It is an end-of-employment provision accrued for for each single employee and paid out upon termination of the employment contract. The provision amounts approximately to one month of salary per each worked year: the cost for the TFR can therefore vary significantly between employees depending on age and salary. Since the change in legislation in 2007, the TFR valuation as defined benefit obligations (DBO) has only consisted of: The TFR for entities of less than 50 employees; The TFR for the employees of companies greater than
50 employees and in existence before December 2006 (this “old” TFR is re-evaluated every year).

73
Since 2007, entities of more than 50 employees established after 2006 had the obligation to transfer the TFR provision to external funds (alternatively the Italian Social Security Agency – INPS – or any other private fund). Where applicable the TFR has been converted into a defined contribution plan. In Norway, the Group has a defined benefit plan (“Multi-Employer Scheme”) for employees who have previously been employed in the public sector (74 FTE). This plan relates to a company acquired by Eurofins. The benefits of this funded plan are mainly dependent on earned pension entitlement, salary at the time of retirement and the size of payments from the National Insurance. The plan also covers a life insurance and disability insurance. The yearly premiums are calculated in accordance with the Insurance Activity Act §10-5 to §10-8 and the National Insurance Act §19-14. The pension scheme is included in a common arrangement with other companies and the yearly premiums are levelled between all participating companies. The arrangement ensures that the premiums paid are neutral of gender and age. The premiums to be paid by Eurofins are calculated based upon the share of the total pension entitlements of the members of the scheme. The company is not liable to the plan for other entities participating in the scheme. Any surplus of the scheme will be allocated to the participating companies and added to its pension fund. Deficits will be charged to each participating company according to the share of the future obligation. In all countries, the calculation is performed by actuary experts (except in France where the calculation is performed by Eurofins). The movement on the pension accrual account is as follows:
EUR Thousands 2016 2015
At beginning of year 46,563 34,616 Exchange differences -424 329 Change of scope 1,095 10,428 Remeasurements included in OCI 5,238 1,232 Annual expense 1,234 1,878 Contributions paid -2,593 -1,921
At end of year 51,113 46,563
The total pension costs for the year 2016 amount to EUR 24.3m, of which EUR 1.2m for defined benefit plans and EUR 23.1m for defined contribution plans. The total pension costs for the year 2015 amounted to EUR 21.3m, of which EUR 1.9m for defined benefit plans and EUR 19.4m for defined contribution plans. The amount of contributions to defined contribution plans paid to members of the Board of Directors corresponds to EUR 34k. The amounts recognised in the Income Statement for the defined benefit plans are determined as follows:
EUR Thousands 2016 2015
Current service costs 3,516 1,358 Past service costs -3,258 -652 Effects of curtailments -70 -279 Interest cost 1,343 1,698 Expected return on plan assets -297 -247
Total 1,234 1,878
Out of the total yearly amount recognised in the Income Statement for defined benefit plans, an amount of EUR 258K has been recognised in “Personnel expenses”, EUR -70K in “Operating costs, net” and EUR 1,046K in the “Financial result”. The past service costs registered in 2016 is mainly due to the settlement of the “Nationale Nederlanden” plan in the Netherlands.
For 2016, the movement on the pension accrual account between present value of obligation and fair value of plan assets is as follows:
EUR Thousands Present value of
obligation
Fair value of plan
asset Total
At beginning of year 63,181 -16,619 46,563
Current service cost 3,516 - 3,516
Interest expense/(income) 1,343 -297 1,046
Past service costs -3,258 - -3,258
Effects of curtailments -70 - -70
Amounts recognised in the Income Statement
1,531 -297 1,234
Remeasurements :
Return on plan assets, excluding amounts included in interest expense/(income)
-1,156 -1,156
(Gain)/loss from change in demographic assumptions
-761 - -761
(Gain)/loss from change in financial assumptions
7,188 - 7,188
Experience (gains)/losses -32 - -32
Amounts recognised in the Other Comprehensive Income
6,394 -1,156 5,238
Exchange differences 65 -489 -423 Change of scope 1,581 -487 1,095 Contributions : - Employers - -571 -571 - Plan participants 31 -31 -
Benefit payments :
- From plans -7,920 7,920 - - From Employers -2,022 - -2,022
At end of year 62,843 -11,730 51,113
The amounts recognised in the balance sheet are determined as follows in EUR Thousands:
Country Present value
of funded obligations
Fair value of plan assets
Pension liability in the
balance sheet
Austria 60 - 60
Germany 7,763 -363 7,400
France 24,084 -73 24,010
Italy 2,951 - 2,951
Japan 3,199 -1,519 1,680
Netherlands 1,042 - 1,042
Norway 3,215 -2,581 634
Sweden 14,528 - 14,528
Taiwan 6,001 -7,194 -1,193
Total 62,843 -11,730 51,113

74
The main actuarial assumptions used vary depending on the country and are as follows:
Assumptions Discount
rate
Salary increase
rate (including inflation)
Pension increase
rate Inflation
Germany 1.1% 3.8% 1.8% 1.8%
France 1.1% 3.0% N/A 2.0%
Italy 1.1% 3.0% 2.6% 1.8%
Japan 0.4% N/A N/A N/A
Netherlands 1.1% 4.0% N/A 2.0%
Norway 2.1% 2.3% 1.2% 2.0%
Sweden 2.3% 3.0% 3.0% 1.5%
Taiwan 1.1% 1.0% N/A N/A
Assumptions regarding future mortality rates are set based on actuarial data, published statistics and experience in each country. The sensitivity of the defined benefit obligation to changes in the main assumptions is as follows:
Sensitivity tests Discount
rate
Salary growth rate
(incl. inflation)
Pension growth rate
(incl. inflation)
Change in assumption +/- 0.5% +/- 0.5% +/- 0.5% Current Net Liability Amount 51,113 51,113 51,113 Increase of rate in assumption -4,409 3,473 871 Decrease of rate in assumption 5,486 -2,636 -258
The above sensitivity analyses are based on a change in assumption while holding all other assumptions constant. In practice, this is unlikely to occur, and changes in some assumptions may be correlated. When calculating the sensitivity of the defined benefit obligation to significant actuarial assumptions the same method has been applied as when calculating the pension liability recognised within the balance sheet. Plan assets are detailed as follows:
EUR Thousands Quoted Unquoted Total %
Equity instruments -506 - -506 4%
Governmental bonds
-762 - -762 6%
Corporate bonds -1,651 - -1,651 14%
Property -322 - -322 3%
Qualifying insurance - -436 -436 4%
Cash & Cash equivalents
- -7,439 -7,439 63%
Investment funds - - - 0%
Others -209 -405 -615 5%
Total -3,450 -8,281 -11,730 100%
The expected maturity analysis of undiscounted pension benefits is as follows:
EUR Thousands
Expected undiscounted
benefit payments to
employees
2017 1,563
2018 1,887
2019 1,675
2020 1,924
2021 2,003
2022 & afterwards 126,610
Total 135,663
The expected employer contributions for 2017 amount to EUR 1,494K. 3.16 Provisions for other liabilities and charges
EUR Thousands Focusing
resources Other
Charges Total
At January 1, 2015 7,645 5,537 13,182 Currency translation differences
135 199 334
Change of scope/ Reclassification
8,977 2,364 11,341
Additional provisions 2,776 2,312 5,088 Utilised during year -5,328 -1,433 -6,761 Unused amounts reversed
-861 -627 -1,488
At December 31, 2015 13,344 8,352 21,696
EUR Thousands Focusing
resources Other
Charges Total
At January 1, 2016 13,344 8,352 21,696 Currency translation differences
-41 78 37
Change of scope/ Reclassification
1,010 52 1,062
Additional provisions 1,373 3,667 5,040 Utilised during year -7,200 -1,768 -8,967 Unused amounts reversed
-331 -759 -1,090
At December 31, 2016 8,156 9,622 17,778
Focusing resources provisions are related to reorganisations in progress. Provisions for other charges are mainly related to litigations. The change in provision for focusing resources mainly relates to: The ongoing restructuring plan within Biomnis SELAS.
This plan was initiated before the company’s integration into Eurofins Group;
Various sites reorganisations in the UK (Camberley) and in Norway (Bergen).
The additional provisions and unused amounts reversed are included in the separately disclosed items (Note 2.3).

75
The periods in which the provision for other liabilities and charges could be paid are: EUR Thousands 2016 2015
Up to one year 12,728 14,652 1 to 5 years 3,874 5,563 Over 5 years 1,176 1,481
Total 17,778 21,696
3.17 Deferred income taxes The movement on the deferred income tax account is as follows:
EUR Thousands 2016 2015
At beginning of year -58,083 -15,941 Exchange differences -994 -2,445 Change of scope -6,459 -41,894 Deferred taxes on Retirement benefit obligations (change in OCI)
1,310 97
Deferred taxes on net investments (change in OCI)
- -260
Income statement/ expense or income (Note 2.6)
18,119 2,358
At end of year -46,107 -58,083
The deferred tax liabilities (change of scope) are mainly related to the deferred taxes on intangible assets recognised on the purchase price allocation (Note 3.19). The amounts of deferred taxes are shown in the consolidated balance sheet as follows: EUR Thousands 2016 2015
Deferred tax assets 37,804 36,020 Deferred tax liabilities -83,911 -94,103
Total -46,107 -58,083
Deferred income tax assets are recognised for tax loss carryforwards only to the extent that realisation of the related tax benefit is probable. The Group owns tax losses of around EUR 395 million, excluding MWG Group, to carry forward against future taxable income and which have not been recognised as tax assets due to uncertainty of their recoverability. The MWG Group owns more than EUR 62 million of unrecognised tax loss carry forwards. The analysis of the deferred tax assets and deferred tax liabilities is detailed as follows: EUR millions 2016 2015
Deferred tax assets To be used after more than 12 months
4 8
To be used within 12 months 33 28
Total 38 36
Deferred tax liabilities To be released after more than 12 months
71 73
To be released within 12 months 13 21
Total 84 94
The movement in deferred income tax assets and liabilities during the year is as follows:
Deferred tax effect
in EUR millions
Open-ing
Exchange differ-rences
Pen- sion
Change of
scope
Net profit
Clos-ing
Intangible assets amortisation and fixed assets depreciation temporary differences liability
-111.4 -2.8 - -9.8 5.8 -118.1
Land revaluation
-3.7 -0.2 - - - -3.9
Discounted amounts due for business acquisitions
-5.8 -0.1 - - 0.8 -5.1
Tax losses capitalised
32.7 0.8 - 0.9 0.8 35.1
Pension accrual 9.6 - 1.3 0.3 -0.9 10.3
Fixed assets depreciation temporary difference assets
7.2 - - 0.8 2.2 10.2
Other 13.3 1.2 - 1.4 9.5 25.3
Total -58.1 -1.0 1.3 -6.5 18.1 -46.1
The deferred tax assets on tax losses capitalised mainly concern the tax unity Eurofins GeneScan GmbH (EUR 2.8m) and MWG Biotech AG (EUR 3.3m) in Germany, Eurofins Genomics LLC and Eurofins MWG Operon LLC (EUR 6.9m in the US) with an expectation to be used in the next 7 years. 3.18 Change in net working capital
The change in net working capital as disclosed in the cash flow statement is the following:
EUR Thousands 2016 2015
Change in:
Trade accounts receivable -81,271 -121,759 Inventories -2,032 -12,892 Prepaid expenses and other current assets
-4,841 -16,546
Trade accounts payable 33,107 69,874 Advance payments received and deferred revenues
8,983 6,601
Other current liabilities 29,059 60,838
Total changes – balance sheet -16,995 -13,884 Change of scope – current assets
40,998 117,859
Tax credits accruals receivable transfer
-6,656 -3,472
Change of scope – current liabilities
-29,113 -108,985
Currency translation differences 5,129 5,485
Total cash flow -6,636 -2,997

76
3.19 Business combinations During 2016 the Group concluded the following new significant acquisitions (see also Note 5.1): In January, Eurofins completed the acquisition of Sinensis Life Sciences BV. This company is specialised in the pharmaceutical product testing and cGMP Quality Control (QC) services in the Netherlands. It employs about 150 staff and generates annual revenues of about EUR 13.5m. In January, Eurofins completed the acquisition of Biotech-Germande SAS, one of the leading players in the environmental clinical testing and hospital hygiene market, as well as in medical device evaluation in France. Located in Marseille, it employs 40 staff and generates annual revenues of about EUR 3m. Eurofins also acquired in January a small Agrosciences business in Australia. In March, Eurofins completed the acquisition of Ams Laboratories Pty Ltd. This company is specialised in cGMP Quality Control (QC) services in Australia. It employs about 45 staff and generates annual revenues of about EUR 5m. In April, Eurofins completed the acquisition of Advantar Laboratories Inc. This company is specialised in GLP (Good Laboratory Practice) and cGMP Quality Control (QC) services in the USA. It employs about 50 staff and generates annual revenues of about USD 8m. In April, Eurofins completed the acquisition of PerkinElmer, Inc.’s prenatal screening laboratory services business branded as PerkinElmer Labs/NTD. It employs about 80 staff and generates annual revenues of about USD 20m at its laboratory in Melville, NY (USA), serving universities, hospitals, maternal foetal medicine specialists, and other laboratories worldwide. In April, Eurofins completed a small acquisition of an Agro-testing laboratory in The Netherlands with revenue of about EUR 2m. End of May, Eurofins completed the acquisition of EAC Corporation Ltd. ("EAC") from Asahi Industries Co., Ltd. ("Asahi") in Japan. As part of the acquisition, Asahi and Eurofins entered into an exclusive service agreement for a period of 3 years. EAC provides environment testing services nationwide, with a strong competence in water and dioxin testing. EAC employs about 70 staff and generates revenues of about EUR 5m. End of May, Eurofins completed the acquisition of Agro-Analyses SAS, one of the leading analytical service providers supporting the food retail and catering sectors in France. Founded nearly 30 years ago, the company employs 157 staff at its site in Metz, in the northeast of France. The company provides food safety testing with a strong competence in microbiology, as well as surface analysis and generates annual revenues in excess of EUR 10m. In May, Eurofins completed the acquisition of Tecna, a small manufacturer of diagnostic test kits for the analysis of chemical contaminants in food and feed in Italy. Mid-June, Eurofins completed the acquisition of Bureau de Wit B.V. (“Bureau de Wit”), one of the main laboratory service providers focused on food and water safety testing for the food production, hotel and catering sectors in The Netherlands. Bureau de Wit operates a laboratory in Almere, and employs 64 staff, generating annual revenues in excess of EUR 5m.
End of June, Eurofins completed a small acquisition of a clinical diagnostic laboratory in France with revenue of about EUR 2m. In July, Eurofins completed the acquisition of Exova's food, water and pharmaceutical testing business in the UK & Ireland, comprising 10 laboratories, for approximately GBP 18m. Collectively, the 10 laboratories employ more than 300 staff and generate revenues in excess of EUR 20m in 2016. Of the 10 laboratories, 3 are for food testing, 5 for water testing, and 2 for pharmaceutical products testing. In July, Eurofins completed the acquisition of a food testing laboratory in New Zealand, an agroscience business in the UK and an environment testing business in France and in Sweden with total combined revenues of above EUR 10m. In September 2016 Eurofins completed the acquisition of VRL Laboratories (“VRL”), one of the leading laboratories in pre-transplant testing for the eligibility determination for Donors of Human Cells, Tissues, and Cellular and Tissue-Based Products (HCT/Ps) in the US. Founded in 2010, VRL employs a total of 60 staff, generating revenues of above USD 15m across its main facility in Denver CO, and its satellite laboratories in Boston, MA, Dallas, TX, and Atlanta, GA. In August and beginning of September, Eurofins completed the acquisition of three small laboratories in Scandinavia and in Germany, in environmental, genomics and clinical testing with total combined revenues of about EUR 20m. In September, Eurofins completed the acquisition of the Megalab Group, one of the top five clinical diagnostic laboratory groups in Spain, for approximately EUR 40m. Headquartered in Madrid, where the central laboratory is based, Megalab operates 83 sites, of which 35 are located in private hospitals in 18 companies. The company employs about 550 staff across its sites and generated revenues in excess of EUR 45m in 2016. In October, Eurofins completed the acquisition of a food and pharma testing laboratory in the UK. It generates revenues of above EUR 6m and employs around 100 staff. In December, Eurofins acquired Exova’s environment testing business in Eastern Canada for about CAD 13m. The acquired business includes 5 laboratories in Quebec and Ontario, employing about 160 staff, and generated around CAD 19m of revenues in 2015. End of December, Eurofins acquired ASL Análises Ambientais (“ASL”), one of the leading environment testing service providers in Brazil. ASL employs about 150 staff and expects to generate revenues in excess of BRL 25m in 2016, with EBITDA margin already at Group objective. Furthermore, during 2016, some small companies have been discontinued or sold for a non-significant aggregated amount. As Eurofins carries out multiple acquisitions each year, Management takes the view to only provide this information with paragraph B64 of IFRS 3 on an aggregate level basis as none of these acquisitions would be relevant individually. The net cash outflow on acquisitions concerns both acquisitions completed in 2016 and in previous years. The businesses acquired contributed to Eurofins consolidated revenues of EUR 103 million and to consolidated EBITAS of EUR 10 million in 2016. If the effective dates of these acquisitions would have been January 1, 2016, Group consolidated revenues would have been increased by an additional EUR 122 million and consolidated EBITAS increased by an additional EUR 12 million.

77
The goodwill is attributable to the workforce of the acquired business and the synergies expected to arise after acquisition. The provisional fair values of assets and liabilities acquired or disposed of were as follows:
EUR Thousands 2016 2015
Property plant and equipment
-33,241 -61,140
Intangible assets -748 -4,701 Customer relationships and brands
-43,167 -147,095
Investments1 12,001 -12,067
Financial assets -709 -4,541 Trade Accounts Receivable, net
-34,809 -97,389
Inventories -3,939 -9,783 Other receivables -2,250 -10,687 Deferred income taxes assets
-2,151 -11,665
Corporate tax receivable -1,220 -7,559 Cash -15,160 -51,725
Current liabilities 29,113 108,985 Corporate taxes due 1,190 1,972 Borrowings 9,738 84,355 Accrued Interest Payable -59 200 Pension accrual 1,095 10,428 Provisions for risks 1,062 11,341 Deferred income taxes liabilities
8,610 53,559
Net Assets Acquired -74,644 -147,512
Goodwill (Note 3.2) -148,718 -712,376 Negative Goodwill (Note 2.4)
109 -
Non-controlling interests 1,892 1,171 Amounts due from business combinations on new acquisitions
17,180 192,836
Purchase price paid -204,181 -665,880
Less cash 15,160 51,725 Amounts due from business combinations paid
-12,101 -13,173
Net Cash Outflow on Acquisitions, net
-201,122 -627,328
Divided into:
Cash outflow on acquisition -201,179 -627,328
Proceeds from disposals of a subsidiary net of cash transferred
57 -
1
The amount shown under Investments is related to the acquisition of NM Group of Laboratories (NML), Water & Waste Gesellschaft für Umweltschutz und chemische Laboratorien GmbH, Phyliae SAS, Histolog SL and Radonlab closed in November and December 2015 respectively and fully consolidated as from January 1, 2016.
For all companies acquired in 2016, the provisional fair value of net assets acquired was as follows:
EUR Thousands 2016
Book value
prior to acquisition
Fair value adjustment
Fair value on
acquisition
Property plant and equipment
-34,310 1,069 -33,241
Intangible assets -748 - -748
Customer relationships and brands
-4,101 -39,066 -43,167
Investments and Financial assets
11,292 - 11,292
Trade Accounts Receivable, net
1
-37,966 3,157 -34,809
Inventories -3,939 - -3,939
Other receivables -2,250 - -2,250
Deferred income taxes assets
-404 -1,747 -2,151
Corporate tax receivable
-1,220 - -1,220
Cash -15,160 - -15,160
Current liabilities 29,179 -66 29,113
Corporate taxes due 1,190 - 1,190
Borrowings 9,738 - 9,738
Accrued Interest Payable
-59 - -59
Pension accrual 263 832 1,095
Provisions for risks 1,062 - 1,062
Deferred income taxes liabilities
-1,287 9,897 8,610
Net Assets Acquired
-48,720 -25,923 -74,644
1 The Gross amount of Trade Accounts Receivable was EUR
37,966K and the provision for bad debts EUR 3,157K. On the last 2 acquisitions completed in December 2016, the purchase price allocation between goodwill and intangible assets related to acquisition has not been carried out. The part of goodwill and other assets related to acquisitions completed in 2016 that are tax deductible represents an amount of EUR 17,552K. 3.20 Shareholders’ equity As of December 31, 2016, the Company’s share capital is composed of 16,925,970 shares of EUR 0.10 each. The allotted, called-up and fully paid capital amounts to EUR 1,693K. During 2016, the shareholders’ equity increased by EUR 7,753K due to the exercise of stock options and BSAAR warrants by employees resulting in 130,150 new shares being issued in 2016. On June 29, 2016, Eurofins privately placed 606,061 newly-issued shares with La Caisse de dépôt et placement du Québec (“CDPQ”), one of Canada’s largest institutional fund managers, at a subscription price of EUR 330 per share, raising gross proceeds of EUR 200m for the Group. On September 12, 2016, Eurofins raised total gross proceeds of EUR 296 million following the issuance of 800,000 new shares to institutional investors, at a price of EUR 370 per share.
78
Issuance commissions and fees related to the issuance of capital amounted to EUR 2.7m. Other reserves correspond to the legal reserve and share premium. Retained earnings correspond to the accumulated reserves not distributed. Furthermore, a EUR 22.3m dividend (EUR 1.45 per share) has been paid in July 2016. 3.21 Non-Controlling Interests The measurement policy of the Non-controlling interests (NCI) is explained in Note 1.3. The Non-controlling Interests (NCI) valued at the fair value at acquisition time relate to the following companies: Eurofins Cerep SA for the remaining non-controlling
interests of circa 10%. During 2016, the Group acquired an additional 0.2% of Eurofins Cerep SA shares. The valuation of the NCI is based on the take-over bid price of EUR 2 per share. This is a level 1 fair value measurement.
the companies listed below for their remaining NCI, already there in 2015: - Eurofins Environment Testing Australia: 9% ; - Agrisearch Services (Australia/ New Zealand): 19% ; - France Biologie Holding SAS: 34%, holding of the Bio-Access group; - France Anapath Holding SAS: 34% ; - Eurofins Digital Testing Belgium & Poland: 12% ; - Laboratories des Pyramides SELAS (France): 28% ; - EGL (US): 24%
and the new companies consolidated in 2016: - NM Group of Laboratories (Malaysia): 25%.
The valuation is based on the value of the Put and Call option at a variable price, as defined in Note 3.14 ‘Amounts due for business acquisitions’ for the put and call option at a variable price. This is a level 3 fair value measurement. The non-controlling interests of the companies listed above consequently bear the risks and rewards attached to their shareholding, which are recognised as Non-controlling interests. Most minority shareholders are managing directors of the companies and they have a right to the dividend of the company in which they hold a non-controlling interest. The Group has elected the full goodwill method on these deals; the non-controlling interests have been in consequence recognised at their fair value against goodwill at acquisition time. In accordance with IAS 32.23, the Group has recognised its obligation to purchase the shares under the put option as a financial liability under the caption “amounts due for business acquisitions”. The same paragraph states that the financial liability is reclassified from equity. During 2016, the Group acquired the 34.9% shares of Eurofins Sac Ky Hai Dang Company Limited (Vietnam) and 2% shares of Kalibios Srl (Italy).
3.22 Change in investments, financial assets and derivative financial instruments, net EUR Thousands 2016 2015
Investments in associates change (Note 3.4)
264 525
Financial assets and other receivables acquisitions/ disposals (Note 3.5)
-892 -1,694
Derivative financial instruments acquisitions (Note 4.5)
- -75,212
Total -628 -76,381

79
4. Other information
4.1 Segment information The Group operates in seven main geographical areas in the Analytical testing business (see Note 1.26). These are Benelux, France, Germany, North America, Nordic Region, UK & Ireland, and Other.
Revenues EUR Thousands
2016 As % of
total 2015
As % of total
% 2016
2015
Benelux 191,155 7.5% 158,066 8.1% 20.9%
France 625,898 24.7% 369,637 19.0% 69.3%
Germany 279,442 11.0% 250,366 12.8% 11.6%
North America
803,635 31.7% 643,234 33.0% 24.9%
Nordic Region
172,420 6.8% 163,322 8.4% 5.6%
UK & Ireland
121,984 4.8% 96,212 4.9% 26.8%
Other 342,074 13.5% 269,237 13.8% 27.1%
Total 2,536,608 100.0% 1,950,074 100.0% 30.1%
Revenues are based on the production country. For confidentiality reasons, the operating income by geographical area is not provided. Total assets and capital expenditure are shown in the geographical area in which the assets are located. Total Assets EUR Thousands
2016
2015
Benelux 875,240 511,628 France 1,015,976 1,283,271 Germany 286,919 256,428 North America 1,198,692 1,078,059 Nordic Region 180,525 173,415 UK & Ireland 117,842 73,521 Other 454,221 323,512
Total 4,129,415 3,699,833
Investments EUR Thousands
2016
2015
Benelux 71,888 56,103 France 53,737 544,529 Germany 31,347 22,863 North America 103,383 364,342 Nordic Region 15,082 10,219 UK & Ireland 24,443 2,309 Other 91,678 28,230
Total 391,559 1,028,596
Investments include the purchase of property, plant, equipment (EUR 155,721K) and intangible assets (EUR 43,954K) as well as the change of scope for goodwill (EUR 148,718K) and for intangible assets related to acquisitions and brands (EUR 43,167K). 4.2 Financial risk management Liquidity risk
During 2015, the Company issued additional hybrid capital for a par value of EUR 300m in April 2015 and two senior unsecured Euro bonds for EUR 500m each in January and July 2015 (Note 3.10 & 3.12).
During 2016, the Company has raised total proceeds of EUR 501m following the issuance of new shares (Note 3.20). In 2016, the Company also repaid the Schuldschein promissory note (EUR 170m) and the OBSAAR bonds (EUR 117m) for their respective outstanding amount in full (Note 3.10). At year-end, the Company and its subsidiaries have also entered into several loan and facility agreements with a number of banks. Certain loans/facilities are secured either by contingent securities over assets and/or by financial covenants, determined at local or consolidated level. Such covenants were usually based on comparable ratios to those applicable to the OBSAAR bonds and the Schuldschein loan.
The hybrid capital and Euro bonds are not secured by any financial covenants.
The Group has made a detailed review of its liquidity risk and considers that it is capable of honouring its debt. However, in regards to the current economic environment, it should be noted that the Company complies with its leverage ratio and at this time does not anticipate any particular liquidity problems or issues regarding the financial covenants within the next twelve months.
The leverage ratio as at December 31, 2016 and 2015 was as follows: EUR Thousands 2016 2015
Net debt (Note 3.9) 557,780 916,276
Adjusted EBITDA 479,623 360,802
Leverage ratio 1.16 2.54
Bearing in mind the uncertainties affecting the banking industry on a global basis and the possible difficulties for corporate enterprises to access the credit markets, it is possible that the Company will bear a higher cost on its short, medium and long term lines of credit than was available previously. This could have adverse effects on the Company's net worth, financial position, and operating results and even its very existence.
The table below analyses the Group’s financial liabilities and net settled derivative financial liabilities into relevant maturity groupings based on the remaining period between the balance sheet date and the maturity date.
EUR Thousands Total Up to 1
year 2-5
years Over 5 years
Year 2016 Bank borrowings par value
78,063 39,927 35,839 2,297
Lease Liabilities
14,196 5,724 7,673 799
Bonds par value 1,299,521 -179 299,700 1,000,000 Amounts due for business acquisitions (not discounted)
236,042 46,666 174,476 14,900
Earnings due on hybrid capital
29,171 29,171 - -
Current and future interest due
1
237,089 68,363 123,682 45,044
Trade accounts payable
230,122 230,122 - -
Total 2,124,203 419,793 641,370 1,063,039 1 Including interests due on borrowings until their full repayment and derivative
financial instruments impact
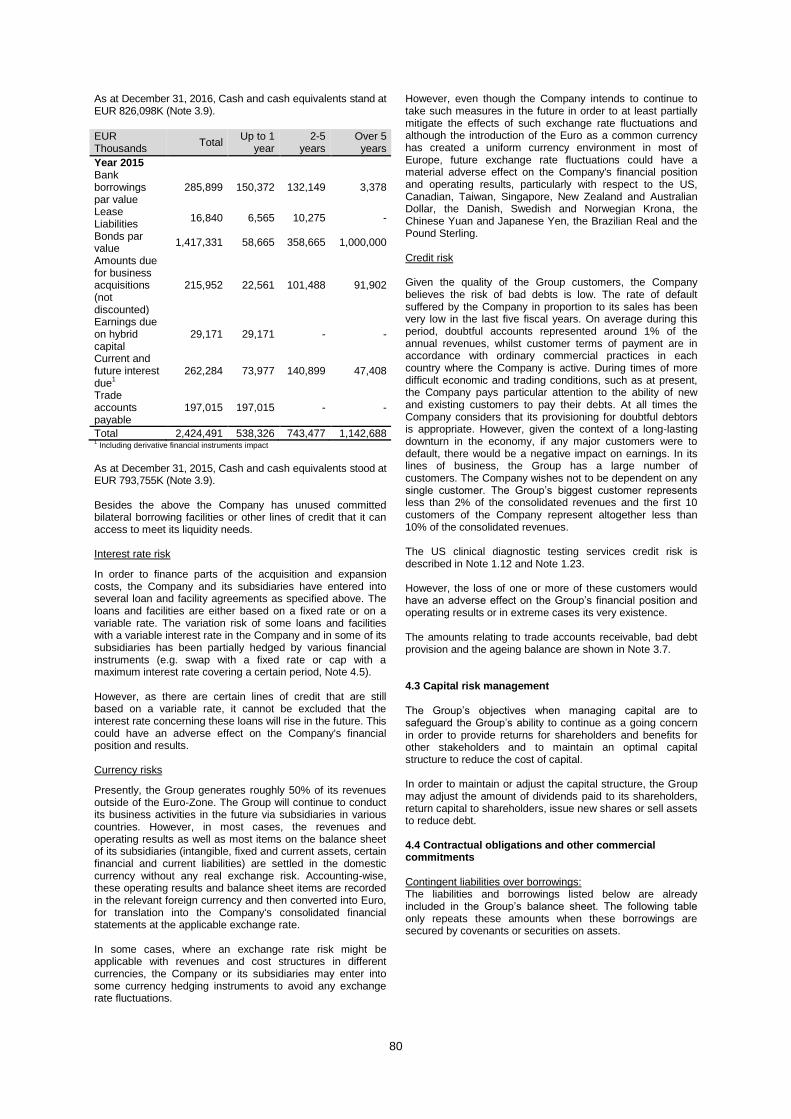
80
As at December 31, 2016, Cash and cash equivalents stand at EUR 826,098K (Note 3.9).
EUR Thousands
Total Up to 1
year 2-5
years Over 5 years
Year 2015 Bank borrowings par value
285,899 150,372 132,149 3,378
Lease Liabilities
16,840 6,565 10,275 -
Bonds par value
1,417,331 58,665 358,665 1,000,000
Amounts due for business acquisitions (not discounted)
215,952 22,561 101,488 91,902
Earnings due on hybrid capital
29,171 29,171 - -
Current and future interest due
1
262,284 73,977 140,899 47,408
Trade accounts payable
197,015 197,015 - -
Total 2,424,491 538,326 743,477 1,142,688 1 Including derivative financial instruments impact
As at December 31, 2015, Cash and cash equivalents stood at EUR 793,755K (Note 3.9). Besides the above the Company has unused committed bilateral borrowing facilities or other lines of credit that it can access to meet its liquidity needs.
Interest rate risk
In order to finance parts of the acquisition and expansion costs, the Company and its subsidiaries have entered into several loan and facility agreements as specified above. The loans and facilities are either based on a fixed rate or on a variable rate. The variation risk of some loans and facilities with a variable interest rate in the Company and in some of its subsidiaries has been partially hedged by various financial instruments (e.g. swap with a fixed rate or cap with a maximum interest rate covering a certain period, Note 4.5). However, as there are certain lines of credit that are still based on a variable rate, it cannot be excluded that the interest rate concerning these loans will rise in the future. This could have an adverse effect on the Company's financial position and results. Currency risks
Presently, the Group generates roughly 50% of its revenues outside of the Euro-Zone. The Group will continue to conduct its business activities in the future via subsidiaries in various countries. However, in most cases, the revenues and operating results as well as most items on the balance sheet of its subsidiaries (intangible, fixed and current assets, certain financial and current liabilities) are settled in the domestic currency without any real exchange risk. Accounting-wise, these operating results and balance sheet items are recorded in the relevant foreign currency and then converted into Euro, for translation into the Company's consolidated financial statements at the applicable exchange rate. In some cases, where an exchange rate risk might be applicable with revenues and cost structures in different currencies, the Company or its subsidiaries may enter into some currency hedging instruments to avoid any exchange rate fluctuations.
However, even though the Company intends to continue to take such measures in the future in order to at least partially mitigate the effects of such exchange rate fluctuations and although the introduction of the Euro as a common currency has created a uniform currency environment in most of Europe, future exchange rate fluctuations could have a material adverse effect on the Company's financial position and operating results, particularly with respect to the US, Canadian, Taiwan, Singapore, New Zealand and Australian Dollar, the Danish, Swedish and Norwegian Krona, the Chinese Yuan and Japanese Yen, the Brazilian Real and the Pound Sterling. Credit risk Given the quality of the Group customers, the Company believes the risk of bad debts is low. The rate of default suffered by the Company in proportion to its sales has been very low in the last five fiscal years. On average during this period, doubtful accounts represented around 1% of the annual revenues, whilst customer terms of payment are in accordance with ordinary commercial practices in each country where the Company is active. During times of more difficult economic and trading conditions, such as at present, the Company pays particular attention to the ability of new and existing customers to pay their debts. At all times the Company considers that its provisioning for doubtful debtors is appropriate. However, given the context of a long-lasting downturn in the economy, if any major customers were to default, there would be a negative impact on earnings. In its lines of business, the Group has a large number of customers. The Company wishes not to be dependent on any single customer. The Group’s biggest customer represents less than 2% of the consolidated revenues and the first 10 customers of the Company represent altogether less than 10% of the consolidated revenues. The US clinical diagnostic testing services credit risk is described in Note 1.12 and Note 1.23. However, the loss of one or more of these customers would have an adverse effect on the Group’s financial position and operating results or in extreme cases its very existence. The amounts relating to trade accounts receivable, bad debt provision and the ageing balance are shown in Note 3.7. 4.3 Capital risk management The Group’s objectives when managing capital are to safeguard the Group’s ability to continue as a going concern in order to provide returns for shareholders and benefits for other stakeholders and to maintain an optimal capital structure to reduce the cost of capital. In order to maintain or adjust the capital structure, the Group may adjust the amount of dividends paid to its shareholders, return capital to shareholders, issue new shares or sell assets to reduce debt. 4.4 Contractual obligations and other commercial commitments Contingent liabilities over borrowings: The liabilities and borrowings listed below are already included in the Group’s balance sheet. The following table only repeats these amounts when these borrowings are secured by covenants or securities on assets.

81
EUR Thousands 2016 2015
Bank borrowings secured over buildings and other assets
1
2,162 4,826
Leases secured over buildings and other assets
2
14,280 16,824
Bank borrowings secured by covenants & assets
8,198 6,560
Total borrowings and leases
secured 24,640 28,210
Bank borrowings & OBSAAR secured by covenants
24,100 335,233
Bank borrowings guaranteed by the direct parent of the borrower
2,210 4,355
Total 50,950 367,798 1 Furthermore, some of these bank borrowings are also secured by covenants.
2 Lease liabilities are effectively secured as the rights to the leased asset revert to
the lessor in the event of default.
The Group complies with the covenants of its relevant lines of credit as at December 31, 2016. The Group’s other contractual obligations and commercial commitments as of December 31, 2016 are as follows:
Other contractual obligations Total
Up to 1 year
2-5 years
Over 5 years
EUR Thousands
Total Operating leases
332,594 70,505 164,422 97,667
- Buildings1 317,287 63,448 156,181 97,658
- Equipments & cars 15,307 7,057 8,241 9
Irrevocable purchase obligations
- - - -
Total 332,594 70,505 164,422 97,667
1 Future aggregate minimum lease payments, non-cancellable (operating leases),
discounted.
The amounts of operating lease payments recognised as an expense during the period are the following:
EUR Thousands 2016 2015
Operating lease payments 77,035 60,200
Other commercial commitments EUR Thousands
Total Up to 1 year
2-5 years
Over 5 years
Guarantees given related to financing
15,728 - - 15,728
Guarantees given related to acquisitions
- - - -
Total 15,728 - - 15,728
Guarantees received - - - -
Total guarantees, net 15,728 - - 15,728
Detail of guarantees given related to financing
In the context of a grant of £1,922K provided by Advantage West Midlands, now managed directly by the Department for Business, Innovation and Skills (a British Government agency), the Company has guaranteed by a comfort letter to provide the company Eurofins Food Testing UK Limited with the resources required to allow it to fulfill its obligations and ensure the payment of all amounts due by Eurofins Food Testing UK Limited in execution of its commitments in relation to the grant offer. This guarantee has expired in 2016.
The Company has counter-guaranteed the Swedish insurance entity "Försäkringsbolaget Pensionsgaranti" for all amounts due that this entity should have to pay to the current and past employees of the Swedish companies, indirect subsidiaries of Eurofins Scientific S.E., for their pension obligation for a maximum amount of EUR 14,528K (this amount is accounted for in the caption “retirement benefit obligations” Note 3.15).
In the scope of a EUR 1,200K grant contract obtained in 2008 by Microchem Laboratories Ltd, the Company gave its guarantee to the Irish governmental agency which provided the grant that it will be liable in case of Microchem Laboratories Ltd failure to meet its commitments related to this grant.
Detail of guarantees given related to acquisitions None. Other commitments given To the Group’s knowledge, no other significant off-balance sheet commitments are in existence. The Group has not set up any factoring or securitization transactions with third parties. Detail of guarantees received None. 4.5 Exposure to market and counterparties risks EUR Thousands 2016 2015
Derivative financial assets 85,554 58,676 Derivative financial liabilities -1,659 -6,898
Total net 83,895 51,778
Exposure to interest rate risk In order to hedge the Group’s exposure to interest rate fluctuations particularly related to the 2010 OBSAAR bonds and part of the Schuldschein promissory note, the Group has concluded hedging contracts in order to swap its floating interest rate against a fixed rate. These contracts are either with immediate or deferred effect. Consequently, the Group has concluded interest rate hedging contracts with deferred effective dates for the period December 2016 to July 2018 for a total nominal amount comprised of EUR 60m declining to EUR 10m over time.
The previous year fair value of the financial instruments has been passed to the Income Statement for an amount of EUR 6,898K.
The fair value of the remaining swaps estimated as a liability of EUR 1,659K has been accounted for in the Income Statement, as the underlying debts were repaid in full in 2016 and the cash flow hedge was no longer efficient.
Interest Notional Fair value (in EUR Thousands) Rate
1 principal value Opening Change Closing
3.81% -50,000 -3,869 2,837 -1,032 3.68% -10,000 -3,029 2,402 -627
-60,000 -6,898 5,239 -1,659 1 interest rate applicable at the end of December 2016
The amount booked in equity is transferred to net profit as far as the underlying instrument impacts the net profit. The impact on the valuation of the financial instruments of a shift of +/- 1 percentage point in the yield curve would be close to + or - EUR 0.3m on the Group’s total equity.

82
The Group’s net exposure to interest rate risk for the borrowings as per balance sheet date, taking into account the above hedging transactions is presented below: 2016 2015
Borrowings at fixed interest rates 95% 93% Borrowings at floating interest rates 5% 7%
Given the breakdown between fixed rate and floating rate assets and liabilities as at December 31, 2016, a 1% increase or decrease in interest rates would have a full-year impact of +/- EUR 714K on results before income taxes.
EUR Thousands
Rate Up to 1 year
2-5 years
Over 5 years
Total
Assets Fixed - - - -
(Note 3.9) Floating -506.0 - - -506.0
Loans Fixed 8.0 3.4 0.8 12.2
Floating 35.1 34.7 1.5 71.2
Euro Bond Fixed - 300.0 1,000.0 1,300.0
Floating - - - -
Net exposure Fixed 8.0 303.4 1,000.8 1,312.2
before hedge Floating -471.0 34.7 1.5 -434.8
Hedge Fixed 50 10 - 60
Floating -50 -10 - -60
Net exposure Fixed 58.0 313.4 1,000.8 1,372.2
after hedge Floating -521.0 24.7 1.5 -494.8
Exposure to other market risks The Group uses non-complex or complex derivative instruments in order to hedge its potential exposure to changes in market values of certain underlying assets that may arise in the future. The assets correspond to listed equity derivatives. The fair value of these assets amounts to EUR 85.6m as of December 31, 2016 vs EUR 58.7m as of December 31, 2015. A 10% increase or decrease of the above-mentioned derivative instrument would have a full-year impact of +/- EUR 8.6 million on results before income taxes. Exposure to currency risk The most significant currencies for the Group were translated at the following exchange rates into Euro.
Value of EUR 1
Balance Sheet Income
Statement
End of period rates average rates
Dec. 31, 2016
Dec. 31, 2015
2016 2015
US dollar 1.05 1.10 1.11 1.11 Pound sterling 0.86 0.73 0.82 0.73 Swedish krona 9.52 9.17 9.43 9.35 Norwegian krone 9.09 9.52 9.26 8.93 Danish krone 7.43 7.46 7.45 7.46 Japanese yen 123.46 131.58 120.48 135.14 Australian dollar 1.46 1.49 1.49 1.47 Brazilian Real 3.42 4.31 3.86 3.61
As at December 31, 2016, the exposure to currency risk breaks down as follows (amounts in EUR Thousands):
Currency Assets Liabilities
Off-balance sheet
Commit -ments
Net position
before hedge Hedge
Net position
after hedge
DKK 98,803 83,698 - 15,105 - 15,105
SEK 79,633 67,257 14,528 -2,152 - -2,152
NOK 34,937 27,165 - 7,773 - 7,773
USD 1,241,852 769,958 - 471,893 - 471,893
GBP 91,854 59,515 - 32,339 - 32,339
BRL 49,239 36,825 - 12,414 - 12,414
Other1 282,592 119,482 - 163,109 - 163,109
Total 1,878,909 1,163,900 14,528 700,481 - 700,481 1 non Euro
A 1 percentage point increase or decrease in exchange rates would have an impact of EUR 7.0m on the Group’s equity and an impact on the Group’s EBITAS of EUR 1.6m. Following the Brexit vote in the UK, the volatility of GBP against EUR had a negative impact on the Group consolidated revenues of EUR 8.6m and a positive impact on the Group consolidated EBITAS of EUR 0.1m in 2016 versus 2015. Net investment hedge The Company has designated instruments to hedge net investments in foreign operations. An entity may have a monetary item that is receivable from or payable to a foreign operation. An item for which settlement is neither planned nor likely to occur in the foreseeable future is, in substance, a part of the entity's net investment in that foreign operation. Such monetary items may include long-term receivables or loans. They correspond to Intercompany loans denominated in Euros and in US Dollars provided by Eurofins GSC Finance NV/SA (lender) to other companies of the Group (borrowers) trading in currencies other than Euro. The nature of the risk hedged is the change in foreign exchange rates between the currency of the loan and the currency of either the lender or the borrower.
Currency of loan Currency of lender or borrower
2016 2015
USD EUR 472,025 416,520
CAD EUR 14,827 8,968
NOK EUR 5,290 3,435
SEK EUR 3,271 1,411
DKK EUR 3,686 1,237
GBP EUR 1,294 -
EUR USD 6,742 6,578
EUR DKK 41,386 41,795
EUR SEK 24,977 24,596
EUR GBP 33,557 30,498
EUR NOK 11,240 11,561
EUR BRL 24,330 17,389
EUR AUD 6,404 3,023
EUR NZD 1,165 1,309
EUR CNY 4,205 6,349
EUR PLN 2,716 1,095
EUR CCH 85 166
EUR BGN 100 -
Total 657,300 575,930

83
The net investment in hedged foreign operations is worth EUR 657.3m (fully eliminated in consolidation). The fair value of hedging represents a positive value of EUR 47.8m at the end of 2016 included in “Currency translation differences” in equity. Credit quality of financial assets The Group may be exposed to the risk of losses on cash and other financial instruments held or managed on its behalf by financial institutions, if any of its counterparties defaults on its obligations. Group policy is to limit its exposure by dealing solely with leading counterparties and monitoring their credit ratings, in line with guidelines approved by the Company. However, credit risks arising from transactions with financial counterparties can escalate rapidly and a high credit rating is no guarantee that an institution will not experience a rapid deterioration of its financial position. As a result, there is no guarantee that this policy will be effective in entirely eliminating counterparty risk. Any default by a counterparty could have a material adverse effect on the Group’s objectives, operating income and financial position. To limit the Group’s exposure to credit risk, the Treasury and Financing Department has defined the following rules for treasury investments: One single counterparty should represent no more than
25% of total invested amount; a counterparty is defined as a financial institution including all its subsidiaries and affiliates.
Counterparties should have a short-term rating of A1/P1F1 or above from Standard & Poor’s / Moody’s / Fitch respectively.
In order to mitigate sovereign risk, invested amounts should be spread into at least 3 countries of solid reputation, mostly in the Euro zone.. One country should not account for more than 40% of the total invested amount.
In order to ensure optimal liquidity, most treasury investments should have daily liquidity. However, short notice periods (max 32 days) are acceptable for limited amounts.
The credit quality of financial assets that are neither past due nor impaired can be assessed by reference to external credit ratings. The cash and marketable securities are allocated within the cash generating units as follows:
Cash & cash equivalents per CGU EUR Thousands
2016 in % 2015 in %
Benelux 1 500,610 61% 193,371 24%
France 1 157,757 19% 453,885 57%
Germany 33,833 4% 32,691 4%
USA 428 0% 995 0%
Scandinavia 17,313 2% 18,514 2%
British Isles 11,437 1% 7,263 1%
Other Countries 104,718 13% 87,037 11%
TOTAL 826,098 100% 793,755 100% 1 includes the Group’s parent company in Luxembourg and its French branch
It should be noted that the breakdown of cash and marketable securities shown in the table above reflects the geographic distribution among cash generating units and not by counterparty. Short term deposits with banks (EUR 506.019K) are invested for more than 95% with banks in France, Germany, Switzerland and Luxembourg.
The maximum credit risk to which the Group is theoretically exposed to as at December 31, 2016 is the carrying amount of financial assets.

84
4.6 Financial instruments by category The carrying and fair values of the financial assets and financial liabilities are as follows:
Financial assets classification
EUR Thousands Carrying
value Loans and
Receivables
Assets at fair value
through profit and
loss
Derivatives used for hedging
Available for sale
Fair value
Assets
Year 2016
Available for sale financial assets (Note 3.5)
4,730 - - - 4,730 4,730
Financial assets trade and other receivables – non current (Note 3.5)
29,424 29,424 29,424
Trade and other receivables excluding prepayments - current (Note 3.7, 3.8)
567,088 567,088 567,088
Financial assets at fair value through profit and loss
- -
Derivative financial instruments (Note 4.5)
85,554 85,554 85,554
Short term deposits with banks (Note 3.9)
506,019 506,019 506,019
Cash and cash equivalents (Note 3.9) 320,079 320,079 - 320,079
1,512,894 916,591 591,573 - 4,730 1,512,894
Financial liabilities classification
EUR Thousands Carrying
Value
Liabilities at fair value
through profit and
loss
Derivatives used for hedging
Other financial
liabilities at amortised
cost
Fair Value
Liabilities
Year 2016
Borrowings (Note 3.10) 1,383,878 - - 1,383,878 1,419,778
Interest and earnings due on hybrid capital (Note 3.11)
58,190 - - 58,190 58,190
Amounts due for business acquisitions (Note 3.14)
224,111 - - 224,111 224,111
Derivative financial instruments (Note 4.5)
1,659 1,659 - - 1,659
Trade accounts payable, other current liabilities and advance payments received and deferred revenues
525,134 - - 525,134 525,134
2,192,972 1,659 - 2,191,313 2,228,872
The Group classifies fair value measurements using a fair value hierarchy that reflects the significance of the inputs used in making the measurements. The fair value hierarchy has the following levels: Quoted prices (unadjusted) in active markets for identical assets or liabilities (Level 1 - Marketable securities, Derivative
financial instruments assets or Eurobonds); Inputs other than quoted prices included within Level 1 that are observable for the asset or the liability, either directly (i.e.
such as prices) or indirectly (i.e. derived from prices) (Level 2 - Derivative financial instruments liabilities); Inputs for the asset or liability that are not based on observable market data (Level 3). There were no transfers between levels. With the exception of the non-current fixed-rate borrowings, the Group considers the carrying value of the financial instruments to approximate their fair value. Regarding borrowings, their fair value is based on:
A quoted price included in Level 1 of the fair value hierarchy for the Eurobond November 2013 (fair value amount of EUR 315m against a carrying value of EUR 300m)
A quoted price included in Level 1 of the fair value hierarchy for the Eurobond January 2015 (fair value amount of EUR 517.5m against a carrying value of EUR 500m)
A quoted price included in Level 1 of the fair value hierarchy for the Eurobond July 2015 (fair value amount of EUR 503.9m against a carrying value of EUR 500m)

85
The fair value of current borrowings (including overdraft) equals to their carrying amount, as the impact of discounting is not significant.
Financial assets classification
EUR Thousands Carrying
value Loans and
Receivables
Assets at fair value through
profit and loss
Derivatives used for hedging
Available for sale
Fair value
Assets
Year 2015
Available for sale financial assets (Note 3.5)
4,713 - - - 4,713 4,713
Financial assets trade and other receivables – non current (Note 3.5)
27,361 27,361 - - - 27,361
Trade and other receivables excluding prepayments - current (Note 3.7, 3.8)
482,897 482,897 - - - 482,897
Financial assets at fair value through profit and loss
- - - - - -
Derivative financial instruments (Note 4.5)
58,676 - 58,676 - - 58,676
Short term deposits with banks (Note 3.9)
591,101 - 591,101 - - 591,101
Cash and cash equivalents (Note 3.9) 202,655 202,655 - - - 202,655
1,367,402 712,913 649,777 - 4,713 1,367,402
Financial liabilities classification
EUR Thousands Carrying
Value
Liabilities at fair value
through profit and loss
Derivatives used for hedging
Other financial
liabilities at amortised
cost
Fair value
Liabilities
Year 2015
Borrowings (Note 3.10) 1,710,033 - - - 1,710,033 1,698,084
Interest and earnings due on hybrid capital (Note 3.11)
51,720 - - - 51,720 51,720
Amounts due for business acquisitions (Note 3.14)
215,952 - - - 215,952 215,952
Derivative financial instruments (Note 4.5)
6,898 - - 6,898 - 6,898
Trade accounts payable, other current liabilities and advance payments received and deferred revenues
453,983 - - - 453,983 453,983
2,438,586 - - 6,898 2,431,688 2,426,637

86
4.7 Potentially dilutive instruments Stock option plans Stock options are granted to directors and to employees. Movements in the number of share options outstanding are as follows: Share options 2016 2015
At beginning of the year 794,682 937,200 Options granted
1 216,660 95,250
Options exercised -129,801 -177,018 Options expired or lost -45,665 -60,750
At end of the year 835,876 794,682 1 Under conditions (strike price, date of exercise, etc.) of new option plans
(Note 2.4).
As at December 31, 2016, 835,876 stock options awarded are still outstanding. Further details can be found in the “Management Report”. Free shares In accordance with article 8bis of the Company’s articles of association (“capital autorisé”), the Board of Directors decided during meetings held on July 29, 2016 and on August 1
st, 2016, to grant up to 10,481 capital-providing
securities in the form of free shares, conferring the beneficiaries the right to subscribe for one share of the Company subject to the rules of the free share plan as defined by the Board of Directors on July 29, 2016. BSAAR warrants (Notes 1.18 and 3.10) The BSAAR warrants have been mainly acquired by the managers of the Group. Movements in the number of shares to be possibly issued upon exercise of BSAAR warrants are as follows:
In potential new shares 2016 2015
At beginning of the period 8,292 16,586 BSAAR granted - - BSAAR exercised -349 -8,294 BSAAR forfeited - -
At end of the period 7,943 8,292
2014 BSA Leaders Warrants Upon decision and authorization granted by the Board of Directors of June 19, 2014, the Managing Director of the Company following a decision dated July 1, 2014 decided to issue up to 117,820 capital-providing securities in the form of stock purchase warrants, conferring 2014 BSA Leaders Warrants’ holders the right to subscribe for one share of the Company for each 2014 BSA Leaders Warrant at a fixed exercise price of EUR 281.58. The subscription price was set at EUR 18.15 per 2014 BSA Leaders Warrant. 2014 BSA Leaders Warrant holders will have the option to exercise their 2014 BSA Leaders Warrants at any time starting 4 years from the date of subscription ie between July 1
st, 2018 and June
30, 2022 inclusive. Partial and optional acquisition price payments in Eurofins shares At December 31, 2016, the overall number of Eurofins shares potentially deliverable is 0 share. Class A beneficiary units Class A beneficiary units, which confer no right to dividends but a right to one vote, are allocated to holders of fully paid-up shares for which proof is provided of registration in the name of the same shareholder for at least three consecutive years as provided for in article 12bis of the Company’s Articles of Association. The number of Class A beneficiary units have decreased from
6,533,527 as of December 31, 2015 to 6,532,840 as of December 31, 2016. Class B beneficiary units Class B beneficiary units, which confer no right to dividends but a right to one vote, are allocated to holders of fully paid-up shares for which (i) proof is provided of registration in the name of the same shareholder for at least five consecutive years as provided for in article 12ter of the Company’s Articles of Association (ii) request to subscribe class B beneficiary units is sent in writing by the relevant shareholder to the Company at the latest by June 30, 2021 and (iii) subject to the Company receiving payment of a subscription price of EUR 0.10 per class B beneficiary unit. In June 2016, Analytical Bioventures SCA exercised its right to receive 1,000,000 Class B beneficiary units on the equivalent number of shares out of its 6,400,000 shares registered in a registered account for five consecutive years in the name of the Company’s shareholder Analytical Bioventures SCA for a cash contribution of EUR 100k equivalent to EUR 0.10 (ten euro cents) per beneficiary unit. The number of Class B beneficiary units amounts to 1,000,000 as of December 31, 2016. Voting rights Voting rights attached to shares are proportional to the capital quota they represent. Each share gives the right to one vote. However as mentioned above, class A and class B beneficiary units (“part bénéficiaire de catégorie A” and “part bénéficiaire de catégorie B”) carrying an extra voting right each can be allotted to all fully paid-up shares fulfilling conditions as specified in the last two paragraphs. As at December 31, 2016, a total amount of 6,532,840 class A and 1,000,000 class B beneficiary units has been issued and the total potential number of voting rights amounts to 24,458,810. Own shares As at December 31, 2016, the Company does not own any of its shares (same as of December 31, 2015). Detail of the weighted average number of shares outstanding (diluted) In Thousands 2016 2015
Weighted average number of shares outstanding (basic)
15,990 15,291
Weighted average number of stock options
837 844
Weighted average number of free shares
4 -
Weighted potential number of shares by BSAAR exercise
8 13
Weighted potential number of shares by 2014 BSA Leaders Warrants exercise
118 118
Weighted average number of shares outstanding (diluted)
16,957 16,266

87
4.8 Earnings per share Net
Profit of the period (in
EUR Thousands)
Weighted average
number of shares
outstanding
Earnings per
share (in EUR)
Basic Total 173,997 15,990 10.88 Hybrid capital investors
1
35,625 - 2.23
Equity holders 138,372 15,990 8.65 Diluted Total 173,997 16,957 10.26 Hybrid capital investors
1
35,625 - 2.10
Equity holders 138,372 16,957 8.16 1
See Note 3.12
4.9 Contingencies The Group has contingent liabilities in respect of legal claims arising in the ordinary course of business in connection with the services they provide. The majority of these claims are covered by business-specific insurance. Specifically, the Group contests significant liability demands in the United States, which it considered unjustified. The Group’s responsibility has not been proven and the damages that are claimed have been neither established nor measured. Risk factors are described in the section 6 of the Management report. Based on the information available to date, the Group considers that the outcome of these disputes and legal claims currently in process is unlikely to have a significant adverse impact on the consolidated financial statements other than those provided for (Note 3.16). 4.10 Related-party transactions Transactions between the Company and its subsidiaries, which are related parties of the Group, have been eliminated in the consolidation process and are not disclosed in the notes. The company Analytical Bioventures SCA, which is controlled by the Martin family, owns 37.8% of the Company’s shares and 56.4% of its voting rights as of December 31, 2016. Transactions with affiliates or with companies owning shares in Eurofins Group such as Analytical Bioventures SCA or with companies in which some members of the Company’s Board of Directors or top management have significant influence such as “International Assets Finance S.à.r.l.” are detailed as follows:
EUR Millions 2016 2015
Support management services provided to the related party
0.4 0.3
Support management services provided to Eurofins
- -
Receivables from related party 12.9 12.0
Payables to related party 0.2 1.7
Rent paid to related party 19.8 17.7
Following reporting & controlling procedures implementation in 2016 for the related party transactions
between Analytical Bioventures SCA and Eurofins Group, the 2015 figures have been restated. In 2016, new leases have been paid in Ireland and the USA to new property companies owned directly or indirectly by Analytical Bioventures SCA, the holding company of the Martin family, representing an amount of EUR 0.2m. The aggregate discounted amount of future minimum, non-cancellable (operating leases), lease commitments payable to related-parties represent an amount of EUR 201m as at December 31, 2016 (EUR 154m in 2015). Receivables relate to lease deposits. Compensation of the Board of Directors: EUR Thousands 2016 2015
Director fees and other short-term fringe benefits
1,602 1,405
Post-employment benefits - - Share-based payments - -
Total 1,602 1,405
4.11 Auditor’s remuneration EUR Thousands 2016 2015
Audit of these financial statements 220 205 Amounts receivable by the auditors and their associates in respect of:
Audit of financial statements of subsidiaries pursuant to legislation
1,286 864
Other services pursuant to such legislation
95 118
Total fees payable pursuant to legislation
1,601 1,187
Taxation services 37 4 Transaction advisory - - Other - -
Total 1,638 1,191
The Group has external auditors other than PricewaterhouseCoopers in some countries. Their fees are not included in the above table. 4.12 Post-closing events Change of scope: Since the beginning of 2017, Eurofins completed the acquisition of one small clinical diagnostic testing laboratory in Ireland, one small German environmental testing laboratory and a pharma product testing laboratory in France.

88
5. Scope of the Group 5.1 Change in the scope 2016
The Companies below are fully consolidated (at 100%).
Company Country ISO Code
Subsidiary of :
% of interest
by the Group
Date of entry
Eurofins NUA AT Holding GmbH AT Eurofins Environment Testing AT Holding GmbH
100 01/16
1
Wiener Neudorf Palmersstraße Real Estate GmbH
AT Eurofins Real Estate LUX Holding SARL 100 12/16
1
Eurofins SCEC Pty Ltd AU Eurofins Agrosciences Services LUX Holding SARL
100 01/16
Eurofins ams Laboratories Pty Ltd. AU Eurofins Food and Environment Testing Australia New Zealand Holding Ltd.
100 03/16
Eurofins Food and Environment Testing Australia New Zealand Holding Ltd.
AU Eurofins Environment Testing France Australia Holding SAS
100 05/16
1
Eurofins Food Testing Australia Pty Ltd. AU Eurofins Food and Environment Testing
Australia New Zealand Holding Ltd. 100
07/16 1
Eurofins GSC Finance & Administration NV BE Eurofins Support Services LUX Holding SARL
100 09/16
1
Eurofins HOS Testing Bulgaria EOOD BG Eurofins Food Testing LUX Holding SARL 100 09/16 1
Laboratorio Sao Lucas Ltda. BR Integrated Petroleum Expertise Company - Serviços em Petroleo Ltda.
100 12/16
Eurofins Environment Testing Canada, Inc. CA Eurofins Environment Testing LUX Holding SARL
100 12/16
Quebec St. Bruno Real Estate, Inc. CA Eurofins Real Estate LUX Holding SARL 100 12/16 1
Eurofins Food Testing Service (Dalian) Co., Ltd. CN Eurofins Food Testing LUX Holding SARL 100 06/16 1
Eurofins Technology Service (Qingdao) Co., Ltd.
CN Eurofins Food Testing LUX Holding SARL 100 06/16
1
Eurofins Food Certification Service (Shanghai) Co., Ltd
CN Eurofins Food Testing LUX Holding SARL 100 06/16
1
St. Marien Krankenhaus Lampertheim GmbH DE Eurofins Clinical Testing Holding LUX SARL
100 08/16
Eurofins Air Monitoring Germany Holding GmbH DE Eurofins Air Monitoring LUX Holding SARL 100 07/16 1
Eurofins Finance Transactions Germany GmbH DE Eurofins Support Services LUX Holding SARL
100 10/16
1
Eurofins 4. Verwaltungsgesellschaft mbH DE Eurofins Food Testing Hamburg Germany Holding GmbH
100 04/16
1
GenoSkan A/S DK Eurofins Genomics Holding Denmark A/S 100 09/16
Eurofins NSC Spain SL ES Eurofins Support Services LUX Holding SARL
100 01/16
1
Eurofins NDSC Food Testing Spain SL ES Eurofins Analisis Alimentario Holding Espana SL
100 04/16
1
Eurofins Product Testing Holding Spain SL ES Eurofins Product Testing LUX Holding SARL
100 04/16
1
Megalab SA ES Eurofins Clinical Testing Holding LUX SARL
100 09/16
Alfalab Internacional, SL ES Megalab SA 100 09/16
Cifuentes Fisioclinic, SL ES Megalab SA 100 09/16
Laboratorio Ángel Mendez, SL ES Megalab SA 100 09/16
Laboratorio Calbo, SL ES Megalab SA 100 09/16
Laboratorio Bernad-Munoz, SL ES Megalab SA 100 09/16
Carlos Bosch Millares, SL ES Megalab SA 100 09/16
Laboratorio Clinico Sanitario, SL ES Megalab SA 100 09/16
DRA. Vicente, SL ES Megalab SA 100 09/16
Laboratorios Doctores Cermeno, SL ES Megalab SA 100 09/16
Laboratorios Garcia Lopez, S.L ES Megalab SA 100 09/16

89
Company Country ISO Code
Subsidiary of :
% of interest
by the Group
Date of entry
Laboratorio Pilar Larraz, SL ES Megalab SA 99 09/16
Laboratorios Recio, SL ES Megalab SA 100 09/16
Laboratorios Surlab, SL ES Megalab SA 100 09/16
Megalab Medio Ambiente, SL ES Megalab SA 70 09/16
Laboratorios de Analisis DR. Valenzuela, SL ES Megalab SA 100 09/16
Lab. San Andres, SL ES Laboratorios de Analisis DR. Valenzuela, S.L.
100 09/16
Laboratorio Sanchez Castineiras, SL ES Laboratorios de Analisis DR. Valenzuela, S.L.
100 09/16
Biotech-Germande SAS FR Eurofins Hydrologie France Holding SAS 100 01/16
AgroAnalyses SAS FR Eurofins Hygiène Alimentaire France Holding SAS
100 05/16
LCDI SAS FR Eurofins Hydrologie France Holding SAS 100 07/16
SCI Lentilly Aqueduc FR Eurofins Real Estate LUX Holding SARL 100 11/16 1
Eurofins Elelmiszer Analizis Magyarorszàg Kft HU Eurofins Food Testing LUX Holding SARL 100 08/16 1
Eurofins Professional Scientific Services Ireland Ltd
IE Eurofins Pharma Ireland Holding Limited 100 07/16
1
Eurofins Product Testing India Pvt Ltd IN Eurofins Product Testing LUX Holding SARL
100 10/16
1
Tecna Srl IT Eurofins Technology and Supplies LUX Holding SARL
100 05/16
Eurofins Professional Scientific Services Italy Srl
IT Eurofins Pharma Services Italia Holding Srl
100 12/16
1
Eurofins NDSC Food and Environment Testing Japan KK
JP Eurofins Nihon Kankyo KK 100 04/16
1
EAC Corporation Ltd. JP Eurofins Environment Testing LUX Holding SARL
100 05/16
Eurofins Air Monitoring LUX Holding SARL LU Eurofins Environment Testing LUX Holding SARL
100 02/16
1
Eurofins Support Services LUX Holding SARL LU Eurofins International Holdings LUX SARL 100 04/16 1
Eurofins Technology and Supplies LUX Holding SARL
LU Eurofins International Holdings LUX SARL 100 05/16
1
Sinensis Life Sciences BV NL Eurofins Pharma Services LUX Holding SARL
100 01/16
Bactimm BV NL Sinensis Life Sciences BV 100 01/16
Prolepha Labs BV NL Sinensis Life Sciences BV 100 01/16
PROXY Laboratories BV NL Sinensis Life Sciences BV 100 01/16
Spinnovation Holding BV NL Sinensis Life Sciences BV 60 01/16
Spinnovation Analytical BV NL Spinnovation Holding BV 60 01/16
Den Haan Research Laboratory For Soil, Water and Vegetation BV
NL Eurofins Agro Testing Benelux Holding BV 100 04/16
Bureau de Wit B.V. NL Eurofins Food Testing Netherlands Holding BV
100 06/16
Barneveld Gildeweg Real Estate BV NL Eurofins Real Estate LUX Holding SARL 100 08/16 1
Eurofins Bay Of Plenty Limited NZ Eurofins Food and Environment Testing
Australia New Zealand Holding Ltd. 100
06/16
Eurofins GSC Poland Sp. z.o.o. PL Eurofins Support Services LUX Holding SARL
100 02/16
1
Eurofins Digital Testing Polska Sp. z.o.o. PL Eurofins Digital Testing Belgium Holding NV
88 06/16
1
Eurofins Environment Services Polska Sp z o. o.
PL Eurofins Environment Testing LUX Holding SARL
100 12/16
1
Eurofins Food Testing S.R.L. RO Eurofins Food Testing LUX Holding SARL 100 11/16 1
Eurofins NSC South Eastern Europe SRL RO Eurofins Support Services LUX Holding SARL
100 11/16
1
Eurofins Digital Testing Sweden AB SE Eurofins Product Testing LUX Holding SARL
100 07/16

90
Company Country ISO Code
Subsidiary of :
% of interest
by the Group
Date of entry
Eurofins Radon Testing Sweden AB SE Eurofins Environment Testing Sweden Holding AB
100 09/16
Nové Zámky Komjatická Real Estate s.r.o. SK Eurofins Real Estate LUX Holding SARL 100 10/16 1
Eurofins Agroscience Services Thailand Co. Ltd.
TH Eurofins Agrosciences Services LUX Holding SARL
100 05/16
1
Pharmacology Discovery Services Taiwan, Ltd. TW Eurofins Discovery Services LUX Holding SARL
100 08/16
1
Eurofins Panlabs Discovery Services Taiwan, Ltd.
TW Eurofins Discovery Services LUX Holding SARL
100 08/16
1
Eurofins Agro Testing UK Limited UK Eurofins Food Testing UK Holding Limited 100 03/16 1
Eurofins UK 2016 Limited UK Eurofins Food Testing LUX Holding SARL 100 07/16
NDSM Limited UK Eurofins Agroscience Services UK Holding Limited
100 07/16
Eurofins Agroscience Services UK Holding Limited
UK Eurofins Agrosciences Services LUX Holding SARL
100 07/16
1
Livingston Cochrane Square Real Estate Limited
UK Eurofins Real Estate LUX Holding SARL 100 08/16
1
ILS Limited UK Eurofins Food Testing UK Holding Limited 100 10/16
Eurofins Food Safety Solutions Limited UK Eurofins Food Testing UK Holding Limited 100 11/16 1
Pomona 900 Corporate Drive Real Estate, Inc. US Eurofins Real Estate LUX Holding SARL 100 01/16 1
Eurofins NTD, Inc. US Eurofins Genomic Clinical Diagnostics US Holdings, Inc.
100 04/16
Advantar Laboratories, Inc. US Eurofins Pharma US Holdings II Inc. 100 04/16
Eurofins BDI-CO, LLC US Eurofins Food Testing US Holdings Inc. 100 04/16 1
North Kingstown (R.I.) Camp Avenue Real Estate, Inc.
US Eurofins Real Estate LUX Holding SARL 100 05/16
1
Eurofins VRL, Inc. US Eurofins Pharma US Holdings II Inc. 100 09/16
DeSoto Falcon Drive Real Estate, Inc. US Eurofins Real Estate LUX Holding SARL 100 09/16 1
Lafayette Horizon Avenue Real Estate, Inc. US Eurofins Real Estate LUX Holding SARL 100 09/16 1
Eurofins Clinical Diagnostic US NDSC, Inc. US Eurofins Pharma US Holdings II Inc. 100 09/16 1
Eurofins VRL Los Angeles, LLC US Eurofins Pharma US Holdings II Inc. 100 11/16 1
Agawam Silver Street Real Estate, Inc. US Eurofins Real Estate LUX Holding SARL 100 11/16 1
New Berlin 170th Street Real Estate, Inc. US Eurofins Real Estate LUX Holding SARL 100 11/16 1
1 New Companies incorporated during the period.
The below companies have been merged/liquidated during the period:
Company Country ISO Code
% of interest by the Group
Date of exit
Eurofins Norlab AS NO 100 02/16
Eurofins STA Laboratories Inc. US 100 04/16
Water Utility Testing Services Limited UK 100 04/16
IPL Atlantique SA FR 100 06/16
Biorade SELAS (acquired in June 2016) FR 100 10/16
Eurofins Food Testing Canada Holdings Inc. US 100 12/16
Eurofins ALTIC BV NL 100 12/16
CropWorx BV NL 100 12/16
CropForce BV NL 100 12/16
Holding CFW BV NL 100 12/16
Eurofins Genomic Clinical Diagnostics US Holdings, Inc. US 100 12/16

91
The below companies have been sold during the period:
Company Country ISO Code
% of interest by the Group
Date of exit
O.C.B. NV BE 100 05/16
Eurofins Consulting Srl IT 100 08/16
Eurofins Portugal Ltda PT 100 10/16

92
5.2 Principal subsidiary undertakings The Companies below are fully consolidated (at 100%). The % of voting rights is identical to the % of ownership in the Group’s Subsidiaries.
Company Country ISO Code
Subsidiary of :
% of interest by the Group
Date of entry
Eurofins Scientific S.E. LU
Eurofins Lebensmittelanalytik Österreich GmbH AT Eurofins Food Testing LUX Holding SARL 100 01/07
Eurofins Genomics AT AT Eurofins Genomics LUX Holding SARL 100 09/11
Eurofins Agroscience Services Austria GmbH AT Eurofins Agrosciences Services LUX Holding SARL
100 12/12
Eurofins Environment Testing AT Holding GmbH
AT Eurofins Environment Testing LUX Holding SARL
100 03/15
NUA-Umweltanalytik GmbH & Co KG AT Eurofins Environment Testing AT Holding GmbH
100 03/15
Water & Waste Gesellschaft fur Umweltschutz und chemische Laboratorien GmbH
AT Eurofins Environment Testing AT Holding GmbH
100 12/15
Eurofins Environment Testing Australia Pty Ltd. AU Eurofins Food Testing LUX Holding SARL 91 01/13
Eurofins Agroscience Services Pty Ltd. AU Eurofins Agrosciences Services LUX Holding SARL
81 07/13
Eurofins Agroscience Testing Pty Ltd. AU Eurofins Agroscience Services Pty Ltd. 81 07/13
Eurofins GSC Management Services NV BE Eurofins Support Services LUX Holding SARL
100 06/01
Eurofins GSC Finance NV BE Eurofins Scientific S.E. 100 07/06
Eurofins Belgium NV BE Eurofins Environment Testing Belgium Holding NV
100 11/07
Eurofins Food Testing Belgium NV BE Eurofins Food Testing LUX Holding SARL 100 10/10
Eurofins Environment Testing Belgium Holding NV
BE Eurofins Environment Testing LUX Holding SARL
100 09/11
Eurofins Environment Testing Belgium NV BE Eurofins Environment Testing Belgium Holding NV
100 09/11
Eurofins Forensics Belgium BVBA BE Eurofins Forensics LUX Holding SARL 100 10/11
Eurofins Pharmaceutical Product Testing Belgium NV
BE Eurofins Pharma Services LUX Holding SARL
100 11/11
Envirocontrol NV BE Eurofins Environment Testing Belgium Holding NV
100 03/12
Eurofins Agro Testing Belgium NV BE Holding BLGG BV 100 07/13
Eurofins Professional Scientific Services Belgium NV
BE Eurofins Pharma Services LUX Holding SARL
100 06/14
Eurofins GSC Belgium SA BE Eurofins International Holdings LUX SARL 100 07/14
Eurofins Digital Testing Belgium Holding NV BE Eurofins Product Testing LUX Holding SARL
88 04/15
Eurofins Digital Testing Belgium NV BE Eurofins Digital Testing Belgium Holding NV
88 04/15
Eurofins Agrosciences Services EOOD BG Eurofins Agrosciences Services LUX Holding SARL
100 11/08
Eurofins do Brasil Análises de Alimentos Ltda. BR Eurofins Latin American Ventures SL 100 07/03
Innolab do Brasil Ltda. BR Eurofins Latin American Ventures SL 100 07/09
Eurofins Agrosciences Services Ltda. BR Eurofins Latin American Ventures SL 100 06/12
Laboratório ALAC Ltda. BR Eurofins Latin American Ventures SL 100 04/12
Analytical Technology Serviços Analíticos e Ambientais Ltda.
BR Innolab do Brasil Ltda. 100 07/14
Integrated Petroleum Expertise Company - Serviços em Petroleo Ltda.
BR Innolab do Brasil Ltda. 100 09/14
Scientia Laboratorios Ltda. BR Eurofins EVIC Product Testing France SAS 100 07/15
Eurofins Experchem Laboratories, Inc. CA Eurofins Food Testing LUX Holding SARL 100 04/15
Eurofins Scientific AG CH Eurofins Food Testing LUX Holding SARL 100 07/00
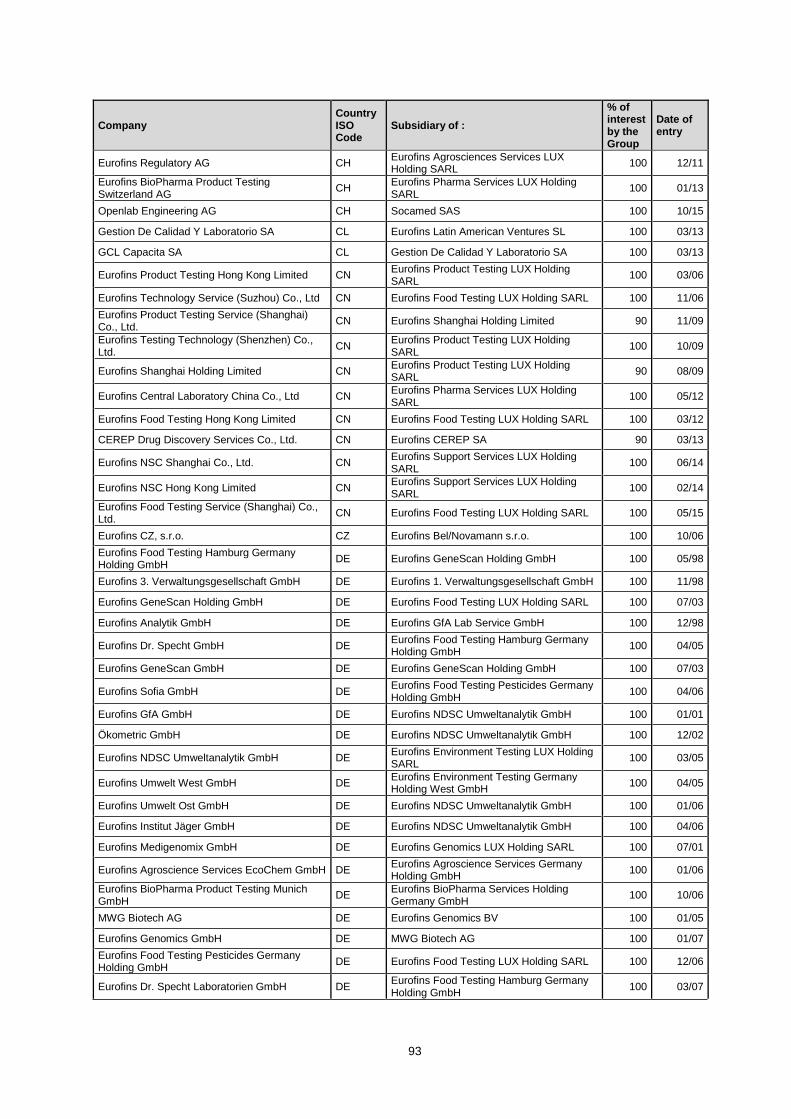
93
Company Country ISO Code
Subsidiary of :
% of interest by the Group
Date of entry
Eurofins Regulatory AG CH Eurofins Agrosciences Services LUX Holding SARL
100 12/11
Eurofins BioPharma Product Testing Switzerland AG
CH Eurofins Pharma Services LUX Holding SARL
100 01/13
Openlab Engineering AG CH Socamed SAS 100 10/15
Gestion De Calidad Y Laboratorio SA CL Eurofins Latin American Ventures SL 100 03/13
GCL Capacita SA CL Gestion De Calidad Y Laboratorio SA 100 03/13
Eurofins Product Testing Hong Kong Limited CN Eurofins Product Testing LUX Holding SARL
100 03/06
Eurofins Technology Service (Suzhou) Co., Ltd CN Eurofins Food Testing LUX Holding SARL 100 11/06
Eurofins Product Testing Service (Shanghai) Co., Ltd.
CN Eurofins Shanghai Holding Limited 90 11/09
Eurofins Testing Technology (Shenzhen) Co., Ltd.
CN Eurofins Product Testing LUX Holding SARL
100 10/09
Eurofins Shanghai Holding Limited CN Eurofins Product Testing LUX Holding SARL
90 08/09
Eurofins Central Laboratory China Co., Ltd CN Eurofins Pharma Services LUX Holding SARL
100 05/12
Eurofins Food Testing Hong Kong Limited CN Eurofins Food Testing LUX Holding SARL 100 03/12
CEREP Drug Discovery Services Co., Ltd. CN Eurofins CEREP SA 90 03/13
Eurofins NSC Shanghai Co., Ltd. CN Eurofins Support Services LUX Holding SARL
100 06/14
Eurofins NSC Hong Kong Limited CN Eurofins Support Services LUX Holding SARL
100 02/14
Eurofins Food Testing Service (Shanghai) Co., Ltd.
CN Eurofins Food Testing LUX Holding SARL 100 05/15
Eurofins CZ, s.r.o. CZ Eurofins Bel/Novamann s.r.o. 100 10/06
Eurofins Food Testing Hamburg Germany Holding GmbH
DE Eurofins GeneScan Holding GmbH 100 05/98
Eurofins 3. Verwaltungsgesellschaft GmbH DE Eurofins 1. Verwaltungsgesellschaft GmbH 100 11/98
Eurofins GeneScan Holding GmbH DE Eurofins Food Testing LUX Holding SARL 100 07/03
Eurofins Analytik GmbH DE Eurofins GfA Lab Service GmbH 100 12/98
Eurofins Dr. Specht GmbH DE Eurofins Food Testing Hamburg Germany Holding GmbH
100 04/05
Eurofins GeneScan GmbH DE Eurofins GeneScan Holding GmbH 100 07/03
Eurofins Sofia GmbH DE Eurofins Food Testing Pesticides Germany Holding GmbH
100 04/06
Eurofins GfA GmbH DE Eurofins NDSC Umweltanalytik GmbH 100 01/01
Ökometric GmbH DE Eurofins NDSC Umweltanalytik GmbH 100 12/02
Eurofins NDSC Umweltanalytik GmbH DE Eurofins Environment Testing LUX Holding SARL
100 03/05
Eurofins Umwelt West GmbH DE Eurofins Environment Testing Germany Holding West GmbH
100 04/05
Eurofins Umwelt Ost GmbH DE Eurofins NDSC Umweltanalytik GmbH 100 01/06
Eurofins Institut Jäger GmbH DE Eurofins NDSC Umweltanalytik GmbH 100 04/06
Eurofins Medigenomix GmbH DE Eurofins Genomics LUX Holding SARL 100 07/01
Eurofins Agroscience Services EcoChem GmbH DE Eurofins Agroscience Services Germany Holding GmbH
100 01/06
Eurofins BioPharma Product Testing Munich GmbH
DE Eurofins BioPharma Services Holding Germany GmbH
100 10/06
MWG Biotech AG DE Eurofins Genomics BV 100 01/05
Eurofins Genomics GmbH DE MWG Biotech AG 100 01/07
Eurofins Food Testing Pesticides Germany Holding GmbH
DE Eurofins Food Testing LUX Holding SARL 100 12/06
Eurofins Dr. Specht Laboratorien GmbH DE Eurofins Food Testing Hamburg Germany Holding GmbH
100 03/07

94
Company Country ISO Code
Subsidiary of :
% of interest by the Group
Date of entry
Eurofins MWG Synthesis GmbH DE MWG Biotech AG 100 01/07
Eurofins Food Testing General Chemistry Germany Holding GmbH
DE Eurofins Laborservices GmbH 100 04/07
Eurofins Institut Dr. Rothe DE Eurofins Food Testing General Chemistry Germany Holding GmbH
100 04/07
Eurofins Product Testing Verwaltungs GmbH DE Eurofins Product Service GmbH 100 03/07
Eurofins Environment Testing Germany Holding West GmbH
DE Eurofins Environment Testing LUX Holding SARL
100 12/07
Eurofins Agroscience Services Germany Holding GmbH
DE Eurofins Agrosciences Services LUX Holding SARL
100 04/07
Eurofins 1. Verwaltungsgesellschaft mbH DE Eurofins Scientific S.E. 100 04/07
Eurofins Umwelt Nord GmbH DE Eurofins NDSC Umweltanalytik GmbH 100 05/07
Eurofins Laborservices GmbH DE Eurofins Food Testing LUX Holding SARL 100 04/07
Eurofins NSC IT Infrastructure Germany GmbH DE Eurofins Support Services LUX Holding SARL
100 12/07
INLAB GmbH Institut für Lebensmittelmikrobiologie GmbH
DE Eurofins Food Testing General Chemistry Germany Holding GmbH
93 12/07
Eurofins Product Service GmbH DE Eurofins Scientific S.E. 100 01/08
Eurofins Information Systems GmbH DE Eurofins Food Testing Hamburg Germany Holding GmbH
100 11/07
Eurofins NSC Finance Germany GmbH DE Eurofins Support Services LUX Holding SARL
100 12/07
Eurofins Consumer Product Testing GmbH DE Eurofins Product Testing Verwaltungs GmbH
100 01/08
Eurofins Food Testing Germany East Holding GmbH
DE Eurofins Food Testing LUX Holding SARL 100 01/08
Eurofins Agroscience Services Chem GmbH DE Eurofins Food Testing Hamburg Germany Holding GmbH
100 02/08
Eurofins Food Control Services GmbH DE Eurofins Food Testing LUX Holding SARL 100 12/08
Eurofins WEJ Contaminants GmbH DE Eurofins GfA Lab Service GmbH 100 12/08
Eurofins BioTesting Services Nord GmbH DE Eurofins GfA Lab Service GmbH 100 12/08
Eurofins 2. Verwaltungsgesellschaft mbH DE Eurofins Real Estate LUX Holding SARL 100 06/08
Eurofins Global Control GmbH DE Eurofins Food Testing Pesticides Germany Holding GmbH
100 04/09
Eurofins Institut Dr. Appelt Leipzig GmbH DE Dr. Appelt Beteiligungs GmbH 100 05/09
Eurofins Rapidust Analysis GmbH DE Eurofins Food Testing Pesticides Germany Holding GmbH
100 08/09
Eurofins BioPharma Product Testing Hamburg GmbH
DE Eurofins BioPharma Services Holding Germany GmbH
100 07/09
Eurofins Institut Dr. Appelt Thüringen GmbH DE Dr. Appelt Beteiligungs GmbH 100 05/09
Eurofins Institut Dr. Appelt Hilter GmbH DE Dr. Appelt Beteiligungs GmbH 100 05/09
Dr. Appelt Beteiligungs GmbH DE Eurofins Food Testing Germany East Holding GmbH
100 05/09
Eurofins GeneScan Technologies GmbH DE Eurofins GeneScan Holding GmbH 100 05/09
Eurofins GfA Lab Service GmbH DE Eurofins Food Testing Hamburg Germany Holding GmbH
100 10/10
Eurofins NDSC Food Testing Germany GmbH DE Eurofins Food Testing Hamburg Germany Holding GmbH
100 03/11
Eurofins Agroscience Services GmbH DE Eurofins Agroscience Services Germany Holding GmbH
100 07/11
Eurofins Facility Management Germany GmbH DE Eurofins Food Testing Hamburg Germany Holding GmbH
100 11/11
GUA Gesellschaft für Umweltanalytik mbH DE Eurofins NDSC Umweltanalytik GmbH 100 06/12
Eurofins Medigenomix Forensik GmbH DE MWG Biotech AG 100 08/12
Eurofins Institut Dr. Appelt Südwest GmbH DE Dr. Appelt Beteiligungs GmbH 100 01/13
Eurofins GSC Germany GmbH DE Eurofins Support Services LUX Holding SARL
100 04/13
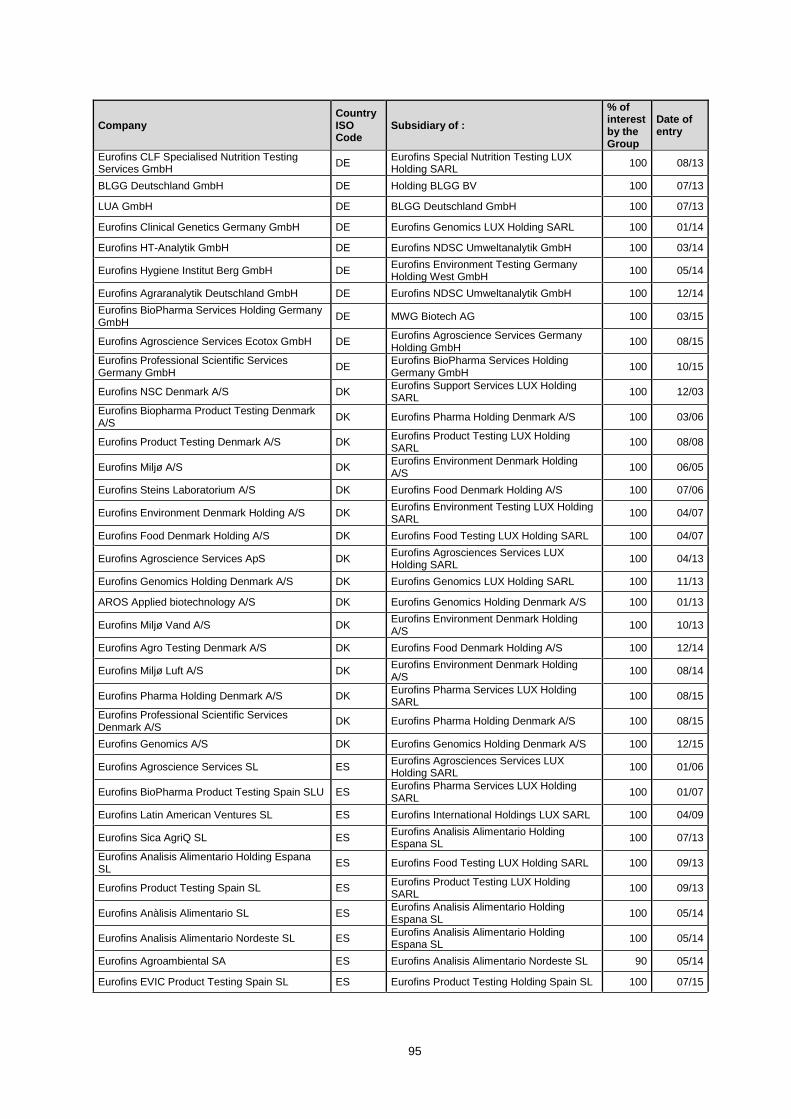
95
Company Country ISO Code
Subsidiary of :
% of interest by the Group
Date of entry
Eurofins CLF Specialised Nutrition Testing Services GmbH
DE Eurofins Special Nutrition Testing LUX Holding SARL
100 08/13
BLGG Deutschland GmbH DE Holding BLGG BV 100 07/13
LUA GmbH DE BLGG Deutschland GmbH 100 07/13
Eurofins Clinical Genetics Germany GmbH DE Eurofins Genomics LUX Holding SARL 100 01/14
Eurofins HT-Analytik GmbH DE Eurofins NDSC Umweltanalytik GmbH 100 03/14
Eurofins Hygiene Institut Berg GmbH DE Eurofins Environment Testing Germany Holding West GmbH
100 05/14
Eurofins Agraranalytik Deutschland GmbH DE Eurofins NDSC Umweltanalytik GmbH 100 12/14
Eurofins BioPharma Services Holding Germany GmbH
DE MWG Biotech AG 100 03/15
Eurofins Agroscience Services Ecotox GmbH DE Eurofins Agroscience Services Germany Holding GmbH
100 08/15
Eurofins Professional Scientific Services Germany GmbH
DE Eurofins BioPharma Services Holding Germany GmbH
100 10/15
Eurofins NSC Denmark A/S DK Eurofins Support Services LUX Holding SARL
100 12/03
Eurofins Biopharma Product Testing Denmark A/S
DK Eurofins Pharma Holding Denmark A/S 100 03/06
Eurofins Product Testing Denmark A/S DK Eurofins Product Testing LUX Holding SARL
100 08/08
Eurofins Miljø A/S DK Eurofins Environment Denmark Holding A/S
100 06/05
Eurofins Steins Laboratorium A/S DK Eurofins Food Denmark Holding A/S 100 07/06
Eurofins Environment Denmark Holding A/S DK Eurofins Environment Testing LUX Holding SARL
100 04/07
Eurofins Food Denmark Holding A/S DK Eurofins Food Testing LUX Holding SARL 100 04/07
Eurofins Agroscience Services ApS DK Eurofins Agrosciences Services LUX Holding SARL
100 04/13
Eurofins Genomics Holding Denmark A/S DK Eurofins Genomics LUX Holding SARL 100 11/13
AROS Applied biotechnology A/S DK Eurofins Genomics Holding Denmark A/S 100 01/13
Eurofins Miljø Vand A/S DK Eurofins Environment Denmark Holding A/S
100 10/13
Eurofins Agro Testing Denmark A/S DK Eurofins Food Denmark Holding A/S 100 12/14
Eurofins Miljø Luft A/S DK Eurofins Environment Denmark Holding A/S
100 08/14
Eurofins Pharma Holding Denmark A/S DK Eurofins Pharma Services LUX Holding SARL
100 08/15
Eurofins Professional Scientific Services Denmark A/S
DK Eurofins Pharma Holding Denmark A/S 100 08/15
Eurofins Genomics A/S DK Eurofins Genomics Holding Denmark A/S 100 12/15
Eurofins Agroscience Services SL ES Eurofins Agrosciences Services LUX Holding SARL
100 01/06
Eurofins BioPharma Product Testing Spain SLU ES Eurofins Pharma Services LUX Holding SARL
100 01/07
Eurofins Latin American Ventures SL ES Eurofins International Holdings LUX SARL 100 04/09
Eurofins Sica AgriQ SL ES Eurofins Analisis Alimentario Holding Espana SL
100 07/13
Eurofins Analisis Alimentario Holding Espana SL
ES Eurofins Food Testing LUX Holding SARL 100 09/13
Eurofins Product Testing Spain SL ES Eurofins Product Testing LUX Holding SARL
100 09/13
Eurofins Anàlisis Alimentario SL ES Eurofins Analisis Alimentario Holding Espana SL
100 05/14
Eurofins Analisis Alimentario Nordeste SL ES Eurofins Analisis Alimentario Holding Espana SL
100 05/14
Eurofins Agroambiental SA ES Eurofins Analisis Alimentario Nordeste SL 90 05/14
Eurofins EVIC Product Testing Spain SL ES Eurofins Product Testing Holding Spain SL 100 07/15

96
Company Country ISO Code
Subsidiary of :
% of interest by the Group
Date of entry
Trialcamp SL ES Eurofins Agrosciences Services LUX Holding SARL
100 06/15
Laboratori SARRO SL ES Bio-Access SAS 66 07/15
Histolog SL ES France Anapath Holding SAS 66 01/16
Eurofins Scientific Finland Oy FI Eurofins Food Testing LUX Holding SARL 100 10/07
Eurofins Viljavuuspalvelu Oy FI Eurofins Food Testing LUX Holding SARL 100 12/12
Eurofins Hygiène Alimentaire France Holding SAS
FR Eurofins Hygiène Alimentaire France LUX Holding SARL
100 01/99
Eurofins Analytics France SAS FR Eurofins Food Chemistry Testing France Holding SAS
100 07/99
Eurofins Biosciences SAS FR Eurofins Hygiène Alimentaire France Holding SAS
100 07/99
Eurofins Certification SAS FR Eurofins Hygiène Alimentaire France Holding SAS
100 07/03
Eurofins Laboratoire de Microbiologie de l'Est SAS
FR Eurofins Hygiène Alimentaire France Holding SAS
100 01/06
Eurofins ATS SAS FR Eurofins Product Testing LUX Holding SARL
100 01/99
Eurofins Hydrologie France Holding SAS FR Eurofins Hydrologie France LUX Holding SARL
100 07/05
Eurofins Analyses pour l'Environnement France SAS
FR Eurofins Analyses Environnementales pour les Industriels France LUX Holding SARL
100 07/05
Eurofins Analyses pour le Bâtiment Est SAS FR Eurofins Analyses pour le Batiment France Holding SAS
100 01/01
Eurofins Pharma France Holding SAS FR Eurofins Pharma Services France LUX Holding SARL
100 06/06
Eurofins Genomics SAS FR Eurofins Genomics LUX Holding SARL 100 07/05
IFEG SAS FR Eurofins Forensics LUX Holding SARL 75 11/05
Toxlab SAS FR Eurofins Forensics LUX Holding SARL 88 02/05
Eurofins ADME Bioanalyses SAS FR Eurofins Pharma France Holding SAS 100 10/04
Eurofins Optimed SAS FR Eurofins Pharma France Holding SAS 100 01/06
Eurofins Pharma Quality Control SAS FR Eurofins Pharma France Holding SAS 100 01/06
Eurofins Medinet France SAS FR Eurofins Pharma France Holding SAS 100 06/06
Eurofins Agroscience Services France SAS FR Eurofins Agrosciences Services France Holding SAS
100 01/06
Eurofins Agroscience Services SAS FR Eurofins Agrosciences Services France Holding SAS
100 01/06
Chemtox SAS FR Eurofins Forensics LUX Holding SARL 96 01/08
Eurofins Laboratoires de Microbiologie Ouest SAS
FR Eurofins Hygiène Alimentaire France Holding SAS
100 10/06
Eurofins Cervac Sud SAS FR Eurofins Food Chemistry Testing France Holding SAS
100 10/06
Eurofins NSC Finance France SAS FR Eurofins Support Services LUX Holding SARL
100 10/06
Eurofins Marketing Research SAS FR Eurofins Food Chemistry Testing France Holding SAS
100 10/06
Eurofins Hydrologie France SAS FR Eurofins Hydrologie France Holding SAS 100 01/01
Eurofins Food Chemistry Testing France Holding SAS
FR Eurofins Food Chemistry Testing France LUX Holding SARL
100 09/07
Eurofins Optimed Lyon SAS FR Eurofins Pharma France Holding SAS 100 09/07
Eurofins NSC IT Infrastructure France SAS FR Eurofins Support Services LUX Holding SARL
100 12/07
Eurofins Hydrologie Centre Est SAS FR Eurofins Hydrologie France Holding SAS 100 04/08
Eurofins Laboratoire Centre SAS FR Eurofins Hygiène Alimentaire France Holding SAS
100 07/10
Eurofins Laboratoire Nord SAS FR Eurofins Food Chemistry Testing France Holding SAS
100 07/10

97
Company Country ISO Code
Subsidiary of :
% of interest by the Group
Date of entry
Eurofins Consulting Agroalimentaire SAS FR Eurofins Hygiène Alimentaire France Holding SAS
100 07/10
Eurofins GSC France SAS FR Eurofins Support Services LUX Holding SARL
100 07/10
Eurofins NDSC Food France SAS FR Eurofins Food Chemistry Testing France Holding SAS
100 08/10
Eurofins NDSC Environnement France SAS FR Eurofins NDSC Environnement France Holding SAS
100 08/10
Eurofins Analyses pour le Bâtiment France Holding SAS
FR Eurofins Analyses pour la Construction France LUX Holding SARL
100 08/10
Eurofins Analyses pour le Bâtiment France SAS FR Eurofins Analyses pour le Batiment France Holding SAS
100 09/10
Eurofins Ascal Hydrologie SAS FR Eurofins Analyses pour le Bâtiment France Holding SAS
100 10/10
Eurofins Analyses Environnementales pour les Industriels France SAS
FR Eurofins Analyses Environnementales pour les Industriels France LUX Holding SARL
100 10/10
Eurofins NSC Développement France SAS FR Eurofins Support Services LUX Holding SARL
100 10/10
Eurofins France Holding SAS FR Eurofins Scientific S.E. (French Branch) 100 12/10
Eurofins Agroscience Services Chem SAS FR Eurofins Agrosciences Services France Holding SAS
100 12/10
Eurofins Analyses pour le Bâtiment Ile de France SAS
FR Eurofins Ascal Hydrologie SAS 100 12/10
Eurofins Analyses pour le Bâtiment Nord SAS FR Eurofins Ascal Hydrologie SAS 100 12/10
Eurofins Analyses pour le Bâtiment Sud Est SAS
FR Eurofins Ascal Hydrologie SAS 100 12/10
Eurofins Analyses pour le Bâtiment Ouest SAS FR Eurofins Analyses pour le Bâtiment France Holding SAS
100 12/10
Eurofins Analyses des Matériaux et Combustibles France SAS
FR Eurofins Analyses Environnementales pour les Industriels France SAS
100 12/10
Eurofins Air à l'Emission France SAS FR Eurofins Analyses Environnementales pour les Industriels France SAS
100 12/10
Eurofins Hydrologie Nord SAS FR Eurofins Hydrologie France Holding SAS 100 11/11
Eurofins IPL Hydrologie SAS FR Eurofins Water Testing LUX SARL 100 11/11
LCAM SAS FR Eurofins Food Management SAS 100 11/11
Eurofins Hydrologie Ile de France SAS FR Eurofins Hydrologie France Holding SAS 100 11/11
Eurofins Hydrologie Est SAS FR Eurofins Hydrologie France SAS 100 11/11
Eurofins Hydrologie Sud SAS FR Eurofins Hydrologie France Holding SAS 100 11/11
Eurofins Asbestos Testing Europe SAS FR Eurofins Industrial Testing LUX SARL 100 11/11
Eurofins Laboratoire Contaminants Sud SAS FR Eurofins Food Chemistry Testing France Holding SAS
100 12/11
Eurofins Laboratoire de Pathologie Végétale SAS
FR Eurofins Food Chemistry Testing France Holding SAS
100 12/11
Eurofins Hydrologie Ouest SAS FR Eurofins Hydrologie France Holding SAS 100 02/12
Eurofins DSC Forensics SAS FR Eurofins Forensics LUX Holding SARL 100 02/12
Eurofins Analyses de l’Air Paris SAS FR Eurofins Analyses Environnementales pour les Industriels France SAS
100 02/12
Eurofins Analyses d’Amiante Paris SAS FR Eurofins Analyses pour le Bâtiment France Holding SAS
100 02/12
Eurofins Food Management SAS FR Eurofins Hygiène Alimentaire France Holding SAS
100 02/12
Eurofins Expertises Environnementales SAS FR Eurofins Hydrologie France Holding SAS 100 04/12
Eurofins NDSC Environnement France Holding SAS
FR Eurofins Environment Testing LUX Holding SARL
100 05/12
Eurofins NDSCE Support France SAS FR Eurofins NDSC Environnement France Holding SAS
100 01/12
Eurofins Agrosciences Services France Holding SAS
FR Eurofins Agrosciences Services LUX Holding SARL
100 12/12
Eurofins GSC Cadet SAS FR Eurofins Support Services LUX Holding SARL
100 11/12

98
Company Country ISO Code
Subsidiary of :
% of interest by the Group
Date of entry
Eurofins Environnement Logistique France SAS FR Eurofins Analyses Environnementales pour les Industriels France SAS
100 12/12
Eurofins Pharma Products Testing France Management SAS
FR Eurofins Pharma France Holding SAS 100 12/12
Eurofins Pharma Products Engineering SAS FR Eurofins Pharma France Holding SAS 100 12/12
EVGS SAS FR Eurofins Food Chemistry Testing France Holding SAS
51 12/12
Eurofins CEREP SA FR Eurofins Discovery Services LUX Holding SARL
90 03/13
Mitox Fopse EURL FR MITOX Trial Management BV 100 07/13
Eurofins Analyses pour le Bâtiment Sud-Ouest SAS
FR Eurofins Analyses pour le Bâtiment France Holding SAS
100 09/13
Eurofins IDmyk SAS FR Eurofins Pharma France Holding SAS 100 01/14
Eurofins Prélèvement pour le Bâtiment France Holding SAS
FR Eurofins Analyses pour l’Environnement France LUX Holding SARL
100 08/14
Eurofins Prélèvement pour le Bâtiment Est SAS FR Eurofins Prélèvement pour le Bâtiment France Holding SAS
100 09/14
Eurofins Prélèvement pour le Bâtiment France SAS
FR Eurofins Prélèvement pour le Bâtiment France Holding SAS
100 10/14
Eurofins Prélèvement pour le Bâtiment Ouest SAS
FR Eurofins Prélèvement pour le Bâtiment France Holding SAS
100 10/14
Eurofins NSC HR France SAS FR Eurofins Support Services LUX Holding SARL
100 07/14
Eurofins Analyses pour le Bâtiment Sud SAS FR Eurofins Analyses pour le Bâtiment France Holding SAS
100 08/14
Eurofins Prélèvement pour le Bâtiment Nord SAS
FR Eurofins Prélèvement pour le Bâtiment France Holding SAS
100 09/14
Eurofins Prélèvement pour le Bâtiment Sud-Est SAS
FR Eurofins Prélèvement pour le Bâtiment France Holding SAS
100 09/14
Eurofins Prélèvement pour le Bâtiment Île-de-France SAS
FR Eurofins Prélèvement pour le Bâtiment France Holding SAS
100 09/14
Eurofins NDSC Hydrologie France SAS FR Eurofins Hydrologie France Holding SAS 100 11/14
Eurofins Hygiène Hospitalière SAS FR Eurofins Hygiène Alimentaire France Holding SAS
100 12/14
SCI Vennecy Les Esses Galerne FR Eurofins Real Estate LUX Holding SARL 100 11/14
Eagle Ventures SAS FR Eurofins International Holdings LUX SARL 100 12/14
Eurofins Product Testing France Holding SAS FR Eurofins Product Testing LUX Holding SARL
100 12/14
Eurofins Cebat SAS FR Eurofins Analyses pour le Bâtiment France Holding SAS
100 04/15
Eurofins EVIC Product Testing France SAS FR Eurofins Product Testing France Holding SAS
100 07/15
EVIC International SAS FR Eurofins France Holding SAS 100 07/15
France Biologie Holding SAS FR Eurofins Clinical Testing Services France LUX Holding SARL
66 06/15
France Biologie de Spécialité Holding SAS FR Eurofins Clinical Testing Services France LUX Holding SARL
100 06/15
Eurofins Environment Testing France Australia Holding SAS
FR Eurofins Environment Testing LUX Holding SARL
100 06/15
Bio-Access SAS FR France Biologie Holding SAS 66 07/15
Labazur Provence SELAS FR Laboratori SARRO SL 66 07/15
Labazur Cayenne SELAS FR Labazur Provence SELAS 66 07/15
Labazur Nice SELAS FR Labazur Provence SELAS 66 07/15
Labazur Rhone Alpes SELAS FR Labazur Provence SELAS 66 07/15
Labazur Bretagne SELAS FR Labazur Provence SELAS 66 07/15
Labazur Armorique SELAS FR Labazur Provence SELAS 66 07/15
Labazur ASV SELAS FR Labazur Provence SELAS 66 07/15

99
Company Country ISO Code
Subsidiary of :
% of interest by the Group
Date of entry
Labazur Cornouaille SELAS FR Labazur Bretagne SELAS 66 07/15
Ouest Bio Santé SELAS FR Labazur Cayenne SELAS 66 07/15
France Anapath Holding SAS FR Eurofins Clinical Testing Services France LUX Holding SARL
66 07/15
IS-O2 SAS FR Bio-Access SAS 66 07/15
Bio-Access Services GIE FR Bio-Access SAS 66 07/15
Eurofins Pharma Products Testing France II SAS
FR Eurofins Pharma France Holding SAS 100 12/15
Eurofins Hydrologie Sud Ouest SAS FR Eurofins Hydrologie France Holding SAS 100 11/15
Eurofins France Holding Développement V SAS FR Eurofins France Holding SAS 100 10/15
Eurofins France Holding Développement VI SAS
FR Eurofins France Holding SAS 100 10/15
Eurofins France Holding Développement VII SAS
FR Eurofins France Holding SAS 100 10/15
Eurofins Biomnis Holding SAS FR France Biologie de Spécialité Holding SAS 100 10/15
Eurofins France Spécialisée SAS FR Eurofins Biomnis Holding SAS 100 10/15
Socamed SAS FR Eurofins France Spécialisée SAS 100 10/15
Biomnis Sample Library SAS FR Socamed SAS 100 10/15
Openlab France SARL FR Socamed SAS 100 10/15
SCI du Val d'Ouest FR Eurofins Real Estate LUX Holding SARL 100 10/15
Biomnis SELAS FR Claymon Laboratories Limited 100 10/15
Laboratoire des Pyramides SELAS FR Biomnis SELAS 72 10/15
CBM 69 SELAS FR Biomnis SELAS 100 10/15
CEF SELAS FR Biomnis SELAS 100 10/15
Bioffice SELAS FR CEF SELAS 100 10/15
Biosphere GIE FR Biomnis SELAS 100 10/15
Phyliae SAS FR Eurofins Agrosciences Services France Holding SAS
100 11/15
SCI Hénin Beaumont Noyelles FR Eurofins Support Services LUX Holding SARL
100 12/15
Aquila (Gigco) Ltd. GI Eurofins Environment Testing LUX Holding SARL
100 12/12
Eurofins Agroscience Services KfT HU Eurofins Agrosciences Services LUX Holding SARL
100 09/07
Eurofins Scientific (Ireland) Limited IE Eurofins GSC LUX SARL 100 05/03
Eurofins Food Testing Ireland Limited IE Eurofins Food Testing LUX Holding SARL 100 04/09
Eurofins Pharma Ireland Holding Limited IE Eurofins Pharma Services LUX Holding SARL
100 02/11
Microchem Laboratories (Ireland) Limited IE Eurofins Pharma Ireland Holding Limited 100 04/11
Eurofins Cork Limited IE Eurofins Food Testing LUX Holding SARL 100 10/15
Clogherane Real Estate Investment Limited IE Eurofins Real Estate LUX Holding SARL 100 11/15
Claymon Laboratories Limited IE Socamed SAS 100 10/15
Lablink Biomnis Limited IE Claymon Laboratories Limited 100 10/15
Eurofins Genomics India Pvt Ltd. IN Eurofins Genomics LUX Holding SARL 100 01/05
Eurofins Analytical Services India Pvt Ltd. IN Eurofins Food Testing LUX Holding SARL 100 05/09
Eurofins Pharma Services India Pvt Ltd. IN Eurofins Pharma Services LUX Holding SARL
100 01/11
Eurofins IT Solutions India Pvt Ltd. IN Eurofins Support Services LUX Holding SARL
100 02/12
Eurofins Resources India Pvt Ltd. IN Eurofins Genomics LUX Holding SARL 100 03/12

100
Company Country ISO Code
Subsidiary of :
% of interest by the Group
Date of entry
Eurofins AgroScience Services Ltd. IN Eurofins Agrosciences Services LUX Holding SARL
100 10/13
Eurofins Clinical Genetics India Pvt Ltd. IN Eurofins Genomics LUX Holding SARL 100 12/15
Eurofins Agroscience Services Srl IT Eurofins Agrosciences Services LUX Holding SARL
100 02/04
Eurofins Food & Feed Testing Italia Holding Srl IT Eurofins Food Testing LUX Holding SARL 100 07/06
Eurofins Chemical Control Srl IT Eurofins Food & Feed Testing Italia Holding Srl
100 09/06
Eurofins Biolab Srl IT Eurofins Pharma Services Italia Holding Srl 100 01/07
Eurofins Qualis Srl IT Eurofins Food & Feed Testing Italia Holding Srl
100 06/07
Eurofins Environment Testing Italy Srl IT Eurofins Environment Testing LUX Holding SARL
100 06/08
Eurofins Product Testing Italy Srl IT Eurofins Product Testing Italia Holding Srl 100 10/08
Eurofins NSC Italia Srl IT Eurofins Support Services LUX Holding SARL
100 01/12
Eurofins Product Testing Italia Holding Srl IT Eurofins Product Testing LUX Holding SARL
100 10/12
Eurofins Consulting Italia Holding Srl IT Eurofins Environment Testing LUX Holding SARL
100 10/12
Eurofins Genomics Srl IT Eurofins Genomics LUX Holding SARL 100 09/12
Eurofins Pivetti Srl IT Eurofins Food & Feed Testing Italia Holding Srl
100 11/12
Eurofins Pharma Services Italia Holding Srl IT Eurofins Pharma Services LUX Holding SARL
100 01/13
Eurofins Modulo Uno Srl IT Eurofins Product Testing Italia Holding Srl 100 07/12
CTP Laboratories Srl IT Eurofins Pharma Services Italia Holding Srl 100 01/13
Padova Via Austria Real Estate Invest Srl IT Eurofins Real Estate LUX Holding SARL 100 04/14
Torino Via Cuorgnè Real Estate Invest Srl IT Eurofins Real Estate LUX Holding SARL 100 03/15
Kalibios Srl IT Eurofins Pharma Services Italia Holding Srl 100 07/15
Eurofins Consulting Italy Srl IT Eurofins Consulting Italia Holding Srl 100 09/15
Eurofins NSC Japan KK JP Eurofins Support Services LUX Holding SARL
100 03/06
Eurofins Genomics KK JP Eurofins Genomics LUX Holding SARL 100 12/07
Eurofins Food and Product Testing Japan KK JP Eurofins Food Testing LUX Holding SARL 100 01/09
Eurofins DNA Synthesis KK JP Eurofins Genomics LUX Holding SARL 66 07/11
Eurofins Nihon Kankyo KK JP Eurofins Environment Testing LUX Holding SARL
100 04/12
Eurofins Nihon Soken KK JP Eurofins Environment Testing LUX Holding SARL
100 07/15
Eurofins Kankyo Sogo Kenkyu Kiko KK JP Eurofins Nihon Soken KK 79 07/15
Eurofins Clinical Genetics Japan KK JP Eurofins Genomics KK 100 12/15
AgriQuest Limited (Kenya) KE AgriQ Group BV 60 07/13
Eurofins Food Testing LUX Holding SARL LU Eurofins International Holdings LUX SARL 100 12/06
Eurofins Environment Testing LUX Holding SARL
LU Eurofins International Holdings LUX SARL 100 12/06
Eurofins Pharma Services LUX Holding SARL LU Eurofins International Holdings LUX SARL 100 12/06
Eurofins GSC LUX SARL LU Eurofins International Holdings LUX SARL 100 10/06
Eurofins Agrosciences Services LUX Holding SARL
LU Eurofins International Holdings LUX SARL 100 07/07
Eurofins Product Testing LUX Holding SARL LU Eurofins International Holdings LUX SARL 100 04/08
Eurofins Real Estate LUX Holding SARL LU Eurofins International Holdings LUX SARL 100 05/10
Eurofins Genomics LUX Holding SARL LU Eurofins International Holdings LUX SARL 100 07/10

101
Company Country ISO Code
Subsidiary of :
% of interest by the Group
Date of entry
Eurofins Forensics LUX Holding SARL LU Eurofins France Holding SAS 100 07/10
Eurofins Industrial Testing LUX SARL LU Eurofins Environment Testing LUX Holding SARL
100 09/10
Eurofins International Holdings LUX SARL LU Eurofins Scientific S.E. 100 12/10
Eurofins Water Testing LUX SARL LU Eurofins Environment Testing LUX Holding SARL
100 10/11
Eurofins Pharma Services France LUX Holding SARL
LU Eurofins France Holding SAS 100 12/11
Eurofins Food Chemistry Testing France LUX Holding SARL
LU Eurofins France Holding SAS 100 12/11
Eurofins Hygiène Alimentaire France LUX Holding SARL
LU Eurofins France Holding SAS 100 12/11
Eurofins Analyses pour la Construction France LUX Holding SARL
LU Eurofins France Holding SAS 100 12/11
Eurofins Analyses pour l’Environnement France LUX Holding SARL
LU Eurofins France Holding SAS 100 12/11
Eurofins Analyses Environnementales pour les Industriels France LUX Holding SARL
LU Eurofins France Holding SAS 100 12/11
Eurofins Hydrologie France LUX Holding SARL LU Eurofins France Holding SAS 100 12/11
Eurofins Discovery Services LUX Holding SARL LU Eurofins International Holdings LUX SARL 100 11/12
Eurofins International Support Services LUX SARL
LU Eurofins Scientific S.E. 100 11/12
Eurofins Special Nutrition Testing LUX Holding SARL
LU Eurofins Food Testing LUX Holding SARL 100 12/12
Eurofins Clinical Testing Holding LUX SARL LU Eurofins International Holdings LUX SARL 100 11/14
Eurofins Clinical Testing Services France LUX Holding SARL
LU Eurofins Scientific S.E. (French Branch) 100 05/15
AgriQ Maroc S.A.R.L. MA Eurofins Sica AgriQ SL 100 07/13
Eurofins NM Laboratory Sdn Bhd MY Eurofins Environment Testing LUX Holding SARL
75 11/15
Eurofins North Malaya Laboratory Sdn Bhd MY Eurofins Environment Testing LUX Holding SARL
75 11/15
Eurofins Environment Testing Netherlands Holding BV
NL Eurofins Environment Testing LUX Holding SARL
100 04/01
Eurofins Food Testing Netherlands BV NL Eurofins Food Testing Netherlands Holding BV
100 10/00
Eurofins Analytico BV NL Eurofins Environment Testing Netherlands Holding BV
100 04/01
Pro Monitoring BV NL Eurofins Environment Testing Netherlands Holding BV
80 10/04
Eurofins Central Laboratory BV NL Eurofins Pharma Services LUX Holding SARL
100 04/01
Eurofins Genomics BV NL Eurofins Scientific S.E. 100 06/06
C-Mark BV NL Eurofins Food Testing Netherlands Holding BV
100 03/11
Eurofins NSC Netherlands BV NL Eurofins Support Services LUX Holding SARL
100 05/11
Eurofins Food Testing Netherlands Holding BV NL Eurofins Food Testing LUX Holding SARL 100 05/11
Eurofins Food Testing Rotterdam BV NL Eurofins Food Testing Netherlands Holding BV
100 03/12
Zandbergsestraat Graauw RE Invest BV NL Eurofins Real Estate LUX Holding SARL 100 01/13
Eurofins Lab Zeeuws-Vlaanderen (LZV) BV NL Eurofins Food Testing Netherlands Holding BV
100 01/13
Eurofins OSO Benelux BV NL Eurofins Environment Testing Netherlands Holding BV
100 04/13
MITOX Trial Management BV NL Eurofins Agrosciences Services LUX Holding SARL
100 07/13
Eurofins Agro Testing Benelux Holding BV NL Eurofins Food Testing Netherlands Holding BV
100 07/13
Holding BLGG BV NL Eurofins Agro Testing Benelux Holding BV 100 07/13

102
Company Country ISO Code
Subsidiary of :
% of interest by the Group
Date of entry
AgriQ Group BV NL Eurofins Agro Testing Benelux Holding BV 100 07/13
Eurofins Agro Testing Wageningen BV NL Holding BLGG BV 100 07/13
Holding CFW BV NL Eurofins Agro Testing Benelux Holding BV 100 07/13
Eurofins KBBL BV NL Eurofins Food Testing Netherlands Holding BV
100 01/14
Eurofins Food Safety Solutions BV NL Eurofins Food Testing Netherlands Holding BV
100 02/14
Eurofins Omegam BV NL Eurofins Environment Testing Netherlands Holding BV
100 01/14
Duivendrecht Real Estate Invest BV NL Eurofins Real Estate LUX Holding SARL 100 07/14
Eurofins BioPharma Product Testing Netherlands BV
NL Eurofins Pharma Services LUX Holding SARL
100 09/14
Eurofins NDSC Environment Testing Benelux BV
NL Eurofins Environment Testing Netherlands Holding BV
100 09/14
Heerenveen Leeuwarderstraatweg Real Estate BV
NL Eurofins Real Estate LUX Holding SARL 100 03/15
Eagle Ventures Netherlands BV NL Eurofins International Holdings LUX SARL 100 08/15
Proefbedrijf Gewasbescherming De Bredelaar BV
NL Eurofins Agrosciences Services LUX Holding SARL
100 07/15
Nieuw Biesterveld BV NL Eurofins Real Estate LUX Holding SARL 100 07/15
Eurofins Environment Testing Norway AS NO Eurofins Environment Testing Norway Holding AS
100 05/06
Eurofins Environment Testing Norway Holding AS
NO Eurofins Environment Testing LUX Holding SARL
100 09/07
Eurofins Food & Feed Testing Norway AS NO Eurofins Food Testing Norway Holding AS 100 09/07
Eurofins Food Testing Norway Holding AS NO Eurofins Food Testing LUX Holding SARL 100 08/07
Eurofins Norge NSC AS NO Eurofins Support Services LUX Holding
SARL 100 12/07
Eurofins Agro Testing Norway AS NO Eurofins Food Testing Norway Holding AS 100 08/14
Moss Property Invest AS NO Eurofins Real Estate LUX Holding SARL 100 08/14
Eurofins Radonlab AS NO Eurofins Environment Testing Norway
Holding AS 100 12/15
Penrose NZ Limited NZ Eurofins Real Estate LUX Holding SARL 100 04/12
Eurofins NZ Laboratory Services Limited NZ Eurofins Food Testing LUX Holding SARL 100 06/12
Eurofins ELS Limited NZ Eurofins Food Testing LUX Holding SARL 100 11/12
Eurofins Agroscience Services NZ Ltd. NZ Eurofins Agroscience Services Pty Ltd. 81 07/13
Eurofins Agroscience Testing NZ Ltd. NZ Eurofins Agroscience Testing Pty Ltd. 81 07/13
Eurofins Agroscience Services Sp. z.o.o. PL Eurofins Agrosciences Services LUX Holding SARL
100 01/06
Eurofins Polska Sp. z.o.o. PL Eurofins Food Testing LUX Holding SARL 100 07/06
Eurofins Environment Testing Polska Sp. z.o.o. PL Eurofins Industrial Testing LUX Holding
SARL 100 07/15
Eurofins Lab Environment Testing Portugal, Unipessoal Ltda.
PT Eurofins Environment Testing LUX Holding SARL
100 06/15
Eurofins Agroscience Services srl RO Eurofins Agrosciences Services LUX Holding SARL
100 08/09
Bio High Tech srl RO Eurofins EVIC Product Testing France Holding SAS
90 07/15
Eurofins Agro Testing Sweden AB SE Eurofins Food Testing Sweden Holding AB 100 01/04
Eurofins Steins Laboratorium AB SE Eurofins Food Testing Sweden Holding AB 100 07/06
Eurofins Food Testing Sweden Holding AB SE Eurofins Food Testing LUX Holding SARL 100 09/07
Eurofins Environment Testing Sweden AB SE Eurofins Environment Testing Sweden
Holding AB 100 10/07
Eurofins Environment Testing Sweden Holding AB
SE Eurofins Environment Testing LUX Holding SARL
100 09/07

103
Company Country ISO Code
Subsidiary of :
% of interest by the Group
Date of entry
Eurofins Food & Feed Testing Sweden AB SE Eurofins Food Testing Sweden Holding AB 100 10/07
Eurofins NSC Sweden AB SE Eurofins Support Services LUX Holding
SARL 100 01/08
Eurofins Biopharma Product Testing Sweden AB
SE Eurofins Pharma Services LUX Holding SARL
100 04/11
Eurofins Pegasuslab AB SE Eurofins Environment Testing Sweden
Holding AB 100 06/12
BLGG Agro Xpertus AB SE Eurofins Agro Testing Sweden AB 100 07/13
Uppsala Property Invest AB SE Eurofins Real Estate LUX Holding SARL 100 03/14
Eurofins Central Laboratory PTE. Ltd. SG Eurofins Pharma Services LUX Holding SARL
100 12/06
Eurofins Food Testing Singapore Pte Ltd SG Eurofins Food Testing LUX Holding SARL 100 12/15
Eurofins Bel/Novamann s.r.o. SK Eurofins Food Testing LUX Holding SARL 100 10/07
Eurofins NSC Central and Eastern Europe s.r.o. SK Eurofins Support Services LUX Holding SARL
100 06/15
Eurofins Product Service (Thailand) Co., Ltd. TH Eurofins Product Testing LUX Holding SARL
100 07/08
Eurofins Turkey Gida Analizleri Limited Sirketi TR Eurofins Food Testing LUX Holding SARL 100 05/12
Eurofins Panlabs Taiwan Ltd. TW Eurofins Discovery Services LUX Holding SARL
100 10/12
Eurofins Food Testing Taiwan Ltd. TW Eurofins Food Testing LUX Holding SARL 100 03/15
Eurofins Agro Testing Ukraine LLC UA Eurofins Food Testing LUX Holding SARL 100 08/14
Eurofins NSC UK & Ireland Limited UK Eurofins Support Services LUX Holding SARL
100 01/06
Eurofins Food Testing UK Limited UK Eurofins Food Testing UK Holding Limited 100 01/04
Public Analyst Scientific Services (NI) Limited UK Eurofins Food Testing UK Holding Limited 100 09/04
Eurofins Genetic Services Limited UK Eurofins Genomics LUX Holding SARL 100 07/05
Eurofins Food Testing UK Holding Limited UK Eurofins Food Testing LUX Holding SARL 100 04/07
Eurofins Agroscience Services Limited UK Eurofins Agrosciences Services LUX
Holding SARL 100 04/07
Eurofins Product Testing Services Limited UK Eurofins Product Testing LUX Holding
SARL 100 10/10
Public Analyst Scientific Services Limited UK Eurofins Food Testing UK Holding Limited 100 07/11
Romsey Real Estate Limited UK Eurofins Food Testing UK Holding Limited 100 07/12
Eurofins Agroscience Services Chem Limited UK Eurofins Agrosciences Services LUX
Holding SARL 100 12/12
Eurofins Newtec Laboratories Limited UK Eurofins Food Testing UK Holding Limited 100 07/13
Eurofins Pharma Bioanalysis Services UK Limited
UK Eurofins Discovery Services LUX Holding SARL
100 09/13
Eurofins Pharma Discovery Services UK Limited UK Eurofins Discovery Services LUX Holding
SARL 100 09/13
Eurofins Digital Product Testing UK Limited UK Eurofins Product Testing LUX Holding
SARL 100 11/14
Eurofins Acton Limited UK Eurofins Food Testing UK Holding Limited 100 10/15
Biomnis Laboratories UK Limited UK Socamed SAS 100 10/15
Eurofins Scientific Inc. US Eurofins Food Testing LUX Holding SARL 100 01/92
Eurofins Central Laboratory LLC US Eurofins Lancaster Laboratories Inc. 100 06/06
Eurofins Analytical Laboratories Inc. US Eurofins Food Testing US Holdings Inc. 100 04/07
Eurofins MWG Operon LLC US Eurofins Genomics LLC 100 12/07
Eurofins Genomics LLC US Eurofins Vircacor, Inc. 100 10/07
Eurofins Food Testing US Holdings Inc. US Eurofins Food Testing LUX Holding SARL 100 04/07
Eurofins Agroscience Services Inc. US Eurofins Agrosciences Services LUX
Holding SARL 100 01/07

104
Company Country ISO Code
Subsidiary of :
% of interest by the Group
Date of entry
Eurofins Microbiology Laboratories Inc. US Eurofins Food Testing US Holdings Inc. 100 06/09
Eurofins NSC US Inc. US Eurofins Support Services LUX Holding
SARL 100 10/10
Eurofins Pharma US Holdings II Inc. US Eurofins Pharma Services LUX Holding
SARL 100 01/11
Eurofins Lancaster Laboratories Inc. US Eurofins Pharma US Holdings II Inc. 100 04/11
Eurofins DQCI LLC US Eurofins Food Testing US Holdings Inc. 100 10/11
Eurofins Environment Testing US Holdings Inc. US Eurofins Environment Testing LUX Holding
SARL 100 11/12
Eurofins Air Toxics, Inc. US Eurofins Environment Testing US Holdings
Inc. 100 01/12
Eurofins QTA Inc. US Eurofins Food Testing US Holdings Inc. 100 02/12
Eurofins Eaton Analytical Inc. US Eurofins Environment Testing US Holdings
Inc. 100 07/12
Eurofins Frontier Global Sciences Inc. US Eurofins Environment Testing US Holdings
Inc. 100 09/12
Eurofins Panlabs Inc. US Eurofins Pharma US Holdings II Inc. 100 10/12
Eurofins Lancaster Laboratories Environmental LLC
US Eurofins Lancaster Laboratories Inc. 100 01/13
Eurofins Pharma BioAnalytics Services US, Inc. US Eurofins Discovery Services LUX Holding
SARL 100 01/13
South Bend Real Estate, Inc. US Eurofins Environment Testing US Holdings
Inc. 100 05/14
Eurofins Calscience, Inc. US Eurofins Environment Testing US Holdings
Inc. 100 05/14
Eurofins VircaCor, Inc. US Eurofins Pharma US Holdings II Inc. 100 07/14
Eurofins SF Analytical Laboratories Inc. US Eurofins Food Testing US Holdings Inc. 100 11/14
Eurofins Clinical Testing US Holdings, Inc. US Eurofins Clinical Testing Holding LUX
SARL 100 11/14
Boston Heart Diagnostics Inc. US Eurofins Clinical Testing US Holdings, Inc. 100 01/15
Eurofins Lancaster Laboratories Professional Scientific Services LLC
US Eurofins Lancaster Laboratories Inc. 100 02/15
Eurofins Product Testing US Inc. US Eurofins Product Testing LUX Holding
SARL 100 02/15
Eurofins BioDiagnostics Inc. US Eurofins Food Testing US Holdings Inc. 100 02/15
Eurofins QCL Holdings, Inc. US Eurofins Environment Testing US Holdings
Inc. 100 04/15
Eurofins QC Inc. US QCL Holdings Inc. 100 04/15
Diatherix Laboratories, LLC US Diatherix LLC 100 05/15
EGL Genetic Diagnostics LLC US Eurofins Genomic Clinical Diagnostics US
Holdings, Inc. 76 06/15
Eurofins Spectrum Analytical Inc. US Eurofins Environment Testing US Holdings
Inc. 100 07/15
Diatherix LLC US Eurofins ViraCor, Inc. 100 07/15
Eurofins Clinical Molecular Testing Services LLC
US Eurofins ViraCor, Inc. 100 09/15
Eurofins Sac Ky Hai Dang Company Limited VN Eurofins Food Testing LUX Holding SARL 100 05/15
* Please note that for confidentiality reasons the information provided above is not comprehensive.
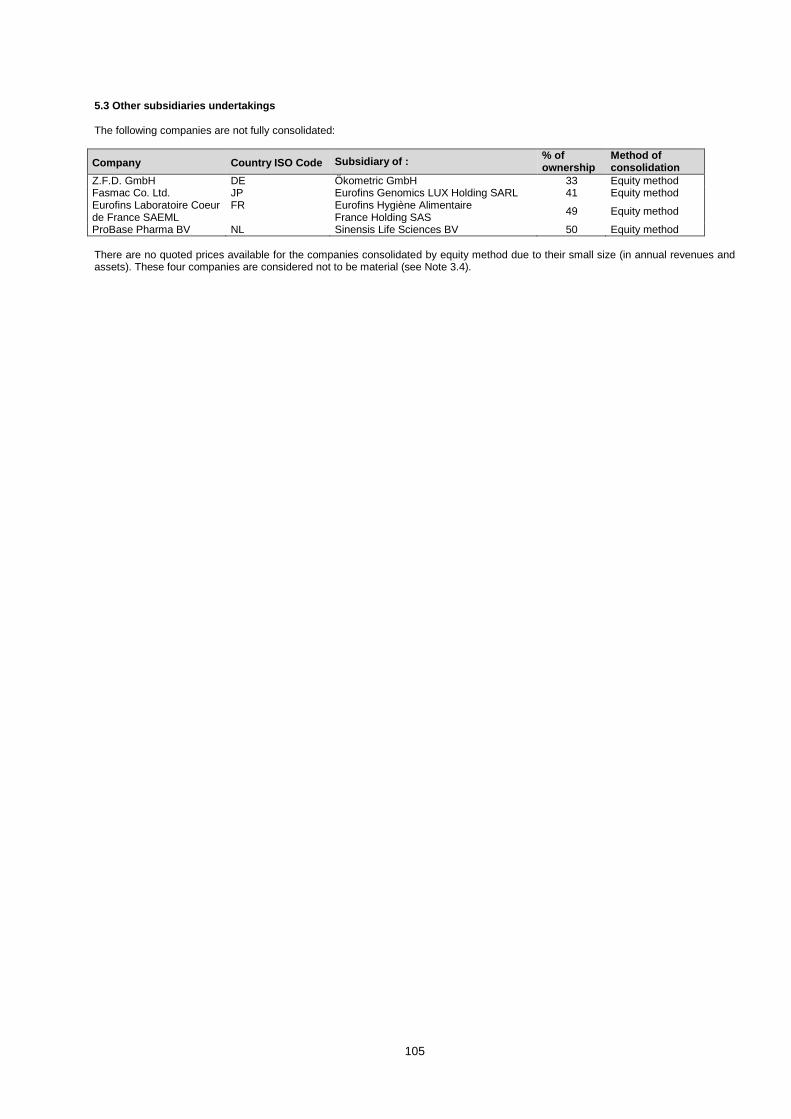
105
5.3 Other subsidiaries undertakings The following companies are not fully consolidated:
Company Country ISO Code Subsidiary of : % of ownership
Method of consolidation
Z.F.D. GmbH DE Ökometric GmbH 33 Equity method Fasmac Co. Ltd. JP Eurofins Genomics LUX Holding SARL 41 Equity method Eurofins Laboratoire Coeur de France SAEML
FR Eurofins Hygiène Alimentaire France Holding SAS
49 Equity method
ProBase Pharma BV NL Sinensis Life Sciences BV 50 Equity method
There are no quoted prices available for the companies consolidated by equity method due to their small size (in annual revenues and assets). These four companies are considered not to be material (see Note 3.4).

106
2 Auditor’s Report on Eurofins Scientific SE’s Consolidated Financial Statements
Audit report To the Shareholders of Eurofins Scientific SE
Report on the consolidated financial statements We have audited the accompanying consolidated financial statements of Eurofins Scientific SE (the “Company”) and its subsidiaries (together the “Group”), which comprise the consolidated balance sheet as of 31 December 2016, and the related consolidated income statement, statement of comprehensive income, cash flow statement and statement of changes in equity for the year then ended and a summary of significant accounting policies and other explanatory notes. Board of Directors’ responsibility for the consolidated financial statements The Board of Directors is responsible for the preparation and fair presentation of these consolidated financial statements in accordance with International Financial Reporting Standards as adopted by the European Union, and for such internal control as the Board of Directors determines is necessary to enable the preparation of consolidated financial statements that are free from material misstatement, whether due to fraud or error. Responsibility of the “Réviseur d’entreprises agréé” Our responsibility is to express an opinion on these consolidated financial statements based on our audit. We conducted our audit in accordance with International Standards on Auditing as adopted for Luxembourg by the “Commission de Surveillance du Secteur Financier”. Those standards require that we comply with ethical requirements and plan and perform the audit to obtain reasonable assurance about whether the consolidated financial statements are free from material misstatement. An audit involves performing procedures to obtain audit evidence about the amounts and disclosures in the consolidated financial statements. The procedures selected depend on the judgment of the “Réviseur d’entreprises agréé” including the assessment of the risks of material misstatement of the consolidated financial statements, whether due to fraud or error. In making those risk assessments, the “Réviseur d’entreprises agréé” considers internal control relevant to the entity’s preparation and fair presentation of the consolidated financial statements in order to design audit procedures that are appropriate in the circumstances, but not for the purpose of expressing an opinion on the effectiveness of the entity’s internal control. An audit also includes evaluating the appropriateness of accounting policies used and the reasonableness of accounting estimates made by the Board of Directors, as well as evaluating the overall presentation of the consolidated financial statements. We believe that the audit evidence we have obtained is sufficient and appropriate to provide a basis for our audit opinion.
PricewaterhouseCoopers, Société coopérative, 2 rue Gerhard Mercator, B.P. 1443, L-1014 Luxembourg T : +352 494848 1, F : +352 494848 2900, www.pwc.lu
Cabinet de révision agréé. Expert-comptable (autorisation gouvernementale n°10028256) R.C.S. Luxembourg B 65 477 - TVA LU25482518

107
Opinion In our opinion, the consolidated financial statements give a true and fair view of the consolidated financial position of the Group as of 31 December 2016, and of its consolidated financial performance and its consolidated cash flows for the year then ended in accordance with International Financial Reporting Standards as adopted by the European Union. Other information
The Board of Directors is responsible for the other information. The other information comprises the information included in the Management report and the Corporate Governance Statement but does not include the consolidated financial statements and our audit report thereon. Our opinion on the consolidated financial statements does not cover the other information and we do not express any form of assurance conclusion thereon. In connection with our audit of the consolidated financial statements, our responsibility is to read the other information and, in doing so, consider whether the other information is materially inconsistent with the consolidated financial statements or our knowledge obtained in the audit or otherwise appears to be materially misstated. If, based on the work we have performed, we conclude that there is a material misstatement of this other information, we are required to report this fact. We have nothing to report in this regard.
Other matter The Corporate Governance Statement includes information required by Article 68bis paragraph (1) of the law of 19 December 2002 on the commercial and companies register and on the accounting records and annual accounts of undertakings, as amended. Report on other legal and regulatory requirements The Management report is consistent with the consolidated financial statements and has been prepared in accordance with the applicable legal requirements. The information required by Article 68bis paragraph (1) letters c) and d) of the law of 19 December 2002 on the commercial and companies register and on the accounting records and annual accounts of undertakings, as amended and included in the Corporate Governance Statement is consistent with the consolidated financial statements and has been prepared in accordance with applicable legal requirements.
PricewaterhouseCoopers, Société coopérative Luxembourg, 24 February 2017 Represented by Gilles Vanderweyen

108
3 Annual accounts - EUROFINS SCIENTIFIC S.E. Profit and Loss Account January 1, 2016 to December 31, 2016 EUR Thousands Notes 2016 2015
Net turnover 4.1 505 1,078
Other operating income 4.1 725 676
Raw materials and consumables -193 -528
Other external expenses 4.1 -1,924 -1,577
Wages and salaries -199 -193
Social security costs -87 -90
Staff costs 5.2 -286 -283
Value adjustments a) in respect of tangible and intangible fixed assets
2.2 / 2.3 3.1 / 3.2
-133 -134
Other operating expenses -72 -40
Income from participating interests a) derived from affiliated undertakings
4.2 / 3.3
70,050 80,975
Other interest receivable and similar income 4.3 a) derived from affiliated undertakings b) other interest and similar income
2.16
9,143 3,163
2,612 2,116
c) financial instruments 2.13 / 3.12 5,239 5,464
Value adjustments in respect of financial assets and of investments held as current assets
2.4 / 2.6 3.3 / 3.4 / 4.4
506 488
Interest payable and similar expenses 4.5
a) concerning affiliated undertakings b) other interest and similar expenses
2.16
-2 -91,863
-74 -77,648
Tax on profit or loss 2.17 / 4.6 -476 387
Profit or loss for the financial year -5,618 13,512
The accompanying notes form an integral part of the annual accounts.
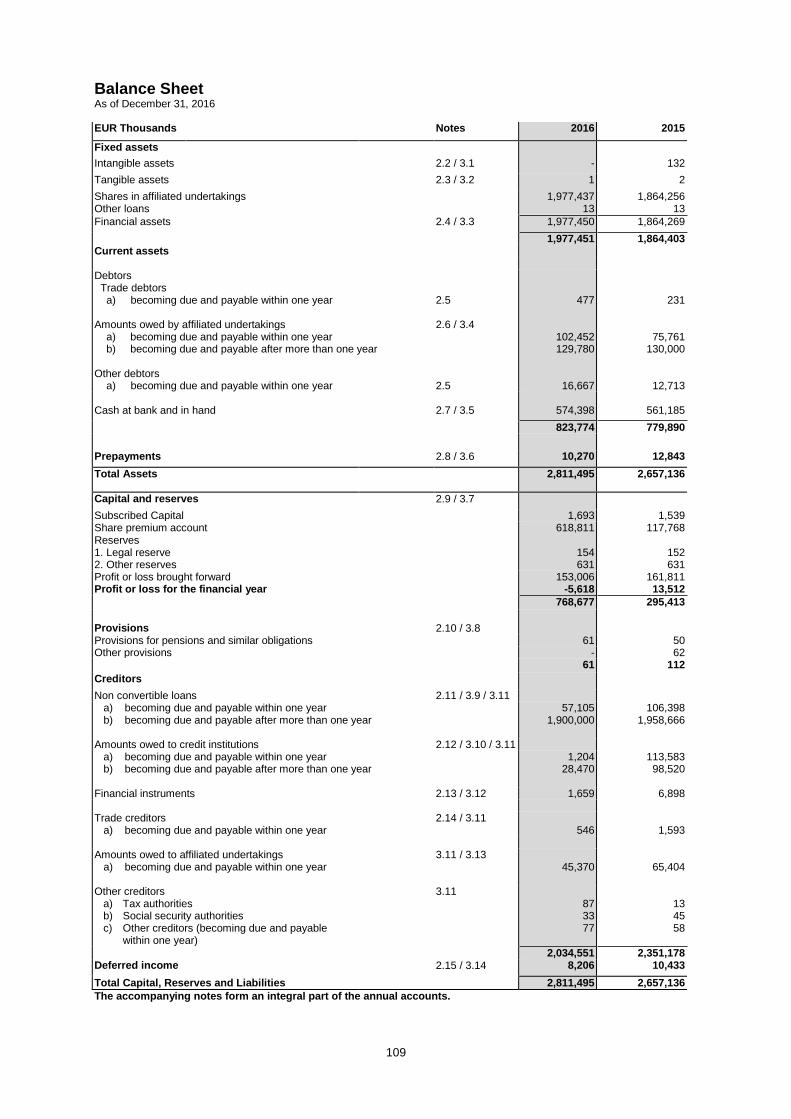
109
Balance Sheet As of December 31, 2016 EUR Thousands Notes 2016 2015
Fixed assets
Intangible assets 2.2 / 3.1 - 132
Tangible assets 2.3 / 3.2 1 2
Shares in affiliated undertakings Other loans
1,977,437 13
1,864,256 13
Financial assets 2.4 / 3.3 1,977,450 1,864,269
1,977,451 1,864,403 Current assets Debtors Trade debtors a) becoming due and payable within one year
2.5
477 231 Amounts owed by affiliated undertakings
a) becoming due and payable within one year b) becoming due and payable after more than one year
2.6 / 3.4
102,452 129,780
75,761 130,000
Other debtors a) becoming due and payable within one year
2.5
16,667 12,713 Cash at bank and in hand 2.7 / 3.5 574,398 561,185
823,774 779,890
Prepayments 2.8 / 3.6 10,270 12,843
Total Assets 2,811,495 2,657,136
Capital and reserves 2.9 / 3.7
Subscribed Capital 1,693 1,539 Share premium account 618,811 117,768 Reserves 1. Legal reserve 2. Other reserves
154 631
152 631
Profit or loss brought forward 153,006 161,811 Profit or loss for the financial year -5,618 13,512
768,677 295,413
Provisions 2.10 / 3.8 Provisions for pensions and similar obligations 61 50 Other provisions - 62 61 112
Creditors
Non convertible loans 2.11 / 3.9 / 3.11 a) becoming due and payable within one year b) becoming due and payable after more than one year
57,105 1,900,000
106,398 1,958,666
Amounts owed to credit institutions 2.12 / 3.10 / 3.11 a) becoming due and payable within one year b) becoming due and payable after more than one year
1,204 28,470
113,583 98,520
Financial instruments 2.13 / 3.12 1,659 6,898 Trade creditors a) becoming due and payable within one year
2.14 / 3.11 546 1,593
Amounts owed to affiliated undertakings a) becoming due and payable within one year
3.11 / 3.13 45,370 65,404
Other creditors a) Tax authorities b) Social security authorities c) Other creditors (becoming due and payable
within one year)
3.11 87 33 77
13 45 58
2,034,551 2,351,178 Deferred income 2.15 / 3.14 8,206 10,433
Total Capital, Reserves and Liabilities 2,811,495 2,657,136
The accompanying notes form an integral part of the annual accounts.

110
Notes to the annual accounts NOTE 1 – GENERAL INFORMATION Eurofins Scientific S.E. (“Eurofins” or the “Company”) is the ultimate parent company of the Eurofins Group (the “Group”) which owns and finances, either directly or indirectly, its subsidiaries throughout the world. Eurofins Scientific S.E. (the “Company”) and its subsidiaries (“Eurofins” or the “Group”) operate in 310 laboratories across 39 countries in Europe, North and South America and Asia-Pacific. Eurofins believes it is the world leader in food, environment and pharmaceutical products testing and that it is also one of the global independent market leaders in certain testing and laboratory services for agroscience, genomics and discovery pharmacology and for supporting clinical studies. In addition, Eurofins is one of the significant emerging players in specialty clinical diagnostic testing in Europe and the USA. Eurofins Scientific S.E. is legally and commercially registered in the Grand Duchy of Luxembourg under the number B 167 775. The Company’s shares are traded on Euronext Paris stock exchange under the ISIN code FR0000038259 (ticker ERF). The Company’s headoffice is located at 23 Val Fleuri, L-1526 Luxembourg, Grand Duchy of Luxembourg. The Company has a French branch located in Nantes, France, registered with the French Register of Commerce under the number RCS B 350 807 947. The main purpose of the branch is the management and administration of French subsidiaries. The notes below are part of the annual accounts for the year closed the December 31, 2016 for a period of twelve months, from January 1, 2016 to December 31, 2016. These annual accounts have been adopted for issue by the Board of Directors on February 23, 2017 and will be submitted to the Shareholder’s Annual General Meeting for approval.
NOTE 2 – SIGNIFICANT ACCOUNTING POLICIES The main valuation rules applied by the Company are set out below. 2.1 – Basis of preparation The annual accounts have been prepared in accordance with Luxembourg legal and regulatory requirements (Luxembourg GAAPs) under the historical cost convention, in particular the law of December 19, 2002 as amended. The principal accounting policies and valuation rules applied in the preparation of these statutory annual accounts are set out below. These policies have been consistently applied to all the years presented, unless otherwise stated. The preparation of annual accounts requires the use of certain critical accounting estimates. It also requires the Board of Directors to exercise its judgement in the process of applying the accounting policies. Changes in the assumptions may have a significant impact on the annual accounts in the period in which the assumptions changed. Management believes that the underlying assumptions are appropriate and that the annual accounts therefore present the financial position and results fairly. The Company makes estimates and assumptions that may affect the reported amounts of assets and liabilities in the next financial years. Estimates and judgments are continually evaluated and are based on historical experience and other factors, including expectations and future events that are believed to be reasonable under the circumstances.
2.2 – Intangible assets Software and patents All capitalised software licenses are purchased externally and are booked at acquisition cost including the expenses incidental thereto or at production cost, less cumulated depreciation amounts written off and value adjustments. These value adjustments are not continued if the reasons for which the value adjustments were made have ceased to apply. Amortisation on intangibles is calculated using the straight line method to write off their cost to their residual values over their estimated useful lives as follows: Software licenses 1-3 years Patents 5 years 5 Goodwill The goodwill corresponds to the value generated by the merger of Eurofins S.A. with Eurofins Scientific S.E. on July 28, 1997 with retroactive effect to January 1, 1997. Following the first application of the Luxembourg GAAPs, goodwill is amortised over an estimated useful life of five years. This goodwill has been rented to the French subsidiary Eurofins Analytics France SAS as from January 1, 2001. 2.3 – Tangible assets Tangible assets are valued at purchase price including the expenses incidental thereto or at production cost. They are depreciated over their estimated useful economic lives. Depreciation on tangible assets is calculated using the straight line method to write off their cost to their residual values over their estimated useful lives as follows: Leasehold improvements 5-10 years * Machinery and laboratory equipments 5 years Office equipment 3 years Vehicles 5 years Office furniture 5 years * with a maximum corresponding to the remaining lease period. Where the Company considers that a tangible asset has suffered a durable depreciation in value, an additional write-down is recorded to reflect this loss. These value adjustments are not continued if the reasons for which the value adjustments were made have ceased to apply. 2.4 – Financial assets Shares in affiliated undertakings Shares in affiliated undertakings are initially recorded at acquisition cost including the expenses incidental thereto and are valued at the lower of acquisition cost or the market value. The market value is determined by the net equity in case of independent operational companies and by a valuation according to the method of discounted cash flows for the holding companies including their subsidiaries. These value adjustments are not continued if the reasons for which the value adjustments were made have ceased to apply. 2.5 – Trade debtors and other debtors Trade debtors and other debtors are valued at their nominal value. They are subject to value adjustments where their recovery is compromised. These value adjustments are not continued if the reasons for which the value adjustments were made have ceased to apply. Trade debtors include the income accrued but not invoiced nor received prior to the closing date.

111
2.6 Amounts owed by affiliated undertakings Amount owed by affiliated undertakings held as loans are valued at purchase nominal value including the expenses incidental thereto. In the case of durable depreciation in value according to the opinion of the Board of Directors, value adjustments are made in respect of financial assets, so that they are valued at the lower figure to be attributed to them at the balance sheet date. These value adjustments are not continued if the reasons for which the value adjustments were made have ceased to apply. 2.7 – Cash at bank and in hand Cash at bank, cash in postal cheque account, cheques and cash in hand are recorded at nominal value. Transferable securities are valued at the lower of purchase price, including expenses incidental thereto and market value in case of quoted instruments, expressed in the currency in which the annual accounts are prepared. A value adjustment is recorded where the market value (final published value in case of quoted instrument) is lower than the purchase price. These value adjustments are not continued if the reasons for which the value adjustments were made have ceased to apply. The market value corresponds to the latest available quote on the valuation day for transferable securities listed on a stock exchange or traded on another regulated market. 2.8 – Prepayments Prepayments are mainly related to financing activities. The costs related to the issuance of the non convertible loans and the amounts owed to credit institutions issued are amortised over the repayment period of each respective loan. The effective financial costs including these expenses correspond to the normal market conditions for companies with a similar risk. 2.9 – Share-based compensation The Company operates a number of equity settled, share-based compensation plans. The proceeds received net of any directly attributable transaction costs are credited to share capital (nominal value) and share premium when the options are exercised. No expense is charged to the profit and loss account over the vesting period. 2.10 – Provisions Provisions for pensions and similar obligations The Company participates in a retirement benefit obligation plan for the French branch as from 2011. The retirement benefit obligations are measured using the aggregate cost method. The provision recognised in the balance sheet is the present value of the defined benefit obligation at the balance sheet date. The Company recognises actuarial gains and losses in the profit or loss account. Other provisions Other provisions are recognised when the Company has a present legal or constructive obligation as a result of past events, it is more likely than not that an outflow of resources will be required to settle the obligation, and the amount has been reliably estimated. 2.11 – Non convertible loans The non convertible loans correspond to two hybrid instruments and three Euro Bonds. They are recorded in the balance sheet at their nominal value increased of interest accruals.
In 2015, the non convertible loans corresponded also to the OBSAAR bonds (French acronym for “Obligations à bons de
souscription et/ou d’acquisition d’actions remboursables”). This instrument has been fully repaid in 2016.
2.12 – Amounts owed to credit institutions Debts are recorded at their reimbursement value. Where the amount repayable on account is greater than the amount received, the difference is shown as an asset and is written off over the period of the debt. 2. 13 – Financial instruments The derivative financial instruments are initially recorded at cost. At each balance sheet date, gains and losses are recognised in the profit or loss account when realised. Unrealised losses are recorded in the profit and loss account of the period. Unrealised gains are not recognised in the profit and loss account of the period. Exposure to currency exchange risk The Company does not hedge its foreign exchange currency exposure, but covers the foreign exchange currency exposure of Eurofins GSC Finance NV (Note 5.3). Exposure to other markets risks The Group uses non-complex or complex derivative instruments in order to hedge its potential exposure to changes in market values of certain underlying assets that may arise in the future. The assets correspond to listed equity derivatives. The Company does not own directly these instruments, but covers the potential exposure to changes in market values of certain underlying assets owned by one of its subsidiaries (Note 5.3). Exposure to interest rate risk In order to hedge the Company’s exposure to interest rate fluctuations particularly related to its 2010 OBSAAR bonds and part of its 2011 Schuldschein loan, the Company has concluded hedging contracts in order to swap its floating interest rate against a fixed rate. These contracts are either with immediate or deferred effect. 2.14 – Trade creditors Trade creditors are valued at their nominal value. Accrued expenses are non-invoiced charges at the closing date but related to the current period. 2.15 – Deferred income Deferred income includes services invoiced during the period, which have not been delivered at the closing date. They are related to contracts for analysis and consultancy spread over several years or covering both periods N and N+1. Deferred income also includes the premium paid by the hybrid instrument holders in July 2014 and amortised until the First Call Date of the hybrid instrument concerned (Note 3.14). 2.16 – Foreign currency translation The Company maintains its books and records in Euro (EUR). Transactions expressed in currencies other than Euro are translated into Euro at the exchange rate effective at the time of the transaction. Cash at bank is translated in Euros at the exchange rate effective at the balance sheet date. Exchange losses and gains are recorded in the profit and loss account of the year. Other assets and liabilities are translated separately respectively at the lower or at the higher of the value converted at the historical rate or the value determined on the basis of the exchange rates effective at the balance sheet date. The
112
unrealised losses are recorded in the profit and loss account of the period whereas gains are accounted for when realised. 2.17 – Income tax The Company Eurofins Scientific S.E. is subject to Luxembourg income taxes. From January 1, 2002, the French branch of Eurofins Scientific S.E. has opted for a tax unity with the French subsidiaries controlled at more than 95% as authorized by article 223 A of the Code Général des Impôts. In the French branch, the income tax for the period recorded in the Income Statement is the sum of:
The income tax expense from the positive tax unity result;
The income tax expense corresponding to an indemnity in case of exit of the tax unity for the tax losses of the subsidiary used during the time of its participation to the tax unity;
And any adjustments in relation to income taxes related to previous periods.
2.18 – Consolidation The Company, as the parent company of the Eurofins Group, prepares consolidated financial statements, which are published in accordance to the provisions of Luxembourg law and IFRS.
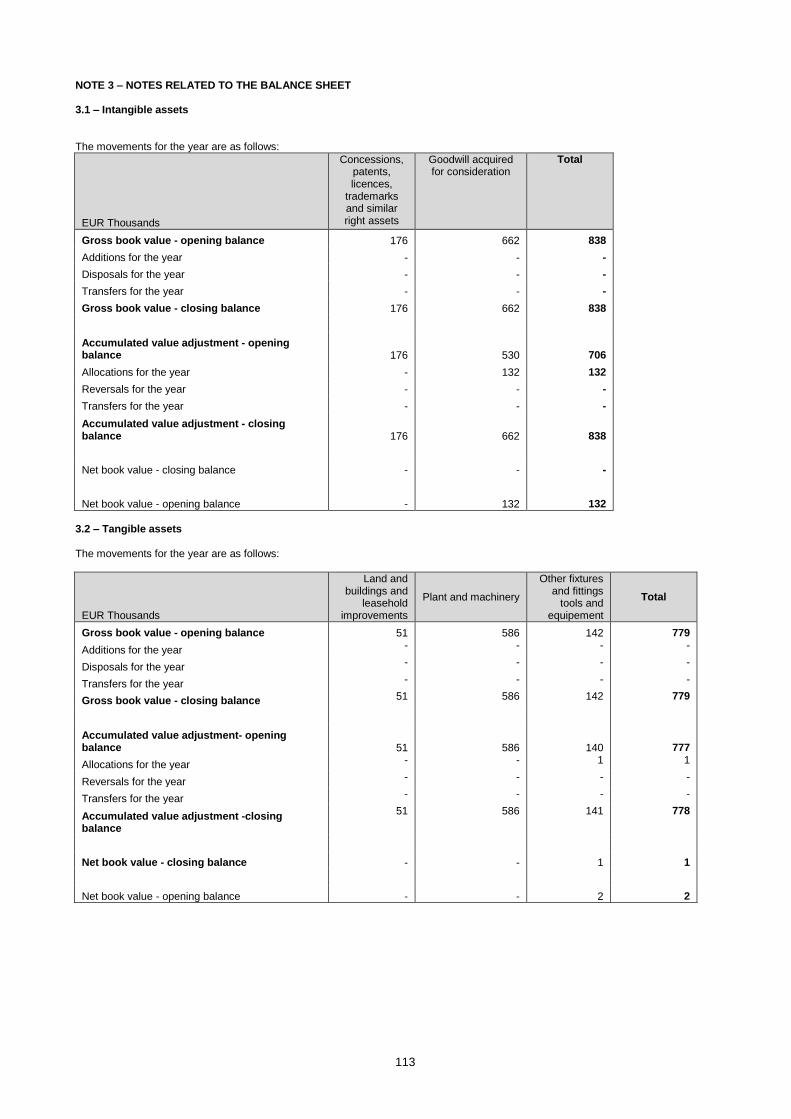
113
NOTE 3 – NOTES RELATED TO THE BALANCE SHEET 3.1 – Intangible assets The movements for the year are as follows:
EUR Thousands
Concessions, patents, licences,
trademarks and similar right assets
Goodwill acquired for consideration
Total
Gross book value - opening balance 176 662 838
Additions for the year - - -
Disposals for the year - - -
Transfers for the year - - -
Gross book value - closing balance 176 662 838
Accumulated value adjustment - opening balance 176 530 706
Allocations for the year - 132 132
Reversals for the year - - -
Transfers for the year - - -
Accumulated value adjustment - closing balance 176 662 838
Net book value - closing balance - - -
Net book value - opening balance - 132 132
3.2 – Tangible assets The movements for the year are as follows:
EUR Thousands
Land and buildings and
leasehold improvements
Plant and machinery
Other fixtures and fittings
tools and equipement
Total
Gross book value - opening balance 51 586 142 779
Additions for the year - - - -
Disposals for the year - - - -
Transfers for the year - - - -
Gross book value - closing balance 51 586 142 779
Accumulated value adjustment- opening balance 51 586 140 777
Allocations for the year - - 1 1
Reversals for the year - - - -
Transfers for the year - - - -
Accumulated value adjustment -closing balance
51 586 141 778
Net book value - closing balance - - 1 1
Net book value - opening balance - - 2 2

114
3.3 – Financial assets
Capital increases were carried out in the following subsidiaries during 2016 by cash contribution: Eurofins GSC Finance NV for EUR 46,850K, Eurofins International Holdings LUX S.à r.l. for EUR 61,000K, Eurofins Product Service GmbH for EUR 2,000K, Eurofins Genomics BV for EUR 3,431K.
Value adjustment: As of December 31, 2016, depreciation on subsidiaries stands at: Eurofins Product Service GmbH for EUR 6,654K (EUR 6,654K as of December 31, 2015), Eurofins 1. Verwaltungsgesellschaft GmbH for EUR 825K (EUR 725K as of December 31, 2015), addition of EUR 100K in 2016.
At the balance sheet date, the Board of Directors has assessed the fair value of those financial assets and has reviewed the value adjustment if necessary. Shares in affiliated undertakings
EUR Thousands Registered office Book value of capital held % of
capital held
Net turnover Result for
the financial year
Net equity
Income from
financial fixed assets
Gross Net (Unaudited) (Unaudited) (Unaudited)
Eurofins 1. Verwaltungsgesellschaft GmbH
Stenzelring 14b, DE-21107 Hamburg
825 - 100 - -443 -334 -
Eurofins Product Service GmbH
Storkower Str. 38c, DE-15526 Reichenwalde
10,420 3,766 100 4,406 9 3,775 -
Eurofins France Holding SAS
Rue Pierre Adolphe Bobierre, 44000 Nantes
178,901 178,901 100 - 33,327 235,607 -
Eurofins GSC Finance NV
Mechelsesteenweg 455, BE-1950 Kraainem
731,379 731,379 100 - 40,158 815,619 15,000
Eurofins Genomics BV Bergschot 71, NL-4817PA Breda
3,431 3,431 100 - 1,879 20,522 2,050
Eurofins International Holdings LUX S.à r.l.
23 Val Fleuri, Grand Duchy of Luxembourg
818,285 818,285 100 - 55,480 929,548 53,000
Eurofins International Support Services LUX S.à r.l.
23 Val Fleuri, Grand Duchy of Luxembourg
13 13 100 - 1,310 2,079 -
Eurofins Clinical Testing Services France LUX S.à r.l.
23 Val Fleuri, Grand Duchy of Luxembourg
241,662 241,662 100 - -115 240,223 -
1,984,916 1,977,437 70,050
The information is based on the Balance Sheet as at December 31, 2016.
EUR Thousands Opening Additions Disposals Closing
Cost Shares in affiliated undertakings 1,871,635 113,281 - 1,984,916 Other financial assets 13 - - 13 Total 1,871,648 113,281 - 1,984,929 Value adjustment (Note 4.4) Shares in affiliated undertakings 7,379 100 - 7,479 Total 7,379 100 - 7,479
Net book value 1,864,269 113,181 - 1,977,450

115
3.4 – Amounts owed by affiliated undertakings
EUR Thousands 2016 2015
Eurofins International Support Services LUX S.à r.l. Eurofins Product Service GmbH Eurofins International Holdings LUX S.à r.l.
23,269
-
-
3,506
3,000
26,000
Eurofins Genomics BV 1,683 - Eurofins GSC Finance NV 9,390 10,743 Eurofins France Holding SAS
38,731 30,300
Eurofins Clinical Testing Services France LUX S.à r.l.
266
106
Direct ownership 73,339 73,655
France Biologie Holding SAS
21,761 -
Other affiliated undertakings 6,220 -
Viralliance Inc. - 4,601
Impairment Viralliance Inc. - -4,601
Indirect ownership 27,981 -
Interests due on these advances
610 1,298
Debtors 522 808
Total short term advances 102,452 75,761
Eurofins France Biologie de Spécialité Holding SAS
109,959
130,000
Other affiliated undertakings 19,821 -
Total medium term advances
129,780 130,000
Total 232,232 205,761
Amounts owed by affiliated undertakings (receivables falling due in one year or less) are mainly related to cash advances to finance intercompany loans to direct or indirect subsidiaries (Eurofins GSC Finance NV) or acquisitions of subsidiaries or dividends to be received for the direct ownership and cash advances for operating purposes (e.g. capex financing) for indirect ownership. The medium term advances to Eurofins France Biologie de Spécialité Holding SAS are due in October 2021 and remunerated at an annual interest rate of 7%. Amounts owed by Viralliance Inc. have been written off in 2016 for an amount of EUR 3,995K as the company Viralliance Inc. has been liquidated (Note 4.4). At the end of December 2015, the amounts owed by Viralliance Inc. were already impaired (EUR 4,601K). 3.5 – Cash at bank and in hand
EUR Thousands 2016 2015
Cash at bank and in hand 574,398 561,185
3.6 – Prepayments 3.6.1 – Prepayments
EUR Thousands 2016 2015
Prepayments 55 5
3.6.2 – Deferred charges
EUR Thousands 2016 2015
Deferred charges 10,215 12,838
EUR Thousands 2016 2015
At beginning of the year Issuance costs Amortisation of deferred charges At end of the year
12,838 293
-2,916 10,215
6,066 9,425
-2,653 12,838
Issuance costs are mainly related to the hybrid instruments and Eurobonds issued in 2013, 2014 and 2015. 3.7 – Capital and reserves The movements for the year are as follows:
EUR Thousands
Subs-cribed capital
Share premium
Legal reserve
Other reserves
Profit brought forward
Profit or loss for
the financial
year
Total
At beginning of the year
1,539 117,768 152 631 161,811 13,512 295,413
Allocation of previous year's profit
- - 2 - 13,510 -13,512 -
Dividend - - - - -22,315 - -22,315
Share capital and share premium increase
154 501,043 - - - - 501,197
Profit or loss for the financial year
- - - - - -5,618 -5,618
At end of the year 1,693 618,811 154 631 153,006 -5,618 768,677
Subscribed capital and share premium increased by EUR 501,197K through: exercise of stock options by employees (129,801
new shares have been issued), 349 new shares issued from exercice of BSAAR, On June 29, 2016, Eurofins has privately placed
606,061 newly-issued shares with La Caisse de dépôt et placement du Québec (“CDPQ”), one of Canada’s largest institutional fund managers, at a subscription price of EUR 330.00 per share, raising EUR 200m of additional cash for the Company.
On September 12, 2016, Eurofins has raised total proceeds of EUR 296m following the issuance of 800,000 new shares to institutional investors, at a price of EUR 370.00 per share.
The net profit of FY2015 (EUR 13,512K) has been allocated as follows: E
UR 2K to legal reserve; E
UR 13,510K as dividends. Additionally, an amount of EUR 8,805K has been taken out of retained earnings in order to distribute a dividend of EUR 1.45 per share for an amount of EUR 22,315K. Retained earnings stand at EUR 153,006K at the end of December 2016. Detail of the Company’s share capital and total number of shares outstanding:
Date Number of Shares
Nominal value (in
EUR)
Share capital
(in EUR)
At beginning of the year
15,389,759
0.10 1,538,975.9
0
Shares issued 1,536,211 0.10 153,621.10
At end of the year 16,925,970
0.10 1,692,597.0
0
Stock option plans Stock options are granted to directors and to employees. Movements in the number of share options outstanding are as follows:

116
Share options 2016 2015
At beginning of the year 794,682 937,200 Options granted * 216,660 95,250 Options exercised -129,081 -177,018 Options expired -45,665 -60,750
At end of the year 835,876 794,682 * Under conditions (strike price, date of exercise, etc.) of new option plans.
As at December 31, 2016, 835,876 stock options awarded are still outstanding. Further details can be found in the “Management Report”. Free shares In accordance with article 8bis of the Company’s articles of association (“capital autorisé”), the Board of Directors decided during meetings held on July 29, 2016 and on August 1
st, 2016, to grant up to 10,481 capital-providing
securities in the form of free shares, conferring the beneficiaries the right to subscribe for one share of the Company subject to the rules of the free share plan as defined by the Board of Directors on July 29, 2016. BSAAR warrants The BSAAR warrants have been mainly subscribed by some business leaders of the Group. Movements in the number of shares to be possibly issued upon exercise of BSAAR warrants are as follows:
In potential new shares 2016 2015
At beginning of the period 8,292 16,586
BSAAR exercised -349 -8,294
BSAAR forfeited - -
At end of the period 7,943 8,292
2014 BSA Leaders Warrants Upon decision and authorization granted by the Board of Directors of June 19, 2014, the Managing Director of the Company following a decision dated of July 1, 2014 has decided to issue up to 117,820 capital-providing securities in the form of stock purchase warrants, conferring 2014 BSA Leaders Warrants’ holders the right to subscribe for one share of the Company for each 2014 BSA Leaders Warrant at a fixed exercise price of EUR 281.58. The subscription price was set at EUR 18.15 per 2014 BSA Leaders Warrant. 2014 BSA Leaders Warrants’ holders will have the option to exercise their 2014 BSA Leaders Warrants at any time starting 4 years from the date of subscription starting July 1, 2018 until June 30, 2022 inclusive. Partial and optional acquisition price payments in Eurofins shares At December 31, 2016, the overall number of Eurofins shares potentially deliverable is estimated at 0 share. Class A beneficiary units Class A beneficiary units, which confer no right to dividends but a right to one vote, are allocated to holders of fully paid-up shares for which proof is provided of registration in the name of the same shareholder for at least three consecutive years as provided for in article 12bis of the Company’s Articles of Association. The total number of Class A beneficiary units have decreased from 6,533,527 as of December 31, 2015 to 6,532,840 as of December 31, 2016. Class B beneficiary units Class B beneficiary units, which confer no right to dividends but a right to one vote, are allocated to holders of fully paid-up shares for which (i) proof is provided of registration in the name of the same shareholder for at least five consecutive years as provided for in article 12ter of the Company’s Articles of Association (ii) request to subscribe class B beneficiary units is sent in writing by the relevant
shareholder to the Company at the latest by June 30, 2021 and (iii) subject to the Company receiving payment of a subscription price of EUR 0.10 per class B beneficiary unit. In June 2016, Analytical Bioventures SCA exercised its right to receive 1,000,000 Class B beneficiary units on the equivalent number of shares out of its 6,400,000 shares registered in a registered account for five consecutive years in the name of the Company’s shareholder Analytical Bioventures SCA for a cash contribution of EUR 100k equivalent to EUR 0.10 (ten euro cents) per beneficiary unit. The total number of Class B beneficiary units amounts to 1,000,000 as of December 31, 2016. Voting rights Voting rights attached to shares are proportional to the capital quota they represent. Each share gives the right to one vote. However as mentioned above, class A and class B beneficiary units (“part bénéficiaire de catégorie A” and “part bénéficiaire de catégorie B”) carrying an extra voting right each can be allotted to fully paid-up shares fulfilling conditions as specified in the last two paragraphs. As at December 31, 2016, a total number of 7,532,840 class A and class B beneficiary units has been issued and the total potential number of voting rights amounts to 24,458,810. Own shares As at December 31, 2016, the Company does not own any of its shares (same as of December 31, 2015). Legal reserves The Company is required to allocate a minimum of 5% of its annual net income to a legal reserve, until this reserve equals to 10% of the subscribed share capital. This reserve may not be distributed. 3.8 – Provisions
EUR Thousands Opening Changes Closing
Retirement benefit obligation 50 11 61
Other provisions 62 -62 -
Total provisions 112 -51 61
3.9 – Non convertible loans OBSAAR bonds
EUR Thousands 2016 2015
Nominal amount (Note 2.11)
- 117,331
Interest due - 41
Total - 117,372
In June 2010, the Company issued OBSAAR bonds (French acronym for “Obligations à bons de souscription et/ou d’acquisition d’actions remboursables”) for a nominal amount of EUR 176m to increase the average maturity of its financial debt and to finance the development of its laboratory network. The principal characteristics of the OBSAAR bonds were as follows: 295,990 Bonds, in denominations of EUR594.60
each; Interest rate: Euribor 3 months + 1.75% p.a. payable
on a quarterly basis; Redemption: in three equal tranches due on June 29,
2015, June 29, 2016 and June 29, 2017; 1 warrant (BSAAR) is attached to each bond
(Obligation), ie. a total of 295,990 warrants, 2 warrants giving the right to subscribe or purchase 1 new or existing Eurofins Scientific S.E. share at a price of EUR40 per share between June 30, 2012 and June 29, 2017. Exercise of the warrants therefore potentially leads to the issue of a maximum of 147,995 new shares, ie. a maximum dilution of 1.04%

117
of the existing number of outstanding shares at the time of the OBSAAR issue.
The bonds are listed on Euronext Paris under ISIN FR0010891770.
In June 2016, the second tranche of EUR 58,665K was repaid. In December 2016, the entire remaining of EUR 58,665K was repaid at par in anticipation. Hybrid instruments
EUR Thousands 2016 2015
Nominal amount (Note 2.11) 600,000 600,000
Interest due 29,171 29,171
Total 629,171 629,171
In January 2013, Eurofins issued a EUR 150m hybrid instrument. In July 2014, Eurofins extended the size of its existing hybrid instrument, bringing the overall size of Eurofins' hybrid instrument up to EUR 300m. In cash terms, the July 2014 transaction raised EUR 169m (EUR 164.2m in gross proceeds plus EUR 4.8m on accrued coupon). The hybrid instrument has a perpetual maturity, but is callable at par by Eurofins in January 2020. It bears a fixed annual coupon of 7.00% for the first seven years until first call, and a coupon of Euribor 3m + 818 bps thereafter if not called. The instrument is listed on the regulated market of the Luxembourg stock exchange (ISIN XS 0881803646).
A distribution on hybrid instrument has been paid of EUR 21m in January 2016 (EUR 300m at 7%) and EUR 14.6m in April 2016 (EUR 300m at 4.875%). In April 2015, Eurofins issued a new EUR 300m hybrid instrument to further strengthen its balance sheet and lengthen its stable financing horizon in a favorable interest rate environment, in order to be able to respond to compelling growth opportunities. The new issue brings Eurofins' total hybrid instrument to EUR 600m. Similar to the existing instrument, the new hybrid has a perpetual maturity, and is accounted for as 100% equity according to International Financial Reporting Standards (IFRS). It is callable at par by Eurofins on the 8th year (ie. on April 29, 2023). The new hybrid instrument bears a fixed annual coupon of 4.875% for the first 8 years until first call, and a coupon of Euribor 3m + 701 bps thereafter if not called. The securities have been listed from their issue date (April 29, 2015) on the regulated market of the Luxembourg stock exchange (ISIN XS1224953882). Euro Bonds
EUR Thousands 2016 2015
Nominal amount (Note 2.11) 1,300,000 1,300,000
Interests due 27,934 18,521
Total 1,327,934 1,318,521
Eurobond November 2018: In November 2013, Eurofins has issued an inaugural senior unsecured Euro bond for a nominal value of EUR 300m. The bonds have a five-year maturity (due November 26, 2018), and pay an annual coupon of 3.125%. The bonds have been listed on the Luxembourg Stock Exchange under ISIN XS0996772876. Eurobond January 2022: In January 2015, Eurofins raised EUR 500m through its second senior unsecured Euro bond public issuance. The bonds have a seven-year maturity (due January 27, 2022) and bear an annual coupon of 2.25% (ACT/ACT). The bonds have been listed from their issue date (January 27,
2015) on the regulated market of the Luxembourg stock exchange (ISIN XS1174211471). Eurobond January 2023: In July 2015, Eurofins raised EUR 500m in its latest senior unsecured Euro bond public issuance. The bonds have a 7.5-year maturity (due January 30, 2023) and bear an annual rate of 3.375% (ACT/ACT). The bonds have been listed from their issue date (July 30, 2015) on the regulated market of the Luxembourg stock exchange (ISIN XS1268496640). The quoted value of the Company’s Eurobonds as at December 31, 2016 is equal to EUR 315m for its Eurobond due in November 2018, to EUR 517.5m for its Eurobond due in January 2022 and to EUR 503.9m for its Eurobond due in January 2023. 3.10 – Amounts owed to credit institutions The amounts owed to credit institutions are detailed as follows:
EUR Thousands 2016 2015
Borrowings (Note 2.12) 28,648 36,656 Loans and interests due 792 173,658 Bank overdrafts 234 1,789
Total 29,674 212,103
At the end of July 2011 Eurofins concluded a EUR 170m Schuldschein loan (“Certificate of Indebtedness”). The loan carried bullet maturities of 5 and 7 years, with interest rates based on Euribor 6 months (variable tranches) or 5 and 7 years mid-swap rates (fixed tranches) and a margin of 1.80% p.a. or 2.20% p.a. respectively. In July 2016, the entire nominal amount of the Schuldschein loan of EUR 170,000K has been repaid. In 2016, Eurofins used credit lines in US Dollars with one bank for an amount of EUR 28,470K. 3.11 – Maturity of creditors
EUR Thousands Total Less than 1
year
From 1 to 5
years
More than 5 years
Hybrid instruments 629,171 29,171
- 600,000
Euro Bonds 1,327,934 27,934
300,000 1,000,000
Borrowings 28,648 178 28,470 - Loans and interests due
792 792 - -
Bank overdrafts 234 234 - - Trade creditors 546 546 - - Amounts owed to affiliated undertakings
45,370 45,370
- -
Creditors for tax 87 87 - - Creditors for social security
33 33 - -
Other creditors 77 77 - -
Total 2,032,893 104,423 328,470 1,600,000
3.12 – Financial instruments
EUR Thousands 2016 2015
Financial instruments 1,659 6,898
The nominal value hedged by the interest rate hedging contracts amounts to EUR 60m as at December 31, 2016. In addition, the Company concluded interest rate hedging contracts with deferred effective date for the period December 2016 to July 2018 for a total nominal amount comprised between EUR 10m and EUR 60m.

118
The fair value as at December 31, 2016 of these swap contracts is estimated at a loss of EUR 1,659K. The change in the fair value of the instrument of EUR 5.239K between 2015 and 2016 has been recognised in the profit and loss account in 2016. 3.13 - Amounts owed to affiliated undertakings
EUR Thousands 2016 2015
Eurofins NSC Finance France SAS MWG Biotech AG Eurofins International Support Services LUX S.à r.l. Eurofins Hygiene Alimentaire France Holding SAS (cash pooling)
30,697 -
716
-
- 16,150 11,089
28,912
Total short term loans 31,413 56,151
Net amount due under the French Tax unity 13,843 8,685
Creditors 114 568
Total 45,370 65,404
Amounts owed to affiliated undertakings (payable falling due in one year or less) were mainly related to the cash pooling agreement in France with Eurofins Hygiène Alimentaire France Holding SAS and related loans with/from subsidiaries. In 2016, Eurofins Scientific SE terminated this cash pooling agreement and a new treasury convention was implemented between Eurofins NSC Finance France SAS and other Group affiliates in France. 3.14 – Deferred income
EUR Thousands 2016 2015
Deferred income 322 -
Premium received on hybrid instrument 7,874 10,433
Total 8,206 10,433
EUR Thousands 2016 2015
Premium received Amortisation At end of the year
10,433 -2,559 7,874
12,986 -2,553 10,433
The premium paid by the holders of the hybrid instrument issued in July 2014 is amortised straight-line until the call date in January 2020. NOTE 4 - NOTES RELATED TO THE INCOME STATEMENT 4.1 – Net turnover, other operating income and other external expenses Net turnover is mainly generated by the sale of SNIF-NMR systems (Site-Specific Natural Isotope Fractionation-Nuclear Magnetic Resonance). Other operating income relates to lease revenues to Eurofins Analytics France SAS and invoices for Group Support Services to Eurofins subsidiaries or Group Service Companies. Other external expenses related mainly to Group Support Services costs invoiced by Group Service Companies, audit, legal and bank fees. 4.2 – Income from participating interests Income from participating interests comes from dividends received from the Company’s subsidiaries and gain on sale of Shares in affiliated undertakings (Note 3.3).
EUR Thousands 2016 2015
Dividends 70,050 79,350 Gain on sale of Shares - 1,625
Total 70,050 80,975
4.3 – Other interest receivable and similar income
EUR Thousands 2016 2015
Interests derived from affiliated undertakings (Note 3.4)
9,143
2,612
Other interests and financial income
3,163 2,116
Financial instruments (Note 3.12) 5,239 5,464
Total 17,545 10,192
Other interests and financial income have been generated by gains from transferable securities (EUR 836K) and foreign exchange gains (EUR 2.327K). 4.4 – Value adjustments in respect of financial assets and of investments held as current assets Value adjustments in respect of financial assets and of investments held as current assets are composed of:
EUR Thousands 2016 2015
Value adjustments of shares in affiliated undertakings (Note 3.3)
-100 988
Value adjustments of amounts owed by affiliated undertakings (Note 3.4)
606 -500
Total 506 488
4.5 – Interest payable and similar expenses The interest payable and similar expenses are composed of:
EUR Thousands 2016 2015
Interest paid to affiliated undertakings
2 74
Interest expenses on borrowings 2,274 1,821 Bonds interests 42,765 33,667 Schuldschein interest expense 5,550 8,302 Additional Schuldschein interest due to early repayment
5,267 -
Hybrid instruments expenses 33,066 28,402 Short term interests 15 16 Net foreign exchange loss 2 2,781 Financial expense on pension 8 7 Amortisation of deferred charges (Note 3.6)
2,916 2,652
Total 91,865 77,722
In 2015, the net foreign exchange loss was mainly related to loans in US dollars with the strong increase of the US Dollar against Euro. In 2016, the increase in bonds interests and hybrid instruments expenses is mainly due to the full-year impact of coupons carried by non convertible loans issued in 2015 in preparation for future acquisitions as part of the Company’s 2020 development plan. 4.6 – Tax on profit or loss In 2016, the tax expense amounts to EUR 476K. The 2016 Luxembourg taxable result for Eurofins Scientific S.E. is a loss of EUR 30 million. By the end of the year, the Company holds a tax loss to be carried forward of over EUR 54 million in Luxembourg.

119
Income taxes are due for an amount EUR 0.1m in 2016 in the French tax unity which is headed by the French branch of the Company. As of December 31, 2016, the French tax unity headed by the French branch of the Company holds a tax loss to be carried forward of over EUR 105 million. NOTE 5 – OTHER INFORMATION 5.1 – Related-party transactions The Company is controlled by the company Analytical Bioventures SCA, the holding company of the Martin family. This company owns 37.8% of the Company’s shares and controls 56.4% of its voting rights as of December 31, 2016. Transactions with subsidiaries or with companies owning shares in Eurofins Group such as Analytical Bioventures SCA or with companies in which some members of the Company’s top management have significant influence such as “International Assets Finance S.à r.l.”, a subsidiary of Analytical Bioventures SCA, are not significant at the level of Eurofins Scientific S.E. 5.2 – Personnel 5.2.1 – Weighted average Full Time Equivalent (FTE) At the end of December 2016, the weighted average FTE stands at 2, same as last year.
2016 2015
Executive * 2 2
Total 2 2 * Employee numbers are weighted average “Full time equivalents” (FTE) during the period.
5.2.2 – Key management compensation of the Board of Directors The aggregate compensation (including benefits) granted by the Company to the Board of Directors amounted to EUR 90K for the year 2016 (EUR 52K for the year 2015). 5.3 – Off-balance sheet commitments 5.3.1 – Detail of guarantees given related to financing
EUR Thousands 2016 2015
OBSAAR Bonds secured by covenants
- 117,331
Amounts owed to credit institutions
28,470 36,520
Schuldschein loan secured by covenants
- 170,000
Total 28,470 323,851
EUR Thousands 12/2016 12/2015
Guarantees given related to the financing of subsidiaries
108,489 67,789
The Company has signed an intercompany foreign
currency hedge agreement with its indirect subsidiary Eurofins GSC Finance NV to cover any foreign exchange impact relating to granting loans in
currencies other than Euro to any Group affiliates.The impact of this agreement is an unrealised exchange gain of EUR 72,892K for Eurofins Scientific S.E. At December 31, 2016, it is not recognised in the profit and loss account in accordance with the Company’s accounting principles.
The Company has signed an intercompany hedge
agreement with one of its indirect subsidiaries to cover any marked to market value fluctuations and foreign exchange impact relating to an equity swap instrument in foreign currency. The impact of this agreement is an unrealised gain of EUR 19,869K for Eurofins Scientific S.E. As at December 31, 2016, it is not recognised in the profit and loss account in accordance with the Company’s accounting principles.
The Company has counter-guaranteed the Swedish
insurance company "Försäkringsbolaget Pensionsgaranti" for all amounts due that this company should have to pay to the current and past employees of the Swedish companies, indirect subsidiaries of Eurofins Scientific S.E., for their pension obligations, for a maximum amount of EUR 14,528K.
In the context of a grant of £1,922K provided by
Advantage West Midlands, now managed directly by the Department for Business, Innovation and Skills (a British Government agency), the Company has guaranteed by a comfort letter to provide the company Eurofins Food Testing UK Limited with the cash required to allow it to fulfill its obligations and ensure the payment of all amounts due by Eurofins Food Testing UK Limited in execution of its commitments in relation to the grant offer. This guarantee has expired in 2016.
In the scope of a EUR 1,200K grant contract obtained
in 2008 by Microchem Laboratories Ltd, the Company gave its guarantee to the Irish governmental agency which provided the grant that it will be liable in case of Microchem Laboratories Ltd failure to meet its contingencies related to this grant.
EUR Thousands 12/2016 12/2015
Guarantees given related to acquisitions
1,606 3,100
In an agreement signed between the companies
Eurofins Genomics BV and MWG Biotech AG, a guarantee was granted by the Company to the benefit of Eurofins Genomics BV, guaranteeing that Eurofins Genomics BV will at all times be in a position to timely meet its obligations towards the MWG Biotech AG minority interests under the “control and profit transfer” i.e. to pay : o A consideration “Abfindung” within the meaning of
sec. 305 of the German Stock Corporation Act (“AktG”)
o A compensation “Ausgleich” within the meaning of sec. 304 of the “AktG”.
5.3.2 – Detail of guarantees received None. 5.4 – Post-closing events None.

120
4 Auditor’s Report on Eurofins Scientific SE’s Annual Accounts
Audit report To the Shareholders of Eurofins Scientific SE
Report on the annual accounts We have audited the accompanying annual accounts of Eurofins Scientific SE, which comprise the balance sheet as at 31 December 2016, the profit and loss account for the year then ended and a summary of significant accounting policies and other explanatory information. Board of Directors’ responsibility for the annual accounts The Board of Directors is responsible for the preparation and fair presentation of these annual accounts in accordance with Luxembourg legal and regulatory requirements relating to the preparation of the annual accounts, and for such internal control as the Board of Directors determines is necessary to enable the preparation of annual accounts that are free from material misstatement, whether due to fraud or error. Responsibility of the “Réviseur d’entreprises agréé” Our responsibility is to express an opinion on these annual accounts based on our audit. We conducted our audit in accordance with International Standards on Auditing as adopted for Luxembourg by the “Commission de Surveillance du Secteur Financier”. Those standards require that we comply with ethical requirements and plan and perform the audit to obtain reasonable assurance about whether the annual accounts are free from material misstatement. An audit involves performing procedures to obtain audit evidence about the amounts and disclosures in the annual accounts. The procedures selected depend on the judgment of the “Réviseur d’entreprises agréé”, including the assessment of the risks of material misstatement of the annual accounts, whether due to fraud or error. In making those risk assessments, the “Réviseur d’entreprises agréé” considers internal control relevant to the entity’s preparation and fair presentation of the annual accounts in order to design audit procedures that are appropriate in the circumstances, but not for the purpose of expressing an opinion on the effectiveness of the entity’s internal control. An audit also includes evaluating the appropriateness of accounting policies used and the reasonableness of accounting estimates made by the Board of Directors, as well as evaluating the overall presentation of the annual accounts. We believe that the audit evidence we have obtained is sufficient and appropriate to provide a basis for our audit opinion.
PricewaterhouseCoopers, Société coopérative, 2 rue Gerhard Mercator, B.P. 1443, L-1014 Luxembourg T : +352 494848 1, F :+352 494848 2900, www.pwc.lu
Cabinet de révision agréé. Expert-comptable (autorisation gouvernementale n°10028256) R.C.S. Luxembourg B 65 477 - TVA LU25482518

121
Opinion In our opinion, the annual accounts give a true and fair view of the financial position of Eurofins Scientific SE as of 31 December 2016, and of the results of its operations for the year then ended in accordance with Luxembourg legal and regulatory requirements relating to the preparation of the annual accounts. PricewaterhouseCoopers, Société coopérative Luxembourg, 24 February 2017 Represented by Gilles Vanderweyen