Embed Size (px)
Citation preview

Bank Name * UK - Royal Bank of Scotland Group plc
LEI Code 2138005O9XJIJN4JPN90
UK
(*) On 21 November 2014, the Royal Bank of Scotland Group plc ("RBS") updated some components of the results of the 2014
EU wide stress test. In particular, RBS recognised an error in its calculation of the modelled Common Equity Tier 1 ratio
(“CET1”) originally published on 26 October 2014. In its calculations, RBS had correctly recognised tax relief on the theoretical
stress losses incurred during the 2014-16 period. However, RBS modelled capital deduction for its Deferred Tax Assets did not
adequately reflect these cumulative tax credits in the capital template. In addition, RBS made a small number of immaterial
adjustments to its capital and RWA templates. Consequently, using the UK Prudential Regulation Authority’s capital definitions,
which do not allow any recognition of Deferred Tax Assets within CET1, RBS’s full year 2016 CET1 under the modelled adverse
scenario reduces by approximately 100 bps to 5.7% CET1 from 6.7% CET1.
NUK_WL_NR_XX
version
1809014
No restructuring
2014 EU-wide Stress Test
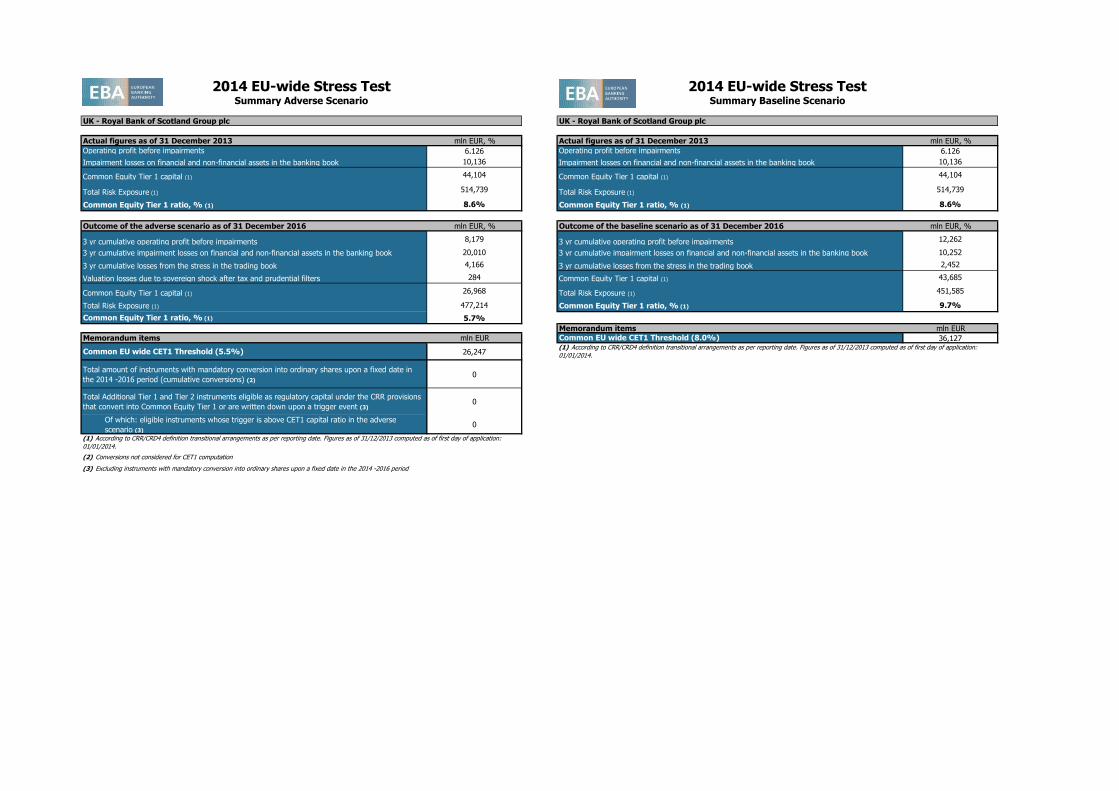
Actual figures as of 31 December 2013 mln EUR, % Actual figures as of 31 December 2013 mln EUR, %
Operating profit before impairments 6,126 Operating profit before impairments 6,126
Impairment losses on financial and non-financial assets in the banking book 10,136 Impairment losses on financial and non-financial assets in the banking book 10,136
Common Equity Tier 1 capital (1) 44,104 Common Equity Tier 1 capital (1) 44,104
Total Risk Exposure (1) 514,739 Total Risk Exposure (1) 514,739
Common Equity Tier 1 ratio, % (1) 8.6% Common Equity Tier 1 ratio, % (1) 8.6%
Outcome of the adverse scenario as of 31 December 2016 mln EUR, % Outcome of the baseline scenario as of 31 December 2016 mln EUR, %
3 yr cumulative operating profit before impairments 8,179 3 yr cumulative operating profit before impairments 12,262
3 yr cumulative impairment losses on financial and non-financial assets in the banking book 20,010 3 yr cumulative impairment losses on financial and non-financial assets in the banking book 10,252
3 yr cumulative losses from the stress in the trading book 4,166 3 yr cumulative losses from the stress in the trading book 2,452
Valuation losses due to sovereign shock after tax and prudential filters 284 Common Equity Tier 1 capital (1) 43,685
Common Equity Tier 1 capital (1) 26,968 Total Risk Exposure (1) 451,585
Total Risk Exposure (1) 477,214 Common Equity Tier 1 ratio, % (1) 9.7%
Common Equity Tier 1 ratio, % (1) 5.7%
Memorandum items mln EUR
Memorandum items mln EUR Common EU wide CET1 Threshold (8.0%) 36,127
Common EU wide CET1 Threshold (5.5%) 26,247
Total amount of instruments with mandatory conversion into ordinary shares upon a fixed date in
the 2014 -2016 period (cumulative conversions) (2)0
Total Additional Tier 1 and Tier 2 instruments eligible as regulatory capital under the CRR provisions
that convert into Common Equity Tier 1 or are written down upon a trigger event (3)0
Of which: eligible instruments whose trigger is above CET1 capital ratio in the adverse
scenario (3)0
(2) Conversions not considered for CET1 computation
(3) Excluding instruments with mandatory conversion into ordinary shares upon a fixed date in the 2014 -2016 period
(1) According to CRR/CRD4 definition transitional arrangements as per reporting date. Figures as of 31/12/2013 computed as of first day of application:
01/01/2014.
2014 EU-wide Stress Test 2014 EU-wide Stress TestSummary Baseline Scenario
UK - Royal Bank of Scotland Group plc
(1) According to CRR/CRD4 definition transitional arrangements as per reporting date. Figures as of 31/12/2013 computed as of first day of application:
01/01/2014.
Summary Adverse Scenario
UK - Royal Bank of Scotland Group plc
2014 EU-wide Stress TestCredit Risk
(mln EUR, %)
Non-defaulted Defaulted Non-defaulted Defaulted Non-defaulted Defaulted Non-defaulted Defaulted Non-defaulted Defaulted Non-defaulted Defaulted Non-defaulted Defaulted Non-defaulted Defaulted Non-defaulted Defaulted Impairment
rate
Stock of
Provisions
Coverage Ratio -
Default Stock
Impairment
rate
Stock of
Provisions
Coverage
Ratio - Default
Stock
Impairment
rate
Stock of
Provisions
Coverage
Ratio - Default
Stock
Impairment rateStock of
Provisions
Coverage
Ratio - Default
Stock
Impairment
rate
Stock of
Provisions
Coverage
Ratio - Default
Stock
Impairment
rate
Stock of
Provisions
Coverage
Ratio - Default
Stock
Central banks and central governments 0 0 68,217 0 88,886 0 0 0 5,490 0 98 0 0 0 14 0 1 0 0.00% 22 14.65% 0.00% 28 21.49% 0.00% 35 24.31% 0.01% 37 21.75% 0.02% 74 26.79% 0.02% 98 34.74%
Institutions 0 0 45,676 83 3,603 0 0 0 13,776 0 1,211 0 0 0 34 34 0 0 0.05% 125 35.97% 0.05% 151 35.48% 0.05% 173 35.83% 0.08% 141 32.75% 0.20% 239 32.25% 0.11% 291 38.14%
Corporates 0 0 230,720 24,947 100,018 13,824 0 0 136,779 43 94,708 969 0 0 1,112 22,851 130 0 0.70% 27,691 51.26% 0.51% 29,149 52.92% 0.37% 30,157 53.13% 1.03% 29,172 50.37% 1.49% 33,944 51.68% 0.95% 36,677 53.71%
Corporates - Of Which: Specialised Lending 0 0 0 0 34,062 13,144 0 0 0 0 34,611 0 0 0 405 6,260 0 0 1.37% 7,552 44.62% 0.77% 7,796 45.28% 0.57% 7,972 45.06% 2.13% 8,121 45.15% 2.03% 9,128 46.40% 1.26% 9,622 47.12%
Corporates - Of Which: SME 0 0 42,485 7,370 372 0 0 0 24,899 0 373 0 0 0 242 4,506 0 0 0.86% 5,380 54.11% 0.54% 5,600 54.16% 0.45% 5,781 53.17% 1.20% 5,543 52.38% 1.74% 6,263 50.65% 1.46% 6,834 50.87%
Retail 0 0 194,242 12,219 59,444 768 0 0 53,492 8,916 34,015 848 0 0 1,410 4,178 180 109 0.51% 7,759 31.27% 0.49% 8,814 34.89% 0.36% 9,562 36.72% 0.68% 8,314 32.06% 0.96% 10,538 36.54% 0.87% 12,425 39.91%
Retail - Secured on real estate property 0.0% 0 0 146,832 7,080 42,069 655 0 0 30,215 6,478 21,287 710 0 0 678 1,262 107 99 0.23% 2,710 16.19% 0.21% 3,062 18.76% 0.10% 3,217 19.51% 0.36% 3,063 17.97% 0.51% 4,059 22.39% 0.37% 4,741 24.68%
Retail - Secured on real estate property - Of
Which: SME0.0% 0 0 0 0 0 0 0 0 0 0 0 0 0 0 0 0 0 0 - 0 5.77% - 0 5.77% - 0 5.77% - 0 5.77% - 0 5.77% - 0 5.77%
Retail - Secured on real estate property - Of
Which: non-SME68.0% 0 0 146,832 7,080 42,069 655 0 0 30,215 6,478 21,287 710 0 0 678 1,262 107 99 0.23% 2,710 16.19% 0.21% 3,062 18.76% 0.10% 3,217 19.51% 0.36% 3,063 17.97% 0.51% 4,059 22.39% 0.37% 4,741 24.68%
Retail - Qualifying Revolving 0 0 30,354 1,101 1,464 16 0 0 10,280 533 1,098 23 0 0 400 713 39 0 1.48% 1,705 52.26% 1.35% 2,104 59.71% 1.20% 2,448 63.71% 1.96% 1,852 53.27% 2.67% 2,630 63.74% 3.09% 3,494 71.16%
Retail - Other Retail 0 0 17,056 4,038 15,911 97 0 0 12,998 1,905 11,630 114 0 0 331 2,203 35 10 1.16% 3,344 55.21% 1.29% 3,649 58.20% 1.17% 3,897 59.71% 1.33% 3,399 53.88% 1.93% 3,849 54.93% 1.65% 4,190 56.88%
Retail - Other Retail - Of Which: SME 0 0 11,464 2,158 2,644 30 0 0 7,177 920 1,994 43 0 0 167 979 0 0 1.15% 1,530 47.82% 0.90% 1,652 48.74% 0.79% 1,757 48.97% 1.49% 1,574 46.12% 1.70% 1,799 45.04% 1.45% 1,984 45.81%
Retail - Other Retail - Of Which: non-SME 0 0 5,592 1,880 13,267 67 0 0 5,821 985 9,636 71 0 0 165 1,224 35 10 1.16% 1,814 63.52% 1.79% 1,997 69.13% 1.78% 2,140 72.51% 1.22% 1,824 63.10% 2.23% 2,051 67.89% 1.96% 2,206 72.45%
Equity 1,961 28 238 0 0 0 3,416 0 748 0 0 0 25 21 0 0 1 1 1.54% 80 25.78% 2.05% 105 65.24% 1.93% 125 89.42% 1.87% 86 26.90% 3.34% 126 62.40% 2.81% 154 84.67%
Securitisation 26,137 4 0 0 0 0 5,492 3 0 0 0 0 0 0 0 0 0 0
Other non-credit obligation assets 0 0 7,220 4 14,353 0 0 0 4,680 3 11,232 0 0 0 0 0 0 0
TOTAL 28,098 32 546,314 37,253 266,304 14,592 8,908 3 214,964 8,962 141,264 1,816 25 21 2,569 27,063 311 110 0.46% 35,678 45.62% 0.37% 38,248 47.73% 0.27% 40,052 48.36% 0.66% 37,751 45.21% 0.92% 44,921 47.29% 0.66% 49,645 49.58%
Securitisation and re-securitisations positions deducted from capital * 0 0 1,011 0 783 0 0 0 0 0 0 0
(mln EUR, %)Non-defaulted Defaulted Non-defaulted Defaulted Non-defaulted Defaulted Non-defaulted Defaulted Non-defaulted Defaulted Non-defaulted Defaulted Non-defaulted Defaulted Non-defaulted Defaulted Non-defaulted Defaulted
Impairment
rate
Stock of
Provisions
Coverage Ratio -
Default Stock
Impairment
rate
Stock of
Provisions
Coverage
Ratio - Default
Stock
Impairment
rate
Stock of
Provisions
Coverage
Ratio - Default
Stock
Impairment rateStock of
Provisions
Coverage
Ratio - Default
Stock
Impairment
rate
Stock of
Provisions
Coverage
Ratio - Default
Stock
Impairment
rate
Stock of
Provisions
Coverage
Ratio - Default
Stock
Central banks and central governments 0 0 1,060 0 77,695 0 0 0 160 0 8 0 0 0 0 0 0 0 0.00% 1 20.00% 0.00% 3 26.67% 0.00% 4 30.00% 0.01% 6 101.09% 0.01% 12 134.80% 0.01% 18 151.67%
Institutions 0 0 5,678 0 214 0 0 0 1,376 0 63 0 0 0 1 0 0 0 0.01% 3 17.06% 0.01% 4 22.73% 0.01% 6 25.32% 0.01% 3 17.09% 0.01% 6 21.37% 0.01% 8 25.53%
Corporates 0 0 103,202 6,833 30,659 8,847 0 0 59,422 26 29,007 166 0 0 544 7,549 0 0 0.64% 9,778 43.32% 0.39% 10,310 43.59% 0.33% 10,754 42.89% 0.95% 10,496 42.88% 1.42% 12,725 43.17% 1.14% 14,303 44.26%
Corporates - Of Which: Specialised Lending 0 0 0 0 21,290 8,722 0 0 0 0 22,856 0 0 0 244 4,078 0 0 0.99% 4,932 45.72% 0.51% 5,042 45.93% 0.38% 5,123 45.46% 1.48% 5,295 46.44% 1.45% 5,902 47.02% 1.12% 6,226 47.27%
Corporates - Of Which: SME 0 0 38,419 3,089 363 0 0 0 20,793 0 364 0 0 0 177 1,530 0 0 0.59% 2,161 41.71% 0.40% 2,313 41.65% 0.35% 2,446 40.66% 0.88% 2,288 39.98% 1.58% 2,894 39.26% 1.36% 3,387 40.65%
Retail 0 0 175,093 7,615 15,175 258 0 0 35,486 5,518 8,294 283 0 0 810 2,690 0 0 0.46% 4,830 32.44% 0.39% 5,555 33.83% 0.34% 6,187 34.67% 0.56% 5,055 32.87% 0.75% 6,550 34.39% 0.80% 8,108 36.92%
Retail - Secured on real estate property 0.0% 0 0 129,425 3,047 10,551 212 0 0 13,646 3,616 4,828 219 0 0 152 136 0 0 0.10% 447 5.26% 0.08% 558 6.27% 0.06% 644 6.81% 0.16% 554 7.03% 0.26% 1,133 12.38% 0.28% 1,798 17.03%
Retail - Secured on real estate property - Of
Which: SME0.0% 0 0 0 0 0 0 0 0 0 0 0 0 0 0 0 0 0 0 - 0 5.77% - 0 5.77% - 0 5.77% - 0 5.77% - 0 5.77% - 0 5.77%
Retail - Secured on real estate property - Of
Which: non-SME63.0% 0 0 129,425 3,047 10,551 212 0 0 13,646 3,616 4,828 219 0 0 152 136 0 0 0.10% 447 5.26% 0.08% 558 6.27% 0.06% 644 6.81% 0.16% 554 7.03% 0.26% 1,133 12.38% 0.28% 1,798 17.03%
Retail - Qualifying Revolving 0 0 29,452 1,055 0 0 0 0 9,754 519 0 0 0 0 372 682 0 0 1.45% 1,561 53.62% 1.29% 1,926 58.70% 1.16% 2,250 61.76% 1.72% 1,636 52.12% 2.37% 2,180 55.67% 2.82% 2,766 58.11%
Retail - Other Retail 0 0 16,216 3,513 4,623 45 0 0 12,086 1,384 3,466 64 0 0 286 1,871 0 0 1.50% 2,822 55.40% 1.25% 3,071 56.75% 1.13% 3,293 57.36% 1.72% 2,866 54.07% 1.90% 3,238 53.44% 1.61% 3,545 54.46%
Retail - Other Retail - Of Which: SME 0 0 10,849 1,766 2,085 24 0 0 6,512 431 1,564 35 0 0 133 734 0 0 1.00% 1,207 45.31% 0.81% 1,307 46.13% 0.72% 1,395 46.33% 1.30% 1,243 43.62% 1.56% 1,432 42.44% 1.37% 1,592 43.21%
Retail - Other Retail - Of Which: non-SME 0 0 5,367 1,747 2,538 21 0 0 5,574 953 1,902 29 0 0 153 1,138 0 0 2.31% 1,616 66.24% 1.97% 1,764 68.19% 1.82% 1,898 69.29% 2.40% 1,622 66.02% 2.45% 1,806 67.12% 2.01% 1,952 69.05%
Equity 535 9 0 0 0 0 1,565 0 0 0 0 0 14 5 0 0 0 0 1.96% 31 54.70% 1.77% 41 65.27% 1.76% 49 70.62% 2.44% 34 53.24% 3.51% 52 60.19% 2.93% 66 69.65%
Securitisation 8,549 0 0 0 0 0 2,982 0 0 0 0 0 0 0 0 0 0 0
Other non-credit obligation assets 0 0 5,477 4 10,258 0 0 0 3,762 3 6,919 0 0 0 0 0 0 0
TOTAL 9,085 9 290,511 14,451 134,000 9,105 4,546 0 100,207 5,548 44,291 449 14 5 1,355 10,239 0 0 0.42% 14,643 39.33% 0.31% 15,912 39.85% 0.27% 17,000 39.67% 0.57% 15,594 39.32% 0.81% 19,345 39.94% 0.74% 22,503 41.46%
Securitisation and re-securitisations positions deducted from capital * 0 0 55 0 0 0 0 0 0 0 0 0
(mln EUR, %)Non-defaulted Defaulted Non-defaulted Defaulted Non-defaulted Defaulted Non-defaulted Defaulted Non-defaulted Defaulted Non-defaulted Defaulted Non-defaulted Defaulted Non-defaulted Defaulted Non-defaulted Defaulted
Impairment
rate
Stock of
Provisions
Coverage Ratio -
Default Stock
Impairment
rate
Stock of
Provisions
Coverage
Ratio - Default
Stock
Impairment
rate
Stock of
Provisions
Coverage
Ratio - Default
Stock
Impairment rateStock of
Provisions
Coverage
Ratio - Default
Stock
Impairment
rate
Stock of
Provisions
Coverage
Ratio - Default
Stock
Impairment
rate
Stock of
Provisions
Coverage
Ratio - Default
Stock
Central banks and central governments 0 0 29,195 0 7,567 0 0 0 1,029 0 19 0 0 0 2 0 1 0 0.00% 3 5.73% 0.00% 3 22.42% 0.00% 3 31.09% 0.00% 3 11.79% 0.00% 3 23.93% 0.00% 3 30.38%
Institutions 0 0 3,122 0 497 0 0 0 853 0 307 0 0 0 1 0 0 0 0.01% 1 4.11% 0.01% 2 5.94% 0.01% 2 7.18% 0.01% 1 4.22% 0.01% 2 5.94% 0.01% 2 7.40%
Corporates 0 0 31,655 153 44,142 664 0 0 14,729 0 38,409 533 0 0 60 145 128 0 0.19% 317 27.93% 0.15% 369 29.47% 0.13% 414 30.23% 0.23% 333 28.12% 0.29% 436 30.99% 0.26% 527 33.67%
Corporates - Of Which: Specialised Lending 0 0 0 0 1,027 292 0 0 0 0 934 0 0 0 10 89 0 0 0.99% 143 36.11% 0.29% 146 38.31% 0.23% 148 38.47% 1.24% 146 36.59% 0.65% 154 39.62% 0.56% 160 40.45%
Corporates - Of Which: SME 0 0 246 1 0 0 0 0 53 0 0 0 0 0 0 1 0 0 0.12% 1 40.93% 0.09% 2 40.12% 0.08% 2 38.49% 0.20% 2 37.42% 0.43% 3 38.22% 0.42% 4 42.97%
Retail 0 0 203 8 37,655 462 0 0 31 7 15,144 484 0 0 1 2 180 109 0.30% 4 23.61% 0.25% 5 24.43% 0.22% 6 24.83% 0.36% 5 24.17% 0.46% 6 24.14% 0.48% 8 25.06%
Retail - Secured on real estate property 0.0% 0 0 139 5 26,393 413 0 0 12 6 14,046 461 0 0 0 0 107 99 0.08% 1 3.91% 0.07% 1 4.62% 0.06% 1 5.02% 0.11% 1 5.04% 0.21% 1 7.60% 0.24% 2 9.57%
Retail - Secured on real estate property - Of
Which: SME0.0% 0 0 0 0 0 0 0 0 0 0 0 0 0 0 0 0 0 0 - 0 - - 0 - - 0 - - 0 - - 0 - - 0 -
Retail - Secured on real estate property - Of
Which: non-SME67.0% 0 0 139 5 26,393 413 0 0 12 6 14,046 461 0 0 0 0 107 99 0.08% 1 3.91% 0.07% 1 4.62% 0.06% 1 5.02% 0.11% 1 5.04% 0.21% 1 7.60% 0.24% 2 9.57%
Retail - Qualifying Revolving 0 0 55 1 1,464 16 0 0 11 0 1,098 23 0 0 0 1 39 0 0.88% 2 54.44% 0.76% 2 59.29% 0.68% 3 62.20% 1.03% 2 52.94% 1.14% 3 56.24% 1.24% 3 58.46%
Retail - Other Retail 0 0 8 2 9,798 34 0 0 7 1 0 0 0 0 0 1 35 10 1.29% 2 55.90% 1.06% 2 57.15% 0.96% 2 57.71% 1.52% 2 53.80% 1.57% 2 53.27% 1.28% 3 54.50%
Retail - Other Retail - Of Which: SME 0 0 4 1 0 0 0 0 3 0 0 0 0 0 0 0 0 0 1.71% 1 42.69% 1.27% 1 43.98% 1.05% 1 44.34% 2.47% 1 39.15% 2.59% 1 38.54% 2.05% 1 39.91%
Retail - Other Retail - Of Which: non-SME 0 0 4 2 9,798 34 0 0 4 1 0 0 0 0 0 1 35 10 1.13% 1 62.70% 0.99% 2 64.04% 0.93% 2 64.76% 1.18% 1 62.50% 1.24% 2 63.04% 1.03% 2 64.47%
Equity 997 0 0 0 0 0 541 0 0 0 7,019 25 2 0 0 0 1 1 2.63% 5 44.79% 2.47% 8 60.81% 2.24% 11 69.44% 3.14% 6 44.72% 4.05% 11 57.90% 3.08% 14 69.92%
Securitisation 6,676 0 0 0 0 0 1,039 1 0 0 1 0 0 0 0 0 0 0
Other non-credit obligation assets 0 0 5 0 4,238 0 0 0 5 0 3,362 0 0 0 0 0 0 0
TOTAL 7,673 0 64,179 162 94,099 1,126 1,580 1 16,648 7 64,262 1,042 2 0 64 147 310 110 0.10% 330 27.81% 0.08% 387 29.48% 0.07% 436 30.36% 0.13% 348 27.97% 0.16% 458 30.92% 0.14% 554 33.69%
Securitisation and re-securitisations positions deducted from capital * 0 0 54 0 259 0 0 0 0 0 0 0
(mln EUR, %)Non-defaulted Defaulted Non-defaulted Defaulted Non-defaulted Defaulted Non-defaulted Defaulted Non-defaulted Defaulted Non-defaulted Defaulted Non-defaulted Defaulted Non-defaulted Defaulted Non-defaulted Defaulted
Impairment
rate
Stock of
Provisions
Coverage Ratio -
Default Stock
Impairment
rate
Stock of
Provisions
Coverage
Ratio - Default
Stock
Impairment
rate
Stock of
Provisions
Coverage
Ratio - Default
Stock
Impairment rateStock of
Provisions
Coverage
Ratio - Default
Stock
Impairment
rate
Stock of
Provisions
Coverage
Ratio - Default
Stock
Impairment
rate
Stock of
Provisions
Coverage
Ratio - Default
Stock
Central banks and central governments 0 0 751 0 0 0 0 0 337 0 0 0 0 0 1 0 0 0 0.04% 2 20.26% 0.04% 4 26.69% 0.04% 5 30.04% 0.28% 6 24.17% 0.29% 11 32.51% 0.29% 17 36.95%
Institutions 0 0 421 0 0 0 0 0 212 0 0 0 0 0 2 0 0 0 0.07% 3 25.58% 0.07% 3 33.92% 0.06% 4 38.83% 0.08% 3 25.54% 0.10% 4 32.80% 0.10% 5 37.31%
Corporates 0 0 8,148 13,797 1,329 198 0 0 9,237 17 4,331 200 0 0 149 11,086 0 0 3.14% 11,679 77.73% 1.84% 11,836 78.27% 1.38% 11,951 78.17% 3.82% 11,770 77.21% 2.67% 12,017 77.58% 1.89% 12,177 77.72%
Corporates - Of Which: Specialised Lending 0 0 0 0 492 65 0 0 0 0 378 0 0 0 3 33 0 0 1.33% 43 39.49% 0.07% 43 46.67% 0.07% 43 46.48% 1.44% 44 39.96% 0.18% 45 47.35% 0.14% 46 47.75%
Corporates - Of Which: SME 0 0 1,939 3,871 9 0 0 0 3,002 0 9 0 0 0 61 2,735 0 0 7.20% 2,965 68.61% 4.00% 3,028 69.82% 3.00% 3,073 70.02% 8.71% 2,994 68.07% 5.83% 3,088 69.22% 4.12% 3,148 69.75%
Retail 0 0 17,779 4,549 224 11 0 0 17,752 3,354 146 16 0 0 593 1,469 0 0 1.29% 2,352 31.57% 1.08% 2,530 31.72% 0.61% 2,629 32.70% 2.44% 2,631 33.42% 2.26% 3,014 36.02% 1.88% 3,307 38.15%
Retail - Secured on real estate property 0.0% 0 0 16,561 4,008 79 4 0 0 16,490 2,832 22 4 0 0 525 1,125 0 0 0.98% 1,858 27.49% 0.85% 1,988 27.39% 0.40% 2,049 28.10% 2.11% 2,125 29.95% 1.95% 2,441 32.55% 1.63% 2,681 34.64%
Retail - Secured on real estate property - Of
Which: SME0.0% 0 0 0 0 0 0 0 0 0 0 0 0 0 0 0 0 0 0 - 0 - - 0 - - 0 - - 0 - - 0 - - 0 -
Retail - Secured on real estate property - Of
Which: non-SME109.0% 0 0 16,561 4,008 79 4 0 0 16,490 2,832 22 4 0 0 525 1,125 0 0 0.98% 1,858 27.49% 0.85% 1,988 27.39% 0.40% 2,049 28.10% 2.11% 2,125 29.95% 1.95% 2,441 32.55% 1.63% 2,681 34.64%
Retail - Qualifying Revolving 0 0 464 34 0 0 0 0 422 9 0 0 0 0 25 23 0 0 6.12% 75 48.50% 5.07% 95 56.76% 4.33% 111 61.52% 8.22% 79 47.38% 8.58% 107 54.45% 8.85% 133 58.94%
Retail - Other Retail 0 0 754 506 145 8 0 0 840 514 124 12 0 0 44 321 0 0 4.79% 419 60.98% 3.55% 447 63.00% 3.02% 470 64.05% 5.77% 427 60.13% 5.22% 466 61.77% 3.68% 493 63.86%
Retail - Other Retail - Of Which: SME 0 0 584 385 109 0 0 0 646 487 94 1 0 0 33 242 0 0 4.35% 315 61.87% 3.06% 334 63.93% 2.54% 349 64.92% 5.53% 322 60.77% 4.83% 351 62.52% 3.25% 369 64.66%
Retail - Other Retail - Of Which: non-SME 0 0 170 122 36 8 0 0 194 26 31 11 0 0 10 79 0 0 6.33% 104 58.44% 5.33% 113 60.42% 4.79% 121 61.68% 6.58% 105 58.26% 6.60% 116 59.62% 5.24% 124 61.62%
Equity 5 0 0 0 0 0 18 0 0 0 0 0 0 0 0 0 0 0 2.38% 0 45.85% 2.24% 0 60.87% 1.97% 0 69.70% 2.66% 0 45.76% 3.08% 0 58.90% 3.11% 1 67.14%
Securitisation 503 0 0 0 0 0 99 0 0 0 0 0 0 0 0 0 0 0
Other non-credit obligation assets 0 0 277 0 269 0 0 0 272 0 0 0 0 0 0 0 0 0
TOTAL 507 0 27,376 18,346 1,823 209 117 0 27,809 3,372 4,477 216 0 0 745 12,555 0 0 1.84% 14,036 65.05% 1.28% 14,374 64.74% 0.83% 14,590 64.86% 2.79% 14,410 64.49% 2.30% 15,046 64.84% 1.81% 15,506 65.20%
Securitisation and re-securitisations positions deducted from capital * 0 0 108 0 0 0 0 0 0 0 0 0
(mln EUR, %)Non-defaulted Defaulted Non-defaulted Defaulted Non-defaulted Defaulted Non-defaulted Defaulted Non-defaulted Defaulted Non-defaulted Defaulted Non-defaulted Defaulted Non-defaulted Defaulted Non-defaulted Defaulted
Impairment
rate
Stock of
Provisions
Coverage Ratio -
Default Stock
Impairment
rate
Stock of
Provisions
Coverage
Ratio - Default
Stock
Impairment
rate
Stock of
Provisions
Coverage
Ratio - Default
Stock
Impairment rateStock of
Provisions
Coverage
Ratio - Default
Stock
Impairment
rate
Stock of
Provisions
Coverage
Ratio - Default
Stock
Impairment
rate
Stock of
Provisions
Coverage
Ratio - Default
Stock
Central banks and central governments 0 0 3,181 0 68 0 0 0 231 0 14 0 0 0 1 0 0 0 0.00% 1 22.31% 0.00% 1 26.68% 0.00% 1 30.05% 0.01% 1 53.78% 0.01% 1 68.17% 0.01% 1 76.59%
Institutions 0 0 6,063 0 91 0 0 0 843 0 18 0 0 0 2 0 0 0 0.01% 3 13.27% 0.01% 4 17.67% 0.01% 4 20.29% 0.01% 3 13.35% 0.01% 4 17.21% 0.01% 5 19.58%
Corporates 0 0 7,712 297 708 691 0 0 7,370 0 653 0 0 0 34 509 0 0 0.68% 639 47.48% 0.53% 687 48.18% 0.38% 722 48.66% 0.96% 672 47.29% 0.88% 761 48.93% 0.58% 817 50.94%
Corporates - Of Which: Specialised Lending 0 0 0 0 580 691 0 0 0 0 531 0 0 0 10 335 0 0 3.56% 387 49.10% 3.13% 402 49.17% 2.22% 413 49.39% 5.53% 404 49.30% 5.74% 439 50.36% 4.40% 460 51.85%
Corporates - Of Which: SME 0 0 74 5 0 0 0 0 54 0 0 0 0 0 0 2 0 0 0.59% 4 44.80% 0.50% 4 45.40% 0.47% 4 45.43% 0.82% 4 43.46% 1.54% 5 42.61% 1.42% 6 44.88%
Retail 0 0 25 1 64 0 0 0 5 1 26 0 0 0 0 0 0 0 0.21% 1 11.04% 0.20% 1 11.33% 0.19% 1 11.43% 0.23% 1 11.56% 0.27% 1 12.52% 0.29% 1 13.30%
Retail - Secured on real estate property 0.0% 0 0 16 1 57 0 0 0 1 1 21 0 0 0 0 0 0 0 0.10% 0 2.88% 0.09% 0 3.57% 0.09% 0 3.94% 0.10% 0 3.18% 0.12% 0 4.34% 0.13% 0 5.05%
Retail - Secured on real estate property - Of
Which: SME0.0% 0 0 0 0 0 0 0 0 0 0 0 0 0 0 0 0 0 0 - 0 - - 0 - - 0 - - 0 - - 0 - - 0 -
Retail - Secured on real estate property - Of
Which: non-SME0.0% 0 0 16 1 57 0 0 0 1 1 21 0 0 0 0 0 0 0 0.10% 0 2.88% 0.09% 0 3.57% 0.09% 0 3.94% 0.10% 0 3.18% 0.12% 0 4.34% 0.13% 0 5.05%
Retail - Qualifying Revolving 0 0 8 0 0 0 0 0 2 0 0 0 0 0 0 0 0 0 0.96% 0 49.63% 0.87% 0 56.02% 0.80% 0 59.73% 1.14% 0 48.18% 1.33% 0 52.87% 1.51% 0 55.84%
Retail - Other Retail 0 0 1 0 7 0 0 0 2 0 5 0 0 0 0 0 0 0 0.44% 0 52.09% 0.42% 0 53.48% 0.42% 0 54.10% 0.47% 0 51.35% 0.55% 0 50.88% 0.50% 0 52.57%
Retail - Other Retail - Of Which: SME 0 0 0 0 0 0 0 0 0 0 0 0 0 0 0 0 0 0 0.77% 0 56.88% 0.66% 0 56.56% 0.61% 0 56.03% 0.95% 0 55.76% 1.18% 0 53.53% 1.11% 0 52.91%
Retail - Other Retail - Of Which: non-SME 0 0 1 0 7 0 0 0 2 0 5 0 0 0 0 0 0 0 0.41% 0 48.19% 0.40% 0 51.42% 0.41% 0 53.01% 0.43% 0 47.73% 0.51% 0 49.16% 0.46% 0 52.38%
Equity 43 0 238 0 0 0 126 0 748 0 0 0 2 0 0 0 0 0 1.19% 2 47.79% 1.12% 3 60.72% 0.99% 3 69.49% 1.33% 2 47.50% 1.54% 3 58.72% 1.56% 3 66.80%
Securitisation 5,141 0 0 0 0 0 530 0 0 0 0 0 0 0 0 0 0 0
Other non-credit obligation assets 0 0 10 0 0 0 0 0 6 0 500 0 0 0 0 0 0 0
TOTAL 5,184 0 17,229 298 931 691 656 0 9,204 1 1,211 0 2 0 36 509 0 0 0.34% 645 47.16% 0.26% 695 47.80% 0.19% 731 48.24% 0.48% 678 46.98% 0.43% 770 48.53% 0.29% 828 50.43%
Securitisation and re-securitisations positions deducted from capital * 0 0 83 0 0 0 0 0 0 0 0 0
(mln EUR, %)Non-defaulted Defaulted Non-defaulted Defaulted Non-defaulted Defaulted Non-defaulted Defaulted Non-defaulted Defaulted Non-defaulted Defaulted Non-defaulted Defaulted Non-defaulted Defaulted Non-defaulted Defaulted
Impairment
rate
Stock of
Provisions
Coverage Ratio -
Default Stock
Impairment
rate
Stock of
Provisions
Coverage
Ratio - Default
Stock
Impairment
rate
Stock of
Provisions
Coverage
Ratio - Default
Stock
Impairment rateStock of
Provisions
Coverage
Ratio - Default
Stock
Impairment
rate
Stock of
Provisions
Coverage
Ratio - Default
Stock
Impairment
rate
Stock of
Provisions
Coverage
Ratio - Default
Stock
Central banks and central governments 0 0 17,714 0 385 0 0 0 579 0 0 0 0 0 2 0 0 0 0.00% 3 20.47% 0.00% 4 26.70% 0.00% 5 30.10% 0.00% 3 22.50% 0.00% 4 28.94% 0.00% 6 32.46%
Institutions 0 0 2,865 0 302 0 0 0 858 0 78 0 0 0 2 0 0 0 0.03% 5 27.59% 0.03% 8 37.09% 0.03% 11 42.46% 0.04% 6 27.57% 0.04% 10 35.85% 0.04% 15 40.77%
Corporates 0 0 4,850 61 1,091 1,197 0 0 1,989 0 1,149 0 0 0 24 655 0 0 0.91% 731 44.57% 0.55% 759 45.47% 0.34% 777 45.91% 1.24% 766 44.72% 0.85% 834 47.53% 0.43% 862 49.22%
Corporates - Of Which: Specialised Lending 0 0 0 0 530 1,197 0 0 0 0 588 0 0 0 13 623 0 0 6.51% 666 46.74% 4.97% 683 46.93% 3.38% 693 47.14% 10.07% 695 47.07% 8.26% 739 48.91% 4.61% 755 50.12%
Corporates - Of Which: SME 0 0 85 0 0 0 0 0 60 0 0 0 0 0 0 0 0 0 0.25% 0 13.68% 0.19% 1 19.14% 0.17% 1 21.62% 0.38% 0 15.28% 0.68% 1 21.90% 0.65% 2 26.56%
Retail 0 0 69 1 47 0 0 0 23 1 17 0 0 0 0 1 0 0 0.75% 2 27.82% 0.70% 3 30.95% 0.67% 4 32.69% 0.81% 2 28.25% 0.93% 3 31.24% 0.91% 4 33.82%
Retail - Secured on real estate property 0.0% 0 0 35 0 26 0 0 0 4 0 1 0 0 0 0 0 0 0 0.59% 0 10.53% 0.55% 1 14.37% 0.52% 1 16.35% 0.63% 0 11.22% 0.70% 1 15.64% 0.70% 1 18.38%
Retail - Secured on real estate property - Of
Which: SME0.0% 0 0 0 0 0 0 0 0 0 0 0 0 0 0 0 0 0 0 - 0 - - 0 - - 0 - - 0 - - 0 - - 0 -
Retail - Secured on real estate property - Of
Which: non-SME0.0% 0 0 35 0 26 0 0 0 4 0 1 0 0 0 0 0 0 0 0.59% 0 10.53% 0.55% 1 14.37% 0.52% 1 16.35% 0.63% 0 11.22% 0.70% 1 15.64% 0.70% 1 18.38%
Retail - Qualifying Revolving 0 0 18 0 0 0 0 0 4 0 0 0 0 0 0 0 0 0 1.03% 1 50.68% 0.91% 1 56.33% 0.83% 1 59.67% 1.22% 1 49.26% 1.38% 1 53.35% 1.53% 1 56.04%
Retail - Other Retail 0 0 16 1 21 0 0 0 15 0 16 0 0 0 0 0 0 0 0.86% 1 49.69% 0.83% 1 54.22% 0.83% 2 56.68% 0.90% 1 49.21% 1.06% 1 52.07% 0.95% 2 56.14%
Retail - Other Retail - Of Which: SME 0 0 0 0 0 0 0 0 0 0 0 0 0 0 0 0 0 0 1.18% 0 56.21% 1.01% 0 56.62% 0.94% 0 56.69% 1.55% 0 54.69% 1.95% 0 53.17% 1.78% 0 53.56%
Retail - Other Retail - Of Which: non-SME 0 0 16 1 21 0 0 0 15 0 16 0 0 0 0 0 0 0 0.86% 1 49.02% 0.82% 1 54.02% 0.83% 2 56.68% 0.89% 1 48.64% 1.05% 1 51.98% 0.94% 2 56.34%
Equity 1 0 0 0 0 0 3 0 0 0 0 0 0 0 0 0 0 0 2.41% 0 45.15% 2.28% 0 60.84% 2.00% 0 69.68% 2.70% 0 45.14% 3.12% 0 58.90% 3.17% 0 67.10%
Securitisation 333 0 0 0 0 0 25 0 0 0 0 0 0 0 0 0 0 0
Other non-credit obligation assets 0 0 62 0 21 0 0 0 52 0 21 0 0 0 0 0 0 0
TOTAL 334 0 25,561 63 1,847 1,197 27 0 3,502 1 1,265 0 0 0 27 656 0 0 0.19% 741 44.29% 0.12% 775 45.20% 0.07% 797 45.68% 0.26% 777 44.44% 0.18% 851 47.19% 0.09% 886 48.85%
Securitisation and re-securitisations positions deducted from capital * 0 0 0 0 0 0 0 0 0 0 0 0
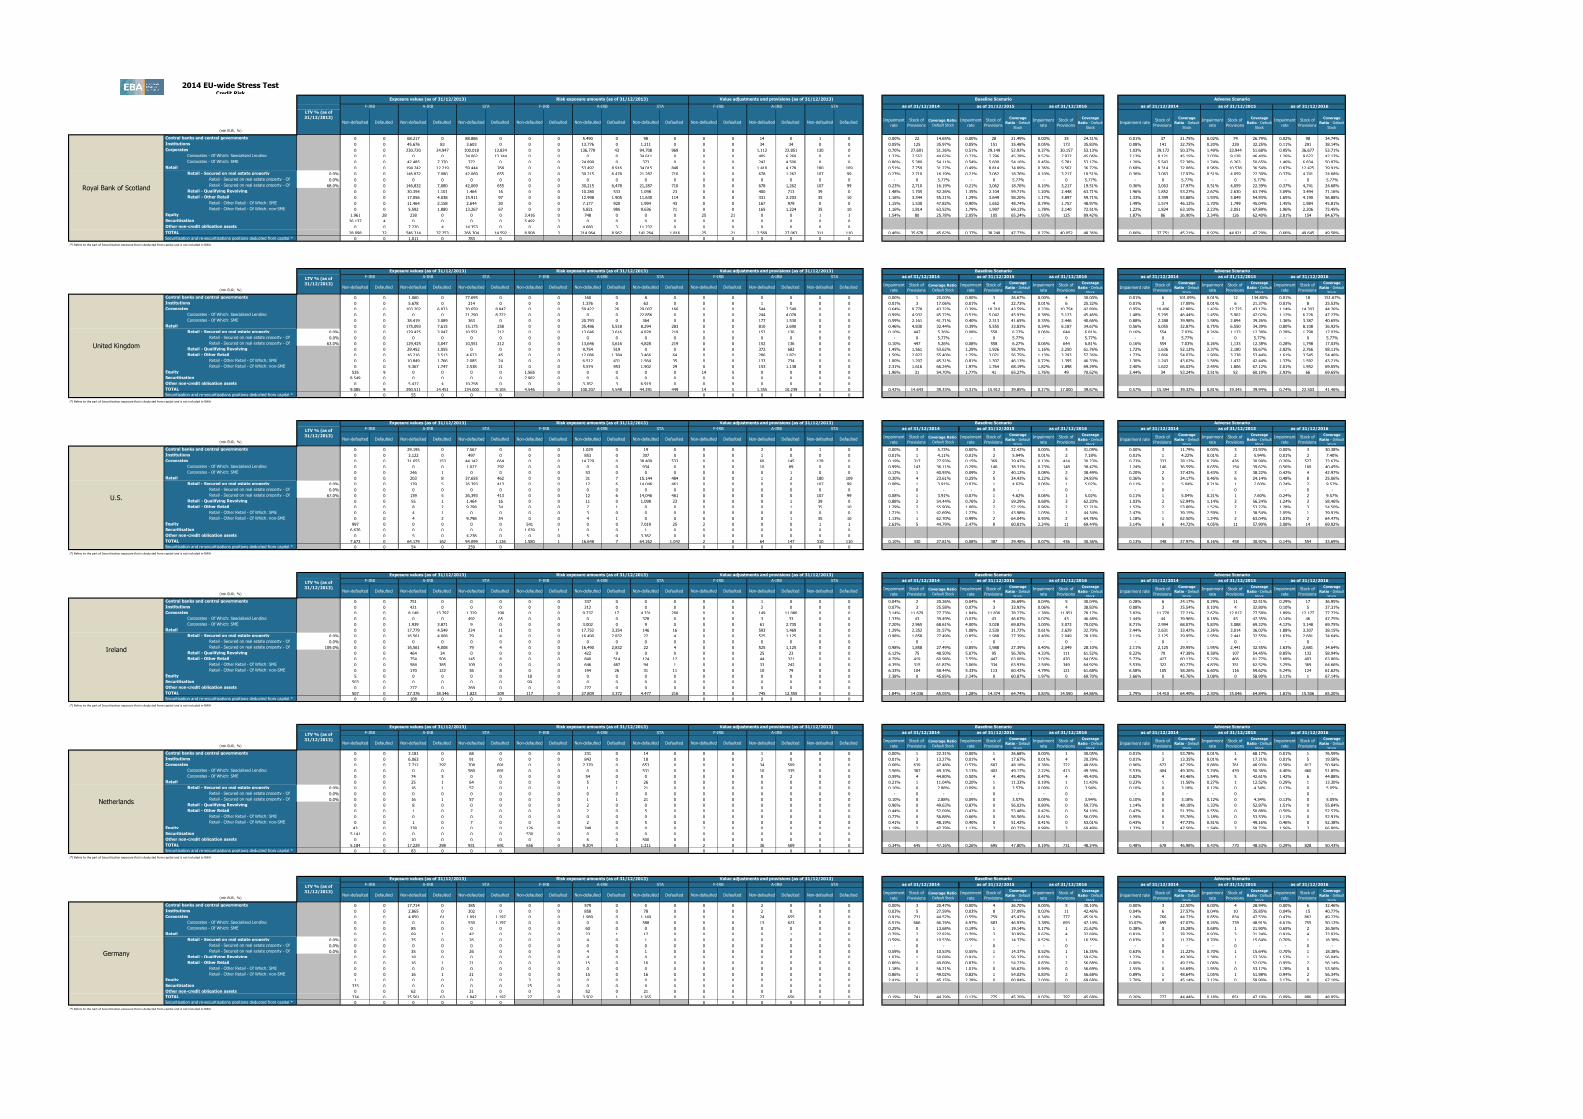
as of 31/12/2016 as of 31/12/2014 as of 31/12/2015 as of 31/12/2016
Germany
F-IRB A-IRB STA as of 31/12/2014 as of 31/12/2015LTV % (as of
31/12/2013)
Exposure values (as of 31/12/2013) Risk exposure amounts (as of 31/12/2013) Value adjustments and provisions (as of 31/12/2013) Baseline Scenario Adverse Scenario
F-IRB A-IRB STA F-IRB A-IRB STA
LTV % (as of
31/12/2013)
Exposure values (as of 31/12/2013) Risk exposure amounts (as of 31/12/2013) Value adjustments and provisions (as of 31/12/2013) Baseline Scenario Adverse Scenario
F-IRB A-IRB STA F-IRB A-IRB STA F-IRB as of 31/12/2014 as of 31/12/2015 as of 31/12/2016A-IRB STA as of 31/12/2014 as of 31/12/2015 as of 31/12/2016
LTV % (as of
31/12/2013)
Exposure values (as of 31/12/2013) Risk exposure amounts (as of 31/12/2013) Value adjustments and provisions (as of 31/12/2013) Baseline Scenario Adverse Scenario
F-IRB A-IRB STA F-IRB A-IRB STA F-IRB A-IRB as of 31/12/2015 as of 31/12/2016STA as of 31/12/2014 as of 31/12/2015 as of 31/12/2016 as of 31/12/2014
Risk exposure amounts (as of 31/12/2013)
Baseline Scenario Adverse Scenario
F-IRB A-IRB STA F-IRB A-IRB STA F-IRB A-IRB STA as of 31/12/2014 as of 31/12/2015 as of 31/12/2016 as of 31/12/2014 as of 31/12/2015 as of 31/12/2016
as of 31/12/2016
United Kingdom
LTV % (as of
31/12/2013)
Exposure values (as of 31/12/2013) Risk exposure amounts (as of 31/12/2013) Value adjustments and provisions (as of 31/12/2013)
Adverse Scenario
F-IRB A-IRB STA F-IRB A-IRB STA F-IRB A-IRB STA as of 31/12/2014 as of 31/12/2015 as of 31/12/2016 as of 31/12/2014 as of 31/12/2015 as of 31/12/2016LTV % (as of
31/12/2013)
Exposure values (as of 31/12/2013)
Royal Bank of Scotland
(*) Refers to the part of Securitization exposure that is deducted from capital and is not included in RWA
Value adjustments and provisions (as of 31/12/2013) Baseline Scenario
LTV % (as of
31/12/2013)
Exposure values (as of 31/12/2013) Risk exposure amounts (as of 31/12/2013) Value adjustments and provisions (as of 31/12/2013) Adverse Scenario
F-IRB A-IRB STA F-IRB A-IRB STA F-IRB A-IRB STA
Baseline Scenario
as of 31/12/2014 as of 31/12/2015 as of 31/12/2016 as of 31/12/2014 as of 31/12/2015
(*) Refers to the part of Securitization exposure that is deducted from capital and is not included in RWA
(*) Refers to the part of Securitization exposure that is deducted from capital and is not included in RWA
(*) Refers to the part of Securitization exposure that is deducted from capital and is not included in RWA
(*) Refers to the part of Securitization exposure that is deducted from capital and is not included in RWA
(*) Refers to the part of Securitization exposure that is deducted from capital and is not included in RWA
U.S.
Ireland
Netherlands
2014 EU-wide Stress TestCredit Risk
LTV % (as of
31/12/2013)
Exposure values (as of 31/12/2013) Risk exposure amounts (as of 31/12/2013) Value adjustments and provisions (as of 31/12/2013) Adverse ScenarioBaseline Scenario
(mln EUR, %)Non-defaulted Defaulted Non-defaulted Defaulted Non-defaulted Defaulted Non-defaulted Defaulted Non-defaulted Defaulted Non-defaulted Defaulted Non-defaulted Defaulted Non-defaulted Defaulted Non-defaulted Defaulted
Impairment
rate
Stock of
Provisions
Coverage Ratio -
Default Stock
Impairment
rate
Stock of
Provisions
Coverage
Ratio - Default
Stock
Impairment
rate
Stock of
Provisions
Coverage
Ratio - Default
Stock
Impairment rateStock of
Provisions
Coverage
Ratio - Default
Stock
Impairment
rate
Stock of
Provisions
Coverage
Ratio - Default
Stock
Impairment
rate
Stock of
Provisions
Coverage
Ratio - Default
Stock
Central banks and central governments 0 0 667 0 3 0 0 0 77 0 0 0 0 0 0 0 0 0 0.01% 0 20.67% 0.01% 0 26.67% 0.01% 0 30.00% 0.05% 0 20.03% 0.05% 1 26.58% 0.05% 1 29.92%
Institutions 0 0 5,942 0 302 0 0 0 1,406 0 61 0 0 0 3 0 0 0 0.03% 8 27.53% 0.03% 12 37.08% 0.03% 16 42.46% 0.04% 8 27.53% 0.05% 15 35.85% 0.05% 21 40.78%
Corporates 0 0 6,392 345 677 111 0 0 3,203 0 565 1 0 0 15 179 0 0 0.33% 305 50.98% 0.26% 325 51.00% 0.20% 340 51.14% 0.57% 328 51.55% 0.57% 376 53.94% 0.37% 405 55.96%
Corporates - Of Which: Specialised Lending 0 0 0 0 551 110 0 0 0 0 439 0 0 0 5 50 0 0 0.82% 66 42.98% 0.65% 69 42.47% 0.50% 72 42.60% 1.19% 74 45.23% 1.13% 85 47.93% 0.72% 91 50.22%
Corporates - Of Which: SME 0 0 43 7 0 0 0 0 46 0 0 0 0 0 0 2 0 0 1.06% 4 40.48% 0.89% 4 40.42% 0.86% 5 40.09% 1.45% 4 39.04% 2.48% 5 38.36% 2.74% 6 39.52%
Retail 0 0 113 5 37 0 0 0 25 3 28 0 0 0 1 2 0 0 0.89% 4 31.14% 0.78% 6 33.28% 0.65% 6 35.10% 1.11% 5 29.47% 1.21% 7 30.97% 1.07% 8 34.17%
Retail - Secured on real estate property 0.0% 0 0 50 1 24 0 0 0 4 1 19 0 0 0 0 0 0 0 0.81% 1 9.85% 0.69% 1 13.61% 0.52% 1 15.77% 1.09% 1 10.65% 1.16% 2 14.65% 0.80% 2 17.66%
Retail - Secured on real estate property - Of
Which: SME0.0% 0 0 0 0 0 0 0 0 0 0 0 0 0 0 0 0 0 0 - 0 - - 0 - - 0 - - 0 - - 0 - - 0 -
Retail - Secured on real estate property - Of
Which: non-SME0.0% 0 0 50 1 24 0 0 0 4 1 19 0 0 0 0 0 0 0 0.81% 1 9.85% 0.69% 1 13.61% 0.52% 1 15.77% 1.09% 1 10.65% 1.16% 2 14.65% 0.80% 2 17.66%
Retail - Qualifying Revolving 0 0 52 1 0 0 0 0 13 1 0 0 0 0 0 1 0 0 1.04% 2 55.19% 0.91% 3 60.12% 0.82% 3 63.09% 1.23% 2 53.69% 1.37% 3 57.06% 1.51% 4 59.33%
Retail - Other Retail 0 0 11 2 12 0 0 0 8 1 9 0 0 0 0 1 0 0 0.80% 2 53.85% 0.72% 2 55.03% 0.69% 2 55.69% 0.88% 2 53.10% 1.00% 2 52.91% 0.87% 2 54.08%
Retail - Other Retail - Of Which: SME 0 0 3 2 0 0 0 0 2 1 0 0 0 0 0 1 0 0 1.15% 1 50.32% 0.98% 1 50.44% 0.90% 1 50.37% 1.50% 1 49.40% 1.91% 1 48.21% 1.74% 1 48.27%
Retail - Other Retail - Of Which: non-SME 0 0 7 1 12 0 0 0 6 0 9 0 0 0 0 0 0 0 0.74% 1 59.44% 0.67% 1 61.56% 0.65% 1 62.55% 0.77% 1 59.06% 0.85% 1 59.64% 0.73% 1 61.92%
Equity 173 0 0 0 0 0 523 0 0 0 0 0 2 0 0 0 0 0 1.47% 4 45.00% 0.68% 6 68.42% 0.61% 7 73.88% 1.79% 5 45.00% 0.97% 7 66.80% 0.79% 8 73.80%
Securitisation 460 0 0 0 0 0 45 0 0 0 0 0 0 0 0 0 0 0
Other non-credit obligation assets 0 0 0 0 0 0 0 0 0 0 0 0 0 0 0 0 0 0
TOTAL 634 0 13,115 350 1,019 111 568 0 4,711 3 654 1 2 0 19 181 0 0 0.21% 322 49.85% 0.16% 349 50.20% 0.12% 370 50.56% 0.33% 347 50.23% 0.32% 405 52.59% 0.22% 443 54.59%
Securitisation and re-securitisations positions deducted from capital * 0 0 0 0 0 0 0 0 0 0 0 0
(mln EUR, %)Non-defaulted Defaulted Non-defaulted Defaulted Non-defaulted Defaulted Non-defaulted Defaulted Non-defaulted Defaulted Non-defaulted Defaulted Non-defaulted Defaulted Non-defaulted Defaulted Non-defaulted Defaulted
Impairment
rate
Stock of
Provisions
Coverage Ratio -
Default Stock
Impairment
rate
Stock of
Provisions
Coverage
Ratio - Default
Stock
Impairment
rate
Stock of
Provisions
Coverage
Ratio - Default
Stock
Impairment rateStock of
Provisions
Coverage
Ratio - Default
Stock
Impairment
rate
Stock of
Provisions
Coverage
Ratio - Default
Stock
Impairment
rate
Stock of
Provisions
Coverage
Ratio - Default
Stock
Central banks and central governments 0 0 0 0 50 0 0 0 0 0 10 0 0 0 0 0 0 0 0.20% 0 20.00% 0.20% 0 26.69% 0.20% 0 30.04% 1.06% 1 19.51% 1.09% 1 26.49% 1.12% 2 30.26%
Institutions 0 0 1,733 0 0 0 0 0 450 0 0 0 0 0 5 0 0 0 0.00% 6 31.85% 0.00% 6 37.60% 0.00% 7 43.05% 0.00% 6 31.44% 0.00% 6 36.36% 0.00% 7 41.36%
Corporates 0 0 5,989 298 1,156 814 0 0 3,269 0 1,210 0 0 0 64 592 0 0 1.04% 753 49.01% 0.85% 821 50.43% 0.54% 863 51.65% 1.61% 817 50.57% 1.61% 964 55.18% 0.88% 1,036 58.29%
Corporates - Of Which: Specialised Lending 0 0 0 0 1,132 814 0 0 0 0 1,187 0 0 0 23 421 0 0 2.21% 477 50.33% 2.02% 506 51.62% 1.30% 524 52.74% 3.16% 511 52.59% 3.00% 574 56.66% 1.75% 602 58.86%
Corporates - Of Which: SME 0 0 0 0 0 0 0 0 0 0 0 0 0 0 0 0 0 0 0.12% 0 35.02% 0.11% 0 47.15% 0.10% 0 53.91% 0.16% 0 35.13% 0.16% 0 46.86% 0.16% 0 52.73%
Retail 0 0 68 5 409 3 0 0 14 3 212 3 0 0 1 2 0 0 1.00% 7 16.61% 0.89% 11 19.93% 0.74% 14 22.05% 1.04% 7 16.61% 1.08% 12 19.65% 1.05% 17 21.74%
Retail - Secured on real estate property 0.0% 0 0 23 2 403 3 0 0 2 3 208 3 0 0 0 0 0 0 0.98% 4 11.35% 0.87% 7 15.55% 0.71% 10 17.98% 0.99% 4 11.34% 1.03% 8 15.38% 0.98% 12 17.78%
Retail - Secured on real estate property - Of
Which: SME0.0% 0 0 0 0 0 0 0 0 0 0 0 0 0 0 0 0 0 0 - 0 - - 0 - - 0 - - 0 - - 0 - - 0 -
Retail - Secured on real estate property - Of
Which: non-SME0.0% 0 0 23 2 403 3 0 0 2 3 208 3 0 0 0 0 0 0 0.98% 4 11.35% 0.87% 7 15.55% 0.71% 10 17.98% 0.99% 4 11.34% 1.03% 8 15.38% 0.98% 12 17.78%
Retail - Qualifying Revolving 0 0 38 1 0 0 0 0 10 1 0 0 0 0 0 1 0 0 1.20% 2 55.54% 1.04% 2 60.53% 0.93% 3 63.55% 1.41% 2 54.14% 1.55% 2 57.67% 1.69% 3 60.07%
Retail - Other Retail 0 0 6 2 6 0 0 0 2 0 5 0 0 0 0 1 0 0 1.17% 1 53.58% 0.98% 2 54.73% 0.89% 2 55.30% 1.40% 1 51.60% 1.45% 2 51.51% 1.15% 2 53.02%
Retail - Other Retail - Of Which: SME 0 0 3 1 0 0 0 0 0 0 0 0 0 0 0 0 0 0 2.63% 1 38.91% 1.88% 1 40.43% 1.46% 1 41.10% 3.71% 1 36.76% 3.58% 1 37.42% 2.52% 1 39.11%
Retail - Other Retail - Of Which: non-SME 0 0 4 1 6 0 0 0 2 0 5 0 0 0 0 1 0 0 0.80% 1 68.15% 0.76% 1 68.56% 0.76% 1 68.62% 0.83% 1 67.88% 0.96% 1 67.15% 0.85% 1 68.01%
Equity 26 0 0 0 0 0 143 0 3 0 0 0 3 0 0 0 0 0 17.58% 7 45.00% 16.99% 10 62.14% 13.94% 12 72.49% 24.47% 8 45.00% 29.79% 12 60.90% 21.27% 15 74.00%
Securitisation 105 0 0 0 0 0 22 0 0 0 0 0 0 0 0 0 0 0
Other non-credit obligation assets 0 0 17 0 0 0 0 0 3 0 0 0 0 0 0 0 0 0
TOTAL 131 0 7,806 303 1,615 817 166 0 3,741 3 1,433 3 3 0 70 594 0 0 0.88% 773 48.05% 0.72% 848 49.44% 0.47% 897 50.64% 1.33% 839 49.53% 1.33% 996 53.88% 0.75% 1,077 56.76%
Securitisation and re-securitisations positions deducted from capital * 0 0 0 0 0 0 0 0 0 0 0 0
(mln EUR, %)Non-defaulted Defaulted Non-defaulted Defaulted Non-defaulted Defaulted Non-defaulted Defaulted Non-defaulted Defaulted Non-defaulted Defaulted Non-defaulted Defaulted Non-defaulted Defaulted Non-defaulted Defaulted
Impairment
rate
Stock of
Provisions
Coverage Ratio -
Default Stock
Impairment
rate
Stock of
Provisions
Coverage
Ratio - Default
Stock
Impairment
rate
Stock of
Provisions
Coverage
Ratio - Default
Stock
Impairment rateStock of
Provisions
Coverage
Ratio - Default
Stock
Impairment
rate
Stock of
Provisions
Coverage
Ratio - Default
Stock
Impairment
rate
Stock of
Provisions
Coverage
Ratio - Default
Stock
Central banks and central governments 0 0 690 0 0 0 0 0 92 0 0 0 0 0 0 0 0 0 0.01% 0 20.00% 0.01% 0 26.67% 0.01% 0 30.00% 0.02% 0 20.00% 0.04% 1 23.98% 0.03% 1 30.30%
Institutions 0 0 4,676 0 13 0 0 0 1,623 0 3 0 0 0 3 0 0 0 0.08% 8 35.84% 0.08% 12 49.30% 0.07% 16 57.07% 0.14% 11 36.31% 0.18% 20 47.83% 0.11% 26 59.81%
Corporates 0 0 1,625 21 1 0 0 0 602 0 1 0 0 0 1 3 0 0 0.27% 10 21.35% 0.26% 15 25.80% 0.26% 19 28.71% 0.63% 16 23.72% 0.83% 30 30.74% 0.43% 37 36.63%
Corporates - Of Which: Specialised Lending 0 0 0 0 0 0 0 0 0 0 0 0 0 0 0 0 0 0 - 0 - - 0 - - 0 - - 0 - - 0 - - 0 -
Corporates - Of Which: SME 0 0 0 0 0 0 0 0 0 0 0 0 0 0 0 0 0 0 - 0 - - 0 - - 0 - - 0 - - 0 - - 0 -
Retail 0 0 13 0 10 0 0 0 1 0 6 0 0 0 0 0 0 0 0.23% 0 32.09% 0.20% 0 32.42% 0.18% 0 32.41% 0.28% 0 31.81% 0.35% 0 29.83% 0.38% 0 29.95%
Retail - Secured on real estate property 0.0% 0 0 8 0 4 0 0 0 0 0 1 0 0 0 0 0 0 0 0.05% 0 3.69% 0.05% 0 4.55% 0.04% 0 5.02% 0.08% 0 4.74% 0.15% 0 7.20% 0.18% 0 9.09%
Retail - Secured on real estate property - Of
Which: SME0.0% 0 0 0 0 0 0 0 0 0 0 0 0 0 0 0 0 0 0 - 0 - - 0 - - 0 - - 0 - - 0 - - 0 -
Retail - Secured on real estate property - Of
Which: non-SME0.0% 0 0 8 0 4 0 0 0 0 0 1 0 0 0 0 0 0 0 0.05% 0 3.69% 0.05% 0 4.55% 0.04% 0 5.02% 0.08% 0 4.74% 0.15% 0 7.20% 0.18% 0 9.09%
Retail - Qualifying Revolving 0 0 4 0 0 0 0 0 1 0 0 0 0 0 0 0 0 0 0.76% 0 47.59% 0.70% 0 52.12% 0.65% 0 54.83% 0.90% 0 46.10% 1.07% 0 49.00% 1.24% 0 50.94%
Retail - Other Retail 0 0 1 0 6 0 0 0 0 0 4 0 0 0 0 0 0 0 0.21% 0 61.70% 0.17% 0 60.38% 0.14% 0 58.60% 0.24% 0 59.91% 0.24% 0 55.53% 0.19% 0 54.39%
Retail - Other Retail - Of Which: SME 0 0 0 0 0 0 0 0 0 0 0 0 0 0 0 0 0 0 0.76% 0 17.64% 0.65% 0 24.19% 0.60% 0 27.33% 1.04% 0 17.63% 1.39% 0 22.56% 1.29% 0 26.43%
Retail - Other Retail - Of Which: non-SME 0 0 0 0 6 0 0 0 0 0 4 0 0 0 0 0 0 0 0.18% 0 66.21% 0.14% 0 64.95% 0.11% 0 63.15% 0.18% 0 65.76% 0.17% 0 62.68% 0.12% 0 61.64%
Equity 0 0 0 0 0 0 0 0 0 0 0 0 0 0 0 0 0 0 - 0 - - 0 - - 0 - - 0 - - 0 - - 0 -
Securitisation 0 0 0 0 0 0 0 0 0 0 0 0 0 0 0 0 0 0
Other non-credit obligation assets 0 0 0 0 134 0 0 0 0 0 1 0 0 0 0 0 0 0
TOTAL 0 0 7,004 21 158 0 0 0 2,318 0 11 0 0 0 5 3 0 0 0.12% 18 24.46% 0.12% 27 31.56% 0.11% 36 35.96% 0.24% 28 26.70% 0.31% 51 35.13% 0.17% 64 42.70%
Securitisation and re-securitisations positions deducted from capital * 0 0 0 0 0 0 0 0 0 0 0 0
(mln EUR, %)Non-defaulted Defaulted Non-defaulted Defaulted Non-defaulted Defaulted Non-defaulted Defaulted Non-defaulted Defaulted Non-defaulted Defaulted Non-defaulted Defaulted Non-defaulted Defaulted Non-defaulted Defaulted
Impairment
rate
Stock of
Provisions
Coverage Ratio -
Default Stock
Impairment
rate
Stock of
Provisions
Coverage
Ratio - Default
Stock
Impairment
rate
Stock of
Provisions
Coverage
Ratio - Default
Stock
Impairment rateStock of
Provisions
Coverage
Ratio - Default
Stock
Impairment
rate
Stock of
Provisions
Coverage
Ratio - Default
Stock
Impairment
rate
Stock of
Provisions
Coverage
Ratio - Default
Stock
Central banks and central governments 0 0 1,017 0 90 0 0 0 511 0 15 0 0 0 3 0 0 0 0.00% 3 20.00% 0.00% 3 26.67% 0.00% 3 30.04% 0.01% 3 20.00% 0.01% 3 26.57% 0.01% 3 30.18%
Institutions 0 0 666 0 50 0 0 0 133 0 10 0 0 0 0 0 0 0 0.01% 0 27.24% 0.01% 0 37.17% 0.01% 1 42.78% 0.02% 0 27.48% 0.02% 1 35.99% 0.01% 1 44.83%
Corporates 0 0 2,284 69 660 51 0 0 1,252 0 475 0 0 0 3 83 0 0 0.06% 91 67.27% 0.05% 93 66.82% 0.05% 96 66.27% 0.13% 94 64.84% 0.16% 102 63.57% 0.09% 106 65.15%
Corporates - Of Which: Specialised Lending 0 0 0 0 653 51 0 0 0 0 468 0 0 0 2 26 0 0 0.01% 30 51.73% 0.01% 31 52.29% 0.01% 32 52.75% 0.01% 31 51.26% 0.03% 33 52.13% 0.01% 34 53.87%
Corporates - Of Which: SME 0 0 0 0 0 0 0 0 0 0 0 0 0 0 0 0 0 0 0.20% 0 52.39% 0.19% 0 48.63% 0.18% 0 45.39% 0.34% 0 44.12% 0.51% 0 34.91% 0.42% 0 33.57%
Retail 0 0 167 6 22 0 0 0 28 5 9 0 0 0 1 2 0 0 0.49% 4 28.00% 0.38% 5 29.74% 0.32% 5 30.64% 0.60% 4 28.87% 0.70% 6 30.40% 0.69% 7 32.61%
Retail - Secured on real estate property 0.0% 0 0 114 3 20 0 0 0 13 3 8 0 0 0 0 0 0 0 0.15% 1 4.87% 0.11% 1 6.07% 0.08% 1 6.65% 0.22% 1 6.75% 0.35% 1 11.11% 0.36% 2 14.42%
Retail - Secured on real estate property - Of
Which: SME0.0% 0 0 0 0 0 0 0 0 0 0 0 0 0 0 0 0 0 0 - 0 - - 0 - - 0 - - 0 - - 0 - - 0 -
Retail - Secured on real estate property - Of
Which: non-SME0.0% 0 0 114 3 20 0 0 0 13 3 8 0 0 0 0 0 0 0 0.15% 1 4.87% 0.11% 1 6.07% 0.08% 1 6.65% 0.22% 1 6.75% 0.35% 1 11.11% 0.36% 2 14.42%
Retail - Qualifying Revolving 0 0 48 1 0 0 0 0 11 1 0 0 0 0 0 1 0 0 1.08% 2 54.10% 0.91% 2 59.31% 0.79% 3 62.36% 1.27% 2 52.71% 1.35% 3 56.50% 1.42% 3 58.93%
Retail - Other Retail 0 0 5 2 2 0 0 0 4 1 1 0 0 0 0 1 0 0 3.12% 2 57.61% 2.29% 2 59.92% 1.82% 2 61.06% 3.48% 2 56.00% 3.11% 2 56.96% 2.23% 2 58.76%
Retail - Other Retail - Of Which: SME 0 0 3 0 0 0 0 0 2 0 0 0 0 0 0 0 0 0 1.77% 0 43.74% 1.25% 0 45.09% 0.97% 0 45.49% 2.44% 0 40.69% 2.34% 0 40.50% 1.74% 0 41.81%
Retail - Other Retail - Of Which: non-SME 0 0 2 1 2 0 0 0 2 1 1 0 0 0 0 1 0 0 4.07% 1 63.65% 3.03% 1 66.44% 2.43% 1 67.99% 4.21% 1 63.45% 3.64% 1 65.63% 2.56% 1 67.94%
Equity 1 5 0 0 0 0 3 0 0 0 0 0 0 5 0 0 0 0 2.43% 5 93.77% 2.42% 5 93.77% 2.22% 5 93.80% 4.23% 5 93.49% 5.19% 5 93.35% 3.19% 5 93.64%
Securitisation 1,742 0 0 0 0 0 192 0 0 0 0 0 0 0 0 0 0 0
Other non-credit obligation assets 0 0 2 0 2 0 0 0 2 0 2 0 0 0 0 0 0 0
TOTAL 1,743 5 4,136 75 823 51 195 0 1,925 5 511 0 0 5 7 85 0 0 0.05% 103 64.91% 0.05% 107 64.31% 0.05% 110 63.65% 0.11% 107 62.74% 0.13% 116 61.11% 0.08% 122 62.27%
Securitisation and re-securitisations positions deducted from capital * 0 0 0 0 0 0 0 0 0 0 0 0
(mln EUR, %)Non-defaulted Defaulted Non-defaulted Defaulted Non-defaulted Defaulted Non-defaulted Defaulted Non-defaulted Defaulted Non-defaulted Defaulted Non-defaulted Defaulted Non-defaulted Defaulted Non-defaulted Defaulted
Impairment
rate
Stock of
Provisions
Coverage Ratio -
Default Stock
Impairment
rate
Stock of
Provisions
Coverage
Ratio - Default
Stock
Impairment
rate
Stock of
Provisions
Coverage
Ratio - Default
Stock
Impairment rateStock of
Provisions
Coverage
Ratio - Default
Stock
Impairment
rate
Stock of
Provisions
Coverage
Ratio - Default
Stock
Impairment
rate
Stock of
Provisions
Coverage
Ratio - Default
Stock
Central banks and central governments 0 0 711 0 0 0 0 0 504 0 0 0 0 0 1 0 0 0 0.11% 1 20.00% 0.11% 2 26.68% 0.11% 3 30.02% 0.23% 2 20.00% 0.93% 9 22.24% 0.46% 12 31.25%
Institutions 0 0 1,501 0 2 0 0 0 1,038 0 1 0 0 0 2 0 0 0 0.26% 7 36.35% 0.27% 11 49.77% 0.25% 15 57.36% 0.48% 10 36.78% 1.89% 39 42.24% 0.93% 53 59.39%
Corporates 0 0 3,402 21 577 1 0 0 1,856 0 577 2 0 0 4 16 0 0 0.37% 37 40.61% 0.26% 48 46.31% 0.28% 60 46.91% 1.28% 75 38.22% 2.09% 157 43.89% 0.92% 193 54.71%
Corporates - Of Which: Specialised Lending 0 0 0 0 0 0 0 0 0 0 0 0 0 0 0 0 0 0 - 0 - - 0 - - 0 - - 0 - - 0 - - 0 -
Corporates - Of Which: SME 0 0 0 0 0 0 0 0 0 0 0 0 0 0 0 0 0 0 0.86% 0 31.36% 0.48% 0 44.96% 0.56% 0 47.26% 3.31% 0 37.08% 3.12% 0 49.87% 1.34% 0 60.84%
Retail 0 0 11 1 2 0 0 0 1 1 0 0 0 0 0 0 0 0 0.27% 0 33.70% 0.25% 0 34.04% 0.24% 0 34.30% 0.32% 0 34.18% 0.43% 0 33.84% 0.49% 0 34.27%
Retail - Secured on real estate property 0.0% 0 0 0 0 1 0 0 0 1 0 0 0 0 0 0 0 0 0 0.05% 0 4.51% 0.04% 0 4.85% 0.04% 0 5.07% 0.07% 0 5.81% 0.15% 0 8.24% 0.19% 0 10.22%
Retail - Secured on real estate property - Of
Which: SME0.0% 0 0 0 0 0 0 0 0 0 0 0 0 0 0 0 0 0 0 - 0 - - 0 - - 0 - - 0 - - 0 - - 0 -
Retail - Secured on real estate property - Of
Which: non-SME0.0% 0 0 0 0 1 0 0 0 1 0 0 0 0 0 0 0 0 0 0.05% 0 4.51% 0.04% 0 4.85% 0.04% 0 5.07% 0.07% 0 5.81% 0.15% 0 8.24% 0.19% 0 10.22%
Retail - Qualifying Revolving 0 0 3 0 0 0 0 0 1 0 0 0 0 0 0 0 0 0 0.64% 0 60.06% 0.60% 0 61.68% 0.56% 0 62.75% 0.77% 0 58.41% 0.93% 0 58.19% 1.09% 0 58.23%
Retail - Other Retail 0 0 8 0 0 0 0 0 0 0 0 0 0 0 0 0 0 0 1.15% 0 65.60% 1.12% 0 66.28% 1.14% 0 66.79% 1.27% 0 64.90% 1.58% 0 64.33% 1.46% 0 64.95%
Retail - Other Retail - Of Which: SME 0 0 0 0 0 0 0 0 0 0 0 0 0 0 0 0 0 0 0.54% 0 53.89% 0.47% 0 53.35% 0.43% 0 52.70% 0.82% 0 50.66% 1.17% 0 46.50% 1.13% 0 45.67%
Retail - Other Retail - Of Which: non-SME 0 0 8 0 0 0 0 0 0 0 0 0 0 0 0 0 0 0 1.36% 0 67.41% 1.34% 0 68.32% 1.38% 0 69.06% 1.42% 0 67.32% 1.72% 0 67.82% 1.58% 0 69.03%
Equity 0 0 0 0 0 0 0 0 0 0 0 0 0 0 0 0 0 0 0.38% 0 45.00% 0.38% 0 60.09% 0.35% 0 68.58% 0.66% 0 45.00% 0.81% 0 58.15% 0.50% 0 71.96%
Securitisation 0 0 0 0 0 0 0 0 0 0 0 0 0 0 0 0 0 0
Other non-credit obligation assets 0 0 0 0 64 0 0 0 0 0 64 0 0 0 0 0 0 0
TOTAL 0 0 5,626 21 644 1 0 0 3,400 1 641 2 0 0 7 16 0 0 0.31% 46 39.22% 0.25% 62 45.71% 0.26% 78 47.43% 0.96% 87 37.37% 1.91% 205 41.89% 0.87% 258 53.69%
Securitisation and re-securitisations positions deducted from capital * 0 0 0 0 0 0 0 0 0 0 0 0
LTV % (as of
31/12/2013)
Exposure values (as of 31/12/2013) Risk exposure amounts (as of 31/12/2013) Value adjustments and provisions (as of 31/12/2013) Baseline Scenario Adverse Scenario
F-IRB A-IRB STA F-IRB A-IRB STA as of 31/12/2016 as of 31/12/2014 as of 31/12/2015 as of 31/12/2016F-IRB A-IRB STA as of 31/12/2014 as of 31/12/2015
LTV % (as of
31/12/2013)
Exposure values (as of 31/12/2013) Risk exposure amounts (as of 31/12/2013) Value adjustments and provisions (as of 31/12/2013) Baseline Scenario Adverse Scenario
F-IRB A-IRB STA F-IRB A-IRB STA F-IRB as of 31/12/2014 as of 31/12/2015 as of 31/12/2016A-IRB STA as of 31/12/2014 as of 31/12/2015 as of 31/12/2016
LTV % (as of
31/12/2013)
Exposure values (as of 31/12/2013) Risk exposure amounts (as of 31/12/2013) Value adjustments and provisions (as of 31/12/2013) Baseline Scenario Adverse Scenario
F-IRB A-IRB STA F-IRB A-IRB STA F-IRB A-IRB as of 31/12/2015 as of 31/12/2016STA as of 31/12/2014 as of 31/12/2015 as of 31/12/2016 as of 31/12/2014
Adverse Scenario
F-IRB A-IRB STA F-IRB A-IRB STA F-IRB A-IRB STA as of 31/12/2014 as of 31/12/2015 as of 31/12/2016 as of 31/12/2014 as of 31/12/2015 as of 31/12/2016LTV % (as of
31/12/2013)
Exposure values (as of 31/12/2013) Risk exposure amounts (as of 31/12/2013) Value adjustments and provisions (as of 31/12/2013)
Adverse Scenario
F-IRB A-IRB STA F-IRB A-IRB STA F-IRB A-IRB STA as of 31/12/2014 as of 31/12/2015 as of 31/12/2016 as of 31/12/2014 as of 31/12/2015 as of 31/12/2016LTV % (as of
31/12/2013)
Exposure values (as of 31/12/2013) Risk exposure amounts (as of 31/12/2013)
Baseline Scenario
Value adjustments and provisions (as of 31/12/2013) Baseline Scenario
(*) Refers to the part of Securitization exposure that is deducted from capital and is not included in RWA
(*) Refers to the part of Securitization exposure that is deducted from capital and is not included in RWA
(*) Refers to the part of Securitization exposure that is deducted from capital and is not included in RWA
(*) Refers to the part of Securitization exposure that is deducted from capital and is not included in RWA
(*) Refers to the part of Securitization exposure that is deducted from capital and is not included in RWA
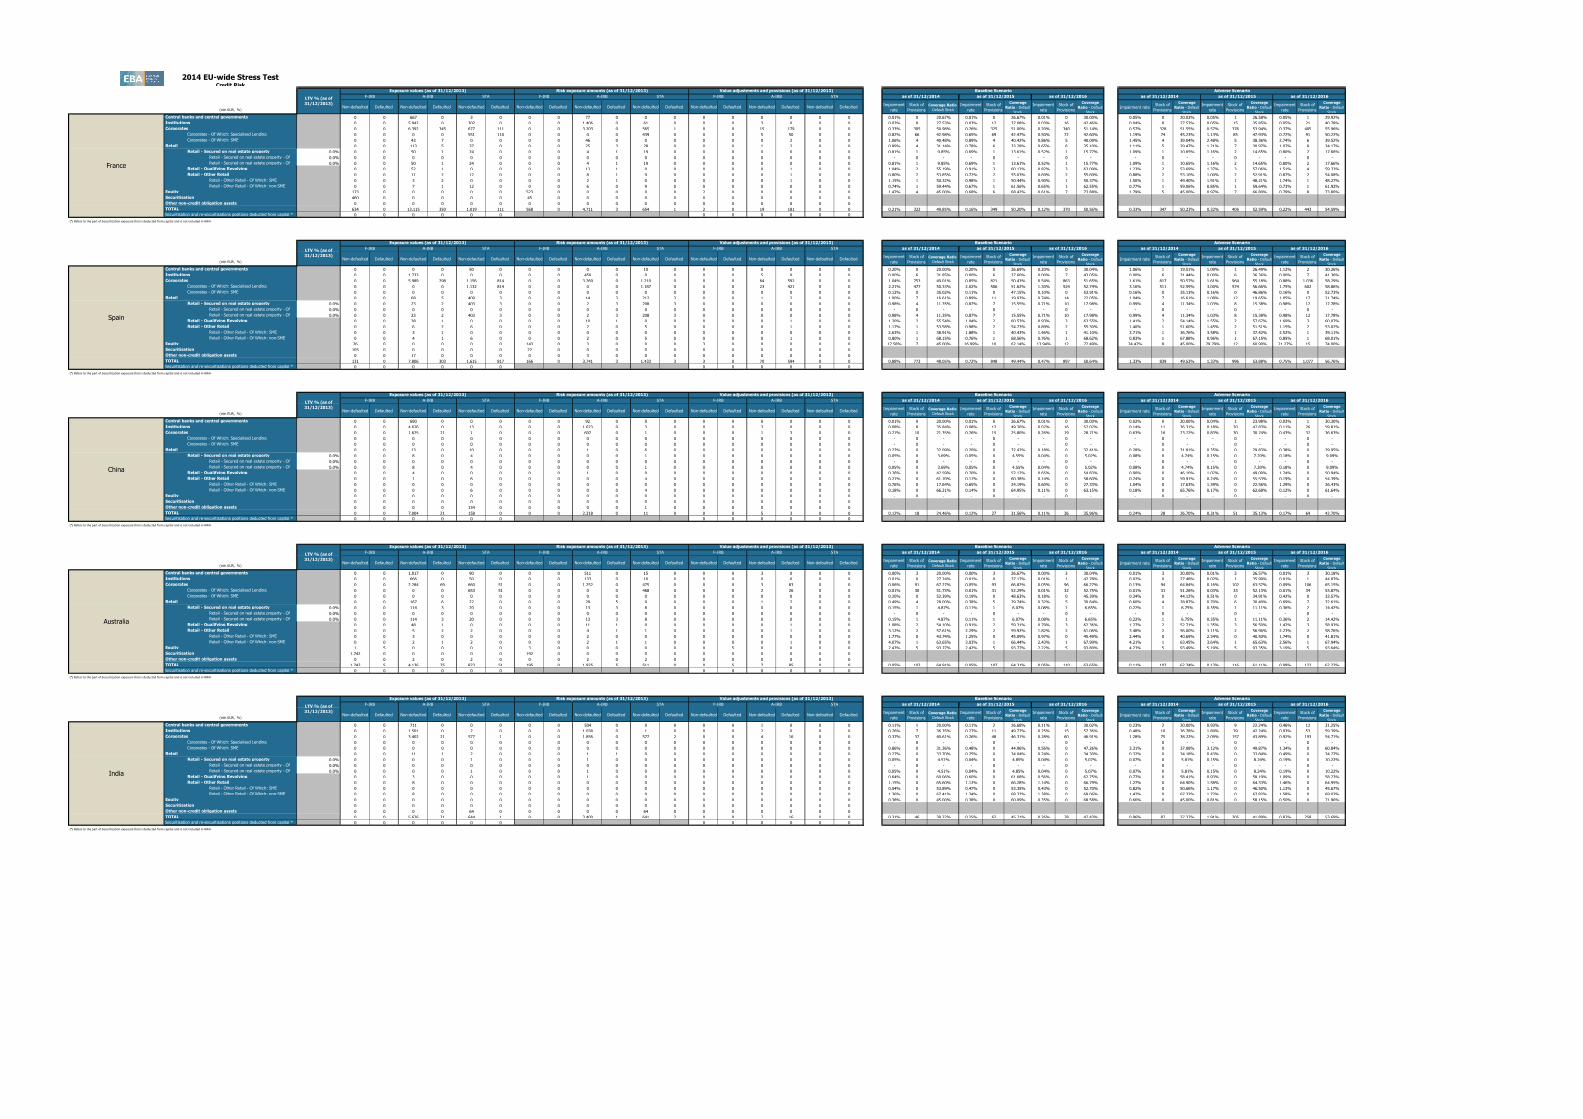
France
Spain
China
India
Australia
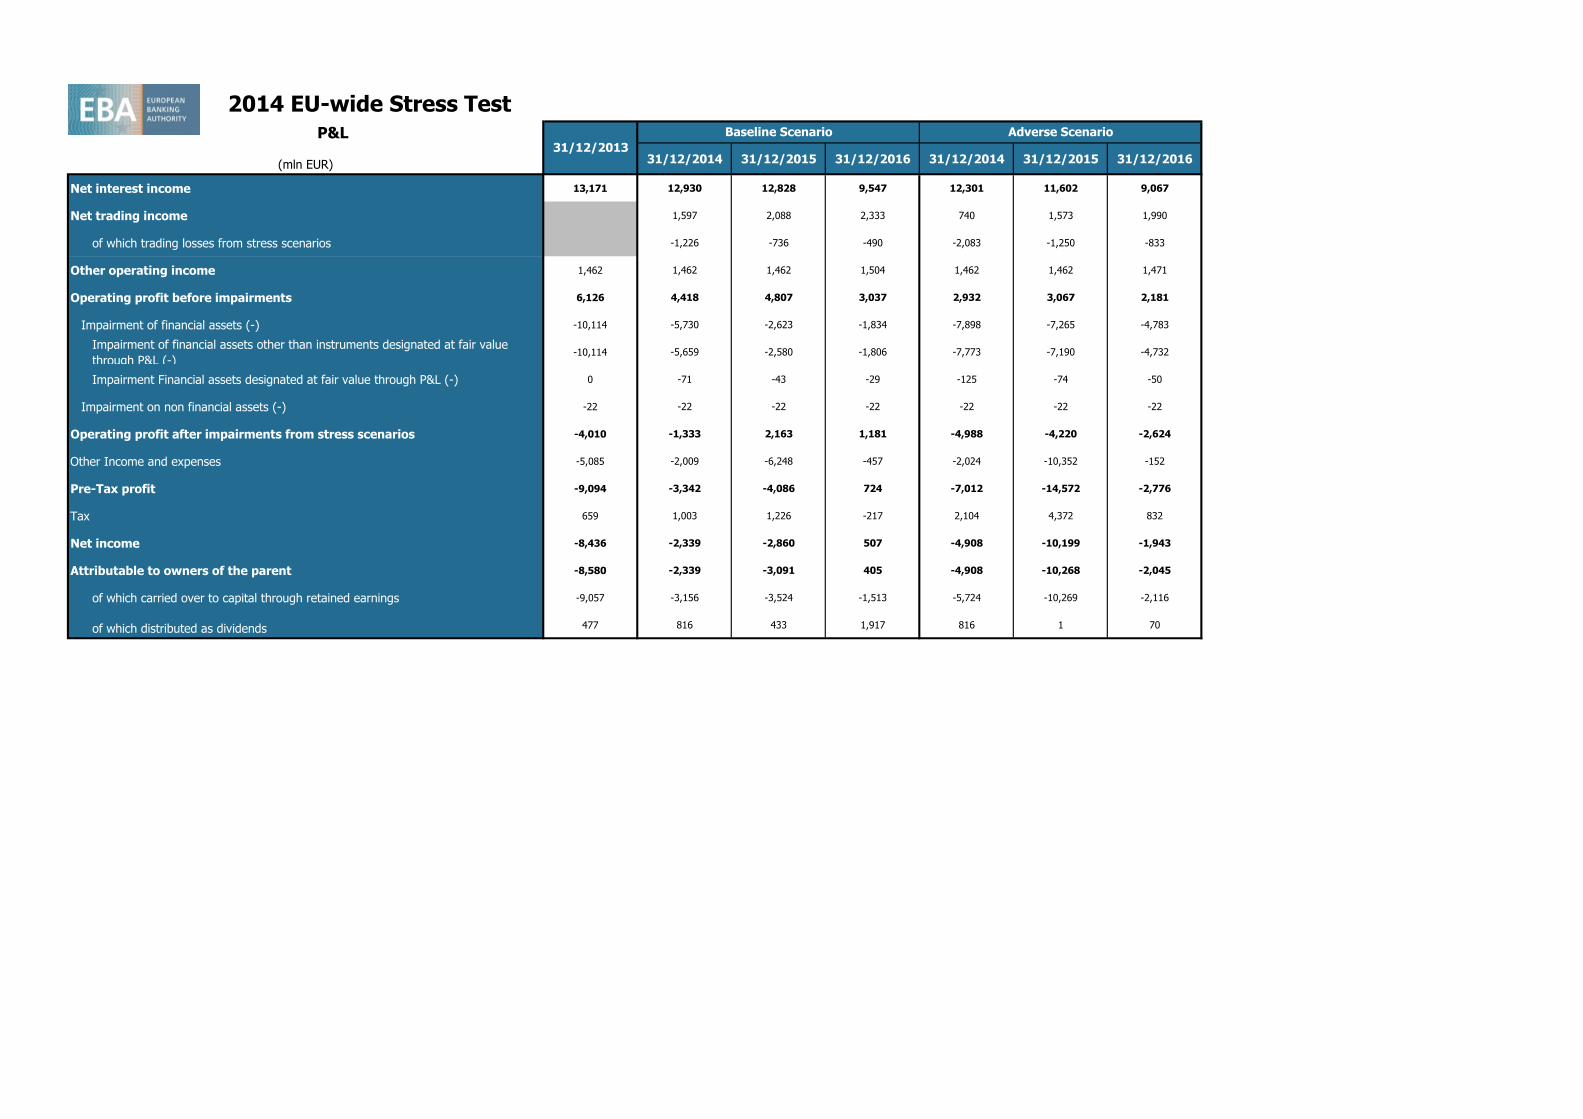
2014 EU-wide Stress Test P&L
(mln EUR) 31/12/2014 31/12/2015 31/12/2016 31/12/2014 31/12/2015 31/12/2016
Net interest income 13,171 12,930 12,828 9,547 12,301 11,602 9,067
Net trading income 1,597 2,088 2,333 740 1,573 1,990
of which trading losses from stress scenarios -1,226 -736 -490 -2,083 -1,250 -833
Other operating income 1,462 1,462 1,462 1,504 1,462 1,462 1,471
Operating profit before impairments 6,126 4,418 4,807 3,037 2,932 3,067 2,181
Impairment of financial assets (-) -10,114 -5,730 -2,623 -1,834 -7,898 -7,265 -4,783
Impairment of financial assets other than instruments designated at fair value
through P&L (-)-10,114 -5,659 -2,580 -1,806 -7,773 -7,190 -4,732
Impairment Financial assets designated at fair value through P&L (-) 0 -71 -43 -29 -125 -74 -50
Impairment on non financial assets (-) -22 -22 -22 -22 -22 -22 -22
Operating profit after impairments from stress scenarios -4,010 -1,333 2,163 1,181 -4,988 -4,220 -2,624
Other Income and expenses -5,085 -2,009 -6,248 -457 -2,024 -10,352 -152
Pre-Tax profit -9,094 -3,342 -4,086 724 -7,012 -14,572 -2,776
Tax 659 1,003 1,226 -217 2,104 4,372 832
Net income -8,436 -2,339 -2,860 507 -4,908 -10,199 -1,943
Attributable to owners of the parent -8,580 -2,339 -3,091 405 -4,908 -10,268 -2,045
of which carried over to capital through retained earnings -9,057 -3,156 -3,524 -1,513 -5,724 -10,269 -2,116
of which distributed as dividends 477 816 433 1,917 816 1 70
31/12/2013
Baseline Scenario Adverse Scenario
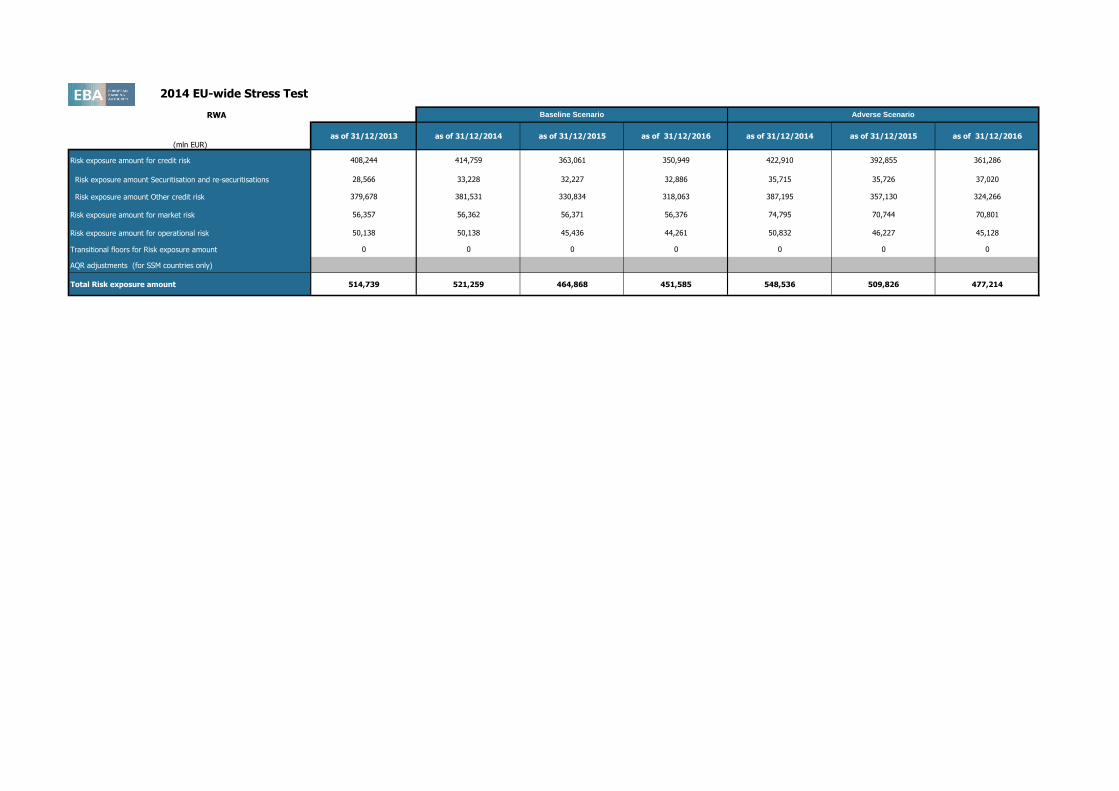
2014 EU-wide Stress Test
RWA
(mln EUR)as of 31/12/2013 as of 31/12/2014 as of 31/12/2015 as of 31/12/2016 as of 31/12/2014 as of 31/12/2015 as of 31/12/2016
Risk exposure amount for credit risk 408,244 414,759 363,061 350,949 422,910 392,855 361,286
Risk exposure amount Securitisation and re-securitisations 28,566 33,228 32,227 32,886 35,715 35,726 37,020
Risk exposure amount Other credit risk 379,678 381,531 330,834 318,063 387,195 357,130 324,266
Risk exposure amount for market risk 56,357 56,362 56,371 56,376 74,795 70,744 70,801
Risk exposure amount for operational risk 50,138 50,138 45,436 44,261 50,832 46,227 45,128
Transitional floors for Risk exposure amount 0 0 0 0 0 0 0
AQR adjustments (for SSM countries only) 0 0 0 0 0 0 0
Total Risk exposure amount 514,739 521,259 464,868 451,585 548,536 509,826 477,214
Baseline Scenario Adverse Scenario
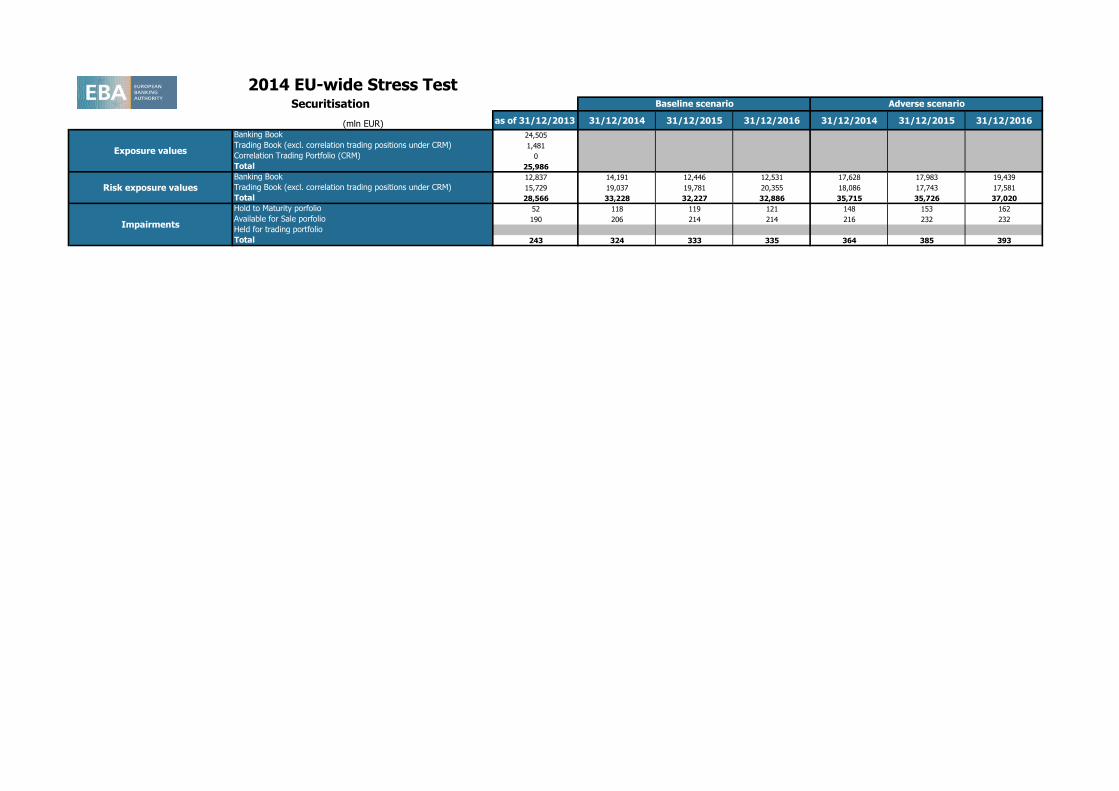
(mln EUR) as of 31/12/2013 31/12/2014 31/12/2015 31/12/2016 31/12/2014 31/12/2015 31/12/2016
Banking Book 24,505
Trading Book (excl. correlation trading positions under CRM) 1,481
Correlation Trading Portfolio (CRM) 0
Total 25,986
Banking Book 12,837 14,191 12,446 12,531 17,628 17,983 19,439
Trading Book (excl. correlation trading positions under CRM) 15,729 19,037 19,781 20,355 18,086 17,743 17,581
Total 28,566 33,228 32,227 32,886 35,715 35,726 37,020
Hold to Maturity porfolio 52 118 119 121 148 153 162
Available for Sale porfolio 190 206 214 214 216 232 232
Held for trading portfolio
Total 243 324 333 335 364 385 393
2014 EU-wide Stress Test
Impairments
Baseline scenario Adverse scenario
Exposure values
Risk exposure values
Securitisation

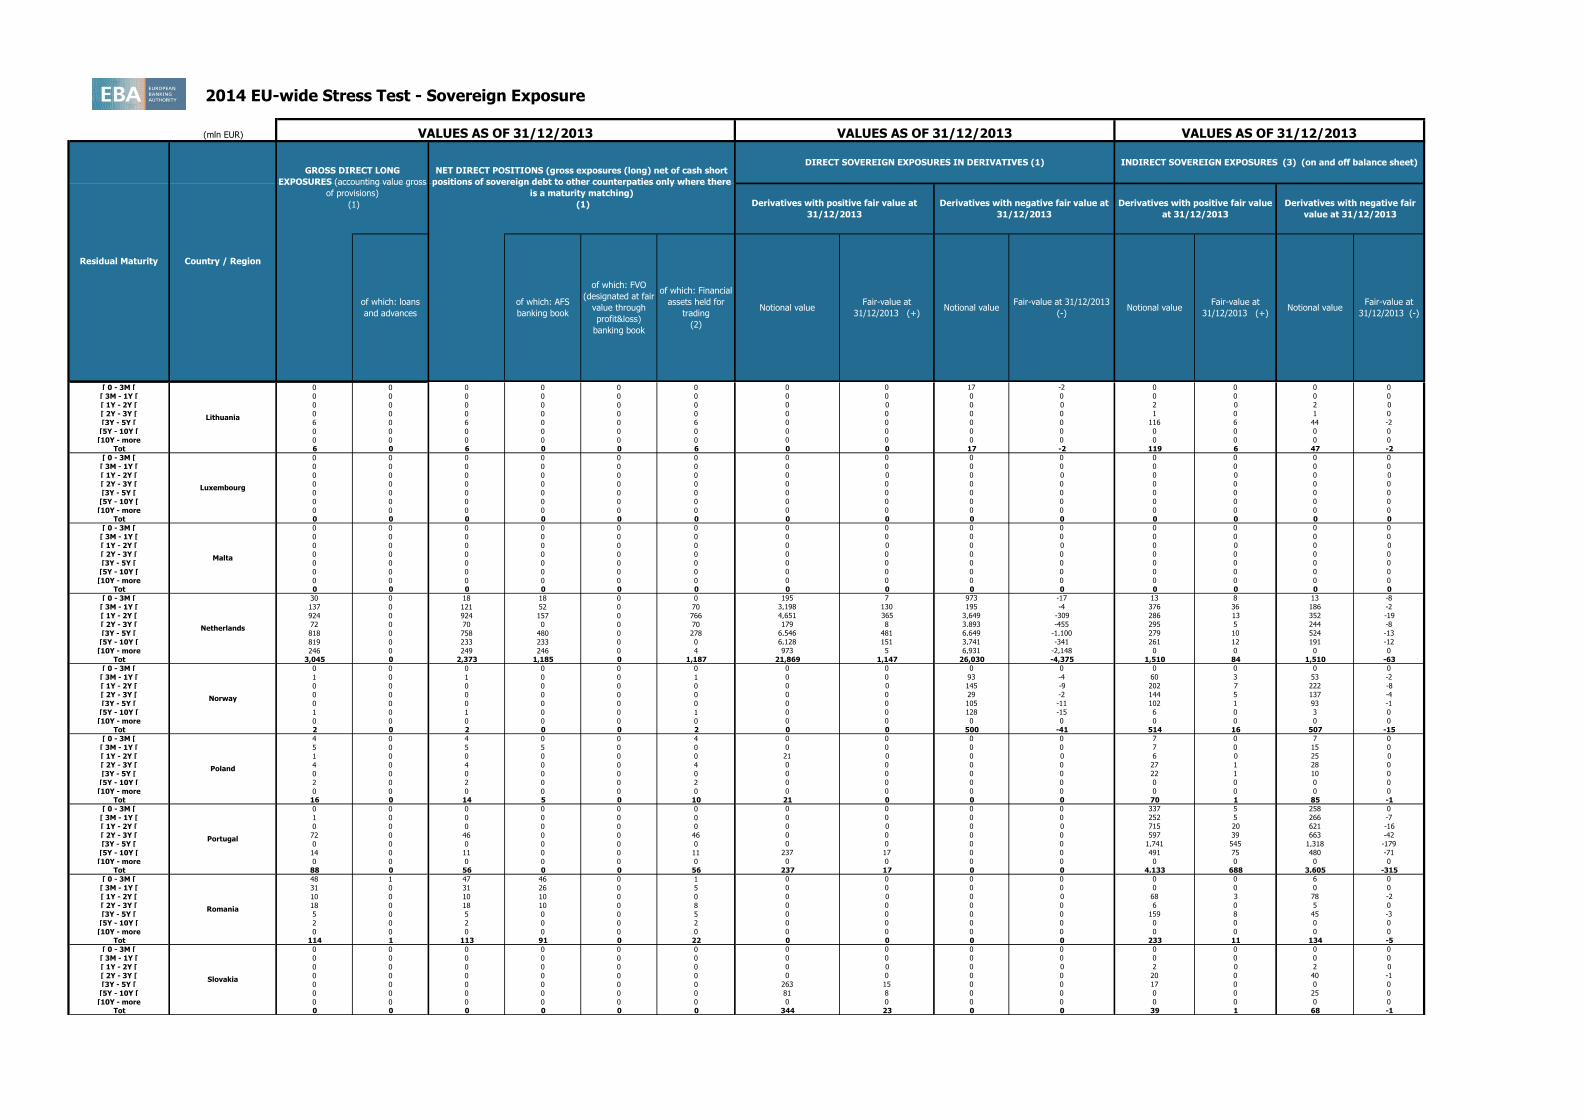
2014 EU-wide Stress Test - Sovereign Exposure
(mln EUR)
[ 0 - 3M [ 0 0 0 0 0 0 261 14 0 0 43 8 43 -8
[ 3M - 1Y [ 36 0 20 0 0 20 541 12 243 -5 283 11 217 -16
[ 1Y - 2Y [ 4 0 0 0 0 0 3,990 6 0 0 380 14 419 -13
[ 2Y - 3Y [ 2 0 0 0 0 0 3,138 3 0 0 237 7 420 -12
[3Y - 5Y [ 30 0 2 2 0 0 49 3 498 -100 1,131 37 720 -24
[5Y - 10Y [ 181 0 38 0 0 38 4,185 114 0 0 235 8 241 -9
[10Y - more 341 0 341 341 0 0 1,479 165 7 -3 0 0 0 0
Tot 594 0 402 343 0 59 13,643 317 749 -108 2,310 85 2,060 -82
[ 0 - 3M [ 5 0 0 0 0 0 0 0 0 0 51 0 33 0
[ 3M - 1Y [ 301 0 0 0 0 0 122 4 752 -33 152 4 210 -3
[ 1Y - 2Y [ 40 0 0 0 0 0 446 22 84 -7 469 17 316 -11
[ 2Y - 3Y [ 1 0 0 0 0 0 0 0 0 0 455 21 463 -17
[3Y - 5Y [ 332 0 240 121 0 119 73 14 1,873 -366 534 27 653 -29
[5Y - 10Y [ 140 0 0 0 0 0 483 89 0 0 177 9 308 -10
[10Y - more 462 0 462 410 0 52 448 82 0 0 0 0 0 0
Tot 1,281 0 702 531 0 170 1,572 211 2,710 -406 1,838 78 1,982 -70
[ 0 - 3M [ 0 0 0 0 0 0 0 0 0 0 11 0 7 0
[ 3M - 1Y [ 0 0 0 0 0 0 0 0 0 0 3 0 7 0
[ 1Y - 2Y [ 0 0 0 0 0 0 0 0 0 0 2 0 5 0
[ 2Y - 3Y [ 0 0 0 0 0 0 0 0 0 0 48 1 6 0
[3Y - 5Y [ 0 0 0 0 0 0 0 0 0 0 36 1 35 -1
[5Y - 10Y [ 0 0 0 0 0 0 0 0 0 0 0 0 0 0
[10Y - more 0 0 0 0 0 0 0 0 0 0 0 0 0 0
Tot 0 0 0 0 0 0 0 0 0 0 101 2 61 -1
[ 0 - 3M [ 0 0 0 0 0 0 0 0 0 0 0 0 0 0
[ 3M - 1Y [ 1 0 1 0 0 1 0 0 0 0 0 0 0 0
[ 1Y - 2Y [ 1 0 1 0 0 1 0 0 0 0 0 0 0 0
[ 2Y - 3Y [ 0 0 0 0 0 0 0 0 0 0 0 0 0 0
[3Y - 5Y [ 0 0 0 0 0 0 0 0 0 0 3 0 3 0
[5Y - 10Y [ 0 0 0 0 0 0 0 0 0 0 0 0 0 0
[10Y - more 0 0 0 0 0 0 0 0 0 0 0 0 0 0
Tot 2 0 2 0 0 2 0 0 0 0 3 0 3 0
[ 0 - 3M [ 0 0 0 0 0 0 0 0 0 0 0 0 7 0
[ 3M - 1Y [ 0 0 0 0 0 0 0 1 0 0 22 0 27 0
[ 1Y - 2Y [ 8 0 8 8 0 0 215 22 0 0 36 0 14 0
[ 2Y - 3Y [ 6 0 6 6 0 0 0 0 0 0 11 0 7 0
[3Y - 5Y [ 53 0 53 53 0 0 0 0 0 0 0 0 7 0
[5Y - 10Y [ 71 0 70 70 0 0 107 24 0 0 0 0 0 0
[10Y - more 0 0 0 0 0 0 0 0 0 0 0 0 0 0
Tot 138 0 137 137 0 0 321 47 0 0 68 1 62 0
[ 0 - 3M [ 0 0 0 0 0 0 0 0 0 0 13 8 13 -8
[ 3M - 1Y [ 0 0 0 0 0 0 0 0 104 -4 104 3 97 -2
[ 1Y - 2Y [ 0 0 0 0 0 0 0 0 243 -15 132 7 124 -7
[ 2Y - 3Y [ 1 0 1 0 0 1 0 0 203 -21 324 6 340 -5
[3Y - 5Y [ 0 0 0 0 0 0 0 0 185 -23 91 0 143 -1
[5Y - 10Y [ 0 0 0 0 0 0 99 4 88 -1 58 1 73 -1
[10Y - more 0 0 0 0 0 0 0 0 0 0 0 0 0 0
Tot 1 0 1 0 0 1 99 4 824 -65 722 26 791 -25
[ 0 - 3M [ 0 0 0 0 0 0 0 0 0 0 0 0 0 0
[ 3M - 1Y [ 0 0 0 0 0 0 0 0 0 0 0 0 0 0
[ 1Y - 2Y [ 0 0 0 0 0 0 0 0 0 0 0 0 0 0
[ 2Y - 3Y [ 0 0 0 0 0 0 0 0 0 0 0 0 0 0
[3Y - 5Y [ 0 0 0 0 0 0 0 0 0 0 0 0 0 0
[5Y - 10Y [ 0 0 0 0 0 0 0 0 0 0 0 0 0 0
[10Y - more 0 0 0 0 0 0 0 0 0 0 0 0 0 0
Tot 0 0 0 0 0 0 0 0 0 0 0 0 0 0
[ 0 - 3M [ 0 0 0 0 0 0 223 4 0 0 0 0 0 0
[ 3M - 1Y [ 3 1 0 0 0 0 389 10 0 0 62 3 53 -2
[ 1Y - 2Y [ 263 0 263 0 0 263 204 12 272 -20 332 8 234 -8
[ 2Y - 3Y [ 8 0 4 0 0 4 671 67 108 -3 244 5 279 -5
[3Y - 5Y [ 314 3 271 7 0 264 978 129 683 -52 177 1 189 -1
[5Y - 10Y [ 352 5 312 0 0 312 1,012 180 146 -18 39 0 75 0
[10Y - more 78 78 0 0 0 0 414 69 940 -55 0 0 0 0
Tot 1,019 88 849 7 0 842 3,892 470 2,149 -149 853 17 830 -16
[ 0 - 3M [ 12 0 0 0 0 0 1,903 50 2,119 -16 178 17 123 -10
[ 3M - 1Y [ 2,941 0 2,920 391 0 2,528 1,770 39 2,049 -75 264 4 324 -3
[ 1Y - 2Y [ 373 0 157 157 0 0 275 16 474 -11 1,004 18 873 -12
[ 2Y - 3Y [ 53 0 24 24 0 0 315 25 4 0 1,240 103 1,225 -10
[3Y - 5Y [ 741 29 0 0 0 0 567 49 533 -119 1,666 135 1,469 -48
[5Y - 10Y [ 389 85 112 112 0 0 831 150 100 -1 598 42 456 -26
[10Y - more 1,107 376 732 319 0 413 631 207 422 -36 32 13 17 -10
Tot 5,615 490 3,944 1,003 0 2,941 6,293 536 5,701 -260 4,982 333 4,488 -119
Residual Maturity Country / Region
GROSS DIRECT LONG
EXPOSURES (accounting value gross
of provisions)
(1)
NET DIRECT POSITIONS (gross exposures (long) net of cash short
positions of sovereign debt to other counterpaties only where there
is a maturity matching)
(1)
DIRECT SOVEREIGN EXPOSURES IN DERIVATIVES (1)
of which: loans
and advances
of which: AFS
banking book
of which: FVO
(designated at fair
value through
profit&loss)
banking book
of which: Financial
assets held for
trading
(2)
Derivatives with positive fair value at
31/12/2013
Derivatives with negative fair value at
31/12/2013
Derivatives with positive fair value
at 31/12/2013
Derivatives with negative fair
value at 31/12/2013
VALUES AS OF 31/12/2013 VALUES AS OF 31/12/2013 VALUES AS OF 31/12/2013
INDIRECT SOVEREIGN EXPOSURES (3) (on and off balance sheet)
Fair-value at
31/12/2013 (+)Notional value
Fair-value at
31/12/2013 (-)Notional value
Fair-value at
31/12/2013 (+)Notional value
Fair-value at 31/12/2013
(-)
Austria
Belgium
Bulgaria
Cyprus
Notional value
Czech Republic
Denmark
Estonia
Finland
France

2014 EU-wide Stress Test - Sovereign Exposure
(mln EUR)
Residual Maturity Country / Region
GROSS DIRECT LONG
EXPOSURES (accounting value gross
of provisions)
(1)
NET DIRECT POSITIONS (gross exposures (long) net of cash short
positions of sovereign debt to other counterpaties only where there
is a maturity matching)
(1)
DIRECT SOVEREIGN EXPOSURES IN DERIVATIVES (1)
of which: loans
and advances
of which: AFS
banking book
of which: FVO
(designated at fair
value through
profit&loss)
banking book
of which: Financial
assets held for
trading
(2)
Derivatives with positive fair value at
31/12/2013
Derivatives with negative fair value at
31/12/2013
Derivatives with positive fair value
at 31/12/2013
Derivatives with negative fair
value at 31/12/2013
VALUES AS OF 31/12/2013 VALUES AS OF 31/12/2013 VALUES AS OF 31/12/2013
INDIRECT SOVEREIGN EXPOSURES (3) (on and off balance sheet)
Fair-value at
31/12/2013 (+)Notional value
Fair-value at
31/12/2013 (-)Notional value
Fair-value at
31/12/2013 (+)Notional value
Fair-value at 31/12/2013
(-)
Austria
Notional value
[ 0 - 3M [ 7 0 0 0 0 0 49 0 0 0 73 0 112 0
[ 3M - 1Y [ 3,879 0 3,541 373 0 3,168 72 4 584 -22 612 4 197 -2
[ 1Y - 2Y [ 2,528 0 1,513 438 0 1,075 814 47 730 -49 849 9 999 -9
[ 2Y - 3Y [ 618 0 458 458 0 0 68 3 1,070 -100 1,066 132 952 -8
[3Y - 5Y [ 3,622 0 3,251 2,075 0 1,175 4,002 584 170 -28 1,822 27 1,224 -15
[5Y - 10Y [ 1,853 0 1,541 1,541 0 0 2,758 604 2,533 -252 517 8 396 -5
[10Y - more 980 0 980 730 0 249 1,592 223 3,908 -947 7 0 36 -1
Tot 13,488 0 11,283 5,616 0 5,668 9,354 1,466 8,995 -1,397 4,946 181 3,916 -41
[ 0 - 3M [ 0 0 0 0 0 0 0 0 0 0 0 0 0 0
[ 3M - 1Y [ 0 0 0 0 0 0 0 0 0 0 0 0 0 0
[ 1Y - 2Y [ 0 0 0 0 0 0 0 0 0 0 0 0 0 0
[ 2Y - 3Y [ 0 0 0 0 0 0 0 0 0 0 0 0 0 0
[3Y - 5Y [ 0 0 0 0 0 0 0 0 0 0 0 0 0 0
[5Y - 10Y [ 0 0 0 0 0 0 0 0 0 0 0 0 0 0
[10Y - more 0 0 0 0 0 0 0 0 0 0 0 0 0 0
Tot 0 0 0 0 0 0 0 0 0 0 0 0 0 0
[ 0 - 3M [ 0 0 0 0 0 0 0 0 0 0 0 0 0 0
[ 3M - 1Y [ 0 0 0 0 0 0 0 0 0 0 0 0 0 0
[ 1Y - 2Y [ 0 0 0 0 0 0 0 0 0 0 0 0 0 0
[ 2Y - 3Y [ 0 0 0 0 0 0 0 0 0 0 0 0 0 0
[3Y - 5Y [ 0 0 0 0 0 0 487 30 973 -72 0 0 0 0
[5Y - 10Y [ 0 0 0 0 0 0 487 42 487 -84 0 0 0 0
[10Y - more 0 0 0 0 0 0 243 55 0 0 0 0 0 0
Tot 0 0 0 0 0 0 1,216 127 1,460 -156 0 0 0 0
[ 0 - 3M [ 0 0 0 0 0 0 0 0 681 -20 18 0 49 0
[ 3M - 1Y [ 0 0 0 0 0 0 0 0 0 0 103 1 115 -1
[ 1Y - 2Y [ 0 0 0 0 0 0 0 0 373 -2 76 2 73 -1
[ 2Y - 3Y [ 0 0 0 0 0 0 0 0 61 -26 86 2 85 -3
[3Y - 5Y [ 0 0 0 0 0 0 244 22 147 -11 57 3 28 -2
[5Y - 10Y [ 0 0 0 0 0 0 0 0 331 -45 4 0 0 0
[10Y - more 0 0 0 0 0 0 0 0 0 0 0 0 0 0
Tot 0 0 0 0 0 0 244 22 1,594 -104 343 9 351 -8
[ 0 - 3M [ 0 0 0 0 0 0 0 0 0 0 0 0 0 0
[ 3M - 1Y [ 0 0 0 0 0 0 0 0 0 0 0 0 0 0
[ 1Y - 2Y [ 0 0 0 0 0 0 0 0 0 0 0 0 0 0
[ 2Y - 3Y [ 0 0 0 0 0 0 0 0 0 0 0 0 0 0
[3Y - 5Y [ 0 0 0 0 0 0 0 0 0 0 0 0 0 0
[5Y - 10Y [ 0 0 0 0 0 0 0 0 0 0 0 0 0 0
[10Y - more 0 0 0 0 0 0 0 0 0 0 0 0 0 0
Tot 0 0 0 0 0 0 0 0 0 0 0 0 0 0
[ 0 - 3M [ 0 0 0 0 0 0 2,361 26 1,836 -34 117 9 110 -9
[ 3M - 1Y [ 2 2 0 0 0 0 0 0 0 0 215 4 211 -4
[ 1Y - 2Y [ 10 7 2 0 0 2 0 0 0 0 457 10 423 -10
[ 2Y - 3Y [ 12 4 8 0 0 8 0 0 0 0 419 29 720 -54
[3Y - 5Y [ 63 7 56 56 0 0 0 0 535 -2 1,434 272 1,205 -55
[5Y - 10Y [ 132 21 112 112 0 0 0 0 0 0 163 6 246 -7
[10Y - more 6 6 0 0 0 0 0 0 0 0 0 0 0 0
Tot 226 47 179 168 0 11 2,361 26 2,371 -36 2,806 329 2,916 -138
[ 0 - 3M [ 1,611 0 1,355 0 0 1,355 0 0 0 0 226 9 161 -9
[ 3M - 1Y [ 1,184 0 125 0 0 125 0 0 0 0 496 18 1,186 -51
[ 1Y - 2Y [ 1,093 0 0 0 0 0 35 2 151 -7 4,482 1,528 2,836 -110
[ 2Y - 3Y [ 428 0 107 107 0 0 20 1 0 -1 2,204 631 3,097 -146
[3Y - 5Y [ 661 0 435 301 0 134 26 2 60 -2 5,735 839 5,447 -445
[5Y - 10Y [ 387 0 0 0 0 0 66 20 0 0 2,221 247 2,098 -198
[10Y - more 429 0 429 106 0 324 135 60 338 -21 982 382 650 -113
Tot 5,793 0 2,452 513 0 1,938 282 85 549 -31 16,346 3,654 15,475 -1,073
[ 0 - 3M [ 0 0 0 0 0 0 0 0 0 0 4 0 5 0
[ 3M - 1Y [ 0 0 0 0 0 0 0 0 0 0 12 1 15 0
[ 1Y - 2Y [ 0 0 0 0 0 0 0 0 0 0 2 0 2 0
[ 2Y - 3Y [ 0 0 0 0 0 0 0 0 0 0 0 0 0 0
[3Y - 5Y [ 0 0 0 0 0 0 0 0 0 0 7 0 7 0
[5Y - 10Y [ 0 0 0 0 0 0 0 0 0 0 9 0 10 0
[10Y - more 0 0 0 0 0 0 0 0 0 0 0 0 0 0
Tot 0 0 0 0 0 0 0 0 0 0 35 1 39 -1
[ 0 - 3M [ 0 0 0 0 0 0 0 0 0 0 0 0 0 0
[ 3M - 1Y [ 0 0 0 0 0 0 0 0 0 0 0 0 0 0
[ 1Y - 2Y [ 0 0 0 0 0 0 0 0 0 0 0 0 0 0
[ 2Y - 3Y [ 0 0 0 0 0 0 0 0 0 0 0 0 0 0
[3Y - 5Y [ 0 0 0 0 0 0 0 0 0 0 0 0 0 0
[5Y - 10Y [ 0 0 0 0 0 0 0 0 0 0 0 0 0 0
[10Y - more 0 0 0 0 0 0 0 0 0 0 0 0 0 0
Tot 0 0 0 0 0 0 0 0 0 0 0 0 0 0
Latvia
Germany
Greece
Hungary
Iceland
Ireland
Italy
Croatia
Liechtenstein
2014 EU-wide Stress Test - Sovereign Exposure
(mln EUR)
Residual Maturity Country / Region
GROSS DIRECT LONG
EXPOSURES (accounting value gross
of provisions)
(1)
NET DIRECT POSITIONS (gross exposures (long) net of cash short
positions of sovereign debt to other counterpaties only where there
is a maturity matching)
(1)
DIRECT SOVEREIGN EXPOSURES IN DERIVATIVES (1)
of which: loans
and advances
of which: AFS
banking book
of which: FVO
(designated at fair
value through
profit&loss)
banking book
of which: Financial
assets held for
trading
(2)
Derivatives with positive fair value at
31/12/2013
Derivatives with negative fair value at
31/12/2013
Derivatives with positive fair value
at 31/12/2013
Derivatives with negative fair
value at 31/12/2013
VALUES AS OF 31/12/2013 VALUES AS OF 31/12/2013 VALUES AS OF 31/12/2013
INDIRECT SOVEREIGN EXPOSURES (3) (on and off balance sheet)
Fair-value at
31/12/2013 (+)Notional value
Fair-value at
31/12/2013 (-)Notional value
Fair-value at
31/12/2013 (+)Notional value
Fair-value at 31/12/2013
(-)
Austria
Notional value
[ 0 - 3M [ 0 0 0 0 0 0 0 0 17 -2 0 0 0 0
[ 3M - 1Y [ 0 0 0 0 0 0 0 0 0 0 0 0 0 0
[ 1Y - 2Y [ 0 0 0 0 0 0 0 0 0 0 2 0 2 0
[ 2Y - 3Y [ 0 0 0 0 0 0 0 0 0 0 1 0 1 0
[3Y - 5Y [ 6 0 6 0 0 6 0 0 0 0 116 6 44 -2
[5Y - 10Y [ 0 0 0 0 0 0 0 0 0 0 0 0 0 0
[10Y - more 0 0 0 0 0 0 0 0 0 0 0 0 0 0
Tot 6 0 6 0 0 6 0 0 17 -2 119 6 47 -2
[ 0 - 3M [ 0 0 0 0 0 0 0 0 0 0 0 0 0 0
[ 3M - 1Y [ 0 0 0 0 0 0 0 0 0 0 0 0 0 0
[ 1Y - 2Y [ 0 0 0 0 0 0 0 0 0 0 0 0 0 0
[ 2Y - 3Y [ 0 0 0 0 0 0 0 0 0 0 0 0 0 0
[3Y - 5Y [ 0 0 0 0 0 0 0 0 0 0 0 0 0 0
[5Y - 10Y [ 0 0 0 0 0 0 0 0 0 0 0 0 0 0
[10Y - more 0 0 0 0 0 0 0 0 0 0 0 0 0 0
Tot 0 0 0 0 0 0 0 0 0 0 0 0 0 0
[ 0 - 3M [ 30 0 18 18 0 0 195 7 973 -17 13 8 13 -8
[ 3M - 1Y [ 137 0 121 52 0 70 3,198 130 195 -4 376 36 186 -2
[ 1Y - 2Y [ 924 0 924 157 0 766 4,651 365 3,649 -309 286 13 352 -19
[ 2Y - 3Y [ 72 0 70 0 0 70 179 8 3,893 -455 295 5 244 -8
[3Y - 5Y [ 818 0 758 480 0 278 6,546 481 6,649 -1,100 279 10 524 -13
[5Y - 10Y [ 819 0 233 233 0 0 6,128 151 3,741 -341 261 12 191 -12
[10Y - more 246 0 249 246 0 4 973 5 6,931 -2,148 0 0 0 0
Tot 3,045 0 2,373 1,185 0 1,187 21,869 1,147 26,030 -4,375 1,510 84 1,510 -63
[ 0 - 3M [ 0 0 0 0 0 0 0 0 0 0 0 0 0 0
[ 3M - 1Y [ 1 0 1 0 0 1 0 0 93 -4 60 3 53 -2
[ 1Y - 2Y [ 0 0 0 0 0 0 0 0 145 -9 202 7 222 -8
[ 2Y - 3Y [ 0 0 0 0 0 0 0 0 29 -2 144 5 137 -4
[3Y - 5Y [ 0 0 0 0 0 0 0 0 105 -11 102 1 93 -1
[5Y - 10Y [ 1 0 1 0 0 1 0 0 128 -15 6 0 3 0
[10Y - more 0 0 0 0 0 0 0 0 0 0 0 0 0 0
Tot 2 0 2 0 0 2 0 0 500 -41 514 16 507 -15
[ 0 - 3M [ 4 0 4 0 0 4 0 0 0 0 7 0 7 0
[ 3M - 1Y [ 5 0 5 5 0 0 0 0 0 0 7 0 15 0
[ 1Y - 2Y [ 1 0 0 0 0 0 21 0 0 0 6 0 25 0
[ 2Y - 3Y [ 4 0 4 0 0 4 0 0 0 0 27 1 28 0
[3Y - 5Y [ 0 0 0 0 0 0 0 0 0 0 22 1 10 0
[5Y - 10Y [ 2 0 2 0 0 2 0 0 0 0 0 0 0 0
[10Y - more 0 0 0 0 0 0 0 0 0 0 0 0 0 0
Tot 16 0 14 5 0 10 21 0 0 0 70 1 85 -1
[ 0 - 3M [ 0 0 0 0 0 0 0 0 0 0 337 5 258 0
[ 3M - 1Y [ 1 0 0 0 0 0 0 0 0 0 252 5 266 -7
[ 1Y - 2Y [ 0 0 0 0 0 0 0 0 0 0 715 20 621 -16
[ 2Y - 3Y [ 72 0 46 0 0 46 0 0 0 0 597 39 663 -42
[3Y - 5Y [ 0 0 0 0 0 0 0 0 0 0 1,741 545 1,318 -179
[5Y - 10Y [ 14 0 11 0 0 11 237 17 0 0 491 75 480 -71
[10Y - more 0 0 0 0 0 0 0 0 0 0 0 0 0 0
Tot 88 0 56 0 0 56 237 17 0 0 4,133 688 3,605 -315
[ 0 - 3M [ 48 1 47 46 0 1 0 0 0 0 0 0 6 0
[ 3M - 1Y [ 31 0 31 26 0 5 0 0 0 0 0 0 0 0
[ 1Y - 2Y [ 10 0 10 10 0 0 0 0 0 0 68 3 78 -2
[ 2Y - 3Y [ 18 0 18 10 0 8 0 0 0 0 6 0 5 0
[3Y - 5Y [ 5 0 5 0 0 5 0 0 0 0 159 8 45 -3
[5Y - 10Y [ 2 0 2 0 0 2 0 0 0 0 0 0 0 0
[10Y - more 0 0 0 0 0 0 0 0 0 0 0 0 0 0
Tot 114 1 113 91 0 22 0 0 0 0 233 11 134 -5
[ 0 - 3M [ 0 0 0 0 0 0 0 0 0 0 0 0 0 0
[ 3M - 1Y [ 0 0 0 0 0 0 0 0 0 0 0 0 0 0
[ 1Y - 2Y [ 0 0 0 0 0 0 0 0 0 0 2 0 2 0
[ 2Y - 3Y [ 0 0 0 0 0 0 0 0 0 0 20 0 40 -1
[3Y - 5Y [ 0 0 0 0 0 0 263 15 0 0 17 0 0 0
[5Y - 10Y [ 0 0 0 0 0 0 81 8 0 0 0 0 25 0
[10Y - more 0 0 0 0 0 0 0 0 0 0 0 0 0 0
Tot 0 0 0 0 0 0 344 23 0 0 39 1 68 -1
Lithuania
Luxembourg
Malta
Netherlands
Norway
Poland
Portugal
Romania
Slovakia
2014 EU-wide Stress Test - Sovereign Exposure
(mln EUR)
Residual Maturity Country / Region
GROSS DIRECT LONG
EXPOSURES (accounting value gross
of provisions)
(1)
NET DIRECT POSITIONS (gross exposures (long) net of cash short
positions of sovereign debt to other counterpaties only where there
is a maturity matching)
(1)
DIRECT SOVEREIGN EXPOSURES IN DERIVATIVES (1)
of which: loans
and advances
of which: AFS
banking book
of which: FVO
(designated at fair
value through
profit&loss)
banking book
of which: Financial
assets held for
trading
(2)
Derivatives with positive fair value at
31/12/2013
Derivatives with negative fair value at
31/12/2013
Derivatives with positive fair value
at 31/12/2013
Derivatives with negative fair
value at 31/12/2013
VALUES AS OF 31/12/2013 VALUES AS OF 31/12/2013 VALUES AS OF 31/12/2013
INDIRECT SOVEREIGN EXPOSURES (3) (on and off balance sheet)
Fair-value at
31/12/2013 (+)Notional value
Fair-value at
31/12/2013 (-)Notional value
Fair-value at
31/12/2013 (+)Notional value
Fair-value at 31/12/2013
(-)
Austria
Notional value
[ 0 - 3M [ 0 0 0 0 0 0 0 0 0 0 0 0 0 0
[ 3M - 1Y [ 0 0 0 0 0 0 0 0 0 0 0 0 0 0
[ 1Y - 2Y [ 0 0 0 0 0 0 0 0 0 0 7 0 6 -1
[ 2Y - 3Y [ 0 0 0 0 0 0 0 0 0 0 0 0 0 0
[3Y - 5Y [ 0 0 0 0 0 0 0 0 0 0 0 0 0 0
[5Y - 10Y [ 0 0 0 0 0 0 0 0 0 0 0 0 0 0
[10Y - more 0 0 0 0 0 0 0 0 0 0 0 0 0 0
Tot 0 0 0 0 0 0 0 0 0 0 7 0 6 -1
[ 0 - 3M [ 13 0 0 0 0 0 0 0 0 0 117 0 52 -1
[ 3M - 1Y [ 891 0 822 0 0 822 75 2 114 -2 544 19 444 -27
[ 1Y - 2Y [ 239 0 56 0 0 56 0 0 45 -9 740 13 1,129 -36
[ 2Y - 3Y [ 258 0 199 53 0 146 33 3 0 0 893 6 711 -5
[3Y - 5Y [ 223 0 0 0 0 0 0 0 0 0 4,101 1,150 3,135 -166
[5Y - 10Y [ 191 0 0 0 0 0 0 0 0 0 747 71 799 -84
[10Y - more 0 0 0 0 0 0 49 8 49 -4 0 0 0 0
Tot 1,815 0 1,077 53 0 1,024 157 13 208 -15 7,142 1,260 6,271 -319
[ 0 - 3M [ 259 127 132 0 0 132 98 7 110 -4 34 8 38 -8
[ 3M - 1Y [ 18 0 17 0 0 17 218 7 699 -94 266 17 188 -19
[ 1Y - 2Y [ 5 0 2 2 0 0 72 6 196 -11 257 7 273 -8
[ 2Y - 3Y [ 62 0 62 12 0 50 41 2 105 -8 297 6 291 -5
[3Y - 5Y [ 23 0 4 4 0 0 44 7 745 -74 118 1 174 -3
[5Y - 10Y [ 139 21 77 0 0 77 363 15 651 -39 80 7 42 -3
[10Y - more 141 141 0 0 0 0 663 57 292 -24 0 0 0 0
Tot 647 289 294 18 0 276 1,499 99 2,799 -254 1,053 46 1,006 -45
[ 0 - 3M [ 170 128 30 30 0 0 0 0 76 -36 0 0 0 0
[ 3M - 1Y [ 485 16 469 271 0 198 71 1 21 -6 51 3 42 -2
[ 1Y - 2Y [ 907 10 341 336 0 0 78 1 133 -18 156 7 163 -8
[ 2Y - 3Y [ 620 9 611 449 0 162 29 0 23 -1 58 4 58 -4
[3Y - 5Y [ 1,601 98 1,382 1,365 0 17 18 1 16 -1 3 0 3 0
[5Y - 10Y [ 5,001 53 4,107 3,799 0 301 133 7 0 0 3 0 3 0
[10Y - more 9,164 1,789 7,376 1,471 0 5,905 0 0 0 0 0 0 0 0
Tot 17,948 2,103 14,314 7,720 0 6,583 329 10 269 -62 270 15 268 -14
[ 0 - 3M [ 65 0 65 65 0 0 0 0 493 -25 0 0 0 0
[ 3M - 1Y [ 236 0 236 236 0 0 44 1 184 -3 0 0 0 0
[ 1Y - 2Y [ 0 0 0 0 0 0 0 0 0 0 1 0 1 0
[ 2Y - 3Y [ 4 0 4 0 0 4 0 0 63 -5 25 1 27 -1
[3Y - 5Y [ 716 715 1 0 0 1 0 0 6 -1 0 0 0 0
[5Y - 10Y [ 2 0 0 0 0 0 193 57 441 -76 0 0 0 0
[10Y - more 0 0 0 0 0 0 57 7 0 0 0 0 0 0
Tot 1,023 715 306 301 0 5 294 64 1,187 -110 26 1 27 -1
[ 0 - 3M [ 108 0 108 0 0 108 0 0 0 0 0 0 0 0
[ 3M - 1Y [ 12 7 5 4 0 1 0 0 0 0 0 0 0 0
[ 1Y - 2Y [ 1 0 1 0 0 1 0 0 58 -3 0 0 0 0
[ 2Y - 3Y [ 20 0 20 0 0 20 0 0 146 -7 0 0 0 0
[3Y - 5Y [ 8 0 0 0 0 0 362 27 125 -14 0 0 0 0
[5Y - 10Y [ 130 0 103 0 0 103 19 0 0 0 0 0 0 0
[10Y - more 0 0 0 0 0 0 65 21 0 0 0 0 0 0
Tot 279 7 237 4 0 234 446 49 329 -24 0 0 0 0
[ 0 - 3M [ 548 0 548 548 0 0 0 0 0 0 0 0 0 0
[ 3M - 1Y [ 2 0 2 2 0 0 0 0 0 0 0 0 0 0
[ 1Y - 2Y [ 0 0 0 0 0 0 0 0 0 0 0 0 0 0
[ 2Y - 3Y [ 0 0 0 0 0 0 0 0 0 0 1 0 1 0
[3Y - 5Y [ 0 0 0 0 0 0 0 0 0 0 0 0 0 0
[5Y - 10Y [ 0 0 0 0 0 0 0 0 0 0 0 0 0 0
[10Y - more 0 0 0 0 0 0 0 0 0 0 0 0 0 0
Tot 551 0 551 551 0 0 0 0 0 0 2 0 2 0
[ 0 - 3M [ 73 0 73 71 0 2 2 0 8 0 0 0 0 0
[ 3M - 1Y [ 31 0 31 14 0 17 205 1 71 -1 0 0 0 0
[ 1Y - 2Y [ 67 0 67 0 0 67 318 3 289 -6 59 1 59 -1
[ 2Y - 3Y [ 28 0 0 0 0 0 356 21 87 -15 141 3 101 -2
[3Y - 5Y [ 333 0 18 0 0 18 339 25 487 -41 46 1 49 -1
[5Y - 10Y [ 1,511 0 0 0 0 0 717 52 142 -2 0 0 0 0
[10Y - more 811 0 0 0 0 0 327 17 528 0 0 0 0 0
Tot 2,855 0 190 85 0 104 2,265 120 1,612 -66 245 5 209 -4
[ 0 - 3M [ 485 4 0 0 0 0 0 0 0 0 125 0 56 0
[ 3M - 1Y [ 2,953 12 2,158 880 0 1,277 0 0 0 0 149 0 107 0
[ 1Y - 2Y [ 4,043 191 2,723 654 0 2,069 0 0 0 0 235 0 241 0
[ 2Y - 3Y [ 5,881 16 3,377 3,179 0 198 0 0 0 0 455 1 178 0
[3Y - 5Y [ 3,673 2 2,675 2,564 0 110 0 0 0 0 271 1 794 -4
[5Y - 10Y [ 3,830 11 2,569 2,382 0 187 0 0 0 0 160 1 146 -1
[10Y - more 1,384 145 264 125 0 139 0 0 0 0 0 0 0 0
Tot 22,250 380 13,765 9,784 0 3,981 0 0 0 0 1,395 3 1,522 -6
Spain
Slovenia
Sweden
United Kingdom
Australia
Canada
Hong Kong
Japan
U.S.
2014 EU-wide Stress Test - Sovereign Exposure
(mln EUR)
Residual Maturity Country / Region
GROSS DIRECT LONG
EXPOSURES (accounting value gross
of provisions)
(1)
NET DIRECT POSITIONS (gross exposures (long) net of cash short
positions of sovereign debt to other counterpaties only where there
is a maturity matching)
(1)
DIRECT SOVEREIGN EXPOSURES IN DERIVATIVES (1)
of which: loans
and advances
of which: AFS
banking book
of which: FVO
(designated at fair
value through
profit&loss)
banking book
of which: Financial
assets held for
trading
(2)
Derivatives with positive fair value at
31/12/2013
Derivatives with negative fair value at
31/12/2013
Derivatives with positive fair value
at 31/12/2013
Derivatives with negative fair
value at 31/12/2013
VALUES AS OF 31/12/2013 VALUES AS OF 31/12/2013 VALUES AS OF 31/12/2013
INDIRECT SOVEREIGN EXPOSURES (3) (on and off balance sheet)
Fair-value at
31/12/2013 (+)Notional value
Fair-value at
31/12/2013 (-)Notional value
Fair-value at
31/12/2013 (+)Notional value
Fair-value at 31/12/2013
(-)
Austria
Notional value
[ 0 - 3M [ 0 0 0 0 0 0 1,965 14 3,948 -138 4 0 7 0
[ 3M - 1Y [ 0 0 0 0 0 0 0 0 135 -10 21 0 21 0
[ 1Y - 2Y [ 173 0 173 173 0 0 18 0 0 0 144 2 173 -2
[ 2Y - 3Y [ 13 0 13 13 0 0 7 0 28 -1 59 1 77 -1
[3Y - 5Y [ 0 0 0 0 0 0 14 0 586 -19 86 2 87 -2
[5Y - 10Y [ 0 0 0 0 0 0 0 0 0 0 4 0 15 0
[10Y - more 0 0 0 0 0 0 0 0 0 0 0 0 0 0
Tot 186 0 186 186 0 0 2,004 15 4,697 -167 318 5 379 -5
[ 0 - 3M [ 127 0 127 127 0 0 18 0 13 -1 58 0 0 0
[ 3M - 1Y [ 407 0 407 0 0 407 1 0 33 -2 0 0 18 0
[ 1Y - 2Y [ 0 0 0 0 0 0 0 0 0 0 0 0 25 0
[ 2Y - 3Y [ 0 0 0 0 0 0 0 0 0 0 0 0 0 0
[3Y - 5Y [ 61 0 61 61 0 0 0 0 0 0 0 0 0 0
[5Y - 10Y [ 0 0 0 0 0 -15 0 0 0 0 0 0 0 0
[10Y - more 0 0 0 0 0 0 0 0 0 0 0 0 0 0
Tot 595 0 595 188 0 392 20 0 46 -2 58 0 44 0
[ 0 - 3M [ 46 0 46 44 0 0 0 0 0 0 16 0 2 0
[ 3M - 1Y [ 255 0 255 255 0 0 0 0 0 0 12 0 52 0
[ 1Y - 2Y [ 14 0 14 14 0 0 0 0 0 0 36 0 57 -1
[ 2Y - 3Y [ 10 0 10 0 0 0 0 0 0 0 155 3 127 -2
[3Y - 5Y [ 4 0 4 0 0 0 0 0 0 0 52,965 52,483 52,810 -52,435
[5Y - 10Y [ 1 0 1 0 0 0 0 0 0 0 392 6 334 -42
[10Y - more 144 0 119 0 0 119 0 0 0 0 0 0 0 0
Tot 474 0 449 314 0 119 0 0 0 0 53,577 52,493 53,383 -52,480
[ 0 - 3M [ 16 0 16 14 0 1 0 0 0 0 7 0 0 0
[ 3M - 1Y [ 96 0 96 36 0 58 0 0 0 0 41 1 49 -1
[ 1Y - 2Y [ 30 15 16 1 0 10 0 0 0 0 67 1 50 -1
[ 2Y - 3Y [ 0 0 0 0 0 0 0 0 0 0 77 2 69 -2
[3Y - 5Y [ 40 40 0 0 0 0 0 0 0 0 120 7 115 -6
[5Y - 10Y [ 26 26 0 0 0 -1 0 0 0 0 9 1 2 0
[10Y - more 0 0 0 0 0 0 0 0 0 0 0 0 0 0
Tot 207 80 127 52 0 68 0 0 0 0 321 11 285 -10
[ 0 - 3M [ 0 0 0 0 0 0 0 0 0 0 13 0 13 0
[ 3M - 1Y [ 0 0 0 0 0 0 0 0 0 0 4 0 15 0
[ 1Y - 2Y [ 0 0 0 0 0 -1 0 0 0 0 19 0 48 -2
[ 2Y - 3Y [ 0 0 0 0 0 0 0 0 141 -7 20 0 16 0
[3Y - 5Y [ 0 0 0 0 0 0 0 0 0 0 24 1 47 -2
[5Y - 10Y [ 2 0 1 0 0 1 0 0 0 0 11 0 4 -1
[10Y - more 0 0 0 0 0 0 101 50 0 0 0 0 0 0
Tot 2 0 1 0 0 0 101 50 141 -7 90 1 142 -4
[ 0 - 3M [ 0 0 0 0 0 0 0 0 0 0 420 2 409 -1
[ 3M - 1Y [ 314 0 314 0 0 62 0 0 0 0 582 9 604 -7
[ 1Y - 2Y [ 6 6 0 0 0 0 0 0 0 0 399 15 392 -14
[ 2Y - 3Y [ 0 0 0 0 0 0 0 0 0 0 508 29 516 -29
[3Y - 5Y [ 10 10 0 0 0 0 0 0 0 0 694 62 705 -62
[5Y - 10Y [ 1 0 1 0 0 0 0 0 0 0 113 19 111 -19
[10Y - more 0 0 0 0 0 0 0 0 0 0 0 0 0 0
Tot 331 16 315 0 0 62 0 0 0 0 2,717 135 2,737 -133
[ 0 - 3M [ 0 0 0 0 0 0 0 0 0 0 4 0 4 0
[ 3M - 1Y [ 0 0 0 0 0 0 0 0 0 0 4 0 0 0
[ 1Y - 2Y [ 0 0 0 0 0 0 0 0 0 0 0 0 0 0
[ 2Y - 3Y [ 0 0 0 0 0 0 0 0 0 0 4 0 4 0
[3Y - 5Y [ 0 0 0 0 0 0 0 0 0 0 1 0 1 0
[5Y - 10Y [ 0 0 0 0 0 0 0 0 0 0 3 0 0 0
[10Y - more 0 0 0 0 0 0 0 0 0 0 0 0 0 0
Tot 0 0 0 0 0 0 0 0 0 0 15 1 8 -1
[ 0 - 3M [ 160 15 145 145 0 0 483 8 1,449 -23 319 1 222 -1
[ 3M - 1Y [ 557 215 342 342 0 0 160 1 653 -13 92 1 127 -2
[ 1Y - 2Y [ 211 0 212 206 1 3 8 0 100 0 256 2 346 -4
[ 2Y - 3Y [ 56 20 36 36 0 0 31 7 93 -2 235 6 242 -7
[3Y - 5Y [ 414 30 384 252 124 8 30 1 993 -48 279 12 343 -16
[5Y - 10Y [ 147 95 48 26 0 19 31 2 39 -2 21 1 17 -1
[10Y - more 73 51 14 0 0 8 0 0 0 -8 0 0 0 0Tot 1,618 425 1,181 1,008 125 38 742 19 3,327 -96 1,202 24 1,296 -31
Notes and definitions
(1) The exposures reported cover only exposures to central, regional and local governments on immediate borrower basis, and do not include exposures to other counterparts with full or partial government guarantees
(2) The banks disclose the exposures in the "Financial assets held for trading" portfolio after offsetting the cash short positions having the same maturities. (3) The exposures reported include the positions towards counterparts (other than sovereign) on sovereign credit risk (i.e. CDS, financial guarantees) booked in all the accounting portfolio (on-off balance sheet). 'Irrespective of the denomination and or accounting classification of the positions the economic substance over the form must be used as a criteria for the identification of the exposures to be included in this column. This item does not include exposures to counterparts (other than sovereign) with full or partial government guarantees by central, regional and local governments
Latin America and the
Caribbean
Africa
Others
Middle East
China
Switzerland
Other advanced economies
non EEA
Other Central and eastern
Europe countries non EEA
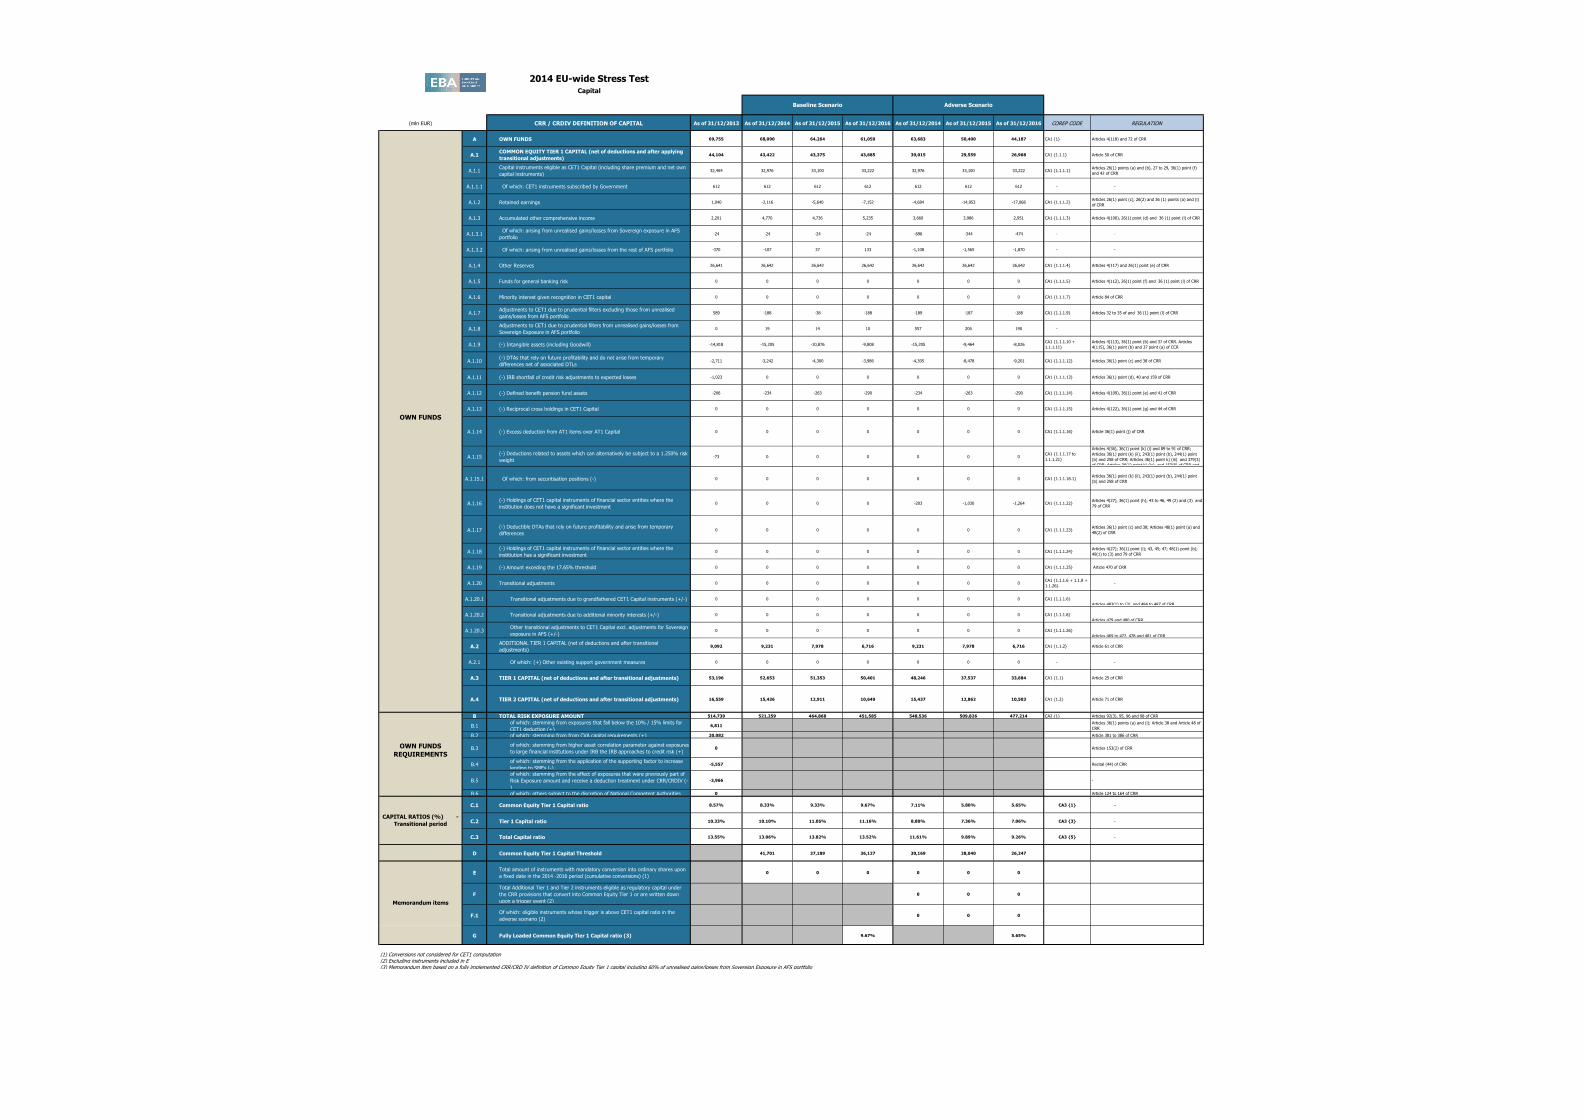
2014 EU-wide Stress TestCapital
(mln EUR) CRR / CRDIV DEFINITION OF CAPITAL As of 31/12/2013 As of 31/12/2014 As of 31/12/2015 As of 31/12/2016 As of 31/12/2014 As of 31/12/2015 As of 31/12/2016 COREP CODE REGULATION
A OWN FUNDS 69,755 68,090 64,264 61,050 63,683 50,400 44,187 CA1 {1} Articles 4(118) and 72 of CRR
A.1COMMON EQUITY TIER 1 CAPITAL (net of deductions and after applying
transitional adjustments)44,104 43,422 43,375 43,685 39,015 29,559 26,968 CA1 {1.1.1} Article 50 of CRR
A.1.1Capital instruments eligible as CET1 Capital (including share premium and net own
capital instruments)32,464 32,976 33,100 33,222 32,976 33,100 33,222 CA1 {1.1.1.1}
Articles 26(1) points (a) and (b), 27 to 29, 36(1) point (f)
and 42 of CRR
A.1.1.1 Of which: CET1 instruments subscribed by Government 612 612 612 612 612 612 612 - -
A.1.2 Retained earnings 1,040 -2,116 -5,640 -7,152 -4,684 -14,953 -17,068 CA1 {1.1.1.2}Articles 26(1) point (c), 26(2) and 36 (1) points (a) and (l)
of CRR
A.1.3 Accumulated other comprehensive income 2,201 4,770 4,736 5,235 3,660 3,986 2,951 CA1 {1.1.1.3} Articles 4(100), 26(1) point (d) and 36 (1) point (l) of CRR
A.1.3.1 Of which: arising from unrealised gains/losses from Sovereign exposure in AFS
portfolio-24 -24 -24 -24 -696 -344 -474 - -
A.1.3.2 Of which: arising from unrealised gains/losses from the rest of AFS portfolio -370 -107 37 133 -1,108 -1,565 -1,870 - -
A.1.4 Other Reserves 26,641 26,642 26,642 26,642 26,642 26,642 26,642 CA1 {1.1.1.4} Articles 4(117) and 26(1) point (e) of CRR
A.1.5 Funds for general banking risk 0 0 0 0 0 0 0 CA1 {1.1.1.5} Articles 4(112), 26(1) point (f) and 36 (1) point (l) of CRR
A.1.6 Minority interest given recognition in CET1 capital 0 0 0 0 0 0 0 CA1 {1.1.1.7} Article 84 of CRR
A.1.7Adjustments to CET1 due to prudential filters excluding those from unrealised
gains/losses from AFS portfolio589 -188 -38 -188 -189 -187 -188 CA1 {1.1.1.9} Articles 32 to 35 of and 36 (1) point (l) of CRR
A.1.8Adjustments to CET1 due to prudential filters from unrealised gains/losses from
Sovereign Exposure in AFS portfolio0 19 14 10 557 206 190 -
A.1.9 (-) Intangible assets (including Goodwill) -14,818 -15,205 -10,876 -9,808 -15,205 -9,464 -8,026CA1 {1.1.1.10 +
1.1.1.11}
Articles 4(113), 36(1) point (b) and 37 of CRR. Articles
4(115), 36(1) point (b) and 37 point (a) of CCR
A.1.10(-) DTAs that rely on future profitability and do not arise from temporary
differences net of associated DTLs -2,711 -3,242 -4,300 -3,986 -4,305 -8,478 -9,201 CA1 {1.1.1.12} Articles 36(1) point (c) and 38 of CRR
A.1.11 (-) IRB shortfall of credit risk adjustments to expected losses -1,023 0 0 0 0 0 0 CA1 {1.1.1.13} Articles 36(1) point (d), 40 and 159 of CRR
A.1.12 (-) Defined benefit pension fund assets -206 -234 -263 -290 -234 -263 -290 CA1 {1.1.1.14} Articles 4(109), 36(1) point (e) and 41 of CRR
A.1.13 (-) Reciprocal cross holdings in CET1 Capital 0 0 0 0 0 0 0 CA1 {1.1.1.15} Articles 4(122), 36(1) point (g) and 44 of CRR
A.1.14 (-) Excess deduction from AT1 items over AT1 Capital 0 0 0 0 0 0 0 CA1 {1.1.1.16} Article 36(1) point (j) of CRR
A.1.15(-) Deductions related to assets which can alternatively be subject to a 1.250% risk
weight-73 0 0 0 0 0 0
CA1 {1.1.1.17 to
1.1.1.21}
Articles 4(36), 36(1) point (k) (i) and 89 to 91 of CRR;
Articles 36(1) point (k) (ii), 243(1) point (b), 244(1) point
(b) and 258 of CRR; Articles 36(1) point k) (iii) and 379(3)
of CRR; Articles 36(1) point k) (iv) and 153(8) of CRR and
A.1.15.1 Of which: from securitisation positions (-) 0 0 0 0 0 0 0 CA1 {1.1.1.18.1}Articles 36(1) point (k) (ii), 243(1) point (b), 244(1) point
(b) and 258 of CRR
A.1.16(-) Holdings of CET1 capital instruments of financial sector entities where the
institiution does not have a significant investment0 0 0 0 -203 -1,030 -1,264 CA1 {1.1.1.22}
Articles 4(27), 36(1) point (h); 43 to 46, 49 (2) and (3) and
79 of CRR
A.1.17(-) Deductible DTAs that rely on future profitability and arise from temporary
differences0 0 0 0 0 0 0 CA1 {1.1.1.23}
Articles 36(1) point (c) and 38; Articles 48(1) point (a) and
48(2) of CRR
A.1.18(-) Holdings of CET1 capital instruments of financial sector entities where the
institiution has a significant investment0 0 0 0 0 0 0 CA1 {1.1.1.24}
Articles 4(27); 36(1) point (i); 43, 45; 47; 48(1) point (b);
49(1) to (3) and 79 of CRR
A.1.19 (-) Amount exceding the 17.65% threshold 0 0 0 0 0 0 0 CA1 {1.1.1.25} Article 470 of CRR
A.1.20 Transitional adjustments 0 0 0 0 0 0 0CA1 {1.1.1.6 + 1.1.8 +
1.1.26}-
A.1.20.1 Transitional adjustments due to grandfathered CET1 Capital instruments (+/-) 0 0 0 0 0 0 0 CA1 {1.1.1.6}
Articles 483(1) to (3), and 484 to 487 of CRR
A.1.20.2 Transitional adjustments due to additional minority interests (+/-) 0 0 0 0 0 0 0 CA1 {1.1.1.8}
Articles 479 and 480 of CRR
A.1.20.3Other transitional adjustments to CET1 Capital excl. adjustments for Sovereign
exposure in AFS (+/-)0 0 0 0 0 0 0 CA1 {1.1.1.26}
Articles 469 to 472, 478 and 481 of CRR
A.2ADDITIONAL TIER 1 CAPITAL (net of deductions and after transitional
adjustments)9,092 9,231 7,978 6,716 9,231 7,978 6,716 CA1 {1.1.2} Article 61 of CRR
A.2.1 Of which: (+) Other existing support government measures 0 0 0 0 0 0 0 - -
A.3 TIER 1 CAPITAL (net of deductions and after transitional adjustments) 53,196 52,653 51,353 50,401 48,246 37,537 33,684 CA1 {1.1} Article 25 of CRR
A.4 TIER 2 CAPITAL (net of deductions and after transitional adjustments) 16,559 15,436 12,911 10,649 15,437 12,862 10,503 CA1 {1.2} Article 71 of CRR
B TOTAL RISK EXPOSURE AMOUNT 514,739 521,259 464,868 451,585 548,536 509,826 477,214 CA2 {1} Articles 92(3), 95, 96 and 98 of CRR
B.1of which: stemming from exposures that fall below the 10% / 15% limits for
CET1 deduction (+)6,811 0 0 0 0 0 0
Articles 36(1) points (a) and (i); Article 38 and Article 48 of
CRR
B.2 of which: stemming from from CVA capital requirements (+) 20,082 0 0 0 0 0 0 Article 381 to 386 of CRR
B.3of which: stemming from higher asset correlation parameter against exposures
to large financial institutions under IRB the IRB approaches to credit risk (+)0 0 0 0 0 0 0 Articles 153(2) of CRR
B.4of which: stemming from the application of the supporting factor to increase
lending to SMEs (-)-5,557 0 0 0 0 0 0 Recital (44) of CRR
B.5
of which: stemming from the effect of exposures that were previously part of
Risk Exposure amount and receive a deduction treatment under CRR/CRDIV (-
)
-3,966 0 0 0 0 0 0 -
B.6 of which: others subject to the discretion of National Competent Authorities 0 0 0 0 0 0 0 Article 124 to 164 of CRR
C.1 Common Equity Tier 1 Capital ratio 8.57% 8.33% 9.33% 9.67% 7.11% 5.80% 5.65% CA3 {1} -
C.2 Tier 1 Capital ratio 10.33% 10.10% 11.05% 11.16% 8.80% 7.36% 7.06% CA3 {3} -
C.3 Total Capital ratio 13.55% 13.06% 13.82% 13.52% 11.61% 9.89% 9.26% CA3 {5} -
D Common Equity Tier 1 Capital Threshold 41,701 37,189 36,127 30,169 28,040 26,247
ETotal amount of instruments with mandatory conversion into ordinary shares upon
a fixed date in the 2014 -2016 period (cumulative conversions) (1)0 0 0 0 0 0
F
Total Additional Tier 1 and Tier 2 instruments eligible as regulatory capital under
the CRR provisions that convert into Common Equity Tier 1 or are written down
upon a trigger event (2)
0 0 0
F.1Of which: eligible instruments whose trigger is above CET1 capital ratio in the
adverse scenario (2)0 0 0
G Fully Loaded Common Equity Tier 1 Capital ratio (3) 9.67% 5.65%
(1) Conversions not considered for CET1 computation(2) Excluding instruments included in E(3) Memorandum item based on a fully implemented CRR/CRD IV definition of Common Equity Tier 1 capital including 60% of unrealised gains/losses from Sovereign Exposure in AFS portfolio
Memorandum items
Baseline Scenario Adverse Scenario
OWN FUNDS
OWN FUNDS
REQUIREMENTS
CAPITAL RATIOS (%) -
Transitional period
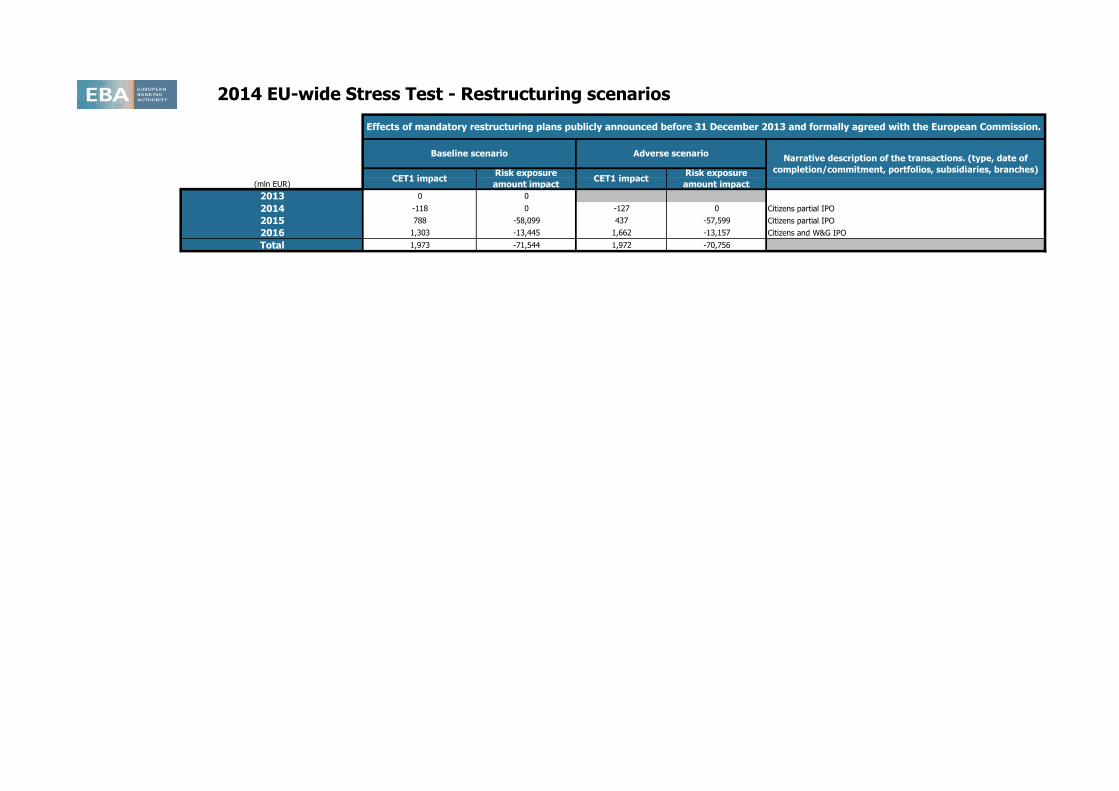
2014 EU-wide Stress Test - Restructuring scenarios
(mln EUR)
2013 0 0
2014 -118 0 -127 0 Citizens partial IPO
2015 788 -58,099 437 -57,599 Citizens partial IPO
2016 1,303 -13,445 1,662 -13,157 Citizens and W&G IPO
Total 1,973 -71,544 1,972 -70,756
Effects of mandatory restructuring plans publicly announced before 31 December 2013 and formally agreed with the European Commission.
Baseline scenario Adverse scenarioNarrative description of the transactions. (type, date of
completion/commitment, portfolios, subsidiaries, branches) CET1 impact
Risk exposure
amount impactCET1 impact
Risk exposure
amount impact
2014 EU-wide Stress Test
Outcome of the Stress Test based on the Restructuring plan for banks whose plan was formally agreed with the European Commission after 31 December 2013
(mln EUR)
As of
31/12/2013
As of
31/12/2014
As of
31/12/2015
As of
31/12/2016
As of
31/12/2014
As of
31/12/2015
As of
31/12/2016
COMMON EQUITY TIER 1 CAPITAL (net of deductions and after applying transitional adjustments)
TOTAL RISK EXPOSURE AMOUNT
COMMON EQUITY TIER 1 RATIO #DIV/0! #DIV/0! #DIV/0! #DIV/0! #DIV/0! #DIV/0! #DIV/0!
Baseline scenario Adverse scenario
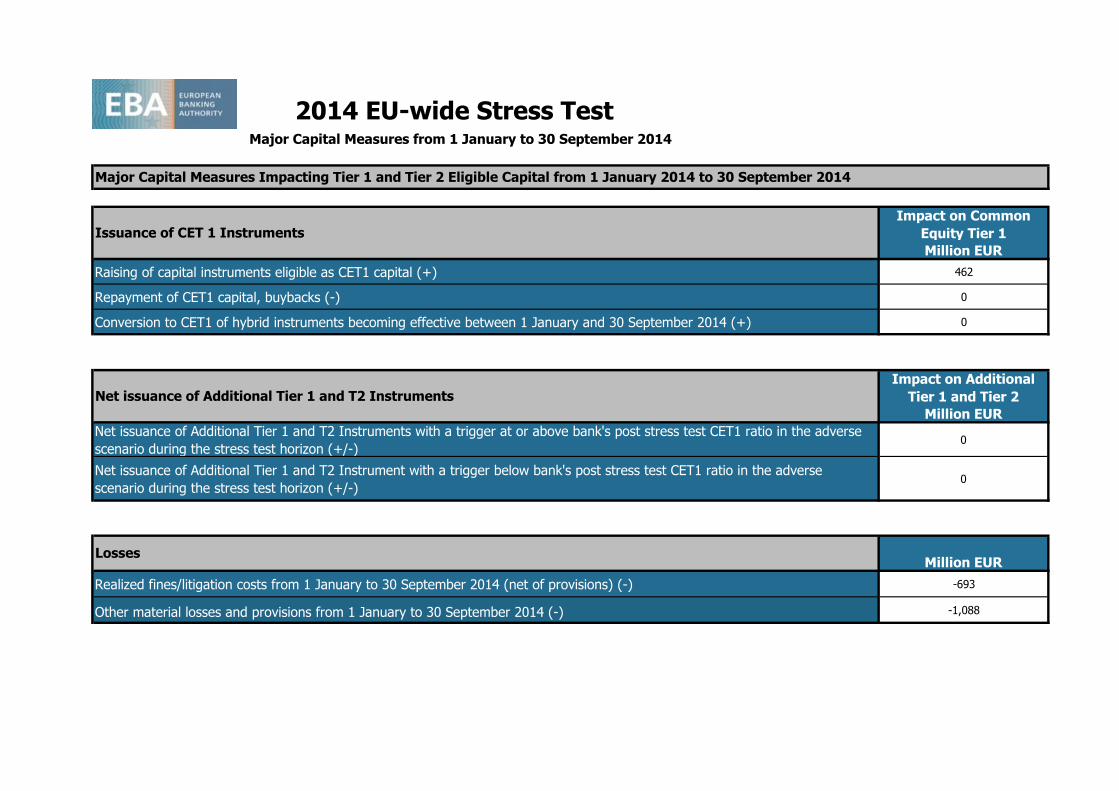
2014 EU-wide Stress Test
Impact on Common
Equity Tier 1
Million EUR
Raising of capital instruments eligible as CET1 capital (+) 462
Repayment of CET1 capital, buybacks (-) 0
Conversion to CET1 of hybrid instruments becoming effective between 1 January and 30 September 2014 (+) 0
Impact on Additional
Tier 1 and Tier 2
Million EUR
Net issuance of Additional Tier 1 and T2 Instruments with a trigger at or above bank's post stress test CET1 ratio in the adverse
scenario during the stress test horizon (+/-)0
Net issuance of Additional Tier 1 and T2 Instrument with a trigger below bank's post stress test CET1 ratio in the adverse
scenario during the stress test horizon (+/-)0
Million EUR
Realized fines/litigation costs from 1 January to 30 September 2014 (net of provisions) (-) -693
Other material losses and provisions from 1 January to 30 September 2014 (-) -1,088
Major Capital Measures from 1 January to 30 September 2014
Losses
Net issuance of Additional Tier 1 and T2 Instruments
Issuance of CET 1 Instruments
Major Capital Measures Impacting Tier 1 and Tier 2 Eligible Capital from 1 January 2014 to 30 September 2014