Embed Size (px)
Citation preview
Key elements of the Energy Reform
and their implications for the Gas
Sector from CFE’s perspective
Enrique Ochoa Reza, PhD
CEO
Comisión Federal de Electricidad - CFE
November 2014
@EnriqueOchoaR
2
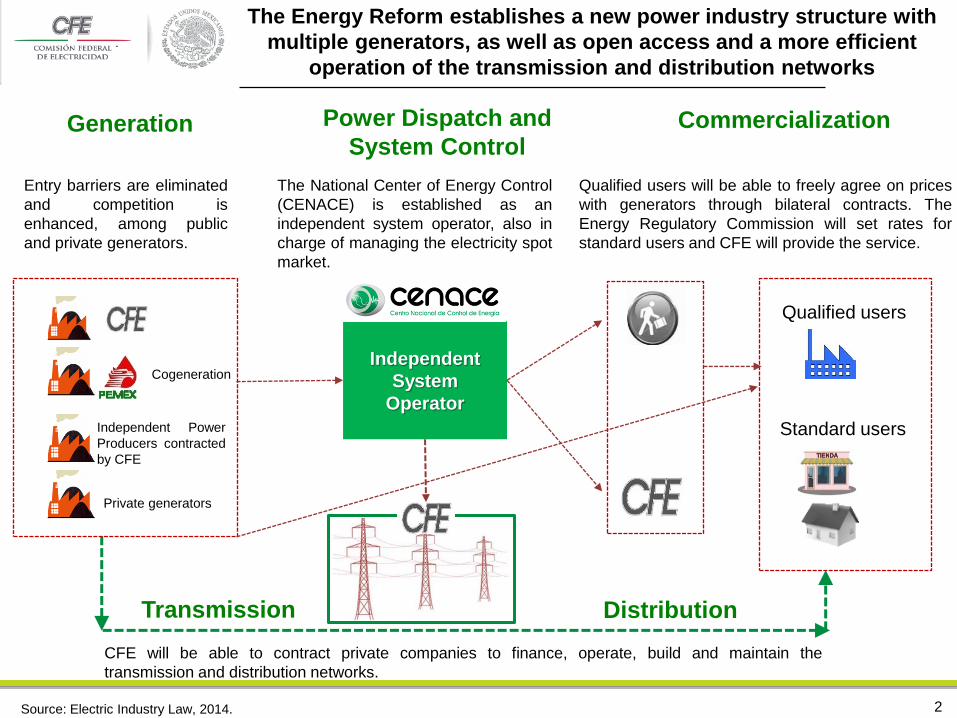
The Energy Reform establishes a new power industry structure with
multiple generators, as well as open access and a more efficient
operation of the transmission and distribution networks
Independent
System
Operator
Generation Power Dispatch and
System Control
Qualified users
Standard users
Transmission
Independent Power
Producers contracted
by CFE
Commercialization
Private generators
Distribution
Cogeneration
Entry barriers are eliminated
and competition is
enhanced, among public
and private generators.
The National Center of Energy Control
(CENACE) is established as an
independent system operator, also in
charge of managing the electricity spot
market.
Qualified users will be able to freely agree on prices
with generators through bilateral contracts. The
Energy Regulatory Commission will set rates for
standard users and CFE will provide the service.
Source: Electric Industry Law, 2014.
CFE will be able to contract private companies to finance, operate, build and maintain the
transmission and distribution networks.
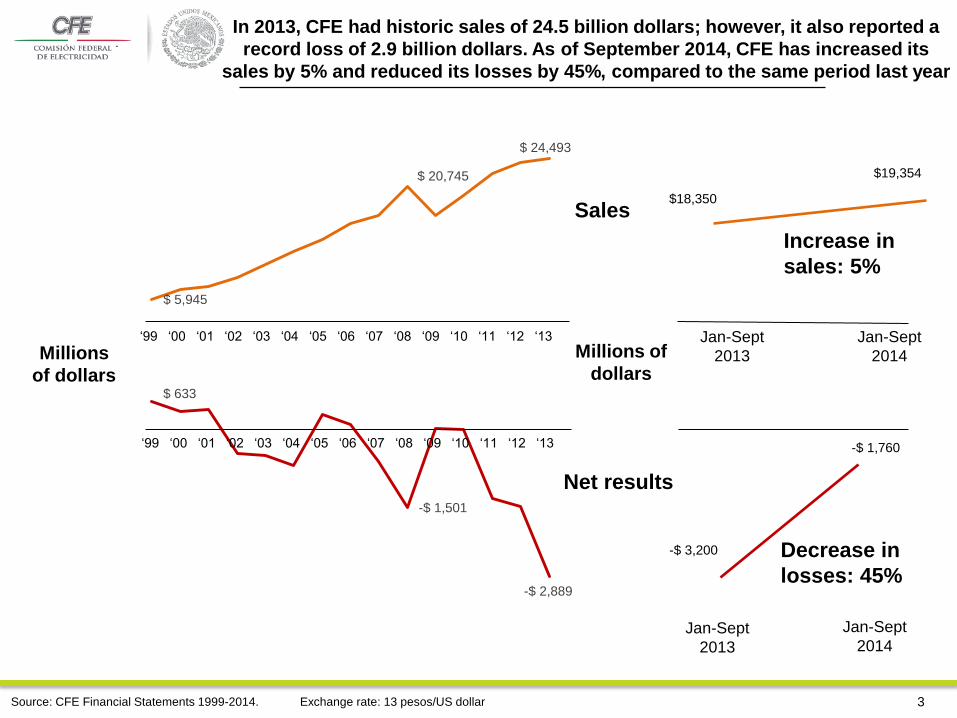
In 2013, CFE had historic sales of 24.5 billion dollars; however, it also reported a
record loss of 2.9 billion dollars. As of September 2014, CFE has increased its
sales by 5% and reduced its losses by 45%, compared to the same period last year
$ 5,945
$ 20,745
$ 24,493
$ 633
-$ 1,501
-$ 2,889
‘99 ‘00 ‘01 ‘02 ‘03 ‘04 ‘05 ‘06 ‘07 ‘08 ‘09 ‘10 ‘11 ‘12 ‘13
Millions
of dollars
‘99 ‘00 ‘01 ‘02 ‘03 ‘04 ‘05 ‘06 ‘07 ‘08 ‘09 ‘10 ‘11 ‘12 ‘13
Sales
Net results
Jan-Sept
2013
Jan-Sept
2014
Jan-Sept
2013
Jan-Sept
2014
Millions of
dollars
$18,350
$19,354
-$ 3,200
-$ 1,760
Increase in
sales: 5%
Decrease in
losses: 45%
Source: CFE Financial Statements 1999-2014. 3 Exchange rate: 13 pesos/US dollar
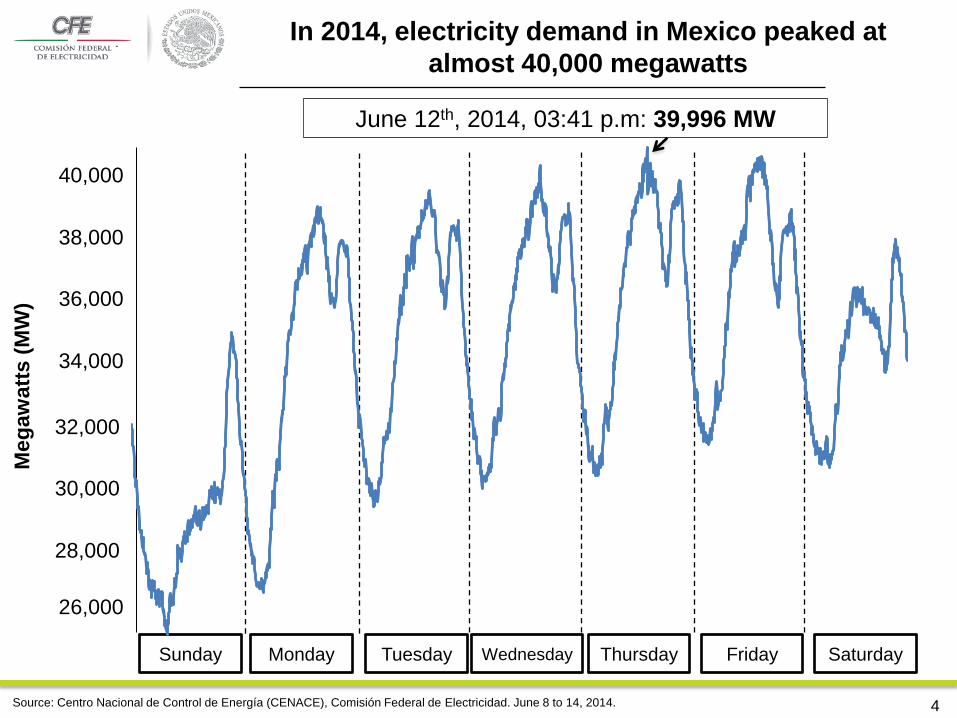
In 2014, electricity demand in Mexico peaked at
almost 40,000 megawatts
Meg
aw
att
s (
MW
)
40,000
38,000
36,000
34,000
32,000
30,000
28,000
Source: Centro Nacional de Control de Energía (CENACE), Comisión Federal de Electricidad. June 8 to 14, 2014.
Sunday Monday Tuesday Wednesday Thursday Friday Saturday
June 12th, 2014, 03:41 p.m: 39,996 MW
26,000
4
Sources: Energy Information System, Energy Information Administration (U.S). U.S electricity rates converted to Mexican pesos at a 12.6 pesos/dollar.
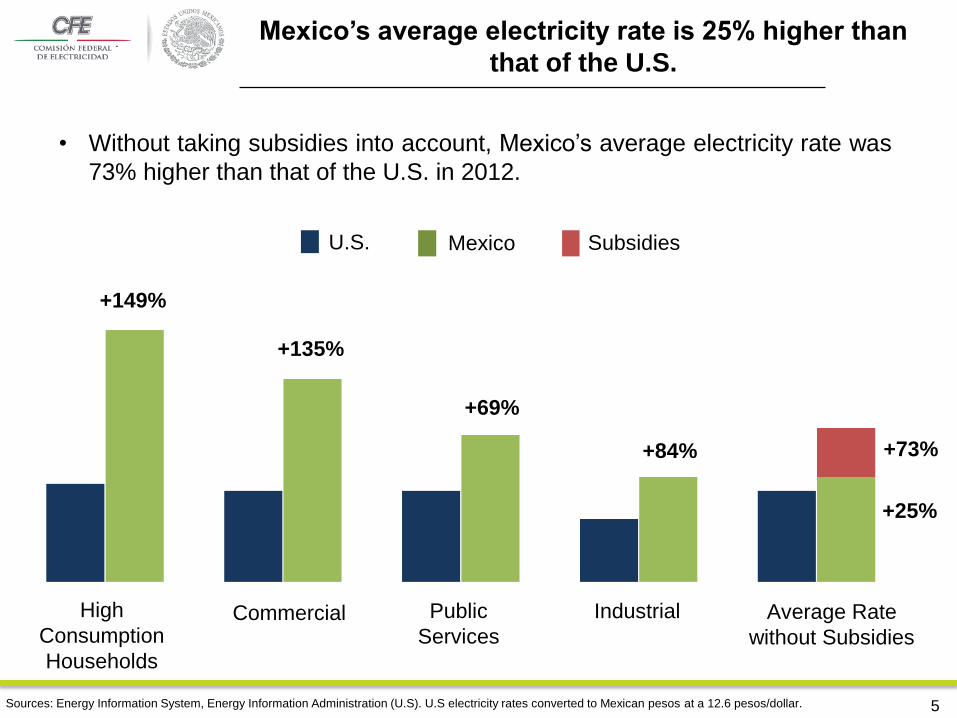
Mexico’s average electricity rate is 25% higher than
that of the U.S.
+149%
+135%
+69%
+84% +73%
Average Rate
without Subsidies
High
Consumption
Households
Commercial Public
Services
Industrial
+25%
• Without taking subsidies into account, Mexico’s average electricity rate was
73% higher than that of the U.S. in 2012.
U.S. Subsidies Mexico
5
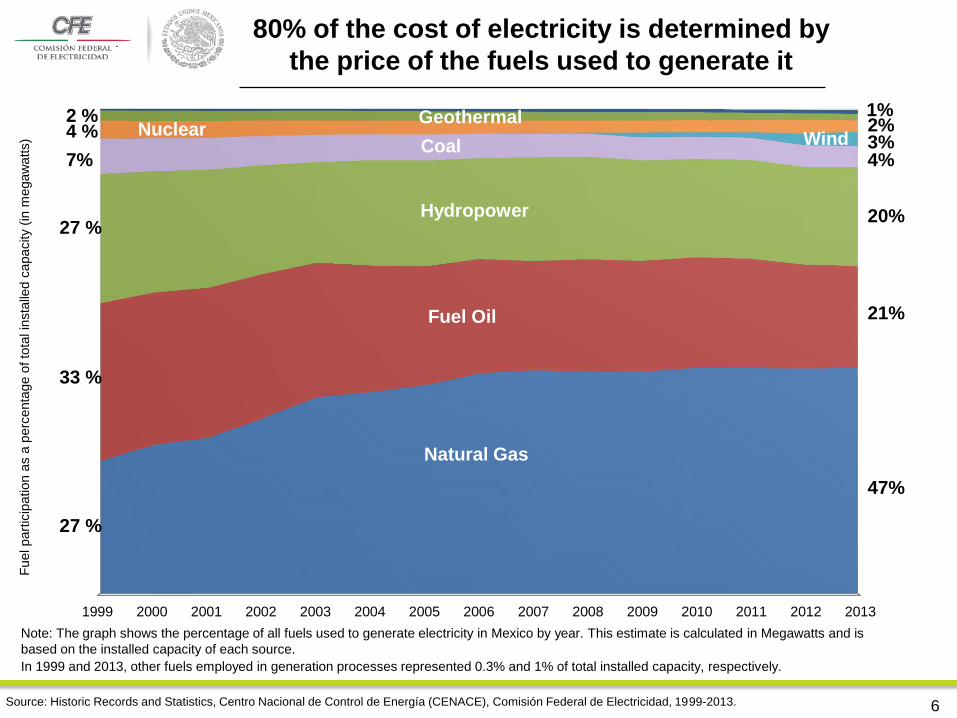
2%
1999 2000 2001 2002 2003 2004 2005 2006 2007 2008 2009 2010 2011 2012 2013
Natural Gas
Hydropower
Fuel Oil
Nuclear Coal Wind Geothermal
80% of the cost of electricity is determined by
the price of the fuels used to generate it
Source: Historic Records and Statistics, Centro Nacional de Control de Energía (CENACE), Comisión Federal de Electricidad, 1999-2013.
27 %
33 %
27 %
7%
4 % 2 %
In 1999 and 2013, other fuels employed in generation processes represented 0.3% and 1% of total installed capacity, respectively.
47%
21%
20%
4% 3%
1%
Note: The graph shows the percentage of all fuels used to generate electricity in Mexico by year. This estimate is calculated in Megawatts and is
based on the installed capacity of each source.
Fuel part
icip
ation a
s a
perc
enta
ge o
f to
tal in
sta
lled c
apacity (
in m
egaw
atts)
6
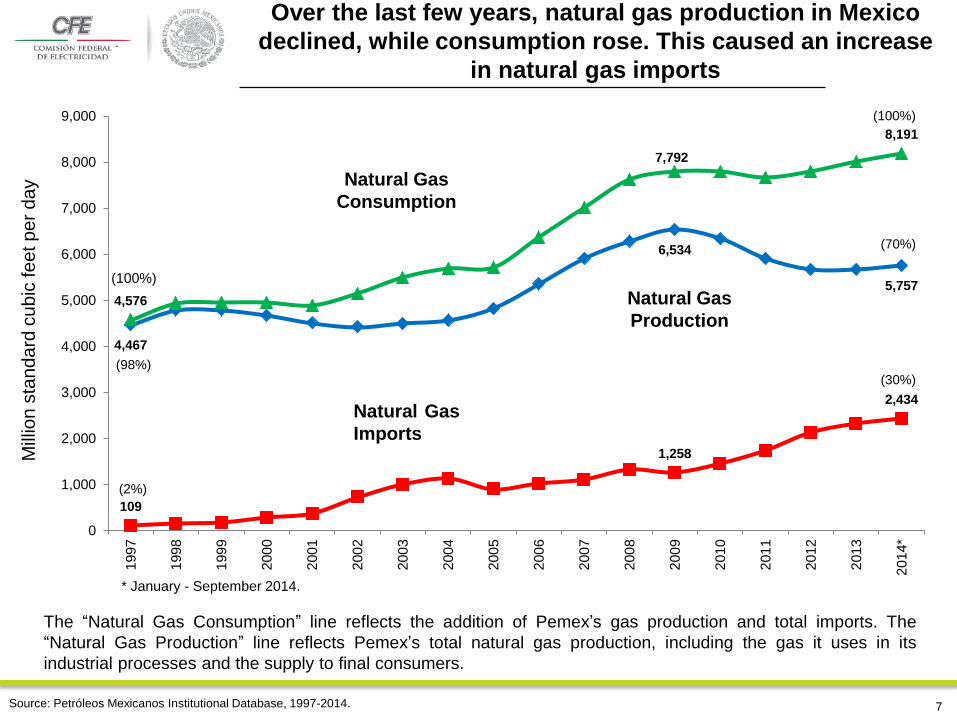
4,467
6,534
5,757
109
1,258
2,434
4,576
7,792
8,191
0
1,000
2,000
3,000
4,000
5,000
6,000
7,000
8,000
9,0001
99
7
199
8
199
9
200
0
200
1
200
2
200
3
200
4
200
5
200
6
200
7
200
8
200
9
201
0
201
1
201
2
201
3
201
4*
Mill
ion s
tandard
cubic
feet per
day
Over the last few years, natural gas production in Mexico
declined, while consumption rose. This caused an increase
in natural gas imports
Source: Petróleos Mexicanos Institutional Database, 1997-2014.
* January - September 2014.
Natural Gas
Consumption
Natural Gas
Production
Natural Gas
Imports
(100%)
(98%)
(2%)
(100%)
(70%)
(30%)
7
The “Natural Gas Consumption” line reflects the addition of Pemex’s gas production and total imports. The
“Natural Gas Production” line reflects Pemex’s total natural gas production, including the gas it uses in its
industrial processes and the supply to final consumers.
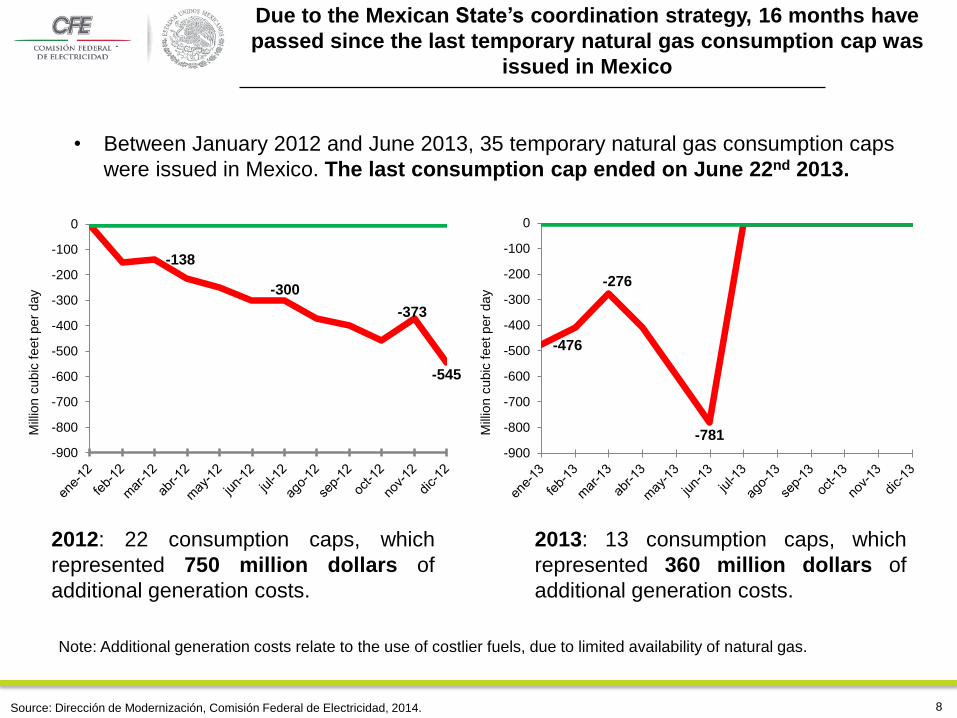
-138
-300
-373
-545
-900
-800
-700
-600
-500
-400
-300
-200
-100
0
Mill
ion c
ubic
feet per
day
Due to the Mexican State’s coordination strategy, 16 months have
passed since the last temporary natural gas consumption cap was
issued in Mexico
-476
-276
-781
-900
-800
-700
-600
-500
-400
-300
-200
-100
0
Mill
ion c
ubic
feet per
day
• Between January 2012 and June 2013, 35 temporary natural gas consumption caps
were issued in Mexico. The last consumption cap ended on June 22nd 2013.
Note: Additional generation costs relate to the use of costlier fuels, due to limited availability of natural gas.
Source: Dirección de Modernización, Comisión Federal de Electricidad, 2014.
2013: 13 consumption caps, which
represented 360 million dollars of
additional generation costs.
2012: 22 consumption caps, which
represented 750 million dollars of
additional generation costs.
8
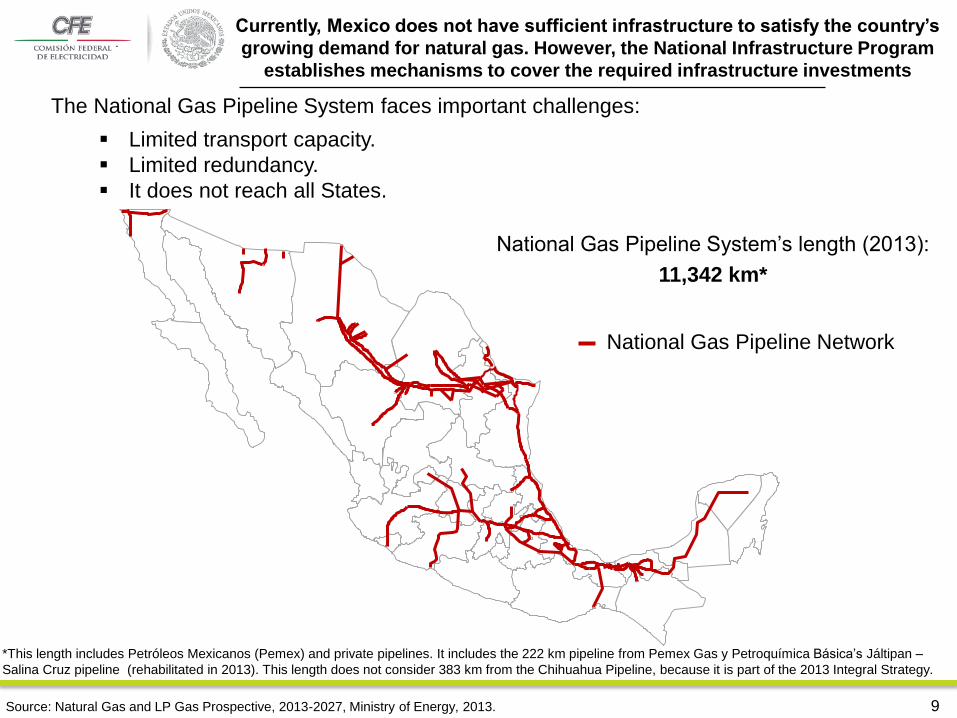
The National Gas Pipeline System faces important challenges:
Limited transport capacity.
Limited redundancy.
It does not reach all States.
Currently, Mexico does not have sufficient infrastructure to satisfy the country’s
growing demand for natural gas. However, the National Infrastructure Program
establishes mechanisms to cover the required infrastructure investments
National Gas Pipeline Network
Source: Natural Gas and LP Gas Prospective, 2013-2027, Ministry of Energy, 2013.
National Gas Pipeline System’s length (2013):
11,342 km*
*This length includes Petróleos Mexicanos (Pemex) and private pipelines. It includes the 222 km pipeline from Pemex Gas y Petroquímica Básica’s Jáltipan –
Salina Cruz pipeline (rehabilitated in 2013). This length does not consider 383 km from the Chihuahua Pipeline, because it is part of the 2013 Integral Strategy.
9
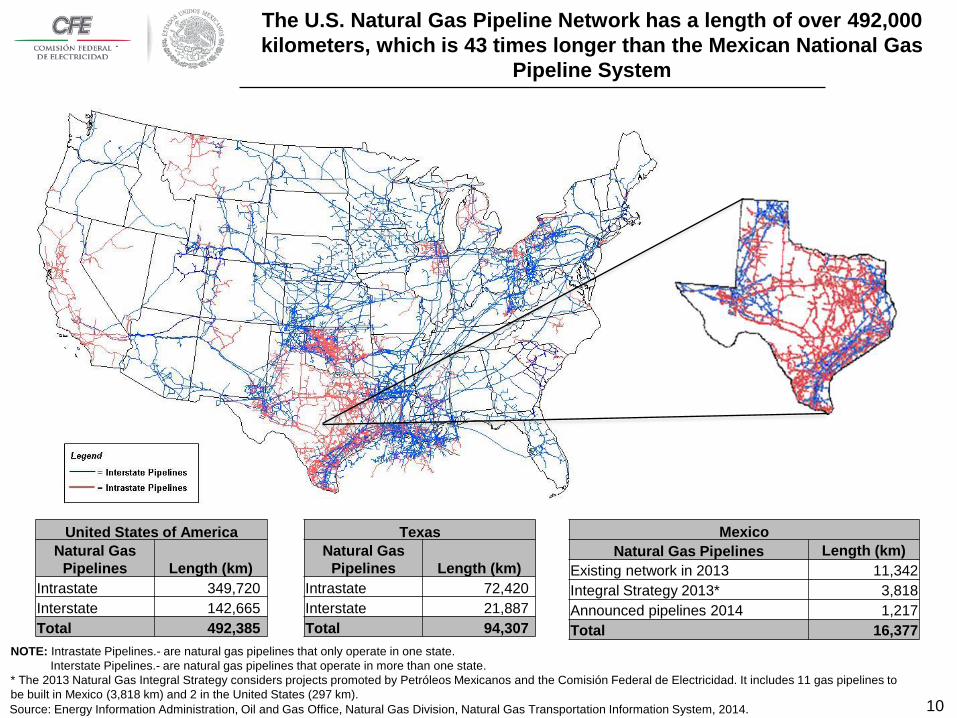
The U.S. Natural Gas Pipeline Network has a length of over 492,000
kilometers, which is 43 times longer than the Mexican National Gas
Pipeline System
Mexico
Natural Gas Pipelines Length (km)
Existing network in 2013 11,342
Integral Strategy 2013* 3,818
Announced pipelines 2014 1,217
Total 16,377
Texas
Natural Gas
Pipelines Length (km)
Intrastate 72,420
Interstate 21,887
Total 94,307
United States of America
Natural Gas
Pipelines Length (km)
Intrastate 349,720
Interstate 142,665
Total 492,385
NOTE: Intrastate Pipelines.- are natural gas pipelines that only operate in one state.
Interstate Pipelines.- are natural gas pipelines that operate in more than one state.
* The 2013 Natural Gas Integral Strategy considers projects promoted by Petróleos Mexicanos and the Comisión Federal de Electricidad. It includes 11 gas pipelines to
be built in Mexico (3,818 km) and 2 in the United States (297 km).
Source: Energy Information Administration, Oil and Gas Office, Natural Gas Division, Natural Gas Transportation Information System, 2014. 10
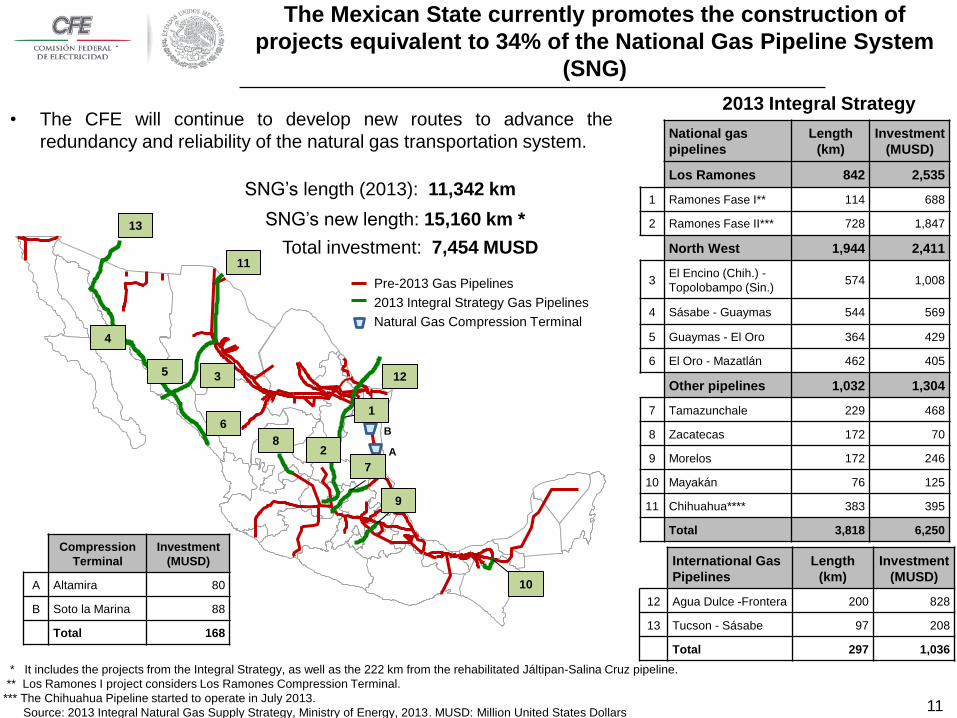
• The CFE will continue to develop new routes to advance the
redundancy and reliability of the natural gas transportation system.
Pre-2013 Gas Pipelines
2013 Integral Strategy Gas Pipelines
Natural Gas Compression Terminal
A
B
SNG’s length (2013): 11,342 km
National gas
pipelines
Length
(km)
Investment
(MUSD)
Los Ramones 842 2,535
1 Ramones Fase I** 114 688
2 Ramones Fase II*** 728 1,847
North West 1,944 2,411
3 El Encino (Chih.) -
Topolobampo (Sin.) 574 1,008
4 Sásabe - Guaymas 544 569
5 Guaymas - El Oro 364 429
6 El Oro - Mazatlán 462 405
Other pipelines 1,032 1,304
7 Tamazunchale 229 468
8 Zacatecas 172 70
9 Morelos 172 246
10 Mayakán 76 125
11 Chihuahua**** 383 395
Total 3,818 6,250
International Gas
Pipelines
Length
(km)
Investment
(MUSD)
12 Agua Dulce -Frontera 200 828
13 Tucson - Sásabe 97 208
Total 297 1,036
Compression
Terminal
Investment
(MUSD)
A Altamira 80
B Soto la Marina 88
Total 168
Total investment: 7,454 MUSD
12
The Mexican State currently promotes the construction of
projects equivalent to 34% of the National Gas Pipeline System
(SNG)
SNG’s new length: 15,160 km *
2013 Integral Strategy
13
11
4
5 3
6
7
2 8
1
9
10
* It includes the projects from the Integral Strategy, as well as the 222 km from the rehabilitated Jáltipan-Salina Cruz pipeline.
** Los Ramones I project considers Los Ramones Compression Terminal.
*** The Chihuahua Pipeline started to operate in July 2013.
Source: 2013 Integral Natural Gas Supply Strategy, Ministry of Energy, 2013. MUSD: Million United States Dollars 11
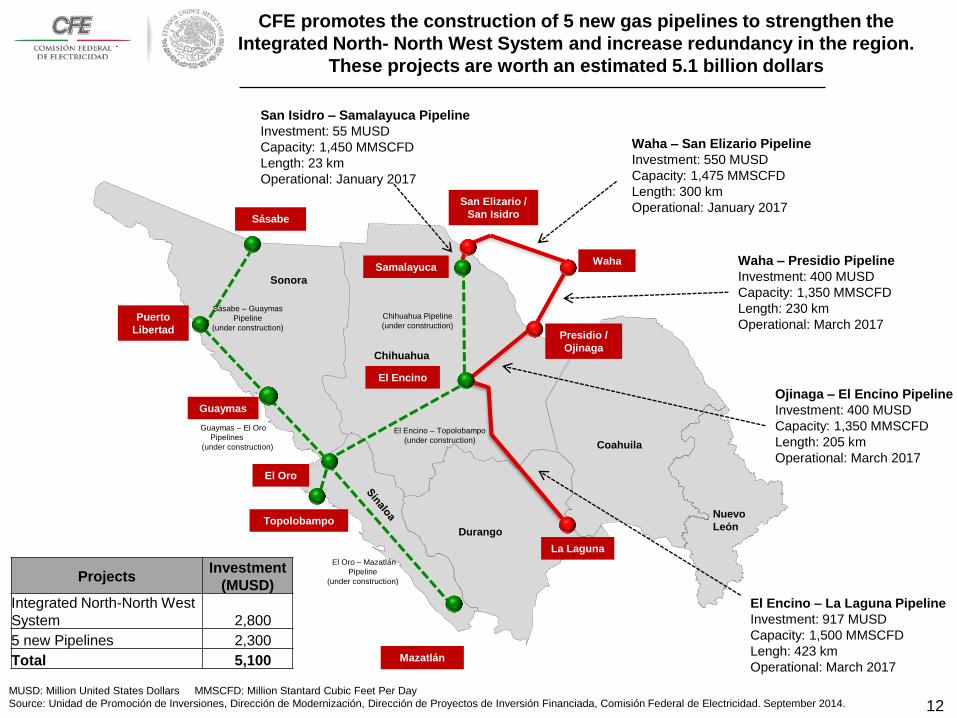
Waha – San Elizario Pipeline
Investment: 550 MUSD
Capacity: 1,475 MMSCFD
Length: 300 km
Operational: January 2017
Waha – Presidio Pipeline
Investment: 400 MUSD
Capacity: 1,350 MMSCFD
Length: 230 km
Operational: March 2017
Sásabe – Guaymas
Pipeline
(under construction)
Guaymas – El Oro
Pipelines
(under construction)
El Oro – Mazatlán
Pipeline
(under construction)
Chihuahua Pipeline
(under construction)
El Encino – Topolobampo
(under construction)
MUSD: Million United States Dollars MMSCFD: Million Stantard Cubic Feet Per Day
Source: Unidad de Promoción de Inversiones, Dirección de Modernización, Dirección de Proyectos de Inversión Financiada, Comisión Federal de Electricidad. September 2014.
CFE promotes the construction of 5 new gas pipelines to strengthen the
Integrated North- North West System and increase redundancy in the region.
These projects are worth an estimated 5.1 billion dollars
Waha
La Laguna
Presidio /
Ojinaga
Samalayuca
El Encino
El Encino – La Laguna Pipeline
Investment: 917 MUSD
Capacity: 1,500 MMSCFD
Lengh: 423 km
Operational: March 2017
San Isidro – Samalayuca Pipeline
Investment: 55 MUSD
Capacity: 1,450 MMSCFD
Length: 23 km
Operational: January 2017
Sonora
Coahuila
Durango
Chihuahua
Nuevo
León
Ojinaga – El Encino Pipeline
Investment: 400 MUSD
Capacity: 1,350 MMSCFD
Length: 205 km
Operational: March 2017
Puerto
Libertad
Guaymas
Topolobampo
El Oro
Mazatlán
Sásabe
San Elizario /
San Isidro
Projects Investment
(MUSD)
Integrated North-North West
System 2,800
5 new Pipelines 2,300
Total 5,100
12
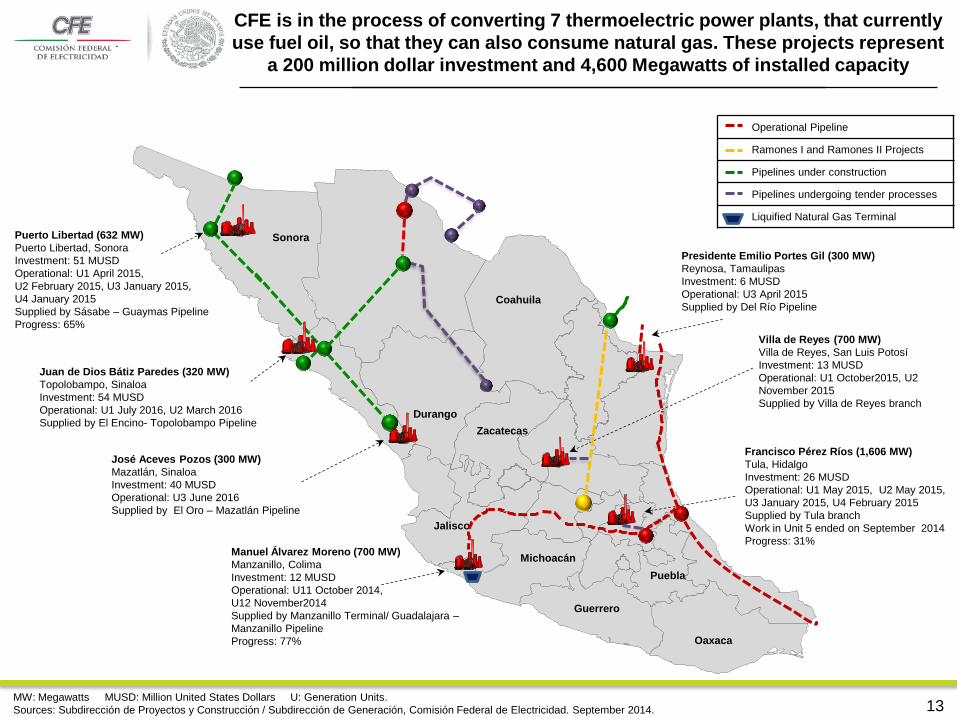
Puerto Libertad (632 MW)
Puerto Libertad, Sonora
Investment: 51 MUSD
Operational: U1 April 2015,
U2 February 2015, U3 January 2015,
U4 January 2015
Supplied by Sásabe – Guaymas Pipeline
Progress: 65%
Juan de Dios Bátiz Paredes (320 MW)
Topolobampo, Sinaloa
Investment: 54 MUSD
Operational: U1 July 2016, U2 March 2016
Supplied by El Encino- Topolobampo Pipeline
José Aceves Pozos (300 MW)
Mazatlán, Sinaloa
Investment: 40 MUSD
Operational: U3 June 2016
Supplied by El Oro – Mazatlán Pipeline
Manuel Álvarez Moreno (700 MW)
Manzanillo, Colima
Investment: 12 MUSD
Operational: U11 October 2014,
U12 November2014
Supplied by Manzanillo Terminal/ Guadalajara –
Manzanillo Pipeline
Progress: 77%
Villa de Reyes (700 MW)
Villa de Reyes, San Luis Potosí
Investment: 13 MUSD
Operational: U1 October2015, U2
November 2015
Supplied by Villa de Reyes branch
Francisco Pérez Ríos (1,606 MW)
Tula, Hidalgo
Investment: 26 MUSD
Operational: U1 May 2015, U2 May 2015,
U3 January 2015, U4 February 2015
Supplied by Tula branch
Work in Unit 5 ended on September 2014
Progress: 31%
Operational Pipeline
Ramones I and Ramones II Projects
Pipelines under construction
Pipelines undergoing tender processes
Liquified Natural Gas Terminal
Coahuila
Sonora
Durango Zacatecas
Jalisco
Michoacán
Guerrero
Oaxaca
Puebla
Presidente Emilio Portes Gil (300 MW)
Reynosa, Tamaulipas
Investment: 6 MUSD
Operational: U3 April 2015
Supplied by Del Río Pipeline
MW: Megawatts MUSD: Million United States Dollars U: Generation Units.
Sources: Subdirección de Proyectos y Construcción / Subdirección de Generación, Comisión Federal de Electricidad. September 2014.
CFE is in the process of converting 7 thermoelectric power plants, that currently
use fuel oil, so that they can also consume natural gas. These projects represent
a 200 million dollar investment and 4,600 Megawatts of installed capacity
13
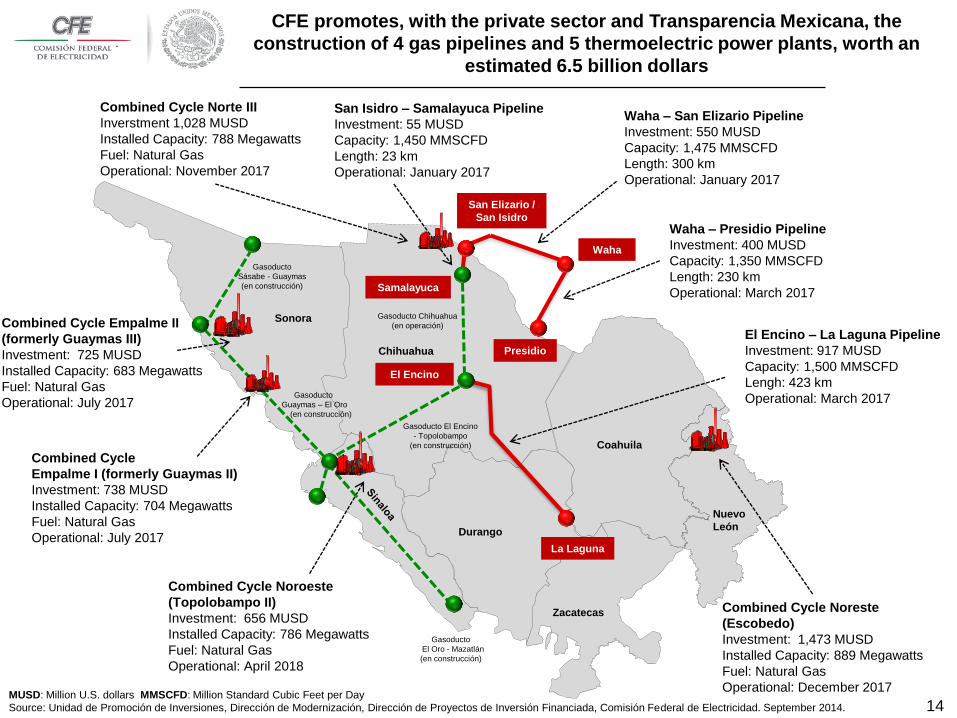
Combined Cycle Empalme II
(formerly Guaymas III)
Investment: 725 MUSD
Installed Capacity: 683 Megawatts
Fuel: Natural Gas
Operational: July 2017
Combined Cycle Noreste
(Escobedo)
Investment: 1,473 MUSD
Installed Capacity: 889 Megawatts
Fuel: Natural Gas
Operational: December 2017
Combined Cycle Noroeste
(Topolobampo II)
Investment: 656 MUSD
Installed Capacity: 786 Megawatts
Fuel: Natural Gas
Operational: April 2018
Gasoducto
Sásabe - Guaymas
(en construcción)
Gasoducto
Guaymas – El Oro
(en construcción)
Gasoducto
El Oro - Mazatlán
(en construcción)
Gasoducto Chihuahua
(en operación)
Gasoducto El Encino
- Topolobampo
(en construcción)
MUSD: Million U.S. dollars MMSCFD: Million Standard Cubic Feet per Day
Source: Unidad de Promoción de Inversiones, Dirección de Modernización, Dirección de Proyectos de Inversión Financiada, Comisión Federal de Electricidad. September 2014.
CFE promotes, with the private sector and Transparencia Mexicana, the
construction of 4 gas pipelines and 5 thermoelectric power plants, worth an
estimated 6.5 billion dollars
Waha
La Laguna
Presidio
Samalayuca
El Encino
Combined Cycle
Empalme I (formerly Guaymas II)
Investment: 738 MUSD
Installed Capacity: 704 Megawatts
Fuel: Natural Gas
Operational: July 2017
Combined Cycle Norte III
Inverstment 1,028 MUSD
Installed Capacity: 788 Megawatts
Fuel: Natural Gas
Operational: November 2017
Sonora
Coahuila
Durango
Chihuahua
Zacatecas
Nuevo
León
San Elizario /
San Isidro
14
San Isidro – Samalayuca Pipeline
Investment: 55 MUSD
Capacity: 1,450 MMSCFD
Length: 23 km
Operational: January 2017
Waha – San Elizario Pipeline
Investment: 550 MUSD
Capacity: 1,475 MMSCFD
Length: 300 km
Operational: January 2017
Waha – Presidio Pipeline
Investment: 400 MUSD
Capacity: 1,350 MMSCFD
Length: 230 km
Operational: March 2017
El Encino – La Laguna Pipeline
Investment: 917 MUSD
Capacity: 1,500 MMSCFD
Lengh: 423 km
Operational: March 2017
15
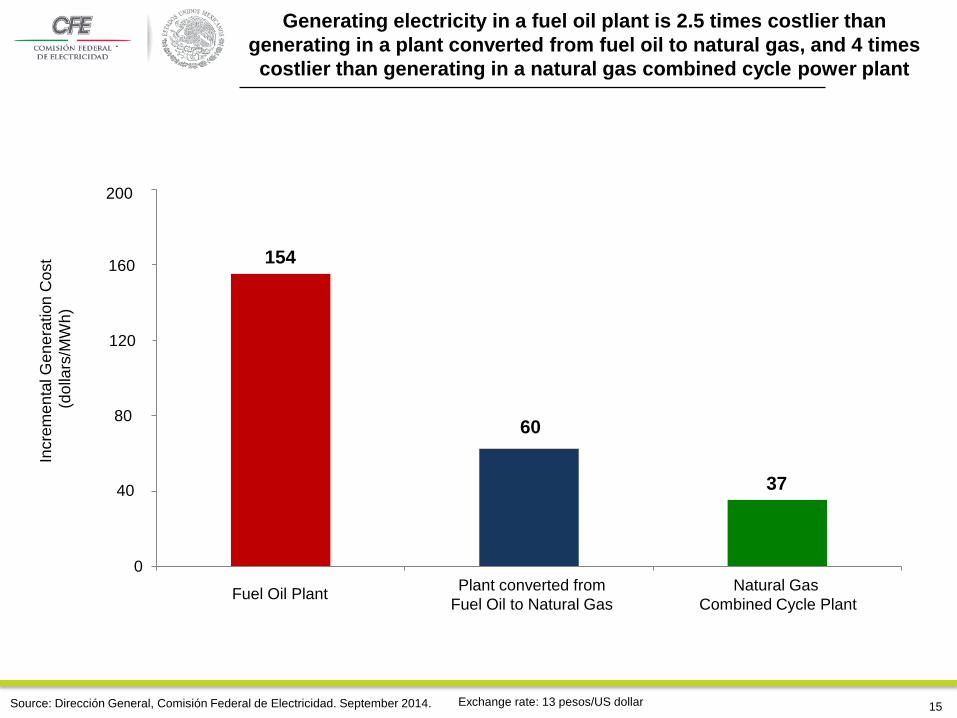
Generating electricity in a fuel oil plant is 2.5 times costlier than
generating in a plant converted from fuel oil to natural gas, and 4 times
costlier than generating in a natural gas combined cycle power plant
Source: Dirección General, Comisión Federal de Electricidad. September 2014.
Incre
me
nta
l G
en
era
tion
Co
st
(d
olla
rs/M
Wh
)
1,997
780
478
0
500
1,000
1,500
2,000
2,500
Combustóleo Conversiones Ciclo Combinado con Gas NaturalPlant converted from
Fuel Oil to Natural Gas
Natural Gas
Combined Cycle Plant Fuel Oil Plant
Exchange rate: 13 pesos/US dollar
154
60
37 40
80
120
160
200
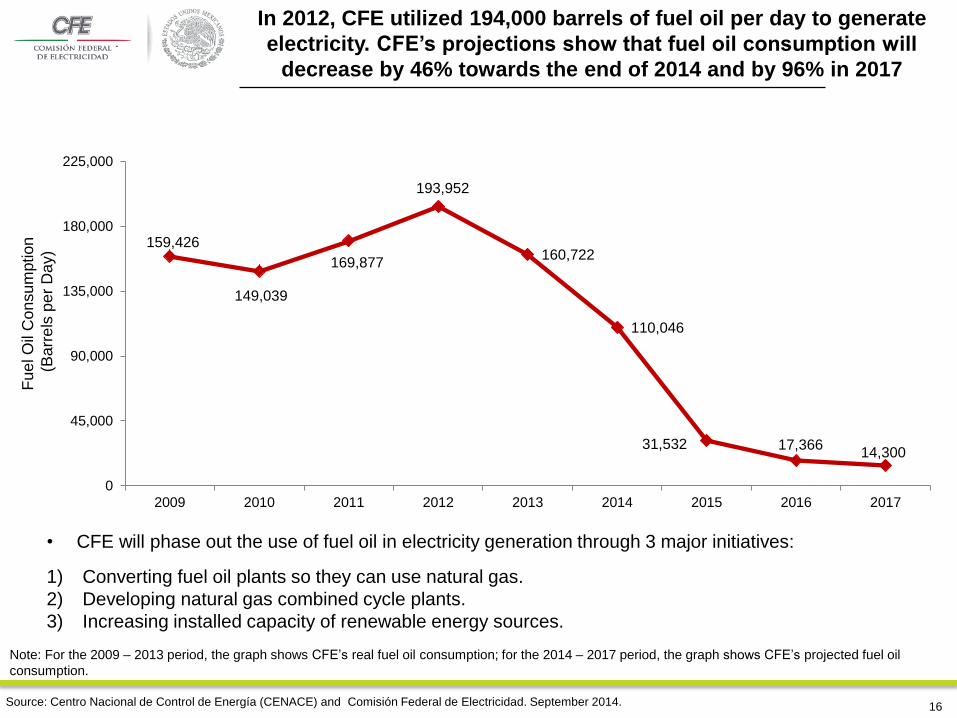
• CFE will phase out the use of fuel oil in electricity generation through 3 major initiatives:
1) Converting fuel oil plants so they can use natural gas.
2) Developing natural gas combined cycle plants.
3) Increasing installed capacity of renewable energy sources.
Source: Centro Nacional de Control de Energía (CENACE) and Comisión Federal de Electricidad. September 2014.
159,426
149,039
169,877
193,952
160,722
110,046
31,532 17,366 14,300
0
45,000
90,000
135,000
180,000
225,000
2009 2010 2011 2012 2013 2014 2015 2016 2017
In 2012, CFE utilized 194,000 barrels of fuel oil per day to generate
electricity. CFE’s projections show that fuel oil consumption will
decrease by 46% towards the end of 2014 and by 96% in 2017
Note: For the 2009 – 2013 period, the graph shows CFE’s real fuel oil consumption; for the 2014 – 2017 period, the graph shows CFE’s projected fuel oil
consumption.
Fu
el O
il C
on
su
mption
(B
arr
els
pe
r D
ay)
16
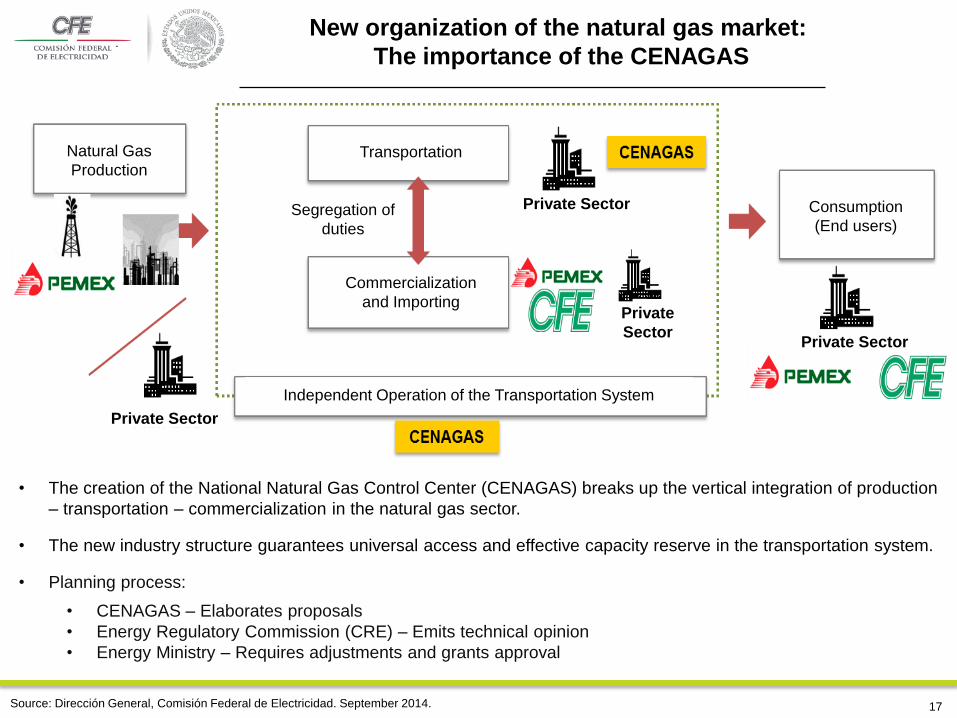
• The creation of the National Natural Gas Control Center (CENAGAS) breaks up the vertical integration of production
– transportation – commercialization in the natural gas sector.
• The new industry structure guarantees universal access and effective capacity reserve in the transportation system.
• Planning process:
• CENAGAS – Elaborates proposals
• Energy Regulatory Commission (CRE) – Emits technical opinion
• Energy Ministry – Requires adjustments and grants approval
New organization of the natural gas market:
The importance of the CENAGAS
17 Source: Dirección General, Comisión Federal de Electricidad. September 2014.
Consumption
(End users)
Transportation
Private Sector
Private Sector
Private Sector
Private
Sector
Commercialization
and Importing
Independent Operation of the Transportation System
Segregation of
duties
Natural Gas
Production
• Article 69 of the Hydrocarbons Law states that strategic infrastructure projects
can be developed through open season procedures in the terms
established by the Energy Regulatory Commission (CRE). The Energy
Ministry, with technical assistance of the CRE, will verify that these projects are
aligned to the national five-year Integrated Natural Gas Transportation and
Storage Expansion Plan. If this is not the case, the Energy Ministry will dictate
corrective actions.
• Article 70 establishes that permit holders with idle capacity, will have to make it
available through Electronic Capacity Posting Bulletins, enabling third
parties to reserve such capacity after paying an authorized fee and meeting the
technical requirements established by the Energy Regulatory Commission
(CRE).
• Articles 71 through 75 detail the regulatory framework which establishes
open access for users interested in participating in the natural gas
transportation sector.
Open Seasons in the Natural Gas Sector
(Open access for transportation system users:
Hydrocarbons Law, Chapter IV)
Source: Hydrocarbons Law, Chapter IV. 18
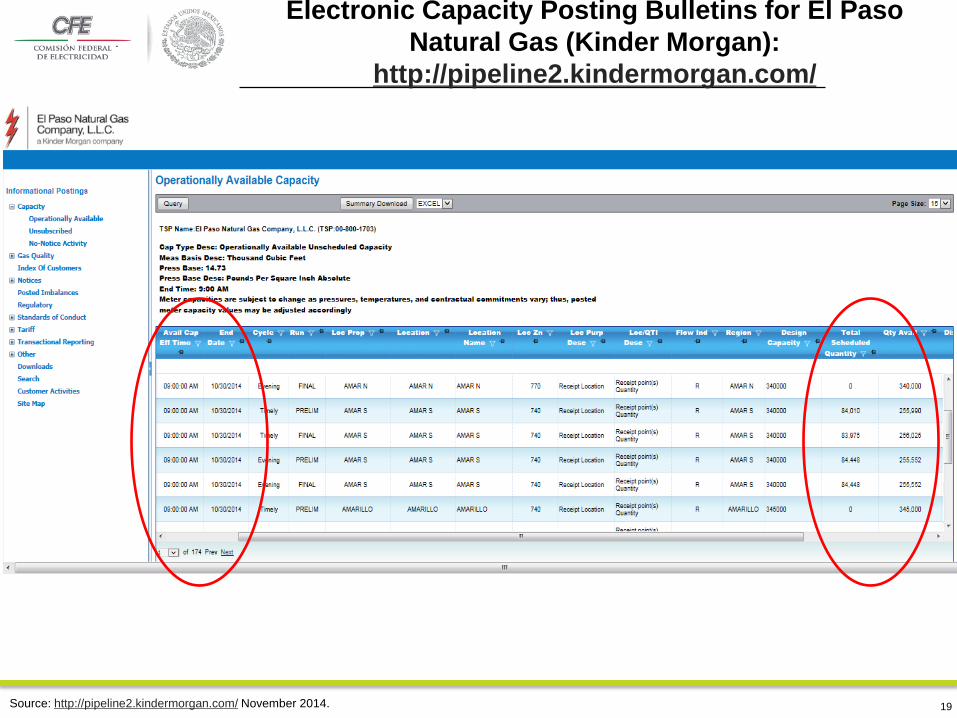
Electronic Capacity Posting Bulletins for El Paso
Natural Gas (Kinder Morgan):
http://pipeline2.kindermorgan.com/
Source: http://pipeline2.kindermorgan.com/ November 2014. 19
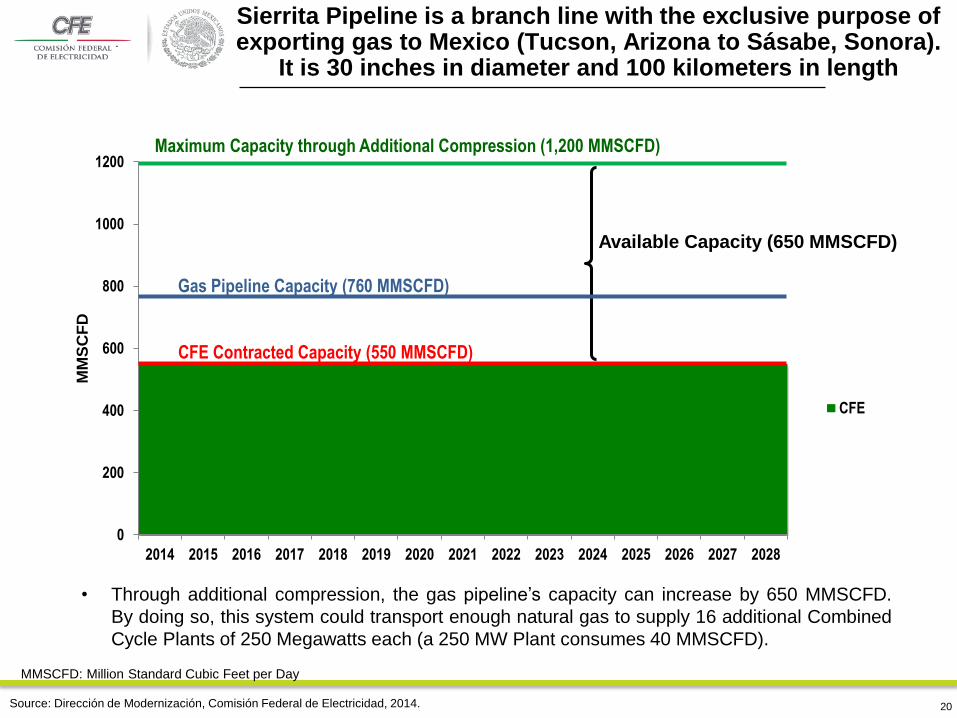
Sierrita Pipeline is a branch line with the exclusive purpose of exporting gas to Mexico (Tucson, Arizona to Sásabe, Sonora).
It is 30 inches in diameter and 100 kilometers in length
20
0
200
400
600
800
1000
1200
2014 2015 2016 2017 2018 2019 2020 2021 2022 2023 2024 2025 2026 2027 2028
MM
SC
FD
CFE
CFE Contracted Capacity (550 MMSCFD)
Maximum Capacity through Additional Compression (1,200 MMSCFD)
• Through additional compression, the gas pipeline’s capacity can increase by 650 MMSCFD.
By doing so, this system could transport enough natural gas to supply 16 additional Combined
Cycle Plants of 250 Megawatts each (a 250 MW Plant consumes 40 MMSCFD).
Available Capacity (650 MMSCFD)
Gas Pipeline Capacity (760 MMSCFD)
Source: Dirección de Modernización, Comisión Federal de Electricidad, 2014.
MMSCFD: Million Standard Cubic Feet per Day
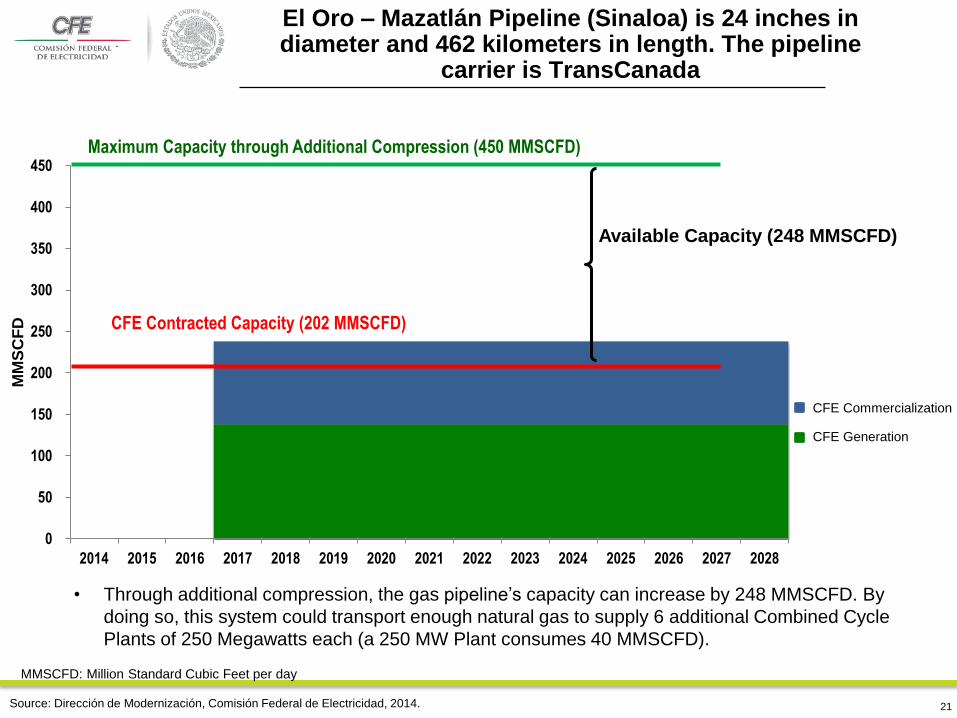
El Oro – Mazatlán Pipeline (Sinaloa) is 24 inches in diameter and 462 kilometers in length. The pipeline
carrier is TransCanada
21
0
50
100
150
200
250
300
350
400
450
2014 2015 2016 2017 2018 2019 2020 2021 2022 2023 2024 2025 2026 2027 2028
MM
SC
FD
CFE Contracted Capacity (202 MMSCFD)
Maximum Capacity through Additional Compression (450 MMSCFD)
Available Capacity (248 MMSCFD)
• Through additional compression, the gas pipeline’s capacity can increase by 248 MMSCFD. By
doing so, this system could transport enough natural gas to supply 6 additional Combined Cycle
Plants of 250 Megawatts each (a 250 MW Plant consumes 40 MMSCFD).
Source: Dirección de Modernización, Comisión Federal de Electricidad, 2014.
CFE Commercialization
CFE Generation
MMSCFD: Million Standard Cubic Feet per day
Key elements of the Energy Reform
and their implications for the Gas
Sector from CFE’s perspective
Enrique Ochoa Reza, PhD
CEO
Comisión Federal de Electricidad - CFE
November 2014
@EnriqueOchoaR