Embed Size (px)
Citation preview

Career implications - 1
Implications of Health Reform for
Healthcare Executive Positions: A
National Study of Senior Leadership
Teams in Freestanding Hospitals
Final Report: Oct. 24, 2014
Prepared for the American College of Healthcare Executives by
Andrew N. Garman, PsyD, MS
Professor, health systems management, Rush University
Cassia Carter, MS
Research Assistant, Rush University &
Doctoral student, industrial/organizational psychology, Illinois Institute of Technology

Career implications - 2
Introduction The evolution of the U.S. healthcare environment is bringing with it unprecedented changes to
the healthcare management profession. This evolution is likely to yield many opportunities for
career-minded healthcare managers, but can also make career planning more confusing. With
new titles featuring phrases such as “experience officer” and “population health” appearing on
the horizon, as well as more titles beginning with “chief,” sorting out which of these represent
robust career paths, and which may be temporary phenomena, can seem daunting.
To help shed light on the changing nature of healthcare executive career paths, the American
College of Healthcare Executives partnered with researchers at Rush University to develop and
implement a national survey to examine the changing nature of senior leadership teams, focusing
on freestanding community hospitals as a starting point. Prior to describing this research, some
historical context and definitions will be helpful.
Healthcare Management: A Profession in Transition
The U.S. Bureau of Labor Statistics (BLS)’s Occupational Outlook Handbook (2014) defines the
medical and health services manager’s role involving the planning, directing and coordinating of
medical and health services. This definition encompasses both executive leadership and
healthcare management at other levels. According to BLS estimates, there were approximately
315,500 people working in healthcare management in the United States in 2012.
Given the considerable volume of merger and acquisition activity in the health sector, it may
seem logical to conclude that the number of healthcare management positions will shrink.
However this conclusion does not take into account the extent to which organizational change
creates new management needs. For example, prior research from other industries suggests in
times of environmental uncertainty and sector-level change, senior leadership teams in particular
tend to expand rather than contract (Haleblian, Jerayr, & Finkelstein, 1993). Indeed, the BLS
estimates the healthcare management profession is likely to grow by about 23% between 2012
and 2022, much faster than the national average for jobs generally.
Healthcare Management in the Context of Health Reform
Regardless of this growth, the level and pace of change in healthcare is unprecedented
(American College of Healthcare Executives, 2014), which may translate into a much larger
proportion of job transitions than has historically been the case. Growth is also unlikely to be
uniform across the healthcare management profession, let alone individual organizations. Some
specialties may grow steadily in the years to come; demand for others may grow rapidly during
the height of the transition from volume to value and then halt or decline afterward. In each case,
the balance of talent supply as well as demand will influence how robust a specific career path
will become.

Career implications - 3
The present study was pursued to help shed light on some of these transitions within the
healthcare management profession. Using a survey of ACHE-affiliated CEOs from freestanding
hospitals, we sought to address three research questions in particular:
1. What job titles and roles are most frequently found within freestanding hospitals’
senior leadership teams?
2. How are these positions changing over time?
3. How often are “Chief” and “top officer” jobs within these organizations found on
senior leadership teams, vs. reporting to the CEO but not on the senior team, vs. neither?
Methods
Survey design
The survey used in this study was part of a larger project ACHE conducted on behalf of its CEO
Circle membership, to understand the changing nature of senior leadership teams (SLTs) within
freestanding hospitals (Athey & Garman, 2014). Three sections of this survey asked respondents
to systematically describe the members of their SLT, their direct reports who were not SLT
members and anyone else in their organization carrying a title containing “chief.”
Respondents were asked to provide two descriptors for each of the SLT members they identified.
First they were asked to provide a job title and next to identify one or more roles as appropriate
to that person’s responsibilities. The survey was prepopulated with 18 role codes commonly
found among senior executives. Respondents could also write in up to two “Other” codes if they
had SLT members with substantive roles that were not captured by these 18.
Survey Sample and Distribution
Our survey sample was identified by staff of the American College of Healthcare Executives,
who queried their member database to identify all members who were currently listed as CEOs
of freestanding hospitals. A total of 949 individuals with deliverable addresses were identified.
Surveys were distributed to these members via two rounds of post mail during October-
December of 2013. Completed surveys were mailed back to ACHE, who keypunched responses
into an Excel file according to a prespecified coding protocol. Individual responses that did not
readily fit into pre-existing coding categories were discussed among ACHE and Rush staff until
consensus on coding was reached.
Results A total of 479 surveys were completed and returned, representing a response rate of 49%. Of the
CEOs responding, 84% indicated they had a master’s degree in either health administration or
Career implications - 4
another administrative area, 12% had a nursing background, 2% had an MD or DO degree, 5%
had an “Other” clinical degree and 5% had a doctorate in health administration or another
administrative area (note: respondents could indicate more than one area in their educational
background).
Of the 479 responses, ten were removed from the sample because the respondents’ organizations
had been reclassified as systems since the original sample was drawn. Of the remaining
respondents, 39% worked for (non-federal) government hospitals; 59% for not-for-profit
hospitals, and 2% for investor-owned hospitals. 4% of respondents’ organizations were Council
of Teaching Hospital (COTH) members; 2% were critical access hospitals. In terms of core
based statistical area (CBSA), 10% were located in divisions, 34% were located in metropolitan
areas, 26% were located in micropolitan areas, and 29% were located in rural areas. Respondents
averaged 7.8 years in their current CEO position, with the majority (83%) having a master’s in
health administration.
Job Titles and Roles
Across the 469 respondents analyzed, a total of 2,711 unique individuals were identified as
members of a senior leadership team (SLT), of which 2,689 were assigned job roles by the
respondents. These individuals had 1025 unique job titles. In other words, each SLT contributed
an average of 2.2 unique job titles to the total.
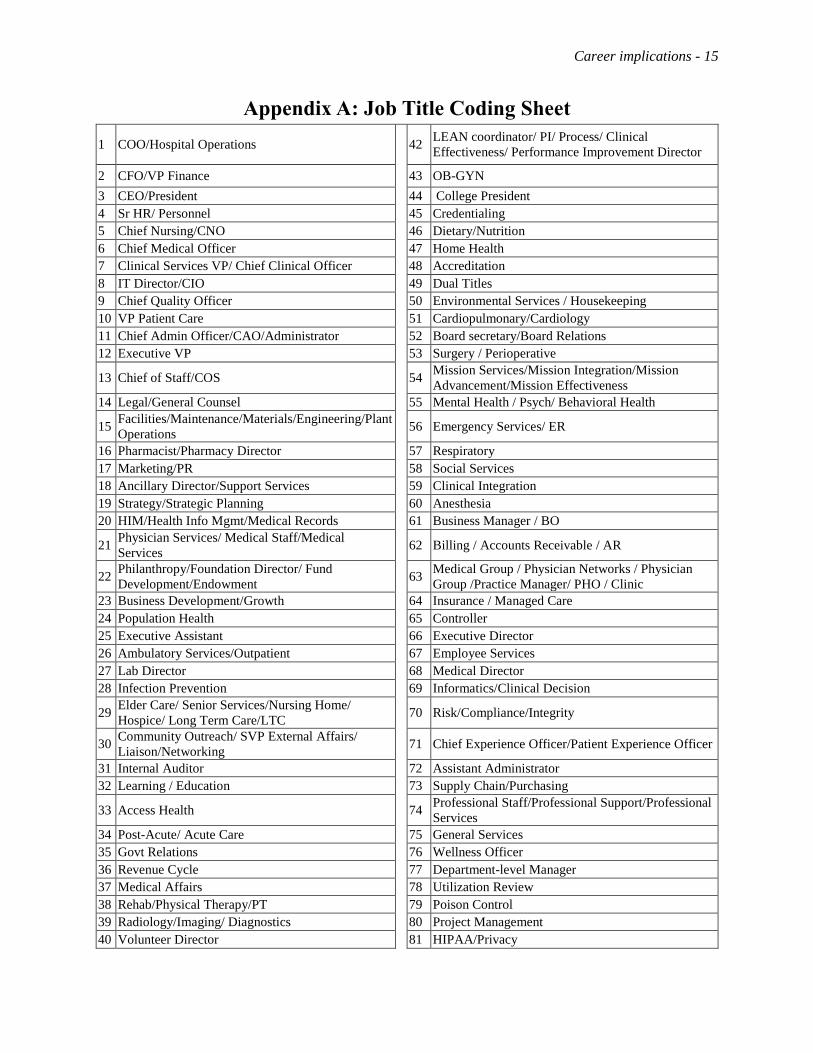
To better identify meaningful patterns across these positions, we needed to reduce title variance
by grouping titles into broader categories. With the assistance of an executive with expertise in
healthcare leadership position design, a coding scheme containing 81 categories was developed
and then used to group all job titles. The full title coding sheet can be found in Appendix A.
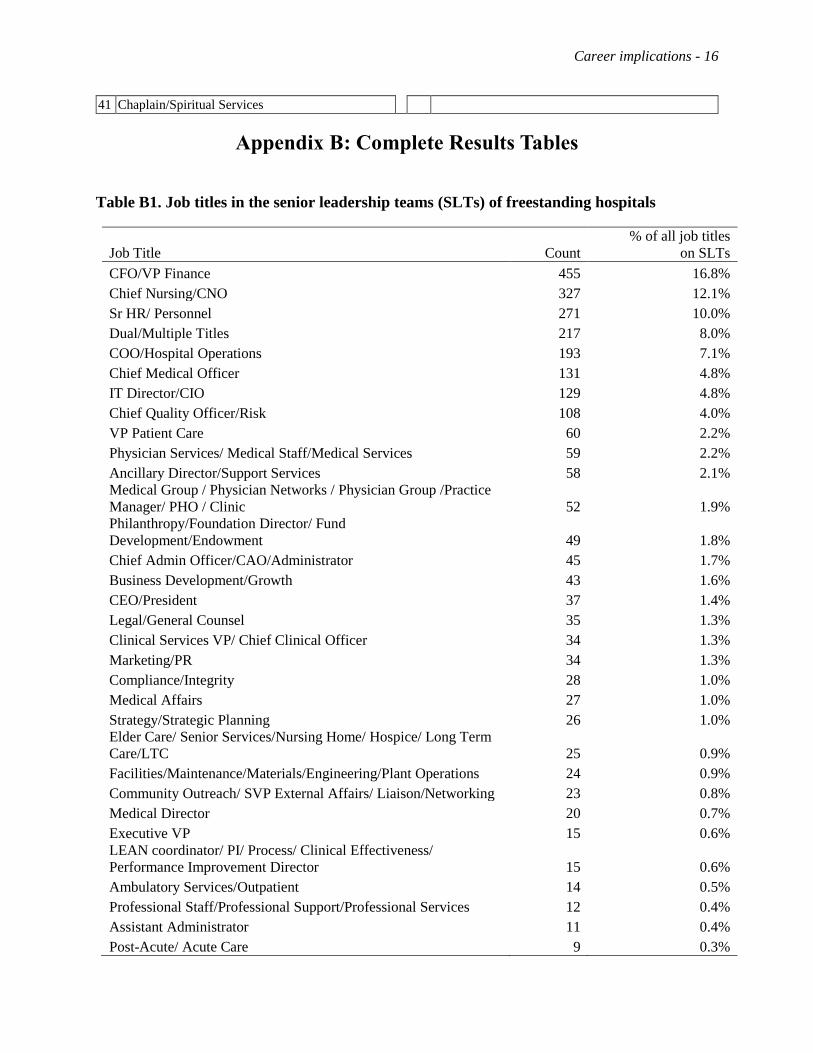
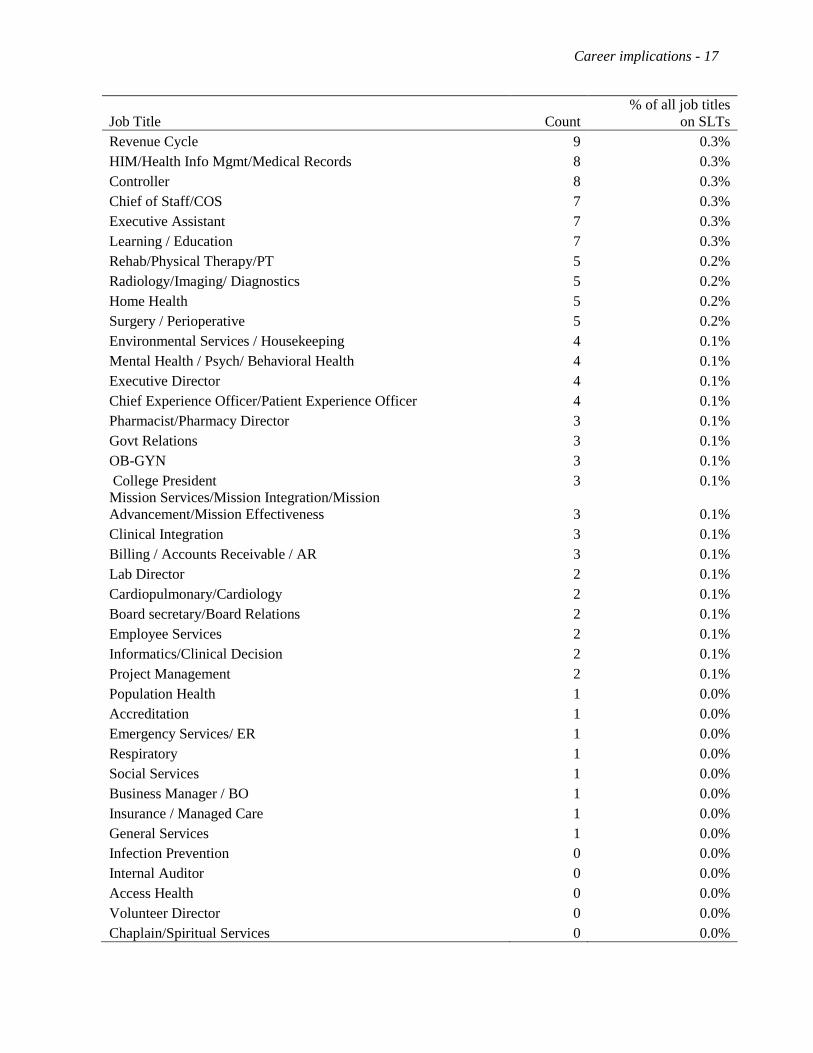
Current Composition of Job Titles on Hospital Senior Leadership Teams
To address our first research question, we analyzed all of the titles of individuals that
respondents identified as members of SLTs. The three job title categories most frequently present
on SLTs were CFO/VP Finance (16.8% of all job titles for positions included in SLTs), Chief
Nursing/CNO (12.1%) and Human Resources (HR) (10.0%).
Of the 2711 total SLT jobs, 8% had two or more job titles assigned to them (e.g. “SVP, COO &
CNE”). Table 1 provides the job titles with the highest frequency of occurrence on SLTs;
complete results can be seen in Appendix B.

Career implications - 5
Table 1. Job title categories comprising at least 1% of the total job titles senior leadership
teams (SLTs) of freestanding hospitals
Job Title Count
% of all Job Titles
on SLTs
CFO/VP Finance 455 16.8%
Chief Nursing/CNO 327 12.1%
Sr HR/ Personnel 271 10.0%
Dual Titles 217 8.0%
COO/Hospital Operations 193 7.1%
Chief Medical Officer 131 4.8%
IT Director/CIO 129 4.8%
Chief Quality Officer/Risk 108 4.0%
VP Patient Care 60 2.2%
Physician Services/ Medical Staff/Medical Services 59 2.2%
Ancillary Director/Support Services 58 2.1%
Medical Group / Physician Networks / Physician Group
/Practice Manager/ PHO / Clinic 52 1.9%
Philanthropy/Foundation Director/ Fund
Development/Endowment 49 1.8%
Chief Admin Officer/CAO/Administrator 45 1.7%
Business Development/Growth 43 1.6%
CEO/President 37 1.4%
Legal/General Counsel 35 1.3%
Clinical Services VP/ Chief Clinical Officer 34 1.3%
Marketing/PR 34 1.3%
Compliance/Integrity 28 1.0%
Medical Affairs 27 1.0%
Strategy/Strategic Planning 26 1.0%
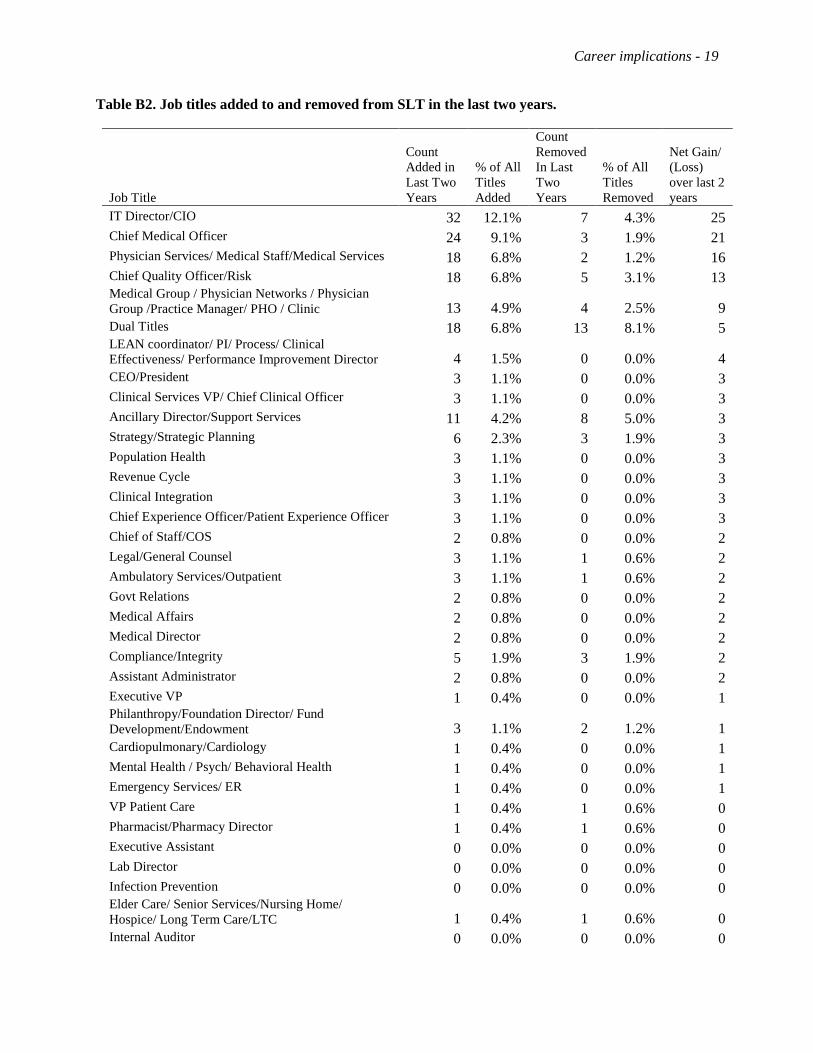
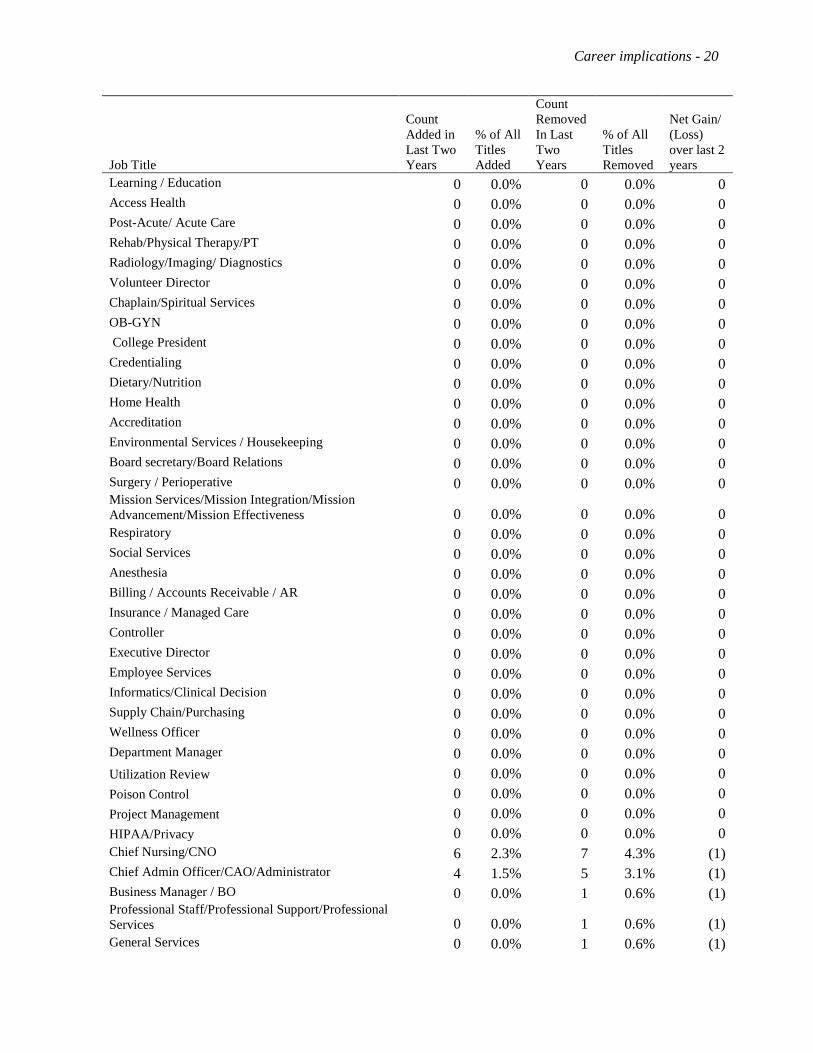
How SLT Jobs Are Changing
Survey respondents were asked to identify changes to their SLTs over the past two years, as well
as the planned additions or subtractions of SLT members during the course of the next two years.
Table 2 reports the largest net changes in job titles associated with SLTs over the past two years;
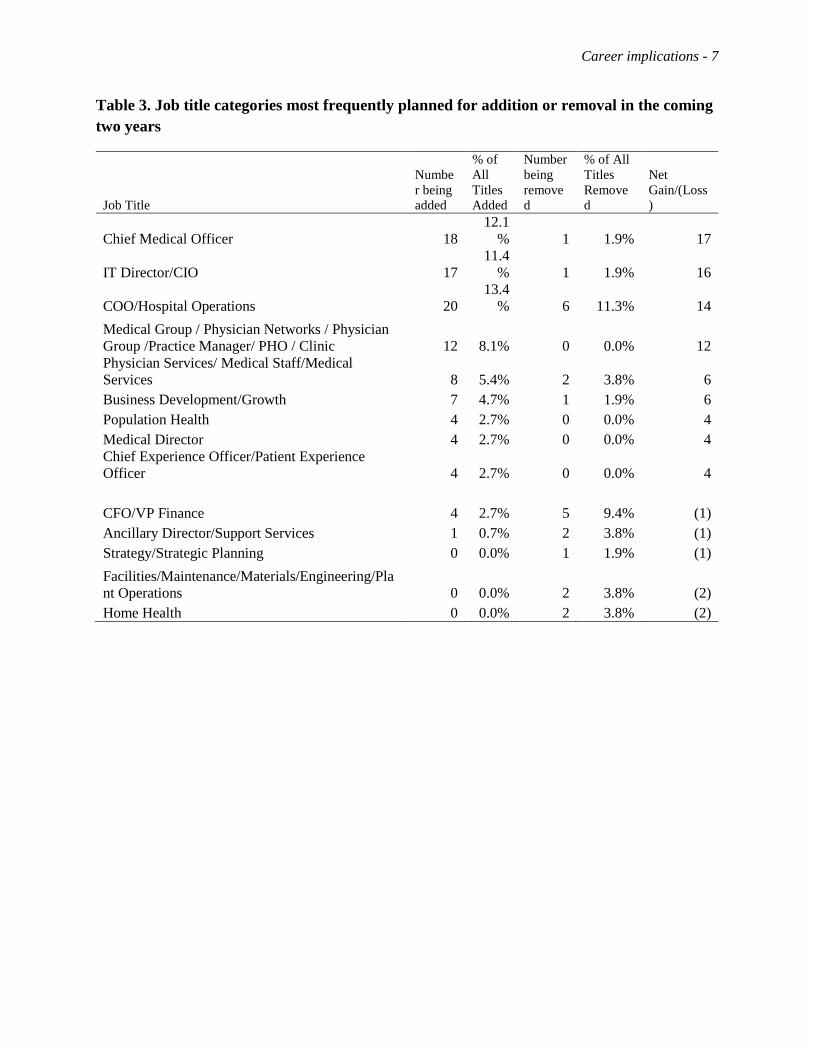
Table 3 describes the largest changes anticipated to SLTs in the coming two years. (Full results
are provided in Appendix B.)
Responses suggest that, in general, SLTs in freestanding hospitals are expanding rather than
contracting, with respondents reporting they added 1.6 positions for every one they removed in
the past two years, and on average planning to add 2.8 positions for every position being
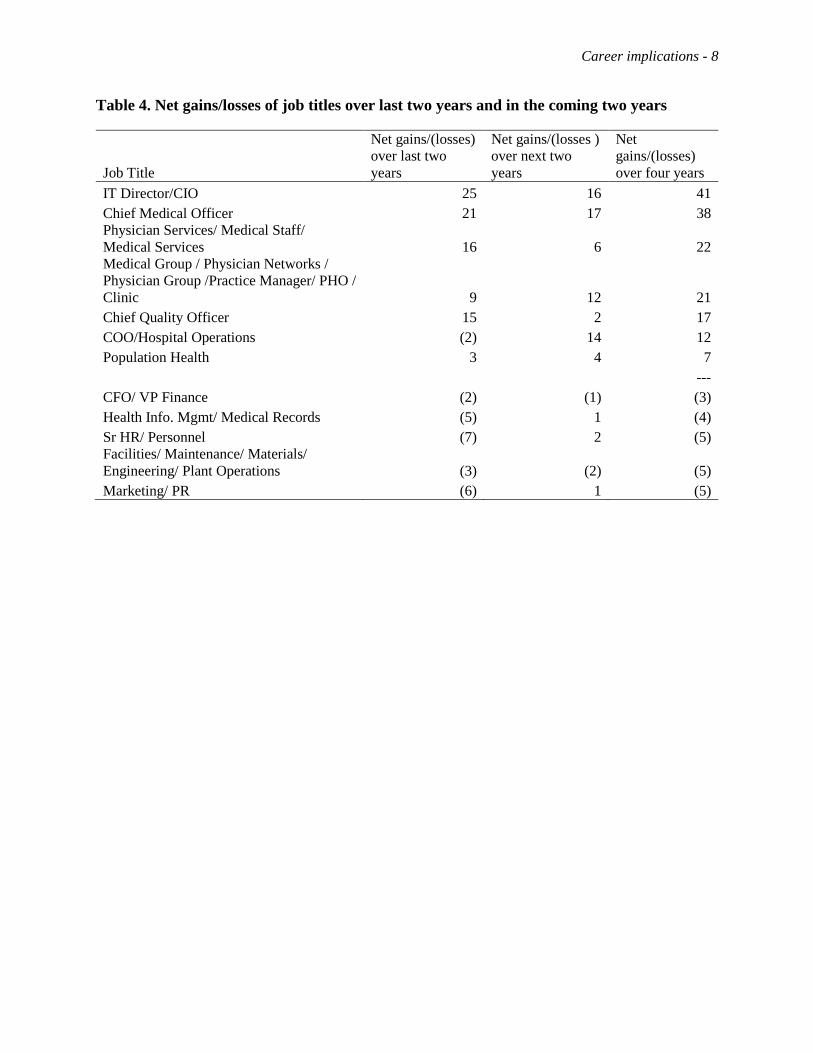
removed in the coming two years. As illustrated by Table 4, which aggregates the results of the
prior and coming two years, recent and anticipated changes reflect an increasing emphasis on

Career implications - 6
both information technology and medical leadership in the ongoing strategic decision-making
within these organizations. The coming years look like they will also add an emphasis on
networks, quality, hospital operations, and public health.
Table 2. Job title categories most frequently added or removed over the past two years
Job Title
Number
added
% of All
Titles
Added
Number
removed
% of All
Titles
Removed
Net
Gain/(Loss)
IT Director/CIO 32 12.1% 7 4.3% 25
Chief Medical Officer 24 9.1% 3 1.9% 21
Physician Services/ Medical
Staff/Medical Services 18 6.8% 2 1.2% 16
Chief Quality Officer/Risk 18 6.8% 5 3.1% 13
Medical Group / Physician
Networks / Physician Group
/Practice Manager/ PHO / Clinic 13 4.9% 4 2.5% 9
…
COO/Hospital Operations 19 7.2% 21 13.0%
(2)
CFO/VP Finance 10 3.8% 12 7.5% (2)
Business Development/Growth 6 2.3% 8 5.0% (2)
Community Outreach/ SVP
External Affairs/
Liaison/Networking 1 0.4% 3 1.9% (2)
Facilities/Maintenance/Materials/
Engineering/Plant Operations 0 0.0% 3 1.9% (3)
HIM/Health Info Mgmt/Medical
Records 1 0.4% 6 3.7% (5)
Marketing/PR 7 2.6% 13 8.1% (6)
Sr HR/ Personnel 18 6.8% 25 15.5% (7)
Career implications - 7
Table 3. Job title categories most frequently planned for addition or removal in the coming
two years
Job Title
Numbe
r being
added
% of
All
Titles
Added
Number
being
remove
d
% of All
Titles
Remove
d
Net
Gain/(Loss
)
Chief Medical Officer 18
12.1
% 1 1.9% 17
IT Director/CIO 17
11.4
% 1 1.9% 16
COO/Hospital Operations 20
13.4
% 6 11.3% 14
Medical Group / Physician Networks / Physician
Group /Practice Manager/ PHO / Clinic 12 8.1% 0 0.0% 12
Physician Services/ Medical Staff/Medical
Services 8 5.4% 2 3.8% 6
Business Development/Growth 7 4.7% 1 1.9% 6
Population Health 4 2.7% 0 0.0% 4
Medical Director 4 2.7% 0 0.0% 4
Chief Experience Officer/Patient Experience
Officer 4 2.7% 0 0.0% 4
CFO/VP Finance 4 2.7% 5 9.4% (1)
Ancillary Director/Support Services 1 0.7% 2 3.8% (1)
Strategy/Strategic Planning 0 0.0% 1 1.9% (1)
Facilities/Maintenance/Materials/Engineering/Pla
nt Operations 0 0.0% 2 3.8% (2)
Home Health 0 0.0% 2 3.8% (2)
Career implications - 8
Table 4. Net gains/losses of job titles over last two years and in the coming two years
Job Title
Net gains/(losses)
over last two
years
Net gains/(losses )
over next two
years
Net
gains/(losses)
over four years
IT Director/CIO 25 16 41
Chief Medical Officer 21 17 38
Physician Services/ Medical Staff/
Medical Services 16 6 22
Medical Group / Physician Networks /
Physician Group /Practice Manager/ PHO /
Clinic 9 12 21
Chief Quality Officer 15 2 17
COO/Hospital Operations (2) 14 12
Population Health 3 4 7
---
CFO/ VP Finance (2) (1) (3)
Health Info. Mgmt/ Medical Records (5) 1 (4)
Sr HR/ Personnel (7) 2 (5)
Facilities/ Maintenance/ Materials/
Engineering/ Plant Operations (3) (2) (5)
Marketing/ PR (6) 1 (5)
Career implications - 9
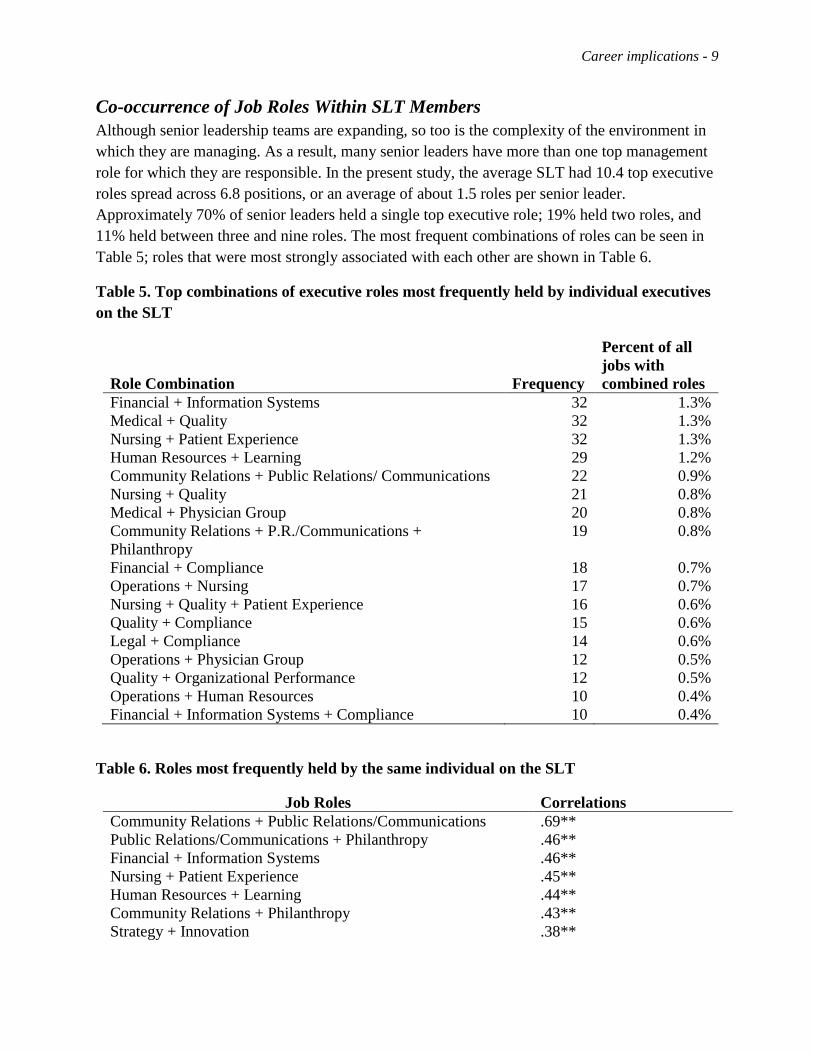
Co-occurrence of Job Roles Within SLT Members
Although senior leadership teams are expanding, so too is the complexity of the environment in
which they are managing. As a result, many senior leaders have more than one top management
role for which they are responsible. In the present study, the average SLT had 10.4 top executive
roles spread across 6.8 positions, or an average of about 1.5 roles per senior leader.
Approximately 70% of senior leaders held a single top executive role; 19% held two roles, and
11% held between three and nine roles. The most frequent combinations of roles can be seen in
Table 5; roles that were most strongly associated with each other are shown in Table 6.
Table 5. Top combinations of executive roles most frequently held by individual executives
on the SLT
Role Combination
Frequency
Percent of all
jobs with
combined roles
Financial + Information Systems 32 1.3%
Medical + Quality 32 1.3%
Nursing + Patient Experience 32 1.3%
Human Resources + Learning 29 1.2%
Community Relations + Public Relations/ Communications 22 0.9%
Nursing + Quality 21 0.8%
Medical + Physician Group 20 0.8%
Community Relations + P.R./Communications +
Philanthropy
19 0.8%
Financial + Compliance 18 0.7%
Operations + Nursing 17 0.7%
Nursing + Quality + Patient Experience 16 0.6%
Quality + Compliance 15 0.6%
Legal + Compliance 14 0.6%
Operations + Physician Group 12 0.5%
Quality + Organizational Performance 12 0.5%
Operations + Human Resources 10 0.4%
Financial + Information Systems + Compliance 10 0.4%
Table 6. Roles most frequently held by the same individual on the SLT
Job Roles Correlations
Community Relations + Public Relations/Communications .69**
Public Relations/Communications + Philanthropy .46**
Financial + Information Systems .46**
Nursing + Patient Experience .45**
Human Resources + Learning .44**
Community Relations + Philanthropy .43**
Strategy + Innovation .38**
Career implications - 10
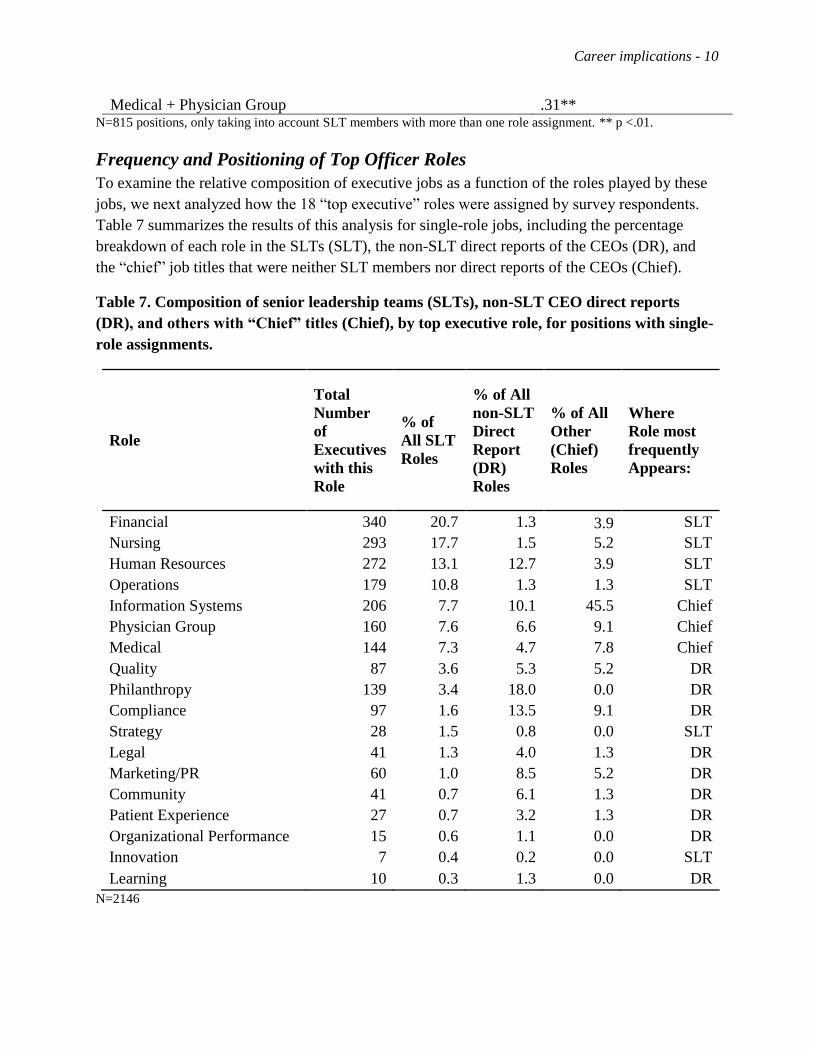
Medical + Physician Group .31** N=815 positions, only taking into account SLT members with more than one role assignment. ** p <.01.
Frequency and Positioning of Top Officer Roles
To examine the relative composition of executive jobs as a function of the roles played by these
jobs, we next analyzed how the 18 “top executive” roles were assigned by survey respondents.
Table 7 summarizes the results of this analysis for single-role jobs, including the percentage
breakdown of each role in the SLTs (SLT), the non-SLT direct reports of the CEOs (DR), and
the “chief” job titles that were neither SLT members nor direct reports of the CEOs (Chief).
Table 7. Composition of senior leadership teams (SLTs), non-SLT CEO direct reports
(DR), and others with “Chief” titles (Chief), by top executive role, for positions with single-
role assignments.
Role
Total
Number
of
Executives
with this
Role
% of
All SLT
Roles
% of All
non-SLT
Direct
Report
(DR)
Roles
% of All
Other
(Chief)
Roles
Where
Role most
frequently
Appears:
Financial 340 20.7 1.3 3.9 SLT
Nursing 293 17.7 1.5 5.2 SLT
Human Resources 272 13.1 12.7 3.9 SLT
Operations 179 10.8 1.3 1.3 SLT
Information Systems 206 7.7 10.1 45.5 Chief
Physician Group 160 7.6 6.6 9.1 Chief
Medical 144 7.3 4.7 7.8 Chief
Quality 87 3.6 5.3 5.2 DR
Philanthropy 139 3.4 18.0 0.0 DR
Compliance 97 1.6 13.5 9.1 DR
Strategy 28 1.5 0.8 0.0 SLT
Legal 41 1.3 4.0 1.3 DR
Marketing/PR 60 1.0 8.5 5.2 DR
Community 41 0.7 6.1 1.3 DR
Patient Experience 27 0.7 3.2 1.3 DR
Organizational Performance 15 0.6 1.1 0.0 DR
Innovation 7 0.4 0.2 0.0 SLT
Learning 10 0.3 1.3 0.0 DR
N=2146
Career implications - 11
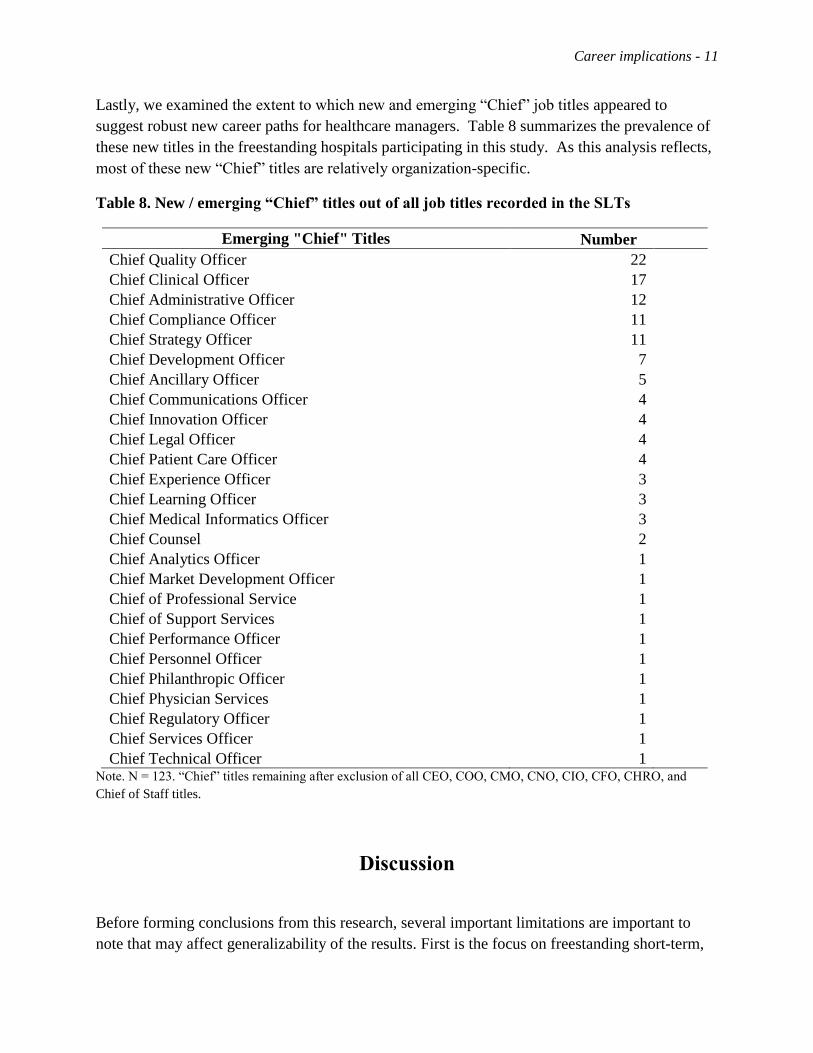
Lastly, we examined the extent to which new and emerging “Chief” job titles appeared to
suggest robust new career paths for healthcare managers. Table 8 summarizes the prevalence of
these new titles in the freestanding hospitals participating in this study. As this analysis reflects,
most of these new “Chief” titles are relatively organization-specific.
Table 8. New / emerging “Chief” titles out of all job titles recorded in the SLTs
Emerging "Chief" Titles Number
Chief Quality Officer 22
Chief Clinical Officer 17
Chief Administrative Officer 12
Chief Compliance Officer 11
Chief Strategy Officer 11
Chief Development Officer 7
Chief Ancillary Officer 5
Chief Communications Officer 4
Chief Innovation Officer 4
Chief Legal Officer 4
Chief Patient Care Officer 4
Chief Experience Officer 3
Chief Learning Officer 3
Chief Medical Informatics Officer 3
Chief Counsel 2
Chief Analytics Officer 1
Chief Market Development Officer 1
Chief of Professional Service 1
Chief of Support Services 1
Chief Performance Officer 1
Chief Personnel Officer 1
Chief Philanthropic Officer 1
Chief Physician Services 1
Chief Regulatory Officer 1
Chief Services Officer 1
Chief Technical Officer 1 Note. N = 123. “Chief” titles remaining after exclusion of all CEO, COO, CMO, CNO, CIO, CFO, CHRO, and
Chief of Staff titles.
Discussion
Before forming conclusions from this research, several important limitations are important to
note that may affect generalizability of the results. First is the focus on freestanding short-term,
Career implications - 12
nonfederal general medical/surgical hospitals. According to the American Hospital Association’s
2011 survey of U.S hospitals—the most recent data available at the time of this research—these
hospitals comprised 32% of the total hospital population in the United States (American Hospital
Association, 2013). Additionally, the 469 ACHE-affiliated CEOs responding to this research
survey oversaw approximately 23% of the total number of freestanding short-term, nonfederal,
medical/surgical hospitals, and their organizational and leadership structures could differ from
those run by non-ACHE affiliates.
While not a limitation per se, an additional challenge to the research related to the very large
number of unique job titles across the positions represented. Clearly, there is currently very little
standardization of job titles across the healthcare management profession. Some of this
heterogeneity may reflect the reality that many SLT members are tasked with more than one top-
level role, and titles could in part reflect these varied role combinations. Title variations may also
reflect positions being designed around the talents specific individuals bring to them. However,
the downsides of this heterogeneity may be considerable. For working and aspiring healthcare
managers, the lack of title standardization can make it very difficult to make sense of potential
career paths. For our colleagues in other disciplines, the level of heterogeneity represented here
poses a formidable barrier to maintaining a coherent professional identity.
These limitations notwithstanding, the present results point to some important trends in the areas
of expertise senior leadership teams are seeking to expand. The overall picture appears to reflect
efforts to effectively manage the level of complexity and environmental uncertainties in which
the sector currently finds itself. Teams are diversifying to include more functional experts,
including more clinically trained leaders. Information technology expertise in particular is clearly
increasing as a core component of many senior leadership teams. Demand for expertise in
productively evolving physician relationships also appears to be growing.
In terms of the CEO role itself, the masters of health administration and related degrees continue
to be the most prominent educational credential, comprising 84% of the total respondents. Even
among the 19% of CEOs with an MD or other clinical degree, 74% reported also having an
administrative master’s degree. This dual-credential finding suggests that recent research
dichotomizing CEOs into doctors vs. managers (e.g. Goodall, 2011) may have inaccurately
minimized or obscured the true importance of professional education in healthcare management
for these roles.
Although the net overall picture for senior leadership teams is one of growth, results still point to
substantial changes at the individual position level, with roughly three positions being removed
for every five that were added. Although current and future leaders can be optimistic about job
prospects, they also need to be mindful of the transitions that may be necessary, and should plan
accordingly.

Career implications - 13
In conclusion, while this research suggests that healthcare management will remain a vibrant
career in the years to come, it also identified better standardization of job titles and roles as an
important opportunity for establishing a stronger professional identity. In our future work, we
hope to provide greater clarity on common themes that might point in the direction of clearer
descriptions of positions and roles, to the benefit of career minded healthcare managers as well
as the profession itself.
References American College of Healthcare Executives (2014). “Career resources.” Available:
http://www.ache.org/carsvcs/ycareer.cfm. Accessed October 9, 2014.
American Hospital Association (2012). AHA Annual Survey Database Fiscal Year 2011. Health
Forum, LLC, an American Hospital Association Company, Chicago, IL.
Athey, L. & Garman, A. N. (2014). “Health Reform and the Evolving Senior Leadership Team:
A Survey of Freestanding Hospital CEOs.” White paper published by the American
College of Healthcare Executives’ CEO Circle, Chicago, IL.
Bureau of Labor Statistics, U.S. Department of Labor (2014). “Medical and Health Services
Managers.” Occupational Outlook Handbook, 2014-15 Edition. Available:
http://www.bls.gov/ooh/management/medical-and-health-services-managers.htm.
Accessed October 9, 2014.
Goodall, A. (2011). Physician-leaders and hospital performance: Is there an association? Social
Science & Medicine, 73, 535-539.
Haleblian, J., & Finkelstein, S. (1993). Top management team size, CEO dominance, and firm
performance: The moderating roles of environmental turbulence and discretion. Academy
of Management Journal, 36, 844-886.

Career implications - 14
Acknowledgments The work described in this research report was made possible through support from the
American College of Healthcare Executives. We wish to thank Leslie Athey, ACHE’s Director
of Research, as well as her staff for their support and expert advice throughout this project. We
would also like to thank Megan Butler for her subject-matter-expert review of the classification
system we developed for this survey, and W. Jeffrey Canar and Ron Landis for their statistical
consultations.
Career implications - 15
Appendix A: Job Title Coding Sheet
1 COO/Hospital Operations 42 LEAN coordinator/ PI/ Process/ Clinical
Effectiveness/ Performance Improvement Director
2 CFO/VP Finance 43 OB-GYN
3 CEO/President 44 College President
4 Sr HR/ Personnel 45 Credentialing
5 Chief Nursing/CNO 46 Dietary/Nutrition
6 Chief Medical Officer 47 Home Health
7 Clinical Services VP/ Chief Clinical Officer 48 Accreditation
8 IT Director/CIO 49 Dual Titles
9 Chief Quality Officer 50 Environmental Services / Housekeeping
10 VP Patient Care 51 Cardiopulmonary/Cardiology
11 Chief Admin Officer/CAO/Administrator 52 Board secretary/Board Relations
12 Executive VP 53 Surgery / Perioperative
13 Chief of Staff/COS 54 Mission Services/Mission Integration/Mission
Advancement/Mission Effectiveness
14 Legal/General Counsel 55 Mental Health / Psych/ Behavioral Health
15 Facilities/Maintenance/Materials/Engineering/Plant
Operations 56 Emergency Services/ ER
16 Pharmacist/Pharmacy Director 57 Respiratory
17 Marketing/PR 58 Social Services
18 Ancillary Director/Support Services 59 Clinical Integration
19 Strategy/Strategic Planning 60 Anesthesia
20 HIM/Health Info Mgmt/Medical Records 61 Business Manager / BO
21 Physician Services/ Medical Staff/Medical
Services 62 Billing / Accounts Receivable / AR
22 Philanthropy/Foundation Director/ Fund
Development/Endowment 63
Medical Group / Physician Networks / Physician
Group /Practice Manager/ PHO / Clinic
23 Business Development/Growth 64 Insurance / Managed Care
24 Population Health 65 Controller
25 Executive Assistant 66 Executive Director
26 Ambulatory Services/Outpatient 67 Employee Services
27 Lab Director 68 Medical Director
28 Infection Prevention 69 Informatics/Clinical Decision
29 Elder Care/ Senior Services/Nursing Home/
Hospice/ Long Term Care/LTC 70 Risk/Compliance/Integrity
30 Community Outreach/ SVP External Affairs/
Liaison/Networking 71 Chief Experience Officer/Patient Experience Officer
31 Internal Auditor 72 Assistant Administrator
32 Learning / Education 73 Supply Chain/Purchasing
33 Access Health 74 Professional Staff/Professional Support/Professional
Services
34 Post-Acute/ Acute Care 75 General Services
35 Govt Relations 76 Wellness Officer
36 Revenue Cycle 77 Department-level Manager
37 Medical Affairs 78 Utilization Review
38 Rehab/Physical Therapy/PT 79 Poison Control
39 Radiology/Imaging/ Diagnostics 80 Project Management
40 Volunteer Director 81 HIPAA/Privacy
Career implications - 16
41 Chaplain/Spiritual Services
Appendix B: Complete Results Tables
Table B1. Job titles in the senior leadership teams (SLTs) of freestanding hospitals
Job Title Count
% of all job titles
on SLTs
CFO/VP Finance 455 16.8%
Chief Nursing/CNO 327 12.1%
Sr HR/ Personnel 271 10.0%
Dual/Multiple Titles 217 8.0%
COO/Hospital Operations 193 7.1%
Chief Medical Officer 131 4.8%
IT Director/CIO 129 4.8%
Chief Quality Officer/Risk 108 4.0%
VP Patient Care 60 2.2%
Physician Services/ Medical Staff/Medical Services 59 2.2%
Ancillary Director/Support Services 58 2.1%
Medical Group / Physician Networks / Physician Group /Practice
Manager/ PHO / Clinic 52 1.9%
Philanthropy/Foundation Director/ Fund
Development/Endowment 49 1.8%
Chief Admin Officer/CAO/Administrator 45 1.7%
Business Development/Growth 43 1.6%
CEO/President 37 1.4%
Legal/General Counsel 35 1.3%
Clinical Services VP/ Chief Clinical Officer 34 1.3%
Marketing/PR 34 1.3%
Compliance/Integrity 28 1.0%
Medical Affairs 27 1.0%
Strategy/Strategic Planning 26 1.0%
Elder Care/ Senior Services/Nursing Home/ Hospice/ Long Term
Care/LTC 25 0.9%
Facilities/Maintenance/Materials/Engineering/Plant Operations 24 0.9%
Community Outreach/ SVP External Affairs/ Liaison/Networking 23 0.8%
Medical Director 20 0.7%
Executive VP 15 0.6%
LEAN coordinator/ PI/ Process/ Clinical Effectiveness/
Performance Improvement Director 15 0.6%
Ambulatory Services/Outpatient 14 0.5%
Professional Staff/Professional Support/Professional Services 12 0.4%
Assistant Administrator 11 0.4%
Post-Acute/ Acute Care 9 0.3%
Career implications - 17
Job Title Count
% of all job titles
on SLTs
Revenue Cycle 9 0.3%
HIM/Health Info Mgmt/Medical Records 8 0.3%
Controller 8 0.3%
Chief of Staff/COS 7 0.3%
Executive Assistant 7 0.3%
Learning / Education 7 0.3%
Rehab/Physical Therapy/PT 5 0.2%
Radiology/Imaging/ Diagnostics 5 0.2%
Home Health 5 0.2%
Surgery / Perioperative 5 0.2%
Environmental Services / Housekeeping 4 0.1%
Mental Health / Psych/ Behavioral Health 4 0.1%
Executive Director 4 0.1%
Chief Experience Officer/Patient Experience Officer 4 0.1%
Pharmacist/Pharmacy Director 3 0.1%
Govt Relations 3 0.1%
OB-GYN 3 0.1%
College President 3 0.1%
Mission Services/Mission Integration/Mission
Advancement/Mission Effectiveness 3 0.1%
Clinical Integration 3 0.1%
Billing / Accounts Receivable / AR 3 0.1%
Lab Director 2 0.1%
Cardiopulmonary/Cardiology 2 0.1%
Board secretary/Board Relations 2 0.1%
Employee Services 2 0.1%
Informatics/Clinical Decision 2 0.1%
Project Management 2 0.1%
Population Health 1 0.0%
Accreditation 1 0.0%
Emergency Services/ ER 1 0.0%
Respiratory 1 0.0%
Social Services 1 0.0%
Business Manager / BO 1 0.0%
Insurance / Managed Care 1 0.0%
General Services 1 0.0%
Infection Prevention 0 0.0%
Internal Auditor 0 0.0%
Access Health 0 0.0%
Volunteer Director 0 0.0%
Chaplain/Spiritual Services 0 0.0%

Career implications - 18
Job Title Count
% of all job titles
on SLTs
Credentialing 0 0.0%
Dietary/Nutrition 0 0.0%
Anesthesia 0 0.0%
Supply Chain/Purchasing 0 0.0%
Wellness Officer 0 0.0%
Department Manager 0 0.0%
Utilization Review 0 0.0%
Poison Control 0 0.0%
HIPAA/Privacy 0 0.0%
Career implications - 19
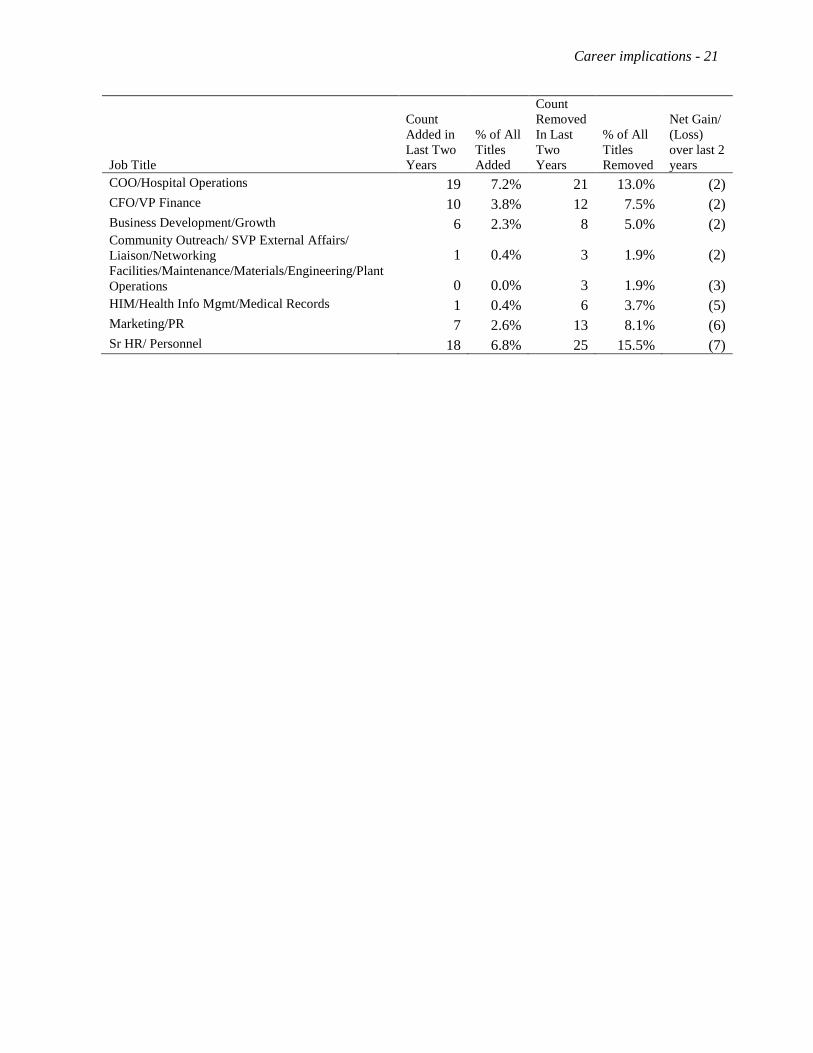
Table B2. Job titles added to and removed from SLT in the last two years.
Job Title
Count
Added in
Last Two
Years
% of All
Titles
Added
Count
Removed
In Last
Two
Years
% of All
Titles
Removed
Net Gain/
(Loss)
over last 2
years
IT Director/CIO 32 12.1% 7 4.3% 25
Chief Medical Officer 24 9.1% 3 1.9% 21
Physician Services/ Medical Staff/Medical Services 18 6.8% 2 1.2% 16
Chief Quality Officer/Risk 18 6.8% 5 3.1% 13 Medical Group / Physician Networks / Physician
Group /Practice Manager/ PHO / Clinic 13 4.9% 4 2.5% 9
Dual Titles 18 6.8% 13 8.1% 5 LEAN coordinator/ PI/ Process/ Clinical
Effectiveness/ Performance Improvement Director 4 1.5% 0 0.0% 4
CEO/President 3 1.1% 0 0.0% 3
Clinical Services VP/ Chief Clinical Officer 3 1.1% 0 0.0% 3
Ancillary Director/Support Services 11 4.2% 8 5.0% 3
Strategy/Strategic Planning 6 2.3% 3 1.9% 3
Population Health 3 1.1% 0 0.0% 3
Revenue Cycle 3 1.1% 0 0.0% 3
Clinical Integration 3 1.1% 0 0.0% 3
Chief Experience Officer/Patient Experience Officer 3 1.1% 0 0.0% 3
Chief of Staff/COS 2 0.8% 0 0.0% 2
Legal/General Counsel 3 1.1% 1 0.6% 2
Ambulatory Services/Outpatient 3 1.1% 1 0.6% 2
Govt Relations 2 0.8% 0 0.0% 2
Medical Affairs 2 0.8% 0 0.0% 2
Medical Director 2 0.8% 0 0.0% 2
Compliance/Integrity 5 1.9% 3 1.9% 2
Assistant Administrator 2 0.8% 0 0.0% 2
Executive VP 1 0.4% 0 0.0% 1 Philanthropy/Foundation Director/ Fund
Development/Endowment 3 1.1% 2 1.2% 1
Cardiopulmonary/Cardiology 1 0.4% 0 0.0% 1
Mental Health / Psych/ Behavioral Health 1 0.4% 0 0.0% 1
Emergency Services/ ER 1 0.4% 0 0.0% 1
VP Patient Care 1 0.4% 1 0.6% 0
Pharmacist/Pharmacy Director 1 0.4% 1 0.6% 0
Executive Assistant 0 0.0% 0 0.0% 0
Lab Director 0 0.0% 0 0.0% 0
Infection Prevention 0 0.0% 0 0.0% 0 Elder Care/ Senior Services/Nursing Home/
Hospice/ Long Term Care/LTC 1 0.4% 1 0.6% 0
Internal Auditor 0 0.0% 0 0.0% 0
Career implications - 20
Job Title
Count
Added in
Last Two
Years
% of All
Titles
Added
Count
Removed
In Last
Two
Years
% of All
Titles
Removed
Net Gain/
(Loss)
over last 2
years
Learning / Education 0 0.0% 0 0.0% 0
Access Health 0 0.0% 0 0.0% 0
Post-Acute/ Acute Care 0 0.0% 0 0.0% 0
Rehab/Physical Therapy/PT 0 0.0% 0 0.0% 0
Radiology/Imaging/ Diagnostics 0 0.0% 0 0.0% 0
Volunteer Director 0 0.0% 0 0.0% 0
Chaplain/Spiritual Services 0 0.0% 0 0.0% 0
OB-GYN 0 0.0% 0 0.0% 0
College President 0 0.0% 0 0.0% 0
Credentialing 0 0.0% 0 0.0% 0
Dietary/Nutrition 0 0.0% 0 0.0% 0
Home Health 0 0.0% 0 0.0% 0
Accreditation 0 0.0% 0 0.0% 0
Environmental Services / Housekeeping 0 0.0% 0 0.0% 0
Board secretary/Board Relations 0 0.0% 0 0.0% 0
Surgery / Perioperative 0 0.0% 0 0.0% 0 Mission Services/Mission Integration/Mission
Advancement/Mission Effectiveness 0 0.0% 0 0.0% 0
Respiratory 0 0.0% 0 0.0% 0
Social Services 0 0.0% 0 0.0% 0
Anesthesia 0 0.0% 0 0.0% 0
Billing / Accounts Receivable / AR 0 0.0% 0 0.0% 0
Insurance / Managed Care 0 0.0% 0 0.0% 0
Controller 0 0.0% 0 0.0% 0
Executive Director 0 0.0% 0 0.0% 0
Employee Services 0 0.0% 0 0.0% 0
Informatics/Clinical Decision 0 0.0% 0 0.0% 0
Supply Chain/Purchasing 0 0.0% 0 0.0% 0
Wellness Officer 0 0.0% 0 0.0% 0
Department Manager 0 0.0% 0 0.0% 0
Utilization Review 0 0.0% 0 0.0% 0
Poison Control 0 0.0% 0 0.0% 0
Project Management 0 0.0% 0 0.0% 0
HIPAA/Privacy 0 0.0% 0 0.0% 0
Chief Nursing/CNO 6 2.3% 7 4.3% (1)
Chief Admin Officer/CAO/Administrator 4 1.5% 5 3.1% (1)
Business Manager / BO 0 0.0% 1 0.6% (1) Professional Staff/Professional Support/Professional
Services 0 0.0% 1 0.6% (1)
General Services 0 0.0% 1 0.6% (1)
Career implications - 21
Job Title
Count
Added in
Last Two
Years
% of All
Titles
Added
Count
Removed
In Last
Two
Years
% of All
Titles
Removed
Net Gain/
(Loss)
over last 2
years
COO/Hospital Operations 19 7.2% 21 13.0% (2)
CFO/VP Finance 10 3.8% 12 7.5% (2)
Business Development/Growth 6 2.3% 8 5.0% (2) Community Outreach/ SVP External Affairs/
Liaison/Networking 1 0.4% 3 1.9% (2) Facilities/Maintenance/Materials/Engineering/Plant
Operations 0 0.0% 3 1.9% (3)
HIM/Health Info Mgmt/Medical Records 1 0.4% 6 3.7% (5)
Marketing/PR 7 2.6% 13 8.1% (6)
Sr HR/ Personnel 18 6.8% 25 15.5% (7)

Career implications - 22
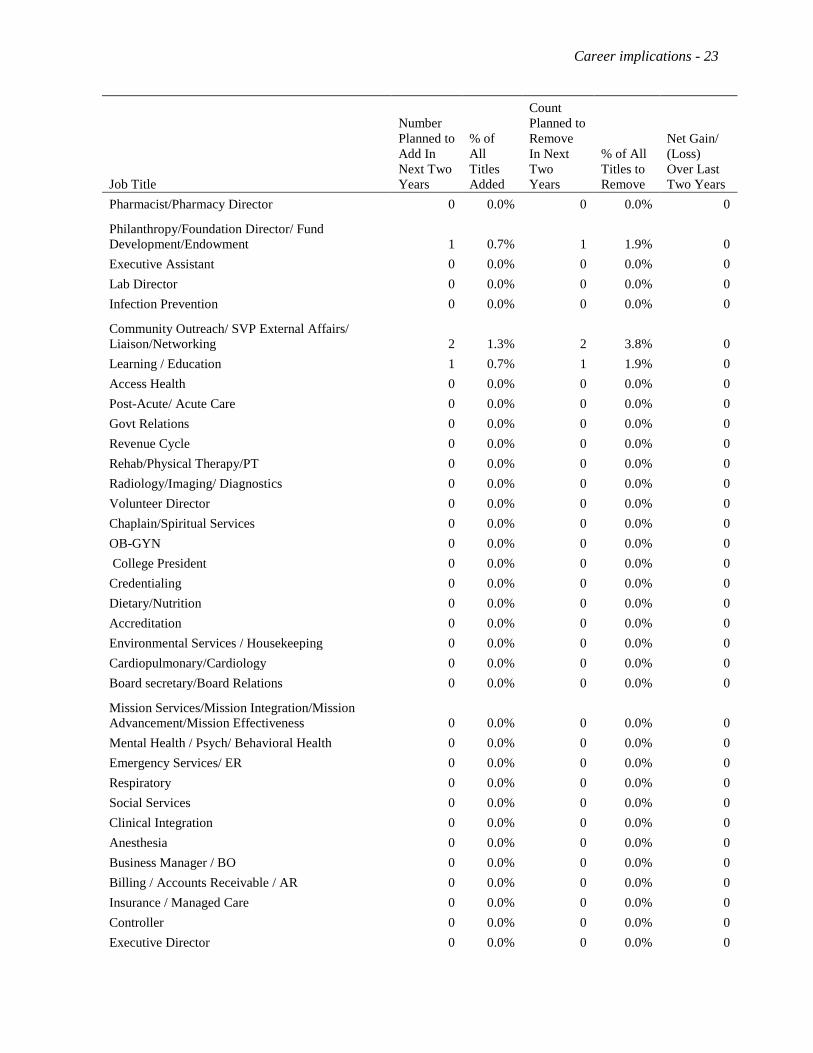
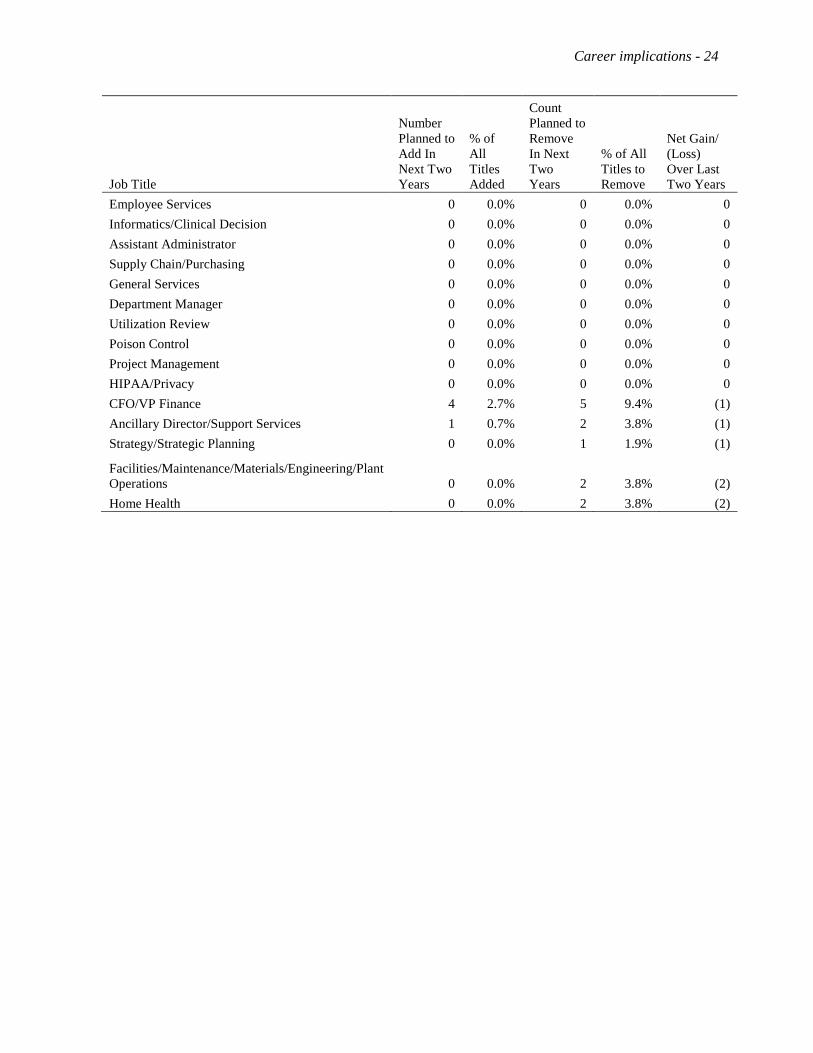
Table B3. Job titles CEOs plan to add to and remove from the SLT in the next two years.
Job Title
Number
Planned to
Add In
Next Two
Years
% of
All
Titles
Added
Count
Planned to
Remove
In Next
Two
Years
% of All
Titles to
Remove
Net Gain/
(Loss)
Over Last
Two Years
Chief Medical Officer 18 12.1% 1 1.9% 17
IT Director/CIO 17 11.4% 1 1.9% 16
COO/Hospital Operations 20 13.4% 6 11.3% 14
Medical Group / Physician Networks / Physician
Group /Practice Manager/ PHO / Clinic 12 8.1% 0 0.0% 12
Physician Services/ Medical Staff/Medical
Services 8 5.4% 2 3.8% 6
Business Development/Growth 7 4.7% 1 1.9% 6
Population Health 4 2.7% 0 0.0% 4
Medical Director 4 2.7% 0 0.0% 4
Chief Experience Officer/Patient Experience
Officer 4 2.7% 0 0.0% 4
Sr HR/ Personnel 8 5.4% 6 11.3% 2
Wellness Officer 2 1.3% 0 0.0% 2
CEO/President 2 1.3% 1 1.9% 1
Chief Quality Officer/Risk 7 4.7% 6 11.3% 1
VP Patient Care 1 0.7% 0 0.0% 1
Chief of Staff/COS 1 0.7% 0 0.0% 1
Legal/General Counsel 1 0.7% 0 0.0% 1
Marketing/PR 2 1.3% 1 1.9% 1
HIM/Health Info Mgmt/Medical Records 1 0.7% 0 0.0% 1
Ambulatory Services/Outpatient 2 1.3% 1 1.9% 1
Elder Care/ Senior Services/Nursing Home/
Hospice/ Long Term Care/LTC 1 0.7% 0 0.0% 1
Internal Auditor 1 0.7% 0 0.0% 1
Medical Affairs 1 0.7% 0 0.0% 1
LEAN coordinator/ PI/ Process/ Clinical
Effectiveness/ Performance Improvement Director 1 0.7% 0 0.0% 1
Dual Titles 10 6.7% 9 17.0% 1
Surgery / Perioperative 1 0.7% 0 0.0% 1
Compliance/Integrity 1 0.7% 0 0.0% 1
Professional Staff/Professional
Support/Professional Services 2 1.3% 1 1.9% 1
Chief Nursing/CNO 1 0.7% 1 1.9% 0
Clinical Services VP/ Chief Clinical Officer 0 0.0% 0 0.0% 0
Chief Admin Officer/CAO/Administrator 0 0.0% 0 0.0% 0
Executive VP 0 0.0% 0 0.0% 0
Career implications - 23
Job Title
Number
Planned to
Add In
Next Two
Years
% of
All
Titles
Added
Count
Planned to
Remove
In Next
Two
Years
% of All
Titles to
Remove
Net Gain/
(Loss)
Over Last
Two Years
Pharmacist/Pharmacy Director 0 0.0% 0 0.0% 0
Philanthropy/Foundation Director/ Fund
Development/Endowment 1 0.7% 1 1.9% 0
Executive Assistant 0 0.0% 0 0.0% 0
Lab Director 0 0.0% 0 0.0% 0
Infection Prevention 0 0.0% 0 0.0% 0
Community Outreach/ SVP External Affairs/
Liaison/Networking 2 1.3% 2 3.8% 0
Learning / Education 1 0.7% 1 1.9% 0
Access Health 0 0.0% 0 0.0% 0
Post-Acute/ Acute Care 0 0.0% 0 0.0% 0
Govt Relations 0 0.0% 0 0.0% 0
Revenue Cycle 0 0.0% 0 0.0% 0
Rehab/Physical Therapy/PT 0 0.0% 0 0.0% 0
Radiology/Imaging/ Diagnostics 0 0.0% 0 0.0% 0
Volunteer Director 0 0.0% 0 0.0% 0
Chaplain/Spiritual Services 0 0.0% 0 0.0% 0
OB-GYN 0 0.0% 0 0.0% 0
College President 0 0.0% 0 0.0% 0
Credentialing 0 0.0% 0 0.0% 0
Dietary/Nutrition 0 0.0% 0 0.0% 0
Accreditation 0 0.0% 0 0.0% 0
Environmental Services / Housekeeping 0 0.0% 0 0.0% 0
Cardiopulmonary/Cardiology 0 0.0% 0 0.0% 0
Board secretary/Board Relations 0 0.0% 0 0.0% 0
Mission Services/Mission Integration/Mission
Advancement/Mission Effectiveness 0 0.0% 0 0.0% 0
Mental Health / Psych/ Behavioral Health 0 0.0% 0 0.0% 0
Emergency Services/ ER 0 0.0% 0 0.0% 0
Respiratory 0 0.0% 0 0.0% 0
Social Services 0 0.0% 0 0.0% 0
Clinical Integration 0 0.0% 0 0.0% 0
Anesthesia 0 0.0% 0 0.0% 0
Business Manager / BO 0 0.0% 0 0.0% 0
Billing / Accounts Receivable / AR 0 0.0% 0 0.0% 0
Insurance / Managed Care 0 0.0% 0 0.0% 0
Controller 0 0.0% 0 0.0% 0
Executive Director 0 0.0% 0 0.0% 0
Career implications - 24
Job Title
Number
Planned to
Add In
Next Two
Years
% of
All
Titles
Added
Count
Planned to
Remove
In Next
Two
Years
% of All
Titles to
Remove
Net Gain/
(Loss)
Over Last
Two Years
Employee Services 0 0.0% 0 0.0% 0
Informatics/Clinical Decision 0 0.0% 0 0.0% 0
Assistant Administrator 0 0.0% 0 0.0% 0
Supply Chain/Purchasing 0 0.0% 0 0.0% 0
General Services 0 0.0% 0 0.0% 0
Department Manager 0 0.0% 0 0.0% 0
Utilization Review 0 0.0% 0 0.0% 0
Poison Control 0 0.0% 0 0.0% 0
Project Management 0 0.0% 0 0.0% 0
HIPAA/Privacy 0 0.0% 0 0.0% 0
CFO/VP Finance 4 2.7% 5 9.4% (1)
Ancillary Director/Support Services 1 0.7% 2 3.8% (1)
Strategy/Strategic Planning 0 0.0% 1 1.9% (1)
Facilities/Maintenance/Materials/Engineering/Plant
Operations 0 0.0% 2 3.8% (2)
Home Health 0 0.0% 2 3.8% (2)
Career implications - 25
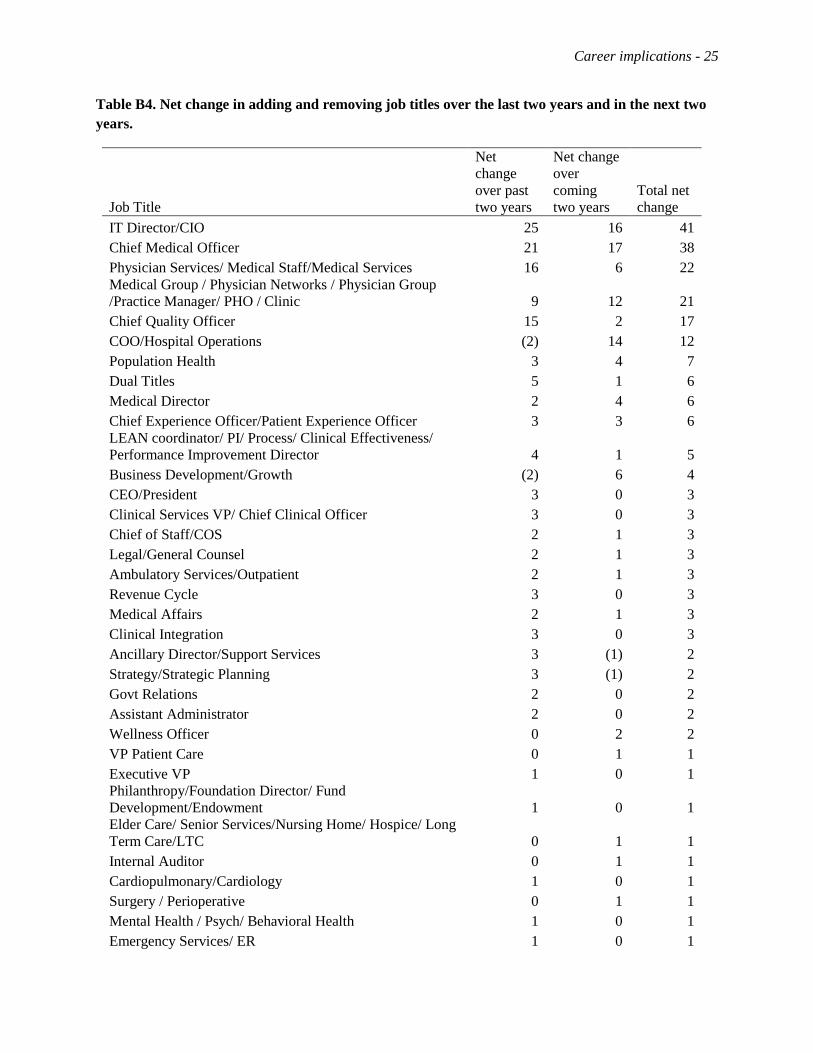
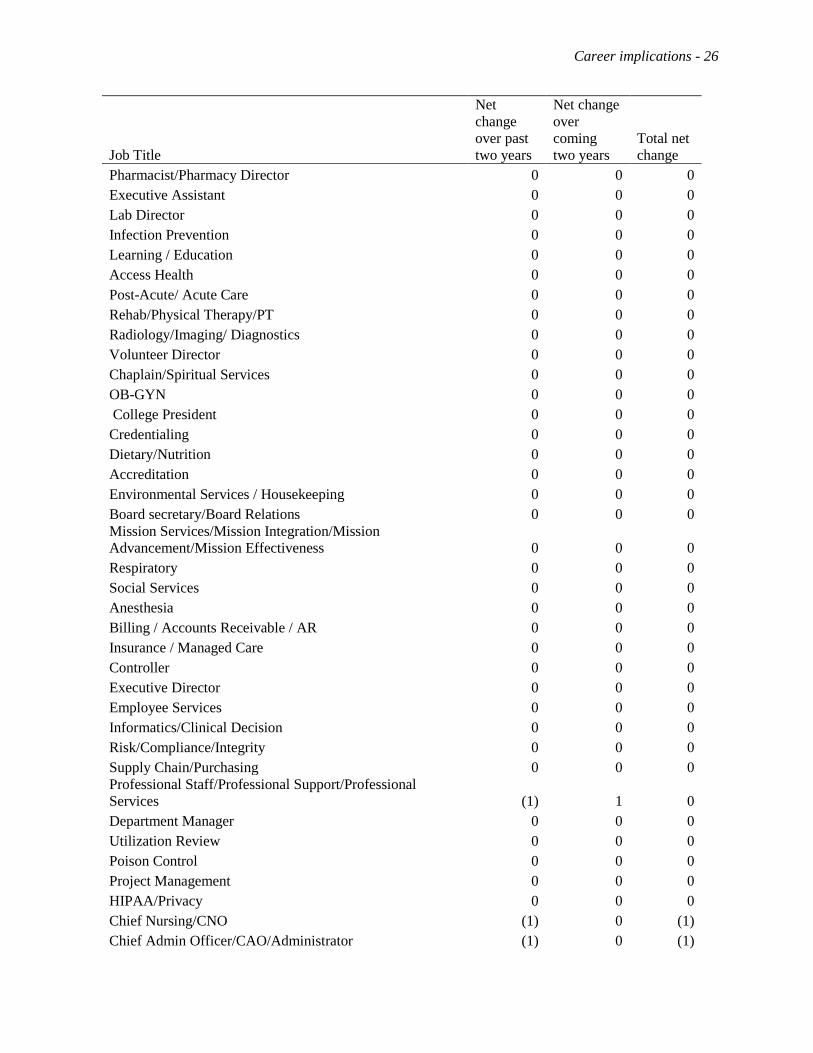
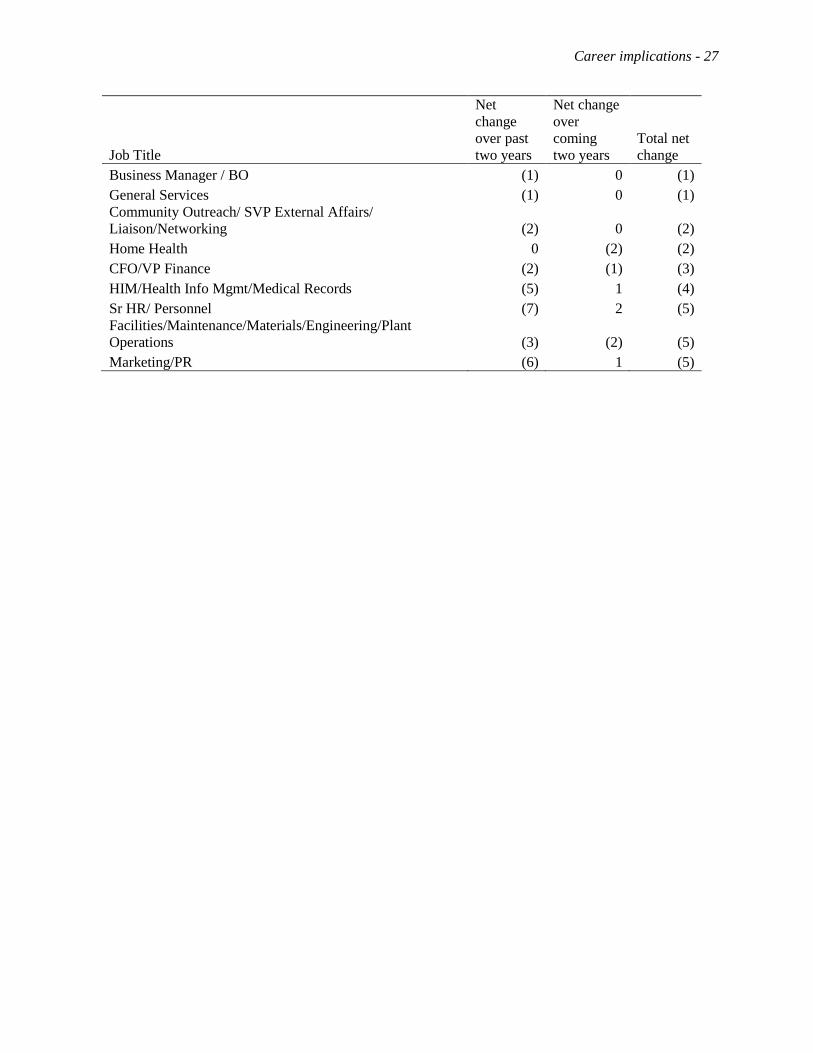
Table B4. Net change in adding and removing job titles over the last two years and in the next two
years.
Job Title
Net
change
over past
two years
Net change
over
coming
two years
Total net
change
IT Director/CIO 25 16 41
Chief Medical Officer 21 17 38
Physician Services/ Medical Staff/Medical Services 16 6 22
Medical Group / Physician Networks / Physician Group
/Practice Manager/ PHO / Clinic 9 12 21
Chief Quality Officer 15 2 17
COO/Hospital Operations (2) 14 12
Population Health 3 4 7
Dual Titles 5 1 6
Medical Director 2 4 6
Chief Experience Officer/Patient Experience Officer 3 3 6
LEAN coordinator/ PI/ Process/ Clinical Effectiveness/
Performance Improvement Director 4 1 5
Business Development/Growth (2) 6 4
CEO/President 3 0 3
Clinical Services VP/ Chief Clinical Officer 3 0 3
Chief of Staff/COS 2 1 3
Legal/General Counsel 2 1 3
Ambulatory Services/Outpatient 2 1 3
Revenue Cycle 3 0 3
Medical Affairs 2 1 3
Clinical Integration 3 0 3
Ancillary Director/Support Services 3 (1) 2
Strategy/Strategic Planning 3 (1) 2
Govt Relations 2 0 2
Assistant Administrator 2 0 2
Wellness Officer 0 2 2
VP Patient Care 0 1 1
Executive VP 1 0 1
Philanthropy/Foundation Director/ Fund
Development/Endowment 1 0 1
Elder Care/ Senior Services/Nursing Home/ Hospice/ Long
Term Care/LTC 0 1 1
Internal Auditor 0 1 1
Cardiopulmonary/Cardiology 1 0 1
Surgery / Perioperative 0 1 1
Mental Health / Psych/ Behavioral Health 1 0 1
Emergency Services/ ER 1 0 1
Career implications - 26
Job Title
Net
change
over past
two years
Net change
over
coming
two years
Total net
change
Pharmacist/Pharmacy Director 0 0 0
Executive Assistant 0 0 0
Lab Director 0 0 0
Infection Prevention 0 0 0
Learning / Education 0 0 0
Access Health 0 0 0
Post-Acute/ Acute Care 0 0 0
Rehab/Physical Therapy/PT 0 0 0
Radiology/Imaging/ Diagnostics 0 0 0
Volunteer Director 0 0 0
Chaplain/Spiritual Services 0 0 0
OB-GYN 0 0 0
College President 0 0 0
Credentialing 0 0 0
Dietary/Nutrition 0 0 0
Accreditation 0 0 0
Environmental Services / Housekeeping 0 0 0
Board secretary/Board Relations 0 0 0
Mission Services/Mission Integration/Mission
Advancement/Mission Effectiveness 0 0 0
Respiratory 0 0 0
Social Services 0 0 0
Anesthesia 0 0 0
Billing / Accounts Receivable / AR 0 0 0
Insurance / Managed Care 0 0 0
Controller 0 0 0
Executive Director 0 0 0
Employee Services 0 0 0
Informatics/Clinical Decision 0 0 0
Risk/Compliance/Integrity 0 0 0
Supply Chain/Purchasing 0 0 0
Professional Staff/Professional Support/Professional
Services (1) 1 0
Department Manager 0 0 0
Utilization Review 0 0 0
Poison Control 0 0 0
Project Management 0 0 0
HIPAA/Privacy 0 0 0
Chief Nursing/CNO (1) 0 (1)
Chief Admin Officer/CAO/Administrator (1) 0 (1)
Career implications - 27
Job Title
Net
change
over past
two years
Net change
over
coming
two years
Total net
change
Business Manager / BO (1) 0 (1)
General Services (1) 0 (1)
Community Outreach/ SVP External Affairs/
Liaison/Networking (2) 0 (2)
Home Health 0 (2) (2)
CFO/VP Finance (2) (1) (3)
HIM/Health Info Mgmt/Medical Records (5) 1 (4)
Sr HR/ Personnel (7) 2 (5)
Facilities/Maintenance/Materials/Engineering/Plant
Operations (3) (2) (5)
Marketing/PR (6) 1 (5)